Article

Performance Estimation of High-Level Dataflow Program on Heterogeneous Platforms by Dynamic Network Execution †

EPFL SCI-STI-MM, École Polytechnique Fédérale de Lausanne, CH-1015 Lausanne, Switzerland
*
Author to whom correspondence should be addressed.
This paper is an extended version of our paper published in 14th IEEE MCSoC 2021.
J. Low Power Electron. Appl. 2022, 12(3), 36; https://doi.org/10.3390/jlpea12030036
Submission received: 10 March 2022 / Revised: 17 May 2022 / Accepted: 18 June 2022 / Published: 23 June 2022

Abstract

:
The performance of programs executed on heterogeneous parallel platforms largely depends on the design choices regarding how to partition the processing on the various different processing units. In other words, it depends on the assumptions and parameters that define the partitioning, mapping, scheduling, and allocation of data exchanges among the various processing elements of the platform executing the program. The advantage of programs written in languages using the dataflow model of computation (MoC) is that executing the program with different configurations and parameter settings does not require rewriting the application software for each configuration setting, but only requires generating a new synthesis of the execution code corresponding to different parameters. The synthesis stage of dataflow programs is usually supported by automatic code generation tools. Another competitive advantage of dataflow software methodologies is that they are well-suited to support designs on heterogeneous parallel systems as they are inherently free of memory access contention issues and naturally expose the available intrinsic parallelism. So as to fully exploit these advantages and to be able to efficiently search the configuration space to find the design points that better satisfy the desired design constraints, it is necessary to develop tools and associated methodologies capable of evaluating the performance of different configurations and to drive the search for good design configurations, according to the desired performance criteria. The number of possible design assumptions and associated parameter settings is usually so large (i.e., the dimensions and size of the design space) that intuition as well as trial and error are clearly unfeasible, inefficient approaches. This paper describes a method for the clock-accurate profiling of software applications developed using the dataflow programming paradigm such as the formal RVL-CAL language. The profiling can be applied when the application program has been compiled and executed on GPU/CPU heterogeneous hardware platforms utilizing two main methodologies, denoted as static and dynamic. This paper also describes how a method for the qualitative evaluation of the performance of such programs as a function of the supplied configuration parameters can be successfully applied to heterogeneous platforms. The technique was illustrated using two different application software examples and several design points.

1. Introduction

The search for higher computational capacity of processing platforms is still driven by the growing needs of the current applications’ programs. The difficulty of satisfying Moore’s law by developing smaller circuit components together with the challenges brought by the increasing logic gate frequency, pushes the roll-out of heterogeneous processing platforms. Indeed, exploiting deeper levels of domain-specific hardware specialization is considered as a solution to the fact that the straightforward multiplication of similar and off-the-shelf processing elements is no longer sufficient to deliver the necessary augmented processing power. More recently, industries are shifting to increasingly complex heterogeneous hardware for custom usage (i.e., Microsoft arm [1], Nvidia Grace [2], Apple silicon [3]). They are clear attempts to answer these increased processing needs; however, they introduce new challenges and the need to resolve existing problems by efficiently programming them.
Design methods, based on abstract dataflow programming software, have been demonstrated to be suitable approaches providing an answer to the problem of dealing with large design spaces and the difficulty of exploring them, and the portability challenges intrinsic when facing heterogeneous platforms [4,5]. Moreover, dataflow languages expose by construction the data parallelism and algorithm parallelism that are naturally available in the process of executing various tasks on the target data. Many settings (i.e., mapping of the software kernel onto the suitable hardware processing element) could be quickly evaluated without demanding costly and complete redesigns of the application program as would be required when utilizing conventional imperative software programs, for which the different parallelization possibilities mandate expensive handmade rewriting of the program, with the side-effect of consuming significant amounts of designer hours.
Nevertheless, dataflow methodologies make it easy to partition and map, in any arbitrary way, a design with the guarantee that any configuration can consistently generate the correct implementations without the necessity of rewriting the software. However, they introduce novel research questions in terms of determining the best performance settings related to the scheduling, mapping, and partitioning for the specific, and possibly heterogeneous, platform at hand. Regardless of the sophistication of the software design, the size of the potential configuration set that needs to be evaluated is often too large. This fact makes design exploration excessively time-consuming, or intractable, for a direct developer’s trial-and-error attempt, particularly when the attempt is to exhaustively test the admissible points in the parameter space. This fact makes evident the necessity of having systematic and automatic methods of recognizing and assessing efficient configurations and designs. TURNUS [6,7] is a design space exploration software tool based on the research conducted by the authors of this article with this intent. The framework was designed using a high-level abstract model of computation (MoC) as a result of the dataflow network structure and the acting model of execution. It was labeled with the measurements from the profiling of every atomic computation acquired on the actual heterogeneous hardware. Consecutively, the analysis of the execution model could identify performance configurations by automatically and efficiently exploring the admissible design space.
To generalize the methodology for additional use with platforms including GPU hardware, the source-to-source compiler backend that generated specialized software code for dataflow application programs, as presented in [8,9,10], would require further expansion. According to the results of this study, the automatic generation of a platform-specific instrumented code aggregating clock-accurate profiling metrics for CUDA/C++ [11] from a dataflow model of the application software was completed at a granularity level that would be particularly suitable for TURNUS’s analysis. The procedures depicted in this article also expanded on the analysis methodology and the associated tools described in [12] by adding support for the actual analysis of GPU/CPU heterogeneous performance weights (i.e., elapsed time per type of processing related to the programming model: communication, computation, and scheduling).
The novel propositions reported in this article are as follows:
  • The development of a method to generate an instrumented code in C++/CUDA from an RVC-CAL actors’ network that, when executed on the appropriate hardware platform, automatically generated the weights (i.e., performance measures) of the actors’ runtime for both platforms, in case it would be executed on the GPU or the CPU system.
  • The development of a method for utilizing the performance measures to estimate the overall performance of any configuration of an RVC-CAL dataflow application without the necessity to configure, synthesize, compile, execute, and profile each configuration on a heterogeneous system.
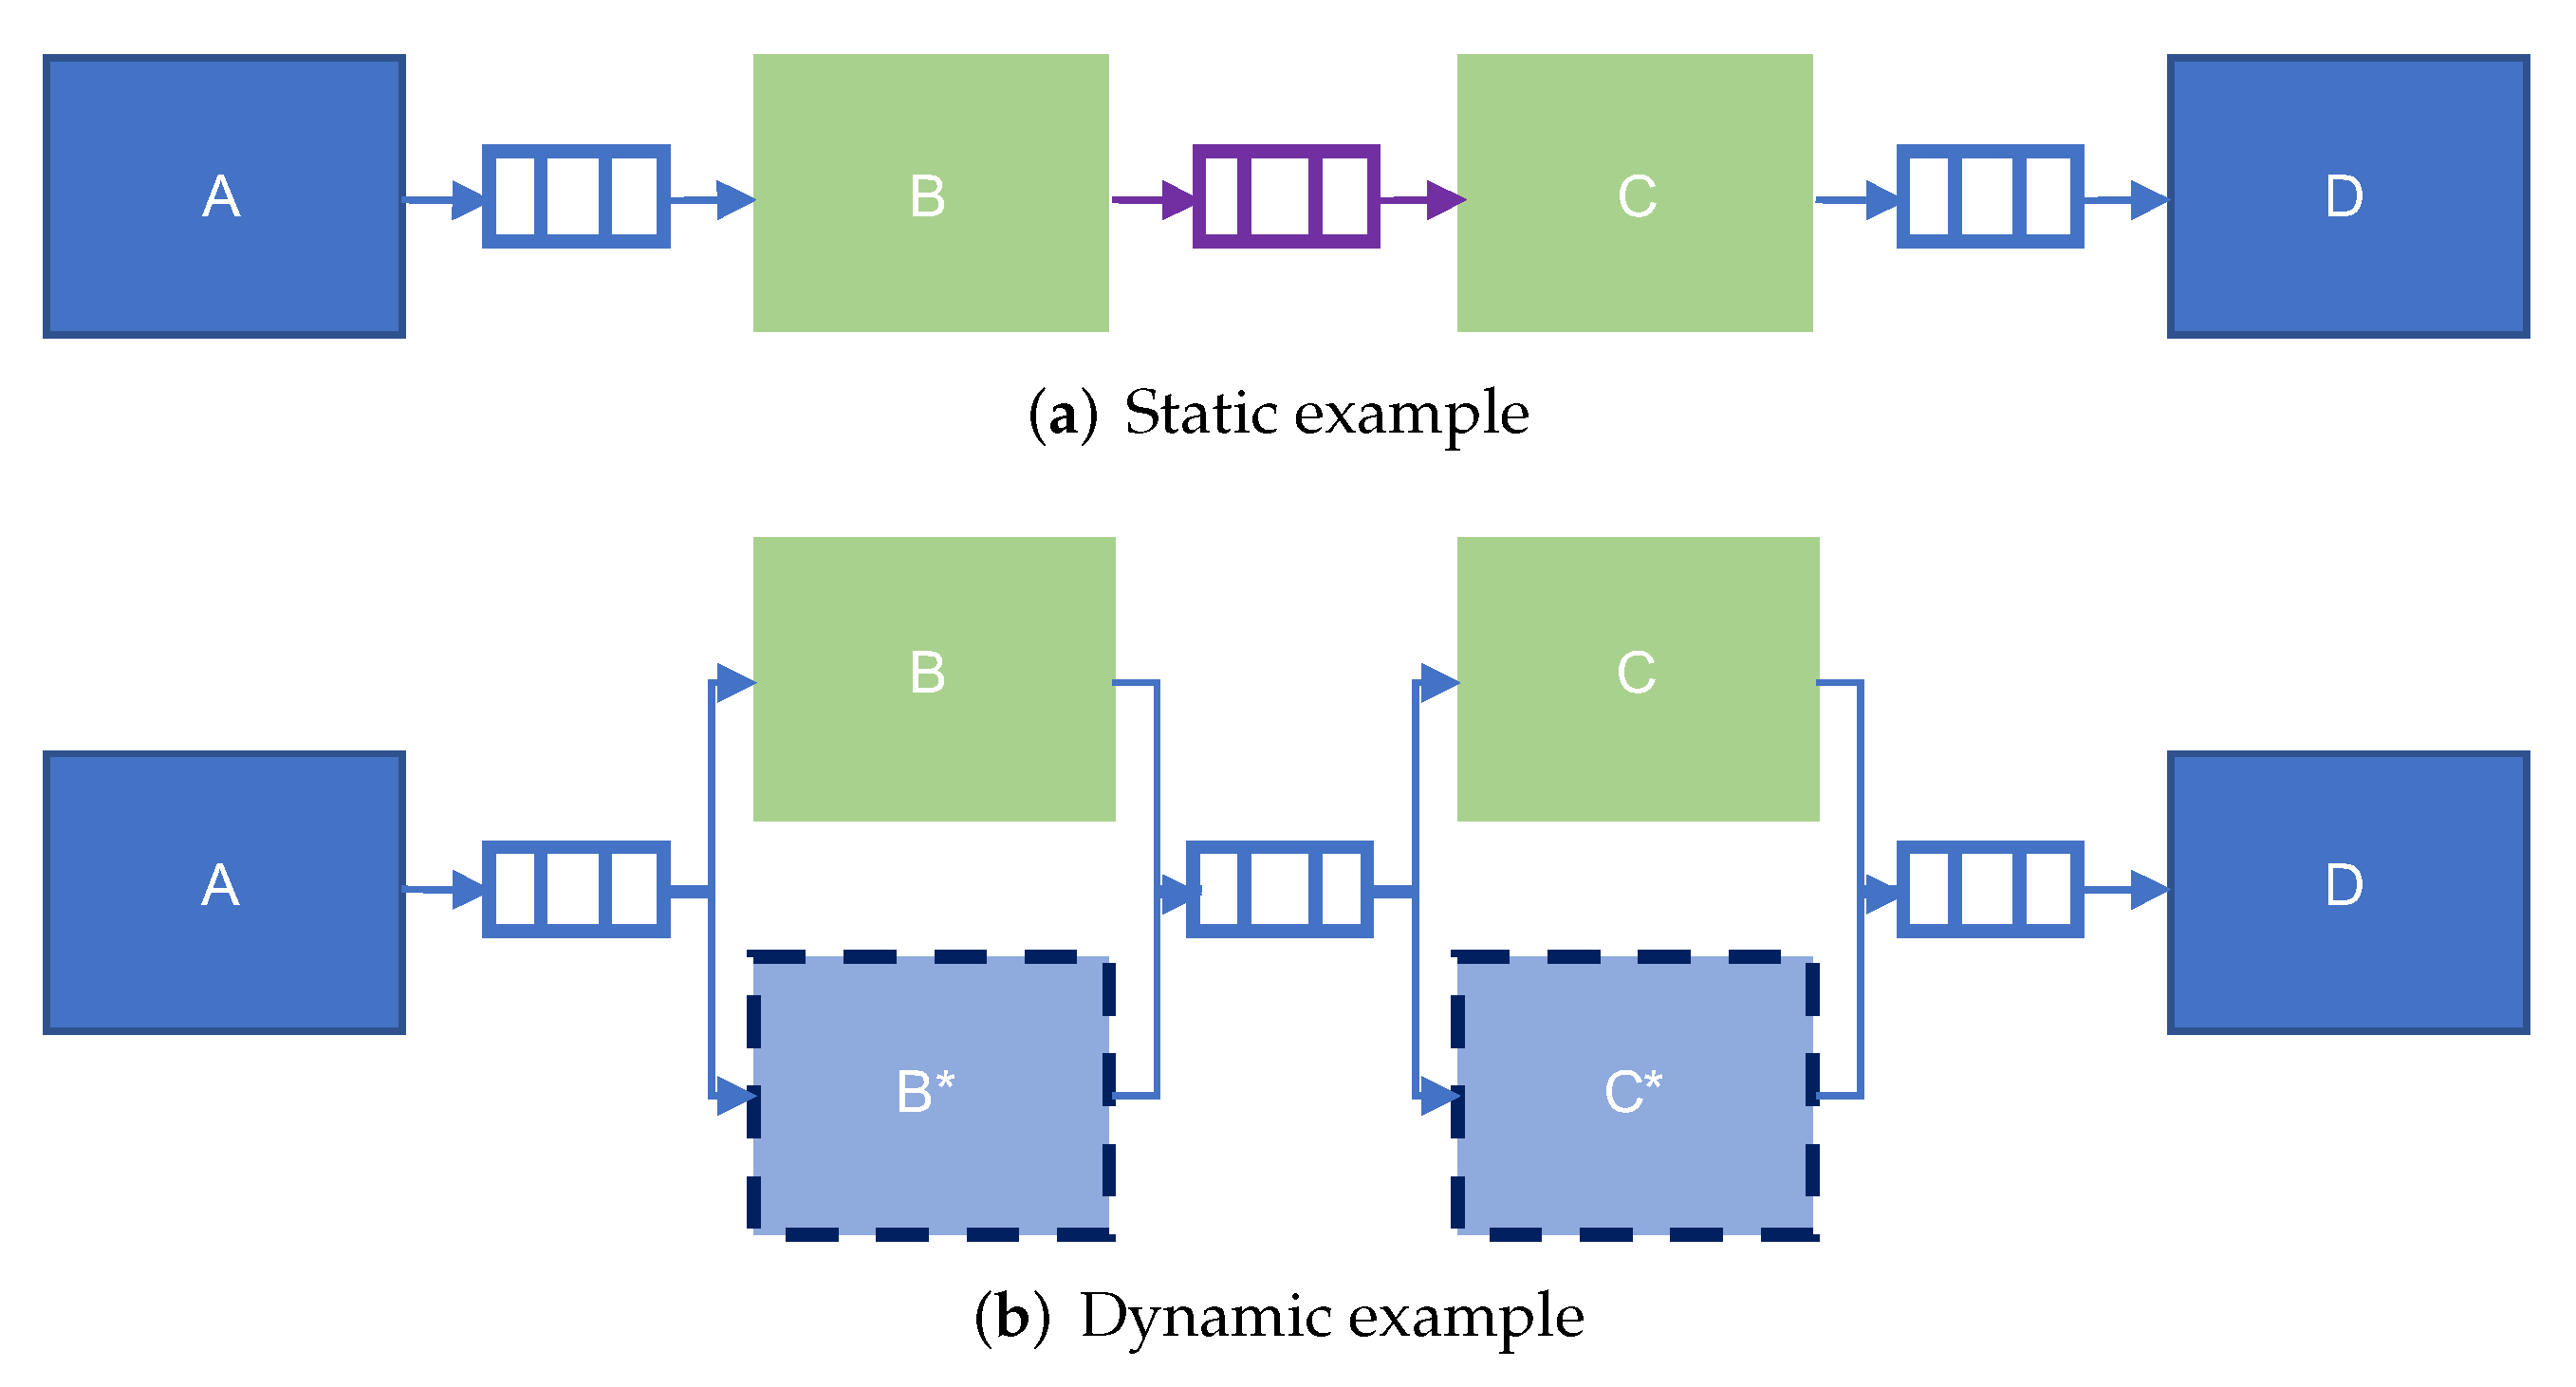
  • A methodology for generating code compatible with the creation of an application program for which the network layout could be dynamically configured at runtime.
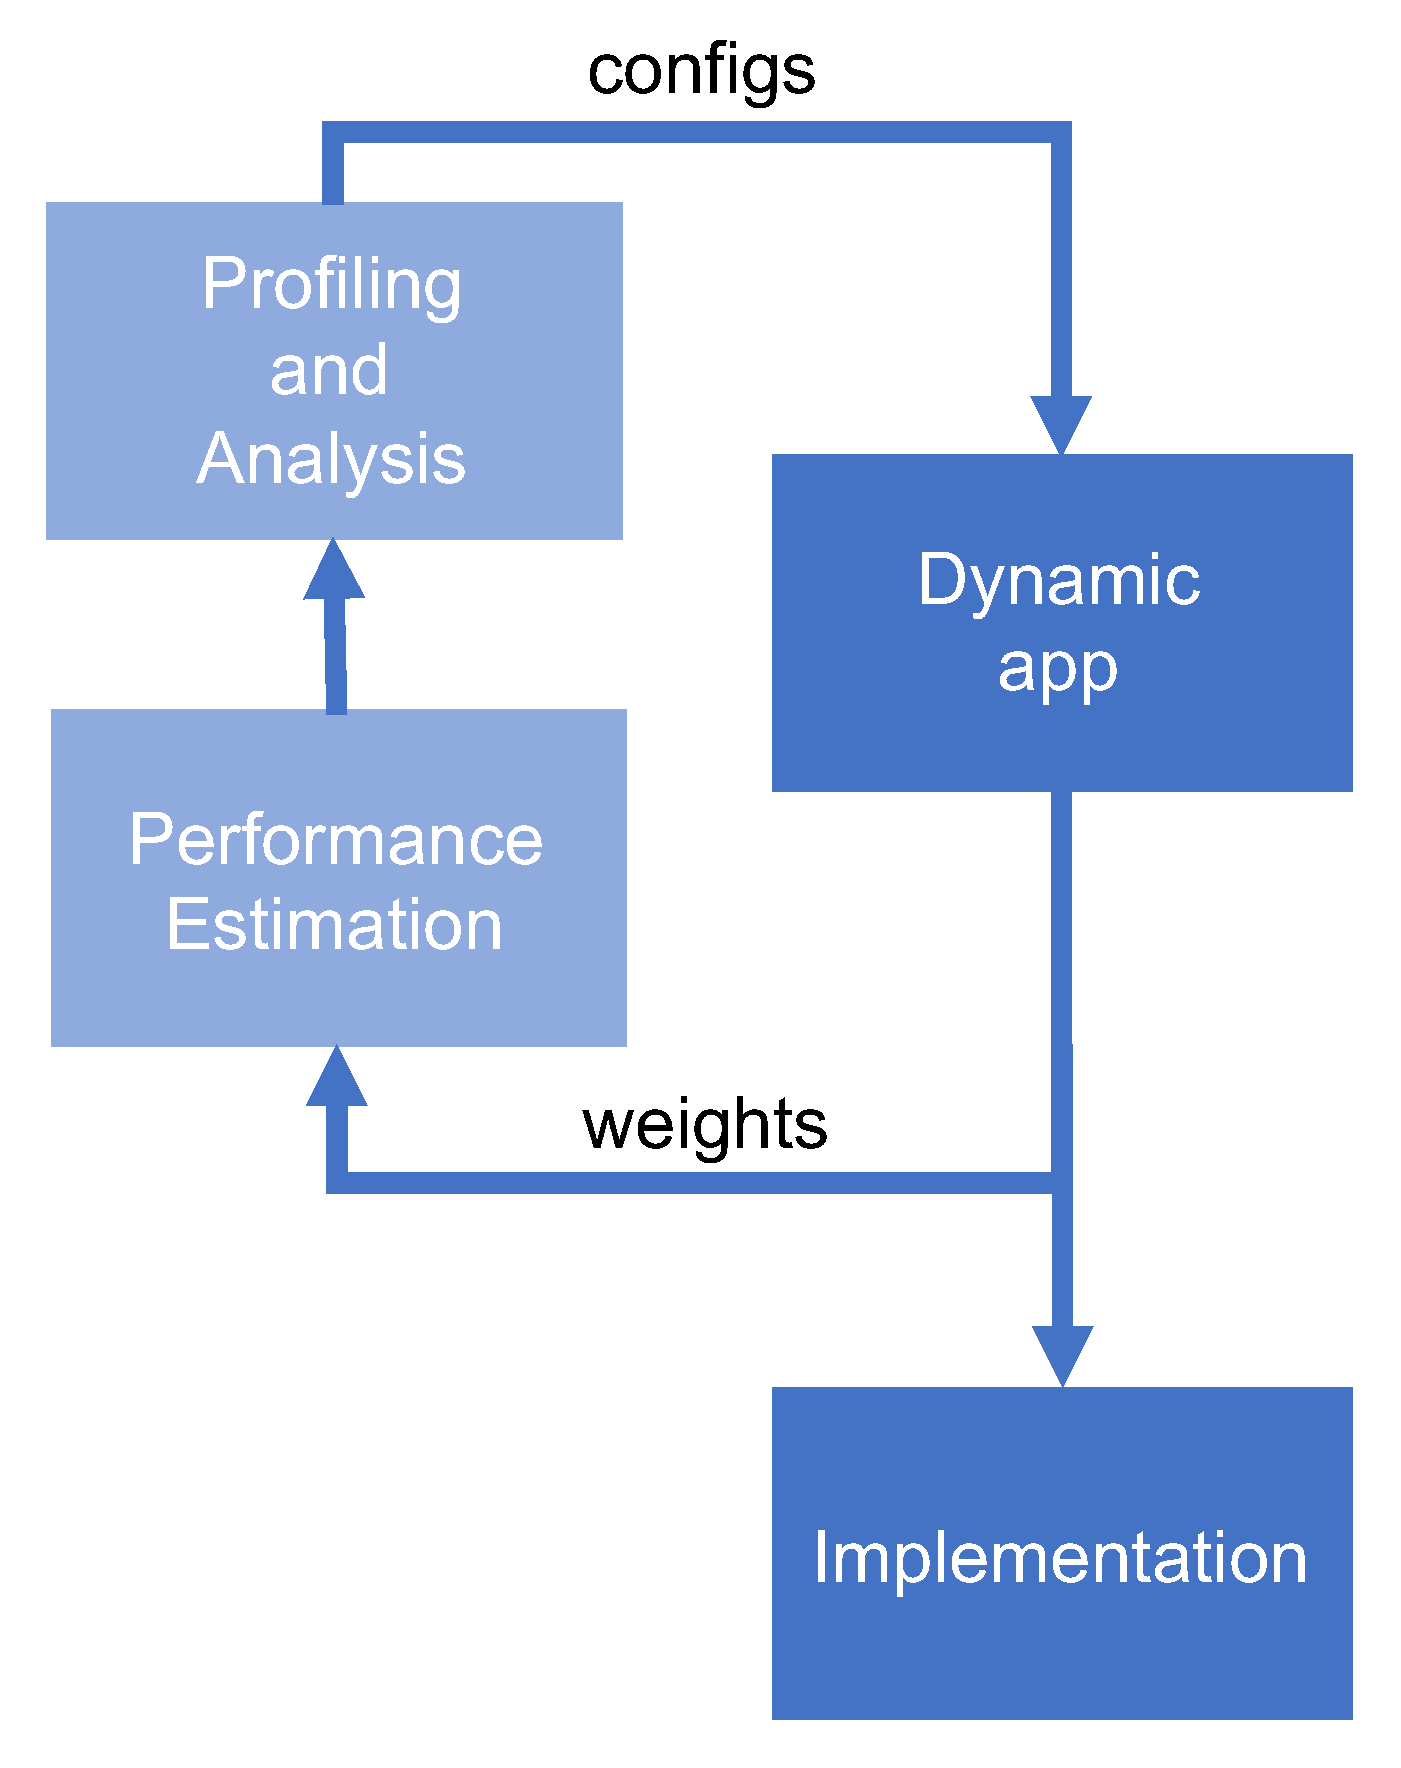
  • An alternative methodology to use the newly introduced dynamic network methodology to generate the runtime profile metrics for use in performance estimation.
The paper is divided into the following sections: Section 2 provides an overview of the profiling framework and methodologies utilized for GPU/CPU co-processing systems, as developed in previous research. Section 3 lays out the necessary background for understanding the work implemented in this article, including all the required concepts concerning the dataflow MoC; the design space exploration process; and the prerequisites, functionalities, and implications of the exact performance estimation phases. Section 4 describes the principal proposition of the article including the clock-accurate profiling for synthesizing dataflow programs on GPU/CPU heterogeneous hardware with both dynamic and static strategies, and a methodology that used heterogeneous profiling measures for estimation of the performance. Section 5 showcases the process by depicting the precision obtained with different application programs while analyzing and comparing their estimated and measured performances. Ultimately, Section 6 summarizes the article and describes the goals, directives, and possible objectives for future research.

2. Related Work

2.1. GPU Profiling

There are various possibilities for profiling a GPU application written using CUDA, either from NVidia directly, such as their NVIDIA Visual Profiler (NVVP) tool [13], or from other research tools including SASSI [14], CUDA Memtrace [15], CUDAAdvisor [16], Nvbit [17], or CUDA flux [18]. CUDA Memtrace, CUDAAdvisor, and CUDA flux are frameworks that were released as open-source profilers and use the LLVM compiler toolchain for instrumenting the LLVM intermediate representation during the compilation phase. NVBit is a framework that uses a dynamic binary injection that instruments programs at the NVIDIA assembly language layer (SASS) without the necessity to recompile, whereas SASSI provides results with similar precision, but it requires software-level instrumentation. The NVIDIA Visual Profiler profiles programs at execution time without requiring a recompilation.
The profilers briefly presented above are based on either sampling approaches, with reported concerns regarding sampling frequency that needs to be accommodated to adjust the overheads for their accuracy trade-offs, or they are based on a binary-level instruction injection, a solution which results in the profiling not matching the dataflow model and thus making it difficult to use the obtained profiling results in appropriate design space exploration strategies. The methodology presented in this article takes advantage of the fact that the CUDA/C++ software can automatically be written by the compiler, eliminating the necessity for binary instruction injection and allowing the exact measurement of performances with a granularity that matches the different program elements used by the dataflow computation model. Strictly speaking, these metrics fitting the dataflow model of computation could be generated by individually measuring the action processing elapsed time, the scheduling elapsed time, and the time occurring in data reading/writing at the scope of each actor execution. Nonetheless, these different profilers export various performance metrics, as compared to the solely elapsed time (e.g., shared memory usage, core usage, register pressure, etc.). Indeed, we do not exclude the possibility of integrating some additional metrics to obtain more precise measurements during the execution of the application software by the profiler framework, in order to achieve a more accurate and effective design space exploration methodology.

2.2. Heterogeneous Dataflow Profiling

The literature contained various profiling applications for dataflow models in the computation for heterogeneous systems. These included Sesame [19,20], SystemCoDesigner [21], CoEx [22], and MAPS [23,24]. Sesame is a system-level simulation framework that tackles the question of discovering an appropriate and performant target MPSoC platform architecture. Sesame uses different models for application and architecture: the architecture model describes the architecture elements and defines their performance restrictions using trace-driven simulation, while the application model describes the functional behavior of an application. The application model is disconnected from the specific assumptions of the hardware architecture; the caveat is that only KPN application models can be utilized and investigated. SystemCoDesigner explores programs expressed in SysteMoC, a high-level language built on top of SystemC. It generates hardware/software SoC with automatic design space exploration methodologies. The model is converted into a behavioral SystemC model. During DSE, the domain is explored using multi-objective optimization algorithms. For each investigated design, the performance is estimated by using performance models (which are generated automatically from the SystemC behavioral model) and the behavioral synthesis results. MAPS is a DSE tool for KPN programs. Both the estimation of the performance and the design space exploration are performed through an analysis of the ETG. ETGs are generated by profiling and are augmented with timing information via performance estimation. However, their definition is limited since only internal variables and token dependencies are supported. It is equipped with a multi-application analysis component that performs composability research in order to assess if a set of applications may run simultaneously on the same platform, without interfering with each other. CoEx provides a multigrained profiling approach that allows the selection of the level of detail at which profiling occurs. It also contains a pre-architectural estimation engine. This engine couples an abstract processor model together with an execution report of an application using a generated low-level code representation of the dataflow program that is successively profiled through an instrumented platform-dependent execution, to generate an estimate of achievable performance.
None of the presented frameworks offer support for heterogeneous systems that include GPU elements. Our research focused on a methodology extension for GPUs. The goal of this study was to certify and confirm that the methodologies developed for the frameworks Orcc/Exelixi + TURNUS that already support Multicore, Manycore, and FPGA, could be used with heterogeneous CPU/GPU platforms. We also described the challenges involved so that GPU platforms could be added to the list of elements that could comprise a heterogeneous system and that would be supported by the developed methodology. To the best of our knowledge, there has not been an integrated method that automatically supports all these platforms, with support for portability and design space exploration that could facilitate porting applications to various systems and selecting efficient partitions and mapping configurations. This study is a step towards achieving such a goal.

3. Dataflow Programs and Design Space Exploration
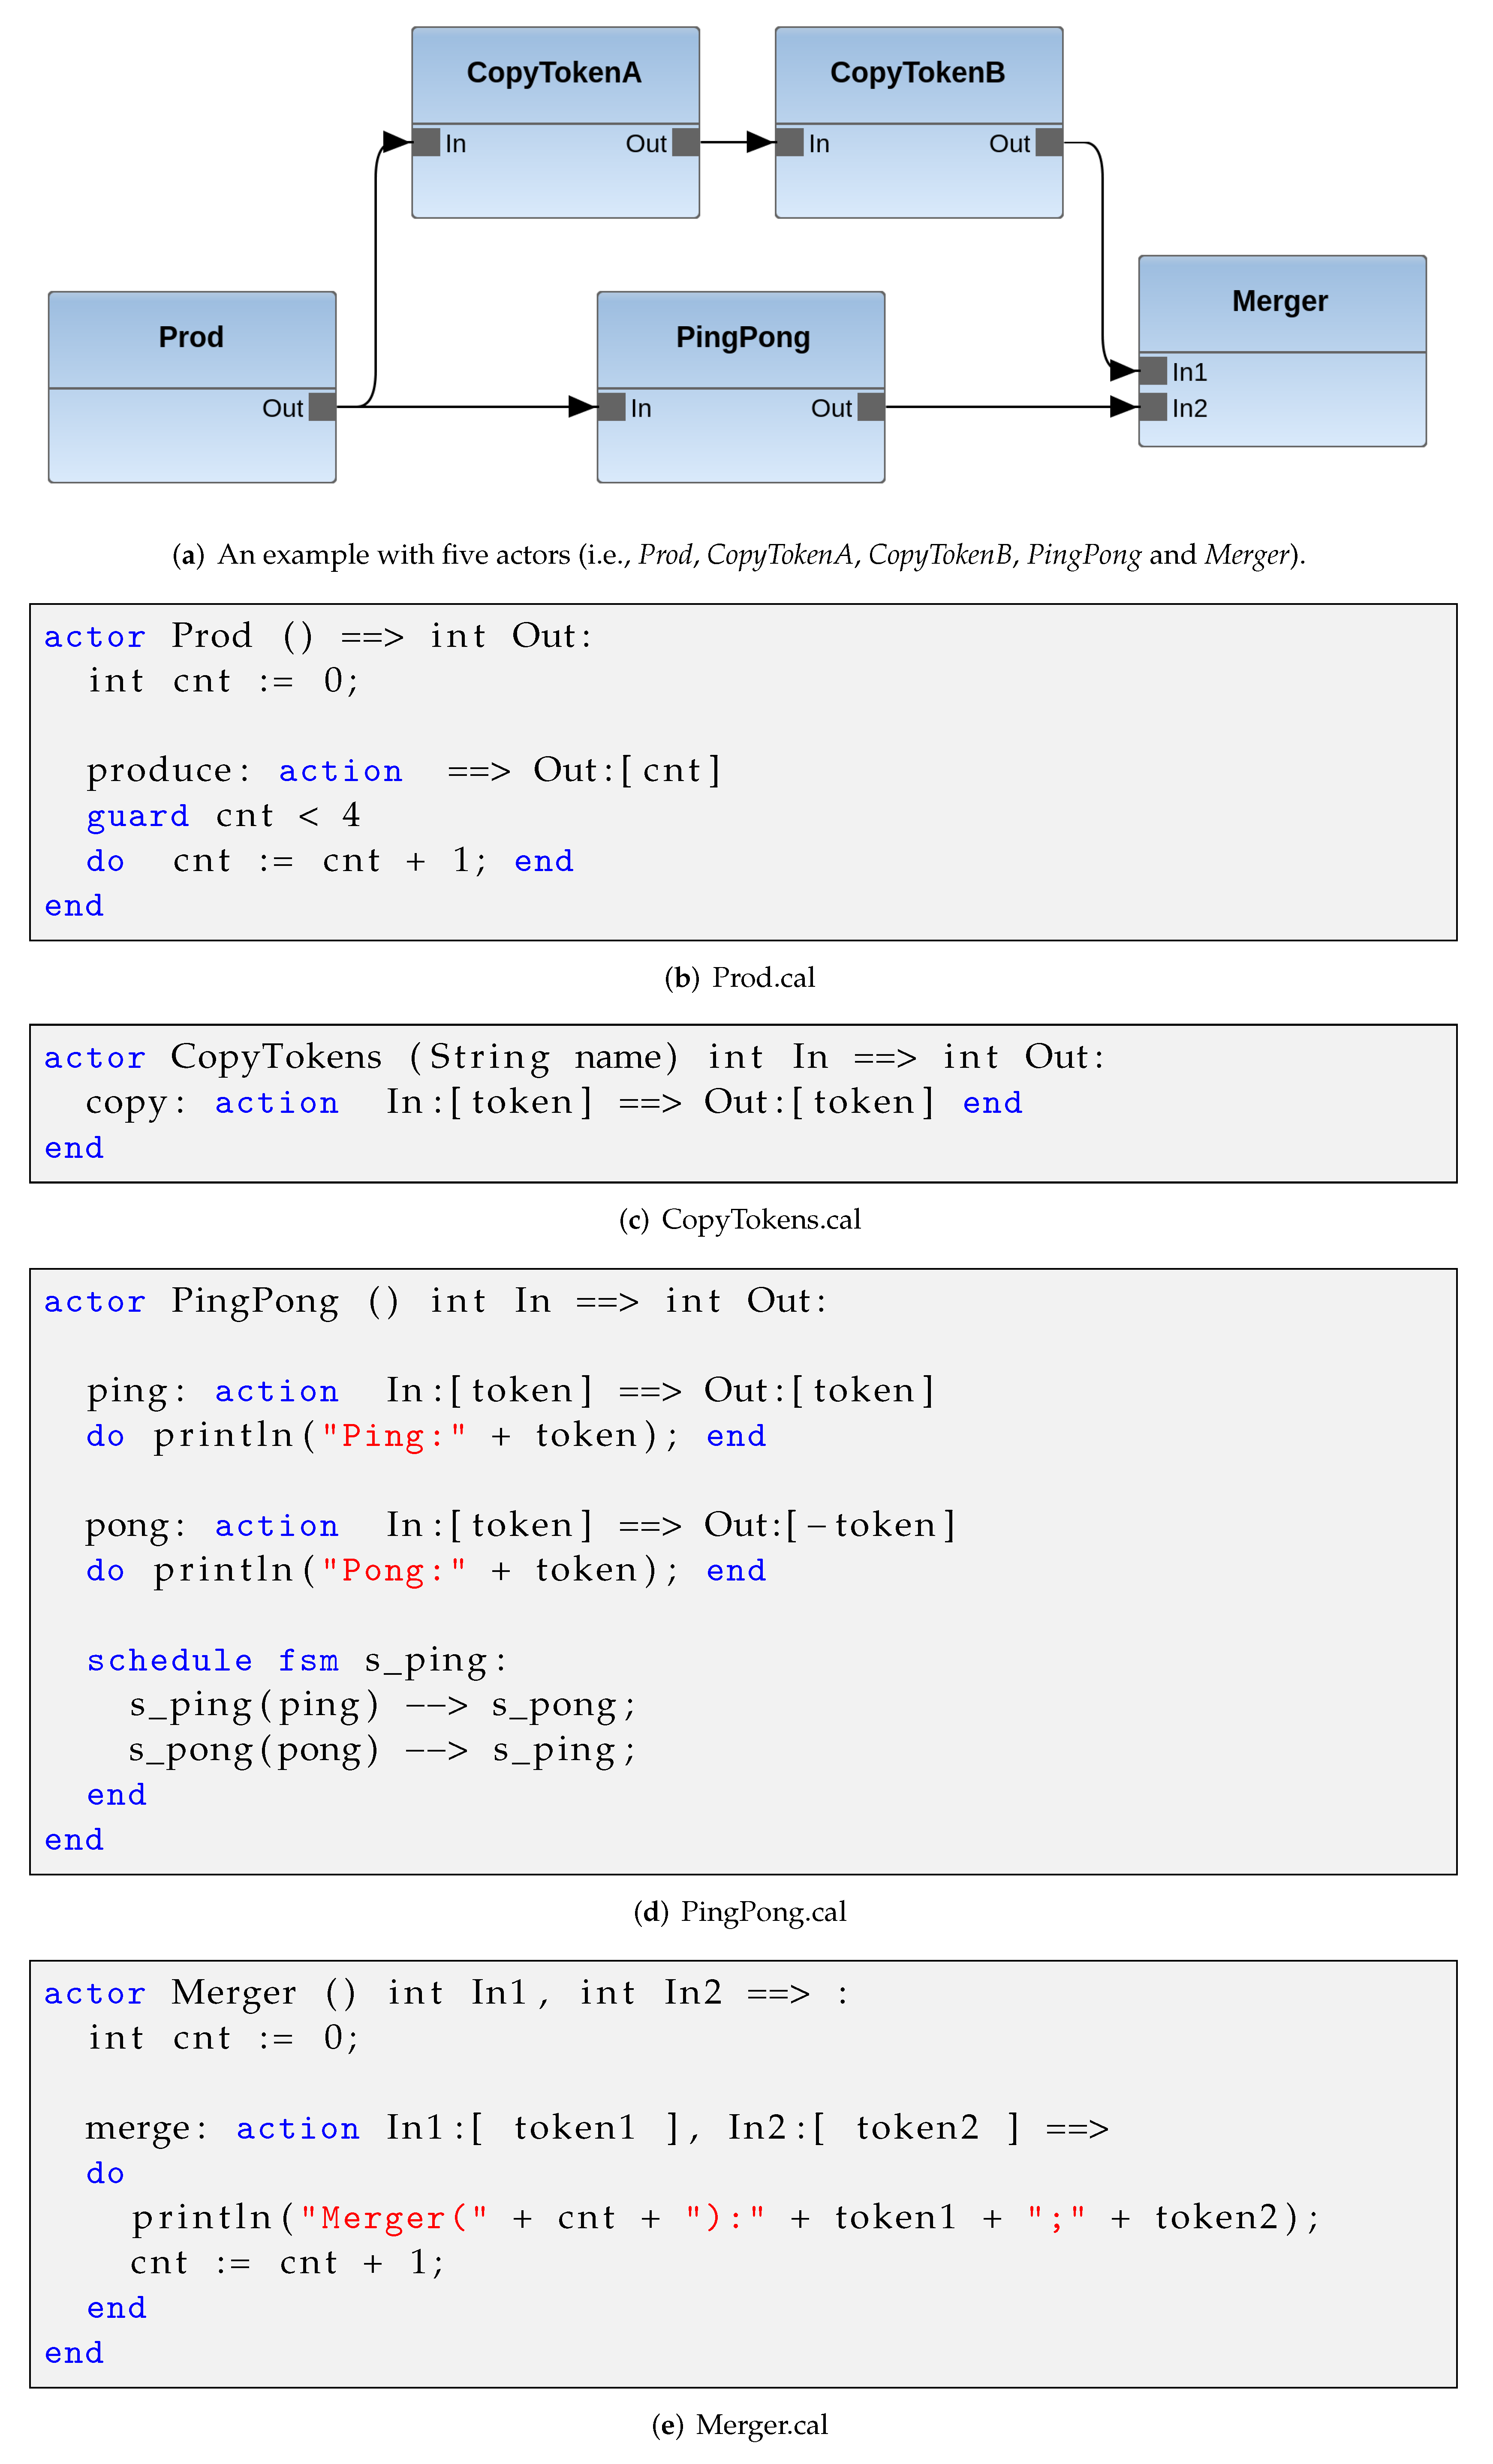
Dataflow process networks (DPN [25]) is a model of computation where a number of concurrent processes communicate through unidirectional FIFO channels, where writes to the channel are nonblocking and reads are blocking. In dataflow process networks, each process consists of repeated firings of a dataflow actor. An actor defines a (often functional) quantum of computation by dividing processes into actor firings.
Therefore, the continuous stream of data (tokens) connecting actors in a dataflow network is entirely explicit, and the access to shared data is solely permitted by transmitting packets of data. This research is based on a high-level dynamic dataflow model of computation (MoC) based on a variant of the DPN presented above. A characteristic aspect of this MoC is that an actor execution is defined by a series of atomic computations (firings). During every firing, an actor could fetch a specific number of input data, push a specific number of output data, and change its local memory when applicable (i.e., determined by the processed input token values and the values of the state variables). The computational element of a unique actor’s firing is defined by the "action". At every stage, depending on its input token’s value and the values of its state variables, a single action is allowed to be executed. The resultant lack of data race and critical section made the behavior of the dataflow software more robust to various computational policies, whether they were fully parallel or only interleaving the respective actor executions [7].

3.1. RVC-CAL

Over the past few decades, an abundance of various software languages have been employed to implement the semantics of dataflow programs [26]. Imperative languages (e.g., Python, Java, C, C++) were augmented including parallel operators, or new languages supporting dataflow features (e.g., SISAL [27], Ptolemy [28]) were developed and standardized. In this diverse environment, the reconfigurable video coding cal actor language (RVC-CAL) has been the only formalized dataflow programming language with ISO compliance (International Organization for Standardization) that fully encompasses the behavioral characteristics of the DPN MoC [29]. Every RVC-CAL actor is composed of a collection of atomic firing functions, called actions, and a set of internal memory that cannot be accessed by other neighboring actors. Only a single function can be executed in parallel while the actor is executing. In other words, for every actor, the collection of firing rules determines at which point the action is allowed to be fired. Each one of these rules can be expressed as a function of the actor’s internal variables and on the availability and value of the input tokens. More precisely, a firing rule can be defined as a Boolean function with a selection of the action input pattern (i.e., that specifies the necessary number of tokens for the action to be fired and that will be taken out of the FIFO buffers) and the action guard condition (i.e., that is, a Boolean expression defined by the actor’s internal memory and the values of the consumed input data). To illustrate these concepts, Figure 1 depicts a simple example of an RVC-CAL dataflow application software, in which Figure 1a reports the graphical model of the network of actors of the example. The dataflow program was composed of five instances of actors (Prod, PingPong, CopyTokensA, CopyTokensB, and Merger). Figure 1b shows the RVC-CAL software code of the Prod actor. It had only one action that output a single token per execution and bumped-up an internal counter. A guard stopped the action from firing more than four times. In the implementation of the PingPong actor in Figure 1d, a scheduled expression played the role of a finite state machine (FSM), in which the execution of an action was the trigger of a change in an actor’s state. The FSM provided an additional element (or language operator) that contributed to the subsequent selection of the action to be executed. In this example, it directed two actions that were executed in an alternating cycle.
An important property of RVC-CAL programming language is its abstraction level, for which it can be considered as fully platform-agnostic: from its high-level representation of the program execution, it can generate optimized, low-level code for various parallel, heterogeneous architectures and platforms. Within the scope of this study, the framework utilized was open RVC-CAL compiler (Orcc) [30,31]. It is worth noting that RVC-CAL compilation is also supported by other open-source compilers developed in the past years, for example, Caltoopia [32,33], Tÿcho [34], Cal2Many [35,36], DAL [37], and StreamBlocks [38].

3.2. Design Space Exploration

The objective of design space exploration and optimization is to find an efficient design configuration leading to an efficient implementation so that the required system resources are minimized and the performance requirements are met. Therefore, both reduction of the utilization of hardware resources established on development choices (e.g., reduction of total memory usage), and algorithmic optimizations (e.g., parallel algorithms) of the application software were conducted during this phase of the implementation process. In the scope of this study, TURNUS was used as a design space exploration software, packaged in the form of an open-source framework. Via software interpretation applied at the level of the RVC-CAL language supplied by the Orcc toolchain, it was possible to obtain a performance-aware, platform-independent, and high-level emulation of the abstract execution of an input application software. As outlined in Figure 2, during this step, TURNUS was capable of evaluating the execution trace graph (ETG) of the software application program [7]. The ETG is a graph-shaped replica of the dataflow program execution, in which every directed edge represents a runtime dependency (i.e., internal variable, finite state machine, guard, port, and tokens.) between two distinct action firings, and every node represents one action execution. After being generated by the tool, the graph could be processed so as to identify the longest succession of processing nodes, or critical path (CP), by using appropriate profiling metrics. Based on this process, the extraction of the information characteristics of the specific CP was used by TURNUS to identify a mapping configuration according to the provided constraints (e.g., buffer sizes of the interconnecting channels) that could minimize or maximize an objective function (e.g., data throughput), as supplied by the user. In addition, the framework provided a rapid performance assessment functionality based on the post-processing of the ETG data structure. This machinery could also be utilized to quickly explore various design points (i.e., partition settings) of the application program, and this could be accomplished while reducing the amount of low-level synthesis needed to verify and evaluate the design.

3.3. Performance Estimation

One of the central features of an ETG is that it can be utilized to represent the entire space of possible scheduling and mapping points of design (i.e., configurations) by using a single actual implementation and execution of the application program as a starting point. Indeed, by adding complementary edges (i.e., dependencies) on the graph, referred to as scheduling dependencies, it was possible to evaluate the runtime behavior for various partitions and configurations. More accurate and detailed information approximately the execution of the application program was evaluated by adding appropriate weighted data to every individual edge and node of the ETG. The weights of the arcs were subject to the data transmission cost, or the w ( s i , s j ) , associated with writing and reading tokens to and from the FIFO buffers, whereas the weights of the vertices corresponded to the time of computation of each action execution, or the w ( s i ) . In both circumstances, the operation of the application software on the target hardware platform was performed so as to obtain the appropriate profiling weights. Discrete event system specification (DEVS) is a formalized model on which the design space exploration framework TURNUS was founded. It implements the performance estimation method that was utilized as a base for the analysis of the executions and further extended in this article. A DEVS procedure is designed as a collection of atomic elements represented by their transitions of states, time functions, and output progress functions. The state transitions can be initiated by external or internal events. The data transmission across atomic element occurs by means of signals sent/received as the port values that define the template argument for the types of objects produced/accepted, respectively, as output/input. Since the framework was intended to model the complete behavior of a dataflow application program, in addition to considering individual actors and FIFO buffers, the partitions of actors and buffers were also modeled. The partitions were used to simulate the mapping of multiple logical elements on a single processing core where the elements (i.e., actors or buffers) were not executed in parallel, but one after the other, following precise scheduling rules. Figure 3 illustrates the various components of such model: a more detailed description of this approach can be found in [4], where all functional components were extensively described.

4. Performance Estimation Methodology

The following part of this section describes how the Exelixi CUDA backend [9] was improved upon to generate instrumented code to achieve clock-accurate profiling and to output the corresponding performance metrics. We also describe how such measures could be utilized in the TURNUS post-processor to make an accurate estimation of the overall application execution time.

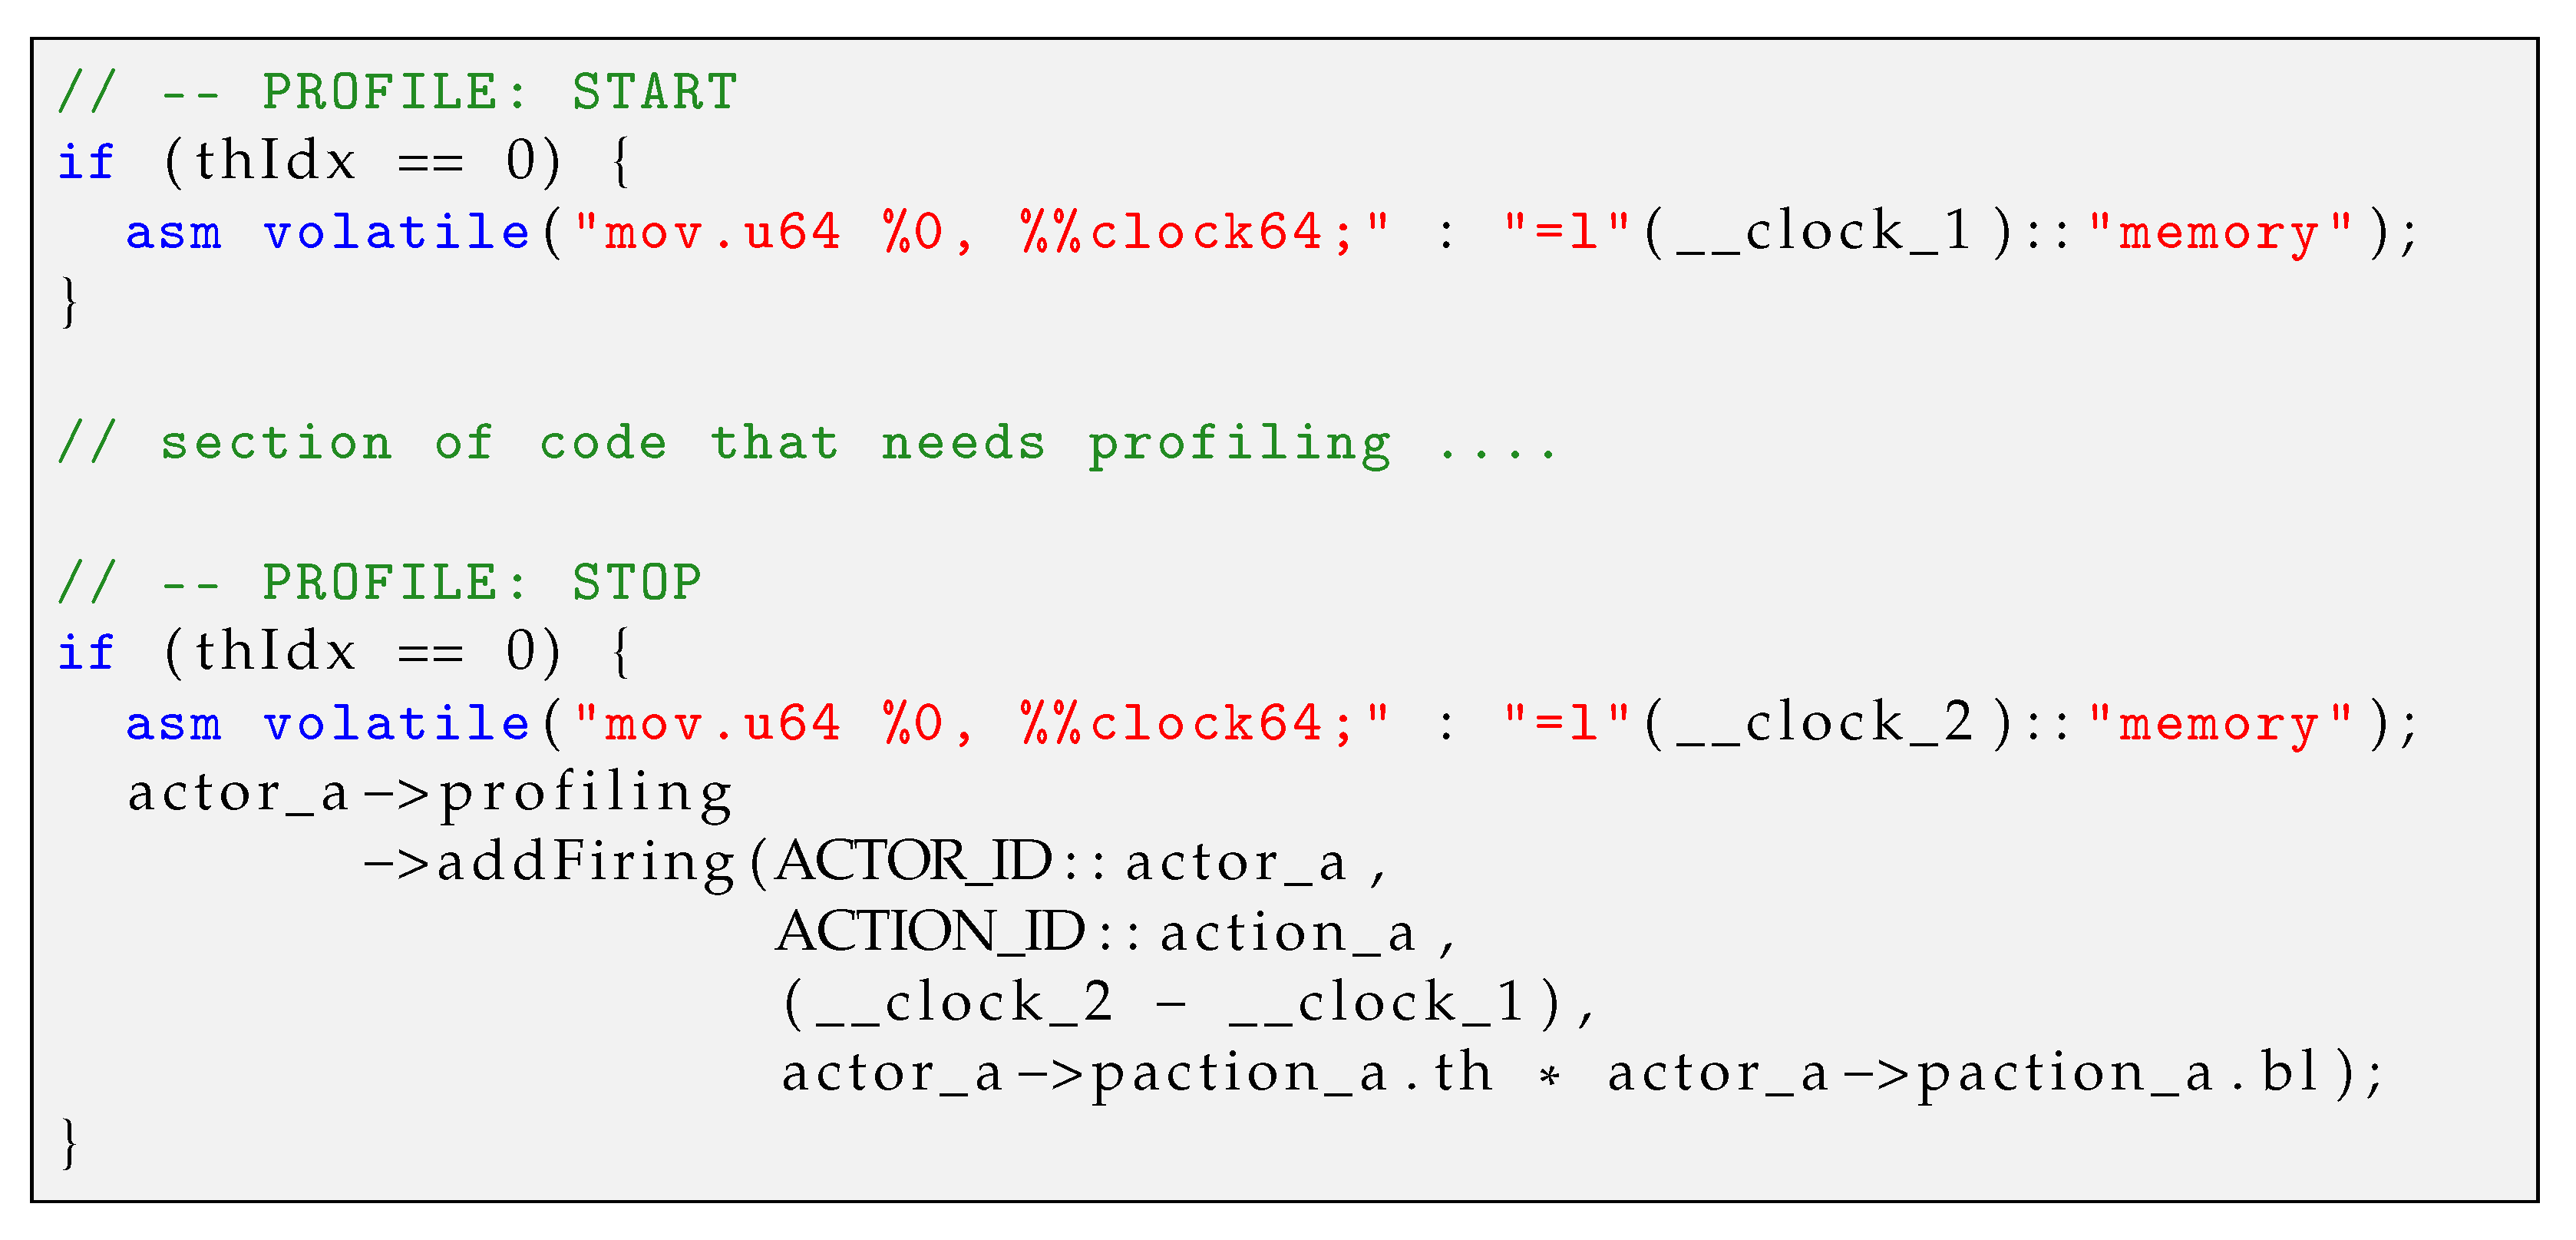
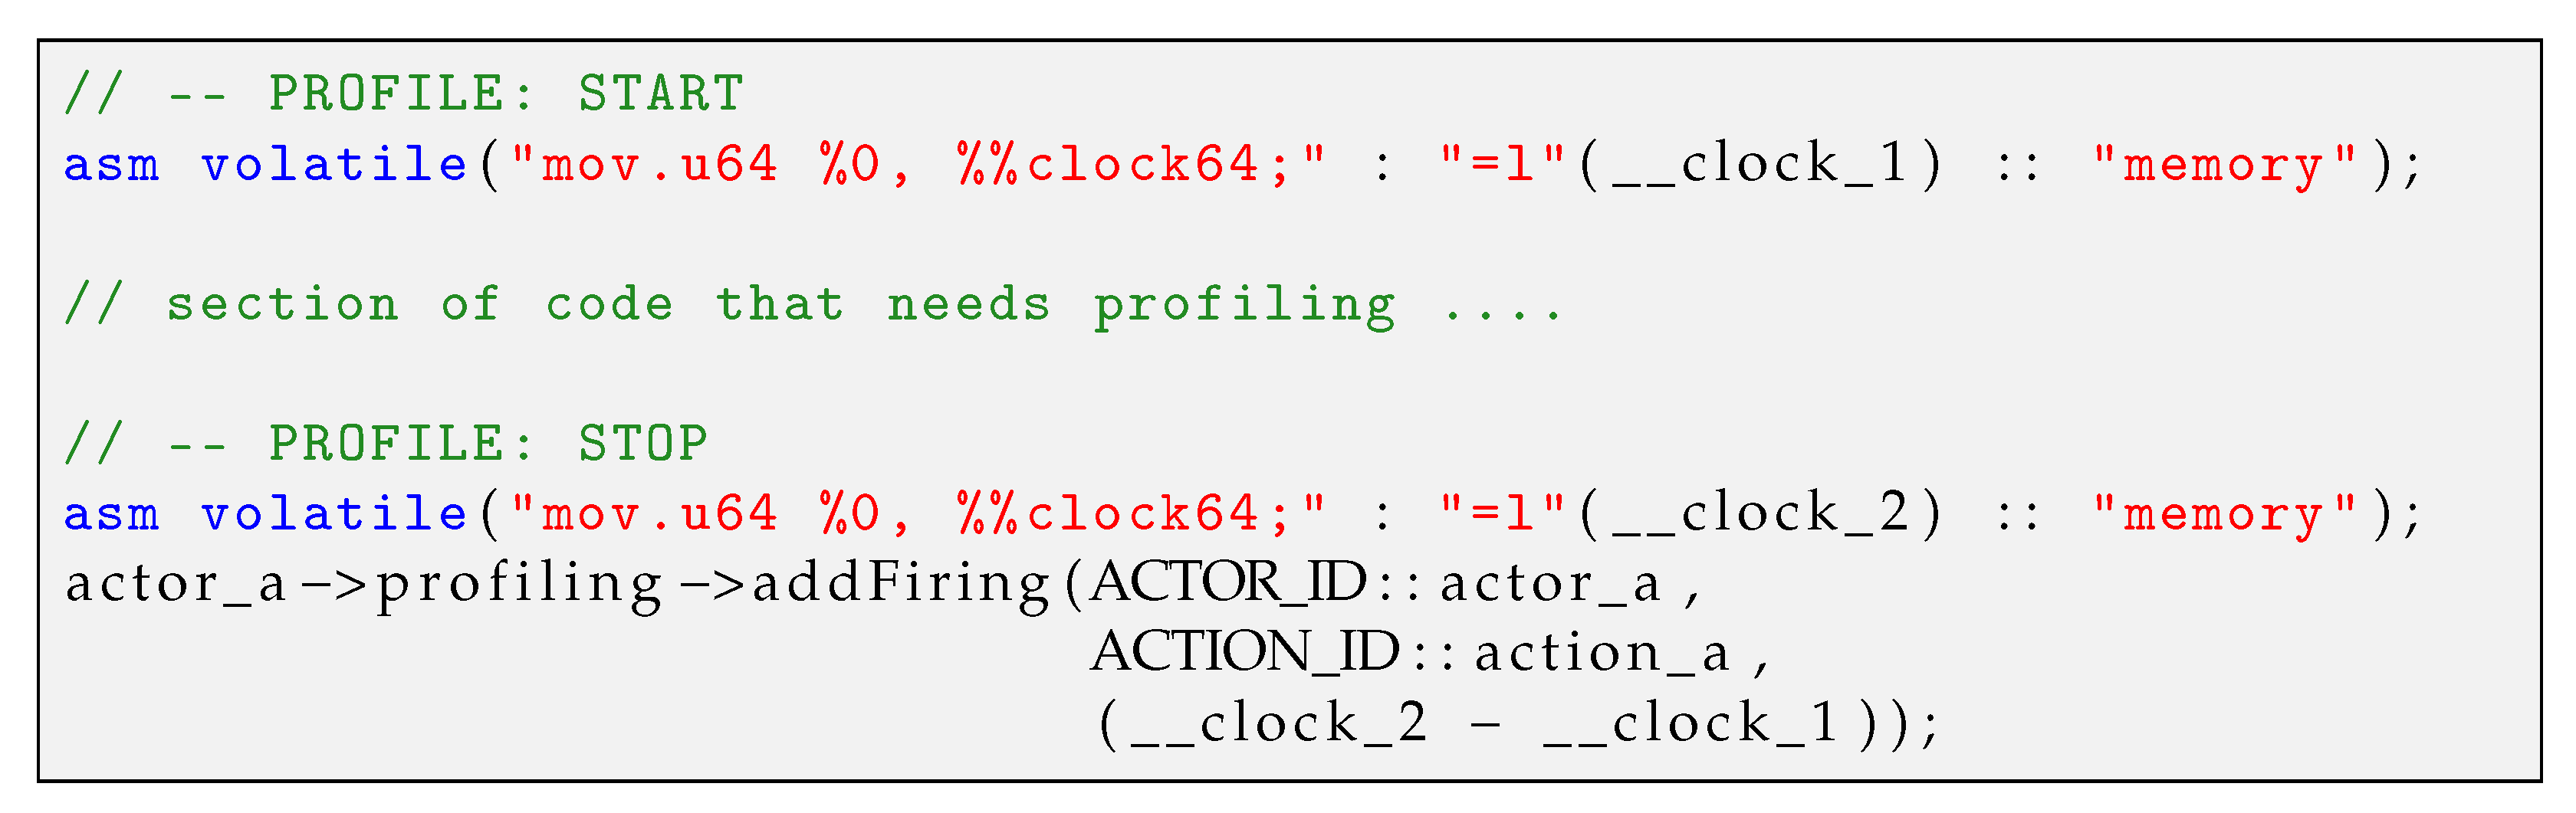
4.1. Clock-Accurate Profiling

To obtain clock-accurate profiling capabilities in an automated method, a new setting in the Exelixi CUDA backend was introduced. The first improvement was to change how the parallel GPU partitions would behave (the partition in charge of the scheduling of all actors) and how the inner scheduler of the actors executing on the GPU would behave (i.e., the CUDA actors themselves). Moreover, in order to avoid any interference with the measurements (e.g., hardware resources access conflicts, memory transfers, etc.), all actors could only be executed in a sequential manner, and a sequential partition was created to schedule, at most, a single GPU actor and a single CPU actor, in parallel. The ordering of the actor scheduling was then switched from fully parallel to non-preemptive (i.e., an actor executed actions as long as inputs, outputs, and predicates allowed it to do so and then released the control back to the partition’s scheduler). The second improvement required for a new implementation of the profiling method was how measurements would be obtained. For clock-accurate metrics, the ability to read platform counters that increased at a fixed rate was required. For the actors running on the CPU, an identical RDTSC intel register in [39] was employed. For the actors running on the GPU, a different approach was required. The NVidia hardware platform (utilized for obtaining the results reported in this article) provided an equivalent functionality for profiling CUDA’s streaming multiprocessors. Figure 4 shows the SASS assembly code utilized to access a steady and clock-accurate performance measurement. These calls could be positioned on opposite sides of the portion of code to be profiled.
In contrast with other software solutions for homogeneous hardware methods presented in previous research, we could not assume that the data transmission time for a typical action would be comparable, as regardless of the chosen partition of the actor (CPU or GPU), it would still be transmitting data. Moreover, cross-platform transmission (i.e., GPU to CPU) is much more resource-demanding. Considering this, the organization of the action software was revised to distinguish the data transmission from the action computation. Figure 5 shows that initially, each input essential to the action computation was read in a sequential manner before the action body, and the tokens produced as result of the computation were written to the outputs. This allowed for sufficient differentiation and measurement of communications and execution weights.
All these metrics from both the GPU and the CPU were aggregated in the profiling class, which was responsible for computing the data statistics (i.e., mean, variance, min, max, and Gaussian filtering) and for writing to the three output XML files, weight.cxdf, weight.exdf, and weight.sxdf, that were composed of the measures for the communication, action body computation, and scheduling metrics, respectively.

4.2. Static Heterogeneous Estimation

This section describes the approach that was developed for obtaining the profiling metrics generated by our method, as explained in the last section. First, at issue was how to manage the differences in frequency between the clock rates of the GPU and CPU. Therefore, for every measure in the XML file, the clock rate of the hardware, on which the measures had been extracted, was added. An extra input to the TURNUS post-processor was thus provided to properly normalize all measurements. To obtain the CPU clock cycle rate, the RDTSC register value was sampled after a fixed time, so as compute the clock cycle rate utilized for the RDTSC register. For the GPU frequency, NVidia disclosed this number via the CUDA API. Finally, another challenge we had to address was the frequency variability. Regardless of the term used (e.g., dynamic clocking, boost, step speed, turbo boost, etc.), various systems for clock rate volatility had been developed for each hardware. These technologies were removed during sampling so as to improve the accuracy of the performance estimation.
The static profiling method consisted of selecting and setting the configuration of the network for the application software during profiling. It was necessary to pinpoint which design settings had to be communicated to the Exelixi CUDA backend as a foundation for the generation of the instrumented software. In order to consider all possible combinations of different FIFO buffers and actor platform assignments, four distinct configurations were needed to output the weights required to estimate the runtime of any configuration, regardless of the sophistication of the software program and the number of potential points of design. These four design points are shown in Figure 6. Examples one and two had all actors assigned to either the CPU or the GPU, respectively. They were then able to measure the action body computation and the scheduling time on each type of hardware platform. However, considering only these two design points would not be sufficient as there was no way to profile the data transmission time across the two platforms (HostFifo n°2 in blue), but only the CPU-to-CPU transmission (Fifo n°1 in red) or GPU-to-GPU transmission (CudaFifo n°3 in purple). To manage this potential limitation, two additional profiling steps with a specifically developed compiler option that would always produce the HostFifo (i.e., FIFO for cross-platform data transmission) to connect each actor was utilized to obtain the data transmission time for all the possible design points.

4.3. SIMD Parallel Estimation

In [40], the authors extended the GPU actor methodology with the usage of SIMD parallelization in the action’s execution. For the proper generation of the performance weights, the following changes were necessary. Figure 7 shows the SASS assembly code used to access the clock performance counter during a parallel SIMD action execution. The first element considered was the if-statement with the thread index (thIdx) so that only a single thread report the elapsed time for the entire thread batch in order to avoid race contention to the shared weight collection (profiling). The second consideration was to provide the number of threads in terms of t h and b l that corresponded to the number of CUDA thread blocks and the number of threads per block, respectively.

4.4. Dynamic Heterogeneous Estimation

In this section, an alternative methodology for the generation of performance weights is presented. Instead of using four static sequential partitions where, at each point in time, a single CPU or GPU actor would be evaluated, a single dynamic program where the configuration of mapping and partitioning was generated and set dynamically during the instantiation of the network. The goal of this change was to increase the speed of the process and to better model what occurred on the hardware at runtime in terms of resource conditions, such as the bus between the CPU and the GPU, or the available CUDA threads on the GPU.

4.4.1. Model for Dynamic Network

In this section, a methodology to generate dynamic RVC-CAL networks is introduced. Instead of repeating the entire four steps of the compilation flow each time a new configuration was evaluated, a single final binary was created that could specify the partition and mapping at runtime during the startup process of the application. Therefore, to test a new configuration, it would be sufficient to change the input XML file and rerun the program.
  • Change the Exelixi CUDA backend parameters configurations files.
  • Generates code
  • Compile
  • Execute
For this methodology, the newly developed Exelixi CUDA backend option generates a shadow CPU version that is not connected by default in the network for each actor assigned to the parallel GPU partition, and depending on the input configuration file, the proper version of the actor would be substituted. Figure 8 illustrates this methodology. In this example, the application program had four actors ( A , B , C , D ) connected together, back-to-back, by three FIFO buffers.
Figure 8a illustrates the former static methodology in which the actors A and D were assigned to the CPU and B and C to the GPU. In this case, the Exelixi CUDA backend only generated the appropriate code to match the configuration, as requested by the developer.
Figure 8b shows the alternative dynamic methodology, where for the actors B and C assigned to the GPU, the Exelixi CUDA backend also generated shadow actors B * C * , respectively, targeted to the CPU. At runtime, during the setup process, the actors’ network was dynamically instantiated with the appropriate versions. The code generated for the handling of the FIFO buffers (e.g., reading, writing, updates notification) was changed so that the same FIFO instance could be used by an actor running on either the CPU or the GPU. Currently, this dynamic setup was performed once for the entire time of the execution, and it could not be changed during execution, especially if the actor contained internal state variables. This was due to the current implementation, where the internal state of the actor was not mirrored, which is a limitation that can be removed in future releases of the tool.
In the two examples, the FIFO connecting actors B and C were not the same (as the color difference attests). Indeed, the one for the static example was a specific GPU-to-GPU FIFO buffer that provided better performance. Due to the dynamic aspect of the second example, this specialization of the FIFO buffer could not be utilized as all buffers had to be HostFifo so that the dynamic switching between the actor and its shadow variant could occur. For more details on the differences between these FIFO buffer implementations, please refer to [8].

4.4.2. Dynamic Methodology Estimation

In this section, we describe the newly introduced dynamic network methodology used to generate the performance weights in the specific partition for which the performance needed to be estimated.
Therefore, both the regular and the complementary shadow actors were injected with instrumented code for measuring the elapsed time for communication, execution, and scheduling. One of the main differences was the execution of the action selection for each actor. Indeed, previously, a single CPU actor and a single GPU actor could be executing at the same time, whereas with this second technique, the code could be executed regardless of the configuration provided with the input XML files and could generate weights in the exact configuration with all the same resource contention and utilization as occurred during actual executions of the application program.
That the profiling could potentially be conducted in parallel provided a new implementation challenge. Therefore, each actor could instantiate its own profiling object to avoid memory contention between actors reporting their measures. Furthermore, for GPU actors, since actions could be executed in parallel, the usage of cuda::atomic variables prevented a data race. At the end of the profiling, all the reported data were merged together to make the appropriate computation so as to generate and output the report files.
This newly developed technique allowed for an updated and accurate full design space exploration methodology. Figure 9 is an updated representation of Figure 2. Here, the TURNUS design space exploration tool provided the configuration files to the already compiled binary to generate updated weights. These weights could then be fed into the performance estimation tool, thus completing the optimization cycle. This smaller and tighter loop offered both a faster exploration of the design space, as the development time to regenerate code as well as compile and test the configuration on the hardware platform would be performed automatically, but it also allowed the weights generated to reflect the actual usage of the hardware.

5. Experimental Evaluation

Two application software programs were used to assess and evaluate the performance of the developed methodology. The goal was to verify if the application runtime estimation had sufficient accuracy to explore the design space. Such estimates were performed using two distinct tasks. The first one is the execution of the software implementation to generate the profiling results as output using the executable synthesized by the Exelixi CUDA backend. The second one is the utilization of the generated weights in the abstract model of execution, from the RVC-CAL construction, and integrated within the TURNUS framework to obtain the resulting estimation. These software application examples are well known, and the corresponding software code can be freely downloaded from the open-source orc-apps Github project [41].

5.1. Experimental Setup

For generating the experimental results, the platforms employed were the Nvidia GeForce GTX 1660 SUPER for the GPU with 6 Gigabytes of VRAM, and the Intel Skylake i5-6600 for the CPU with 16 Gigabytes of DDR4 memory. As described in Section 4.2, the GPU clock speed was maintained at 1.8 GHz and the CPU clock speed at 2.9 GHz.

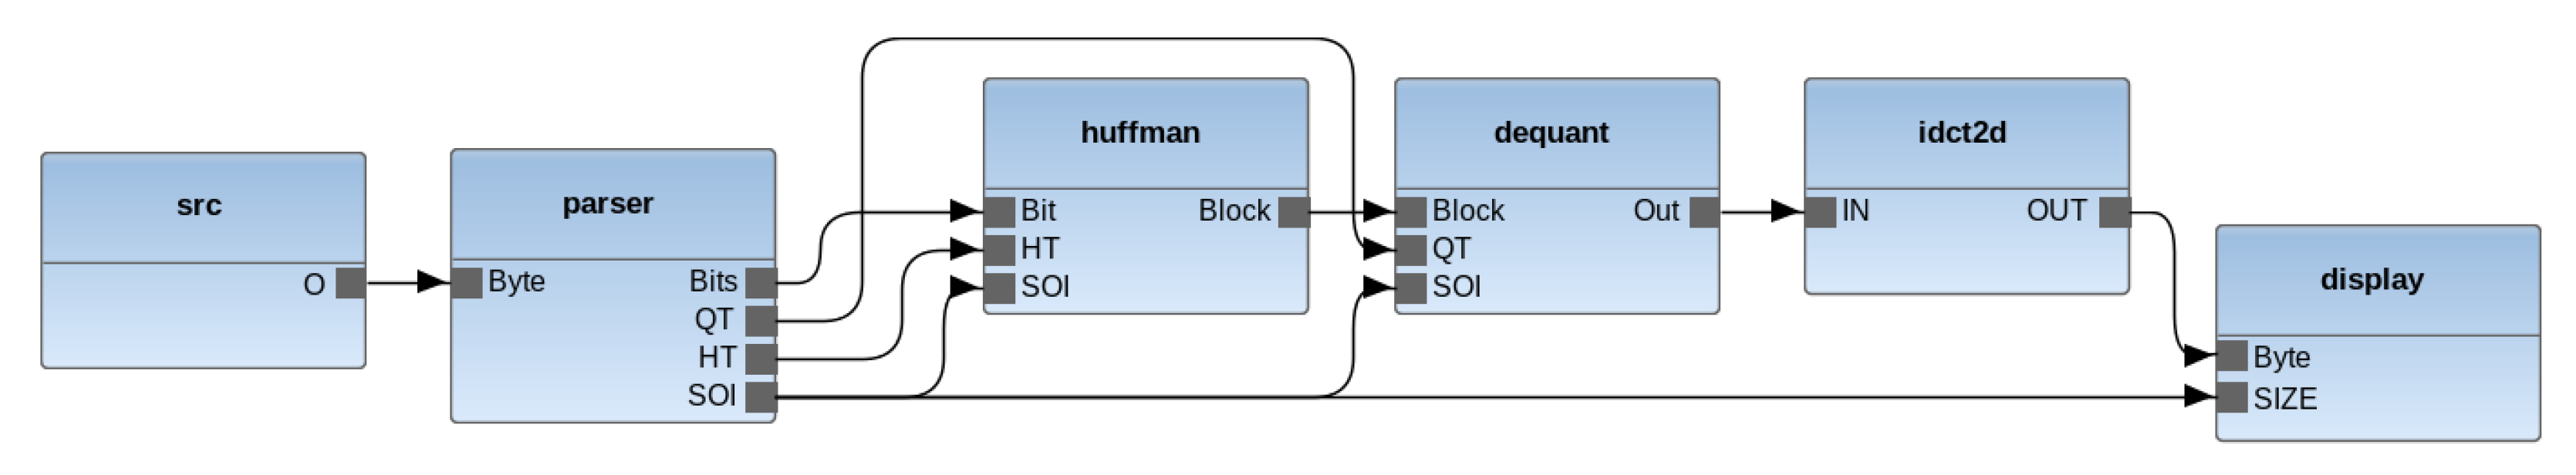
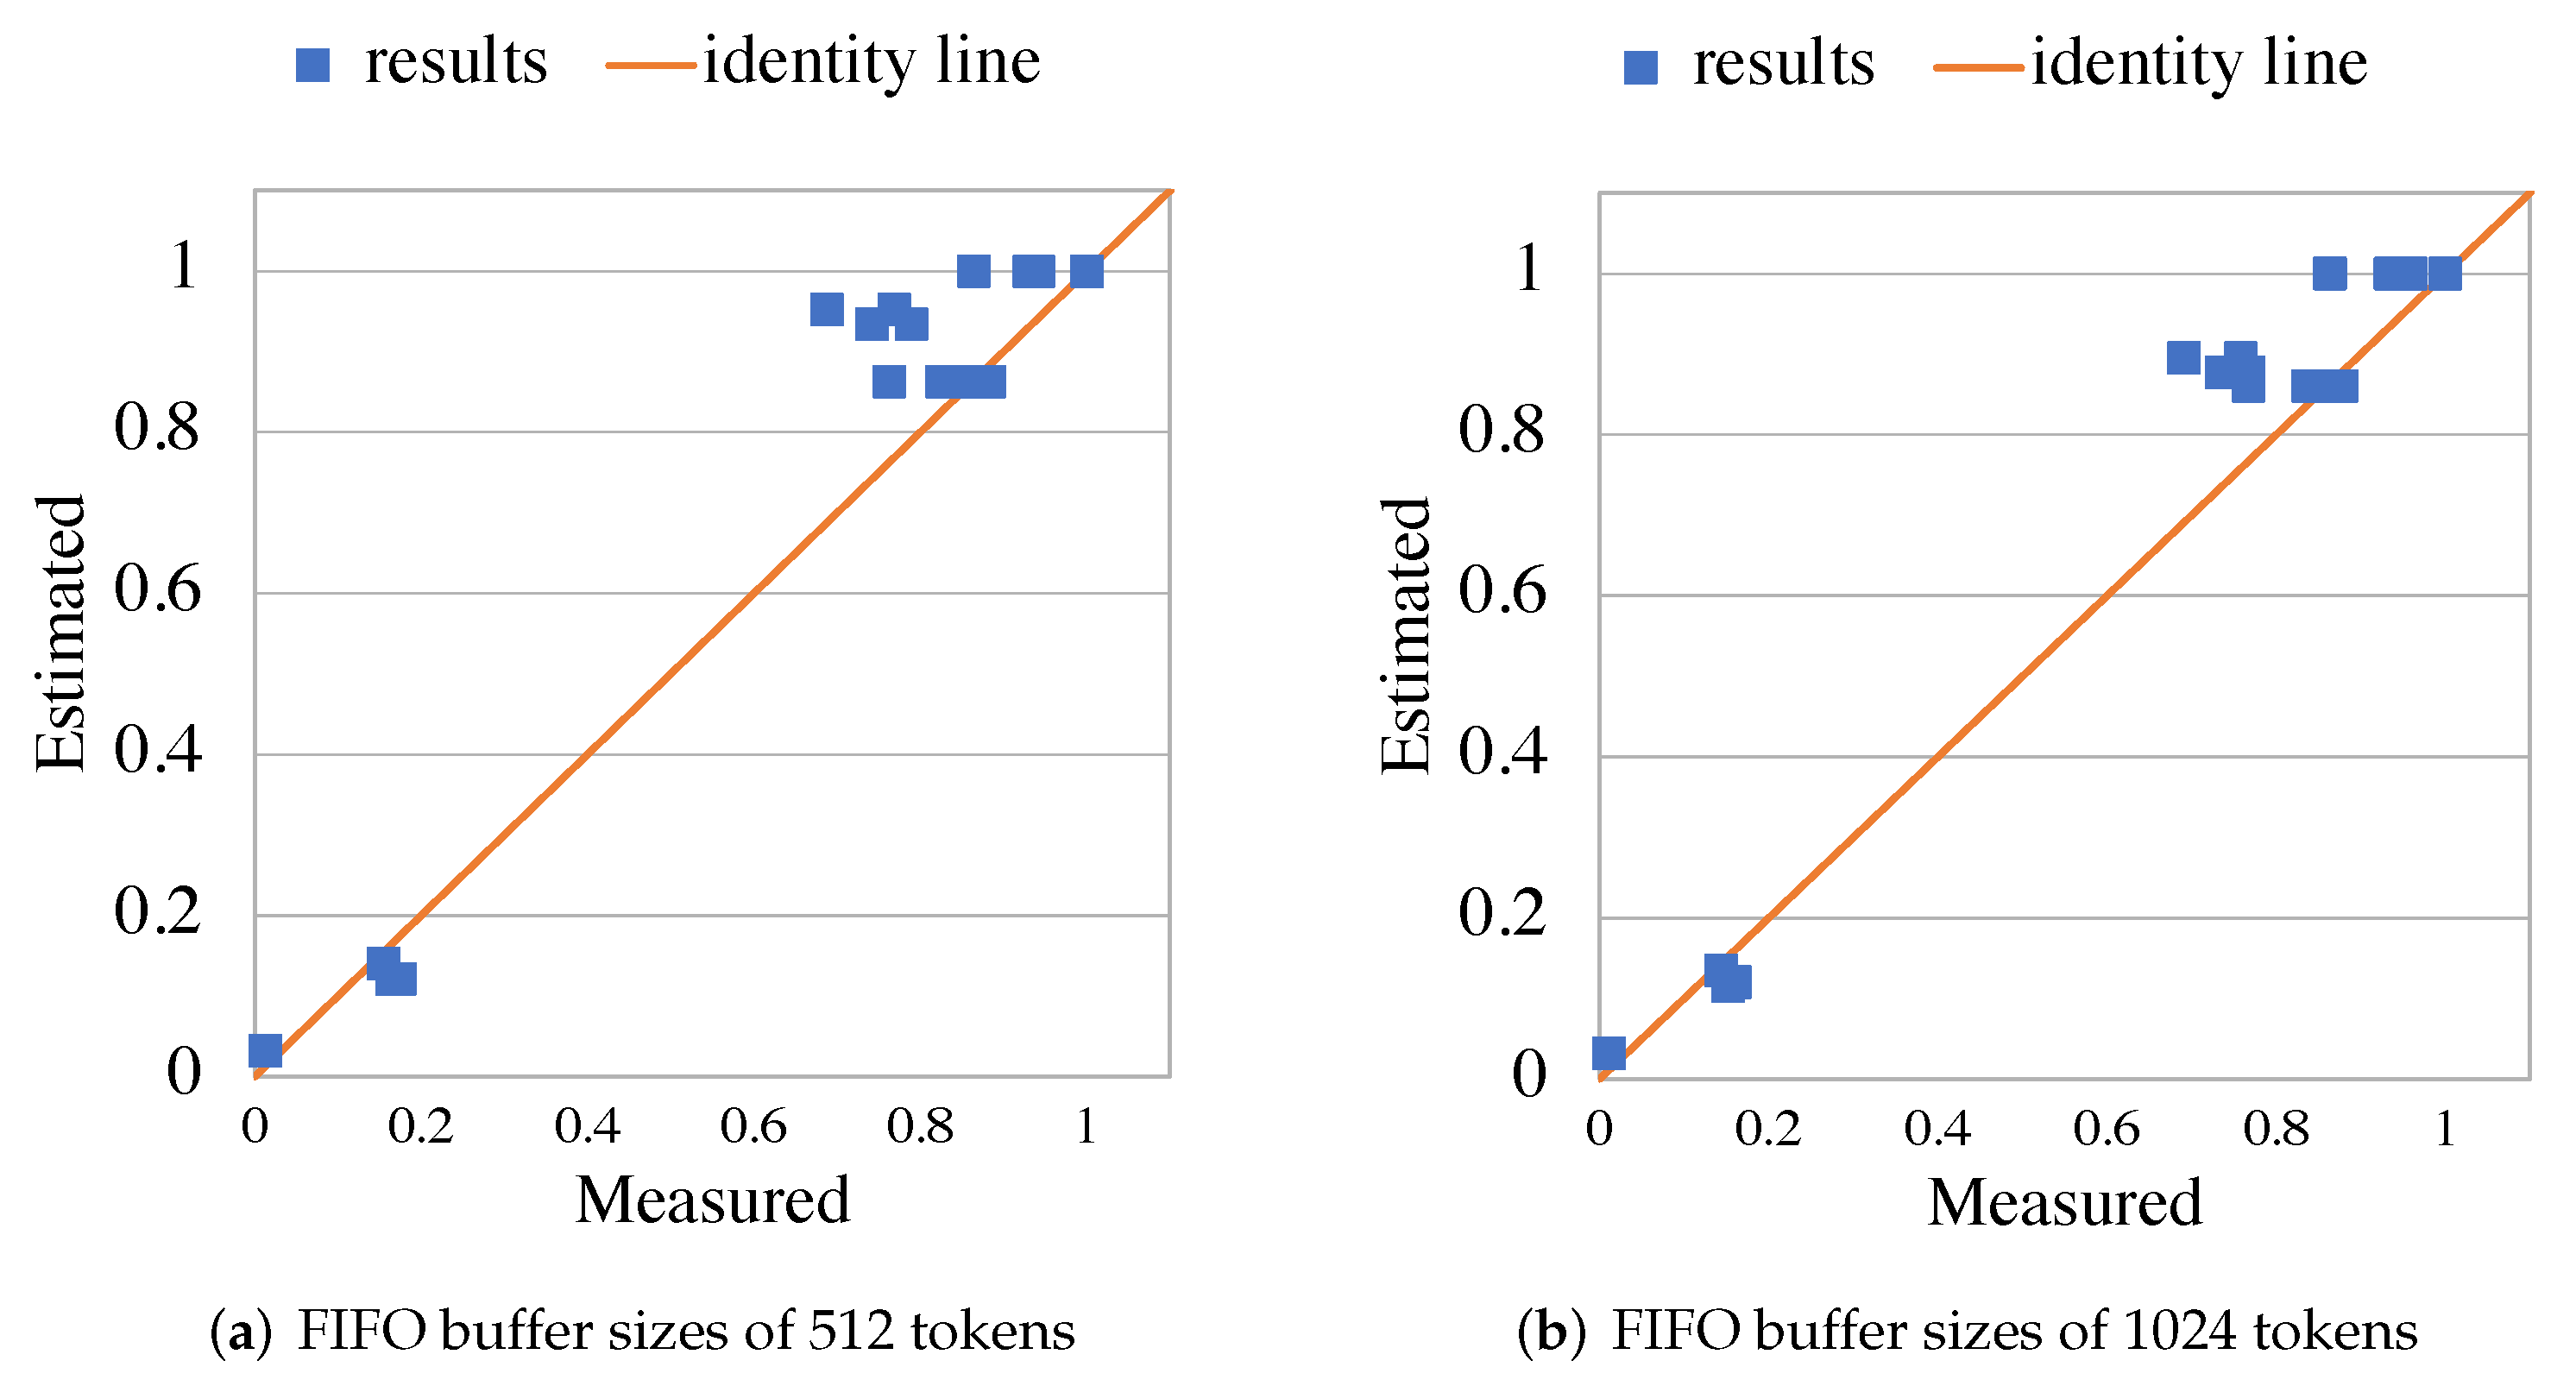
5.2. RVC-CAL JPEG Decoder

Figure 10 is a graphical representation of the network of the JPEG decoder software application program, as first presented in [42], and based on the ITU-T. IS 1091 standard. This program was composed of six connected actors. Excluding the Display and Src actors that were managing, reading/writing the input/output, and operated on the CPU, all the other actors could be indifferently mapped to the GPU or CPU partitions. The parser actor was responsible of the bit-stream parsing and decoding stages, the Huffman actor was in charge of decoding the Huffman codewords carrying the quantified and transformed YUV 4:2:0 data block information, the dequant actor computed the inverse quantization, and finally, the idct2d actor performed the inverse discrete cosine transform.
The first set of results focused on a configuration with one partition, but a variety of input image definitions, quality factors, and FIFO buffer sizes. The design for reference was formed with the Display and Src actors in a unique sequential partition assigned to the CPU while the other actors were assigned to the highly parallel GPU side. For each configuration utilizing TURNUS, a related ETG was extracted. The binary being profiled and compiled from the code produced by the Exelixi CUDA backend was run for each set of distinct input sequence stimuli to output all the requested performance weights. The TURNUS ETG post-processor had been utilized to compute an estimation of the execution time that the application program would need to run. This time was then evaluated, side by side, with the total time measured. Figure 11 presents the outcome, where the application had been evaluated with height-distinct images and two different buffer sizes (512 and 1024 tokens). Table 1 shows the different resolutions and quality factors of the input images used for the experiments. The measures were normalized to the first image, and we observed that the maximal divergence of estimation was approximately 6.00%. This revealed that regardless of the sizes of the FIFO buffers and inputs used, the estimation of the performance could be done with sufficient accuracy.
In the second set of results, we used the same temporal stimulus and mapping configurations while continuing to compare the total time estimated to that measured. In opposition to the first set of results and due to the same image being utilized as an input, a unique ETG was extracted. Regarding the weights and as explained in Section 4.2, only four different configurations were sufficient for generating the weights, and each TURNUS estimation was executed with the proper composition of these weight files. Figure 12 presents the results with 16 possible partitions. The partitions corresponded to an arbitrary selection for each actor to either map them to the highly parallel GPU side or the CPU sequential side. The measures were normalized (between [ 0 , 1 ] ), and the maximal divergence of estimation was approximately 26.5%. As shown in the graph, the mappings in which the estimated results had not been precise were the partitions providing the slowest runtime (top-right) and would not be desirable partitions to select in the design exploration process. This was likely due to the number of FIFO buffers at the boundary across GPU and CPU being higher, as compared to the other mapping configurations. Moreover, for this kind of FIFO buffer, the modeling was optimistic and did not consider all the factors such as the access conflict and the congestion of the memory bus.
Significantly, the result showed that the performance deterioration and improvement tendencies were clearly identified using the estimated time and without the necessity to measure new weights or extract new ETGs for estimating the global performance for each possible setting. This trend detection was the minimal requirement for allowing TURNUS’ heuristics to correctly explore the design space and identify performant configuration points. The reason behind the qualitative evaluation of the methods was to ensure that the mapping configurations could be ranked and that the most satisfactory ones would automatically be selected without the necessity to perform a manual, resource-consuming evaluation on the hardware platform, which would consist of synthesizing, generating, compiling, and measuring each design point on the actual heterogeneous hardware.

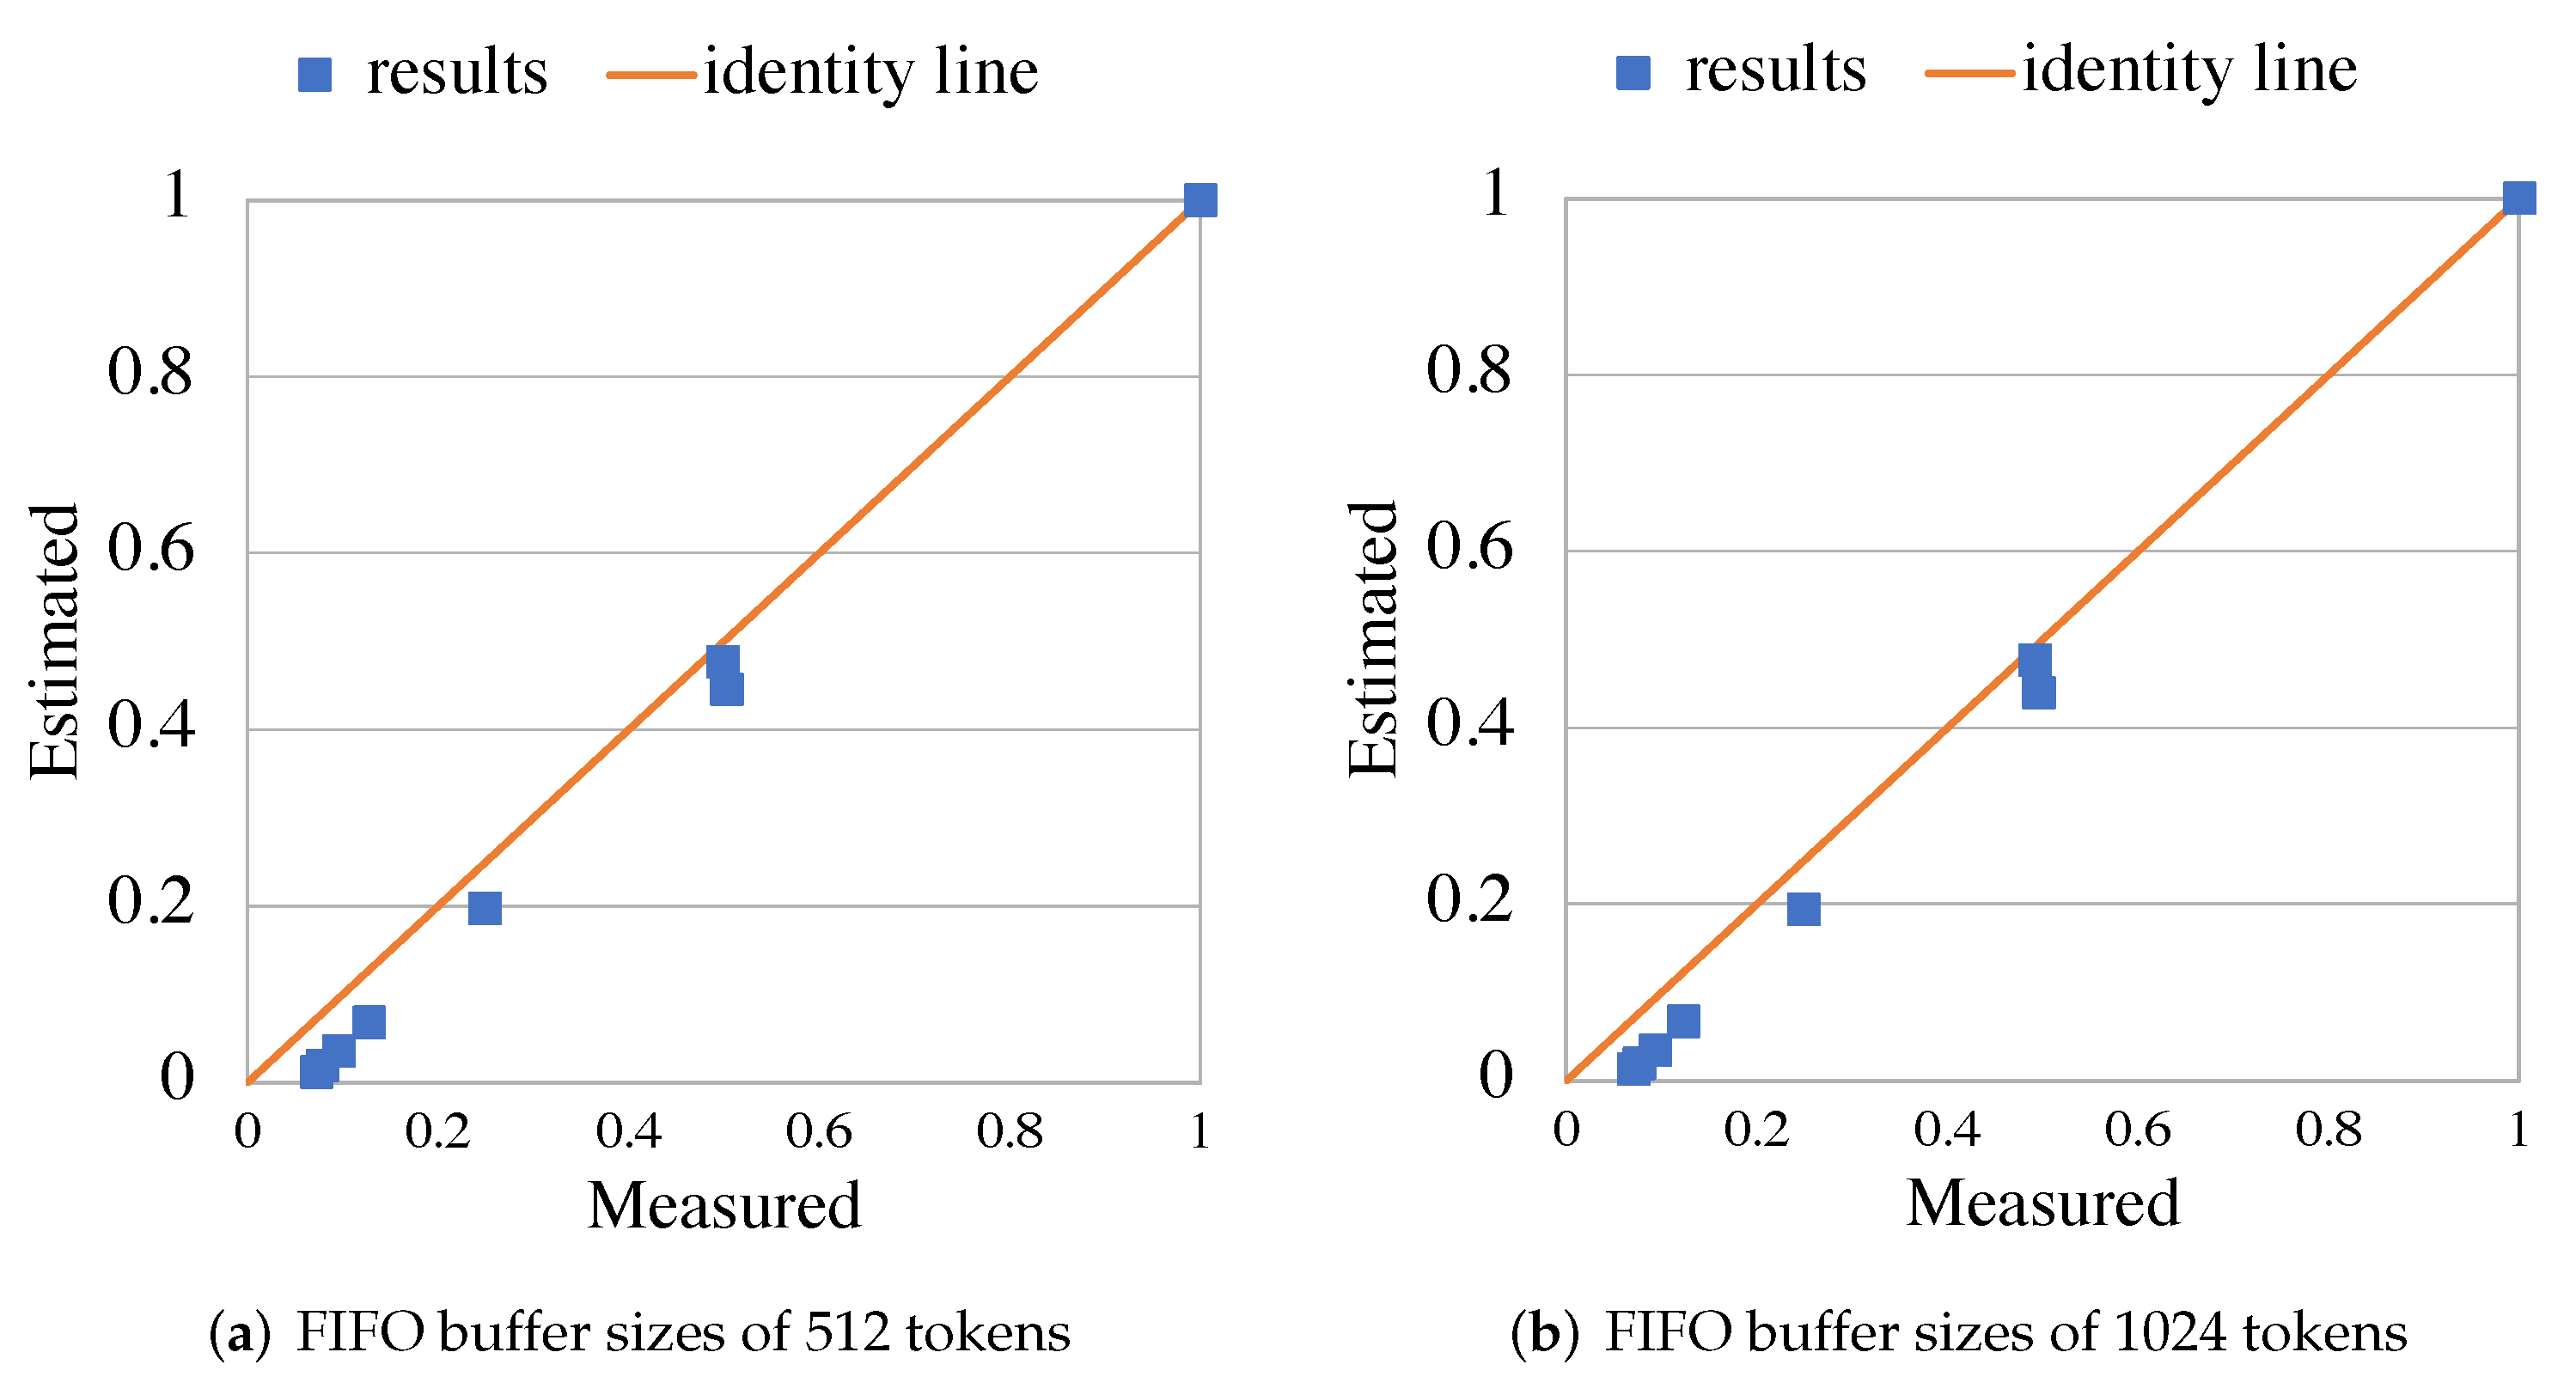
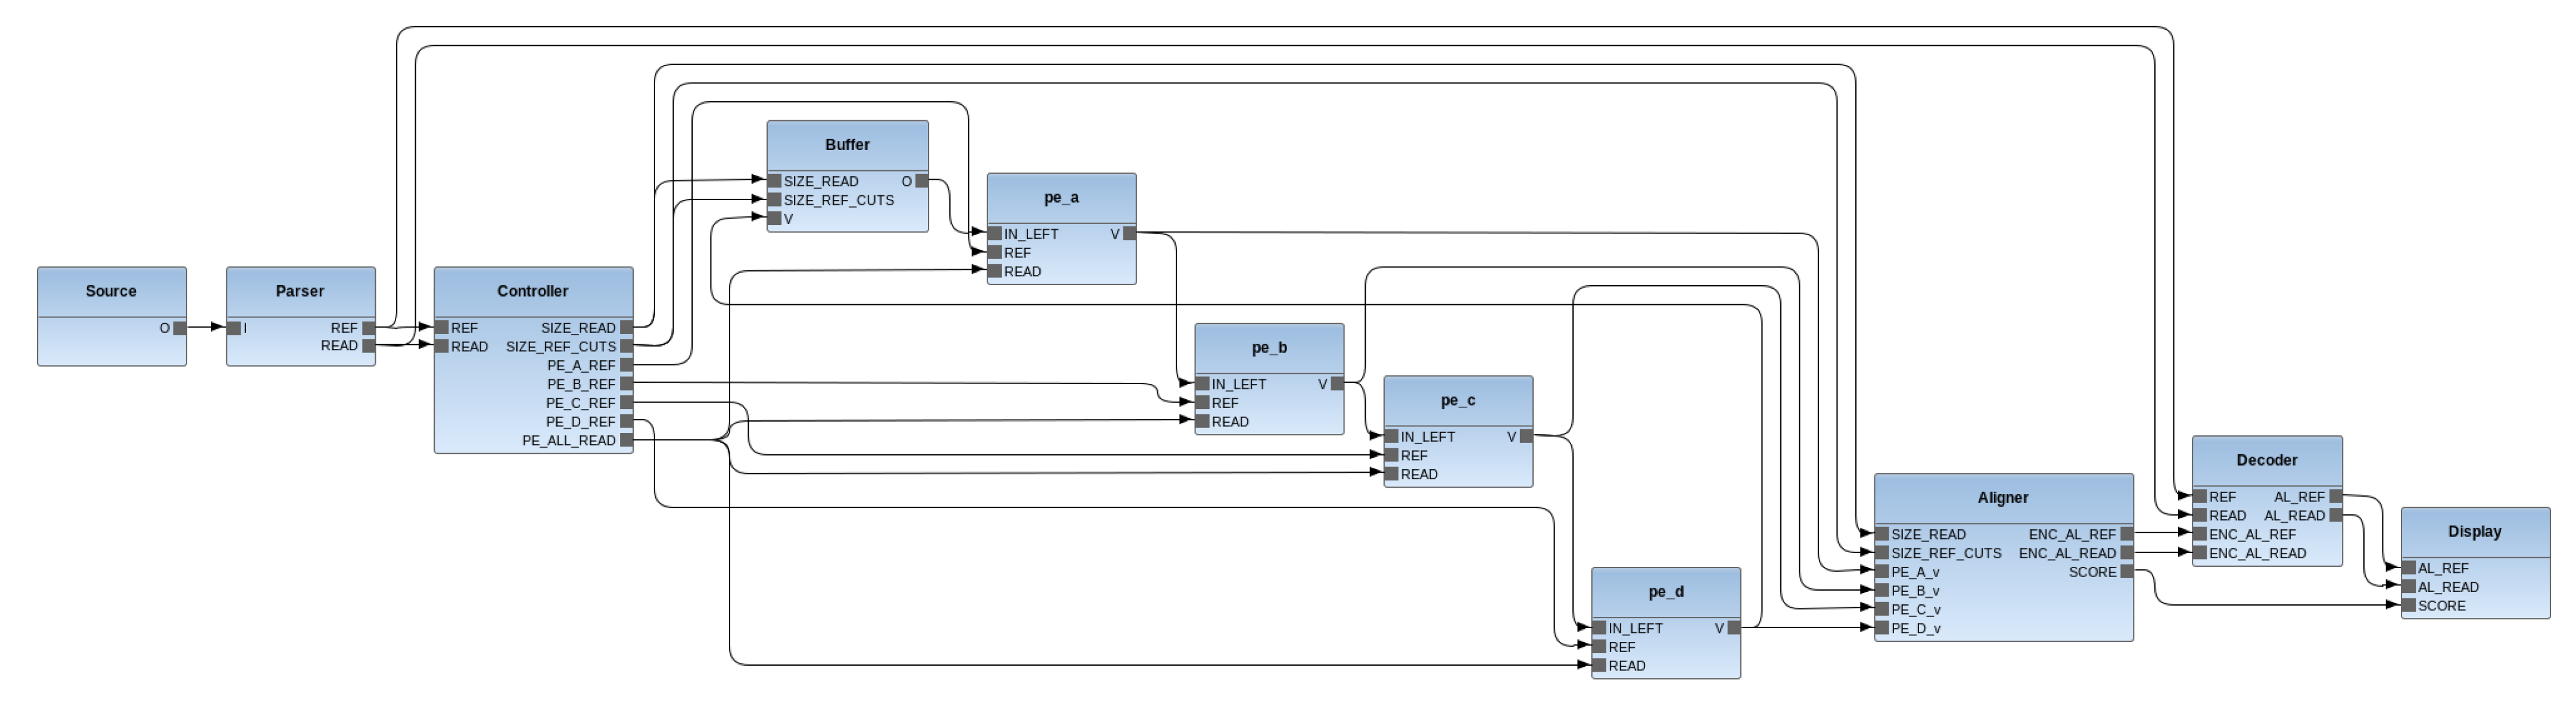
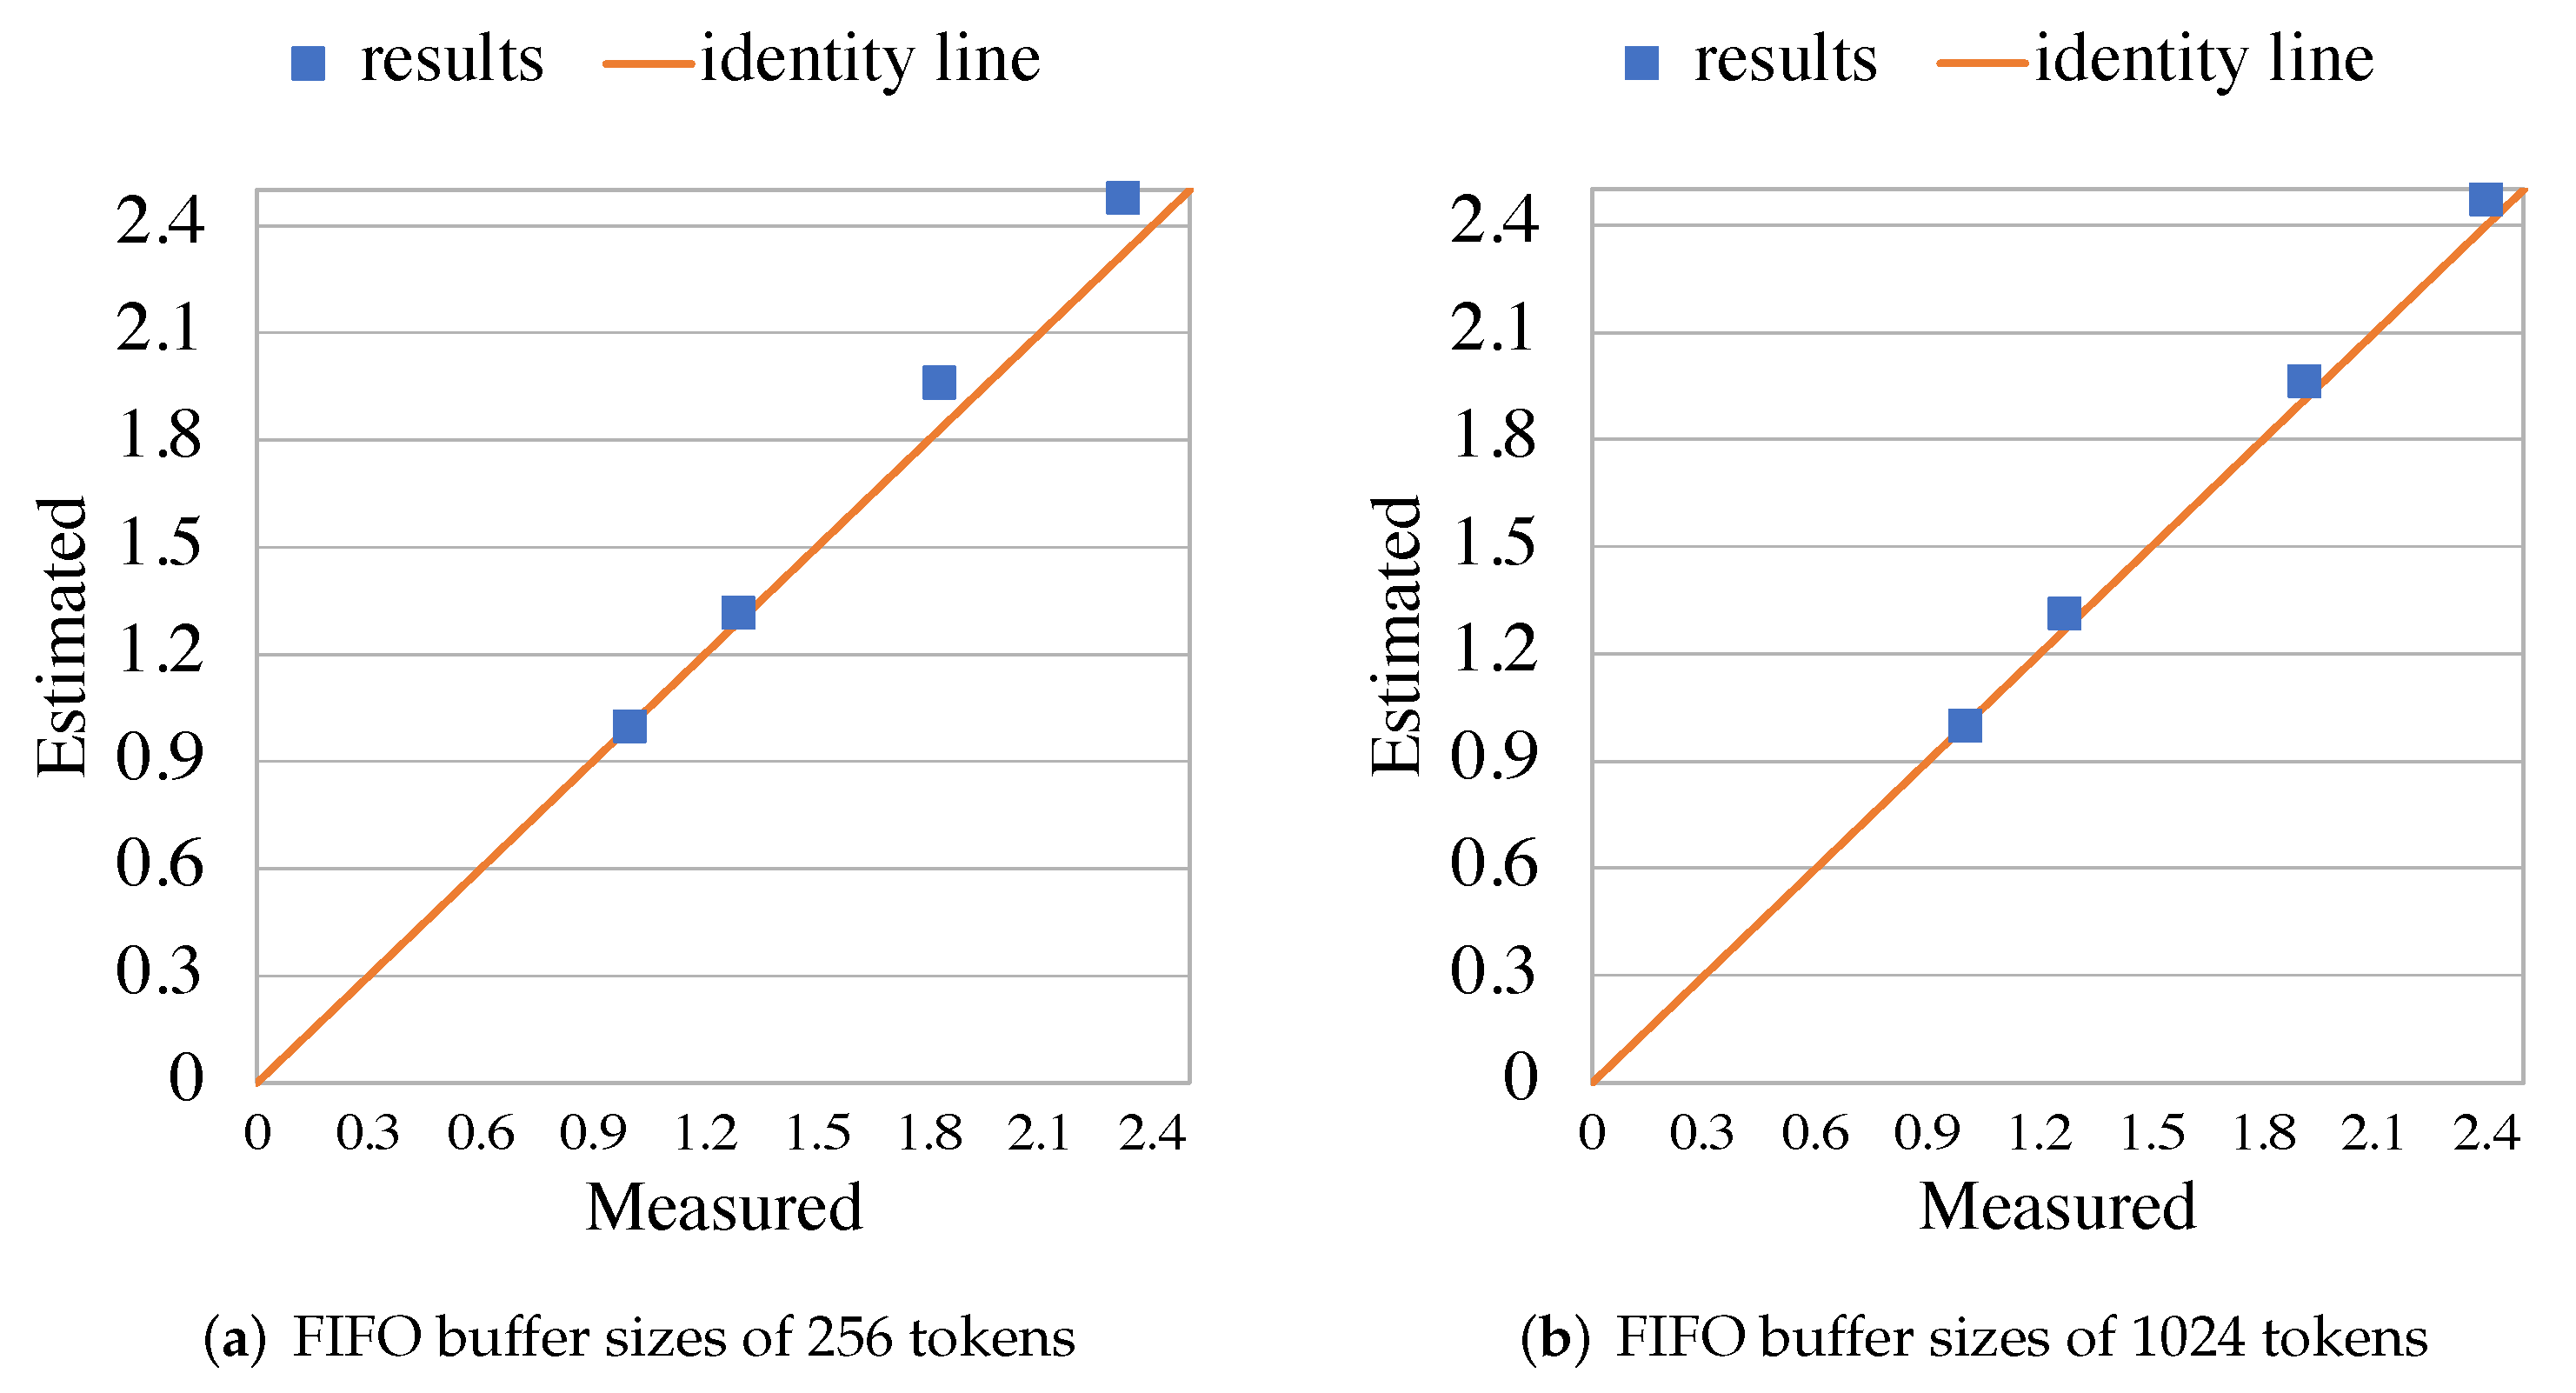
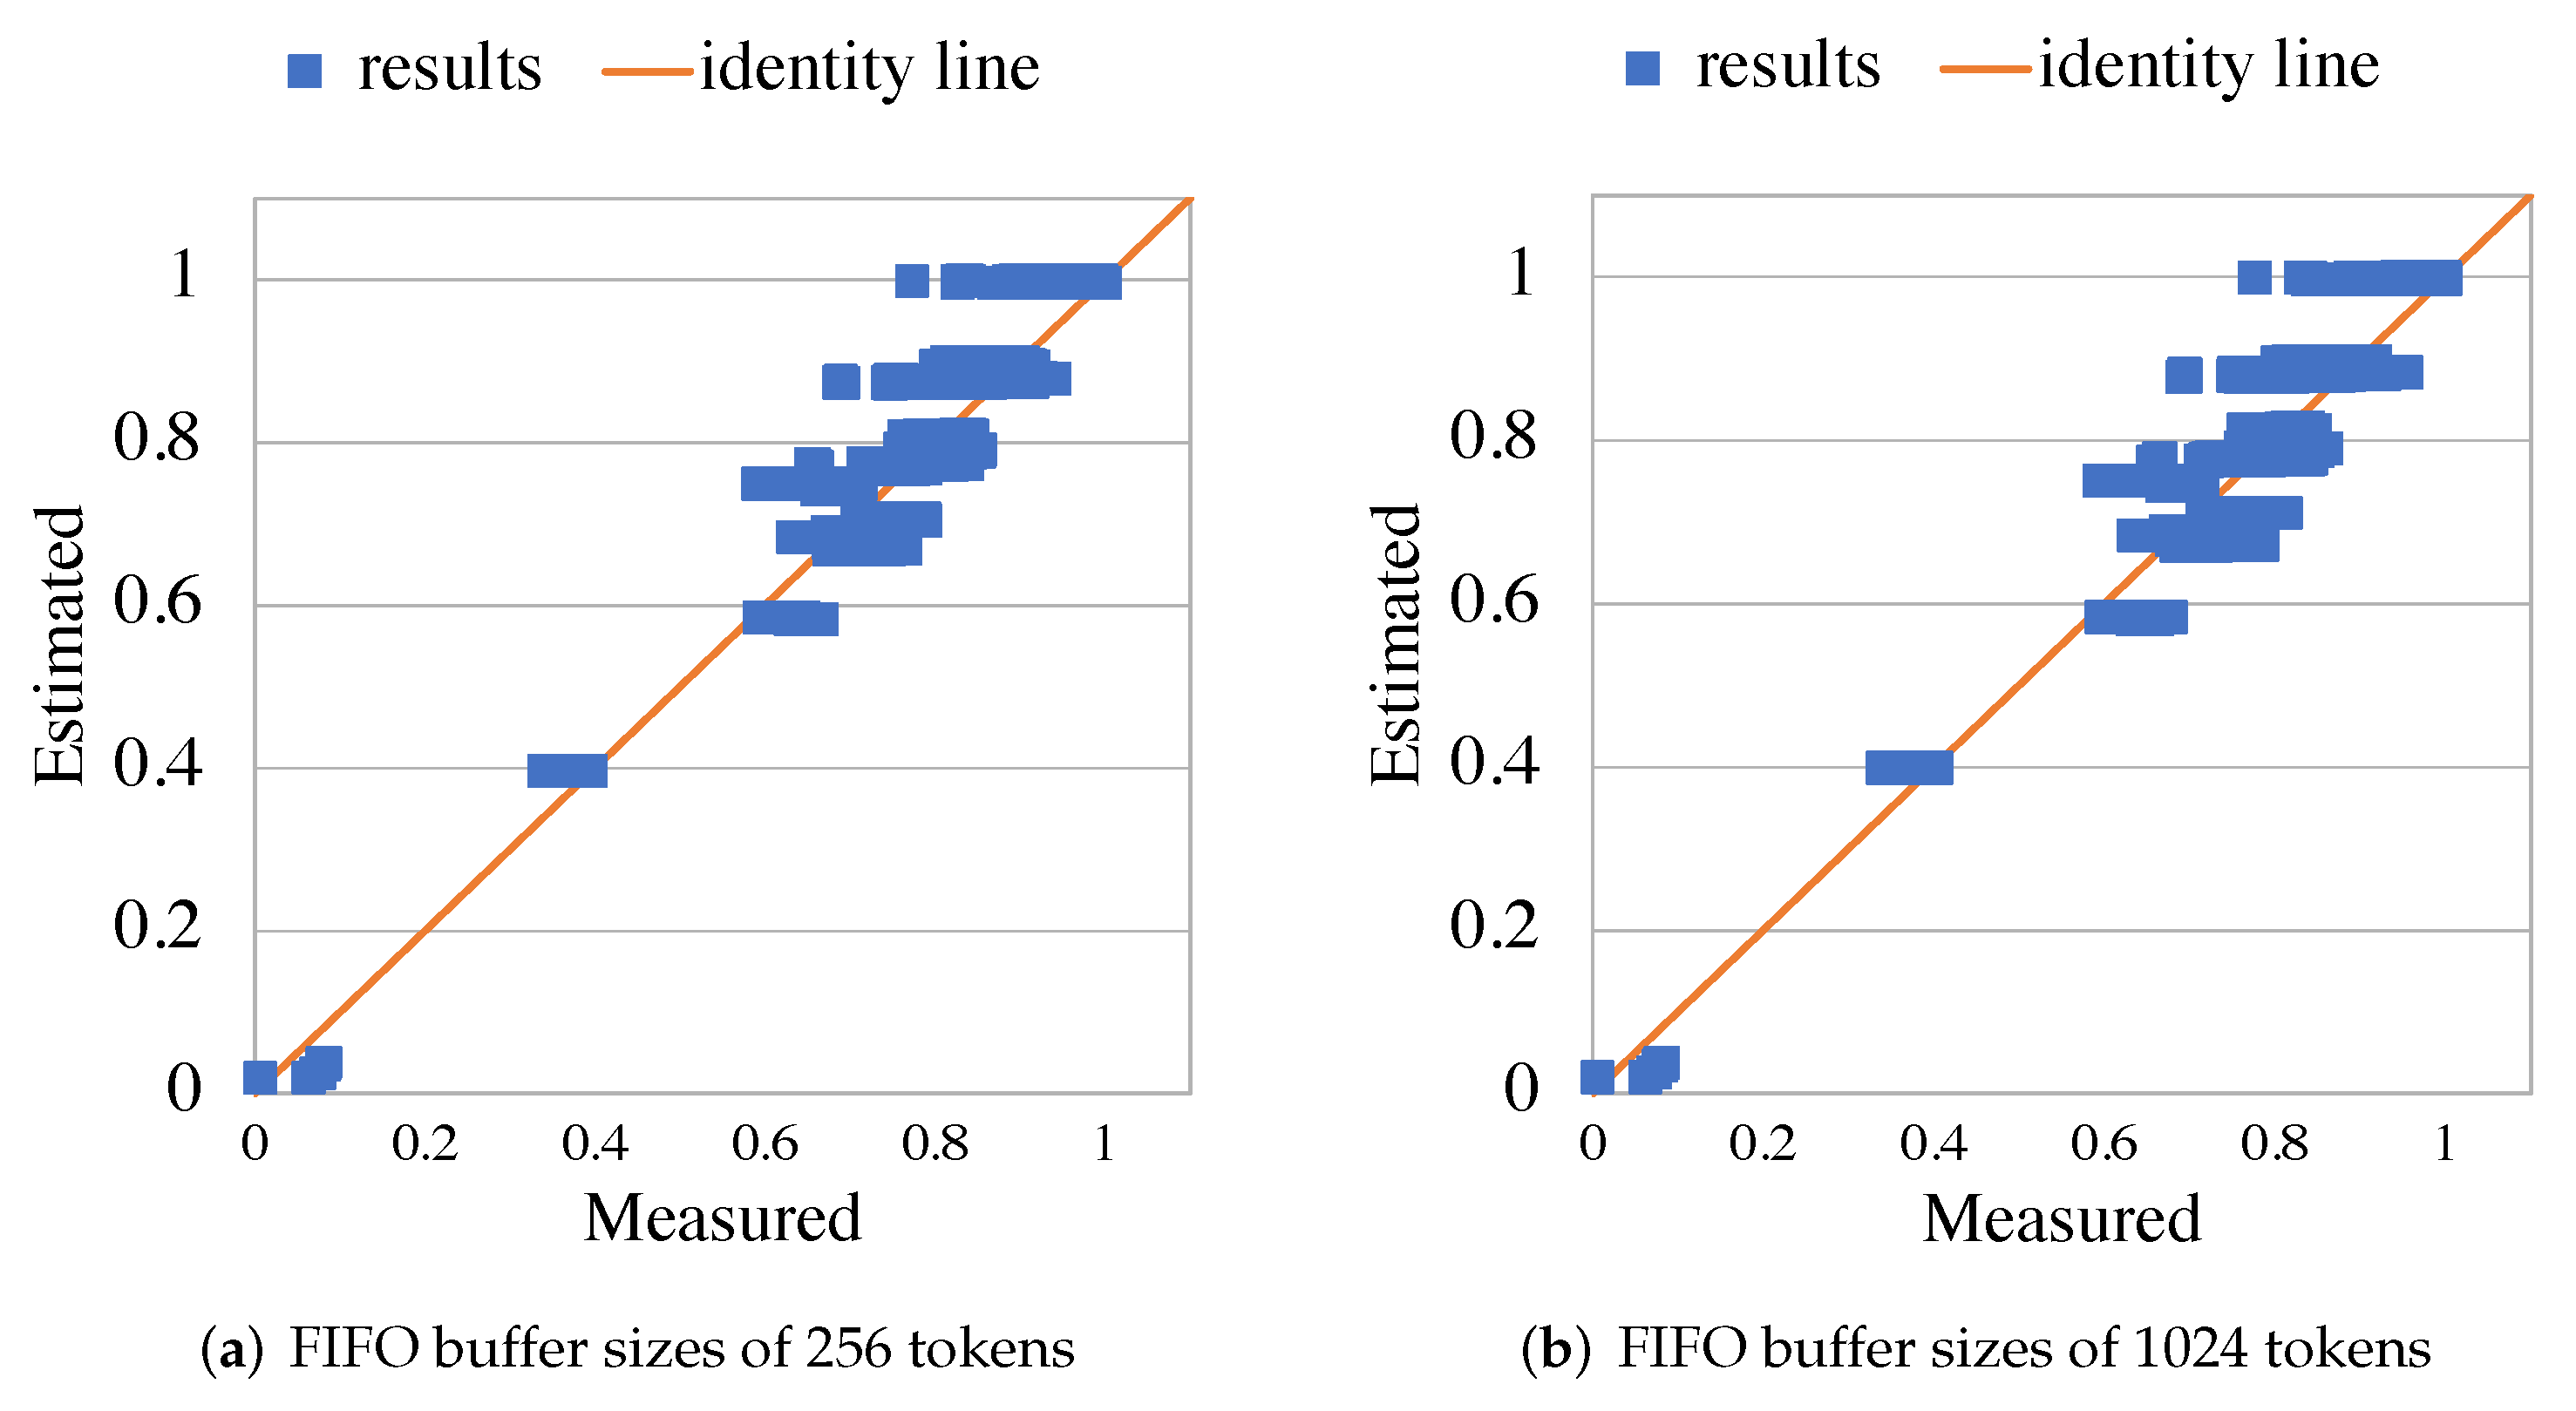
5.3. RVC-CAL Smith-Waterman Aligner

Figure 13 is a graphical representation of the network of the Smith–Waterman (S-W) aligner software application designed in [43]. The S-W aligner conducts a local alignment of two sequences, such as protein, RNA, and DNA sequences. The initial sequence A = { a 1 , a 2 , , a n } is typically considered the reference, and the second B = { b 1 , b 2 , , b m } , the query (or read). The S-W is organized into two processing steps: a first stage, where a cost matrix is computed, and a second stage where this matrix is backtracked, starting from the highest matrix value. The backtrack path computes the alignment (in terms of matches, mismatches, insertions, and deletions) between the query and the reference input sequences. The RVC-CAL implementation utilized in the settings for this study was formed with eleven connected actors. The principal elements were the four PE actors that were the main components responsible for computing the matrix scores and the Aligner actor that was in charge of computing the backtracking path on the matrix. Excluding the Source element that was responsible for managing entry file readings and had to be run on the CPU, all other actors could be mapped similarly to the GPU or CPU partitions.
Similar to the JPEG decoder software program, two sets of experiments were conducted. The first set of experiments focused on a configuration with one partition, but a variety of input sets and FIFO buffer sizes. Each input set was named l m _ l n , with l m being the length of the query (read), and l n , the length of the reference sequences. In this experiment, all sequences were generated from human DNA data. The design for reference was formed with the Source actor in a unique sequential partition assigned to the CPU side and the other actors assigned to the highly parallel GPU side. A similar method was then used to create the results presented in Figure 14, where four different inputs (150_250, 150_200, 100_250, and 100_200) and two buffer sizes (1024 and 256 tokens) were utilized. The measures were normalized to the first input, and the maximal divergence of estimation was approximately 15.6 % . This revealed that regardless of the sizes of the FIFO buffers or inputs used, the estimation of the performance could be calculated with sufficient accuracy.
In second set of results, a similar method was applied, as shown in Figure 15, and the emphasis was on exhaustive testing of all 1024 possible mapping configurations per buffer size. The partitions corresponded to an arbitrary selection for each actor to either map them to the highly parallel GPU side or the CPU sequential side. The measures were normalized (between [ 0 , 1 ] ), and the maximal divergence of estimation was approximately 22.7 % . The mappings for which the estimated results were not as precise were the partitions with the slowest runtime (top-right), and these would not be desirable to select in the design exploration process. This was due to the number of FIFO buffers at the boundary across GPU and CPU being higher, as compared to the other mapping configurations as had been reported in the investigation of the JPEG decoder. Nevertheless, the results showed that the performance deterioration and improvement tendencies could be clearly recognized by utilizing the estimated runtime according to the computed estimation with the TURNUS framework.

6. Conclusions and Future Work

The presented work described a method to estimate the time for a dataflow application program to run using the RVC-CAL software program and a heterogeneous GPU/CPU hardware system for the execution. Our study demonstrated that the precision of the estimated runtime, regardless of the configuration (i.e., buffer sizing, mapping, and partitioning), remained efficient for searching the possible space of design. Utilizing the appropriate operational research heuristics, this estimated runtime allowed for computer-assisted and automatic exploration of the design space of heterogeneous GPU/CPU software programs. The method was developed by advancing prior research that had been conducted by this team previously. This included the implementation, for the Exelixi CUDA backend of the synthesis of the CUDA software with injected instrumented code that measured and output the profiling metrics as well as enhanced the capabilities of the TURNUS execution simulator for the computation of the required estimates for the overall runtime. Two software applications and a combination of different settings were used to test and validate the precision and significance of the performance estimation.
As a possible evolution of the methodology presented in this article, one option would be to incorporate multi-platform information in the TURNUS simulator and improve the heuristic algorithms that we implemented so as to better exploit the exploration capabilities of the design space that the framework and execution models, on which it was based, are capable of providing. Such advancements would allow the investigation of the multidimensional design space and identify ideal design points in terms of high-performance GPU/CPU FIFO buffer sizing, partitioning, and mapping configurations. Furthermore, to decrease the discrepancies that could appear between estimated and actual performances for certain mapping configurations, an improved modeling and implementation of the potential congestion occurring in the FIFO buffers connecting actors at the boundary separating GPU and CPU could be necessary. Such refinement may result in further improving the accuracy of the estimated performance results.

Author Contributions

Conceptualization, A.B.; methodology, A.B.; software, A.B.; validation, A.B., S.C.-B. and M.M.; investigation, A.B.; writing—original draft preparation, A.B.; writing—review and editing, A.B., S.C.-B. and M.M.; supervision, M.M. All authors have read and agreed to the published version of the manuscript.

Funding

This research received no external funding.

Institutional Review Board Statement

Not applicable.

Informed Consent Statement

Not applicable.

Data Availability Statement

Not applicable.

Conflicts of Interest

The authors declare no conflict of interest.

References

  1. Microsoft ARM. Available online: https://www.microsoft.com/en-us/surface/business/surface-pro-x/processor (accessed on 9 March 2022).
  2. NVIDIA Grace. Available online: https://nvidianews.nvidia.com/news/nvidia-introduces-grace-cpu-superchip (accessed on 9 March 2022).
  3. Apple M1. Available online: https://www.apple.com/newsroom/2020/11/apple-unleashes-m1 (accessed on 9 March 2022).
  4. Michalska, M.; Casale-Brunet, S.; Bezati, E.; Mattavelli, M. High-precision performance estimation for the design space exploration of dynamic dataflow programs. IEEE Trans. Multi-Scale Comput. Syst. 2017, 4, 127–140. [Google Scholar] [CrossRef]
  5. Goens, A.; Khasanov, R.; Castrillon, J.; Hähnel, M.; Smejkal, T.; Härtig, H. Tetris: A multi-application run-time system for predictable execution of static mappings. In Proceedings of the 20th International Workshop on Software and Compilers for Embedded Systems, Sankt Goar, Germany, 12–14 June 2017; pp. 11–20. [Google Scholar]
  6. TURNUS Source Code Repositoy. Available online: http://github.com/turnus (accessed on 9 March 2022).
  7. Casale-Brunet, S. Analysis and Optimization of Dynamic Dataflow Programs. Ph.D. Thesis, EPFL STI, Lausanne, Switzerland, 2015. [Google Scholar] [CrossRef]
  8. Bloch, A.; Bezati, E.; Mattavelli, M. Programming Heterogeneous CPU-GPU Systems by High-Level Dataflow Synthesis. In Proceedings of the 2020 IEEE Workshop on Signal Processing Systems (SiPS), Coimbra, Portugal, 20–22 October 2020; pp. 1–6. [Google Scholar]
  9. CAL Exelixi Backends Source Code Repositoy. Available online: https://bitbucket.org/exelixi/exelixi-backends (accessed on 9 March 2022).
  10. Bezati, E.; Casale-Brunet, S.; Mosqueron, R.; Mattavelli, M. An Heterogeneous Compiler of Dataflow Programs for Zynq Platforms. In Proceedings of the ICASSP 2019—2019 IEEE International Conference on Acoustics, Speech and Signal Processing (ICASSP), Brighton, UK, 12–17 May 2019; pp. 1537–1541. [Google Scholar] [CrossRef]
  11. NVIDIA CUDA Compute Unified Device Architecture. Available online: https://docs.nvidia.com/cuda/cuda-c-programming-guide/index.html (accessed on 9 March 2022).
  12. Brunet, S.C.; Bezati, E.; Bloch, A.; Mattavelli, M. Profiling of dynamic dataflow programs on MPSoC multi-core architectures. In Proceedings of the 2017 51st Asilomar Conference on Signals, Systems, and Computers, Pacific Grove, CA, USA, 29 October–1 November 2017; pp. 504–508. [Google Scholar]
  13. NVIDIA Visual Profiler. Available online: https://developer.nvidia.com/nvidia-visual-profiler (accessed on 9 March 2022).
  14. Stephenson, M.; Hari, S.K.S.; Lee, Y.; Ebrahimi, E.; Johnson, D.R.; Nellans, D.; O’Connor, M.; Keckler, S.W. Flexible software profiling of GPU architectures. In Proceedings of the 2015 ACM/IEEE 42nd Annual International Symposium on Computer Architecture (ISCA), Portland, OR, USA, 13–17 June 2015; pp. 185–197. [Google Scholar]
  15. Matz, A.; Fröning, H. Quantifying the NUMA behavior of partitioned GPGPU applications. In Proceedings of the 12th Workshop on General Purpose Processing Using GPUs, Providence, RI, USA, 13 April 2019; pp. 53–62. [Google Scholar]
  16. Shen, D.; Song, S.L.; Li, A.; Liu, X. Cudaadvisor: LLVM-based runtime profiling for modern GPUs. In Proceedings of the 2018 International Symposium on Code Generation and Optimization, Vienna, Austria, 24–28 February 2018; pp. 214–227. [Google Scholar]
  17. Villa, O.; Stephenson, M.; Nellans, D.; Keckler, S.W. NVBit: A Dynamic Binary Instrumentation Framework for NVIDIA GPUs. In Proceedings of the 52nd Annual IEEE/ACM International Symposium on Microarchitecture, Columbus, OH, USA, 12–16 October 2019; pp. 372–383. [Google Scholar]
  18. Braun, L.; Fröning, H. CUDA flux: A lightweight instruction profiler for CUDA applications. In Proceedings of the 2019 IEEE/ACM Performance Modeling, Benchmarking and Simulation of High Performance Computer Systems (PMBS), Denver, CO, USA, 18 November 2019; pp. 73–81. [Google Scholar]
  19. Pimentel, A.D.; Erbas, C.; Polstra, S. A systematic approach to exploring embedded system architectures at multiple abstraction levels. IEEE Trans. Comput. 2006, 55, 99–112. [Google Scholar] [CrossRef]
  20. van Stralen, P.; Pimentel, A.D. Signature-based microprocessor power modeling for rapid system-level design space exploration. In Proceedings of the 2007 IEEE/ACM/IFIP Workshop on Embedded Systems for Real-Time Multimedia, Salzburg, Austria, 4–5 October 2007; pp. 33–38. [Google Scholar]
  21. Keinert, J.; Streubūhr, M.; Schlichter, T.; Falk, J.; Gladigau, J.; Haubelt, C.; Teich, J.; Meredith, M. SystemCoDesigner—An automatic ESL synthesis approach by design space exploration and behavioral synthesis for streaming applications. ACM Trans. Des. Autom. Electron. Syst. (TODAES) 2009, 14, 1–23. [Google Scholar] [CrossRef]
  22. Eusse, J.F.; Williams, C.; Leupers, R. Coex: A novel profiling-based algorithm/architecture co-exploration for asip design. ACM Trans. Reconfigurable Technol. Syst. (TRETS) 2015, 8, 1–16. [Google Scholar] [CrossRef]
  23. Chakraborty, S.; Künzli, S.; Thiele, L.; Herkersdorf, A.; Sagmeister, P. Performance evaluation of network processor architectures: Combining simulation with analytical estimation. Comput. Netw. 2003, 41, 641–665. [Google Scholar] [CrossRef]
  24. Ceng, J.; Castrillón, J.; Sheng, W.; Scharwächter, H.; Leupers, R.; Ascheid, G.; Meyr, H.; Isshiki, T.; Kunieda, H. MAPS: An integrated framework for MPSoC application parallelization. In Proceedings of the 45th annual Design Automation Conference, Anaheim, CA, USA, 8–13 June 2008; pp. 754–759. [Google Scholar]
  25. Lee, E.; Parks, T. Dataflow Process Networks. Proc. IEEE 1995, 83, 773–801. [Google Scholar] [CrossRef] [Green Version]
  26. Johnston, W.; Hanna, J.; Millar, R. Advances in dataflow programming languages. ACM Comput. Surv. (CSUR) 2004, 36, 1–34. [Google Scholar] [CrossRef]
  27. Feo, J.T.; Cann, D.C.; Oldehoeft, R.R. A report on the Sisal language project. J. Parallel Distrib. Comput. 1990, 10, 349–366. [Google Scholar] [CrossRef]
  28. Eker, J.; Janneck, J.; Lee, E.; Liu, J.; Liu, X.; Ludvig, J.; Neuendorffer, S.; Sachs, S.; Xiong, Y. Taming heterogeneity—The Ptolemy approach. Proc. IEEE 2003, 91, 127–144. [Google Scholar] [CrossRef] [Green Version]
  29. ISO/IEC 23001-4:2011. Available online: https://www.iso.org/standard/59979.html (accessed on 9 March 2022).
  30. Yviquel, H.; Lorence, A.; Jerbi, K.; Cocherel, G.; Sanchez, A.; Raulet, M. Orcc: Multimedia Development Made Easy. In Proceedings of the 21st ACM International Conference on Multimedia, MM’13, Barcelona, Spain, 21–25 October 2013; pp. 863–866. [Google Scholar]
  31. Orcc Source Code Repositoy. Available online: http://github.com/orcc/orcc (accessed on 9 March 2022).
  32. Siyoum, F.; Geilen, M.; Eker, J.; von Platen, C.; Corporaal, H. Automated extraction of scenario sequences from disciplined dataflow networks. In Proceedings of the 2013 Eleventh ACM/IEEE International Conference on Formal Methods and Models for Codesign (MEMOCODE 2013), Portland, OR, USA, 18–20 October 2013; pp. 47–56. [Google Scholar]
  33. Caltoopia. Available online: https://github.com/Caltoopia (accessed on 9 March 2022).
  34. Cedersjö, G.; Janneck, J.W. Tÿcho: A framework for compiling stream programs. ACM Trans. Embed. Comput. Syst. (TECS) 2019, 18, 1–25. [Google Scholar] [CrossRef]
  35. Gebrewahid, E. Tools to Compile Dataflow Programs for Manycores. Ph.D. Thesis, Halmstad University Press, Halmstad, Sweden, 2017. [Google Scholar]
  36. Savas, S.; Ul-Abdin, Z.; Nordström, T. A framework to generate domain-specific manycore architectures from dataflow programs. Microprocess. Microsyst. 2020, 72, 102908. [Google Scholar] [CrossRef]
  37. Boutellier, J.; Ghazi, A. Multicore execution of dynamic dataflow programs on the Distributed Application Layer. In Proceedings of the 2015 IEEE Global Conference on Signal and Information Processing (GlobalSIP), Orlando, FL, USA, 14–16 December 2015; pp. 893–897. [Google Scholar]
  38. Bezati, E.; Emami, M.; Janneck, J.; Larus, J. StreamBlocks: A compiler for heterogeneous dataflow computing (technical report). arXiv 2021, arXiv:2107.09333. [Google Scholar]
  39. Michalska, M.; Casale-Brunet, S.; Bezati, E.; Mattavelli, M. High-precision performance estimation of dynamic dataflow programs. In Proceedings of the 2016 IEEE 10th International Symposium on Embedded Multicore/Many-core Systems-on-Chip (MCSOC), Lyon, France, 21–23 September 2016; pp. 101–108. [Google Scholar]
  40. Bloch, A.; Brunet, S.C.; Mattavelli, M. SIMD Parallel Execution on GPU from High-Level Dataflow Synthesis. In Proceedings of the 2021 IEEE 14th International Symposium on Embedded Multicore/Many-core Systems-on-Chip (MCSoC), Singapore, 20–23 December 2021; pp. 62–68. [Google Scholar]
  41. Orcc-Apps Source Code Repositoy. Available online: https://github.com/orcc/orc-apps (accessed on 9 March 2022).
  42. Bezati, E.; Yviquel, H.; Raulet, M.; Mattavelli, M. A unified hardware/software co-synthesis solution for signal processing systems. In Proceedings of the 2011 Conference on Design & Architectures for Signal & Image Processing (DASIP), Tampere, Finland, 2–4 November 2011; pp. 1–6. [Google Scholar]
  43. Casale-Brunet, S.; Bezati, E.; Mattavelli, M. High level synthesis of Smith-Waterman dataflow implementations. In Proceedings of the 2017 IEEE International Conference on Acoustics, Speech and Signal Processing (ICASSP), New Orleans, LA, USA, 5–9 March 2017; pp. 1173–1177. [Google Scholar]
Figure 1. RVC-CAL program example: dataflow network topology and actors source code.
Jlpea 12 00036 g001
Figure 2. Design space exploration and implementation design flow. Deep blue elements represent the code-synthesized path of the tool, while light blue, the profiling and design space exploration path of the tool.
Jlpea 12 00036 g002
Figure 3. ETG post-processor model.
Jlpea 12 00036 g003
Figure 4. A simplified example of the utilization of Nvidia’s assembly language (i.e., SASS) was required for reading the GPU’s stable autoincrementing register.
Jlpea 12 00036 g004
Figure 5. Action profiling.
Jlpea 12 00036 g005
Figure 6. Illustration of the four static configurations required during profiling.
Jlpea 12 00036 g006
Figure 7. A simplified example of the utilization of Nvidia’s assembly language (i.e., SASS) was required for reading the GPU’s stable autoincrementing register in parallel mode.
Jlpea 12 00036 g007
Figure 8. A comparison between the dynamic network and the original static network.
Jlpea 12 00036 g008
Figure 9. Design flow with dynamic networks. Deep blue elements represent the implementation path of the tool, while light blue, the profiling and design space exploration path of the tool.
Jlpea 12 00036 g009
Figure 10. Graphical representation for the JPEG decoder application in RVC-CAL.
Jlpea 12 00036 g010
Figure 11. Normalized comparison between the estimated and measured total runtime of the JPEG application with height inputs and two FIFO buffer configurations (512 and 1024 tokens). The identity line in orange corresponds to the 1:1 line for visual reference.
Jlpea 12 00036 g011
Figure 12. Normalized comparison between the estimated and measured total runtime of the JPEG application with all 16 possible partitions and two FIFO buffer configurations (512 and 1024 tokens). The identity line in orange corresponds to the 1:1 line for visual reference.
Jlpea 12 00036 g012
Figure 13. Graphical representation for the Smith-Waterman aligner application in RVC-CAL.
Jlpea 12 00036 g013
Figure 14. Normalized comparison between the estimated and measured total runtime of the Smith–Waterman aligner application with four inputs and two FIFO buffer configurations (256 and 1024 tokens). The identity line in orange corresponds to the 1:1 line for visual reference.
Jlpea 12 00036 g014
Figure 15. Normalized comparison between the estimated and measured total runtime of the Smith–Waterman aligner application with all 1024 possible partitions and two FIFO buffer configurations (256 and 1024 tokens). The identity line in orange corresponds to the 1:1 line for visual reference.
Jlpea 12 00036 g015
Table 1. The different resolutions and quality factors of the input images used for the JPEG Decoder results.
Resolution4096 × 22402048 × 15364096 × 22402048 × 1536
QF90905050
Resolution1920 × 10801280 × 720640 × 480512 × 512
QF55658075
Publisher’s Note: MDPI stays neutral with regard to jurisdictional claims in published maps and institutional affiliations.

