Article

A Network Simulator for the Estimation of Bandwidth Load and Latency Created by Heterogeneous Spiking Neural Networks on Neuromorphic Computing Communication Networks †

1
Central Institute of Engineering, Electronics and Analytics—Electronic Systems (ZEA-2), Forschungszentrum Jülich GmbH, 52428 Jülich, Germany
2
Faculty of Engineering, Communication Systems, University of Duisburg-Essen, 47057 Duisburg, Germany
*
Author to whom correspondence should be addressed.
This paper is an extended version of our paper published in MCSoC-2021, Kleijnen, R.; Robens, M.; Schiek, M.; van Waasen, S. A Network Simulator for the Estimation of Bandwidth Load and Latency Created by Heterogeneous Spiking Neural Networks on Neuromorphic Computing Communication Networks. In Proceedings of the 2021 IEEE 14th International Symposium on Embedded Multicore/Many-Core Systems-on-Chip (MCSoC), Singapore, 20–23 December 2021; pp. 320–327. https://doi.org/10.1109/MCSoC51149.2021.00054.
J. Low Power Electron. Appl. 2022, 12(2), 23; https://doi.org/10.3390/jlpea12020023
Submission received: 1 February 2022 / Revised: 25 February 2022 / Accepted: 3 March 2022 / Published: 21 April 2022

Abstract

:
Accelerated simulations of biological neural networks are in demand to discover the principals of biological learning. Novel many-core simulation platforms, e.g., SpiNNaker, BrainScaleS and Neurogrid, allow one to study neuron behavior in the brain at an accelerated rate, with a high level of detail. However, they do not come anywhere near simulating the human brain. The massive amount of spike communication has turned out to be a bottleneck. We specifically developed a network simulator to analyze in high detail the network loads and latencies caused by different network topologies and communication protocols in neuromorphic computing communication networks. This simulator allows simulating the impacts of heterogeneous neural networks and evaluating neuron mapping algorithms, which is a unique feature among state-of-the-art network models and simulators. The simulator was cross-checked by comparing the results of a homogeneous neural network-based run with corresponding bandwidth load results from comparable works. Additionally, the increased level of detail achieved by the new simulator is presented. Then, we show the impact heterogeneous connectivity can have on the network load, first for a small-scale test case, and later for a large-scale test case, and how different neuron mapping algorithms can influence this effect. Finally, we look at the latency estimations performed by the simulator for different mapping algorithms, and the impact of the node size.

1. Introduction

Recently, great improvements in the performance of neural network (NN) implementations have been achieved in systems such as TrueNorth [1], which is intended for cognitive computing applications with very low area and power requirements, and in the field of biological neural network (BNN) simulation, such as the SpiNNaker system [2], BrainScaleS [3] and Neurogrid [4]. The later aims to allow better insights into biological learning principles—in what is known as computational neuroscience. Both approaches rely on distributed computing with decentralized memory. These many-core systems realize the very high communication demands between the cores with an overlaying interconnected communication network. The number of neurons and their connectivity level in a cognitive computing system provide far more complexity than the fan-out in traditional computer architectures, but the complexity is still orders of magnitude less than that in the human brain. In the field of computational neuroscience, the number of neurons and their connectivity need to reach biological levels, which for the human brain means approximately 10 11 neurons with around 10,000 synapses, i.e., connections, per neuron. For meaningful research on the principles of biological computing, a significant acceleration in simulations compared to biological real-time is needed [5]. In contrast to cognitive computing systems, power consumption and implementation size are mainly limited by physical constraints—i.e., the power density needs to remain manageable. For this, the inclusion of new power-efficient technologies may need to be considered. Each of the platforms recently developed for computational neuroscience (see above) has different strengths, but none of them meets the requirements concerning size, connectivity and acceleration factor of the Advanced Computing Architectures (ACA) project [6] this work is part of.
The simulation platform to be developed within the ACA project shall enable the simulation of large-scale, natural-density connected BNNs with an acceleration factor of 100. The acceleration, combined with a desired simulation time step of 0.1 ms, would result in a time constraint of 1 μ s of wall clock time per time step. Both the calculations performed in the nodes to mimic neuron behavior and the transmission of generated spikes have to be performed during this time. Assuming an even allocation of time for both tasks leaves a maximum of 500 ns to send all generated spikes to their destinations. This challenge requires a new communication network, as the communication requirements differ substantially from those of traditional computer communication networks. In particular, a large amount of very small information packets need to be sent with minimum latency, in contrast to the fewer large data streams typically for traditional computer networks. This cannot be realized by making use of recent technological advancements in communication components alone, and thus a reconsideration of the network concept itself has to be enabled.
This paper focuses on a Python-based network simulator allowing for the analysis of both the communication bandwidth and the latency between processing elements in a neurmorphic computing (NC) system according to the requirements outlined above. Section 2 presents a brief introduction to NC systems. The network simulator is described in Section 3. In Section 4 the simulation results are outlined. Section 4.1 focuses on the analysis of the homogeneous connectivity model and compares the results with the current state of the art. Section 4.2 discusses the impact of heterogeneous NNs and the mapping of these NNs. Finally, in Section 5 the summary and outlook for possible future works are presented. As this contribution is an extension of our paper [7] previously submitted to the International Symposium of Embedded Multicore/Many-core Systems on Chip (MCSoC-2021), the Introduction and Section 2, Section 3 and Section 4.1 are similar to those of the original. The original paper mainly focuses on the simulator’s implementation, along with a brief verification and proof of concept study, i.e., showing the need for a simulator that is able to handle heterogeneous connectivity models. For this contribution, the focus was extended from the simulator’s implementation and verification to the analysis of a biologically representative large-scale, heterogeneous NN, the multi-area model [8], in Section 4.2.

2. Background and Motivation

2.1. Neuromorphic Computing Systems

Although most existing large-scale NC systems [1,2,3,4,5,9,10] follow the same concept, there are fundamentally differences concerning techniques and designs to achieve their respective goals. In order to better recognize the general problems which arise during the development of such systems, one needs to consider the general functionality of NC systems. In the following, we give a short description of this. NC systems need to include two constituent items, i.e., a vast number of relatively simple computational units (CU), and a network which connects the individual CUs (Figure 1), ensuring a high bandwidth and low latency communication.

2.1.1. Neural and Synaptic Modeling by the CUs

A brain is organized as a massively parallelized system with neurons and synapses as the elemental units. In order to get at least close to this level of parallelism, a simulation of these units is carried out within a large number of CUs, with each CU being responsible for a group of neurons and the corresponding synapses according to a predefined connectivity model. The neuron spike is initiated by the neuron membrane potential surpassing a certain threshold. A small spike-related data packet is generated and either retained within the CU or transmitted to one or more other CUs, as determined by the connectivity model. After the distribution of the spike packet within and between the CUs, first the states of the synapses and secondly the states of the neurons are updated according to their behavioral model.

2.1.2. Interconnect Design and Spike Communication

The communication between neurons in a biological brain is facilitated by axons and dendrites, linked by synapses. This hardwired connectivity between the neurons is very dense, as it utilizes all three spatial dimensions. Additionally, structural plasticity, i.e., realizing new and removing existing connections, is observed in biological neural networks. Both the biological density and structural plasticity are not possible to realize in current VLSI (very-large-scale integration) technologies. On the other hand, technical electrical signals’ transfer speeds are multiple orders of magnitude higher than in the brain. Existing NC systems make use of this by time division multiplexing of signals from different neurons on shared connections. By means of modern routing concepts, the CUs are connected to a network of shared connections and an address event representation (AER) protocol is used to route the spike packets according to the connectivity definition. Due to the temporal relation-based information coding in biology, spike packets next to the timing information only include the AER-address to route the packet. To ensure deterministic behavior of the NC-system, the communication network needs to be able to handle a very large number of small spike packets within a given time frame, requiring low latency, without dropping any packet. In contrast to this, other high-bandwidth networks often have to process large streams of data, whereas latency is less important.

2.2. Motivation and Comparable Work

Fulfilling all the requirements outlined above for designing large-scale NC systems is a complex task. The load on the network and the resulting latency are determined by the number of neurons to be simulated and the communication network topology, together with the routing and casting protocols. For this, it is necessary to perform a comprehensive analysis of the performances of different communication network topologies and communication protocols in order to ensure a well-informed design choice. Comparable studies have been conducted previously, but never at the same level of detail. In [11] a mathematical approach to calculate the bandwidth in a NC communication network is presented. This approach gives a good initial approximation of the network load, but is highly generalized, returns only average values and is limited to very basic connectivity schemes. In [12], a numerical model was used to determine the network load and latency. It offers a higher level of detail and allows more complex connectivity schemes. However, this model still assumes a level of homogeneity in the network. Every neuron has the same probability of connecting to other neurons, i.e., the same probability function is used for every neuron. This does not represent the connectivity observed in the brain, where the connectivity is much more heterogeneous. The connectivity of neurons varies in both the number of connections and the destinations. Two biological network models, often used within the ACA project, which are characterized by this heterogeneous connectivity, are described in [8,13]. The simulator introduced in this work can run such a heterogeneous NN in its analysis and show the effect this has on the network load and latency. Based on this, the simulator is also able to investigate how to efficiently map neurons to the NC system, as will be explained in more detail in Section 3.3.

3. Neuromorphic Communication Network Simulator

In this section, the Python simulator is described at a high level of abstraction. A more detailed description of the simulator can be found in the Supplementary Material.

3.1. High-Level Simulator Description

The Python simulator is designed to provide performance analyses of chosen communication infrastructures for NC systems rather than explorations of neural networks or the behavior of individual neurons. Thus, the NC system is modeled as a directional graph. The latter consists of vertices corresponding to CUs and edges corresponding to unidirectional links. Bidirectional links of the hardware system are mimicked by two antipodal unidirectional links. While analyses are restricted to the square-mesh topology in this paper, the simulator can deal with different regular meshes and hierarchical networks, or other more complex topologies. Fostered by its design, which neglects, for example, computations of membrane potentials and synaptic behavior, a variety of communication network architectures and communication protocols, such as casting and routing schemes, can be examined to substantiate a design decision of a physical implementation. Without node internal calculations, spike packets can be dropped once they reach their destinations, and only transfers from source nodes to destination nodes are considered.
Thus, there are no temporal triggers for spike production, but there is rather the assumption that every neuron spikes once. Since the total network traffic is determined by superposition of the traffic loads caused by single neurons this way, their firing rates (FR) can be considered as simple multipliers. A simulation then delivers the number of spike packets n P a c k e t s passing through each node and over each link in a given time frame T. For an example also covering the desired acceleration factor, please look at [7]. If there is approximately the same level of activity for all neurons in the NN, an average firing rate can be used. In biological NNs, however, neurons typically have different levels of activity, so this condition does not apply. For this reason, it is advantageous to set an FR multiplier for a neuron or a group of neurons separately.
Additionally, a network load based on average firing rates is not a good way to identify bottlenecks created by peak traffic loads during high levels of activity. By changing the FRs of specific neurons or neuron populations, periods of high activity can be mimicked as well, and the corresponding peak traffic loads can be estimated. Variations in the network load are also created by boundary effects of the hardware system and variations in the connectivity of the NN. These effects are discussed in more detail in Section 4.1 and Section 4.2.
Equation (1) relates the network loads determined this way to bandwidth requirements. The packet size used in this equation depends on the network size, the routing and casting scheme and the header or debug bits that are potentially added:
Bandwidth = n p a c k e t s · B i t s / p a c k e t T .
To convey a concise picture, two ways to state the bandwidth requirements should be distinguished: the bandwidth requirements of the routers, i.e., the number of packets passing through individual nodes, and the bandwidth requirements of the input and output ports, i.e., the number of packets passing over each link. In addition to these quantities, the simulator can determine the difference between the instants of time during which a packet is sent by a neuron and received by all its destinations, i.e., latency. According to its principle of operation, this latency is unitless and indicates the “number of routers passed,” also called “hops”, which is used below. By assigning values to the user defined parameters t r o u t e r and t l i n k , however, it is possible to provide real time estimates. These estimates reflect best case scenarios—with routers processing packets immediately upon arrival—since the timing of spike events is not modeled and arbitration within routers is thus neglected. Still, they are deemed appropriate at the design stage considered, because t r o u t e r and t l i n k largely depend on hardware design and technology, which are kept open. Stating results in terms of hops, as below, is equivalent to setting t r o u t e r = 1 and t l i n k = 0 .

3.2. Neural Network Generation

To derive realistic traffic loads on the hardware network, the simulator needs to be fed with exemplary NNs. Currently it supports three NN representations for this purpose:
  • Netlist-based simulation.
  • Connectivity matrix simulation.
  • Location-based connectivity simulation.

3.2.1. Netlist-Based Simulation

This mode provides the highest flexibility but has also the largest memory footprint limiting the NN size. At simulation start-up, a JSON-file is created according to a user’s specifications. For convenience, functions are provided that help create netlist files for the test cases of the ACA project, e.g., the cortical microcircuit published by Potjans and Diesmann [13]. However, any other NN type can be specified by the user with a netlist adhering to the format discussed in the Supplementary Material or in [7]. The netlist contains all information for a repeatable, deterministic simulation. Just as an example, 3.8 GB is required in this mode to store the netlist of the cortical microcircuit with its 78,071 neurons on disk, and a multiple of this is required to load the model into working memory.

3.2.2. Connectivity Matrix Simulation

In computational neuroscience, NNs are modeled by statistical connection probabilities between populations, i.e., neuron clusters of a given size, so that the level of detail provided by netlist-based simulations is not required. For larger scale NNs, such as the multi-area model [8], the simulator can dynamically create connections without the need for a detailed netlist and mitigate the high memory utilization this way. In this mode, it relies on a connectivity matrix (CM) with connection statistics that are stored in a .csv file. Each row of the file contains a population name and the population size, followed by the connection probabilities to the populations. After skipping the first two columns when counting, C X , Y specifies the probability that a neuron from population X is connected to a neuron from population Y. In general C X , Y C Y , X , which means C is not symmetric.

3.2.3. Location Based Connectivity

This approach is similar in spirit to the connectivity matrix described above, but allows the connection probability to depend on the positions of neurons within the communication network. A constant probability function will yield a uniform randomly connected NN (RNDC). Alternatively, connectivity models as described in [12], such as the radially or biologically motivated distribution, can be examined by letting the probability function depend on the distance between nodes containing source and target neurons.

3.3. Neuron Mapping

Heterogeneous NNs pose an additional challenge to the simulator, since the overall traffic generated by a neuron depends on its position in the network. The analysis of such networks is a special feature of this simulator distinguishing it from existing network models mentioned in Section 2.2. Neuron mapping, i.e., the assignment of neurons to nodes, creates proximity relations between neurons that significantly affect traffic loads on the network. Network load and latency can obviously be reduced when tightly coupled neurons are placed in close proximity—ideally on the same node. On the other hand, hardware constraints impose limits on the proximity due to the large number of neurons and high connectivity levels in large-scale heterogeneous NNs. Thus, neuron placement needs to be optimized to reduce overall traffic load and/or latency at the system level. Emphasis is placed on this aspect in Section 4.2 based on the simulation results.
Depending on the neural network generation mode chosen, some mapping algorithms are more suitable than others. Netlist-based network generation allows for the application of VLSI-inspired placement algorithms targeting at optimal locations for individual neurons. However, in addition to the memory constraints mentioned above, the complexities and run times of these mapping approaches limit the applicability of netlist-based simulations. Within heterogeneous NNs [8,13], neurons predominantly connect to neurons of the same population or cluster; therefore, it is advantageous to map whole populations at once, which is possible in the case of CM-based network generation.
At the time of writing this paper, the simulator includes population oriented mapping, a cluster algorithm, along with some VLSI inspired placement algorithms, and will possibly be extended in the future.

4. Results

The results provided in this section were used to validate the simulator against the results of an analytical approach [11] for a homogeneous connectivity model on a square-mesh topology that can be analyzed by both approaches. In addition, they are well suited to show its increased level of detail, especially for heterogeneous NNs with appropriate neuron mapping. While the impacts of several parameters will be analyzed, we do not provide an extensive analysis of network topologies, routing schemes, casting schemes and node sizes, i.e., the number of neurons per node. However, aside from the regular square mesh, the torus variant is also examined, in which nodes at opposing perimeter grid positions are directly connected. In addition, a selection of casting schemes is considered, including unicast (UC), local multicast (LMC) and multicast (MC). They differ in the number of spike packets sent by a neuron: one packet per target synapse in the case of UC, one packet per target node in the case of LMC and one packet per source neuron with duplication at branching points (intermediate nodes) in the case of MC. While network traffic was expected to be reduced from the first to the last, the opposite would apply to the required hardware resources per node. Since LMC requires duplication of packets only within a destination node to reach all the target synapses, the hardware effort was expected to be just slightly increased compared to UC, while network load—especially for clustered neurons—could be reduced. UC and LMC can use destination based addresses or even relative addresses, i.e., the number of hops in either direction needed to reach the destination. Routing in this case can be implemented as a logic operation on the target address and requires only a small number of logic gates. MC, on the other hand, requires some kind of lookup table (LUT), such as the content addressable memory (CAM) used in the SpiNNaker system [2], which requires more hardware and is generally slower. For broadcast (BC), as another common casting scheme, network load and latency can be determined accurately with the analytical model, so it was neglected. In a regular square mesh, the longest dimension first routing (LDFR) algorithm always returns the shortest path between source and destination, so that it was selected in favor of a minimized latency. For more information on this and other implemented routing algorithms, see [14]. Finally, the number of neurons per node NpN) is important for the interpretation of results. It was bounded by the two extreme cases: N p N = 1 , i.e., dedicated hardware for each neuron, and N p N = n , i.e., all neurons n located in one node. While N p N in general must be closely related to the characteristics of node internal hardware, in the latter case, only the advantage of specialized hardware would be retained with respect to a possible acceleration. A value of N p N = 100 was used throughout the simulations examining the homogeneous connectivity scheme and the cortical microcircuit model. The multi-area model simulations were performed for N p N = 100 , 250 , 500 and N p N = 1000 .

4.1. Homogeneous Connectivity Model Simulations

First, we focus on NNs with homogeneous connectivity and compare the simulated network load and latency with results from the analytical model [11]. The latter approximates the average number of spikes per link B W a v g by
B W a v g = n · N t a r g e t s · D a v g L · F R a v g ,
where F R a v g is the average firing rate of all neurons and L is the number of links in the network. F R a v g is a linear multiplier and can be set in both the simulator and the analytical model, so that we used F R a v g = 1 . The remaining variables, D a v g and N t a r g e t s , are the average distance between source and destination and the average number of targets that need to be reached, respectively. They differ among the casting types and will be related to the characteristics of the uniform RNDC NN next. This connectivity model uses a pre-defined connection probability ϵ to randomly select targets of a neuron. This results in a NN with evenly distributed neuron targets.
For UC, N t a r g e t s is equal to the average number of synapses per neuron (SpN) and can be calculated according to the previous consideration as:
N t a r g e t s , RNDC , UC = S p N = n · ϵ .
For LMC and MC, the probability that a node contains at least one target synapse needs to be calculated first. It is given by:
P ( S p N d 1 ) = 1 P ( S p N d = 0 ) = 1 ( 1 ϵ ) N p N ,
with S p N d being the number of target synapses per node. N t a r g e t s is equal to the number of nodes containing target neurons for LMC and MC. In a network with N nodes, this number can be approximated with
N t a r g e t s , RNDC , LMC = N t a r g e t s , RNDC , MC = N · ( 1 ( 1 ϵ ) N p N ) .
For UC and LMC, D a v g can be calculated from the connectivity model. Therefore, we set ϵ approximately to the average connection probability of the cortical microcircuit model (Section 4.2) for the rest of this subsection, i.e., ϵ = 0.048 . In a regular square mesh, the average distance to all targets is then determined by
D a v g , s q u a r e = 2 3 N ,
because the synapses are distributed randomly across all nodes. In the case of the torus variant, it is given by
D a v g , t o r u s = 1 2 N , if   N   is   odd . N 2 · ( N 1 ) N , if   N   is   even .
For MC, D a v g needs to be calculated as the distance from the closest branch node (or source) to the destination. Thus, it is harder to be calculated and can often only be roughly approximated. With ϵ = 0.048 , almost every node in the network will contain a target synapse and will act as branch node, since N t a r g e t s approaches N. This results in a value for D a v g slightly larger than one, so that D a v g , M C 1 is used as the lower limit. B W a v g , M C can be determined more accurately by other tools, such as the one presented in [12], yet not in heterogeneous networks.
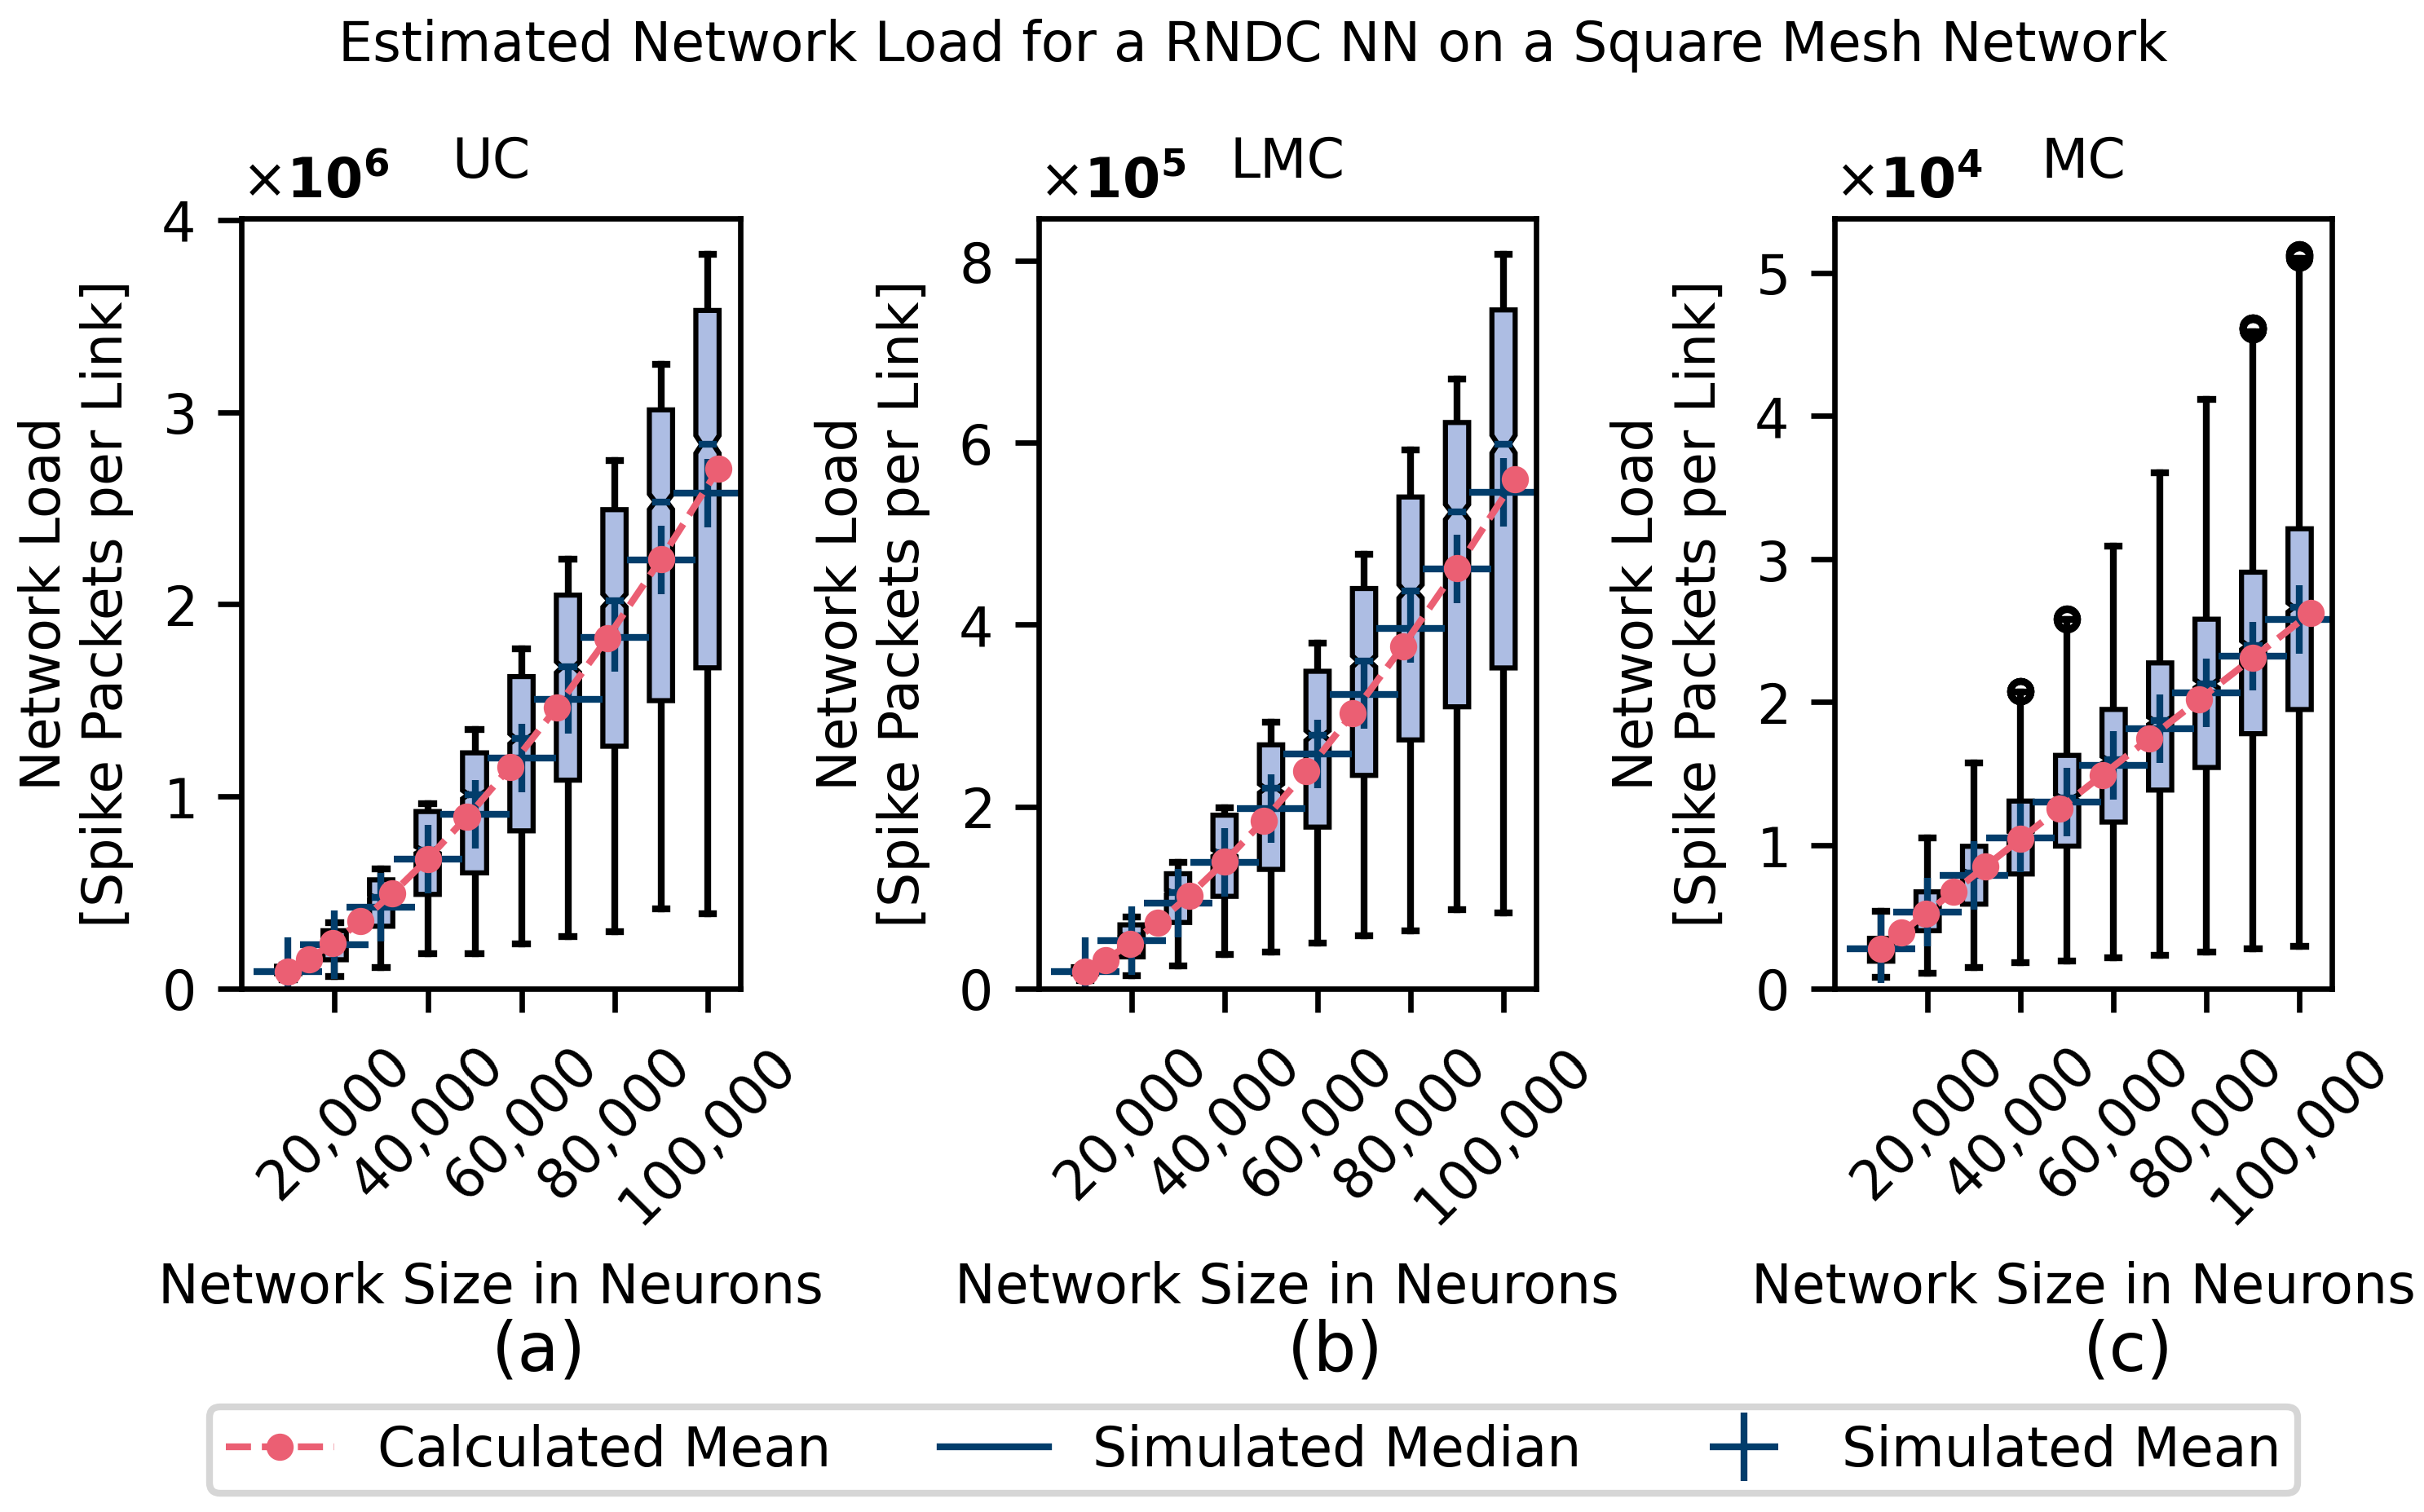
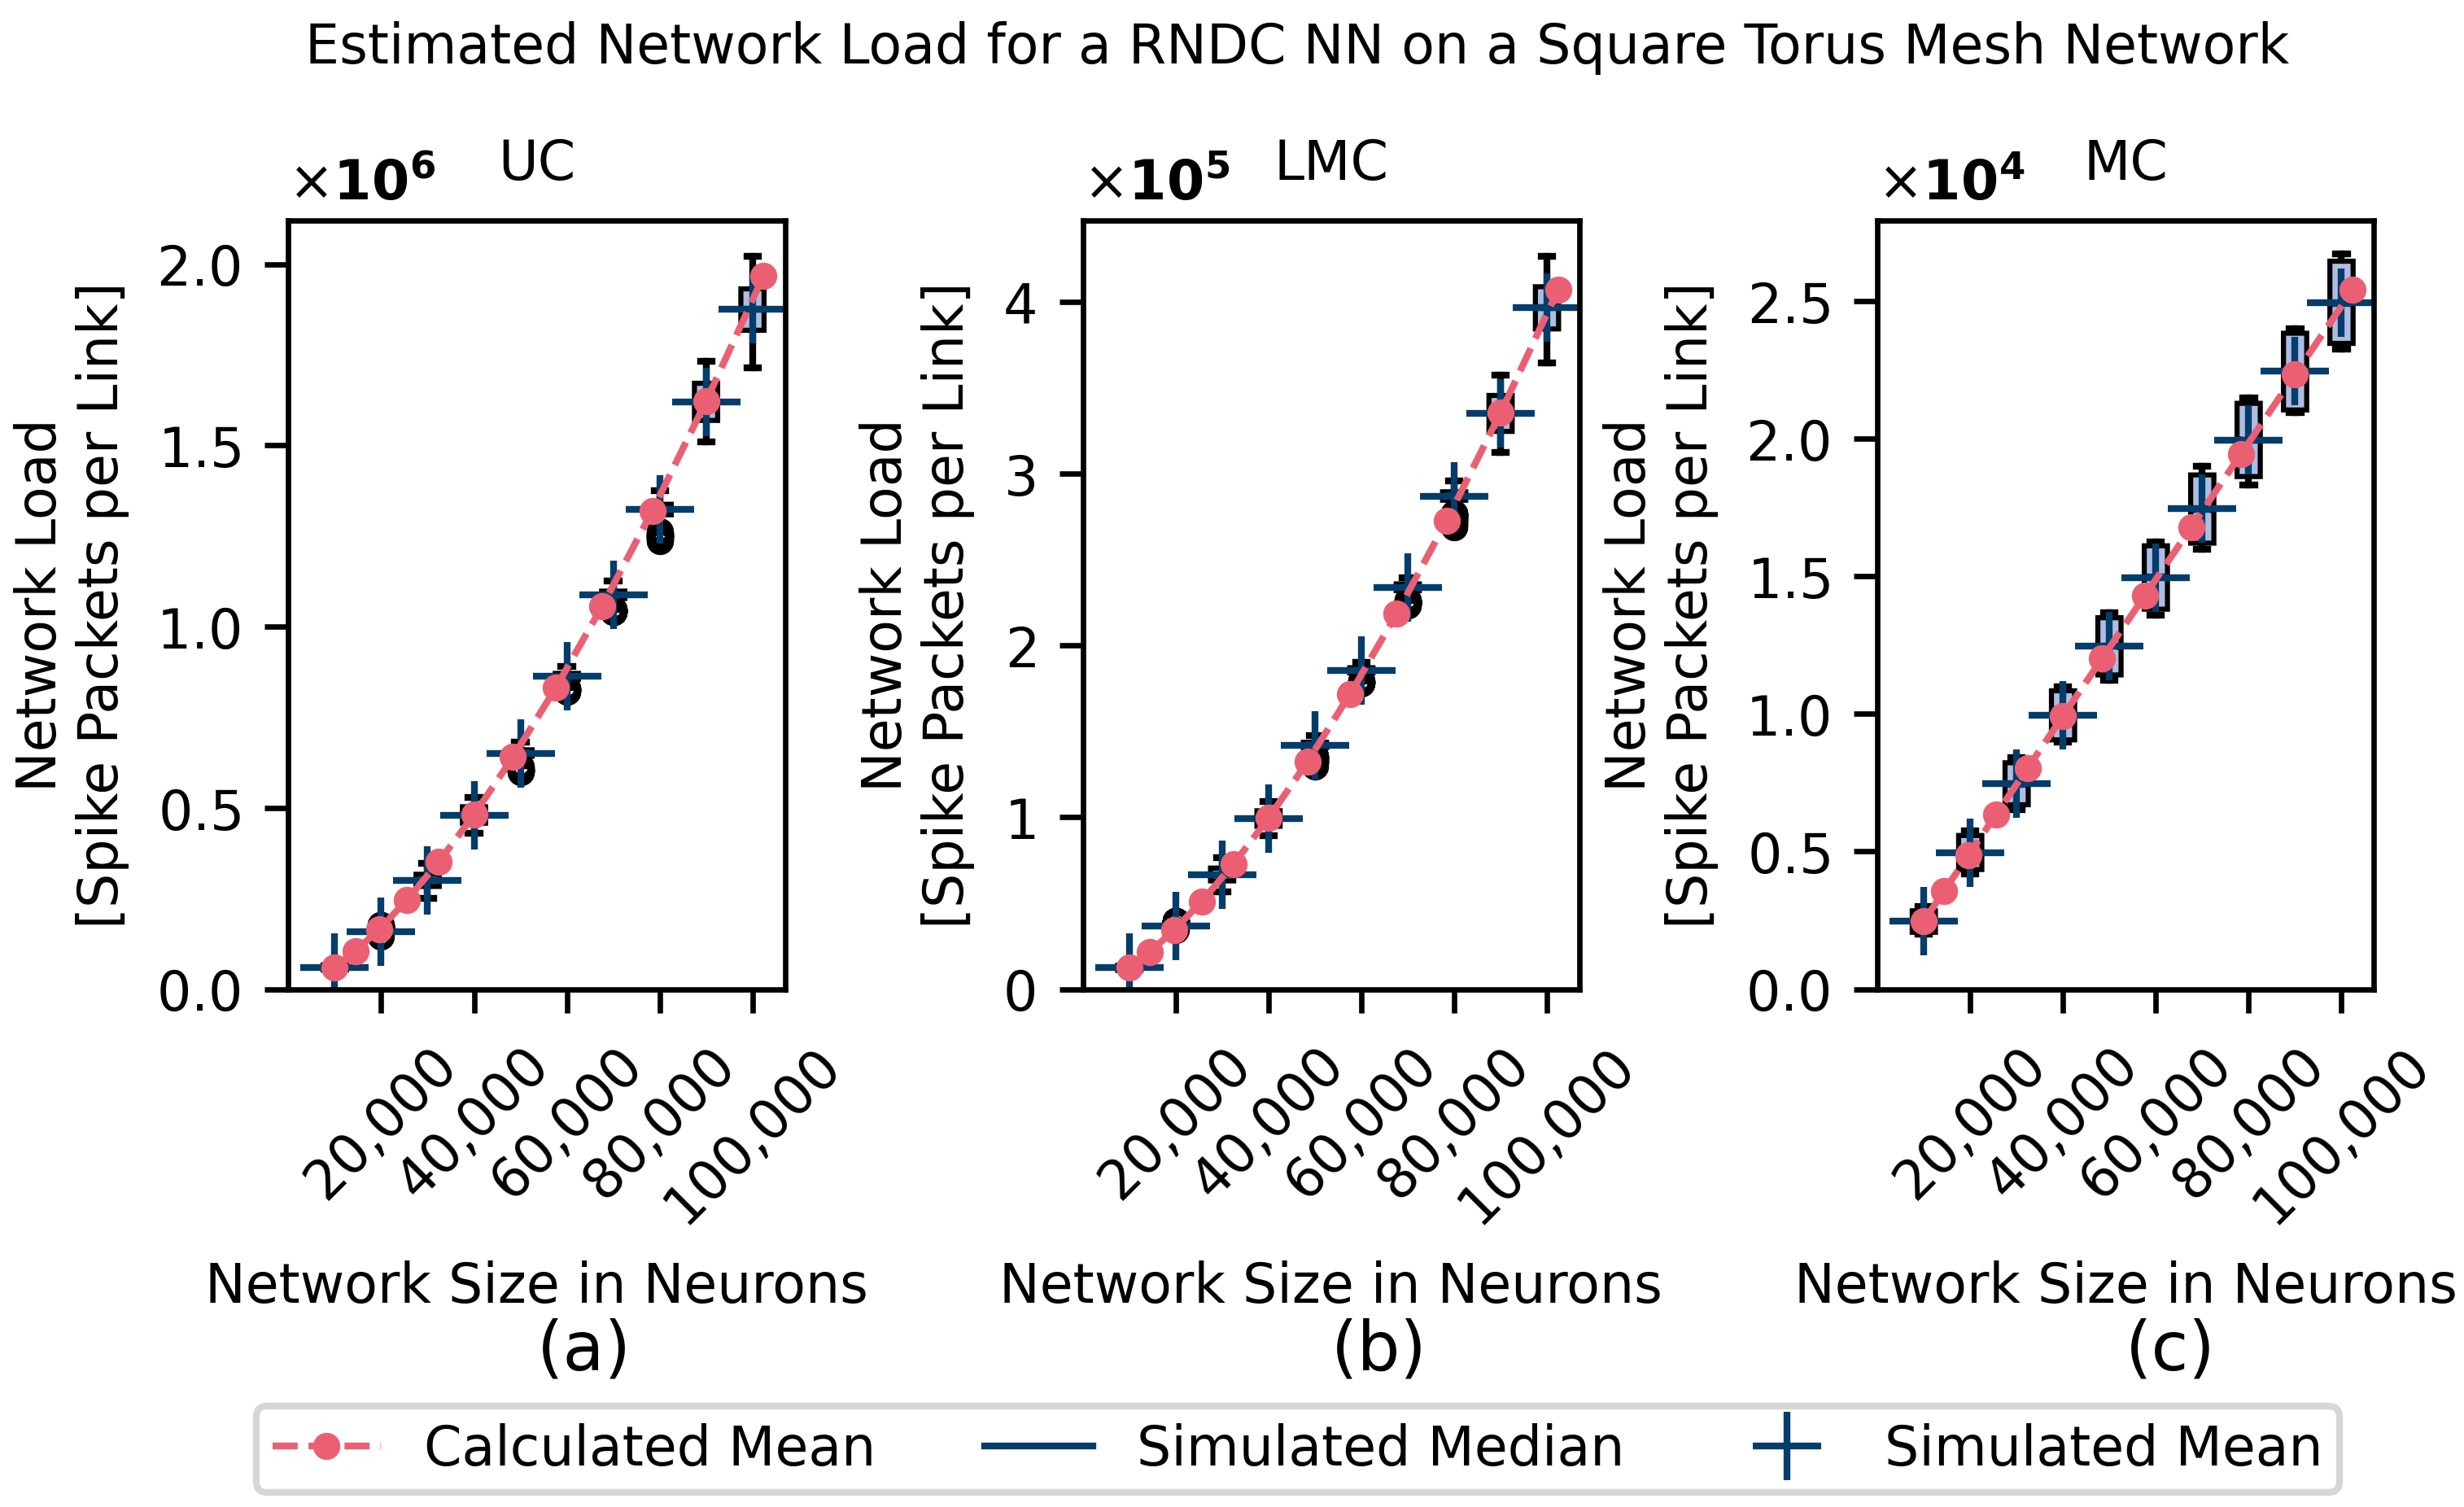
Figure 2 presents box plots of network loads caused by an RNDC NN simulated on a regular square mesh using the three casting types. For comparison, values determined with the above equations and parameter values are shown. Analogous results for the torus-shaped mesh are contained in Figure 3. In both Figures, i.e., for both topology variants, good agreement between the analytical model and average values of network load provided by the simulator can be observed. On the other hand, in Figure 2, i.e., for the case of the regular square mesh, a large variance in the network load at different locations is apparent. This occurs because centrally located links need to handle significantly more spike packets than peripheral links. Such areas are significant, as they may impose communication bottlenecks on the network caused by congestion. In a torus mesh, inherently there are no distinguished locations. Consequently, there are no boundary effects, so that the variance of the network load at different locations is low. When comparing the two topologies with each other for 100,000 neurons, using the analytical model, differences in network load of approximately 37% for UC and LMC and 3% for MC can be identified. However, the differences between the maximum values established with the simulator rose to 89% for UC and LMC and 92% for MC. Therefore, the torus variant is the preferred choice. However, for fixed-size NC systems that simulate NNs of different sizes, there may be occasions of low system utilization. In such cases, when the NN is located in a distinct part of the system, care should be exercised not to create an isolated non-torus subnetwork.

4.2. Heterogeneous Connectivity Model Simulations

To show the impact of heterogeneous connectivity, we examine the aforementioned cortical microcircuit model [13] and the multi-area model [8]. As mentioned before in Section 3.1, the FR can be set for individual neuron populations to account for differences in spike activity in different time frames. However, at this point in time, the test cases do not describe the distribution of spike activity in the networks, and as we were still looking at the network load at a high level of abstraction, we kept F R = 1 for the rest of this work.

4.2.1. Cortical Microcircuit Model

The former model consists of four layers with two populations, an excitatory and an inhibitory population each. Additionally, the model also contains a “thalamic” population. The model specifies the number of neurons in each population and the connection probability C X , Y between neurons from population X and population Y, which are shown in Table 1. With these values, we can determine the average connection probability between neurons in this model to be 0.048.
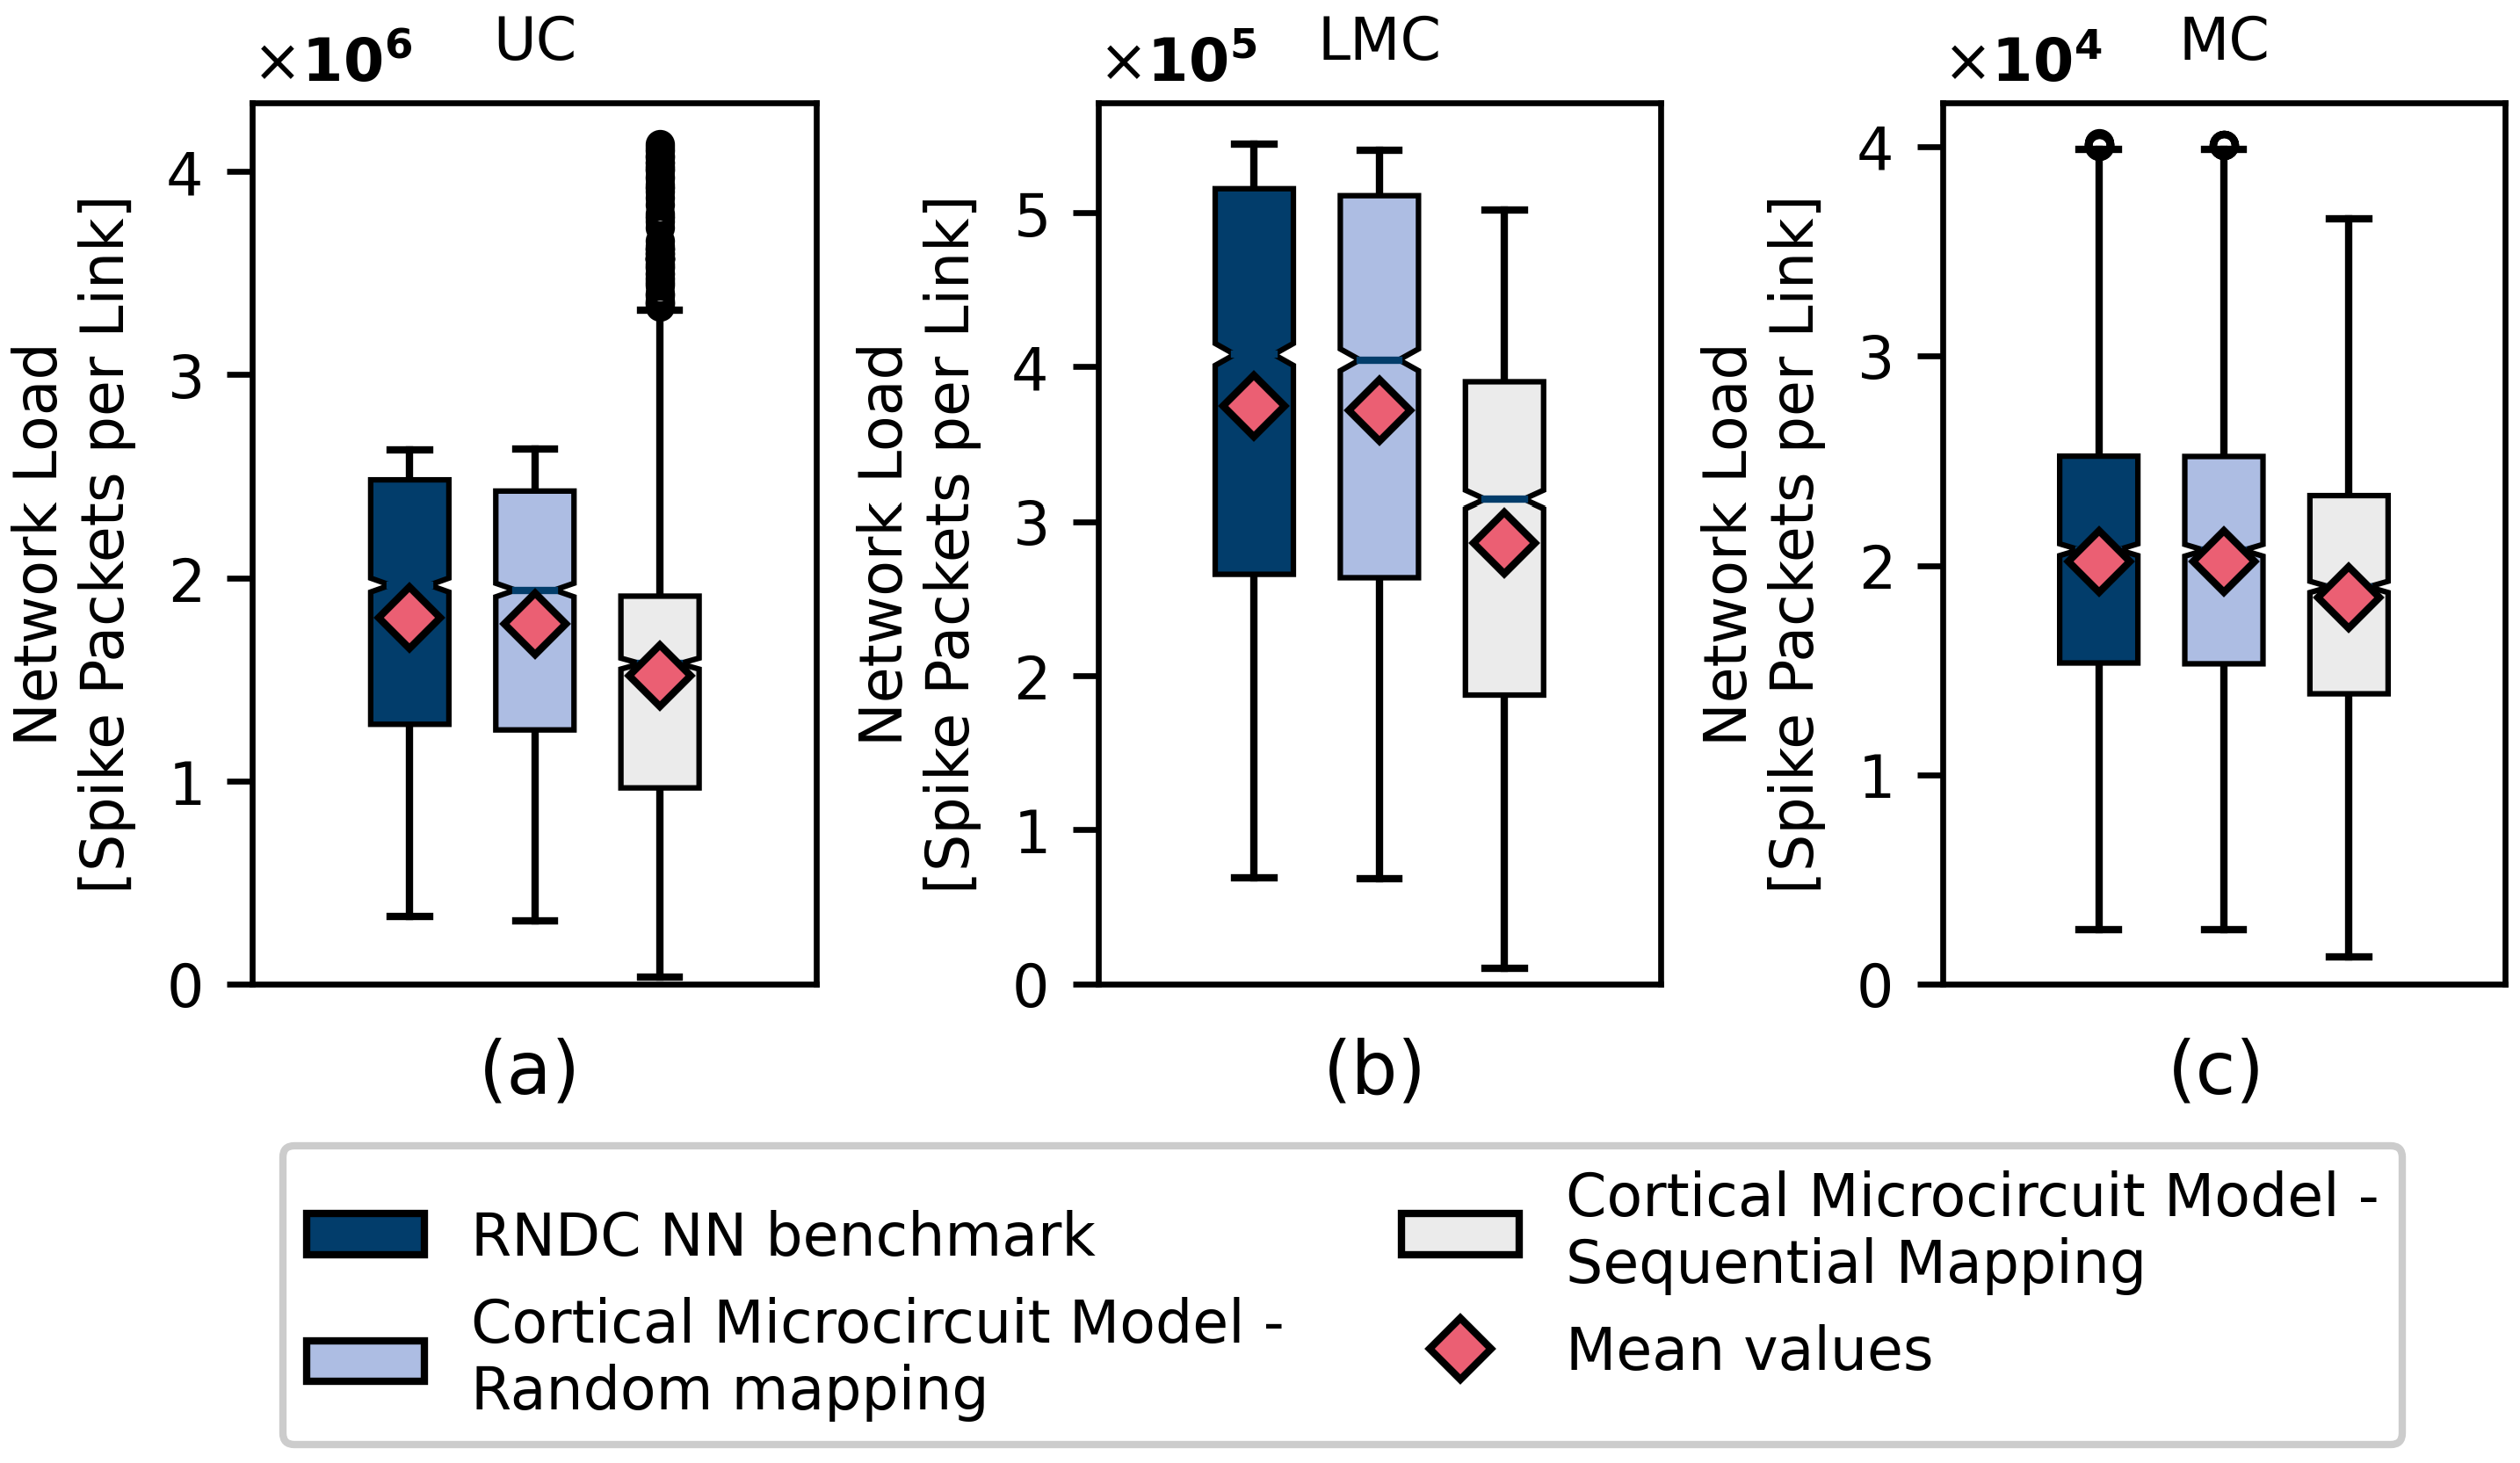
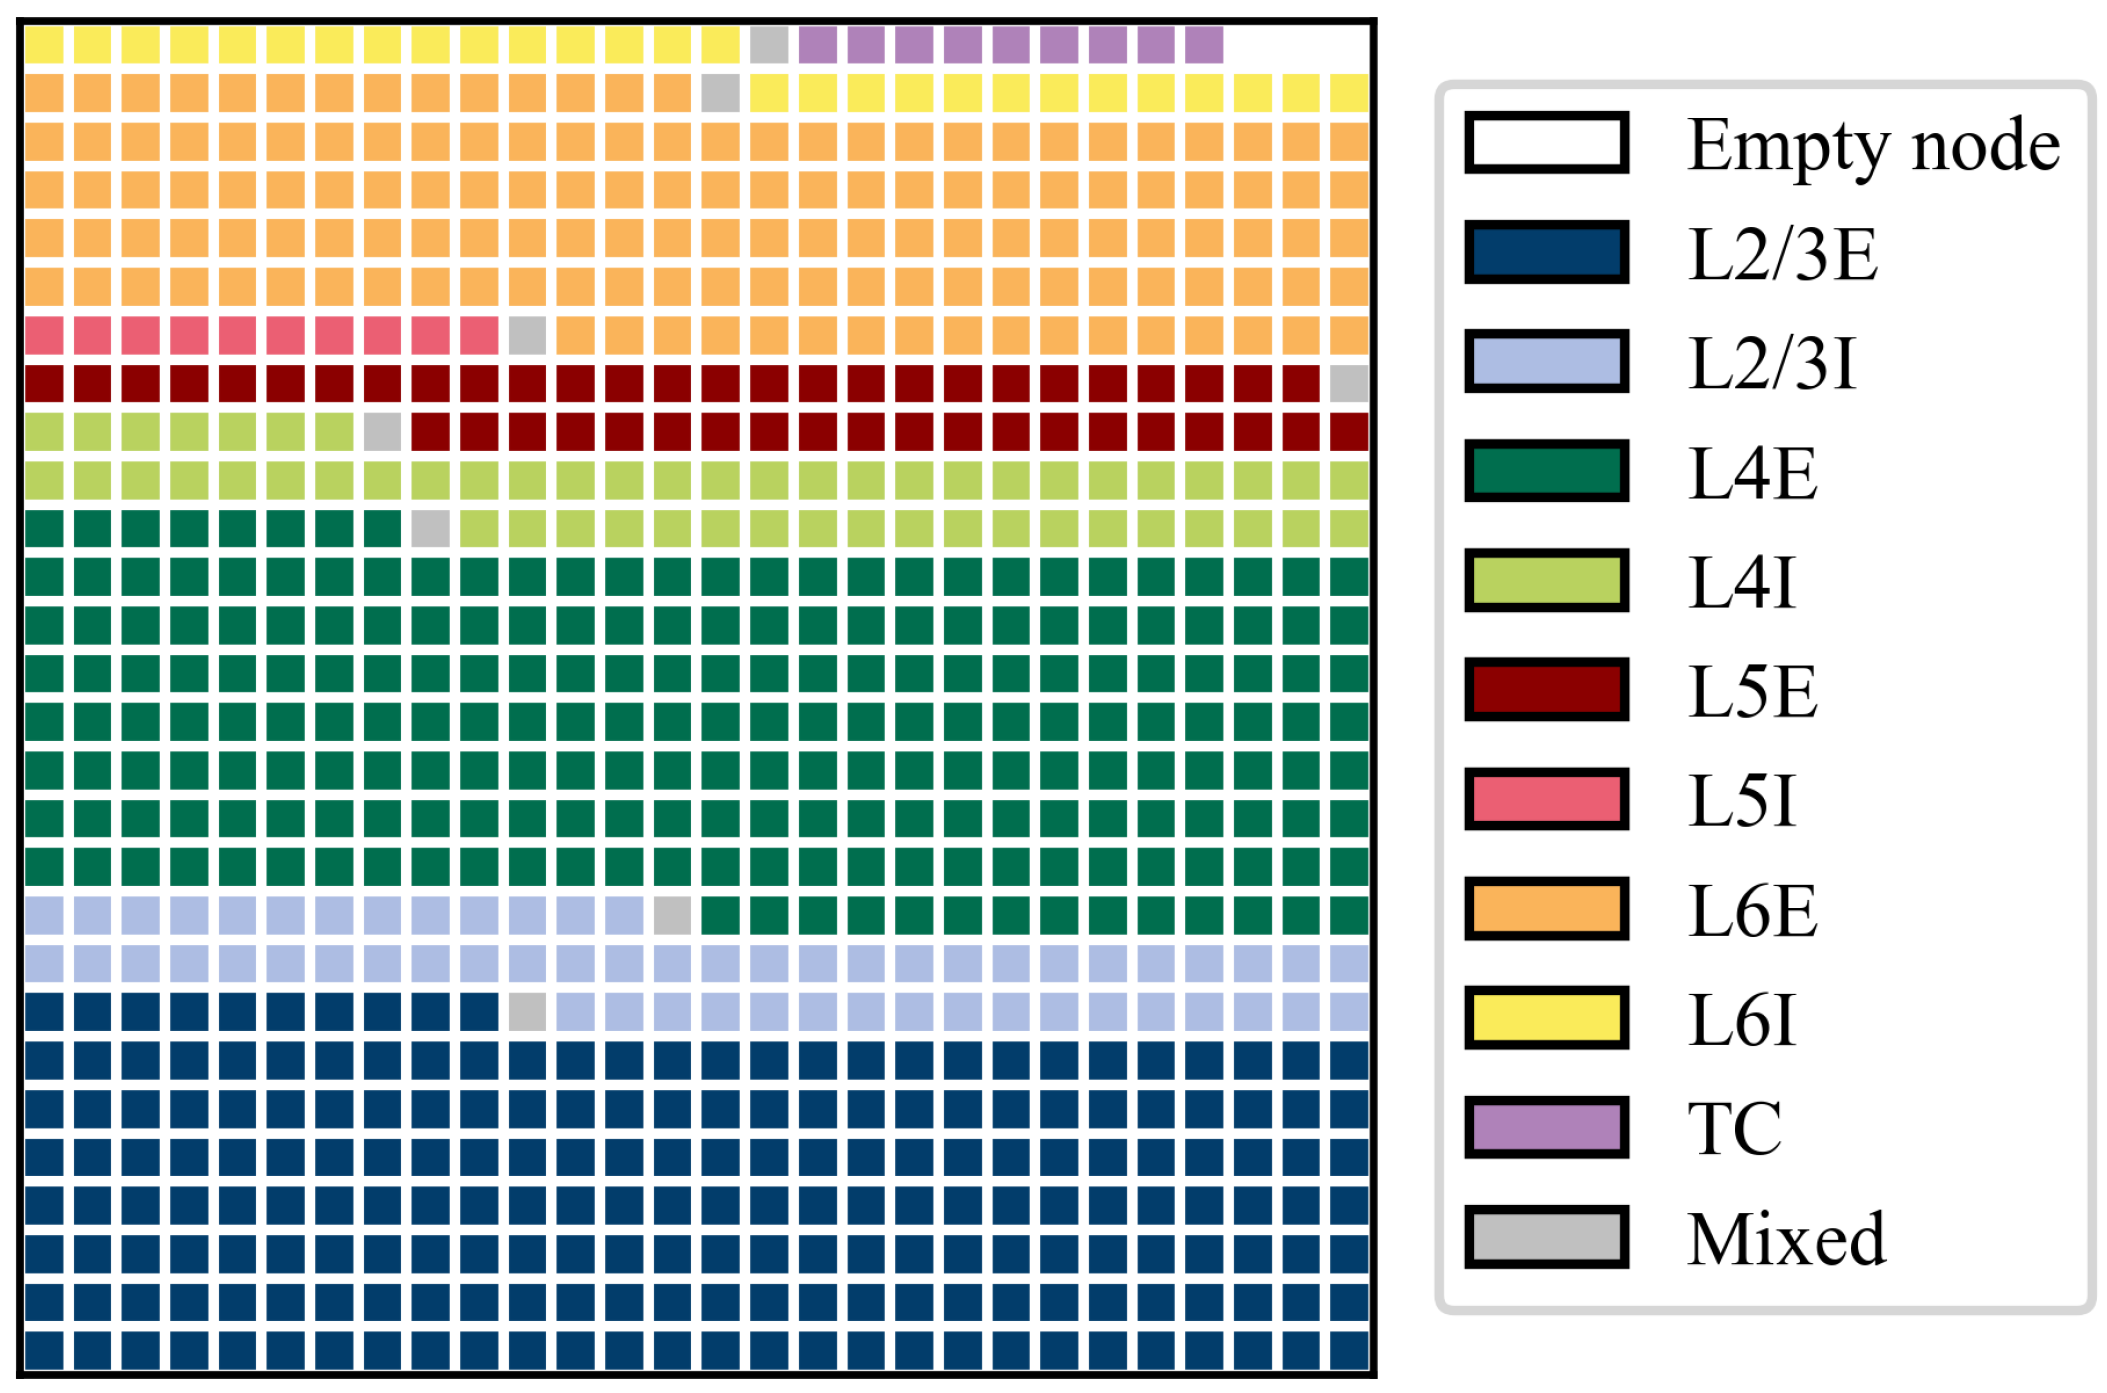
Figure 4 compares the throughput created by the cortical microcircuit model and an RNDC NN model. Both used an average connectivity of ϵ = 0.048 and n = 78,071 neurons. If random mapping is applied to the cortical microcircuit model, the network loads created by the models will be statistically equivalent. However, as outlined before, the simulator allows for the application of a mapping algorithm to achieve beneficial placement. Table 1 shows for the cortical microcircuit model that the connectivity is generally highest between neurons of the same population. For an efficient mapping, it is thus reasonable to group all neurons of one population together. There is also a relevant secondary connectivity between excitatory and inhibitory populations of the same layer, and to adjacent layers. The network is therefore sequentially filled by a rudimentary mapping approach, layer by layer. Figure 5 shows the resulting mapping.
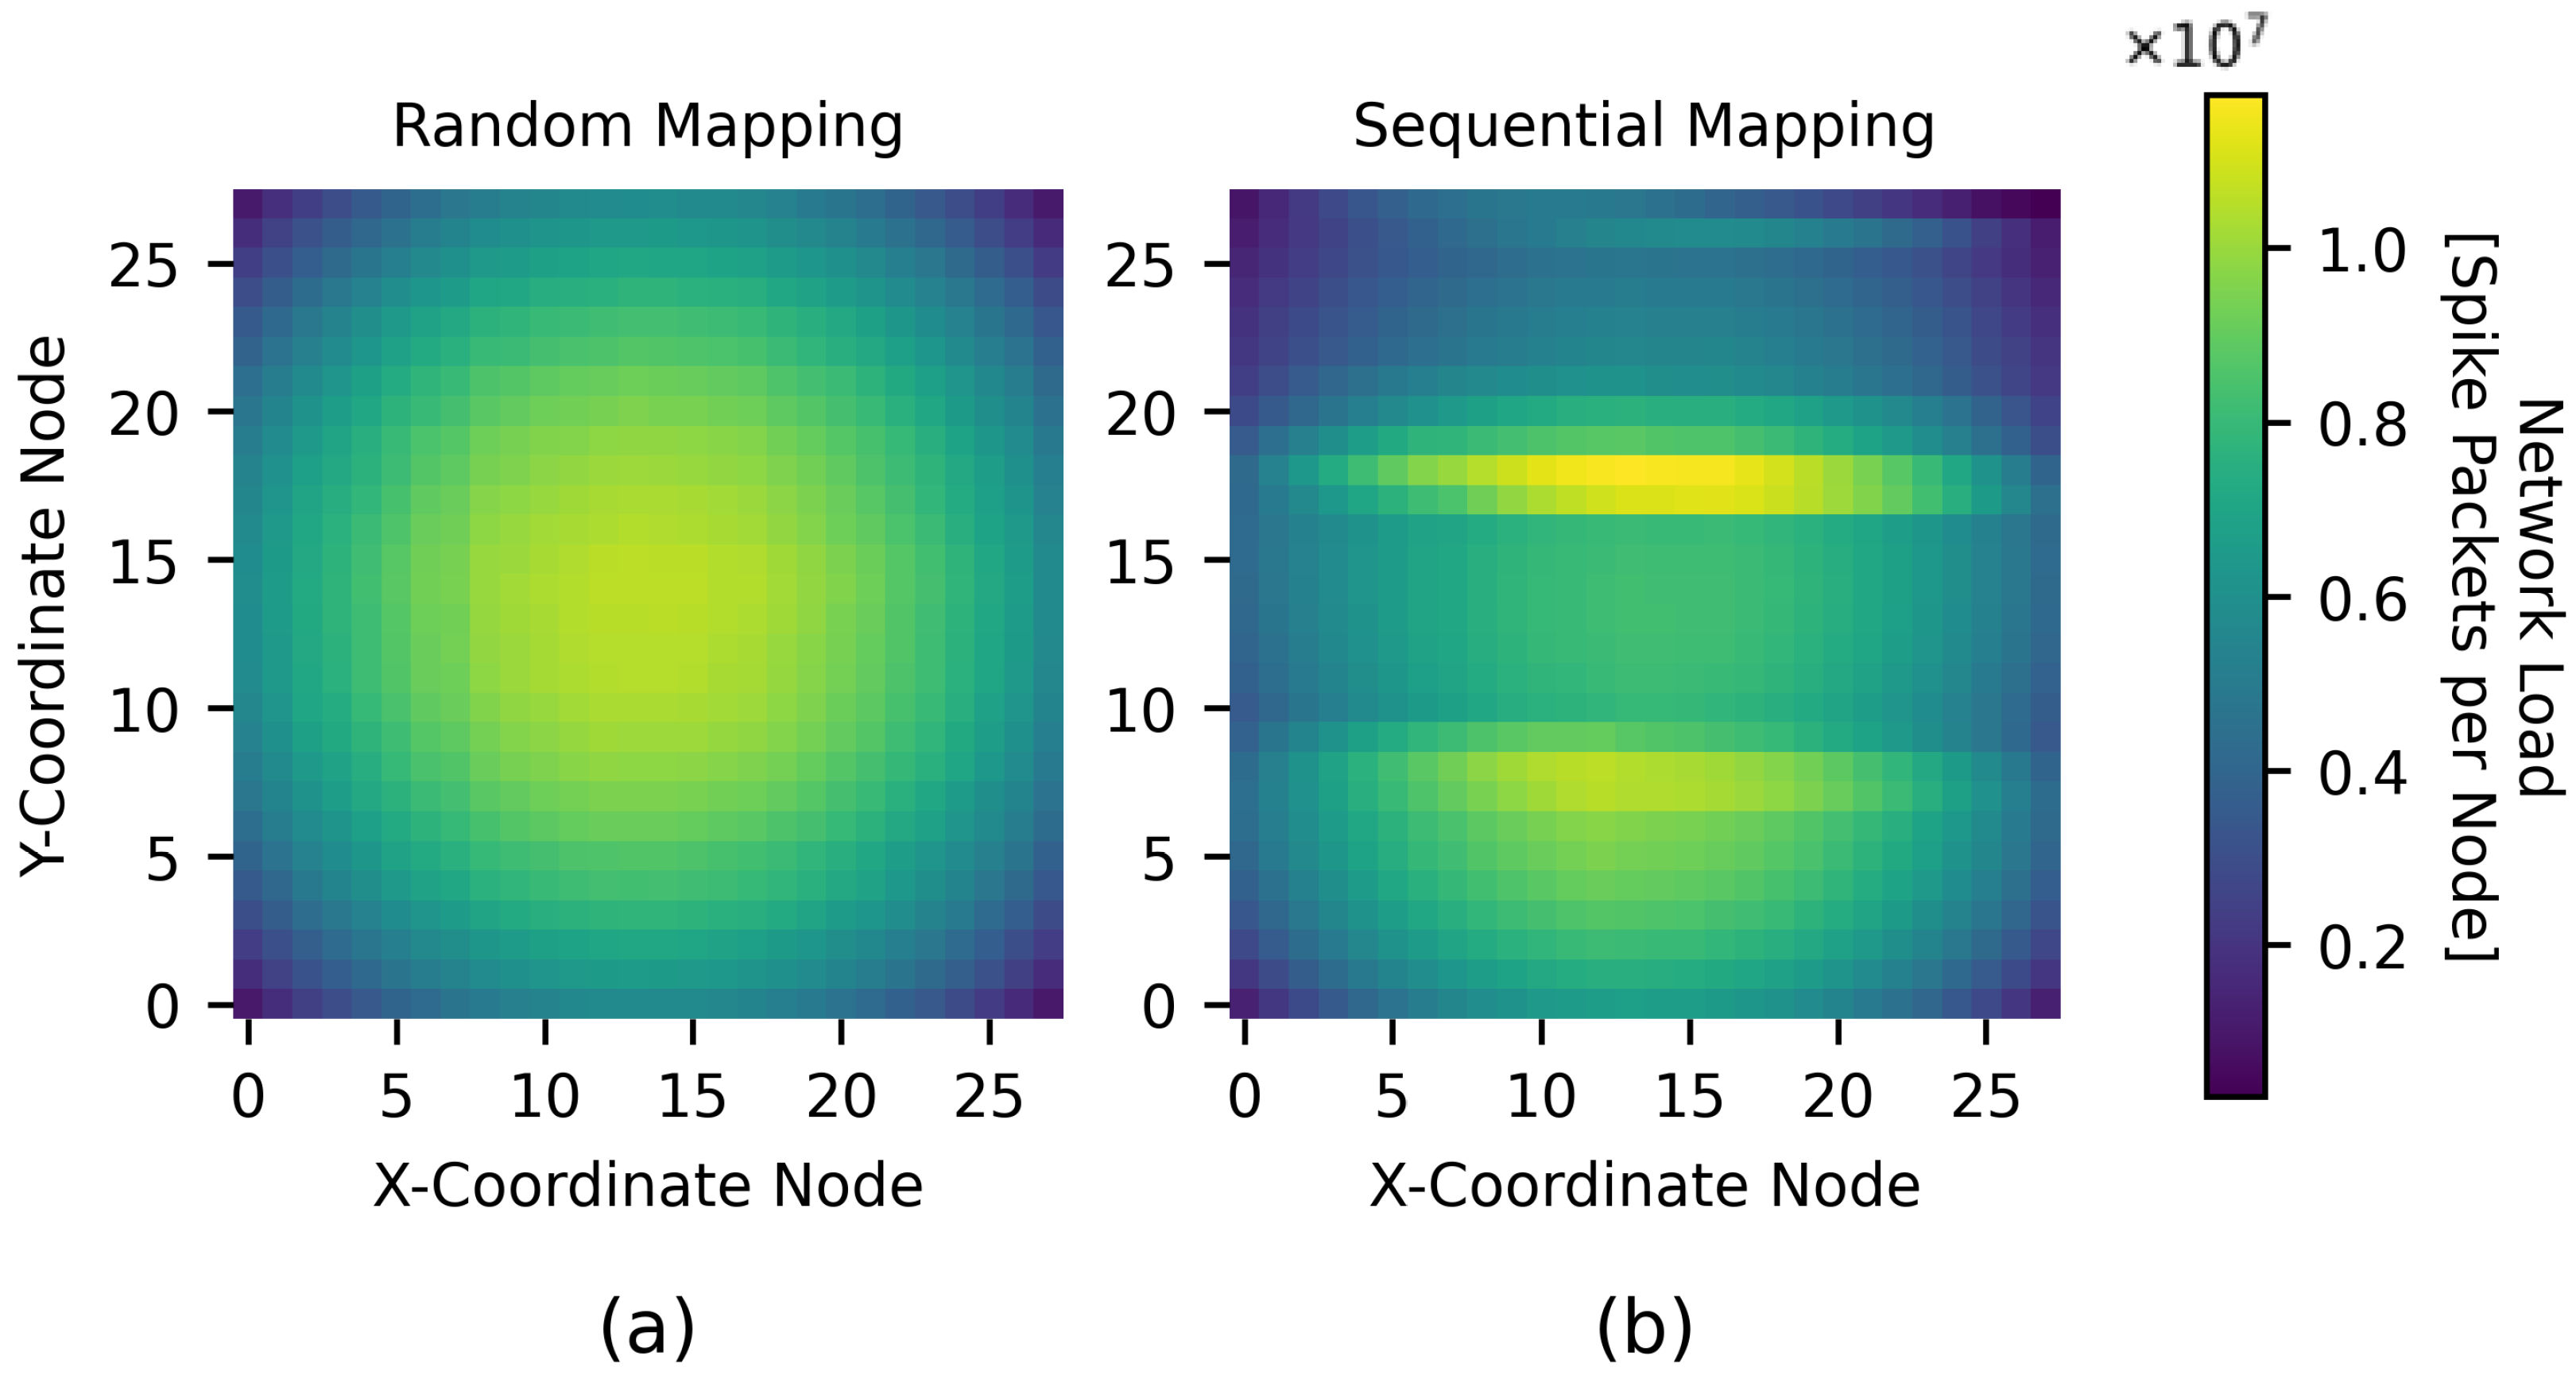
Simulation results after the mapping are contained in Figure 4 as well. They demonstrate that the average network load is significantly reduced for all three casting types. As detailed above, the maximum value is also a critical metric and rises notably for the UC case. The location-dependent network load distributions for a random and a sequential mapping, when using UC, are visualized in Figure 6 as heat maps. Every pixel in the heat map represents a node in the network, and the color, the number of spike packets going through each node. In Figure 6a, we can see a uniform distribution of the network load, caused by randomly mapping the neurons. We can observe reduced traffic in peripheral regions, as this heat map presents results of a non-torus network. In Figure 6b, on the other hand, the network area dedicated to L4I stands out due to high traffic load and may likely become a bottleneck. Notable here is that the differences between the maximum traffic loads for the different types of mapping seem to be larger in the box plots than in the heat maps. This is because the traffic load in Figure 4 is given in spikes per link, whereas Figure 6 shows the traffic load in spikes per node. Induced by sequential mapping, for both LMC and MC, a significant reduction in the maximum network load can be seen in Figure 4, in addition to the reduction in average network load. In a homogeneous NN, as in the RNDC NN, all neurons have similar connections so that there is no underlying structure, which renders sequential mapping ineffective.
Figure 7 presents the latency estimates generated by the simulator. The latency per neuron is determined by the farthest distance its generated spike packet has to travel to reach all its destinations. The box plots in Figure 7 show the resulting latency values for all neurons in the network. As discussed above, the LDFR algorithm always establishes the shortest path between source and destination, which causes the latency to be independent of the casting type. An average latency of 41.9 hops was determined for all neuron communications by the simulator for both the RNDC benchmark and the randomly mapped cortical microcircuit model. When sequential mapping was applied, the average latency dropped slightly to 40.25 hops hops. In a network, often the maximum latency is the critical timing constraint rather than the average latency. For all models considered in this subsection, this value is 55 hops—the maximum possible distance in the network. This could be expected, because the probability that there is a connection between single neurons in opposite corners is close to 1 in all three cases. This might be different for larger NNs or other mapping algorithms.

4.2.2. Multi-Area Model

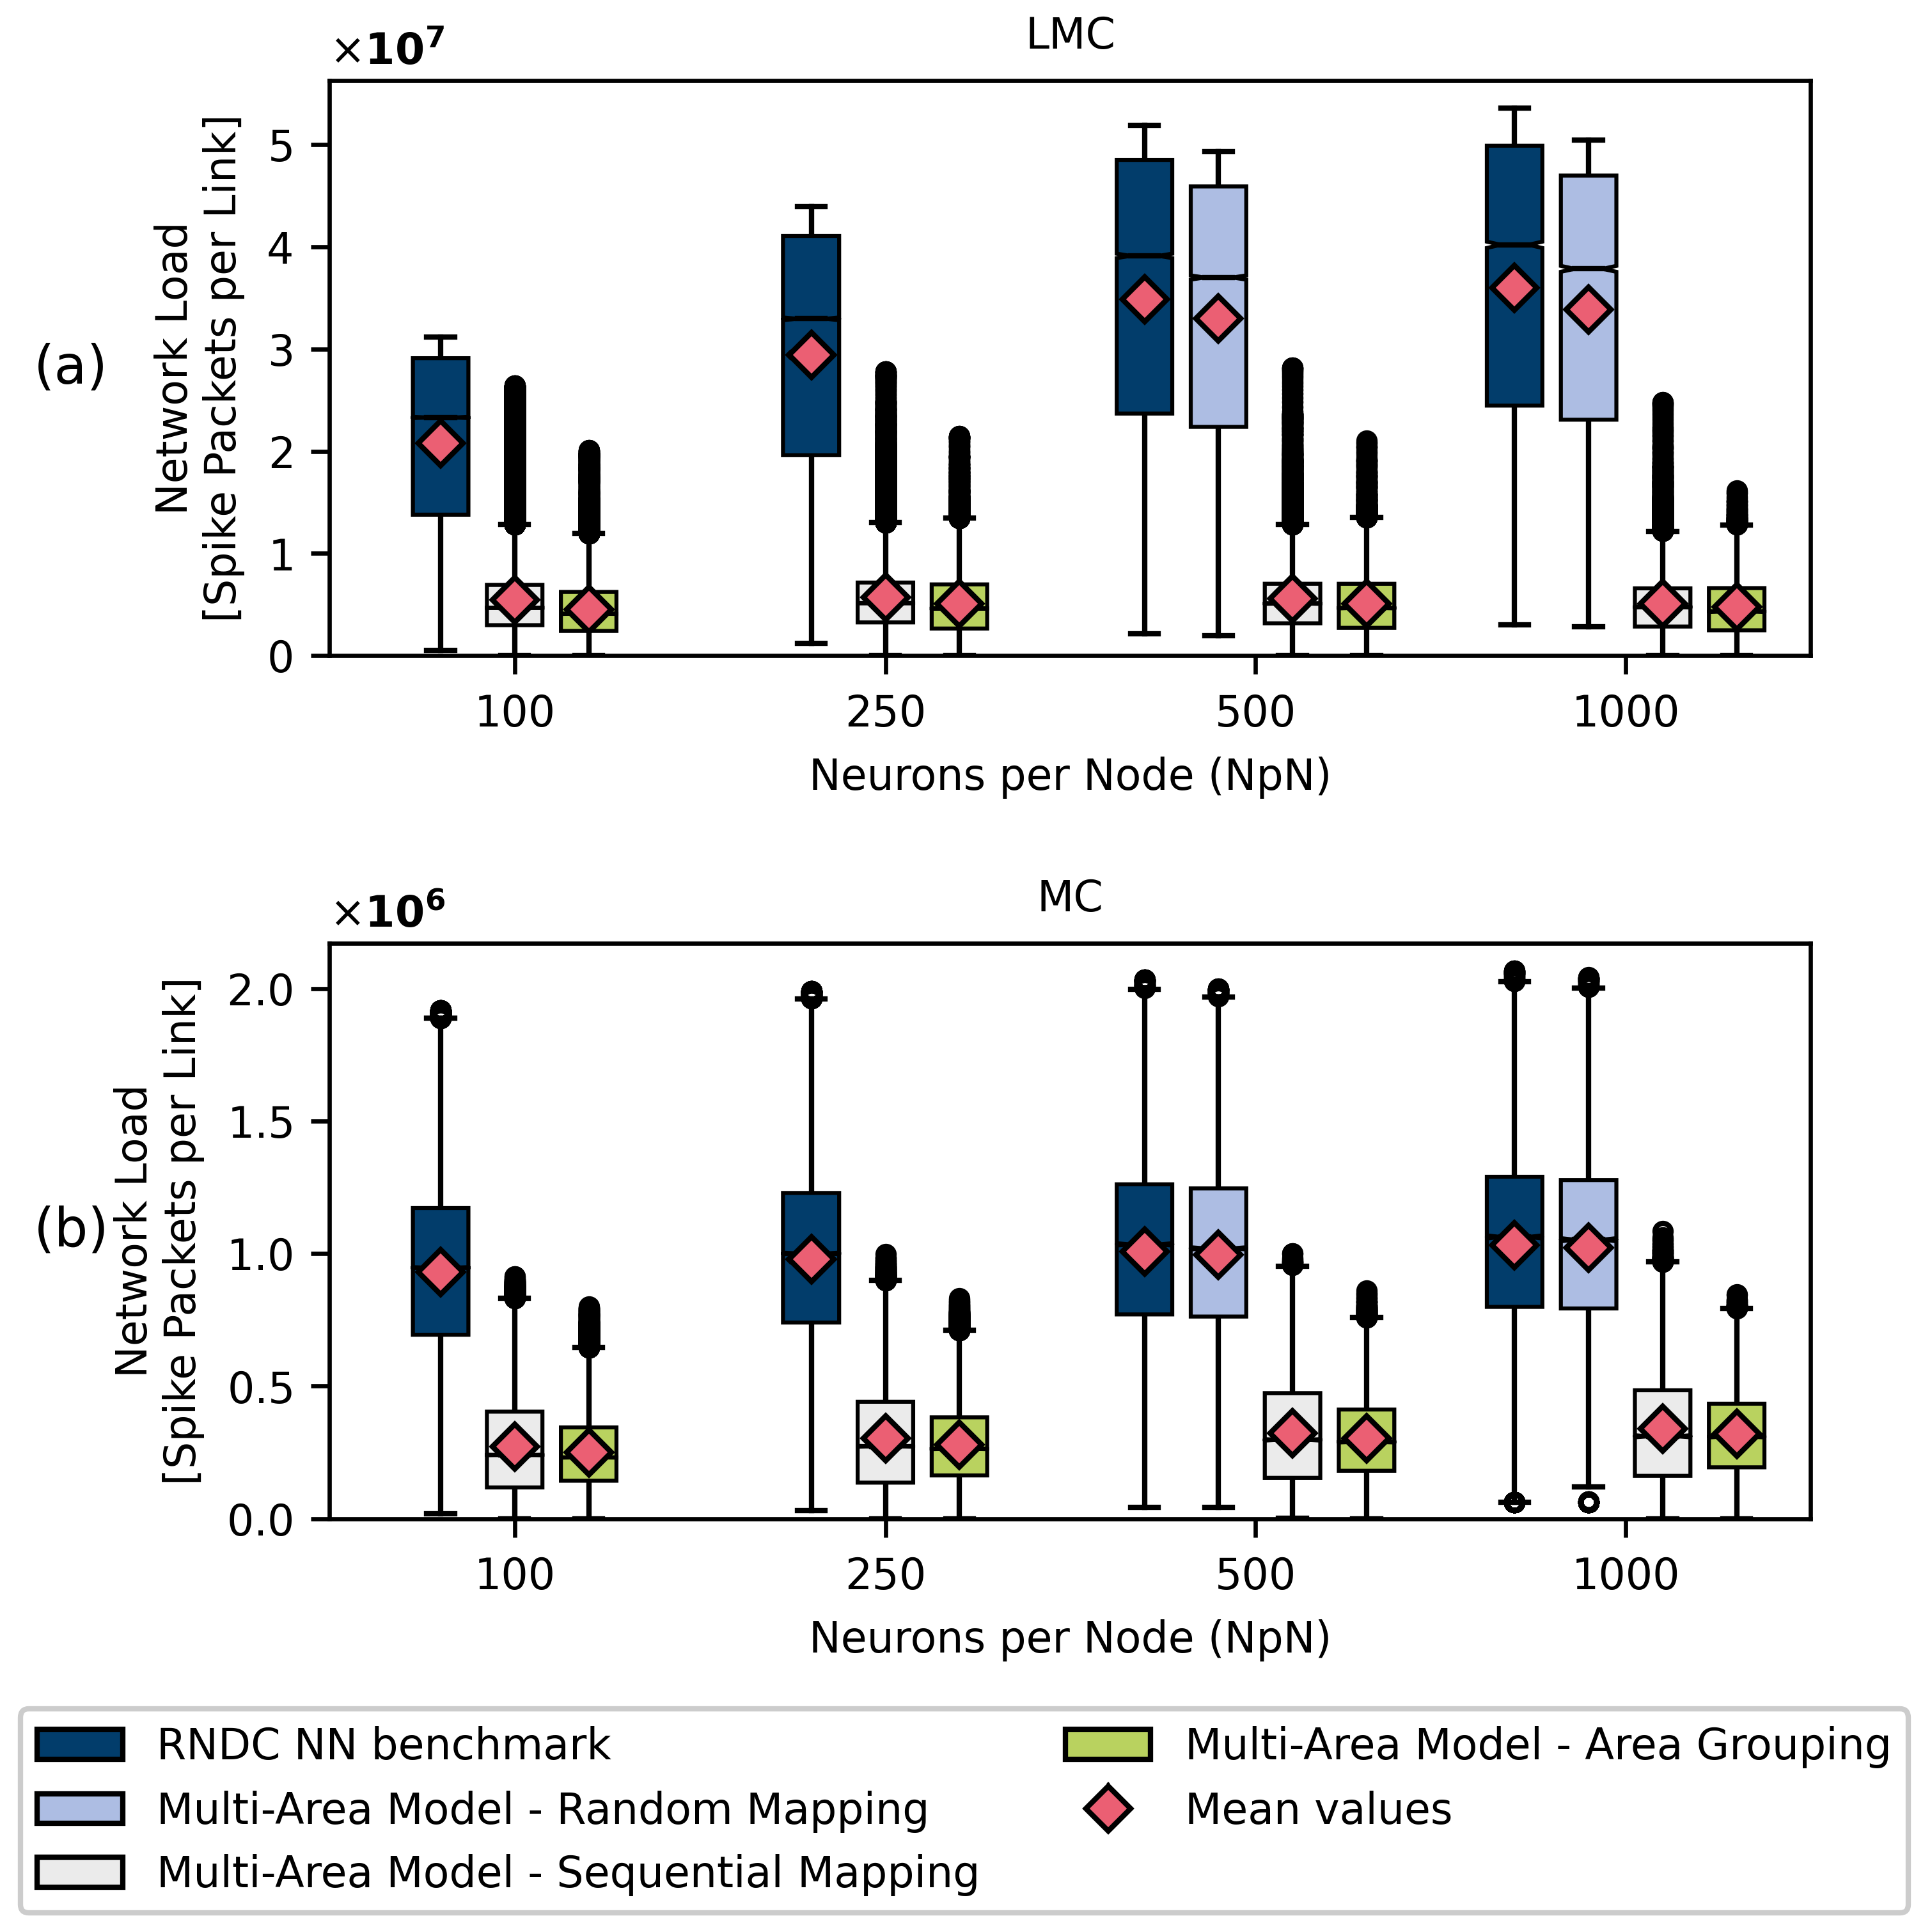
These previously discussed results already show the impacts heterogeneous connectivity models in combination with an appropriate mapping can have on the network load, even for this relatively small test case. This impact becomes even larger for larger NNs. To show this, we used the multi-area model described in [8]. This model contains 4,130,044 neurons, making it approximately 52.9 times the size of the cortical microcircuit, and it has an average connection probability of ϵ 0.0016 . As the name suggests, this model consists out of 32 areas. Each of these areas is comparable to the cortical microcircuit with four layers and two populations per layer, but without a “thalamic” population. However, all areas have their own specific sizes and connection probabilities to populations within and outside of the area. There is one unique area as well, as it does not contain the layer-4 populations. Apart from this, the general structure of these areas is similar to that of the microcircuit model. Connectivity is generally highest within a population and its layer, followed by the connectivity between neighboring layers. At a higher level, the connectivity between areas is significantly lower. Only the excitatory populations of layers L2/3, L5 and L6 have outgoing connections to populations outside of their own areas. However, all populations do have incoming connections from other populations. Unfortunately, for this large-scale NN, the run time of the simulator is infeasible for certain configurations, especially for small values of N p N . For some cases, as for UC and for a random mapping of heterogeneous connectivity models, some optimization tricks for the on-the-fly connectivity generation cannot be utilized, and the run time rises exponentially. Luckily, these configurations are of less interest. UC will be the least desired casting scheme due to the significantly higher network load, even for relatively small N p N , as the added complexity of LMC is relatively small. As of such, UC is omitted in the subsequent analysis of the multi-area model. The random mapping of neurons, on the other hand, might be of interest to act as a benchmark, but as shown in Figure 4, this can be emulated with an RNDC NN of equivalent size and average connectivity. To verify this at a larger scale, random mapping was performed for the simulations of larger values of N p N = 500 and N p N = 1000 , but omitted for the smaller values. In Figure 8 the simulation results for the multi-area model are shown for LMC and MC, for different mapping approaches and node sizes. Just as for the microcircuit model, randomly mapping the neurons will result in a similar network load to running a uniform RNDC NN with an equivalent average connection probability. However, at this scale, the impact of neuron mapping is significantly larger.
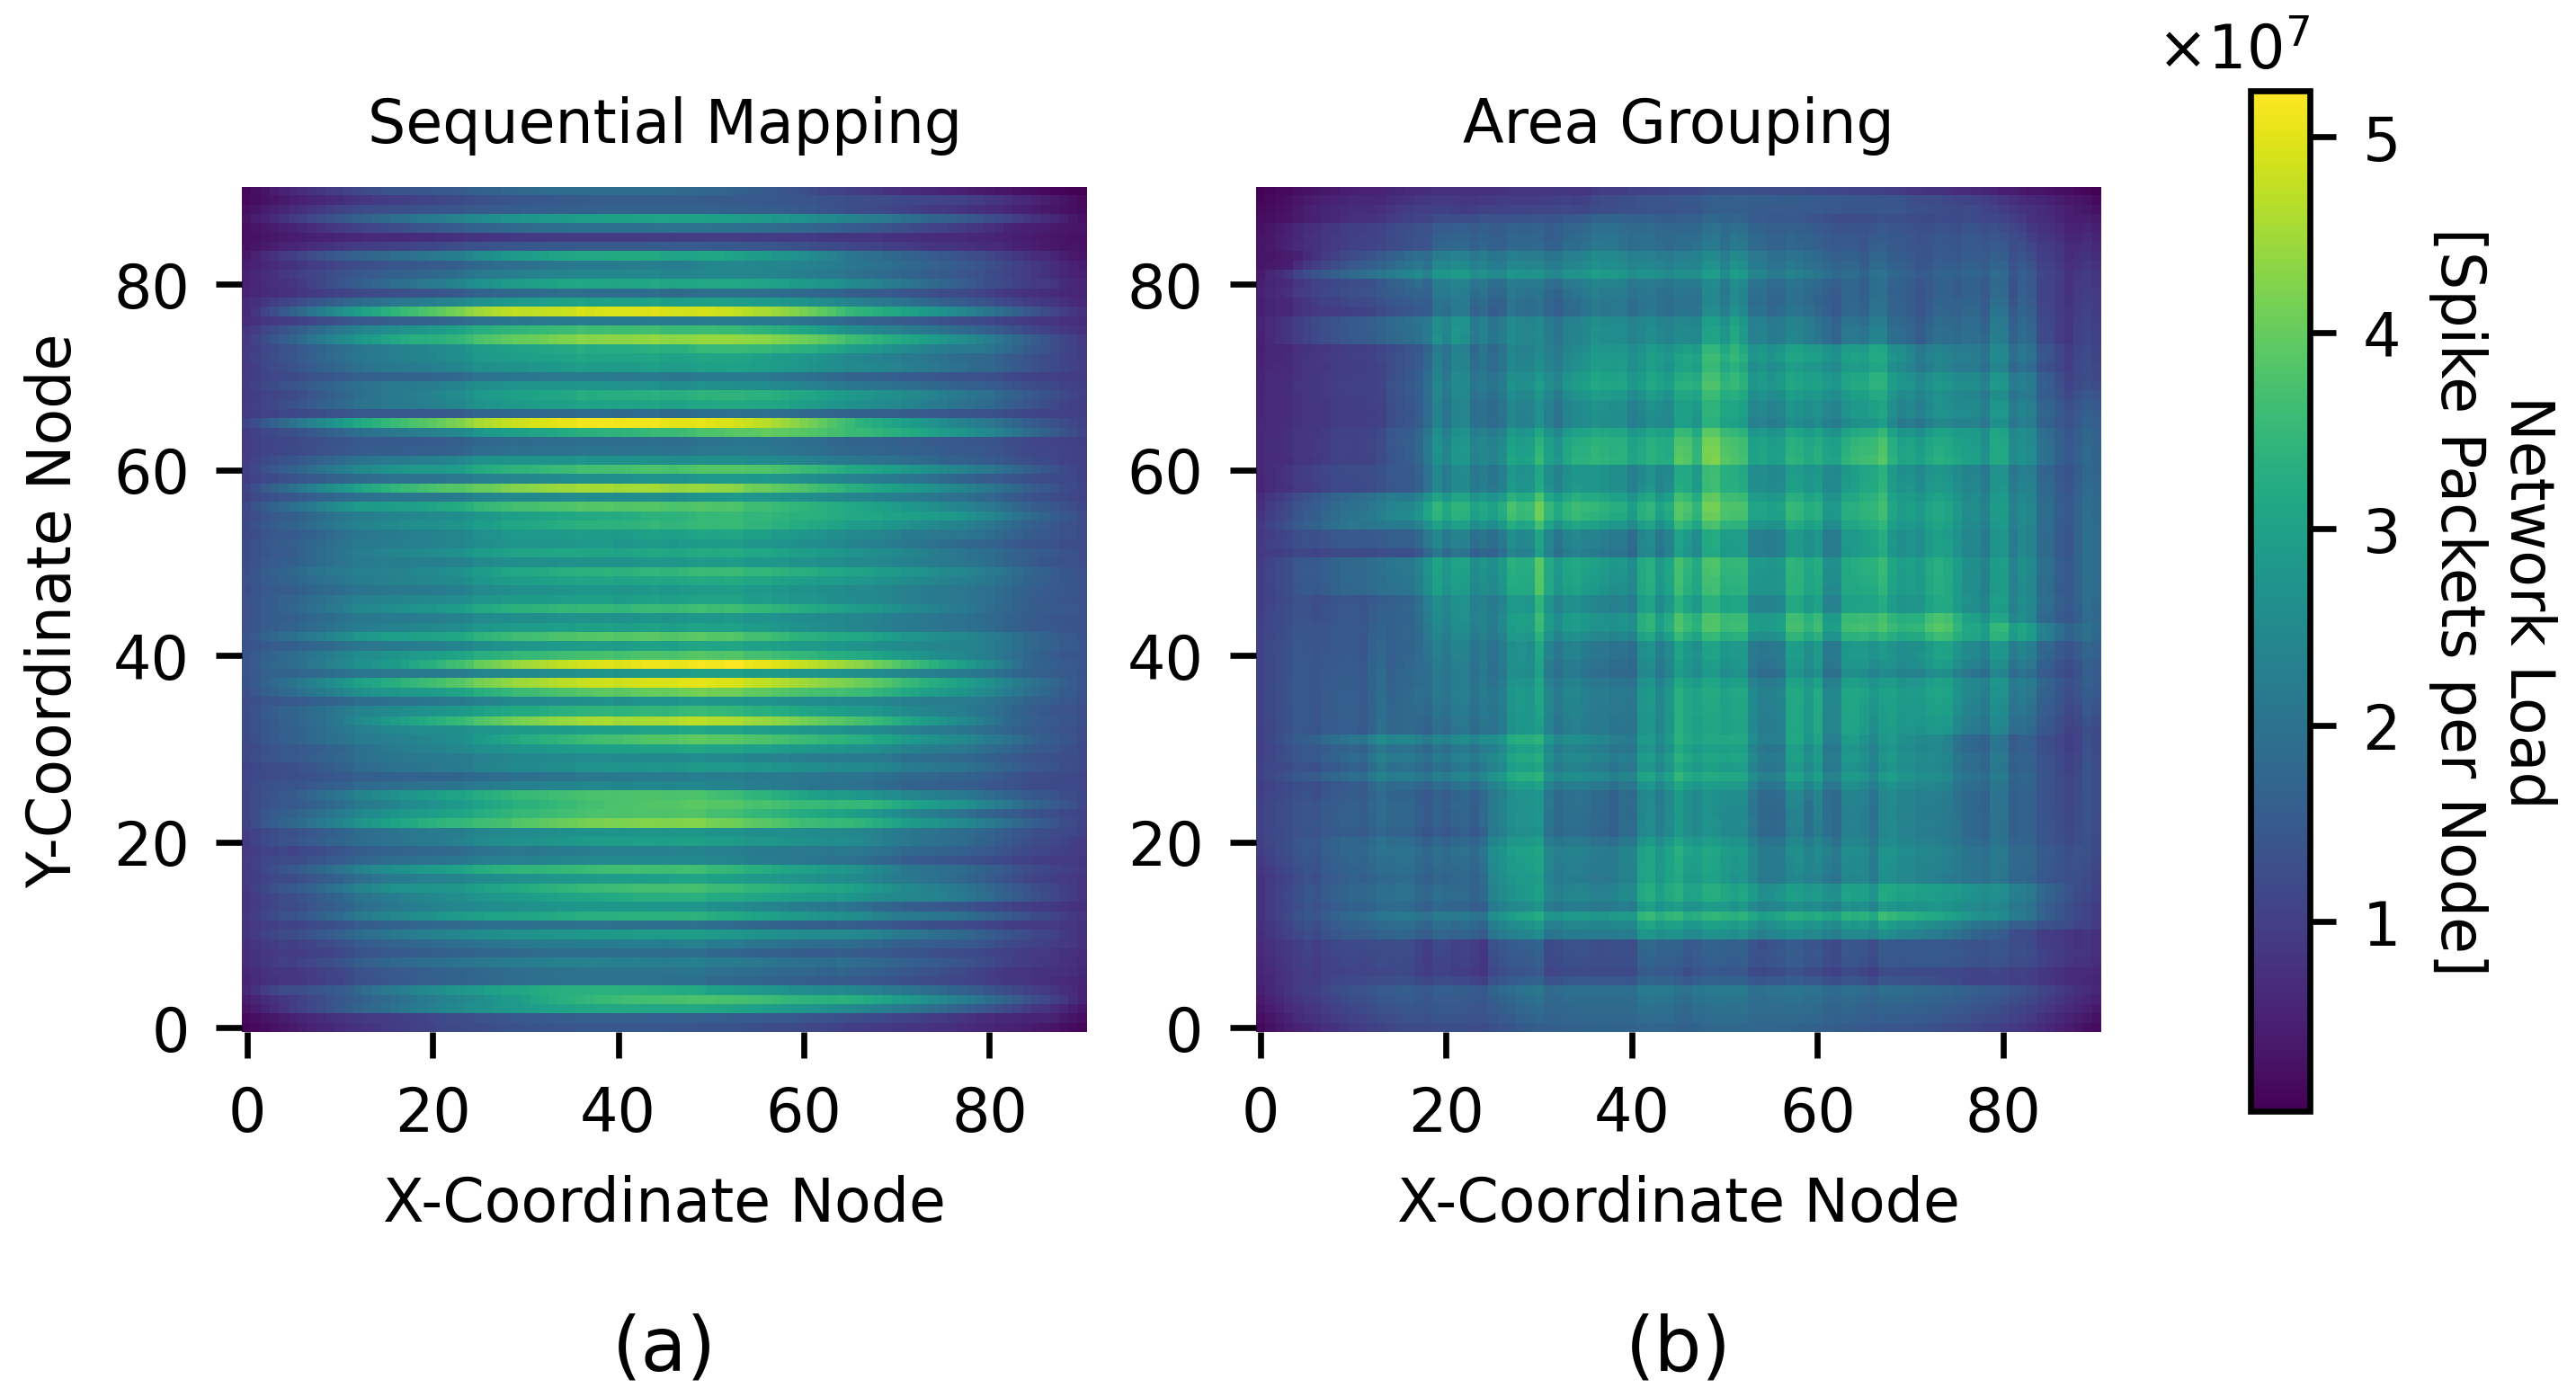
As the connectivity is highest within an area, and especially within a population, we could apply the same reasoning for the mapping as before and place the areas and populations sequentially. However, because the populations were smaller in relation to the total network size, the sequential placement stretched the populations and areas out in small strips over the width of the network. This can also be recognized in the heat map shown in Figure 9a. Another attempt to improve the mapping, which is still in an early stage, limits the sequential placement of the individual populations to a rectangular region determined by the size of the area. This way, neurons of a single population are placed as clusters, and populations of an area are grouped close together as well. The resulting traffic distribution of this mapping approach called “area grouping” is also shown in Figure 8, and the corresponding heat map is in Figure 9b. This small alteration results in an additional reduction in the network load and a more even distribution on the grid.
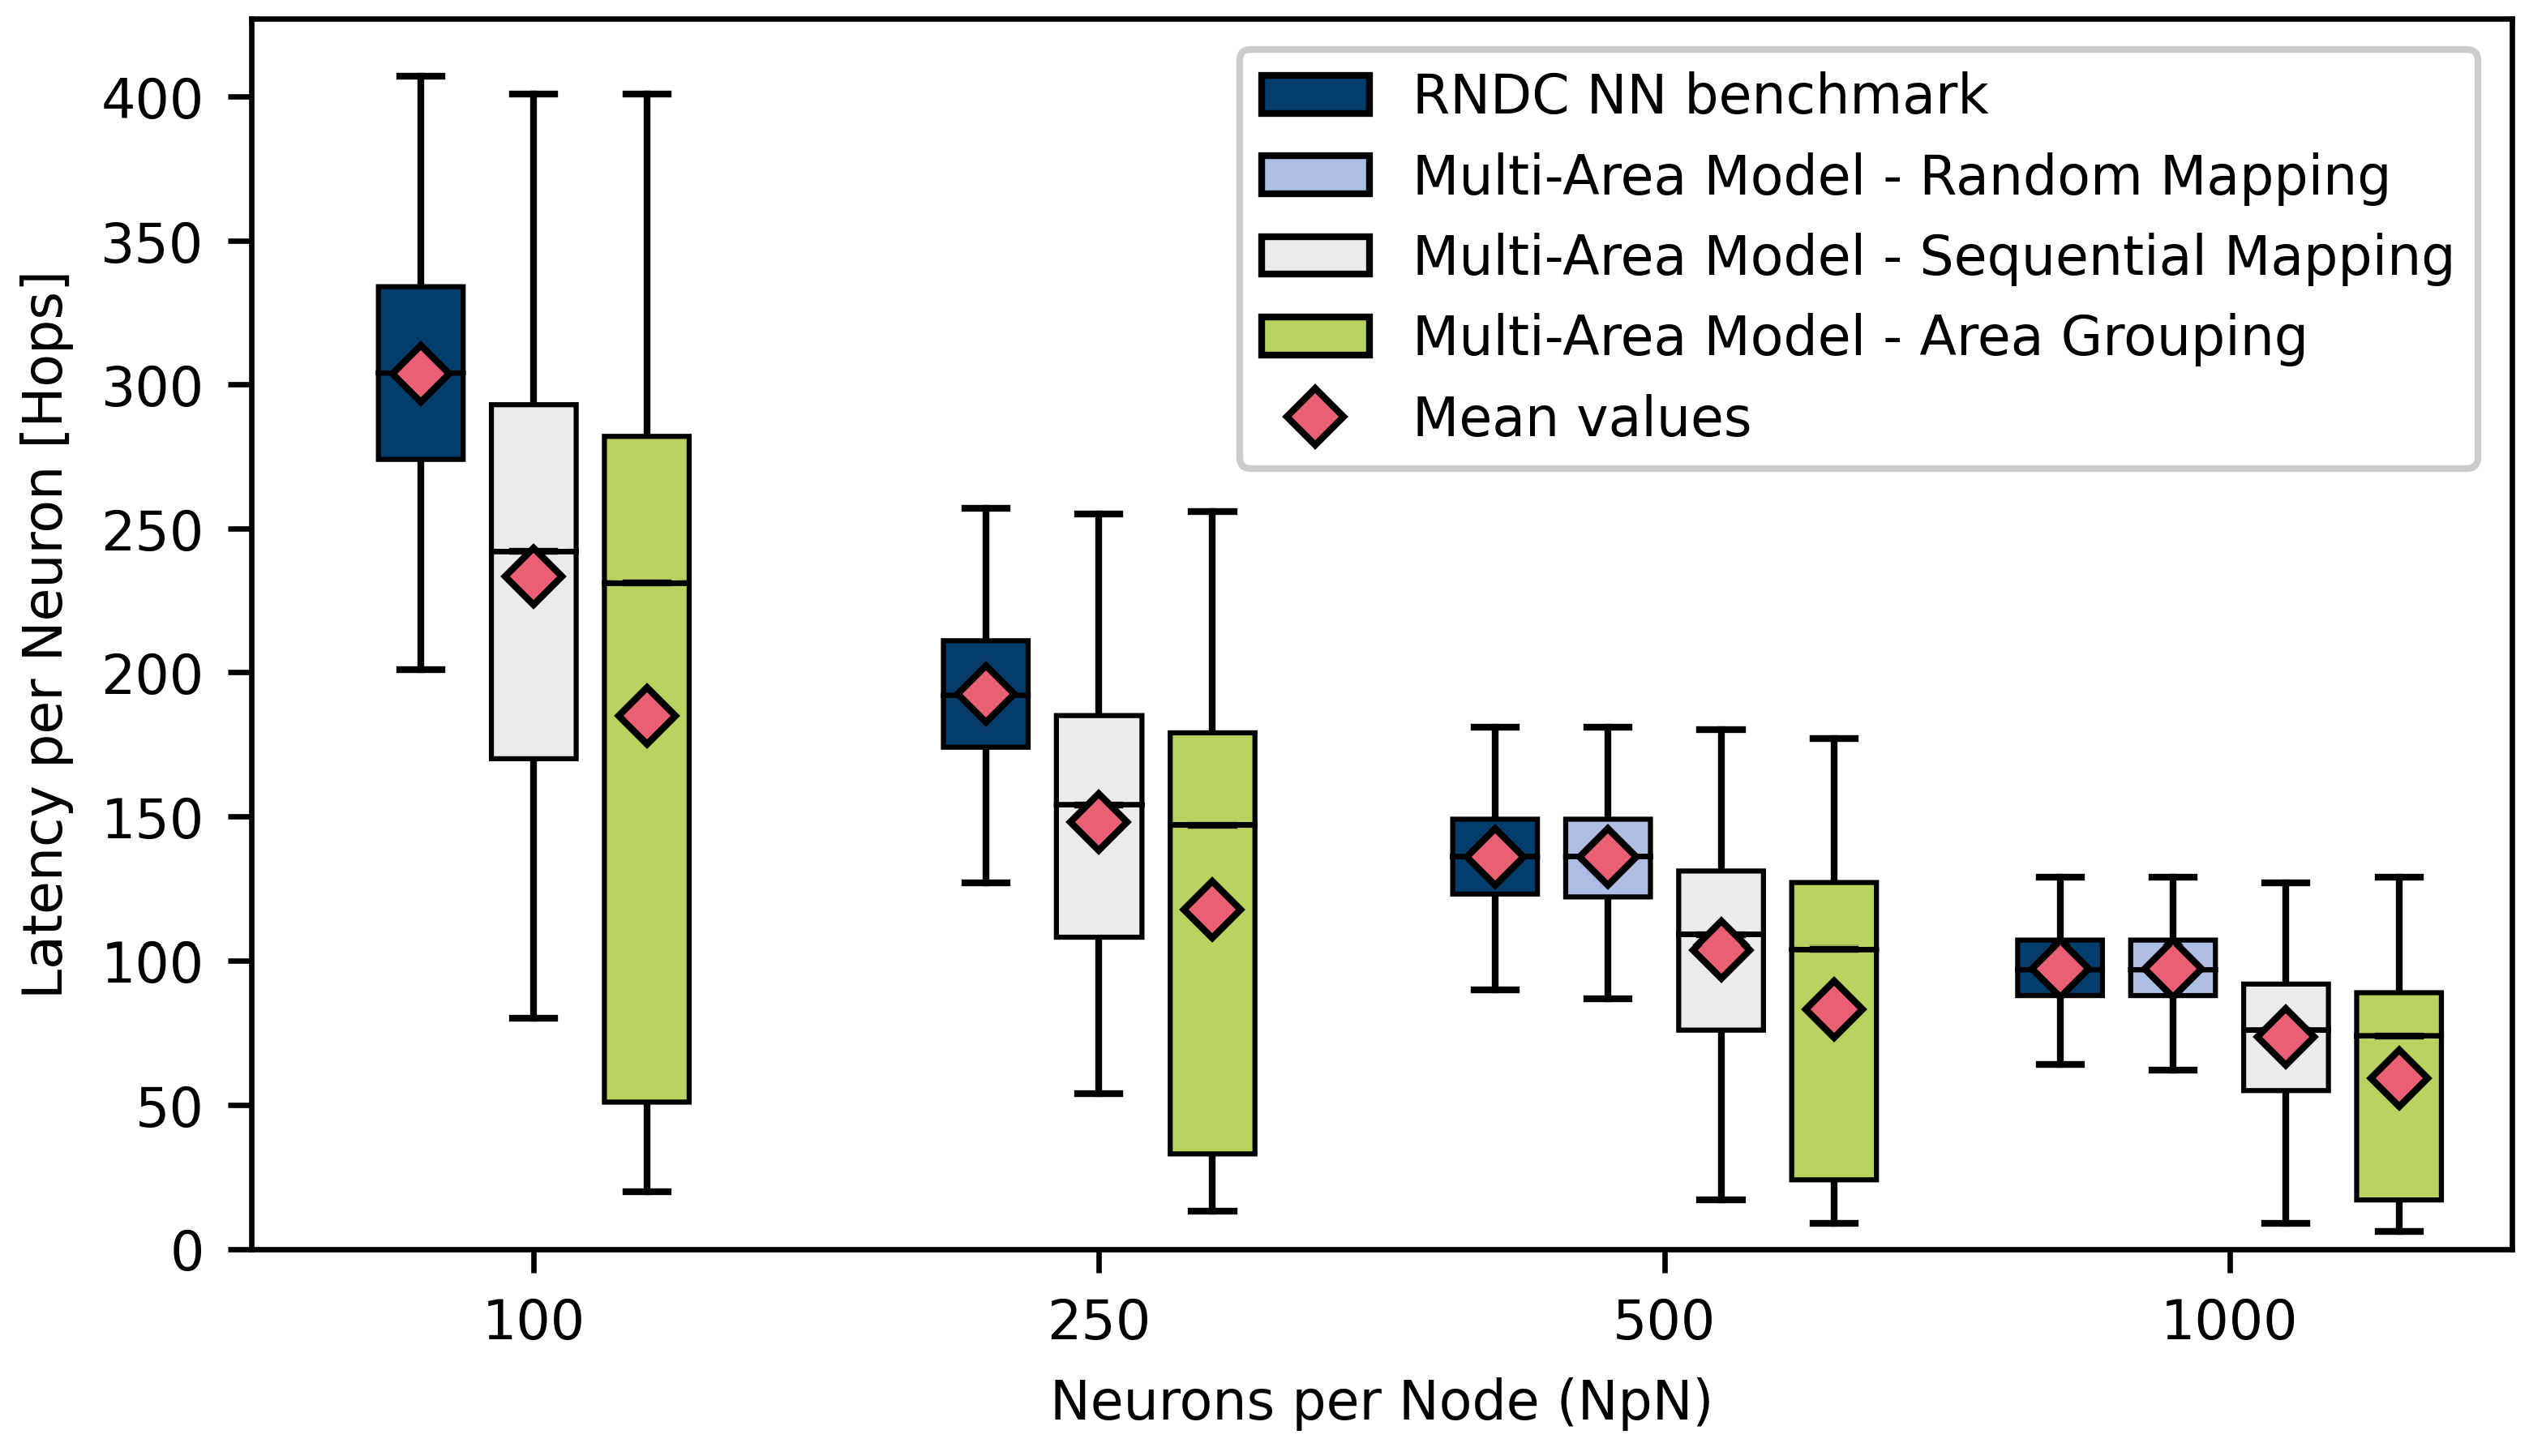
Unlike the smaller microcircuit model, where the latency was hardly affected by the different mappings, at this larger scale, the impact is more pronounced, as shown in Figure 10. Table 2 lists both the average latency and the maximum latency per neuron for the different mapping algorithms and node sizes as well. The maximum latency was still mainly unaffected by the different mapping algorithms. However, the average latency dropped significantly for this large-scale test case. The maximum value is still the critical metric, but the average latency could be important in some scenarios. However, because of the underlying structure present in the multi-area model, there is the potential to reduce the maximum latency for this test case. The long range connections between areas are relatively sparse and the current area grouping algorithm does not consider the inter-area connectivity to determine where to place which area. Placing pairs of areas which do not share any connections in opposite corners would already result in a significant drop in the maximum latency. Generally, latency and network load are related to each other, as a packet which has to travel a shorter distance will not occupy as many links. The potential to improve the latency might also indicate the potential to reduce the network load. However, the optimization of the mapping algorithms lies outside the scope of this work.
As larger nodes, i.e., larger values of NpN, reduce the size of the communication network, the latency can also be expected to reduce. However, the network load shows less dependence on the node size. For MC and for two of the four mapping algorithms with LMC, the network load hardly changed. Only the RNDC benchmark and the randomly mapped test case, which we have shown to be almost equivalent, showed increases in the network load, especially from N p N = 100 to N p N = 500 . From N p N = 500 to N p N = 1000 , the impact that the node size has seems to reduce. Thus, larger node sizes seem to be preferred, as the latency decreases without a significant negative effect on the network load. However, it does increase the complexity of the CUs, which is not considered by the simulator.

5. Summary and Future Work

A Python-based network simulator dedicated to the evaluation of NC communication networks was presented in this paper. It provides an extendable collection of different NN models and communication protocols. We have verified the correctness of the simulator against an existing network model for homogeneous connectivity. We also showed that compared to existing network models and simulators, our implementation offers more details about the distribution of the bandwidth load on a network when homogeneous NNs are analyzed. It reveals an even greater advantage for the torus square mesh over the regular square mesh. To our knowledge, other NC network simulators so far do not address heterogeneous NNs or the network bandwidth loads generated by them. This outstanding capability mandates the use of mapping algorithms so that support for them is included in the simulator. First, we applied the simulator to a small-scale test case, i.e., the microcircuit model, and showed the effect that a rudimentary mapping approach can have on the network’s bandwidth load.
In this extension, we then expanded the analysis of the biologically representative heterogeneous connectivity models by including a large-scale test case, i.e., the multi-area model. The effects previously observed for the small scale test case became even more pronounced for the large-scale test case.
We also took a closer look at the latency of the network and the influence of the node size in this extension. While the maximum latency did not change significantly for different mapping algorithms, an impact could still be observed, even though the mapping algorithms were not yet optimized for latency in any way. The node size itself, on the other hand, had a significant impact on the latency, whereas it only affected networks’ bandwidth loads to a small degree. There was a large influence on the design requirements of the CUs as well, so it seems studying this parameter in more detail in the future will be worthwhile.
According to the simulations, the network loads in heterogeneous connectivity models combined with appropriate mapping schemes differ significantly from the network loads in homogeneous models. This justifies the development of our simulator, since it confirms our assumption that homogeneous connectivity models—and the network models based on them—are not sufficient to analyze the network load in an NC system simulating BNNs. The simulator can be used in further extensions of this research to develop and evaluate more effective (and flexible) mapping solutions.
Our next step is to verify the simulator against actual NC hardware. We will run heterogeneous NNs on systems such as SpiNNaker and BrainScaleS and compare the communication traffic with the network loads estimated by the simulator. Additionally, to determine an appropriate network design for a large scale NC system, different network topologies, communication protocols and NNs will be evaluated qualitatively and quantitatively in our future work.

Supplementary Materials

The following supporting information can be downloaded at: https://www.mdpi.com/article/10.3390/jlpea12020023/s1.

Author Contributions

Conceptualization, R.K.; methodology, R.K.; software, R.K.; validation, R.K.; formal analysis, R.K.; investigation, R.K.; writing—original draft preparation, R.K.; writing—review and editing, M.R. and M.S.; visualization, R.K.; supervision, S.v.W. All authors have read and agreed to the published version of the manuscript.

Funding

This project was funded by the Helmholtz Association Initiative and Networking Fund under project number SO-092 (Advanced Computing Architectures, ACA).

Institutional Review Board Statement

Not applicable.

Informed Consent Statement

Not applicable.

Data Availability Statement

The data presented in this study are available on request from the corresponding author.

Conflicts of Interest

The authors declare no conflict of interest.

Abbreviations

The following abbreviations are used in this manuscript:
ACAAdvanced Computing Architectures
AERAddress event representation
BCBroadcast
BNNBiological neural network
CAMContent addressable memory
CMConnectivity matrix
CUComputational unit
FRFiring rate
LDFRLongest dimension first routing
LMCLocal multicast
LUTLookup table
MCMulticast
NCNeuromorphic computing
NNNeural network
NpNNeurons per node
RNDC NNRandomly connected neural network
SpNSynapses per neuron
UCUnicast
VLSIVery large scale integration

References

  1. Akopyan, F.; Sawada, J.; Cassidy, A.; Alvarez-Icaza, R.; Arthur, J.; Merolla, P.; Imam, N.; Nakamura, Y.; Datta, P.; Nam, G.-J.; et al. TrueNorth: Design and Tool Flow of a 65 MW 1 Million Neuron Programmable Neurosynaptic Chip. IEEE Trans. Comput.-Aided Des. Integr. Circuits Syst. 2015, 34, 1537–1557. [Google Scholar] [CrossRef]
  2. Furber, S.B.; Galluppi, F.; Temple, S.; Plana, L.A. The SpiNNaker Project. Proc. IEEE 2014, 102, 652–665. [Google Scholar] [CrossRef]
  3. Schemmel, J.; Briiderle, D.; Griibl, A.; Hock, M.; Meier, K.; Millner, S. A Wafer-Scale Neuromorphic Hardware System for Large-Scale Neural Modeling. In Proceedings of the 2010 IEEE International Symposium on Circuits and Systems, Paris, France, 30 May–2 June 2010; pp. 1947–1950. [Google Scholar]
  4. Benjamin, B.V.; Gao, P.; McQuinn, E.; Choudhary, S.; Chandrasekaran, A.R.; Bussat, J.-M.; Alvarez-Icaza, R.; Arthur, J.V.; Merolla, P.A.; Boahen, K. Neurogrid: A Mixed-Analog-Digital Multichip System for Large-Scale Neural Simulations. Proc. IEEE 2014, 102, 699–716. [Google Scholar] [CrossRef]
  5. Meier, K. A Mixed-Signal Universal Neuromorphic Computing System. In Proceedings of the 2015 IEEE International Electron Devices Meeting (IEDM), Washington, DC, USA, 7–9 December 2015; pp. 4–6. [Google Scholar]
  6. Forschungszentrum Jülich. Advanced Computing Architectures (ACA) towards Multi-Scale Natural-Density Neuromorphic Computing. Available online: https://www.fz-juelich.de/aca/EN/Home/home_node.html (accessed on 31 January 2022).
  7. Kleijnen, R.; Robens, M.; Schiek, M.; van Waasen, S. A Network Simulator for the Estimation of Bandwidth Load and Latency Created by Heterogeneous Spiking Neural Networks on Neuromorphic Computing Communication Networks. In Proceedings of the 2021 IEEE 14th International Symposium on Embedded Multicore/Many-core Systems-on-Chip (MCSoC), Singapore, 20–23 December 2021; pp. 320–327. [Google Scholar] [CrossRef]
  8. Schmidt, M.; Bakker, R.; Hilgetag, C.C.; Diesmann, M.; van Albada, S.J. Multi-Scale Account of the Network Structure of Macaque Visual Cortex. Brain Struct. Funct. 2018, 223, 1409–1435. [Google Scholar] [CrossRef] [PubMed] [Green Version]
  9. Young, A.R.; Dean, M.E.; Plank, J.S.; Rose, G.S. A Review of Spiking Neuromorphic Hardware Communication Systems. IEEE Access 2019, 7, 135606–135620. [Google Scholar] [CrossRef]
  10. Thakur, C.S.; Molin, J.L.; Cauwenberghs, G.; Indiveri, G.; Kumar, K.; Qiao, N.; Schemmel, J.; Wang, R.; Chicca, E.; Olson Hasler, J.; et al. Large-Scale Neuromorphic Spiking Array Processors: A Quest to Mimic the Brain. Front. Neurosci. 2018, 12, 891. [Google Scholar] [CrossRef] [PubMed]
  11. Vainbrand, D.; Ginosar, R. Scalable Network-on-Chip Architecture for Configurable Neural Networks. Microprocessors and Microsystems 2011, 35, 152–166. [Google Scholar] [CrossRef]
  12. Kauth, K.; Stadtmann, T.; Brandhofer, R.; Sobhani, V.; Gemmeke, T. Communication Architecture Enabling 100x Accelerated Simulation of Biological Neural Networks. In Proceedings of the Workshop on System-Level Interconnect: Problems and Pathfinding Workshop, San Diego, CA, USA, 5 November 2020; pp. 1–8. [Google Scholar]
  13. Potjans, T.C.; Diesmann, M. The Cell-Type Specific Cortical Microcircuit: Relating Structure and Activity in a Full-Scale Spiking Network Model. Cereb. Cortex 2014, 24, 785–806. [Google Scholar] [CrossRef] [PubMed]
  14. Navaridas, J.; Luján, M.; Plana, L.A.; Temple, S.; Furber, S.B. SpiNNaker: Enhanced Multicast Routing. Parallel Comput. 2015, 45, 49–66. [Google Scholar] [CrossRef]
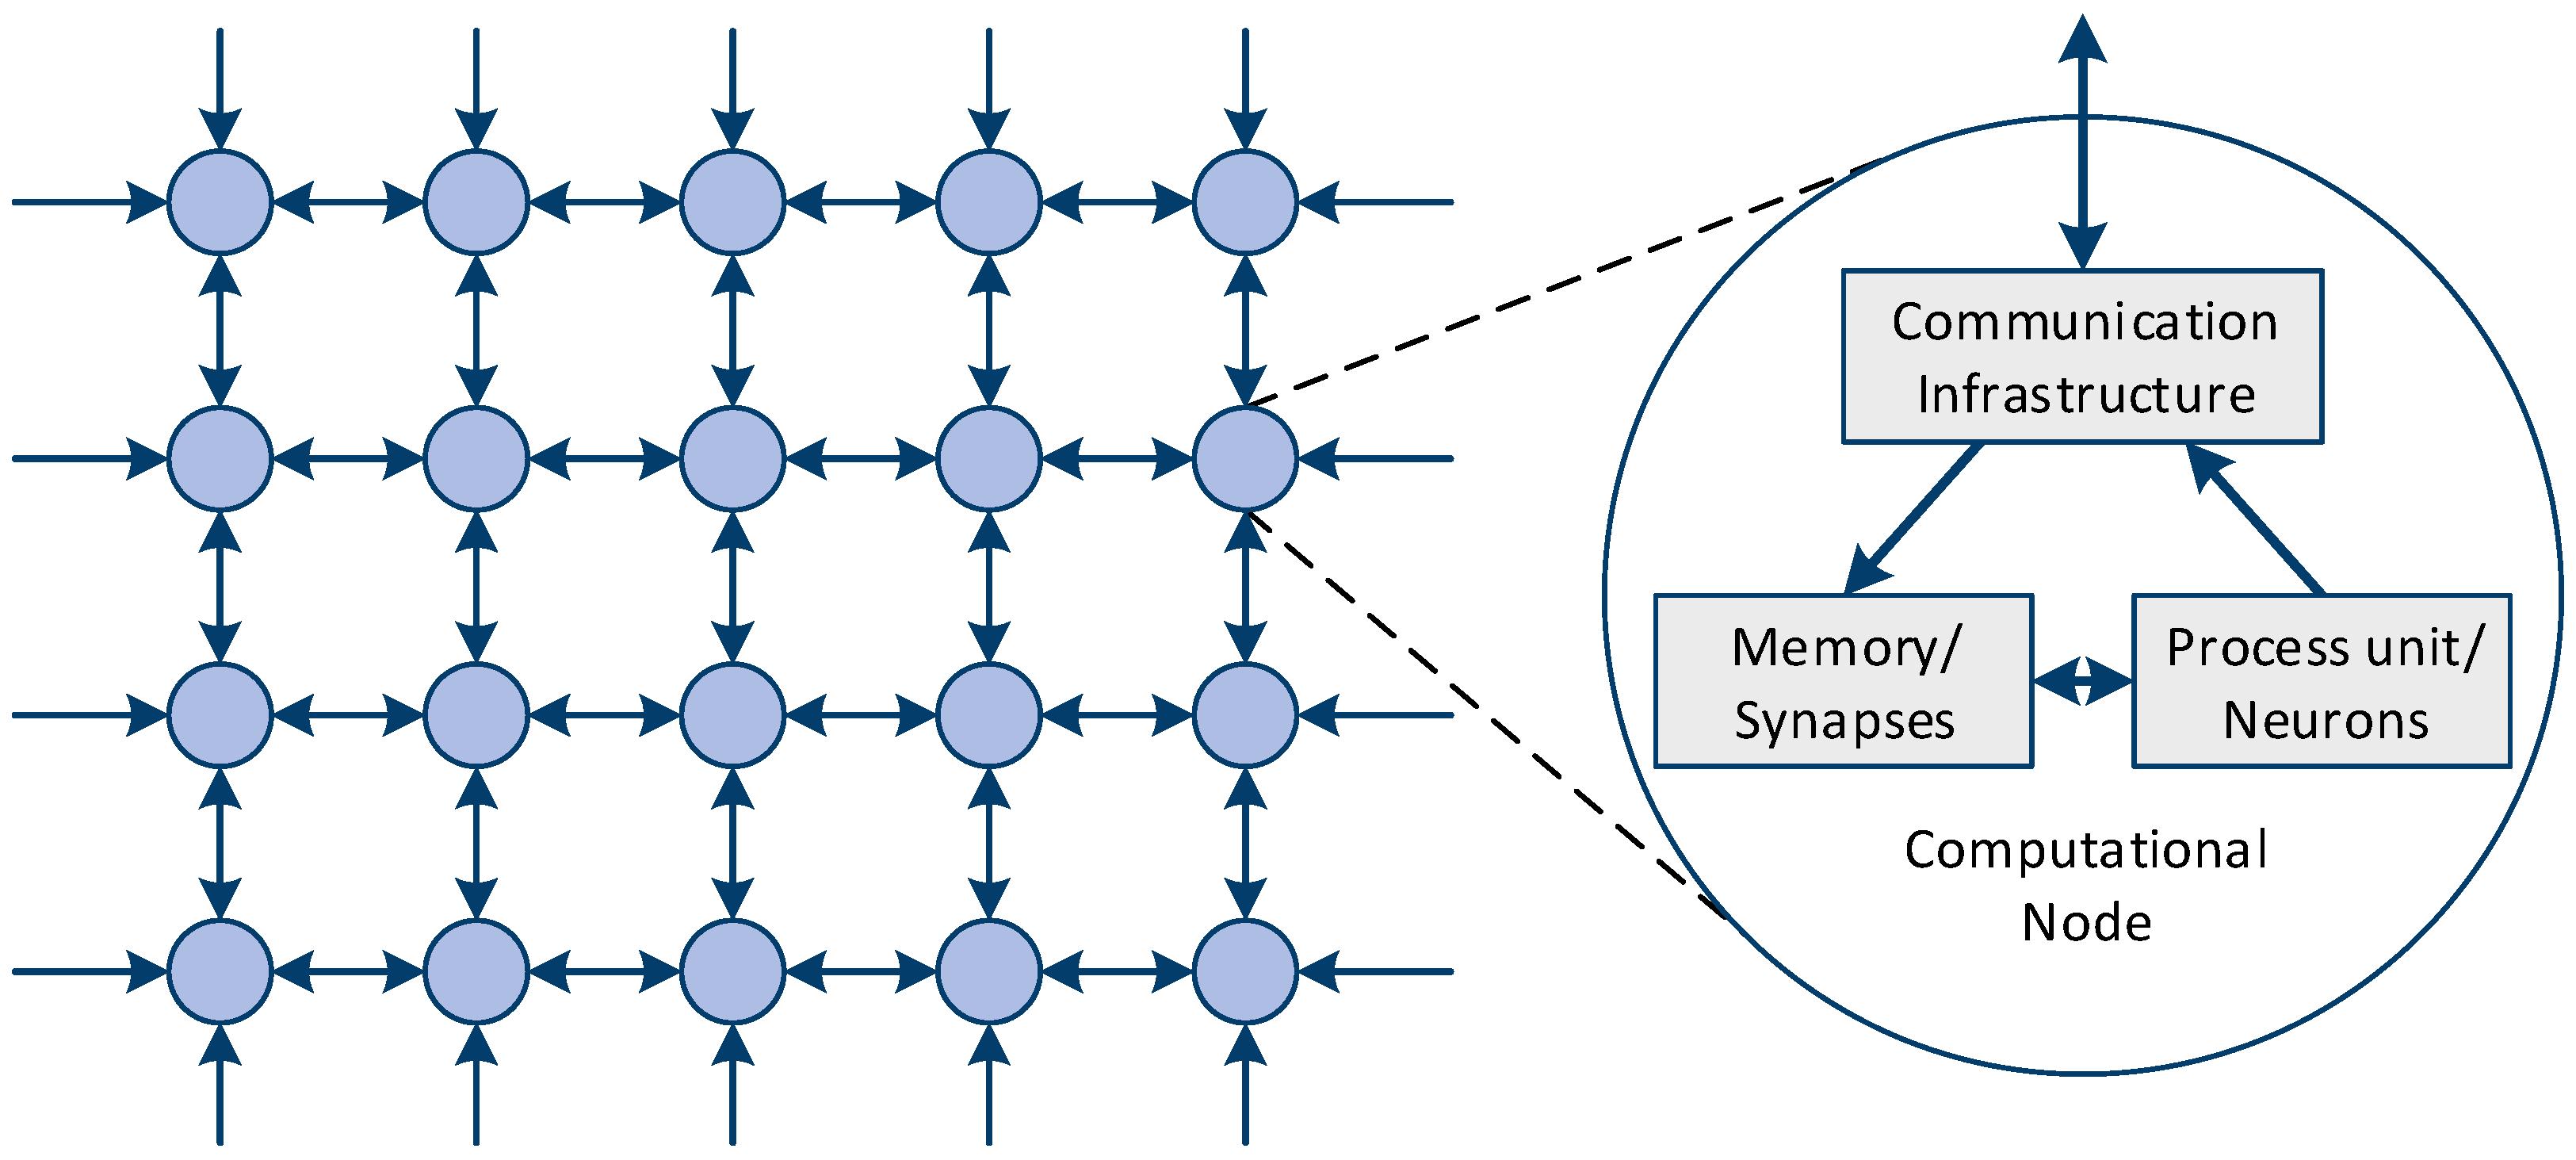
Figure 1. An example of a basic neuromorphic system’s structure, i.e., an interconnected square-mesh system [7].
Jlpea 12 00023 g001
Figure 2. Network load estimation of an RNDC NN on a square mesh for different types of casting, (a) unicast, (b) local multicast, (c) multicast [7].
Jlpea 12 00023 g002
Figure 3. Network load estimation for an RNDC NN on a square torus mesh for different types of casting, (a) unicast, (b) local multicast, (c) multicast [7].
Jlpea 12 00023 g003
Figure 4. Network load over each link for the cortical microcircuit model compared to an RNDC NN of the same size and average connectivity for different types of casting, (a) unicast, (b) local multicast, (c) multicast [7].
Jlpea 12 00023 g004
Figure 5. Sequential mapping of the cortical microcircuit model to a 28 × 28 square mesh network. Different items of the legend correspond to different populations of the microcircuit model [7].
Jlpea 12 00023 g005
Figure 6. Heatmaps of the network load through each node for two differently mapped cortical microcircuit model simulations on a square mesh using UC, (a) random mapping, (b) sequential mapping [7].
Jlpea 12 00023 g006
Figure 7. Latency of the cortical microcircuit model compared to an RNDC NN simulated on a square mesh.
Jlpea 12 00023 g007
Figure 8. Network load of the multi-area model compared to an RNDC NN of the same size and average connectivity simulated on a square mesh for different types of casting, (a) local multicast, (b) multicast.
Jlpea 12 00023 g008
Figure 9. Heatmaps of two differently mapped multi-area model simulations on a square mesh with 500 NpN and LMC: (a) sequential mapping, (b) area grouping.
Jlpea 12 00023 g009
Figure 10. Estimated latency of the multi-area model compared to an RNDC NN of the same size simulated on a square mesh.
Jlpea 12 00023 g010
Table 1. The connection probability matrix of the cortical microcircuit model [13].
Source Population (X)Number of NeuronsTarget Population (Y)
L2/3EL2/3IL4EL4IL5EL5IL6EL6I
L2/3E20,6830.10090.13460.00770.06910.10040.05480.01560.0364
L2/3I58340.16890.13710.00590.00290.06220.02690.00660.0010
L4E21,9150.04370.03160.04970.07940.05050.02570.02110.0034
L4I54790.08180.05150.13500.15970.00570.00220.01660.0005
L5E48500.03230.07550.00670.00330.08310.06000.05720.0277
L5I10650.00.00.00030.00.37260.31580.01970.0080
L6E14,3950.00760.00420.04530.10570.02040.00860.03960.0658
L6I29480.00.00.00.00.00.00.22520.1443
TC9020.00.00.09830.06190.00.00.05120.0196
Table 2. The estimated latency in number of hops in the multi-area simulation runs.
Neurons per Node
1002505001000
RNDC BenchmarkAverage303.808192.428135.94597.2743
Maximum407257181129
Randomly MappedAverage 135.82897.2132
Multi-Area ModelMaximum 181129
Sequentially MappedAverage233.358147.889103.89573.5825
Multi-Area ModelMaximum401255180127
Grouped AreasAverage184.783117.583.311359.1662
Multi-Area ModelMaximum401256177129
Publisher’s Note: MDPI stays neutral with regard to jurisdictional claims in published maps and institutional affiliations.