Trends in Occurrences of Systems Engineering Topics in Literature


Abstract
1. Introduction
2. Background
2.1. What Is Systems Engineering?
2.2. Review of Past Studies
2.3. Contributions of This Study
3. Methodology
3.1. Selection of Topics
3.2. Selection of Sources (Journals)
3.3. Analyses of Journals
4. Results
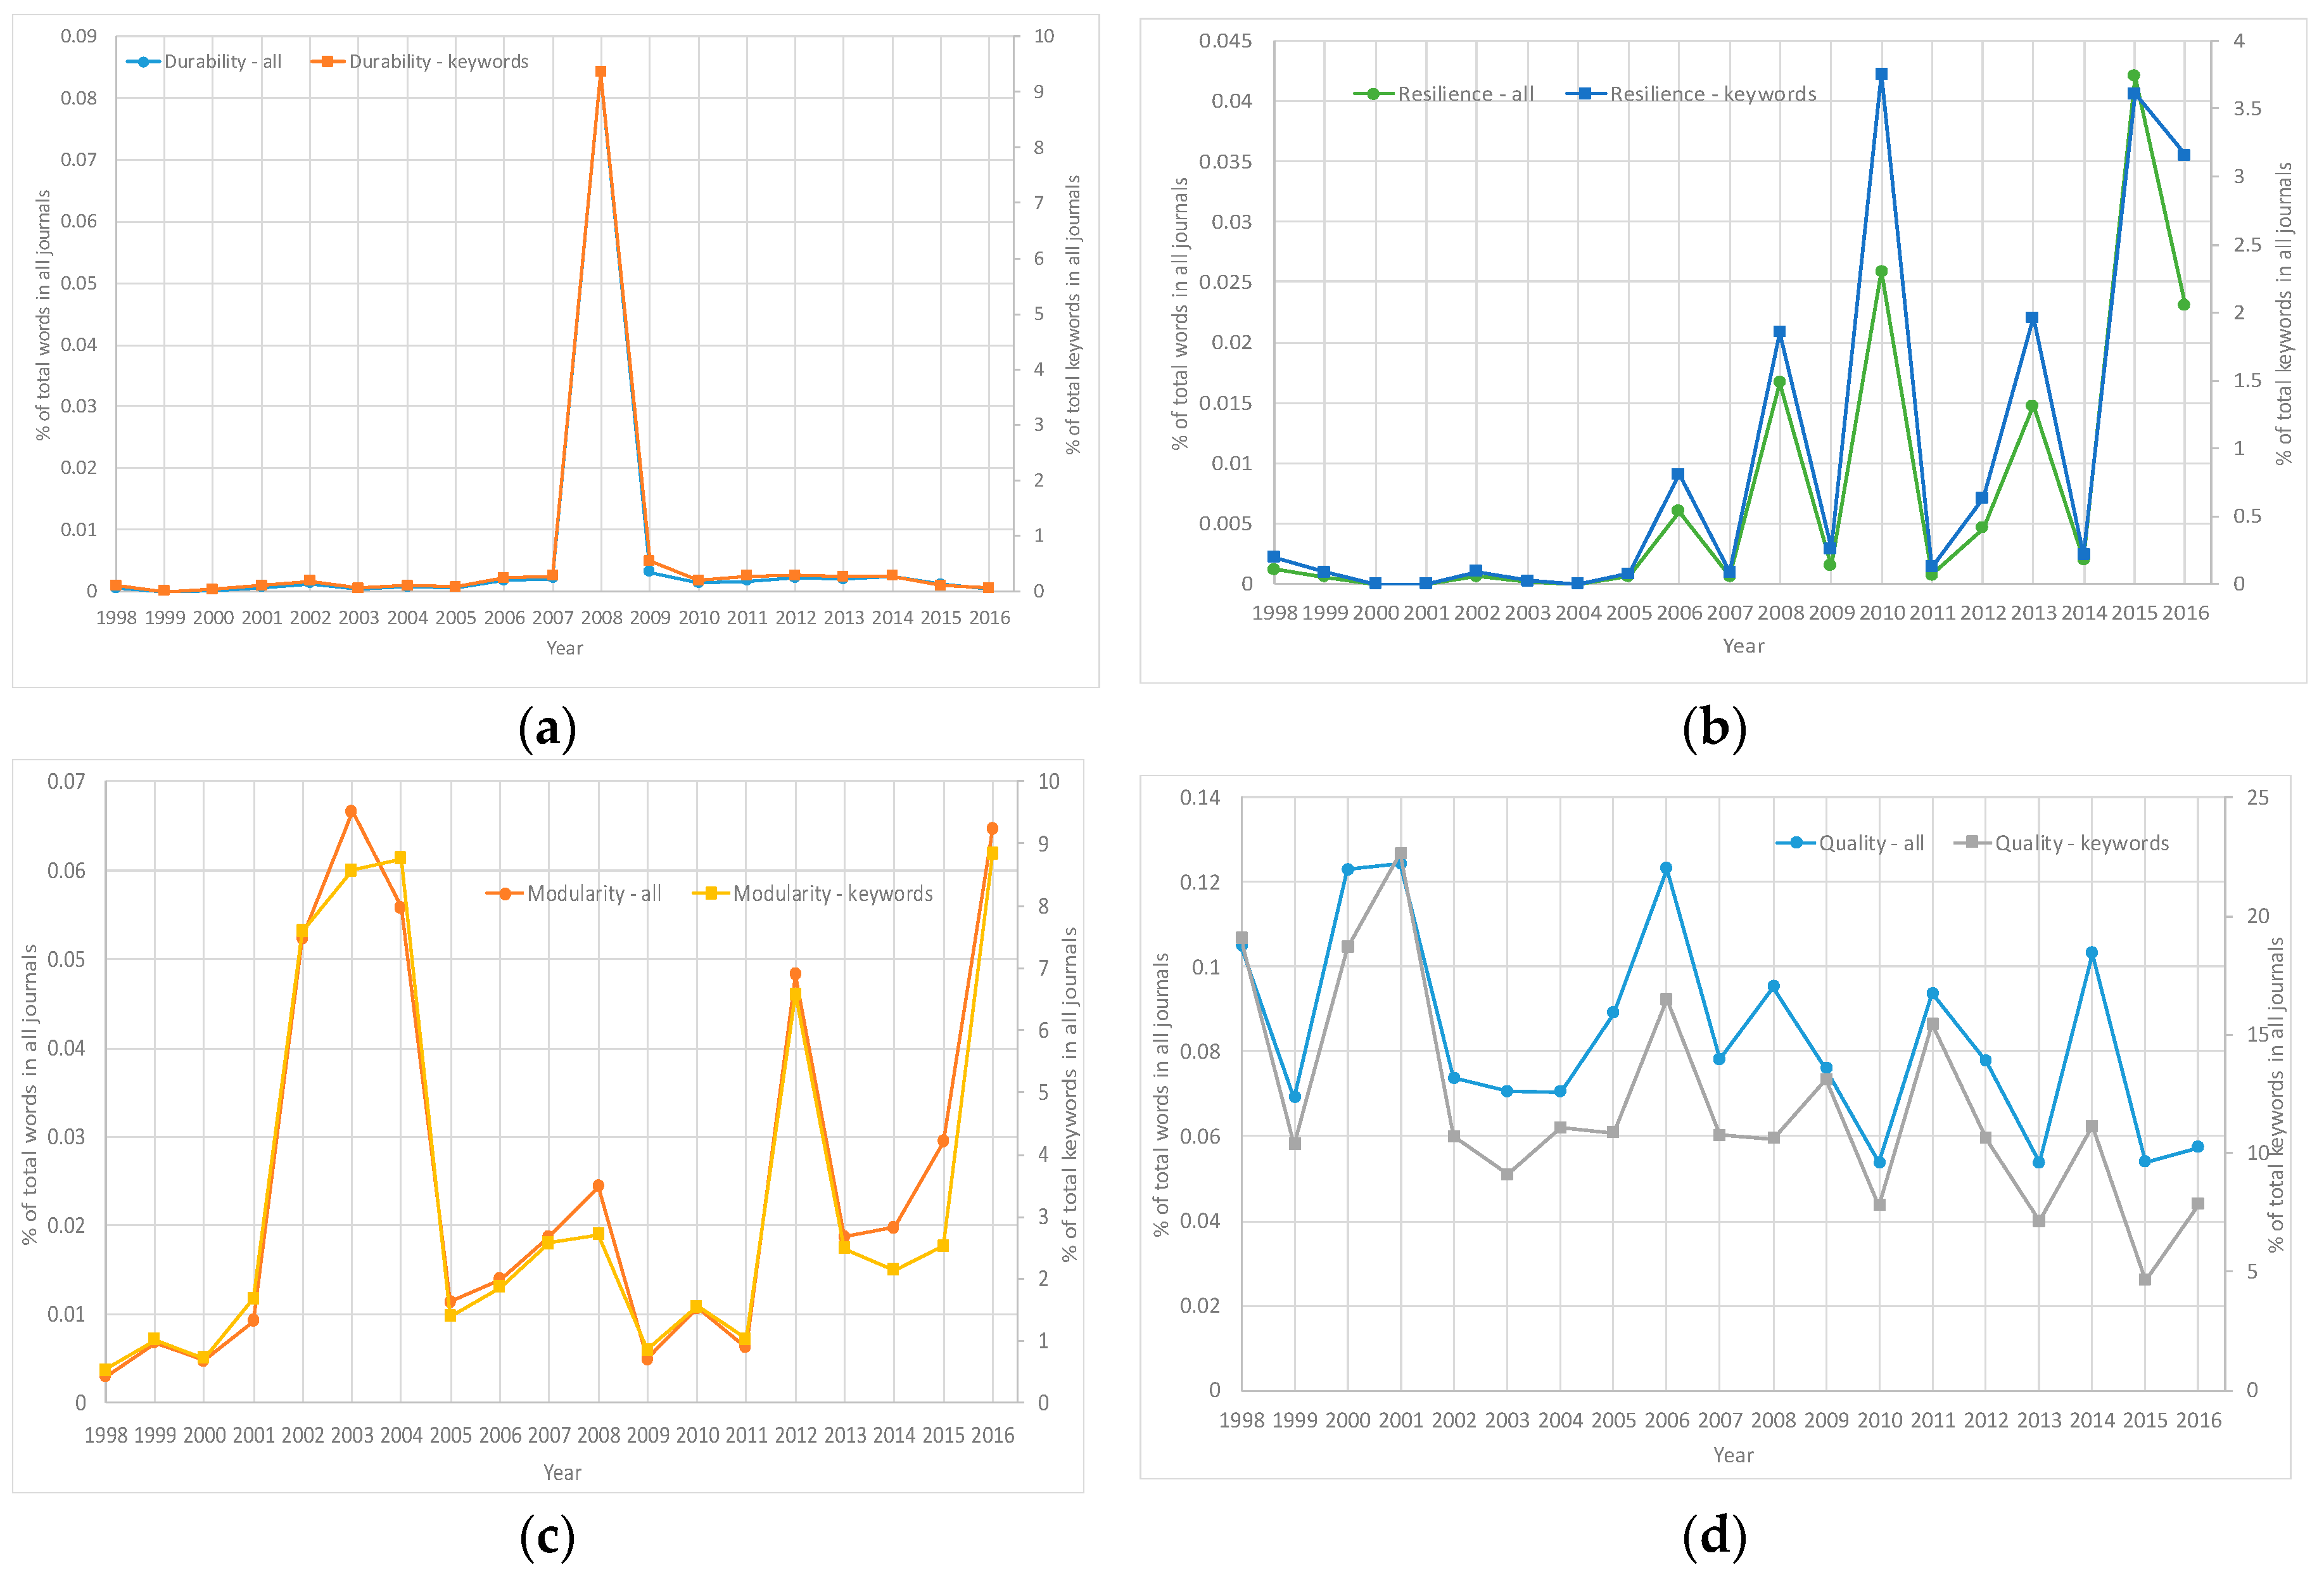
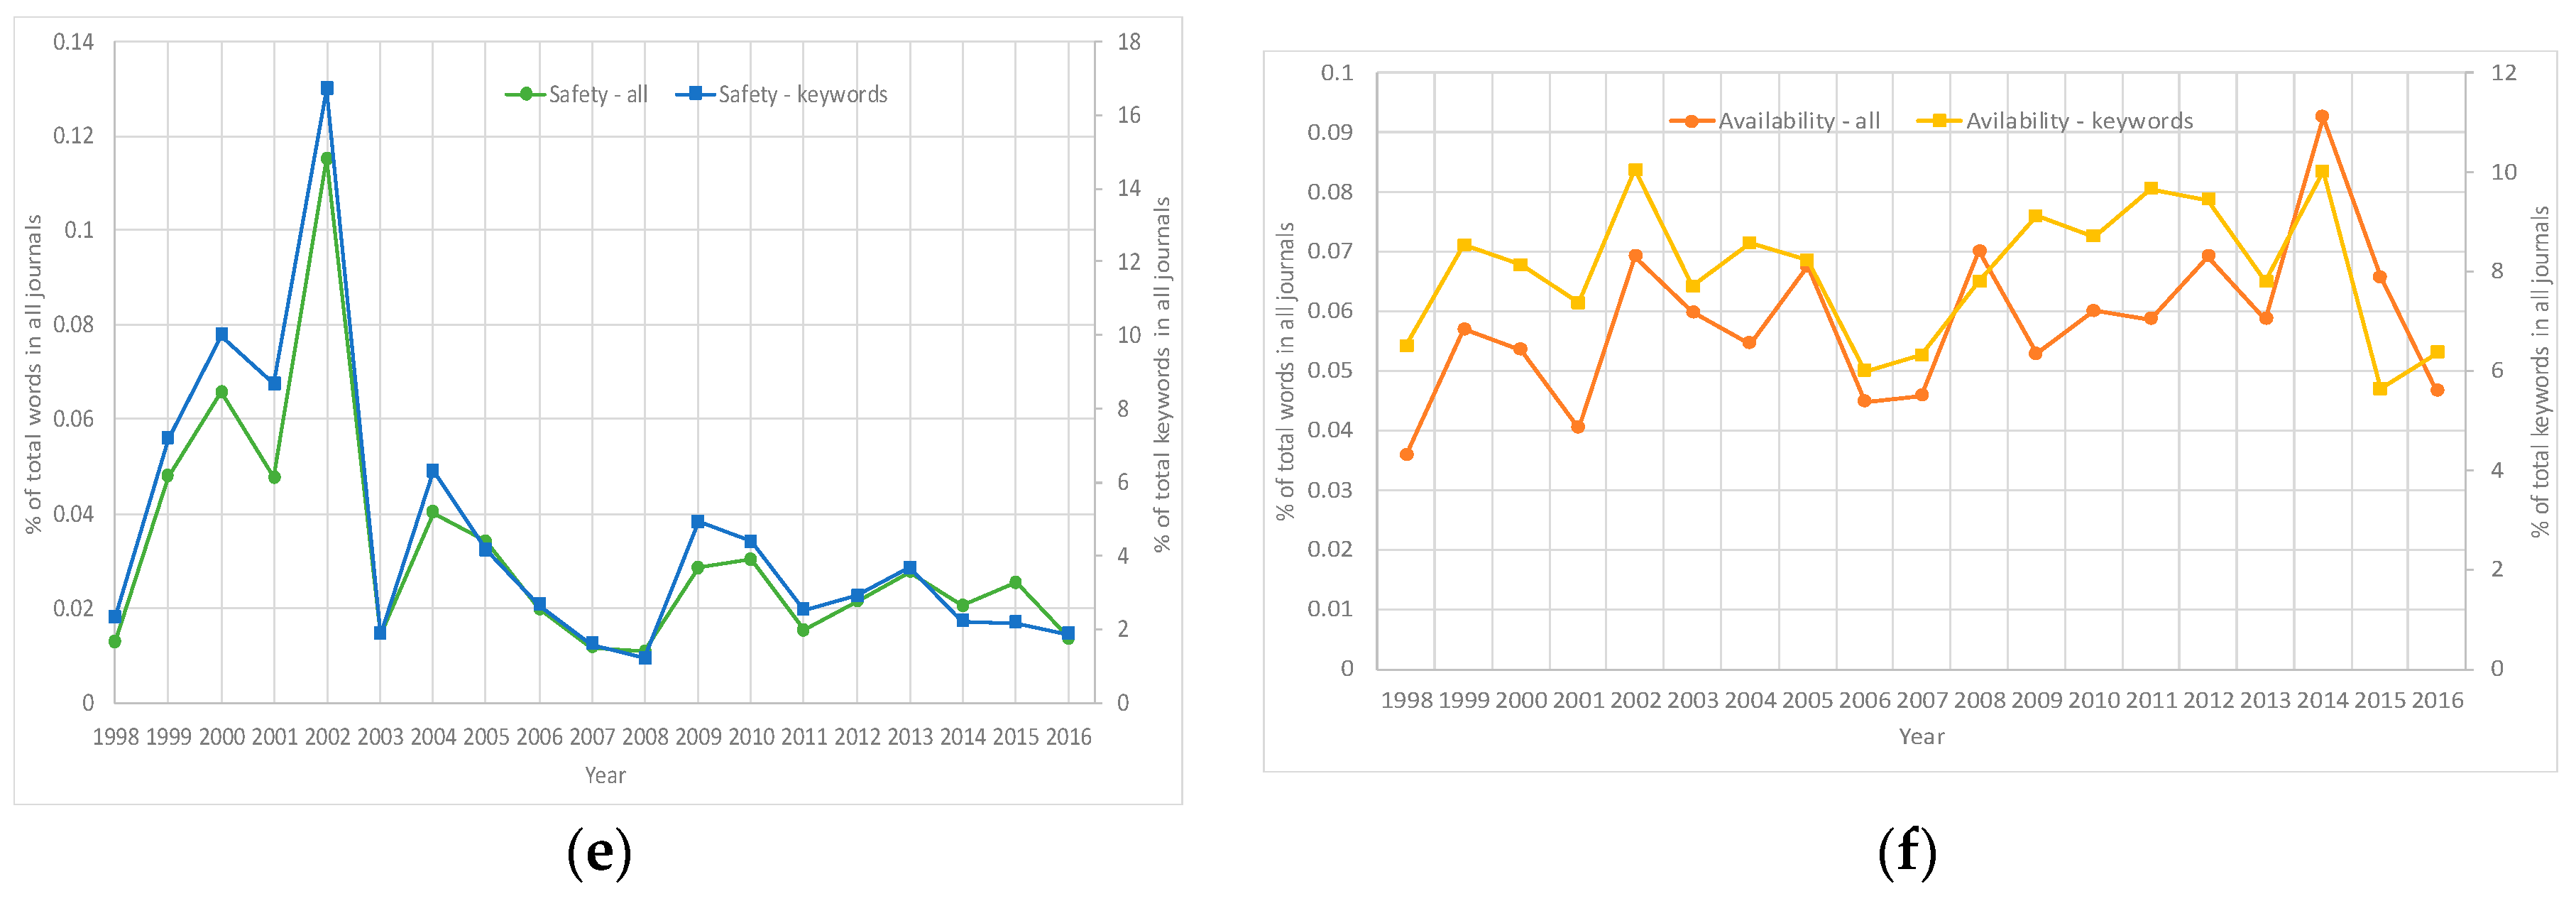
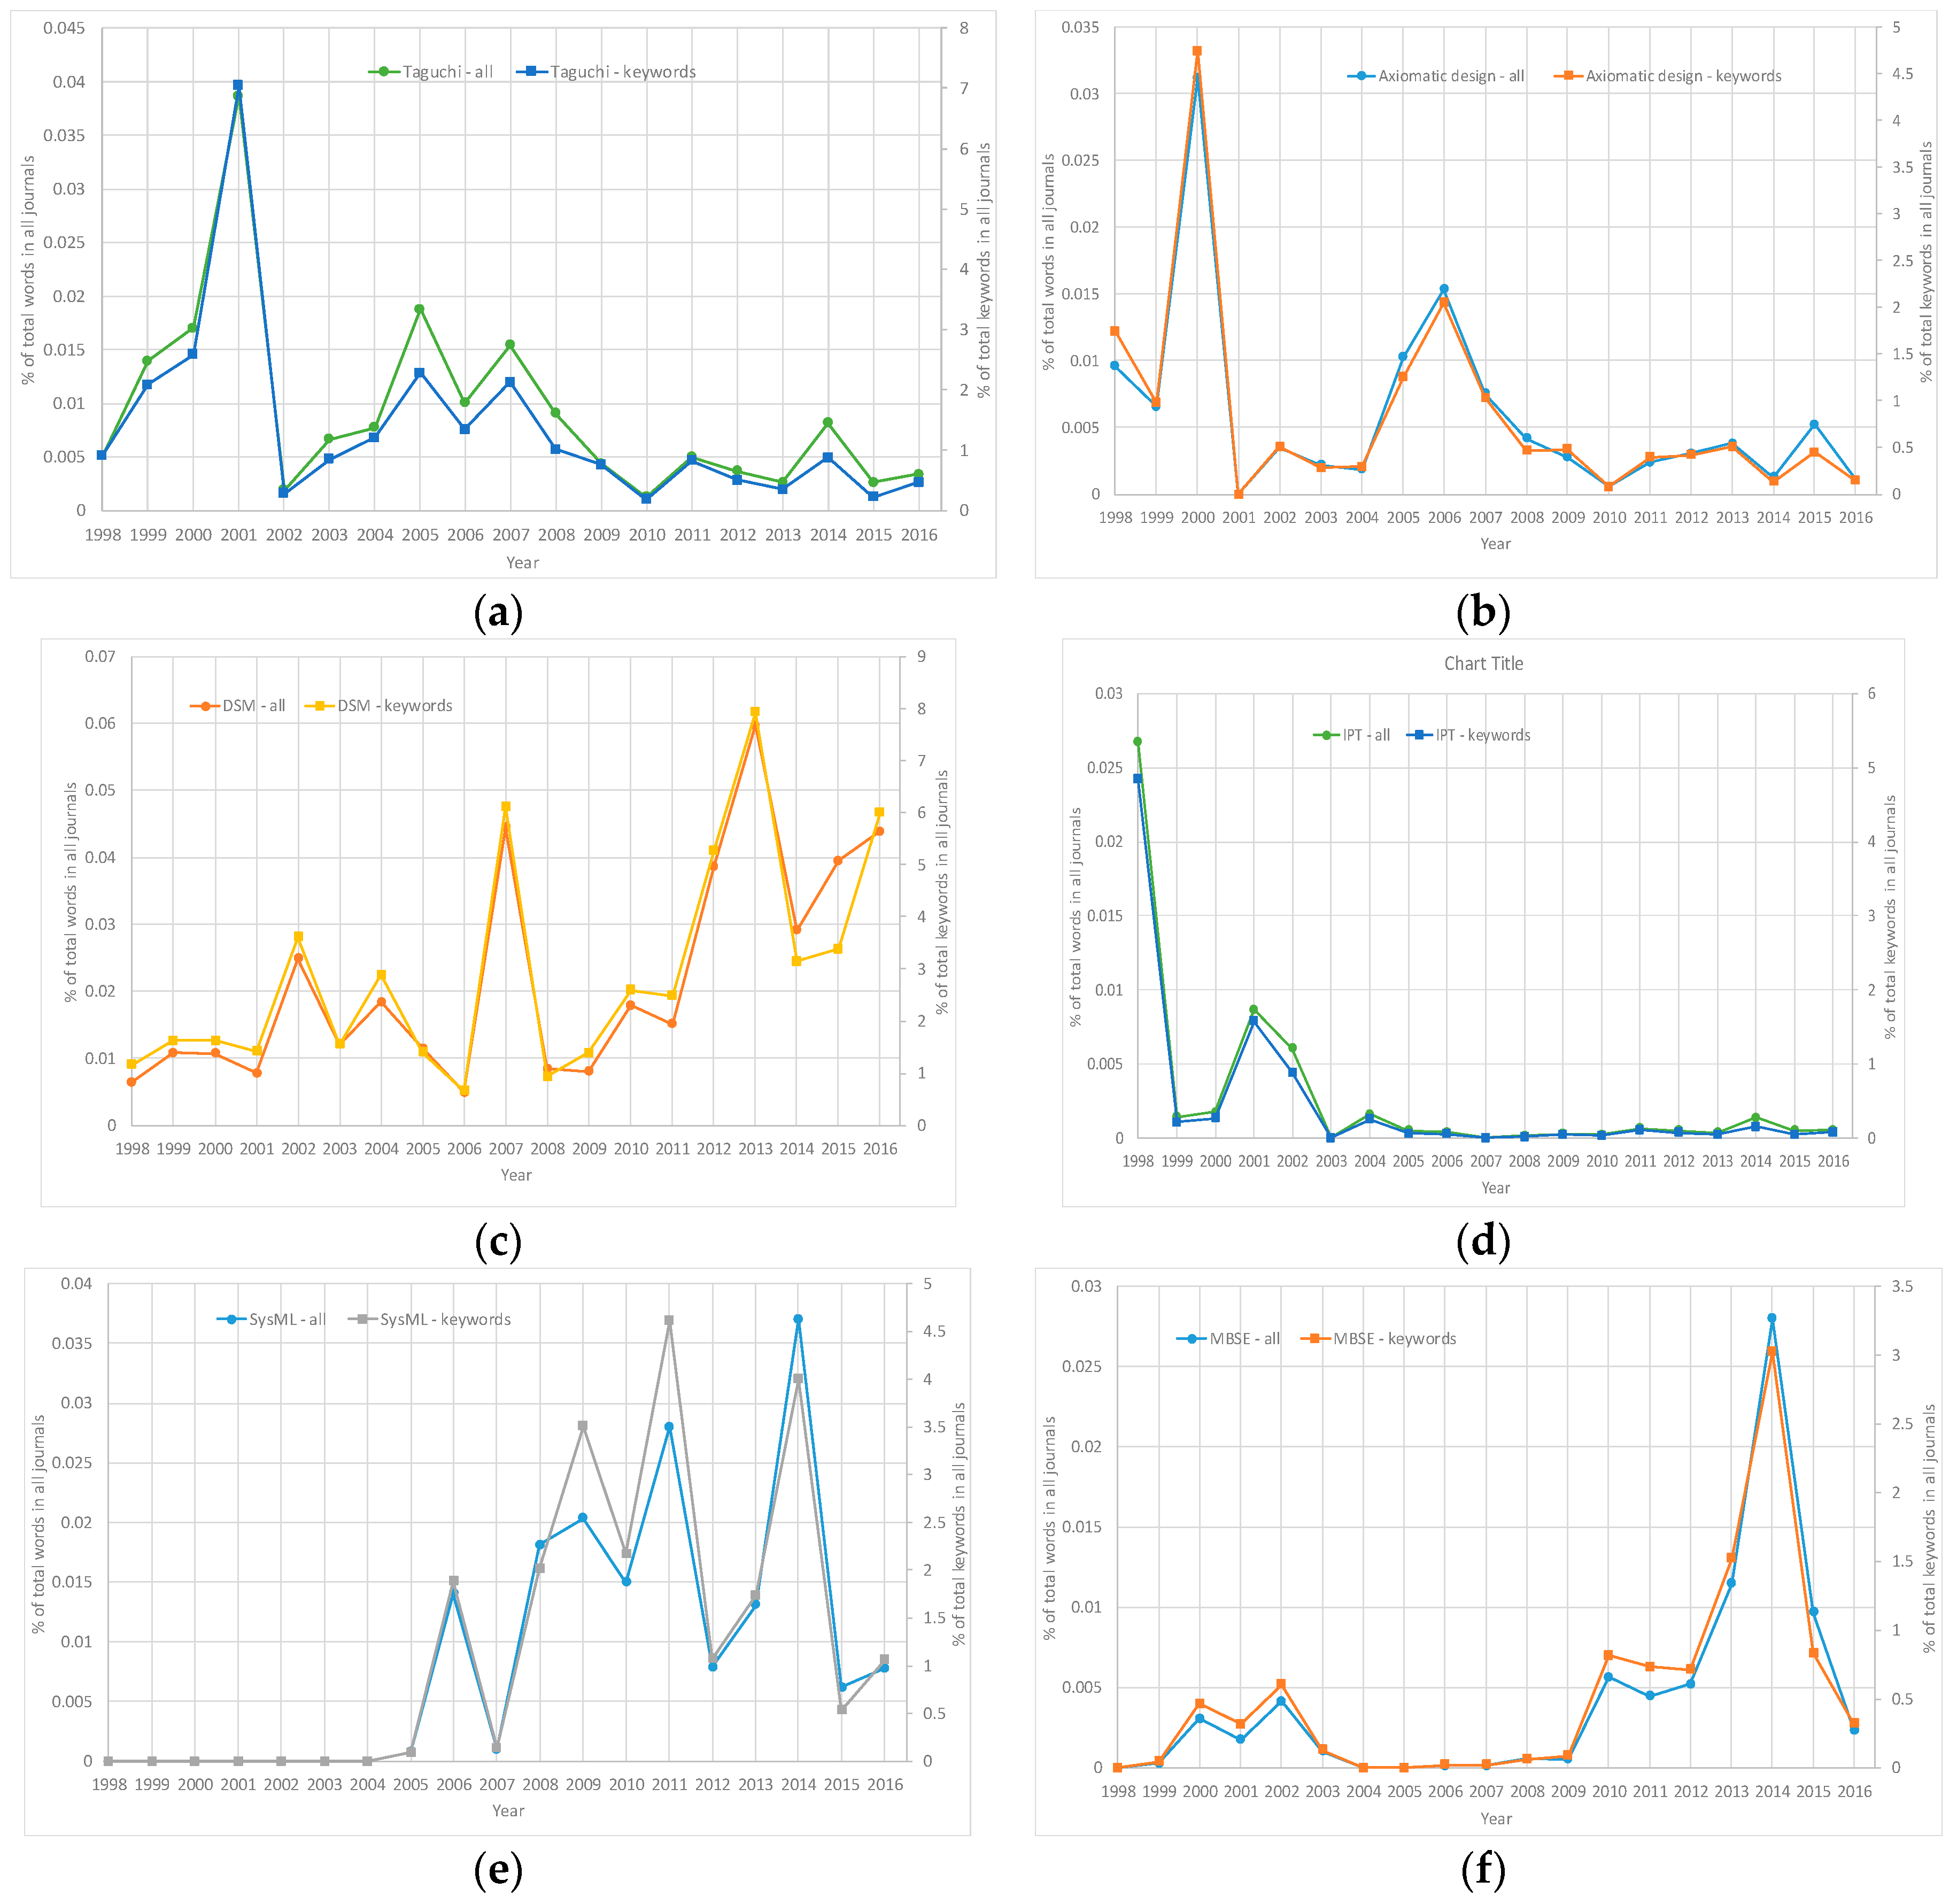
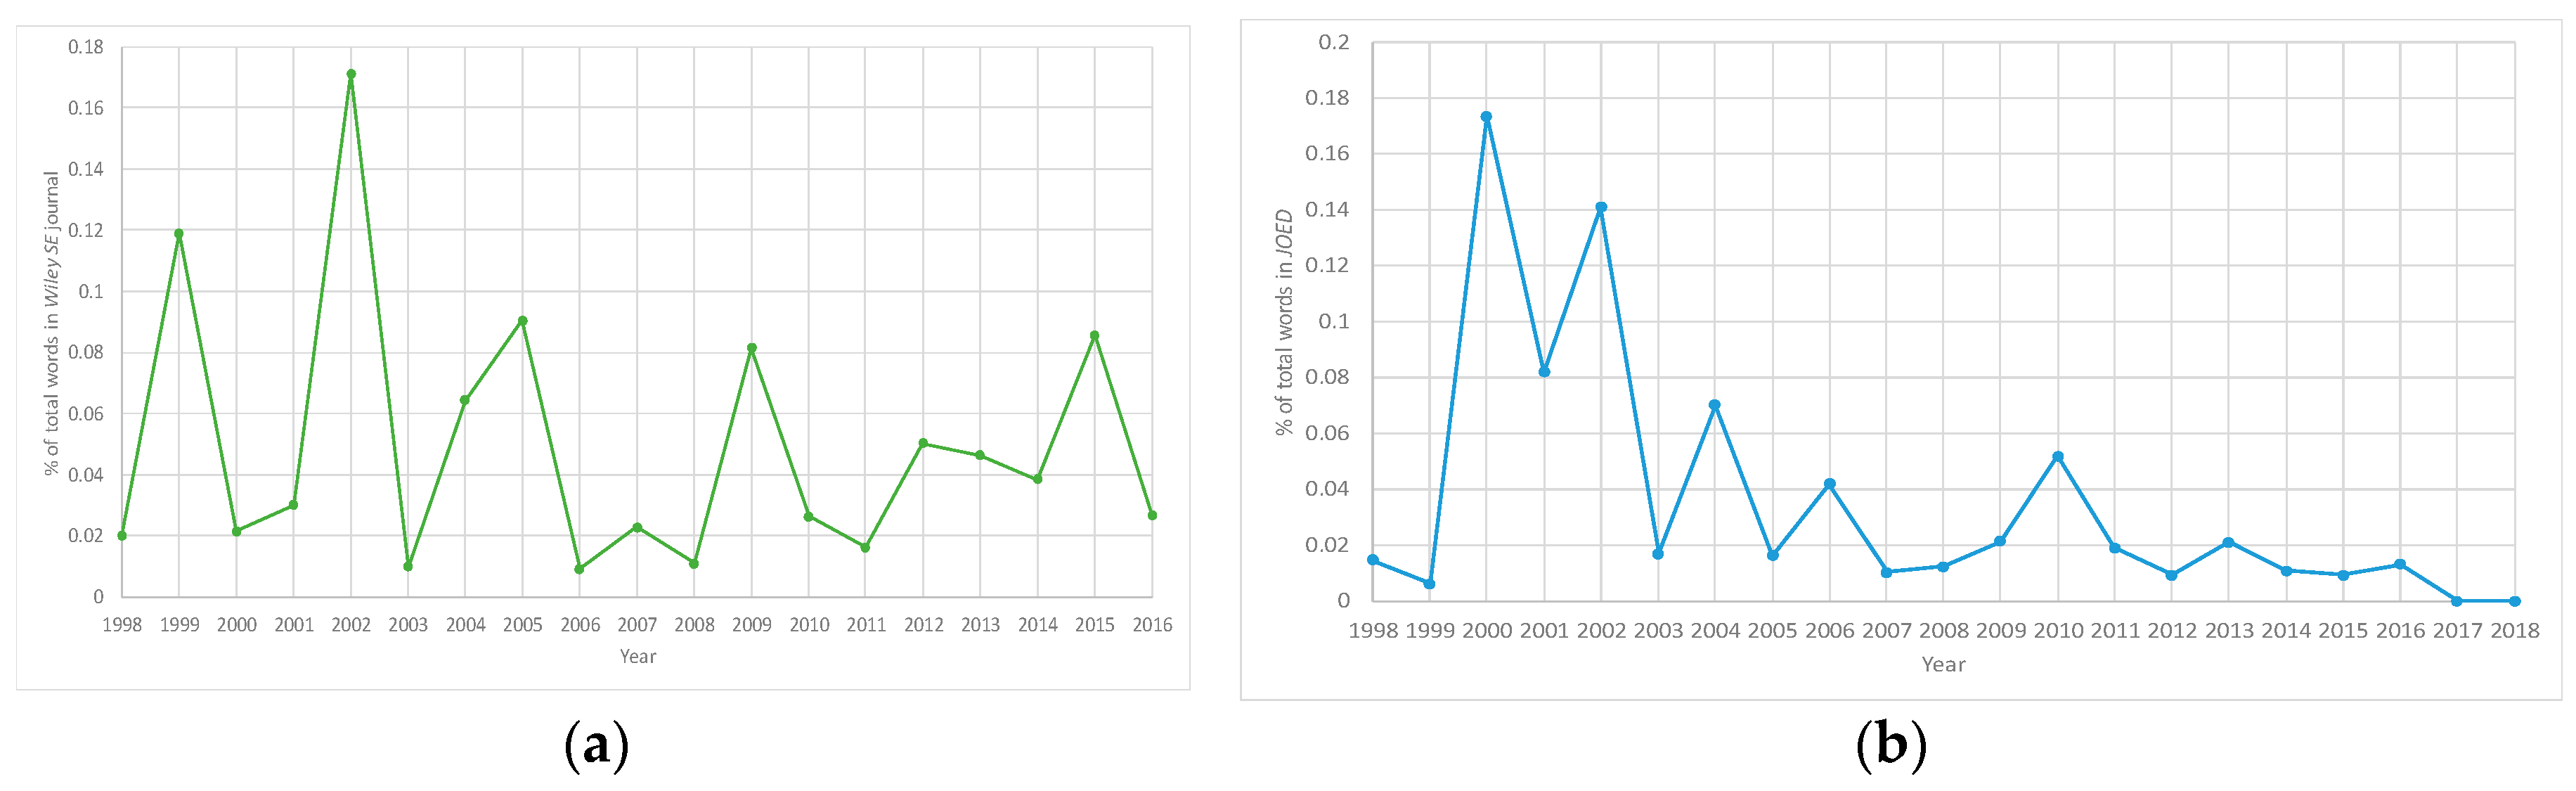
4.1. Frequency Trends
4.2. Rank Ordering and Rank Correlation Metric
4.3. Weighted Average Analysis—Frequencies and Ordering
5. Discussion
5.1. Comparison between Unequal and Equal Weight Analyses
5.2. Evidence of Topics Becoming Less Frequent in Occurrence
5.3. Evidence of Topics Becoming More Frequent in Occurrence
5.4. Differences in Frequencies of Occurrence of Topics between SE and Design Engineering
5.5. Consistency with INCOSE Vision
5.6. Practical Implications of Findings
5.6.1. SE Theory Implications
5.6.2. SE Research Implications
5.6.3. SE Practice Implications
5.7. Limitations
5.7.1. Choice of Journals and Years
5.7.2. Context of Topics in Articles
6. Conclusions and Future Work
6.1. Conclusions
6.2. Future Work
Author Contributions
Funding
Acknowledgments
Conflicts of Interest
Appendix A

| Approach | Keywords |
|---|---|
| Analytical Hierarchy Process (AHP) | “AHP” “Analytic Hierarchy Process” “Analytic Hierarchical Procedure” “Analytical Hierarchy Process” “Analytical Hierarchical Process” “Analytical Hierarchical Procedure” |
| Quality Function Deployment (QFD) | “QFD” “Quality Function Deployment” “House Of Quality” |
| Pugh | “Pugh” |
| Six Sigma | “Six Sigma” “6 Sigma” “6 S” |
| Game Theory | “Games” “Game” |
| Taguchi | “Taguchi” |
| Systems Modeling Language (SysML) | “SysML” “Systems Modeling Language” “Systems Modelling Language” |
| Agile | “Agile” |
| Model-Based Systems Engineering (MBSE) | “Model-Based Systems Engineering” “Model Based Systems Engineering” “MBSE” “Model-Driven Engineering” “Model-Driven Systems Engineering” |
| Lean | “Lean” |
| Value-Driven Design (VDD) | “Value-Driven” “Value-Based” “Value-Centric” “Value-Focused” “Value-Derived” |
| Axiomatic Design | “Axiomatic Design” |
| Utility Theory | “Utility Theory” “SEU” “Expected Utility” |
| Fuzzy Logic | “Fuzzy Logic” “Fuzzy Set Theory” “Fuzzy Sets” “Fuzzy Set” “Fuzzy” |
| Digital Twin | “Digital Twin” “Digital Engineering” “Digital Thread” |
| Optimization | “Optimization” “Optimized” “Optimize” “Optimal” “Optimum” “Optimizer” |
| Failure Modes And Effect Analysis (FMEA) | “Failure Modes And Effects Analysis” “Failure Mode And Effect Analysis” “Failure Mode Effects Analysis” “Failure Modes Effects Analysis” “Failure Mode And Effects Analysis” “Failure Modes And Effects Analysis” “FMEA” “Failure Modes Effects And Criticality Analysis” “FMECA” “Failure Effects And Modes Analysis” “FEMA” |
| Requirements Verification And Traceability Matrix (RVTM) | “Requirements Traceability Matrix” “RTM” “Requirements Verification And Traceability Matrix” “RVTM” “Traceability Matrix” “Trace Matrix” “Verification Requirements Traceability Matrix” “VRTM” |
| Integrated Product Teams (IPT) | “Integrated Product Team” “Integrated Product Teams” “IPT” “IPTs” |
| Risk Matrix | “Risk Matrix” “Risk Assessment Matrix” “Risk Matrices” “Risk Assessment Matrices” |
| N2 Diagram | “N2 Diagram” “N2 Chart” “N-Squared Diagram” “N-Squared Chart” “N2 Matrix” “N*N Matrix” “N*N Diagram” “N*N Chart” “N-Squared Matrix” “Design Structure Matrix” “DSM” “Dependency Structure Matrix” |
| Reliability | “Reliability” |
| Robustness | “Robustness” “Robust” |
| Complexity | “Complexity” “Complex” “Complexities” |
| Maintainability | “Maintainability” “Maintainable” |
| Sustainability | “Sustainability” “Sustainable” |
| Affordability | “Affordability” “Affordable” |
| Availability | “Availability” “Available” |
| Resilience | “Resilience” “Resilient” |
| Adaptability | “Adaptability” “Adaptable” |
| Modularity | “Modularity” “Modular” |
| Quality | “Quality” |
| Durability | “Durability” |
| Manufacturability | “Manufacturability” “Manufacturable” |
| Safety | “Safety” |
| Flexibility | “Flexibility” |
| Scalability | “Scalability” “Scalable” |
| Usability | “Usability” “Usable” |
| Interoperability | “Interoperability” “Interoperable” |
| Testability | “Testability” “Testable” |
| Extensibility | “Extensibility” “Extensible” |
| Agility | “Agility” |
| Repairability | “Repairability” “Repairable” |
| Evolvability | “Evolvability” “Evolvable” |
| Modifiability | “Modifiability” “Modifiable” |
| Journal | Wiley SE | SS & SE | JOED | RED | |
|---|---|---|---|---|---|
| Year | |||||
| 1998 | 17 | 0 | 12 | 16 | |
| 1999 | 21 | 0 | 24 | 17 | |
| 2000 | 20 | 0 | 23 | 19 | |
| 2001 | 24 | 0 | 25 | 4 | |
| 2002 | 27 | 0 | 26 | 11 | |
| 2003 | 21 | 34 | 24 | 10 | |
| 2004 | 24 | 27 | 34 | 12 | |
| 2005 | 25 | 29 | 33 | 15 | |
| 2006 | 21 | 34 | 33 | 14 | |
| 2007 | 21 | 32 | 37 | 10 | |
| 2008 | 24 | 31 | 35 | 15 | |
| 2009 | 19 | 27 | 34 | 18 | |
| 2010 | 28 | 25 | 36 | 22 | |
| 2011 | 30 | 29 | 40 | 17 | |
| 2012 | 35 | 25 | 52 | 20 | |
| 2013 | 35 | 28 | 39 | 29 | |
| 2014 | 32 | 25 | 16 | 22 | |
| 2015 | 43 | 22 | 21 | 19 | |
| 2016 | 36 | 27 | 25 | 23 | |
| Journal | Wiley SE | SS & SE | JOED | RED | |
|---|---|---|---|---|---|
| Year | |||||
| 1998 | 185,683 | 0 | 41,485 | 147,291 | |
| 1999 | 135,381 | 0 | 67,109 | 149,015 | |
| 2000 | 153,768 | 0 | 151,128 | 153,147 | |
| 2001 | 150,339 | 0 | 145,372 | 50,684 | |
| 2002 | 103,878 | 0 | 109,295 | 100,404 | |
| 2003 | 151,403 | 134,406 | 118,044 | 94,889 | |
| 2004 | 185,013 | 216,017 | 227,277 | 122,909 | |
| 2005 | 199,979 | 219,183 | 235,908 | 122,909 | |
| 2006 | 195,501 | 215,576 | 237,280 | 147,894 | |
| 2007 | 205,864 | 218,106 | 242,542 | 119,126 | |
| 2008 | 211,034 | 136,972 | 246,702 | 143,766 | |
| 2009 | 177,934 | 176,316 | 291,501 | 151,027 | |
| 2010 | 251,685 | 119,341 | 334,643 | 181,761 | |
| 2011 | 284,611 | 214,530 | 371,521 | 207,904 | |
| 2012 | 306,817 | 139,207 | 494,359 | 229,333 | |
| 2013 | 317,529 | 119,546 | 402,176 | 313,292 | |
| 2014 | 305,437 | 78,750 | 176,858 | 236,029 | |
| 2015 | 123,742 | 233,196 | 215,512 | 232,990 | |
| 2016 | 371,174 | 218,225 | 276,621 | 251,775 | |
| Journal | Wiley SE | SS & SE | JOED | RED | |
|---|---|---|---|---|---|
| Year | |||||
| 1998 | 1077 | 0 | 291 | 697 | |
| 1999 | 959 | 0 | 422 | 963 | |
| 2000 | 710 | 0 | 1234 | 1070 | |
| 2001 | 881 | 0 | 798 | 224 | |
| 2002 | 854 | 0 | 976 | 332 | |
| 2003 | 919 | 1624 | 869 | 463 | |
| 2004 | 1656 | 1054 | 1709 | 366 | |
| 2005 | 1598 | 1332 | 2274 | 1181 | |
| 2006 | 1190 | 1660 | 2361 | 736 | |
| 2007 | 1915 | 1160 | 1704 | 922 | |
| 2008 | 1885 | 1655 | 2409 | 693 | |
| 2009 | 1300 | 1180 | 1537 | 600 | |
| 2010 | 1779 | 1101 | 2065 | 1177 | |
| 2011 | 2479 | 1274 | 1634 | 1164 | |
| 2012 | 2008 | 1778 | 3597 | 1188 | |
| 2013 | 2737 | 1362 | 3463 | 1112 | |
| 2014 | 3055 | 1727 | 1006 | 1589 | |
| 2015 | 4080 | 2055 | 1697 | 1559 | |
| 2016 | 3511 | 1250 | 1819 | 1592 | |
References
- Haskins, C.; Forsberg, K.; Krueger, M.; Walden, D.; Hamelin, D. Systems Engineering Handbook; INCOSE: San Diego, CA, USA, 2006. [Google Scholar]
- Royce, W.W. Managing the development of large software systems: Concepts and techniques. In Proceedings of the 9th International Conference on Software Engineering, Monterey, CA, USA, 30 March–2 April 1987; pp. 328–338. [Google Scholar]
- Boehm, B.W. A spiral model of software development and enhancement. Computer 1988, 21, 61–72. [Google Scholar] [CrossRef]
- Griffin, M.D. How do we fix systems engineering? In Proceedings of the 61st International Astronautical Congress, Prague, Czech Republic, 27 September–1 October 2010; pp. 1–9. [Google Scholar]
- Hazelrigg, G.A. Systems Engineering: An Approach to Information-Based Design; Prentice Hall: Upper Saddle River, NJ, USA, 1996. [Google Scholar]
- Nuseibeh, B.; Easterbrook, S. Requirements engineering: A roadmap. In Proceedings of the Conference on the Future of Software Engineering, Limerick, Ireland, 4–11 June 2000; pp. 35–46. [Google Scholar]
- Collopy, P.D.; Hollingsworth, P.M. Value-driven design. J. Aircr. 2011, 48, 749–759. [Google Scholar] [CrossRef]
- Collopy, P.; Bloebaum, C.; Mesmer, B.; Green, L. The distinct and interrelated roles of value-driven design, multidisciplinary design optimization, and decision analysis. In Proceedings of the 12th AIAA Aviation Technology, Integration, and Operations (ATIO) Conference and 14th AIAA/ISSMO Multidisciplinary Analysis and Optimization Conference, Indianapolis, Indiana, 17–19 September 2012; p. 5575. [Google Scholar]
- Delligatti, L. SysML Distilled: A Brief Guide to the Systems Modeling Language; Addison-Wesley: Boston, MA, USA, 2013. [Google Scholar]
- Friedenthal, S.; Moore, A.; Steiner, R. A Practical Guide to SysML: The Systems Modeling Language; Morgan Kaufmann: Burlington, MA, USA, 2014. [Google Scholar]
- Sobieszczanski-Sobieski, J. Multidisciplinary design optimization: An emerging new engineering discipline. In Advances in Structural Optimization; Springer: Berlin, Germany, 1995; pp. 483–496. [Google Scholar]
- Sobieszczanski-Sobieski, J.; Haftka, R.T. Multidisciplinary aerospace design optimization: Survey of recent developments. Struct. Optim. 1997, 14, 1–23. [Google Scholar] [CrossRef]
- Chapanis, A.; Garner, W.R.; Morgan, C.T. Applied Experimental Psychology: Human Factors in Engineering Design; John Wiley & Sons Inc.: Hoboken, NJ, USA, 1949. [Google Scholar]
- Sage, A.P.; Rouse, W.B. Handbook of Systems Engineering and Management; John Wiley & Sons: Hoboken, NJ, USA, 2009. [Google Scholar]
- Tilbury, “Dear Colleague Letter: Announcing Creation of the Engineering Design and Systems Engineering (EDSE) Program which Merges and Replaces the Engineering and Systems Design (ESD), System Science (SYS), and Design of Engineering Material Systems (DEMS) Programs”, National Science Foundation, 26-Sep-2017. Available online: https://www.nsf.gov/pubs/2017/nsf17146/nsf17146.jsp (accessed on 28 May 2019).
- Wasson, C.S. System Engineering Analysis, Design, and Development: Concepts, Principles, and Practices; John Wiley & Sons: Hoboken, NJ, USA, 2015. [Google Scholar]
- Monell, D.W.; Piland, W.M. Aerospace systems design in NASA’s collaborative engineering environment. Acta Astronaut. 2000, 47, 255–264. [Google Scholar] [CrossRef]
- Kapurch, S.J. NASA Systems Engineering Handbook; Diane Publishing: Collingdale, PA, USA, 2010. [Google Scholar]
- Dahmann, J.S.; Baldwin, K.J. Understanding the current state of US defense systems of systems and the implications for systems engineering. In Proceedings of the 2008 2nd Annual IEEE Systems Conference, Montreal, QC, Canada, 7–10 April 2008; pp. 1–7. [Google Scholar]
- Piaszczyk, C. Model based systems engineering with department of defense architectural framework. Syst. Eng. 2011, 14, 305–326. [Google Scholar] [CrossRef]
- Meier, S.R. Best project management and systems engineering practices in the preacquisition phase for federal intelligence and defense agencies. Proj. Manag. J. 2008, 39, 59–71. [Google Scholar] [CrossRef]
- Dahmann, J.S. Systems engineering for department of defense systems of systems. In System of Systems Engineering: Innovations for the 21st Century; John Wiley & Sons: Hoboken, NJ, USA, 2008; pp. 218–231. [Google Scholar]
- Freund, E. ISO/IEC 15288: 2002, Systems Engineering-System Life-Cycle Processes. Softw. Qual. Prof. 2005, 8, 42–43. [Google Scholar]
- Shen, W.; Hao, Q.; Mak, H.; Neelamkavil, J.; Xie, H.; Dickinson, J.; Thomas, R.; Pardasani, A.; Xue, H. Systems integration and collaboration in architecture, engineering, construction, and facilities management: A review. Adv. Eng. Inform. 2010, 24, 196–207. [Google Scholar] [CrossRef]
- Saurin, T.A.; Formoso, C.T.; Cambraia, F.B. An analysis of construction safety best practices from a cognitive systems engineering perspective. Saf. Sci. 2008, 46, 1169–1183. [Google Scholar] [CrossRef]
- Kamara, J.M.; Augenbroe, G.; Anumba, C.J.; Carrillo, P.M. Knowledge management in the architecture, engineering and construction industry. Constr. Innov. 2002, 2, 53–67. [Google Scholar] [CrossRef]
- Morgan, J.M.; Liker, J.K. The Toyota Product Development System; Productivity Press: New York, NY, USA, 2006; Volume 13533. [Google Scholar]
- Sobek, D.K., II; Ward, A.C.; Liker, J.K. Toyota’s principles of set-based concurrent engineering. MIT Sloan Manag. Rev. 1999, 40, 67. [Google Scholar]
- Mohanty, R.P.; Yadav, O.P.; Jain, R. Implementation of lean manufacturing principles in auto industry. Vilakshan–XIMB J. Manag. 2007, 1, 1–32. [Google Scholar]
- Fanjiang, G.; Grossman, J.H.; Compton, W.D.; Reid, P.P. Building a Better Delivery System: A New Engineering/Health Care Partnership; National Academies Press: Washington, DC, USA, 2005. [Google Scholar]
- Kopach-Konrad, R.; Lawley, M.; Criswell, M.; Hasan, I.; Chakraborty, S.; Pekny, J.; Doebbeling, B.N. Applying systems engineering principles in improving health care delivery. J. Gen. Intern. Med. 2007, 22, 431–437. [Google Scholar] [CrossRef] [PubMed]
- Rouse, W.B.; Cortese, D.A. Engineering the System of Healthcare Delivery; IOS Press: Amsterdam, The Netherlands, 2010; Volume 153. [Google Scholar]
- Fernandez, F.; Pallis, G.C. Opportunities and challenges of the Internet of Things for healthcare: Systems engineering perspective. In Proceedings of the 2014 4th International Conference on Wireless Mobile Communication and Healthcare-Transforming Healthcare Through Innovations in Mobile and Wireless Technologies (MOBIHEALTH), Athens, Greece, 3–5 November 2014; pp. 263–266. [Google Scholar]
- Jamshidi, M. Systems of Systems Engineering: Principles and Applications; CRC Press: Boca Raton, FL, USA, 2008. [Google Scholar]
- Dreher, M.R.; Chilkoti, A. Toward a Systems Engineering Approach to Cancer Drug Delivery; Oxford University Press: Oxford, UK, 2007. [Google Scholar]
- Valdez, R.S.; Ramly, E.; Brennan, P.F. Final Report: Industrial and Systems Engineering and Health Care: Critical Areas of Research; Publication No. 10-0079-EF; Agency for Healthcare Research and Quality: Rockville, ML, USA, 2010. [Google Scholar]
- Świerniak, A.; Kimmel, M.; Smieja, J.; Puszynski, K.; Psiuk-Maksymowicz, K. System Engineering Approach to Planning Anticancer Therapies; Springer: Berlin, Germany, 2016. [Google Scholar]
- Sheard, S.A. Evolution of systems engineering scholarship from 2000 to 2015, with particular emphasis on software. Syst. Eng. 2018, 21, 152–171. [Google Scholar] [CrossRef]
- Engineering Village. Engineering Village—Compendex and Inspec. 17 October 2018. Available online: https://www.engineeringvillage.com/search/quick.url (accessed on 17 October 2018).
- Boehm, B. Some future trends and implications for systems and software engineering processes. Syst. Eng. 2006, 9, 1–19. [Google Scholar] [CrossRef]
- Broniatowski, D.A. Building the tower without climbing it: Progress in engineering systems. Syst. Eng. 2018, 21, 259–281. [Google Scholar] [CrossRef]
- Kitchenham, B.; Brereton, O.P.; Budgen, D.; Turner, M.; Bailey, J.; Linkman, S. Systematic literature reviews in software engineering—A systematic literature review. Inf. Softw. Technol. 2009, 51, 7–15. [Google Scholar] [CrossRef]
- Kitchenham, B.; Pretorius, R.; Budgen, D.; Brereton, O.P.; Turner, M.; Niazi, M.; Linkman, S. Systematic literature reviews in software engineering—A tertiary study. Inf. Softw. Technol. 2010, 52, 792–805. [Google Scholar] [CrossRef]
- Rech, J. Discovering trends in software engineering with google trend. ACM SIGSOFT Softw. Eng. Notes 2007, 32, 1–2. [Google Scholar] [CrossRef]
- Coulter, N.; Monarch, I.; Konda, S. Software engineering as seen through its research literature: A study in co-word analysis. J. Am. Soc. Inf. Sci. 1998, 49, 1206–1223. [Google Scholar] [CrossRef]
- Line, N.D.; Runyan, R.C. Hospitality marketing research: Recent trends and future directions. Int. J. Hosp. Manag. 2012, 31, 477–488. [Google Scholar] [CrossRef]
- Chon, K.-S.; Evans, M.R.; Sutherlin, D. Trends in hospitality management literature: A content analysis. Hosp. Educ. Res. J. 1989, 13, 483–491. [Google Scholar] [CrossRef]
- Sainaghi, R.; Phillips, P.; Zavarrone, E. Performance measurement in tourism firms: A content analytical meta-approach. Tour. Manag. 2017, 59, 36–56. [Google Scholar] [CrossRef]
- De Weck, O.L.; Ross, A.M.; Rhodes, D.H. Investigating Relationships and Semantic Sets amongst System Lifecycle Properties (Ilities); CESUN, Delft University of Technology: Delft, The Netherlands, 2012. [Google Scholar]
- Ross, A.M.; Rhodes, D.H.; Hastings, D.E. Defining changeability: Reconciling flexibility, adaptability, scalability, modifiability, and robustness for maintaining system lifecycle value. Syst. Eng. 2008, 11, 246–262. [Google Scholar] [CrossRef]
- Hazelrigg, G.A. Fundamentals of Decision Making for Engineering Design and Systems Engineering, 1st ed.; Pearson Education: London, UK, 2012. [Google Scholar]
- QSR International Pty Ltd. NVivo Qualitative Data Analysis Software; Version 10; QSR International Pty Ltd.: Doncaster, Australia, 2012. [Google Scholar]
- Newson, R. Parameters behind ‘nonparametric’ statistics: Kendall’s tau, Somers’ D and median differences. Stata J. 2002, 2, 45–64. [Google Scholar] [CrossRef]
- Mayers, A. Introduction to Statistics and SPSS in Psychology; Pearson Higher Ed.: Harlow, UK, 2013. [Google Scholar]
- Roedler, G.J.; Jones, C. Technical Measurement; Technical Measurement, INCOSE, Lockhead Martin Corporation: San Diego, CA, USA, 2005; Volume 12. [Google Scholar]
- Blanchard, B.S.; Fabrycky, W.J.; Fabrycky, W.J. Systems Engineering and Analysis; Prentice Hall: Englewood Cliffs, NJ, USA, 1990; Volume 4. [Google Scholar]
- Taguchi, G. Introduction to Quality Engineering: Designing Quality into Products and Processes; Quality Resources: Clearwater, FL, USA, 1986. [Google Scholar]
- Suh, N.P. Axiomatic Design: Advances and Applications (the Oxford Series on Advanced Manufacturing); Oxford University Press: Oxford, UK, 2001. [Google Scholar]
- Tsui, K.-L. A critical look at Taguchi’s modelling approach for robust design. J. Appl. Stat. 1996, 23, 81–96. [Google Scholar] [CrossRef]
- Kim, Y.J.; Cho, B.R. Economic considerations on parameter design. Qual. Reliab. Eng. Int. 2000, 16, 501–514. [Google Scholar] [CrossRef]
- Maghsoodloo, S.; Ozdemir, G.; Jordan, V.; Huang, C.-H. Strengths and limitations of Taguchi’s contributions to quality, manufacturing, and process engineering. J. Manuf. Syst. 2004, 23, 73–126. [Google Scholar] [CrossRef]
- Frey, D.D.; Jahangir, E.; Engelhardt, F. Computing the information content of decoupled designs. Res. Eng. Des. 2000, 12, 90–102. [Google Scholar] [CrossRef]
- Fan, L.X.; Cai, M.Y.; Lin, Y.; Zhang, W.J. Axiomatic design theory: Further notes and its guideline to applications. Int. J. Mater. Prod. Technol. 2015, 51, 359–374. [Google Scholar] [CrossRef]
- Olewnik, A.; Lewis, K. Limitations of the House of Quality to provide quantitative design information. Int. J. Qual. Reliab. Manag. 2008, 25, 125–146. [Google Scholar] [CrossRef]
- Van de Poel, I. Methodological problems in QFD and directions for future development. Res. Eng. Des. 2007, 18, 21–36. [Google Scholar] [CrossRef]
- OMG. OMG Systems Modeling Language (OMG SysMLTM); OMG: Needham, MA, USA, September 2015. [Google Scholar]
- Estefan, J.A. Survey of model-based systems engineering (MBSE) methodologies. Incose MBSE Focus Group 2007, 25, 1–12. [Google Scholar]
- Friedenthal, S.; Griego, R.; Sampson, M. INCOSE model based systems engineering (MBSE) initiative. In Proceedings of the INCOSE 2007 Symposium, San Diego, CA, USA, 24–28 June 2007; Volume 11. [Google Scholar]
- INCOSE. A World in Motion: Systems Engineering Vision 2025; International Council on Systems Engineering: San Diego, CA, USA, 2014. [Google Scholar]
- IDETC/CIE. CIE-17 Systems Engineering Information Knowledge Management (SEIKM): Systems Engineering; IDETC/CIE: Quebec City, Canada, 2018. [Google Scholar]
- Buchanan, R.; Richards, J.; Rinuado, C.; Goerger, S. Integrating Set-Based Design into Cost Analysis. In Proceedings of the 16th Annual Conference on Systems Engineering Research (CSER), Charlottesville, VA, USA, 8–9 May 2018. [Google Scholar]
- Moazeni, S.; Nilchiani, R.; Pugliese, A. Effects of Uncertain Requirements on the Design Selection Problem. In Proceedings of the 16th Annual Conference on Systems Engineering Research, Charlottesville, VA, USA, 8–9 May 2018. [Google Scholar]
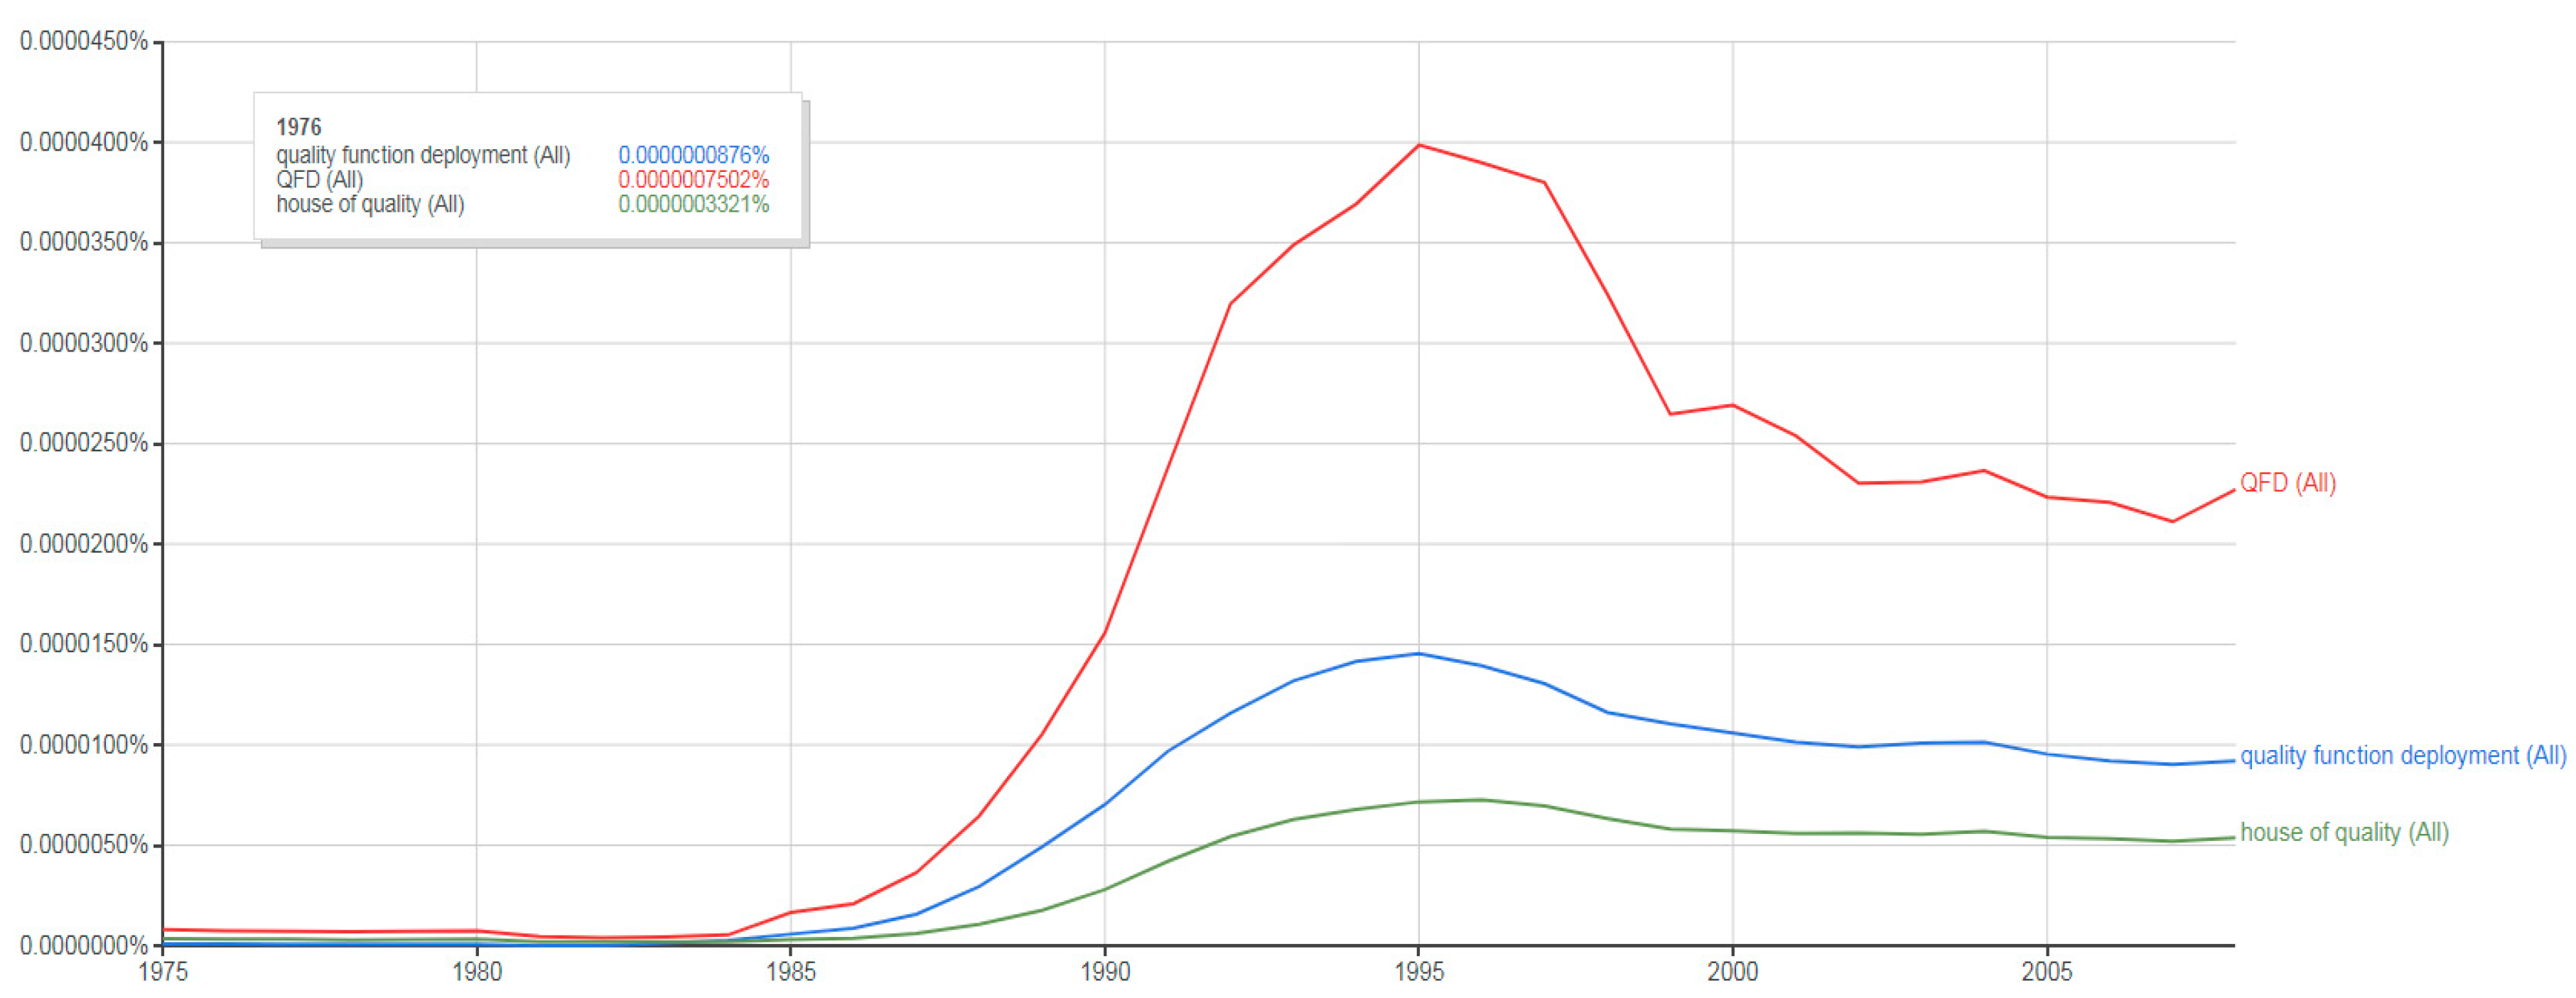
| 1 | Ngram Viewer is a tool that plots the frequencies of search strings using a yearly count of n-grams found in books printed between 1500 and 2008 in multiple languages that are available in Google’s database. |


| Journal | Years of Availability |
|---|---|
| Wiley SE—Wiley Systems Engineering | 1998–2016 |
| SS & SE—Springer Journal of Systems Science and Systems Engineering | 2003–2016 |
| JOED—Journal of Engineering Design | 1998–2016 |
| RED—Research in Engineering Design | 1998–2016 |
| Order of Magnitude of Initial Frequencies | |||||
|---|---|---|---|---|---|
| Game Theory Adaptability MBSE | Resilience Evolvability VDD | SysML Repairability Modifiability Digital twin | |||
| Fuzzy sets | AHP Affordability Modularity Flexibility DSM | Durability | |||
| Scalability Interoperability | Risk matrix | ||||
| Reliability Sustainability Optimization | Maintainability Lean Usability | ||||
| Complexity | Robustness Availability | Manufacturability Extensibility Agility Utility theory FMEA | Testability | ||
| Quality | QFD Safety | SixSigma Agile | |||
| Taguchi Axiomatic design | Pugh RVTM IPT | ||||
| Order of Magnitude of Initial Frequencies | |||||||
|---|---|---|---|---|---|---|---|
| Game Theory MBSE Adaptability | Resilience Evolvability | SysML Repairability Modifiability Digital twin | |||||
| Modularity | VDD | ||||||
| Fuzzy sets DSM | AHP Affordability Flexibility | Durability | |||||
| Optimization | Scalability Interoperability | Risk matrix | |||||
| Sustainability | Reliability | Maintainability Usability FMEA | |||||
| Complexity | Robustness Availability | Six Sigma Lean Agility Utility Theory | Testability | ||||
| Quality Safety | QFD Taguchi Axiomatic Design IPT | Pugh Agile Manufacturability Extensibility RVTM | |||||
 —Topics that changed their row positions, as compared to Table 3 —Topics that changed their row positions, as compared to Table 3 | |||||||
| Topic | Journal | Topic | Journal | ||||||
|---|---|---|---|---|---|---|---|---|---|
| JOED | RED | SS & SE | Wiley | JOED | RED | SS & SE | Wiley | ||
| QFD | + | + | # | # | Resilience | # | ^ | # | + |
| Reliability | + | + | + | + | Adaptability | # | # | # | + |
| Robustness | + | + | + | + | Manufacturability | # | # | ^ | ^ |
| Complexity | + | + | * | * | Flexibility | # | # | + | + |
| Taguchi | + | # | # | # | Scalability | # | # | # | # |
| DSM | + | + | ! | + | Repairability | # | ! | ^ | ^ |
| Sustainability | + | # | + | + | Axiomatic design | # | + | ~ | # |
| Availability | + | + | + | + | Utility theory | # | # | # | # |
| Modularity | + | + | # | + | FMEA | # | # | ^ | # |
| Quality | + | + | + | + | IPT | # | ^ | ~ | # |
| Durability | + | # | # | ^ | Risk matrix | # | ^ | ! | # |
| Safety | + | + | + | + | Affordability | ^ | ^ | ^ | # |
| Usability | + | # | # | # | Interoperability | ^ | # | # | + |
| Fuzzy sets | + | + | * | + | Testability | ^ | ^ | ~ | ^ |
| Optimization | + | * | * | + | Extensibility | ^ | ^ | # | # |
| AHP | # | + | + | # | Agility | ^ | # | # | # |
| Pugh | # | + | ! | # | VDD | ^ | ^ | # | # |
| SixSigma | # | ^ | # | # | MBSE | ~ | ^ | ^ | + |
| Game Theory | # | + | + | + | Evolvability | ~ | ^ | ~ | # |
| SysML | # | # | ^ | + | Digital twin | ~ | ! | ~ | ~ |
| Agile | # | # | # | # | Modifiability | ! | ! | ! | ~ |
| Maintainability | # | # | # | # | RVTM | ! | ^ | ^ | # |
| Lean | # | # | # | + | |||||
| * | ^ | ||||||||
| + | ~ | ||||||||
| # | ! | ||||||||
| Topic | Journal | Topic | Journal | ||||||
|---|---|---|---|---|---|---|---|---|---|
| JOED | RED | SS & SE | Wiley | JOED | RED | SS & SE | Wiley | ||
| Complexity | * | * | * | * | Lean | # | # | # | + |
| Quality | * | * | * | * | Manufacturability | # | + | ^ | # |
| Optimization | * | * | * | + | Flexibility | # | # | + | + |
| QFD | + | + | # | + | Scalability | # | # | # | # |
| Game Theory | + | + | + | + | Interoperability | # | # | # | + |
| Reliability | + | + | + | + | Repairability | # | / | # | ^ |
| Robustness | + | + | + | + | VDD | # | ^ | # | # |
| Taguchi | + | + | # | # | Axiomatic design | # | + | ^ | # |
| Sustainability | + | # | + | + | Utility theory | # | # | # | # |
| Availability | + | + | + | FMEA | # | + | ^ | # | |
| Adaptability | + | # | # | + | IPT | # | ^ | ~ | # |
| Modularity | + | + | # | + | Risk matrix | # | ^ | / | # |
| Durability | + | # | # | ^ | Affordability | # | ^ | ^ | |
| Safety | + | + | + | + | Resilience | ^ | ^ | # | + |
| Usability | + | # | # | # | Testability | ^ | # | ~ | # |
| Fuzzy sets | + | + | + | Extensibility | ^ | # | # | # | |
| DSM | + | + | ^ | + | Agility | ^ | # | # | # |
| AHP | # | + | + | # | Evolvability | ^ | # | ^ | # |
| Pugh | # | + | / | # | Digital twin | ^ | / | ~ | ~ |
| Six Sigma | # | # | ^ | # | MBSE | ~ | ^ | # | + |
| SysML | # | # | ^ | + | Modifiability | / | / | / | ^ |
| Agile | # | # | # | # | RVTM | / | ^ | ^ | # |
| Maintainability | # | # | # | # | |||||
| * | ^ | $ | |||||||
| + | ~ | / | |||||||
| # | ! | ||||||||
| Topic | Journal | Topic | Journal | |||||||
|---|---|---|---|---|---|---|---|---|---|---|
| JOED | RED | SS and SE | Wiley | JOED | RED | SS and SE | Wiley | |||
| Six Sigma | * | ^ | $ | $ | Optimization | ^ | $ | ^ | # | |
| SysML | * | * | * | * | Reliability | ~ | ^ | # | # | |
| Agile | * | / | ~ | * | Durability | ~ | * | * | * | |
| MBSE | * | * | * | * | Manufacturability | ~ | $ | / | / | |
| Sustainability | * | * | ^ | ^ | Extensibility | ~ | / | / | ~ | |
| Adaptability | * | ~ | ^ | * | Modifiability | ! | ! | ! | * | |
| Modularity | * | # | + | * | RVTM | ! | * | $ | / | |
| Scalability | * | $ | # | * | Game Theory | $ | * | ~ | * | |
| Usability | * | # | ~ | Complexity | $ | ~ | ^ | # | ||
| Interoperability | * | / | # | # | Maintainability | $ | * | * | $ | |
| Agility | * | / | # | # | Affordability | $ | * | ^ | * | |
| Repairability | * | ! | $ | * | Availability | $ | ~ | ~ | ^ | |
| Evolvability | * | * | ! | * | QFD | / | / | * | ||
| Digital twin | * | ! | * | * | Pugh | / | ~ | ! | $ | |
| Risk Matrix | * | * | ! | $ | Taguchi | / | / | ! | $ | |
| Resilience | + | ^ | + | * | Lean | / | # | ~ | + | |
| Flexibility | + | * | $ | * | Quality | / | $ | $ | $ | |
| Fuzzy sets | + | ^ | ^ | $ | Safety | / | + | ~ | ~ | |
| Robustness | # | / | # | ^ | Axiomatic design | / | / | ! | ^ | |
| Testability | # | * | ! | ~ | Utility theory | / | / | $ | + | |
| VDD | # | * | * | * | FMEA | / | + | / | ~ | |
| DSM | # | * | ! | * | IPT | / | ! | * | / | |
| AHP | ^ | + | ~ | ^ | ||||||
| ! No change | ||||||||||
| Topic | Journal | Topic | Journal | ||||||||
|---|---|---|---|---|---|---|---|---|---|---|---|
| JOED | RED | SS & SE | Wiley | JOED | RED | SS & SE | Wiley | ||||
| SysML | * | * | * | / | Reliability | ~ | # | ^ | $ | ||
| Agile | * | / | $ | * | Durability | ~ | * | * | * | ||
| MBSE | * | * | * | + | Manufacturability | ~ | $ | / | / | ||
| Sustainability | * | * | $ | $ | Extensibility | ~ | / | / | / | ||
| Adaptability | * | ~ | $ | * | Optimization | ~ | $ | ~ | ~ | ||
| Modularity | * | # | ^ | * | Modifiability | ! | ! | ! | * | ||
| Scalability | * | / | # | * | RVTM | ! | * | $ | / | ||
| Interoperability | * | / | # | ^ | Game Theory | $ | + | $ | # | ||
| Agility | * | / | # | ~ | Complexity | $ | ~ | ~ | $ | ||
| Repairability | * | ! | $ | * | Maintainability | $ | * | * | / | ||
| Evolvability | * | * | / | # | Affordability | $ | * | $ | # | ||
| Digital twin | * | ! | * | * | Availability | $ | ^ | $ | ~ | ||
| Risk matrix | * | * | ! | $ | Quality | $ | $ | $ | / | ||
| Six Sigma | + | ~ | $ | / | QFD | / | / | * | / | ||
| Resilience | + | # | # | * | Pugh | / | ~ | ! | / | ||
| Flexibility | + | * | / | # | Taguchi | / | / | / | $ | ||
| Usability | + | # | / | / | Lean | / | # | $ | ~ | ||
| Fuzzy sets | + | # | $ | / | Safety | / | + | $ | |||
| Robustness | # | $ | ~ | $ | Axiomatic design | / | / | ! | $ | ||
| Testability | # | * | ! | / | Utility theory | / | / | / | ^ | ||
| VDD | # | * | * | * | FMEA | / | * | / | / | ||
| DSM | # | + | / | # | IPT | / | / | * | / | ||
| AHP | ~ | + | / | ~ | |||||||
| ! No change | |||||||||||
| Topics | |||||
|---|---|---|---|---|---|
| * SysML | ~ Modularity | ~ Maintainability | / Lean | / FMEA | |
| * Resilience | ~ Durability | ! Complexity | / Sustainability | / Robustness | |
| + Evolvability | ~ Flexibility | ! Availability | / Quality | # Pugh | |
| + Game Theory | ~ Scalability | ! Reliability | / Testability | # Taguchi | |
| + MBSE | ~ DSM | ! Risk matrix | / Extensibility | # Agile | |
| + Adaptability | ~Interoperability | / Usability | / Agility | # QFD | |
| + Repairability | ~ AHP | / Modifiability | / Safety | # Axiomatic design | |
| ~ Optimization | ~ VDD | / Manufacturability | / Utility theory | # RVTM | |
| ~ Affordability | ~ Fuzzy sets | / Six sigma | / Digital twin | # IPT | |
| * Increase in rank > 20 | ^ Decrease in rank >20 | ||||
| + Increase in rank between 11 and 20 | # Decrease in rank between 11 and 20 | ||||
| ~ Increase in rank between 1 and 10 | / Decrease in rank between 1 and 10 | ||||
| ! No change in rank | |||||
| Year | 1998 | 1999 | 2000 | 2001 | 2002 | 2003 | 2004 | 2005 | 2006 | 2007 | 2008 | 2009 | 2010 | 2011 | 2012 | 2013 | 2014 | 2015 | 2016 | Average |
|---|---|---|---|---|---|---|---|---|---|---|---|---|---|---|---|---|---|---|---|---|
| Complexity | 3 | 1 | 2 | 2 | 3 | 2 | 1 | 3 | 3 | 2 | 2 | 1 | 1 | 3 | 1 | 2 | 1 | 2 | 1 | 2 |
| Optimization | 1 | 2 | 5 | 3 | 2 | 1 | 2 | 1 | 1 | 1 | 1 | 3 | 2 | 2 | 2 | 1 | 2 | 1 | 2 | 2 |
| Quality | 2 | 3 | 1 | 1 | 4 | 3 | 3 | 2 | 2 | 3 | 3 | 2 | 5 | 1 | 3 | 6 | 3 | 6 | 4 | 3 |
| Availability | 4 | 4 | 5 | 5 | 5 | 6 | 5 | 6 | 6 | 5 | 5 | 4 | 3 | 4 | 4 | 4 | 4 | 4 | 5 | 5 |
| Reliability | 6 | 10 | 8 | 12 | 7 | 7 | 9 | 7 | 9 | 9 | 12 | 12 | 4 | 6 | 11 | 7 | 6 | 7 | 10 | 8 |
| Robustness | 11 | 6 | 4 | 7 | 9 | 8 | 12 | 4 | 7 | 4 | 8 | 7 | 12 | 13 | 8 | 9 | 12 | 3 | 9 | 8 |
| Safety | 9 | 5 | 3 | 4 | 1 | 11 | 7 | 8 | 10 | 15 | 16 | 6 | 7 | 10 | 12 | 8 | 13 | 14 | 12 | 9 |
| Fuzzy sets | 20 | 8 | 10 | 26 | 13 | 5 | 6 | 5 | 5 | 8 | 10 | 9 | 6 | 5 | 10 | 5 | 5 | 9 | 7 | 9 |
| DSM | 12 | 12 | 13 | 12 | 8 | 12 | 11 | 12 | 22 | 6 | 20 | 15 | 10 | 11 | 6 | 3 | 9 | 11 | 6 | 11 |
| Modularity | 20 | 15 | 16 | 9 | 6 | 4 | 4 | 12 | 14 | 13 | 9 | 20 | 16 | 16 | 5 | 12 | 14 | 13 | 3 | 12 |
| QFD | 8 | 7 | 7 | 8 | 10 | 10 | 13 | 15 | 12 | 7 | 11 | 16 | 13 | 9 | 18 | 18 | 15 | 17 | 19 | 12 |
| Game Theory | 22 | 25 | 28 | 24 | 34 | 9 | 20 | 10 | 4 | 12 | 6 | 11 | 16 | 17 | 9 | 20 | 17 | 12 | 11 | 16 |
| Sustainability | 5 | 25 | 17 | 30 | 19 | 19 | 17 | 19 | 17 | 18 | 17 | 5 | 21 | 12 | 7 | 10 | 16 | 16 | 18 | 16 |
| Flexibility | 14 | 18 | 15 | 23 | 15 | 13 | 16 | 21 | 24 | 10 | 7 | 13 | 25 | 18 | 19 | 11 | 21 | 5 | 13 | 16 |
| AHP | 35 | 12 | 18 | 27 | 12 | 21 | 10 | 9 | 8 | 11 | 22 | 22 | 20 | 15 | 22 | 13 | 8 | 21 | 23 | 17 |
| Usability | 23 | 20 | 20 | 10 | 13 | 19 | 14 | 22 | 24 | 20 | 24 | 17 | 9 | 14 | 13 | 21 | 22 | 19 | 20 | 18 |
| Taguchi | 14 | 11 | 11 | 6 | 25 | 16 | 14 | 11 | 15 | 14 | 19 | 21 | 34 | 21 | 24 | 31 | 18 | 31 | 20 | 19 |
| Pugh | 13 | 14 | 14 | 27 | 18 | 23 | 21 | 25 | 26 | 27 | 17 | 10 | 11 | 22 | 29 | 28 | 23 | 40 | 28 | 22 |
| Lean | 16 | 29 | 35 | 14 | 27 | 14 | 8 | 23 | 18 | 19 | 26 | 14 | 24 | 8 | 32 | 28 | 29 | 20 | 33 | 22 |
| Adaptability | 25 | 21 | 33 | 33 | 25 | 29 | 25 | 20 | 18 | 24 | 15 | 36 | 29 | 29 | 14 | 16 | 19 | 8 | 17 | 23 |
| Interoperability | 17 | 25 | 21 | 16 | 23 | 15 | 23 | 24 | 30 | 29 | 35 | 28 | 18 | 19 | 27 | 27 | 11 | 27 | 24 | 23 |
| Axiomatic design | 10 | 16 | 9 | 38 | 22 | 24 | 23 | 14 | 11 | 17 | 27 | 24 | 39 | 26 | 26 | 24 | 36 | 26 | 30 | 23 |
| FMEA | 25 | 22 | 12 | 38 | 11 | 22 | 27 | 16 | 26 | 32 | 33 | 25 | 19 | 24 | 17 | 22 | 26 | 30 | 27 | 24 |
| SysML | 35 | 37 | 38 | 38 | 42 | 39 | 40 | 32 | 13 | 34 | 13 | 8 | 14 | 7 | 16 | 15 | 7 | 25 | 15 | 25 |
| Maintainability | 19 | 22 | 21 | 16 | 31 | 26 | 18 | 18 | 29 | 37 | 34 | 32 | 25 | 19 | 33 | 23 | 31 | 18 | 22 | 25 |
| Manufacturability | 18 | 22 | 26 | 24 | 19 | 33 | 22 | 29 | 30 | 16 | 25 | 19 | 15 | 35 | 29 | 35 | 28 | 35 | 33 | 26 |
| Scalability | 29 | 29 | 26 | 15 | 34 | 29 | 19 | 28 | 28 | 34 | 23 | 30 | 34 | 32 | 24 | 28 | 20 | 24 | 16 | 26 |
| Agile | 29 | 9 | 38 | 34 | 27 | 27 | 29 | 31 | 16 | 21 | 30 | 34 | 23 | 27 | 15 | 26 | 31 | 32 | 25 | 27 |
| Resilience | 24 | 33 | 38 | 38 | 34 | 37 | 40 | 33 | 21 | 38 | 14 | 30 | 8 | 35 | 21 | 14 | 33 | 10 | 8 | 27 |
| Utility theory | 29 | 18 | 23 | 16 | 34 | 35 | 35 | 17 | 20 | 22 | 28 | 27 | 36 | 34 | 38 | 33 | 24 | 29 | 30 | 28 |
| SixSigma | 29 | 33 | 28 | 19 | 24 | 17 | 31 | 30 | 37 | 27 | 21 | 29 | 31 | 25 | 28 | 35 | 40 | 34 | 29 | 29 |
| MBSE | 35 | 36 | 18 | 27 | 19 | 31 | 40 | 41 | 40 | 40 | 37 | 38 | 22 | 23 | 20 | 17 | 10 | 22 | 26 | 29 |
| Affordability | 29 | 37 | 28 | 21 | 29 | 18 | 33 | 35 | 33 | 34 | 36 | 26 | 38 | 30 | 39 | 32 | 27 | 23 | 14 | 30 |
| Durability | 27 | 37 | 35 | 34 | 29 | 35 | 30 | 33 | 33 | 24 | 4 | 23 | 33 | 28 | 31 | 33 | 29 | 37 | 38 | 30 |
| Agility | 27 | 17 | 28 | 37 | 31 | 31 | 37 | 26 | 23 | 29 | 30 | 39 | 37 | 31 | 23 | 25 | 43 | 35 | 40 | 31 |
| Extensibility | 29 | 32 | 35 | 19 | 34 | 28 | 28 | 27 | 36 | 40 | 38 | 33 | 27 | 32 | 34 | 40 | 34 | 38 | 38 | 33 |
| VDD | 35 | 37 | 28 | 34 | 40 | 25 | 31 | 35 | 30 | 32 | 32 | 34 | 28 | 37 | 37 | 37 | 25 | 28 | 35 | 33 |
| IPT | 7 | 29 | 25 | 10 | 16 | 39 | 25 | 35 | 38 | 43 | 41 | 43 | 40 | 37 | 40 | 42 | 35 | 42 | 36 | 33 |
| Risk Matrix | 35 | 25 | 38 | 38 | 16 | 39 | 40 | 38 | 42 | 23 | 42 | 17 | 43 | 39 | 41 | 38 | 40 | 33 | 40 | 35 |
| Testability | 35 | 33 | 33 | 30 | 34 | 37 | 33 | 41 | 35 | 39 | 38 | 39 | 32 | 39 | 36 | 39 | 37 | 39 | 37 | 36 |
| Evolvability | 35 | 37 | 38 | 30 | 40 | 39 | 37 | 39 | 40 | 24 | 40 | 36 | 40 | 42 | 35 | 43 | 39 | 15 | 30 | 36 |
| RVTM | 35 | 37 | 23 | 22 | 31 | 33 | 37 | 41 | 39 | 40 | 42 | 39 | 30 | 42 | 43 | 45 | 44 | 43 | 40 | 37 |
| Repairability | 35 | 37 | 38 | 38 | 42 | 39 | 40 | 39 | 42 | 29 | 42 | 39 | 43 | 39 | 42 | 19 | 38 | 41 | 45 | 38 |
| Modifiability | 35 | 37 | 38 | 38 | 42 | 39 | 35 | 41 | 42 | 43 | 29 | 44 | 42 | 44 | 45 | 41 | 40 | 43 | 43 | 40 |
| Digital twin | 35 | 37 | 38 | 38 | 42 | 39 | 40 | 41 | 42 | 43 | 42 | 45 | 43 | 44 | 43 | 44 | 44 | 45 | 43 | 41 |
| Tau-b | 0.596 | 0.669 | 0.555 | 0.489 | 0.596 | 0.721 | 0.698 | 0.75 | 0.64 | 0.588 | 0.602 | 0.578 | 0.647 | 0.667 | 0.714 | 0.651 | 0.572 | 0.715 | ||
| p-value | <0.001 | <0.001 | <0.001 | <0.001 | <0.001 | <0.001 | <0.001 | <0.001 | <0.001 | <0.001 | <0.001 | <0.001 | <0.001 | <0.001 | <0.001 | <0.001 | <0.001 | <0.001 |
| Year | 1998 | 1999 | 2000 | 2001 | 2002 | 2003 | 2004 | 2005 | 2006 | 2007 | 2008 | 2009 | 2010 | 2011 | 2012 | 2013 | 2014 | 2015 | 2016 | Average |
|---|---|---|---|---|---|---|---|---|---|---|---|---|---|---|---|---|---|---|---|---|
| Game Theory | 4 | 5 | 5 | 4 | 6 | 1 | 2 | 1 | 1 | 2 | 1 | 1 | 2 | 2 | 2 | 2 | 2 | 2 | 2 | 2 |
| DSM | 3 | 2 | 2 | 2 | 1 | 2 | 1 | 2 | 5 | 1 | 2 | 2 | 1 | 1 | 1 | 1 | 1 | 1 | 1 | 2 |
| Agile | 5 | 1 | 7 | 5 | 5 | 5 | 5 | 5 | 3 | 4 | 5 | 6 | 3 | 4 | 3 | 4 | 5 | 6 | 3 | 4 |
| Axiomatic design | 2 | 3 | 1 | 7 | 4 | 3 | 3 | 3 | 2 | 3 | 3 | 4 | 6 | 3 | 4 | 3 | 7 | 3 | 4 | 4 |
| Utility theory | 5 | 4 | 3 | 3 | 6 | 6 | 7 | 4 | 4 | 5 | 4 | 5 | 5 | 5 | 6 | 5 | 3 | 5 | 4 | 5 |
| VDD | 7 | 8 | 5 | 5 | 8 | 4 | 6 | 6 | 6 | 7 | 6 | 6 | 4 | 6 | 5 | 6 | 4 | 4 | 6 | 6 |
| IPT | 1 | 7 | 4 | 1 | 2 | 7 | 4 | 6 | 7 | 8 | 7 | 8 | 7 | 6 | 7 | 8 | 6 | 8 | 7 | 6 |
| Risk Matrix | 7 | 5 | 7 | 7 | 2 | 7 | 8 | 8 | 8 | 6 | 8 | 3 | 8 | 8 | 8 | 7 | 8 | 7 | 8 | 7 |
| Tau-b | 0.113 | 0.189 | 0.308 | 0.077 | -0.151 | 0.62 | 0.62 | 0.69 | 0.57 | 0.71 | 0.62 | 0.182 | 0.69 | 0.84 | 0.79 | 0.500 | 0.57 | 0.62 | ||
| p-value | 0.704 | 0.527 | 0.308 | 0.799 | 0.613 | 0.034 | 0.034 | 0.018 | 0.048 | 0.013 | 0.034 | 0.533 | 0.018 | 0.004 | 0.006 | 0.083 | 0.048 | 0.034 |
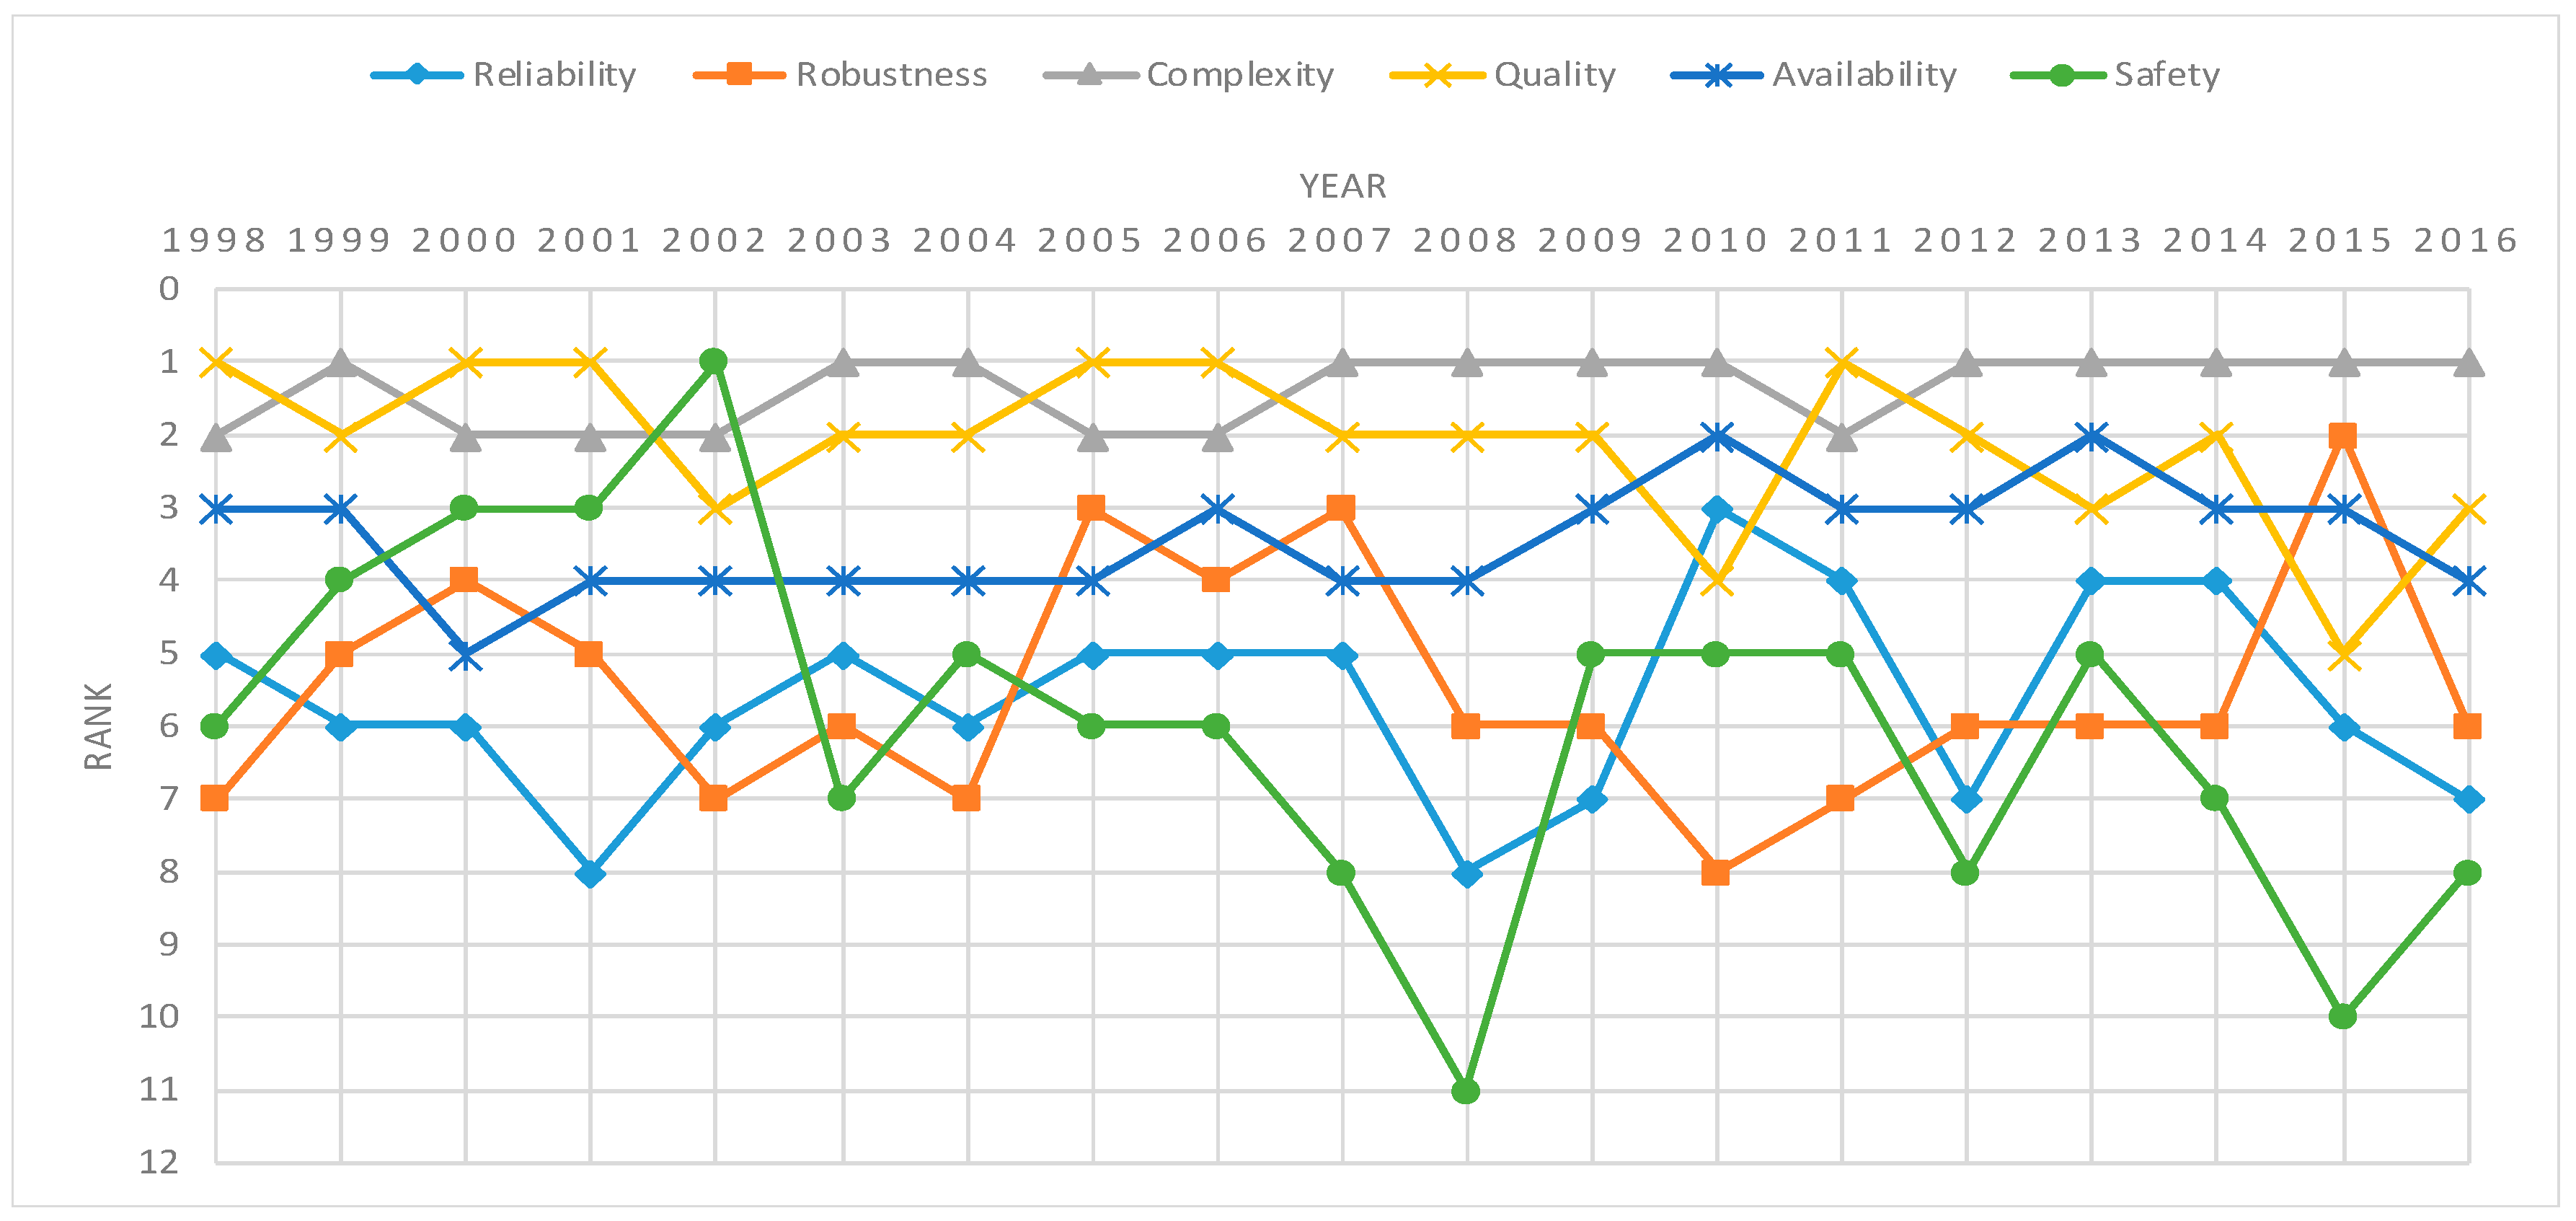
| Year | 1998 | 1999 | 2000 | 2001 | 2002 | 2003 | 2004 | 2005 | 2006 | 2007 | 2008 | 2009 | 2010 | 2011 | 2012 | 2013 | 2014 | 2015 | 2016 | Average |
|---|---|---|---|---|---|---|---|---|---|---|---|---|---|---|---|---|---|---|---|---|
| Complexity | 2 | 1 | 2 | 2 | 2 | 1 | 1 | 2 | 2 | 1 | 1 | 1 | 1 | 2 | 1 | 1 | 1 | 1 | 1 | 1 |
| Quality | 1 | 2 | 1 | 1 | 3 | 2 | 2 | 1 | 1 | 2 | 2 | 2 | 4 | 1 | 2 | 3 | 2 | 5 | 3 | 2 |
| Availability | 3 | 3 | 5 | 4 | 4 | 4 | 4 | 4 | 3 | 4 | 4 | 3 | 2 | 3 | 3 | 2 | 3 | 3 | 4 | 3 |
| Robustness | 7 | 5 | 4 | 5 | 7 | 6 | 7 | 3 | 4 | 3 | 6 | 6 | 8 | 7 | 6 | 6 | 6 | 2 | 6 | 5 |
| Reliability | 5 | 6 | 6 | 8 | 6 | 5 | 6 | 5 | 5 | 5 | 8 | 7 | 3 | 4 | 7 | 4 | 4 | 6 | 7 | 6 |
| Safety | 6 | 4 | 3 | 3 | 1 | 7 | 5 | 6 | 6 | 8 | 11 | 5 | 5 | 5 | 8 | 5 | 7 | 10 | 8 | 6 |
| Modularity | 12 | 7 | 8 | 6 | 5 | 3 | 3 | 7 | 7 | 7 | 7 | 11 | 10 | 9 | 4 | 9 | 8 | 9 | 2 | 7 |
| Flexibility | 8 | 9 | 7 | 14 | 9 | 8 | 9 | 11 | 12 | 6 | 5 | 8 | 13 | 10 | 11 | 8 | 12 | 4 | 9 | 9 |
| Sustainability | 4 | 14 | 9 | 16 | 10 | 11 | 10 | 9 | 8 | 10 | 12 | 4 | 12 | 6 | 5 | 7 | 9 | 12 | 13 | 10 |
| Usability | 13 | 10 | 10 | 7 | 8 | 11 | 8 | 12 | 12 | 11 | 14 | 9 | 7 | 8 | 9 | 13 | 13 | 14 | 14 | 11 |
| Adaptability | 15 | 11 | 17 | 19 | 13 | 15 | 15 | 10 | 9 | 12 | 10 | 19 | 16 | 14 | 10 | 11 | 10 | 7 | 12 | 13 |
| Interoperability | 9 | 14 | 11 | 10 | 12 | 9 | 14 | 13 | 16 | 15 | 19 | 14 | 11 | 11 | 15 | 16 | 5 | 17 | 16 | 13 |
| Maintainability | 11 | 12 | 11 | 10 | 16 | 13 | 11 | 8 | 15 | 20 | 18 | 17 | 13 | 11 | 18 | 14 | 17 | 13 | 15 | 14 |
| Manufacturability | 10 | 12 | 13 | 15 | 10 | 18 | 13 | 17 | 16 | 9 | 15 | 10 | 9 | 19 | 16 | 20 | 15 | 18 | 18 | 14 |
| Resilience | 14 | 18 | 21 | 22 | 18 | 20 | 23 | 18 | 10 | 21 | 9 | 15 | 6 | 19 | 12 | 10 | 18 | 8 | 5 | 15 |
| Scalability | 18 | 16 | 13 | 9 | 18 | 15 | 12 | 16 | 14 | 18 | 13 | 15 | 19 | 17 | 14 | 17 | 11 | 16 | 11 | 15 |
| Affordability | 18 | 20 | 15 | 13 | 14 | 10 | 18 | 20 | 18 | 18 | 20 | 13 | 21 | 15 | 22 | 18 | 14 | 15 | 10 | 16 |
| Durability | 16 | 20 | 19 | 20 | 14 | 19 | 17 | 18 | 18 | 12 | 3 | 12 | 18 | 13 | 17 | 19 | 16 | 20 | 20 | 16 |
| Agility | 16 | 8 | 15 | 21 | 16 | 17 | 21 | 14 | 11 | 15 | 17 | 21 | 20 | 16 | 13 | 15 | 24 | 18 | 22 | 17 |
| Extensibility | 18 | 17 | 19 | 12 | 18 | 14 | 16 | 15 | 21 | 23 | 21 | 18 | 15 | 17 | 19 | 22 | 19 | 21 | 20 | 18 |
| Testability | 21 | 18 | 17 | 16 | 18 | 20 | 18 | 23 | 20 | 22 | 21 | 21 | 17 | 21 | 21 | 21 | 20 | 22 | 19 | 20 |
| Evolvability | 21 | 20 | 21 | 16 | 22 | 22 | 21 | 21 | 22 | 12 | 23 | 19 | 22 | 23 | 20 | 24 | 22 | 11 | 17 | 20 |
| Repairability | 21 | 20 | 21 | 22 | 23 | 22 | 23 | 21 | 23 | 15 | 24 | 21 | 24 | 21 | 23 | 12 | 21 | 23 | 24 | 21 |
| Modifiability | 21 | 20 | 21 | 22 | 23 | 22 | 20 | 23 | 23 | 24 | 16 | 24 | 23 | 24 | 24 | 23 | 23 | 24 | 23 | 22 |
| Tau-b | 0.673 | 0.769 | 0.749 | 0.658 | 0.769 | 0.792 | 0.703 | 0.796 | 0.64 | 0.566 | 0.557 | 0.667 | 0.647 | 0.708 | 0.696 | 0.652 | 0.577 | 0.713 | ||
| p-value | <0.001 | <0.001 | <0.001 | <0.001 | <0.001 | <0.001 | <0.001 | <0.001 | <0.001 | <0.001 | <0.001 | <0.001 | <0.001 | <0.001 | <0.001 | <0.001 | <0.001 | <0.001 |
| Order of Magnitude of Initial Frequencies | |||||
|---|---|---|---|---|---|
| Fuzzy sets | AHP Game Theory MBSE Adaptability Flexibility | Resilience Evolvability VDD | SysML Repairability Modifiability Digital twin | ||
| Affordability Modularity | Durability | ||||
| Reliability Optimization DSM | Maintainability Lean Sustainability Interoperability | Risk matrix | |||
| Usability Scalability | Testability | ||||
| Complexity | Robustness Availability | SixSigma Agility | |||
| Quality | Safety | Agile Manufacturability Extensibility Utility theory FMEA | |||
| QFD Taguchi Axiomatic design | Pugh RVTM IPT | ||||
| —Topics that moved vertically and horizontally as compared to Table 3 | |||||
 —Topics that moved only vertically as compared to Table 3 —Topics that moved only vertically as compared to Table 3 | |||||
| Topics | ||||
|---|---|---|---|---|
| * SysML | ~ Modularity | ~ Reliability | / Scalability | # Utility theory |
| * Resilience | ~ Durability | ~ Usability | / Sustainability | # FMEA |
| + Evolvability | ~ Flexibility | ! Maintainability | / Quality | # Pugh |
| + Game Theory | ~ Lean | / Availability | / Testability | # Taguchi |
| + MBSE | ~ DSM | / Complexity | / Extensibility | # Agile |
| + Adaptability | ~ Interoperability | / Risk matrix | / Agility | # QFD |
| + Repairability | ~ AHP | / Modifiability | / Safety | # RVTM |
| ~ Optimization | ~ VDD | / Manufacturability | / Robustness | ^ Axiomatic design |
| ~ Affordability | ~ Fuzzy sets | / Six sigma | / Digital twin | ^ IPT |
| * Increase in rank > 20 | ^ Decrease in rank >20 | |||
| + Increase in rank between 11 and 20 | # Decrease in rank between 11 and 20 | |||
| ~ Increase in rank between 1 and 10 | / Decrease in rank between 1 and 10 | |||
| ! No change in rank | ||||
| Paper Title | Journal | Year | Keywords Describing Article | Word Frequency Query Results |
|---|---|---|---|---|
| “Engineering Design Models: context, theory and practice” | JOED | 1998 | Design, engineering, model, context, product | Design, product, engineering, model, process, companies, approach, strategy |
| “Development of product design requirements using taxonomies of environmental issues” | RED | 2002 | Manufacturing, environment, taxonomy, requirements, design, DFM, DFE, safety, health, attributes | Design, requirements, products, taxonomy, environmental, manufacturing, approach, DFE, attributes, DFM |
| “System and Software Architecture Reconciliation” | Wiley | 2006 | Software, hardware, architecture, integration, layers, views, viewpoints | System, software, model, architecture, layered, views, methods, functionality, hardware, design |
| “Moral Hazard Strategy and Quality Contract Design in a Two-Echelon Supply Chain” | SS & SE | 2011 | Game theory, principal-agent theory, supply chain, quality, moral hazard, contract, buyer, supplier | Quality, product, supplier, buyer, supply chain, contract, profits, cost, inspection, hazard, moral, design, process |
| “Engineered Resilience for Complex Systems as a Predictor for Cost Overruns” | Wiley | 2016 | Complexity, resilience, MDAP, complex systems, cost overruns, SoS, PLA, SYS, cost changes | Systems, programs, SoS, SYS, PLA, cost, complex, games, effect, change, defense, acquisition |
© 2019 by the authors. Licensee MDPI, Basel, Switzerland. This article is an open access article distributed under the terms and conditions of the Creative Commons Attribution (CC BY) license (http://creativecommons.org/licenses/by/4.0/).
Share and Cite
Bhatia, G.; Mesmer, B. Trends in Occurrences of Systems Engineering Topics in Literature. Systems 2019, 7, 28. https://doi.org/10.3390/systems7020028
Bhatia G, Mesmer B. Trends in Occurrences of Systems Engineering Topics in Literature. Systems. 2019; 7(2):28. https://doi.org/10.3390/systems7020028
Chicago/Turabian StyleBhatia, Garima, and Bryan Mesmer. 2019. "Trends in Occurrences of Systems Engineering Topics in Literature" Systems 7, no. 2: 28. https://doi.org/10.3390/systems7020028
APA StyleBhatia, G., & Mesmer, B. (2019). Trends in Occurrences of Systems Engineering Topics in Literature. Systems, 7(2), 28. https://doi.org/10.3390/systems7020028