1. Introduction
Systemic disruptions in modern companies rarely stay within the function where they first appear. Some market or internal risks can still be localized, but technological change, environmental threats, economic instability, and geopolitical restrictions may simultaneously affect supply, development, production, and financial planning. Recent reviews show that geopolitical disruptions alter both network configuration and the sequence of operational responses, while post-pandemic resilience research has moved beyond preparedness toward recovery, adaptation, viability, and intertwined effects [
1,
2]. Technological development is especially exposed: replacing a critical input may require additional resources, engineering work, revised documentation, and repeated qualification rather than a straightforward purchasing substitution.
Here, organizational resilience refers to the ability to preserve critical technological, human-resource, and financial functions, adapt processes as conditions change, and restore or reconfigure acceptable operating parameters after an adverse impact. Financial, material, and organizational reserves provide a safety margin, but they do not explain how a company responds once a disruption crosses functional boundaries. Recent work on management control shows that resilience measures become operational when monitoring, interpretation, and corrective action are embedded in systems that turn deviations into managerial attention and decisions [
3,
4]. Resilience is therefore not treated as a directly measured dependent variable in this study; the focus is one organizational mechanism through which it may be supported.
In this study, a systemic challenge is understood as a set of external and internal factors that may require strategic or operational changes in established management practices. A systemic disruption is a realized disturbance whose consequences extend beyond the function in which it is initially detected and propagate through interconnected technical, organizational, and economic processes.
The article focuses on the organizational path from the measurable manifestation of a systemic challenge to a response. This path connects the source and observed signal, the process in which the principal consequences are generated, the quantitative estimate of those consequences, the role responsible for professional interpretation, and the management level authorized to change the affected process.
The development and production of technologically complex products combine research, design, testing, and manufacturing processes whose results depend on component availability, specialized competences, and compliance with technical requirements. For a high-technology enterprise, replacement of a critical component may require additional funding, revision of design documentation, technical qualification of an alternative, and additional testing, increasing both cost and lead time. At the production stage, the same disturbance can instead appear through loss of completeness, changes in the assembly sequence, delayed shipment, and postponed revenue. An external disruption can therefore be transformed into different technical, time, and financial consequences depending on the process in which it develops.
An estimate of potential losses does not, by itself, show who should alter the course of work or on what basis. Procurement holds information on suppliers and deadlines; developers and test specialists understand technical constraints; and the project manager and the economic department assess the implications for the budget and expected result. These views are formed in different parts of the organization and may be compared only after the initial problem has already reached other processes. The analysis therefore has to follow the information flow from signal recording and consequence assessment to a decision by a role with sufficient authority. It must also account for the links among development, testing, supply, and production and for the way these links change under external pressure [
5,
6]. Revising a technical solution rarely stays within one function: work is redistributed, additional competences are involved, information flows change, and actions have to be coordinated [
7,
8,
9,
10].
Existing research explains many parts of this problem, but not the full organizational connection among them. Dynamic-capabilities research, supply-chain resilience, corporate risk management, and quantitative risk assessment address different stages of the response. Recent studies describe cross-functional resilience processes [
11], show how supply concentration can shift from coordination benefit to rigidity [
12], examine managerial sensemaking under supply-chain risk [
13,
14], identify management-control systems that embed resilience in ordinary routines [
3,
4,
15], and analyze decision environments that affect response quality and speed [
16]. Quantitative methods estimate downside exposure. Less explicit is what happens next: how that estimate is linked to the process where consequences accumulate, transferred to an accountable role, escalated to a suitable decision level, and later compared with the realized result. This organizational interface, rather than resilience in general, is the gap addressed here.
The study develops and examines a process-role model connecting an observed disruption signal with the affected process, expected financial deviation, an accountable organizational role, the locus of decision authority, a feasible corrective action, and a later feedback step. Empirical analysis is limited to the forward part of this sequence in two contrasting process contexts; the feedback mechanism is left for longitudinal validation.
None of these elements is claimed as novel on its own. The paper does not propose a new resilience score, nor does it present process ownership, decision rights, or Monte Carlo simulation as new concepts. The article’s contribution is a process-role interface that integrates, within a single disruption episode, process-specific propagation, downside financial assessment, process responsibility, and decision authority while explicitly distinguishing case evidence, model-based estimates, case-derived interpretation, and design propositions.
The study aims to answer the following questions:
RQ1. How does the propagation trajectory of a similar external disruption differ between R&D and production processes in technologically complex projects?
RQ2. How can the financial consequences of these disruption trajectories be quantified under scenario uncertainty?
RQ3. How can the resulting quantitative assessment be linked to the affected process, organizational responsibility, and an appropriate managerial response?
Given the exploratory comparative design, the paper is organized around these three research questions rather than hypotheses that the available data cannot test.
2. Literature Review and Theoretical Background
The concept of resilience is used to characterize the ability of economic and organizational systems to maintain functioning in the face of adverse impacts. Early studies emphasized persistence and recovery after a shock; subsequent work expanded the construct toward adaptation, reconfiguration, and learning [
17,
18,
19,
20,
21,
22]. Recent reviews further show that organizational resilience is not reducible to one stable capability or one optimum state. It often requires managing tensions between efficiency and slack, centralized control and local adaptation, stability and transformation [
23]. This broader understanding is important for technologically complex projects, where restoring the exact pre-disruption configuration may be technically impossible or economically irrational.
At company level, resilience concerns the management system as well as production and finance. Here it is understood as the management system’s ability to maintain critical functions under systemic challenges, adapt processes and resource allocation, restore acceptable operating parameters, and use lessons from earlier decisions in subsequent responses. A simple return-to-baseline definition is too narrow for this setting because, after a disruption, the previous configuration of resources, suppliers, and processes may no longer be feasible or economically viable.
Recent empirical and review studies make the managerial side of resilience more explicit. Wulandhari et al. show that organizational structure and managerial sensemaking shape how supply-chain risks are assessed and acted upon [
13]. Weber et al. identify a still underdeveloped boundary between organizational resilience and management control and argue that resilience measures need to be anchored in ordinary control systems that translate strategic intent into managerial action [
3]. Phan et al. report positive associations between interactive and belief systems of control, organizational resilience, and performance [
4], while Tucker and Alewine show, from NASA programmes, how procedures, error detection, accountability, and learning mechanisms influenced recovery after severe failures [
15]. These studies shift attention from the possession of reserves to the organizational processes through which information is interpreted and action is coordinated.
Resilience must be distinguished from sustainable development and risk management. Sustainable development reflects the long-term focus of a company’s activities and involves aligning economic, social, and environmental outcomes. Risk management defines the procedures for identifying, assessing, and treating risks. Resilience characterizes a company’s ability to maintain control and restructure operations in the face of an existing or developing disruption, the consequences of which may extend beyond the boundaries of a single function.
This view requires a systemic boundary around the company. The relevant boundary is not the formal organization chart but the technical, organizational, informational, and economic links through which the consequences of a disturbance are transmitted [
5,
6,
24,
25,
26]. The initial impact may originate outside the company, while the main losses arise inside it—at functional interfaces, during information transfer and technical coordination, or through delayed management decisions [
27,
28,
29,
30,
31,
32,
33].
Analysis must therefore follow the trajectory of the disturbance as well as its initial probability and scale. This is especially important in companies that develop and manufacture technologically complex products. Having a component available does not necessarily make it usable. Compatibility with the product architecture, possible software changes, available engineering expertise, the time needed to qualify an alternative, and retesting all matter. As resource specificity increases, replacement tends to involve a wider set of processes.
Replacement of a critical component is therefore neither a purely procurement nor a purely technical task [
7,
8,
9,
10]. Procurement assesses availability and delivery terms; engineering determines whether an alternative can be used; testing specialists decide what additional verification is needed; the project manager evaluates schedule effects; and the economic department estimates costs and cash-flow consequences. A locally attractive decision can still worsen overall project performance. A cheaper alternative, for example, may not offset the cost of documentation changes and testing, while a shorter delivery time may offer little benefit if design modifications are still required.
Dynamic-capabilities theory links organizational adaptation to recognizing change in time, choosing a response, and restructuring the resource base [
34,
35,
36,
37]. It helps explain why companies with similar resources can react differently to the same external pressure. Resources matter, but so does management’s ability to change how they are used.
Dynamic capabilities, however, remain a broad category and do not always show how adaptation unfolds in a particular management situation. To make that process observable, one must trace the sequence from the first signal to the assessment of the action taken: who registers the deviation, which unit evaluates its technical and operational consequences, where the financial effect is calculated, and who can authorize a change in budget, schedule, or technical solution. Without this procedural detail, adaptability remains a company-level characteristic rather than an observable sequence of actions.
Supply-chain resilience research provides a more detailed account of disruption propagation. The literature has moved from a primary concern with reserves and restoration toward the ability of a chain to remain viable through adaptation and reconfiguration [
38,
39,
40,
41,
42]. A central concept is the ripple effect, in which an initial disturbance spreads through related operations and organizations [
30,
31,
43,
44]. Its scale depends on the event itself, but also on network structure, process flexibility, reserve capacity, information availability, and coordination speed [
45,
46,
47,
48,
49,
50,
51].
The post-2020 literature sharpens this process perspective. Ivanov identifies a shift from preparedness and disruption prediction toward recovery, proactive adaptation, viability, and intertwined-network effects [
2]. Stentoft and Mikkelsen develop a structured cross-functional process for supply-chain resilience that moves from mapping and vulnerability identification to prioritization and action plans [
11]. Nikookar et al. show that configurations of managerial and organizational capabilities may matter more than isolated resilience “ingredients” [
52], and Pu et al. demonstrate that managerial cognition, human capital, and social capital are connected to sensing, seizing, and reconfiguring capabilities [
14]. These results support treating disruption response as a sequence of coordinated activities rather than as a property that can be inferred from one resource or one department.
For companies using technologically specific components, the availability of an alternative supplier does not always ensure process recovery. A new resource may require qualification, design modifications, software adjustments, or recertification. For this reason, the supply recovery time cannot be considered the sole indicator of resilience. The place of the resource in the product’s technical architecture and the dependency of subsequent processes on it must be considered.
Digital models, enterprise analytics platforms, and digital twins expand the capabilities of supply chain monitoring, scenario analysis, and stress testing [
53,
54,
55,
56]. However, increased information transparency does not necessarily translate into reduced management response time. Data acquires practical value only when it is associated with a specific process, responsible entity, and level of authority. Without such a connection, digital monitoring allows for faster detection of deviations, but does not eliminate organizational delays in selecting and approving a solution.
That still leaves the question of who acts on the information. Process-ownership research treats the process owner as a governance role responsible for end-to-end performance and cross-functional coordination, not merely for the local task where a signal is first recorded [
57]. Organizational economics distinguishes formal from real authority, and recent work shows that decision sequence and information timing can affect coordination [
58]. Under disruption, the decision environment can also shape response speed and quality; Bukoye et al. find that different environments call for different combinations of control and adaptability [
16]. Together, these arguments support separating the unit that records a signal, the owner of the affected process, and the level with authority to alter schedule, budget, design, or customer commitments.
Corporate risk management already provides a sequence of identification, analysis, response, and monitoring and links these activities to strategy and performance [
59,
60,
61,
62,
63,
64,
65,
66]. Centralization, however, does not remove differences in how the same event is interpreted across functions. Technical, financial, production, and procurement units work with different data and criteria and may judge the same deviation differently. The managerial problem is therefore not simply to aggregate indicators, but to organize interaction among these professional areas and determine where the decision should be made.
Risk management and resilience are closely related here, but they are not interchangeable. Risk management provides procedures for identified risks; resilience concerns the company’s ability to retain control and adapt when consequences spread across processes and initial parameters change rapidly. Regulations alone cannot ensure such resilience if information is delayed, responsibility is unclear, or decision authority sits at the wrong level for the disruption.
Quantitative assessment places the potential consequences of a disruption against the parameters of a project or production program. NPV alone is insufficient for investment and project decisions because it does not show the range of outcomes or sensitivity to changing initial conditions. Scenario analysis and Monte Carlo simulation address this by producing a distribution of possible outcomes and allowing its unfavorable tail to be examined separately [
67,
68,
69,
70,
71,
72,
73]. NPV-at-Risk expresses the potential reduction in net present value under the adopted scenario assumptions [
70].
More simulation runs do not compensate for a weak model. Assessment accuracy still depends on which factors are included, how reliable the probabilities are, how the factors are related, and how their consequences enter cash flows [
74]. When scenario probabilities rely on experts, the result also depends on expert selection, question design, reconciliation of judgments, and documentation of assumptions [
74]. Increasing the number of runs cannot remove errors in model structure.
Recent work on resilience metrics also argues against giving a financial threshold more meaning than it can carry. Bruckler et al. distinguish metrics for absorptive, adaptive, and restorative capacities and link them to different resilience actions [
75]. A single downside percentile should therefore not be read as a general measure of organizational resilience. Cost creates a similar caution: resilience choices have to be considered together with their economic consequences because both overinvestment and underinvestment can be inefficient [
76]. In this study, NPV-at-Risk is used as one decision input, not as a resilience index or an automatic escalation rule.
A quantitative estimate becomes useful only when it informs a specific decision. It is not a universal threshold for acceptable damage and cannot be transferred mechanically from one project to another. Its role is to place the expected deviation alongside budget, schedule, technical constraints, and existing commitments. The decision level then depends on the financial value together with technological significance and the available time reserve.
Once a measure has been implemented, the forecast can be compared with what actually occurred. That comparison can inform later scenario probabilities, thresholds, qualification durations, and response methods. A similar coordination logic is visible at the interorganizational level in innovation ecosystems, where stability depends on the alignment of resources, knowledge, competences, and management decisions [
77]. Experience becomes organizational learning when it moves beyond the tacit knowledge of individual specialists and is incorporated into regulations, information systems, and later calculations [
78,
79,
80]. Research on enacted learning likewise shows that disruption experience strengthens resilience only when organizations interpret events and convert them into capabilities used in later recovery and mitigation [
81].
The relevant knowledge is already present in several research streams, but it is dispersed. Systems and sociotechnical approaches explain interdependence among technical, organizational, and informational elements. Dynamic-capability and supply-chain research address sensing, reconfiguration, and cascading effects, while corporate risk management, business process management, organizational design, and management control deal with response procedures, process ownership, decision rights, and the translation of information into action. Quantitative methods add downside assessment, and organizational learning explains how earlier responses may alter later routines. The unresolved issue is how these pieces are joined around a single disruption episode.
This leads to a narrower research gap. Existing studies explain disruption propagation, organizational resilience, quantitative risk assessment, management control, and adaptive response in considerable depth. What is less clearly specified is the organizational interface that connects a quantified disruption signal to the process where consequences accumulate, an accountable process owner, a decision level with sufficient authority, and a later comparison with the realized outcome. The process-role model structures this interface. Its novelty lies in integrating these components with process-specific disruption propagation and downside NPV assessment in two technologically complex cases, not in claiming novelty for the components themselves (
Table 1).
3. Process-Role Model of Monitoring Systemic Disruptions and Management Response
The model starts from a simple premise: a company’s resilience cannot be represented by one directly observable indicator. Resilience is not estimated as a dependent variable here. The empirical focus is the forward sequence from a disruption signal to management response, reconstructed at different evidential levels: a disruption signal is identified, the process where the principal consequence arises is located, potential impact is estimated, responsibility for interpretation is assigned, a decision locus is identified, and a corrective action is specified. Returning from the actual outcome to revised probabilities and response rules remains a design proposition rather than an empirically validated result.
Two elements organize this sequence. The process element follows the disruption through interconnected activities; the role element identifies who records data, interprets the signal, assesses consequences, prepares and authorizes decisions, and monitors implementation. Bringing them together distinguishes the place where the deviation is first seen from the process where its main consequences are formed and from the role that can change the situation.
The system boundary follows the management task rather than the organization chart: it runs from a recorded disruption signal to a response. Within that boundary are the source of influence, observed signal and data, affected process, impact assessment, process owner, decision locus, corrective action, and a proposed feedback step. Organizations may allocate these functions differently, but the functional sequence remains the same—from verified information to process interpretation, assessment, authorized action, and comparison with the outcome.
Table 1 summarizes the theoretical grounding, organizational function, and evidential status of each element.
The empirical analysis applies the model to constraints involving component availability and changes in supply chains. An external constraint enters corporate monitoring only when it appears in measurable company data. Relevant indicators include the number of critical components without a confirmed equivalent, replacement-qualification time, deviations of actual from planned delivery dates, and changes in purchasing costs. Their dynamics make it possible to trace the development of a disruption and assess its potential consequences for a project or production program.
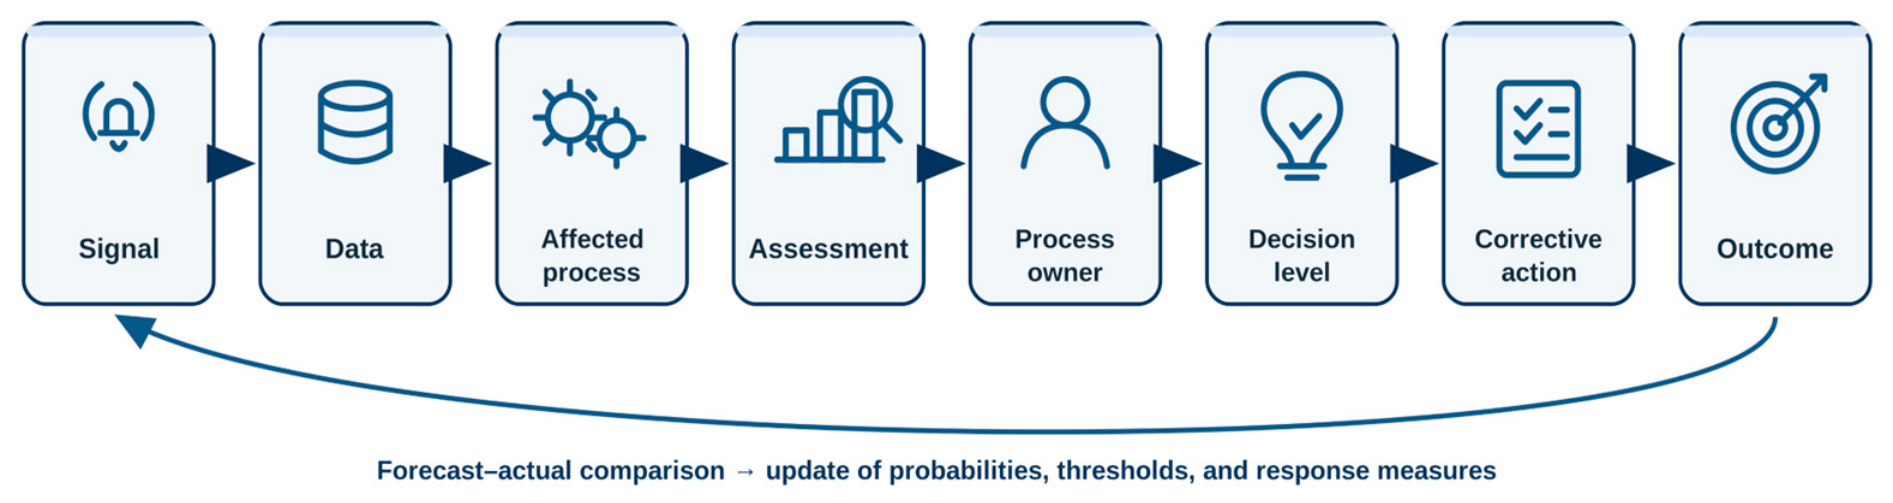
The affected process is determined not by the location of the initial event recording but by the mechanism that generates the primary consequence. A signal may be first recorded by the procurement department, while the primary technical, time, or financial consequences arise during development, testing, or production. Therefore, the department recording the signal and the owner of the affected process may not coincide (
Figure 1).
In
Figure 1, the forward sequence corresponds to the empirical case analysis, whereas the return arrow denotes a proposed feedback loop that requires longitudinal validation.
Primary information is generated by the department directly affected by the disruption. The procurement department records changes in component availability and delivery times; engineering departments assess the need for documentation adjustments and additional testing; production determines the impact of the disruption on equipment availability and utilization; and the planning and economics department calculates the impact on costs and cash flows. At each stage, the information is refined based on the professional competences of the relevant departments.
The central management problem is to reconcile technical, time, and cost consequences within one decision. A cheaper alternative may still require additional testing, documentation changes, and production delays; a technically acceptable replacement may exceed the project budget or threaten customer commitments. The assessment therefore has to reflect the effect on the company as a whole rather than only on the department where the disruption was first detected.
The model does not require a separate scenario-modelling department. Its organizational configuration depends on company size and structure, and the functions can remain with existing departments or be handled by a cross-functional team. What matters is that responsibility for data quality is explicit, the owner of the affected process is identifiable, and the authority needed to change process parameters is clear.
Not every deviation requires senior management involvement. The model should distinguish between updating information and decision-making within a single function, cross-functional coordination, changing project or production program parameters, and reviewing decisions affecting the company’s strategic commitments.
The decision-making level is proposed to be selected not by a single financial value but by considering the expected financial deviation together with the technological and operational significance of the disruption and the available time reserve. This is an organizational design rule, not a relationship empirically tested in the present dataset. A large financial deviation may justify escalation, but a comparatively small deviation can require the same response if the disruption concerns a critical component, a near-term qualification milestone, or a customer commitment. The logic also reflects the distinction between process ownership and decision rights: the role that understands the affected process is not necessarily the role authorized to change the budget, design, or project commitment [
57,
58] (
Table 2).
Table 2 presents a proposed escalation logic based on disruption scale, technological criticality, contractual consequences, and urgency. It should be read as a decision-support rule derived from the model rather than as a validated causal relationship.
A corrective measure does not end the management cycle. Each event should retain the date of signal registration, initial probability assessment, predicted consequences, decision taken, actual disruption duration, incurred costs, and resulting deviation. Over time, these records create groups of comparable events and allow forecasts to be compared with realized parameters.
An event history can then be used to revise the model. If qualification of an alternative component repeatedly takes longer than forecast, scenario duration and escalation criteria can be adjusted; if safety stock reduces production delays, that realized effect can inform later decisions. Organizational learning occurs when individual experience is incorporated into corporate data, regulations, thresholds, and standard procedures. This logic is consistent with recent evidence on enacted learning in supply-chain resilience [
81].
4. Materials and Methods
The study uses a comparative two-case design. Case-study methodology is appropriate because the research questions concern how disruption-response processes unfold within their organizational and technological context [
82]. The two cases were selected through theoretical replication rather than statistical sampling: they belong to the same broad telecommunications and electronics setting and are exposed to a similar class of component and supply-chain disruptions, but their core process logics differ [
83]. Case 1 represents R&D for a software and hardware measuring complex designed to measure crosstalk attenuation and transmit data to a dispatch-control system; Case 2 concerns production of equipment for transmitting data over optical channels. The expected contrast is that a similar external disturbance will propagate through engineering qualification and testing in the first case and through completeness, production scheduling, and shipment in the second.
The unit of comparative analysis is the disruption-response process within each case rather than the company as a whole. In Case 1, the relevant processes primarily include development, updating design documentation, qualification of replacement components, and testing. In Case 2, the primary focus is on delivery regularity, completeness, capacity utilization, production scheduling, and order fulfillment. The cases are therefore analytically contrasting rather than statistically representative. Their comparison is used to trace whether the unit that first records the signal coincides with the process where the main consequences are generated and to identify differences in the distribution of responsibility, observable indicators, and feasible corrective measures (
Table 3).
The quantitative analysis drew on corporate data marts, management reports, fi-nancial data cubes, and data from QlikView 12.70 (QlikTech International AB, Lund, Sweden) and Qlik Sense Enterprise on Windows May 2022, version 14.67.7 (QlikTech International AB, Lund, Sweden) business-analytics platforms. The dataset covered 71 monthly observations from January 2020 to November 2025. The 1773 daily records were aggregated to construct the monthly indicators used for factor screening and were also examined as an event chronology for delivery delays, critical-component availability, and production-schedule status; they were not treated as independent regression observations.
For the process-role analysis, the same corporate records were read as an event sequence, with attention to where a deviation was first recorded, where its main consequences accumulated, and which roles were involved in interpretation and response. For each case, we identified:
The department that initially recorded the deviation;
The indicator in which it was measurably expressed;
The process where the majority of the consequences were generated;
The party responsible for interpreting the situation and preparing the solution;
The required level of authority;
A possible corrective measure.
The resulting process-role map is an analytical reconstruction of the management situation, not a universal organizational structure intended to apply unchanged across companies.
Multiple linear regression served only as an auxiliary factor-screening step and is not used as causal or confirmatory evidence in this article. To make this screening step transparent, the candidate-factor results are reported here. For Case 1, the p-values were 0.0269 (T1), 0.2250 (T2), 0.6501 (T3), 0.1966 (T8), 0.4931 (T10), 0.1389 (T11), and 0.0089 (T15); for Case 2, they were 0.0169, 0.2350, 0.6601, 0.1966, 0.5031, 0.1489, and 0.0105, respectively. The adjusted R2 values were 0.7508 for Case 1 and 0.7507 for Case 2. T1 and T15 were retained for scenario analysis because they were statistically significant at the 5% level in both cases and their process manifestations could also be traced in the corporate records. Their selection is not interpreted as evidence that these factors are statistically dominant beyond the cases examined.
A systemic challenge entered the quantitative analysis only after an observable manifestation had been identified in corporate data. Operationalization then served two purposes: it translated the external impact into an indicator suitable for statistical and scenario assessment and identified the process through which the main technological, time, and financial consequences were formed (
Table 4).
For T15, the cost and time channels were treated separately. At the screening stage, changes in logistics costs were considered, whereas the scenario analysis reported here varied delivery-delay duration. The distinction matters because these two effects represent different consequence channels of the same systemic challenge.
The simulation was conducted using the Monte Carlo method in Oracle Crystal Ball 12c (Oracle Corporation, Austin, TX, USA) with 100,000 iterations. For each factor, the model specified the probability of occurrence, a set of event scenarios, the conditional probability of each scenario, and the corresponding change in cash flows and NPV.
Table 5 reports the scenario anchor points and probabilities in discrete form for interpretation; in the simulation, intermediate values between those anchors were represented through piecewise-continuous intervals.
For each case, a planned net present value
calculated in the absence of the disruption in question was used. When scenario
s of factor
i was realized, a corresponding scenario value
was generated. The reduction in NPV was determined as the difference between the planned and scenario values:
where
i denotes the factor of systemic disruption,
j is the case under consideration, and
s is the scenario of its implementation.
The probability of the baseline state, in which the factor under consideration is not realized, was taken to be 0.60. The probability of the factor’s occurrence was 0.40. The unconditional probability of an individual scenario was calculated as the product of the probability of the factor’s occurrence and the conditional probability of the given scenario:
where
Fi is the event consisting of the occurrence of the
ith factor;
Sik is the
kth scenario realized upon the occurrence of factor
Fi;
P(
Fi) is the probability of the occurrence of the
ith factor;
P(
Sik|
Fi) is the conditional probability of the realization of the
kth scenario upon the occurrence of the
ith factor; and
P(
Sik) is the unconditional probability of this scenario.
For T1 and T15, the occurrence probability of 0.40 and the scenario weights were derived from recorded analogous events and corporate historical statistics. No formal expert panel or Delphi aggregation was used to parameterize these two distributions.
Given factor occurrence, the scenario weights were 0.50, 0.30, and 0.20 for T1 (cost increases of 10%, 15%, and 20%) and 0.50, 0.40, and 0.10 for T15 (delivery delays of 3, 6, and 9 months). Multiplication by
P(
Fi) = 0.40 gives the unconditional probabilities in
Table 5. Crystal Ball represented T1 on a technical 0.80–1.00 scale: intervals 0.80–0.85, 0.85–0.90, 0.90–0.99, and 0.99–1.00 carried weights 0.08, 0.12, 0.20, and 0.60. For T15, the intervals were 0–0.01, 0.01–3, 3–6, and 6–9 months, with weights 0.60, 0.20, 0.16, and 0.04. These are implementation settings in Crystal Ball; the economic interpretation is given by the scenario anchors in
Table 5.
The single-factor effects of T1 and T15 were interpreted separately. Dependence between the two factors was not estimated. Their possible co-occurrence is therefore examined through a deterministic compound sensitivity test rather than through an assumed joint probability. Three paired states are considered: moderate (+10% T1 cost and a 3-month T15 delay), central (+15% and 6 months), and severe (+20% and 9 months). As a first-order approximation, the single-factor NPV reductions from the paired scenarios are added. This may overstate impact if the factors affect overlapping cash-flow items and may understate it if delay triggers additional engineering or contractual effects. The test is used only to determine whether co-occurrence is material enough to change the interpretation of the single-factor results; it is not a second probabilistic model.
For each scenario, the initial cash flow was adjusted according to the economic content of the factor under consideration. For factor T1, the calculation included an increase in the costs of finding and qualifying a new supplier by 10, 15, or 20% relative to the baseline. For factor T15, the corresponding cash flows were postponed by 3, 6, or 9 months. After adjusting the cash flows for each scenario, the NPV was recalculated, and its reduction was determined as the difference between the planned and scenario values.
Table 5 documents the economic scenario anchors and the corresponding single-factor NPV reductions. The RUB 75 million and RUB 62 million values reported below summarize the lower tail of the case-level NPV distributions obtained in Crystal Ball. They are not obtained by selecting or summing individual rows of
Table 5, nor do they represent a joint T1–T15 probability. Co-occurrence is examined separately through the deterministic stress test.
Let NPV0 denote the planned net present value for a case in the absence of the modelled disruption and NPV* the corresponding case-level NPV output generated by the Monte Carlo simulation. The downside threshold is defined consistently as ΔNPV0.95 = NPV0 − Q0.05(NPV*), where Q0.05 is the lower 5th percentile of the simulated NPV distribution. Equivalently, if loss is defined as L = NPV0 − NPV*, the same downside concept is the 95th percentile Q0.95(L). The reported RUB 75 million and RUB 62 million values should therefore be read as case-specific downside thresholds under the adopted scenario assumptions, not as universal resilience scores or guaranteed upper bounds on actual future losses.
The threshold is not a reserve standard and does not by itself imply project termination. It indicates the scale of unfavorable deviation under the specified scenarios and can support escalation to a higher decision level. The strategic importance of the product, customer commitments, technical alternatives, and available time remain separate considerations.
Quantitative results were compared with three groups of characteristics:
The dynamics of the observed signal;
The technological and operational significance of the disruption;
The magnitude of the expected financial deviation and the available time reserve.
Technological significance was determined by the availability of a confirmed equivalent, the need to modify the design or documentation, additional testing, and the impact of the disruption on critical project stages. Operational significance was characterized by the impact on completeness, production schedule, shipment, and fulfillment of customer obligations.
The time reserve was understood as the period remaining until the onset of a critical milestone of a project or production program, minus the time required to implement a corrective measure.
For the process-role interpretation, the proposed decision level was based on three considerations: financial deviation, technological criticality, and available time reserve. This is a model principle rather than an empirically established rule. For each case and factor, the matrix records:
The observed signal;
The owner of the affected process;
A possible corrective measure;
The decision-making level.
These elements provide the methodological basis for Table 8 in the
Section 5. The process-role relationship there follows the trajectory of consequences rather than a single financial indicator.
RQ1 was addressed by comparing the two cases on four grounds:
The location of the initial signal recording;
The process during which the majority of the consequences were generated;
The composition of the departments involved in assessment and response;
The nature of the technological, time, and financial consequences.
RQ1 is supported within the two cases when a similar class of external disruption follows different internal trajectories because its principal consequence develops in a different process. The design does not estimate a general causal effect of process importance on organizational resilience.
RQ2 is addressed through the scenario and Monte Carlo module, while RQ3 is addressed through process-role mapping. For RQ3, the observed signal and affected process are reconstructed from the cases; the NPV threshold is model-based; process ownership and decision locus are analytical interpretations; and corrective actions and the feedback cycle are design propositions. This evidence hierarchy is used throughout the
Section 5 and
Section 6 so that proposed organizational rules are not presented as empirically validated relationships.
The following analytical procedures were applied to the cases:
A procedure for operationalizing systemic challenges;
Comparing disruption propagation trajectories;
Quantifying the potential reduction in NPV;
Linking the assessment results to the affected process, owner, and decision level.
5. Results
Across both cases, the largest modelled deviations in the scenario module were linked to restricted access to critical components and changes in delivery conditions. What differed was the internal process through which the same broad disruption class produced its consequences.
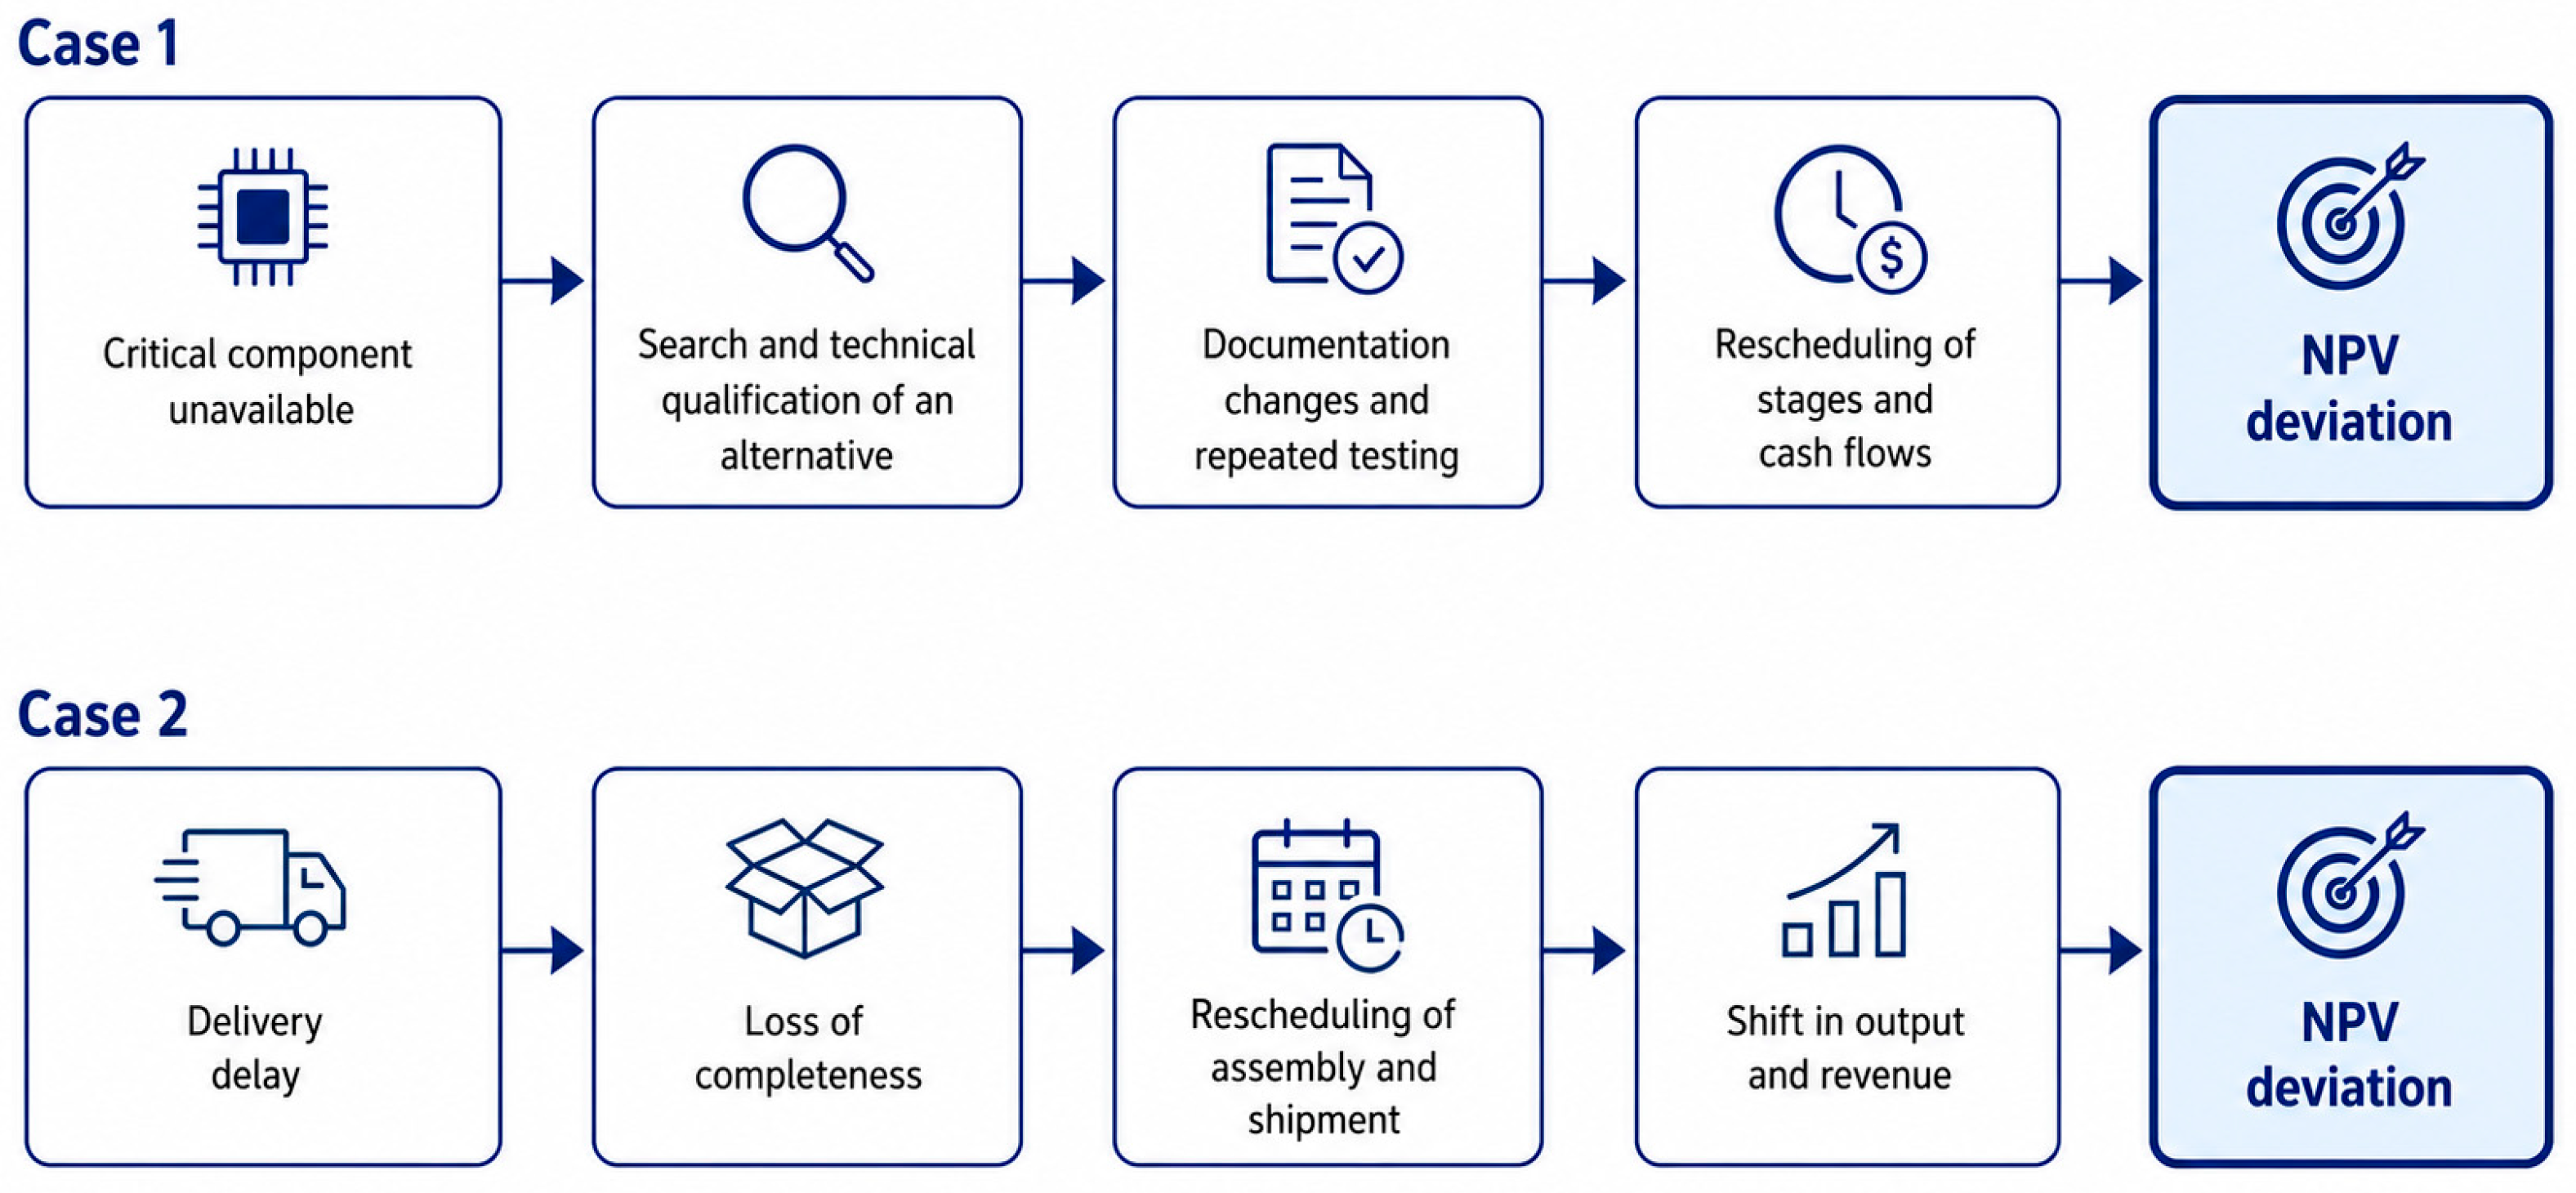
In Case 1, procurement registered the initial signal, but the main consequences developed in R&D. With no confirmed alternative, the project required technical-compatibility checks, clarification of design documentation, software adjustments, and additional testing. The cost of the disruption therefore extended beyond procurement to engineering time and project completion.
In the production of optical data transmission equipment, the consequences of a disruption were primarily related to product completeness and adherence to the production schedule. Component shortages limited production, changed the assembly sequence, and delayed shipping dates. If the replacement did not require significant technical rework, additional engineering costs remained relatively small, but the financial consequences arose earlier due to delayed production and revenue collection.
In Case 1, the procurement function recorded the initial component-related signal, whereas the principal interpretation shifted to the technical service and development manager as qualification and testing consequences emerged. In Case 2, the response required coordination among procurement, production, and planning as delivery delays affected completeness and the production schedule (
Figure 2).
Within the two cases, this contrast answers RQ1: the consequences depend on the external disruption and on the process through which the initial deviation becomes an engineering, scheduling, or cash-flow effect. The evidence does not show that one process is intrinsically more important to resilience than another, nor does it justify transferring these trajectories automatically to companies with different technological architectures.
The scenario model therefore retained two preselected factors: limited access to critical components (T1) and changes in supply chains (T15).
Under the adopted scenario assumptions, the simulation yields a 95% downside NPV threshold of RUB 75 million for Case 1 and RUB 62 million for Case 2. In the notation used in the
Section 4, these values are ΔNPV
0.95 = NPV
0 − Q
0.05(NPV*). They are case-specific model outputs rather than standards of acceptable loss. The largest modelled single-factor reductions are higher—RUB 83 million for Case 1 and RUB 71 million for Case 2—because a scenario endpoint is not the same statistical quantity as the 95th percentile of the simulated loss distribution.
Relative normalization of the downside thresholds by baseline NPV was considered but not retained because comparability of the baseline values and simulated downside thresholds on the same cash-flow horizon and calculation basis could not be established. The results are therefore reported in absolute terms and are not interpreted as relative resilience measures.
Case 1 reaches its largest modelled single-factor reduction, RUB 83 million, when supplier-search and qualification costs rise by 20%. In Case 2, the corresponding maximum, RUB 71 million, occurs with a nine-month delivery delay. The difference follows the process logic of the cases: R&D is more exposed to qualification and technological compatibility, whereas production is more directly affected by disruption duration, completeness, and schedule effects (
Table 6).
This stress test is diagnostic rather than probabilistic (
Table 7). Under the additive approximation, central and severe co-occurrence place combined exposure materially above the single-factor 95% thresholds. The result shows that joint occurrence of T1 and T15 can materially increase exposure. Estimating dependence between the two factors is therefore left to future probabilistic modelling based on event-level data and shared cash-flow channels.
NPV-at-Risk does not determine the management response on its own. A similar financial deviation may call for different action depending on component criticality, the availability of a proven alternative, contractual obligations, and the time remaining before a critical project or production milestone.
The process-role interpretation also shows why a common financial metric does not produce a common management response. The same factor calls for different observed indicators, responsible roles, and corrective measures depending on the process in which its consequences develop.
For the first case, the key observable indicators for factor T1 are the number of components without a confirmed equivalent, the duration, and the cost of qualification. In the proposed model, responsibility for a meaningful impact assessment is assigned to the technical service and the development manager. If a key project milestone changes or the expected NPV decline approaches the established threshold, the issue should be addressed at the project level.
For factor T15 in Case 1 (the R&D project), the delivery-schedule deviation is important not only in itself but also because it can affect the testing program. The response therefore requires coordination between procurement and the development manager and may include changing the testing sequence, revising the schedule, or identifying an alternative delivery channel.
In the production of optical data transmission equipment (Case 2), the key indicators for factor T1 are the share of components without available replacements, procurement cost, and the size of available inventory. The response requires coordination between procurement and production. Factor T15 is interpreted through delivery-schedule deviation, completeness, equipment utilization, and shipment timing. If the disruption threatens customer commitments, escalation may be required beyond the functional level (
Table 8).
Table 8 is not a universal organizational template, nor is every corrective action shown there an observed event. Indicators and propagation paths are case-based; process owner and decision locus are analytical interpretations; and corrective measures are design recommendations. The table instead illustrates why the same financial assessment can lead to different organizational responses when the affected process, technical constraints, and decision time differ.
In Case 1, a relatively small financial deviation may require a solution at the project level if a technically proven alternative is unavailable or retesting is required. In Case 2, a similar financial deviation may be managed at the cross-functional level if sufficient inventory is available and production can be rescheduled.
Therefore, the level of decision-making should be determined by joint consideration of:
Expected financial deviation;
Technological and operational significance of the disruption;
Time remaining to implement the corrective action.
The case analysis informs RQ3 but does not test a general relationship between organizational resilience and the quality or timeliness of corrective measures. The evidence supports a narrower conclusion: the appropriate decision locus cannot be inferred from NPV deviation alone because technological criticality and time reserve alter the feasible response. Whether this decision logic improves resilience requires a longitudinal record of actual decisions and outcomes and therefore remains a proposition for future validation.
The case results were also used to formulate a “forecast–decision–outcome–update” sequence (
Table 9). The record begins with the disruption source, event date, and initial indicator; the forecast adds scenario probability, expected timeframe, costs, and NPV reduction. It should then retain the decision, selected measure, budget, implementation time, responsible parties, and realized operational and financial result.
After implementation, projected values can be compared with actual timeframes, costs, test results, production volumes, shipments, and NPV. Those comparisons can then inform later scenario probabilities, thresholds, and the list of standard measures.
The two cases support reconstruction of the disruption-propagation trajectories; the financial values remain model-based results conditional on the stated scenario assumptions. Process ownership and decision locus are case-derived interpretations. Experience accumulation and parameter updating have not been tested longitudinally and remain a conceptual extension. Validation would require repeated-event data linking the initial signal, forecast, decision, implemented measure, and actual operational and financial results.
6. Discussion
These results support a view of resilience that is broader than returning to the previous state. In the cases studied, preserving key functions may instead require a different supplier, a revised design or testing program, a changed production schedule, or a different allocation of responsibilities. Restoring the original configuration can be technically impossible or economically impractical.
A disruption becomes systemic through the processes it reaches and the way its consequences accumulate, not simply through the size of the initial event. An unavailable component, for example, becomes a company-wide problem when replacement requires documentation changes, repeated testing, postponed milestones, and cash-flow adjustments. This pattern is consistent with research on cascading risks and ripple effects [
30,
31,
32,
33,
43,
44]. The cases add an organizational point: tracing propagation is not enough for response selection. Management also needs to know where the main consequences are being formed, who can assess them professionally, and which level has authority to change the established work procedure.
The two cases also show why a similar external influence need not produce the same response path. In production, safety stock, rapid supplier replacement, and sequencing of operations can be decisive. These measures may be insufficient in R&D, where an available alternative component still has to fit the technical architecture and may require engineering qualification, documentation changes, and repeated testing. The difference is therefore not that one case is generally more resilient; the disruption is transformed by different technical and organizational dependencies.
This gives a case-bounded answer to RQ1. Propagation and the structure of consequences vary with the process in which the primary deviation develops. The issue is not a simple division among procurement, technical, and production functions but the sequence by which the disturbance moves across them and changes departmental roles as it unfolds. This interpretation is consistent with process and configuration views of supply-chain resilience, which emphasize cross-functional alignment and combinations of capabilities rather than isolated resources [
11,
52].
The process-role model makes this organizational interface explicit. A signal is recorded and checked; professional interpretation takes place in the process where consequences accumulate; response preparation may require several functions; and implementation depends on a role with authority to alter a supplier, schedule, budget, design, or project commitment. This reading connects dynamic-capability logic [
34,
35,
36,
37] with process ownership [
57], decision rights [
58], and resilience-oriented management control [
3,
4,
15]. The model remains deliberately narrower than these theories: it does not explain organizational resilience as a whole but specifies how one disruption episode can move from information to coordinated action.
The quantitative module provides a common financial scale for operationally different consequences but it does not determine the response. The RUB 75 million and RUB 62 million downside thresholds apply only to the adopted scenarios and project conditions; they are not standards for acceptable damage. Their role is to complement the technical and operational assessment rather than replace it.
This interpretation is consistent with recent resilience-metrics research, which links different resilience capacities to different measures and actions rather than to a single universal index [
75]. A downside threshold expressed in monetary terms facilitates comparison of scenario exposure but it does not capture technological irreversibility, qualification constraints, competence loss, or contractual timing. The financial measure therefore remains one component of a broader process-level assessment.
RQ3 remains partly interpretive. The two cases show that the choice of decision locus should consider expected financial deviation together with technological significance and available time, but the study does not observe a sufficiently broad longitudinal set of actual decisions to estimate whether these characteristics determine response quality or resilience outcomes. The corresponding escalation logic is therefore a case-informed design proposition, not a validated causal relationship. This distinction is consistent with recent work showing that decision environments and managerial capabilities shape disruption response but require direct behavioral evidence for stronger claims [
14,
16].
Feedback remains a conceptual part of the model. Comparing forecasts with realized outcomes could support later revisions to alternative-component qualification time, safety-stock standards, scenario probabilities, thresholds, and the list of acceptable measures. In that form, experience from a disruption can move from individual professional memory into corporate data and regulations, creating one possible route from monitoring to organizational learning [
78,
79,
80].
That proposed feedback loop should not be confused with an observed learning mechanism. Kaneberg et al. show that disruption experience contributes to resilience through enacted learning and sensemaking, not through data accumulation alone [
81]. Management-control research makes a similar point: feedback matters when routines change later attention and action [
3,
15]. The present dataset does not demonstrate such a recursive effect; it identifies only the information that would have to be retained to test it.
One practical implication follows from this distinction. Responsibility is better attached to the end-to-end processes where disruption consequences are generated than to risk categories alone. Digital integration helps only when technical, procurement, production, and financial roles are connected to clear decision rights and escalation procedures. Data marts, cloud solutions, and digital twins can speed up information acquisition [
53,
54,
55,
56], but unclear authority or weak cross-functional coordination can still delay action.
The study has clear limits. Both cases come from the same technology sector, so companies with standardized products, highly interchangeable components, or different production organization may exhibit different propagation trajectories. Applying the model elsewhere would require re-operationalizing the signals, reconsidering the process structure, and assigning responsibilities for that context.
For T1 and T15, scenario probabilities were derived from recorded analogous events and corporate historical statistics; no formal expert panel was used. Their accuracy nevertheless depends on the completeness and comparability of internal disruption records. T1 and T15 were modelled separately although restricted component access may also produce delivery delay. The compound stress test shows that co-occurrence is potentially material, but it deliberately avoids assigning an unsupported joint probability. A next step is to estimate dependence from event-level data and model shared cash-flow channels directly.
NPV captures only the financial side of the disruption. It does not fully reflect technological readiness, competence retention, or product quality. The model could therefore be extended with several independent indicators, but combining financial, technological, and organizational outcomes into a single index would be difficult to justify.
A useful next step would be a digital prototype linking corporate data, scenario calculations, and decision history. Its evaluation should go beyond forecast accuracy to include information-flow speed, cross-functional coordination, fit between decision level and disruption type, and the realized outcome of the selected measure.
7. Conclusions
The study traced component-related systemic disruptions through technologically complex R&D and production processes and examined how quantified consequences can be linked to organizational responsibility and managerial response. In Case 1, the main consequences arose from searching for and technically qualifying an alternative, changing documentation, and additional testing. In Case 2, they arose through completeness, production scheduling, shipment, and revenue timing.
Within the studied cases, the analysis indicates that a feasible response depends on identifying the process in which consequences accumulate, coordinating across functions, and locating sufficient decision authority. Safety stock or an alternative supplier can provide a reserve, but neither substitutes for engineering validation nor cross-functional decision-making when a component is technologically specific.
The process-role model links the observed signal, corporate data, the affected process, quantitative impact assessment, process ownership, decision locus, and corrective action. In this architecture, quantitative assessment is one input alongside technological criticality, availability of alternatives, customer commitments, and time reserve.
Taken together, the findings answer the three research questions at different evidential levels. The case comparison supports RQ1: similar component and supply-chain disruptions follow different internal trajectories in R&D and production. RQ2 is addressed through the case-specific downside thresholds of RUB 75 million and RUB 62 million under the adopted scenario assumptions, supplemented by an illustrative additive T1–T15 sensitivity test showing that co-occurrence may generate larger combined exposure. The answer to RQ3 remains interpretive: a quantitative result becomes actionable only when it is connected to the affected process, an accountable role, and a decision locus. The feedback mechanism remains a proposition for longitudinal validation.
The article’s conceptual contribution is a process-role interface that integrates process-specific disruption propagation and downside financial assessment with process responsibility and decision authority while keeping case evidence, model-based estimates, case-derived interpretation, and design propositions analytically distinct. Practical use depends on reliable event data, a documented cash-flow model, agreed ownership of affected processes, and escalation rules that weigh financial exposure alongside technological criticality and time reserve. Other companies would need to re-operationalize and recalibrate the model rather than reuse the reported numerical thresholds.