Article

The Risk-Growth Tradeoff of Customer Concentration and Stability: When AI Orientation Matters

1
School of Management, Harbin Institute of Technology, Harbin 150001, China
2
Business School, Harbin Institute of Technology, Harbin 150001, China
*
Author to whom correspondence should be addressed.
Systems 2026, 14(9), 1104; https://doi.org/10.3390/systems14091104
Submission received: 24 July 2026 / Revised: 1 September 2026 / Accepted: 4 September 2026 / Published: 7 September 2026

Highlights

Please indicate how your work links to systems science via your contributions to systems practice, theory, and/or methodology.
This study contributes to systems science by examining how the structure and continuity of interfirm relationships relate to firm performance within supply chain systems.
For systems practice, the findings highlight the importance of considering customer portfolio structures and AI orientation jointly when managing growth opportunities and risk exposure.
What are the main findings and/or the implications of the main findings?
Customer concentration is associated with higher volatility and growth, while customer stability presents opposite effects.
AI orientation plays a moderating role, especially among firms with lower supply chain power.

Abstract

Although customer relationships are crucial to both firms’ growth potential and risk exposure, little is known about how customer concentration and stability differentially affect these outcomes. Drawing on resource dependence theory and technology affordance theory, this study explores the impact of these two key features of customer relationships on the tradeoff between risk and growth, as well as the moderating role of artificial intelligence (AI) orientation. Using annual data from Chinese A-share listed companies between 2013 and 2024, we derive relationship measures from major customer disclosures, capture risk and long-term growth through stock volatility and cumulative sales growth, and measure AI orientation through textual analysis of annual reports. The results suggest that major customer concentration is associated with higher stock volatility but stronger sales growth, whereas major customer stability is related to lower volatility but weaker growth. AI orientation strengthens the volatility-reducing effect of stability and the growth-enhancing effect of concentration. These moderating effects are stronger among firms with weaker supply chain power. By integrating the cross-sectional distribution and temporal continuity of customer portfolios, we reveal the pronounced risk-growth tradeoff embedded in buyer-supplier relationships and also provide theoretical and practical insights into the differentiated value creation potential of AI orientation, thereby extending the literature related to technology affordance theory.

1. Introduction

Modern companies are often expected to pursue rapid growth while keeping operational risk manageable, yet these two objectives often place competing demands on organizational resources and strategic decision-making [1]. Growth requires investment, experimentation, and entry into uncertain markets, whereas risk reduction tends to favor more predictable activities and established resource commitments. Excessive caution may preserve short-term stability at the expense of future expansion, while aggressive growth may leave firms more exposed to unexpected losses and performance volatility [2,3]. Striking an appropriate balance between growth and risk is therefore a critical challenge for firms seeking sustained development.
Buyer-seller relationships provide a crucial lens for examining such tension faced by firms, particularly the relationship with major customers both are the source of resources and uncertainty as they determine a significant portion of the revenue. Prior studies have revealed these benefits and risks through different aspects of the customer portfolio. Ak and Patatoukas find that manufacturers with more concentrated customer bases hold less inventory for shorter periods, suggesting that concentration can enhance coordination and operating efficiencies [4]. Dhaliwal et al., however, show that customer concentration increases suppliers’ cost of equity, especially when the likelihood or consequences of losing a major customer are greater [5]. Beyond how transactions are distributed across customers, their continuity over time also matters. Irvine et al. find that the relationship between customer concentration and supplier profitability becomes more favorable as customer relationships mature [6], while Liao et al. and Geng et al. show that customer stability is associated with lower cost of debt and higher productivity, especially under greater environmental uncertainty [7,8]. These findings suggest that understanding how buyer relationships influence the trade-off between risk exposure and growth opportunities may require focusing on both the structure and the continuity of the customer portfolio.
Despite these advances, our understanding of how customer relationships shape firm performance remains fragmented. First, prior studies have focused primarily on customer base concentration, with customer stability receiving attention only in recent years. Because these two attributes are generally examined separately, making their findings difficult to compare and integrate within a common framework. As Gu et al. point out, very few studies have simultaneously considered stability and exclusivity, two seemingly similar but distinct dimensions of buyer-seller relationships, leaving the definition of a “healthy” relationship still controversial [9]. The few studies that look at both attributes focus mostly on overall financial performance or trade credit arrangements [9,10], while having yet to conceptualize risk and growth as interrelated and potentially conflicting elements of business performance, or to examine how different customer portfolio structures affect these dimensions in various ways. Second, limited attention has been paid to the conditions that shape these relationships, particularly the potential role of artificial intelligence (AI). As one of the most revolutionary digital technologies available today, it is made up of machine learning-based algorithms that identify, generalize, and transfer probability structures in datasets [11]. Its most distinctive feature is the ability to perform cognitive tasks previously considered exclusive to humans, which turns AI from a technological tool into an active collaborator [12]. Previous research has shown that AI adoption can aid in demand identification and personalized service delivery [13], as well as supplement management competencies and support decision-making [14]. Nevertheless, these studies mostly focus on efficiency improvements in specific business activities but do not clarify whether AI alters the economic outcomes arising from different customer relationship structures. In fact, such moderating effects cannot be simply inferred from the basic premise that AI is generally beneficial since different sorts of customer relationships provide fundamentally distinct information foundations, such that concentration primarily reflects issues related to power structures and risk-taking, whereas stability captures relationship quality and continuity of information flows.
Based on these two gaps, we pose the following three key questions. First, how do the critical structural features of customer relationships (i.e., concentration and stability) affect the tradeoff between risk and growth of a firm? Second, does a firm’s strategic focus on AI (i.e., AI orientation) play a moderating role in these relationships? Third, does the moderating effect of AI orientation vary systematically across enterprises with different organizational characteristics? We use a sample of Chinese A-share listed companies from 2013 to 2024 to conduct empirical analysis to address these issues. Our findings indicate that major customer concentration enables firms to achieve higher growth but also increases volatility. Conversely, major customer stability reduces volatility while constraining sustained growth. We further construct a firm-level AI orientation measure based on annual reports to examine its moderating role. The results show that AI orientation enhances the volatility-mitigating impact of stability and the growth-promoting influence of concentration. These moderating effects are significantly stronger among firms with weaker supply chain power, whereas the analyses across levels of supply chain digitalization yield only suggestive subgroup patterns.
The incremental contributions of this research are twofold. First, it advances research on buyer-seller relationships by integrating customer concentration and stability within a common risk-growth framework. We distinguish concentration as the cross-sectional distribution of sales across major customers from stability as the continuity of customer identities over time and examine their implications for corporates’ volatility and growth. The findings suggest that these two attributes are not mutually substitutable and give rise to differentiated tradeoff logics in terms of risk buffering and growth promotion. This framework connects previously separated streams of research and offers a more nuanced account of the long-term performance implications of customer relationships. Second, we extend technology affordance theory (TAT) literature by identifying customer portfolios as a relational context that shapes the realization of AI affordances. Different from the studies that primarily focus on the direct outcomes of AI, we reveal the differential impacts driven by AI orientation through the lens of TAT. We argue that AI orientation focuses managerial attention and resource commitments toward AI-enabled opportunities, while the data and task conditions embedded in customer relationships determine which opportunities can be realized. Moreover, by incorporating supply chain power configuration and supply chain digital infrastructure, we conduct a stratified examination of the contextual heterogeneity in the moderating effects, thereby deepening the understanding of the contingencies that shape AI-driven value.

2. Theoretical Analysis and Hypothesis Development

2.1. Customer Concentration and Stability

A firm’s customer relationship portfolio can be characterized along two key dimensions: customer base concentration, which captures the extent of dependence on a small number of major customers, and customer stability, which reflects the continuity of major customer relationships over time. Prior studies have shown that high customer concentration is often associated with greater risk exposure and weaker bargaining power [15,16]. Excessive reliance on a few customers can compound the effects of demand unpredictability and potential customer loss, leaving suppliers vulnerable to value appropriation by dominant buyers.
Customer stability is defined as the extent to which a company successfully maintains its existing customer relationships over a given period, indicating the retention and durability of buyer-seller interactions [17]. A higher level of customer stability is generally associated with stronger brand loyalty, lower customer acquisition costs, more stable revenue streams, and more sustainable competitive advantage [18,19,20,21]. Accordingly, concentration and stability have long been regarded as important indicators in marketing and supply chain management, as they jointly describe both the distribution of a firm’s customer base and the durability of its key client ties.

2.2. The Tradeoff Between Risk and Growth

Risk and growth represent two critical outcomes of firm performance. Risk refers to the uncertainty a firm faces in its operations, performance, and value creation, namely, the possibility that actual outcomes may deviate from expectations [22]. It arises from external changes in market demand, technological innovation, and regulation and policy, while also being shaped by complex internal factors such as strategic decisions and managerial arrangements. Greater downside risk tends to reduce operating efficiency and raise the cost of capital [23,24], so that effective risk management can improve performance and market value and alleviate the negative financial consequences [25]. Growth refers to the expansion in the scale and scope of a firm’s economic activities over time, as reflected in sales, employment, assets, or market share [26]. It is conceptually different from profitability, whereas the latter concerns the efficiency with which an organization converts resources into financial returns, and the former concerns the expansion of the underlying activities that generate those returns. Existing research attributes firm growth to the combined influence of organizational resources and capabilities, innovation, market opportunities, and institutional conditions [27,28]. No single factor is sufficient to explain why some enterprises grow or sustain growth while others do not. Successful growth could consolidate a firm’s market position, generate economies of scale, facilitate resource accumulation, and enhance long-term competitiveness [28,29].
Controlling risk and sustaining growth are both desirable, but the two objectives do not always align. Managers seeking to avoid risk may “play it safe” by limiting expenditure, and therefore pass up growth opportunities with the potential of value creation [30]. Rapid expansion, in turn, often increases organizational complexity and poses managerial challenges, reducing the predictability of performance and even constraining long-term development [31]. The risk-growth tradeoff becomes especially relevant when the same organizational characteristic produces a benefit in one dimension but a cost in the other. Viewed in this way, it provides a framework for examining whether features of a firm’s customer portfolio bring greater growth at the cost of higher risk, or reduce risk at the cost of slower growth.

2.3. Customer Concentration and the Risk-Growth Tradeoff

From the perspective of resource dependence theory (RDT), a concentrated customer base provides greater access to critical resources while reducing the availability of alternative resource sources, thereby constituting the common mechanism underlying the risk-growth tradeoff associated with customer concentration. The risk implications arise primarily from reduced substitutability. Financial distress, strategic shifts, or unexpected termination of cooperation by large clients—customer-specific shocks—can be rapidly transmitted to the supplier’s cash flow and may even push the supplier into a financial crisis when a larger proportion of sales is derived from a smaller number of customers [32]. It implies that enterprises absorb the operational risks of these irreplaceable clients as their own idiosyncratic risks, which gives rise to business fluctuations. Once investors recognize that such risk cannot be naturally hedged through a diversified customer portfolio, their required returns will incorporate a higher risk premium, which increases the supplier’s cost of equity and heightens its sensitivity to future earnings surprises [5]. This is reflected in the high volatility of stock returns in the capital markets [33]. Similarly, Lee et al. find that suppliers with concentrated customer bases are more likely to withhold bad news related to cash flows and earnings management, thereby elevating the risk of stock crash [34]. In addition, credit markets generally regard high customer concentration as an important risk factor that increases suppliers’ costs of debt and tightens credit constraints [35]. As a result, suppliers become less able to smooth operational fluctuations caused by external shocks through financing buffers and further strengthen the transmission of performance change to stock volatility. Accordingly, we propose the following hypothesis:
H1a. 
Ceteris paribus, greater major customer concentration is associated with higher volatility.
The growth implications originate from the other side of the same dependence structure: the economic importance of the resources supplied by major customers. A highly concentrated customer base indicates that a supplier receives significant demand from a small number of buyers. By focusing its production resources on these key customers, the supplier can achieve economies of scale. Patatoukas finds that customer concentration predicts lower operating expenses per dollar of sales and higher asset utilization [36]. Although suppliers may incur substantial upfront fixed costs, the benefits become more pronounced as transaction volume allows those costs to be recovered [6]. Ak and Patatoukas further show that manufacturers with concentrated customer bases maintain lower inventory levels, turn inventory over more rapidly, and experience fewer inventory write-downs [4]. Consequently, substantial orders from major buyers reduce the marginal cost of supplier expansion, enabling the same resource base to support a higher volume of sales. This scaling mechanism is particularly relevant to cumulative sales growth because its effects unfold as suppliers expand output over multiple periods. Therefore, we propose the following hypothesis:
H1b. 
Ceteris paribus, greater major customer concentration is associated with higher growth.

2.4. Customer Stability and the Risk-Growth Tradeoff

According to RDT, greater stability among major customers makes suppliers’ access to critical demand more predictable, but also makes resource commitments tied to existing clients more difficult to reconfigure. This tension underlies the risk-growth tradeoff related to customer stability. On the risk side, the continued presence of major buyers makes a significant portion of the business more steady as stable relationships are associated with framework agreements and repeated purchases that foster more optimistic stakeholder expectations about firms’ future revenues [37]. Baoyin and Bo’s study suggests that customer stability can reduce managers’ incentive for opportunistic behavior and improve the quality of accounting information [38], which provides external stakeholders and analysts with additional information that helps reduce forecast bias and divergence and enhance the stability of market expectations. Steady cooperation also implies positive customer satisfaction [39] that produces relational rents that may work as a buffer against shocks. It helps to cushion the sharp fall in suppliers’ cash flows during disruptions by offering trade credit support, technical assistance or information sharing, and dampen investors’ overreaction to adverse news [40]. Therefore, in the stock market, stable customer relationships ultimately manifest as lower idiosyncratic risk and return volatility, particularly in organizations where information asymmetry is more severe [37]. We therefore hypothesize as follows:
H2a. 
Ceteris paribus, greater major customer stability is associated with lower volatility.
The continued availability of demand from major buyers, however, is not costless. RDT suggests that firms seeking to preserve access to critical external resources tend to accommodate the requirements of the actors controlling those resources [41]. Long-term buyer relationships require suppliers to continue investing in specific assets with high switching costs and to spend more on incremental improvements to satisfy key customers [42] which generate path dependence in resources and capabilities [43]. These processes can be efficient in familiar settings, but they might also constrain the speed at which companies can reconfigure resources when new market opportunities arise, thereby increasing the marginal cost of expansion [44]. Previous studies indicate that establishing new relationships requires innovation in unfamiliar domains, whereas repeated interactions with the same partners may gradually erode innovation potential [45], especially for disruptive innovation targeting emerging markets [46]. This often hinders the ability to capitalize on growth opportunities. Furthermore, as previously mentioned, stable revenue reduces competitive pressure, but on the other hand, it weakens the incentives of managers to take risks [47], making them tend to pursue more conservative market strategies and weaken their willingness to explore the market and sensitivity to emerging demands. If existing major customers operate in mature markets, or if they need exclusivity from suppliers to ensure supply chain security and competitive advantage, the focal firm’s growth might be increasingly limited to its existing business base. We thus propose the following hypothesis:
H2b. 
Ceteris paribus, greater major customer stability is associated with lower growth.

2.5. The Role of AI Orientation

AI encompasses technologies that enable machines to learn from data, recognize patterns, process language and images, and support organizational decision-making. Using these technologies can expand firms’ information-processing capacity and improve supply chain efficiency and collaboration [48]. AI orientation, however, is viewed as a comprehensive and ongoing strategic stance that firms adopt by embedding AI and related technologies into their cognitive orientations, decision-making processes, and core business functions [49]. In practice, it transcends the application of AI tools to specific tasks, implying a greater awareness of managers about the capabilities of AI across various functions and is manifested in the development of AI strategies or departments [50].
TAT holds that information technologies create value by enabling goal-directed actions under particular organizational conditions, and which affordances become salient depends jointly on the dynamic interactions among technological features, managerial goals, and the information and tasks available in the organization [51,52,53]. This perspective provides a basis for explaining how AI orientation interacts with customer relationships. AI orientation directs managerial attention and resource commitment toward AI-enabled affordances that may support both exploitation and exploration, while which type of affordance is prioritized depends on the data conditions and task contexts created by the structure of the firm’s customer portfolio. AI technology is particularly effective at identifying patterns in accumulated data and applying them to recurrent tasks as it uses a probability-based approach to knowledge and is largely backward-looking and imitative [54]. Therefore, within the information environment constituted by existing major buyers, AI capabilities for prediction, monitoring, and personalization are more closely aligned with the established knowledge base, making exploitation-oriented AI affordance more readily actionable. Recent evidence about digital transformation supports this contextual view, because digital technologies, particularly those with limited diversity, tend to promote exploitation but constrain exploration [55,56]. Li et al. also suggest that AI contributes more strongly to exploitative innovation when it is coupled with firms’ existing knowledge [57].
Major customer concentration and stability provide information for exploitation in different ways. The former provides informational density and application scale. Concentrating a large share of sales among a few purchasers produces richer customer-specific knowledge and increases the returns from applying them across substantial transactions. Thus, a concentrated customer base directs organizational attention toward deeper search within existing domains [58], making it easier to harness AI for interpreting customers’ needs and improving existing products. This enables firms to generate greater growth from the business with major buyers. The latter provides continuity over time. Repeated transactions with the same partners generate comparable information, which creates favorable conditions for realizing AI’s affordances in detecting deviations from established routines [59]. AI orientation heightens managerial attention to these opportunities, thereby increasing the value of stable customer relationships in reducing uncertainty and further dampening volatility in operating outcomes. In contrast, overcoming the risk exposure associated with customer concentration or the growth constraints arising from customer stability requires a broader range of external information to realize exploratory affordances. Such activities involve data and task configurations that differ from those provided by existing relationships with major customers. Accordingly, we suggest that:
H3a. 
The negative relationship between major customer stability and volatility is stronger at higher levels of AI orientation.
H3b. 
The positive relationship between major customer concentration and growth is stronger at higher levels of AI orientation.
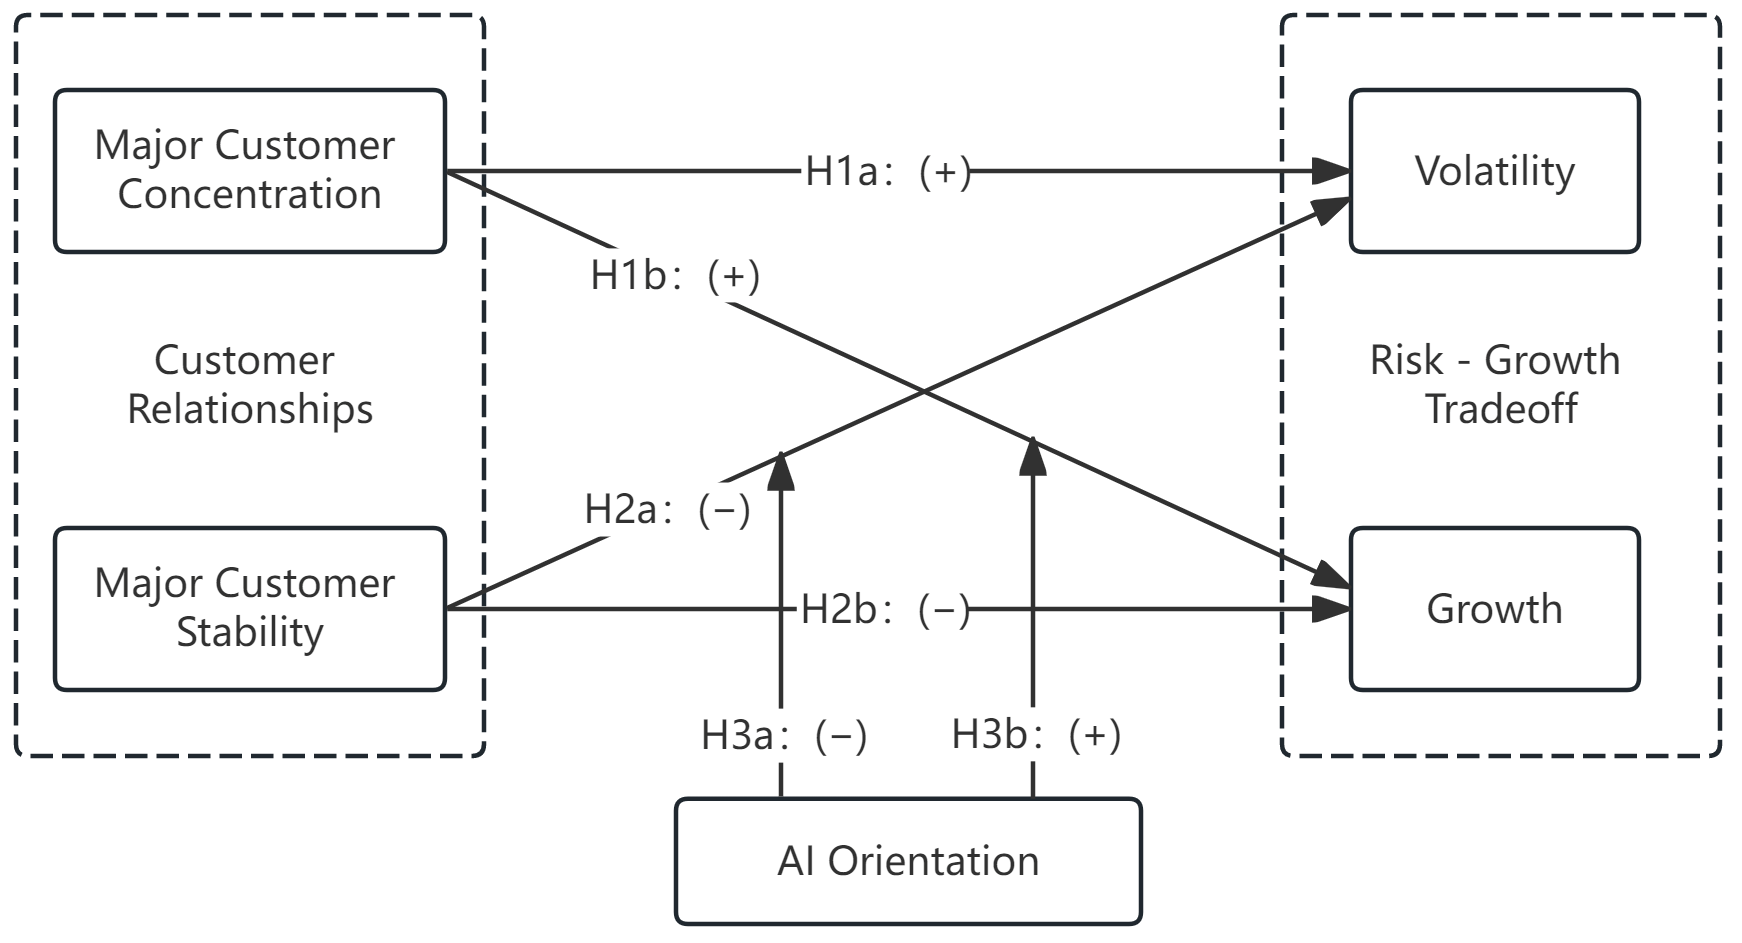
The theoretical framework is presented in Figure 1.
Figure 1. Theoretical Framework.
Systems 14 01104 g001

3. Research Design

3.1. Sample and Data

Our sample consists of Chinese A-share listed companies from 2013 to 2024. The period starts in 2013 because detailed disclosures on the top customers and suppliers became available in listed firms’ annual reports from that year onward under the China Securities Regulatory Commission disclosure requirements. To obtain a clean estimation sample, we implement the following filters. We exclude special treatment firms due to their abnormal financial and operating conditions, remove financial firms because of their distinct regulatory and reporting regimes, and discard observations with missing values for variables. The final sample is an unbalanced panel of 19,057 firm-year observations covering 4394 firms. Data are collected from China Stock Market & Accounting Research (CSMAR) and Chinese Research Data Service Platform (CNRDS). All continuous variables are winsorized at the 1st and 99th percentiles to reduce the influence of extreme observations.

3.2. Variable Measurement

3.2.1. Dependent Variable

Stock return volatility (VOL) captures fluctuations in investors’ valuation of a firm and is widely used as a market-based measure of firm risk [60,61]. We calculate it as the standard deviation of weekly stock returns during the observation period. Greater volatility indicates less predictable shareholder returns and a higher total risk. Growth (GROW) captures the ability for sustained development and is measured by a backward-looking three-year cumulative sales growth variable, calculated as a firm’s sales in year t divided by its sales in year t − 3, minus one [1].

3.2.2. Independent Variable

The independent variables are major customer concentration (MCC) and major customer stability (MCS). Following Patatoukas [36], MCC is measured as sales to the top five customers as a percentage of total sales. A higher MCC indicates greater dependence on a narrow customer base and closer business ties with major buyers. For MCS, following Mao et al. [62], we measure it by the number of retained major customers, defined as customers that appear among a supplier’s top five customers in both the previous and current years. This variable ranges from 0 to 5, with larger values indicating greater continuity in major customer relationships. To mitigate potential reverse causality concerns, both MCC and MCS are lagged by one period in the regressions.

3.2.3. Moderating Variables

Following previous practices in AI-related research, we use natural language processing (NLP) techniques to quantify AI orientation (AIO) based on the textual content of listed firms’ annual reports. Annual reports are formal disclosure documents subject to regulatory oversight and provide a relatively standardized source for identifying firms’ stated strategic priorities. The prominence of AI-related language in these reports may therefore reflect the managerial attention devoted to AI and the extent to which AI features in disclosed strategic agendas. Prior research has shown a significant positive association between such proxies and both the volume of technology-related patent applications and the share of technical personnel [63], indicating that this measure is largely aligned with substantive technology adoption.
The dictionary was developed and validated through several stages. First, we constructed an initial set of seed terms based on the AI keywords identified by Li et al. [64] and Yao et al. [49]. We then expand the candidate pool using iResearch’s 2024 China Artificial Intelligence Industry Research Report, Deloitte’s A Survey of AI Adoption among Enterprises in China and Worldwide, and recent government work reports as the corpus. The candidate terms were subsequently reviewed to remove duplicates, ambiguous expressions, and terms only weakly related to AI. A term was retained only when it referred specifically to AI-enabling infrastructure, a recognized AI technology, or an identifiable AI application scenario. To assess the contextual validity of the dictionary, two AI-scholars from information systems and management independently reviewed 150 randomly sampled sentences containing the candidate terms and evaluated whether each occurrence reflected the intended AI-related meaning. Disagreements were resolved through discussion, and terms that frequently produced false-positive classifications were removed. The final keyword list contains 82 terms covering AI infrastructure, core technologies, and application scenarios. These categories were selected to capture the complementary layers through which firms may express strategic attention to AI. AI infrastructure covers the enabling technological resources required to develop and operate AI systems, which is consistent with research identifying data, technology, and basic resources as tangible foundations of organizational AI capability [65]. Core technologies comprise the computational methods that provide AI systems with capabilities such as learning, perception, language processing, prediction, and reasoning. The terms included in this category are broadly consistent with the technological characteristics and functional scope used by the OECD to identify and describe AI systems [66]. Application scenarios capture the organizational and industry settings in which these technical capabilities are expected to be deployed. It recognizes that the organizational value of AI emerges when technical capabilities are embedded in specific processes, products, or services [67]. The complete dictionary is provided in Table 1.
After cleaning and segmenting the annual reports, we count the occurrences of the validated AI terms and divide this count by the total number of meaningful words in each report. A higher value indicates that a firm is more inclined to use or embed AI technologies in its operations. Consistent with MCC and MCS, AIO is also lagged by one period.

3.2.4. Control Variables

To rule out the influence of other factors, we include a set of control variables in the model. These include firm age (AGE), measured as the logarithm of the difference between the observation year and the year of establishment; firm size (SIZE), measured as the logarithm of total assets; profitability (ROA), measured by return on assets; financial leverage (LEV), measured by the debt-to-asset ratio; capital intensity (FIX), measured as the ratio of fixed assets to total assets; intangible asset intensity (INTAN), measured as the ratio of intangible assets to total assets; and ownership concentration (TOP5), measured as the total shareholding ratio of the five largest shareholders. Given that our sample consists of Chinese listed firms, we also control for ownership type (SOE), which equals 1 for state-owned enterprises and 0 otherwise. In addition, we control for firm and year fixed effects to absorb potential unobserved heterogeneity. Because some companies changed their industry affiliations during the sample period, their influence could not be fully absorbed by individual fixed effects. We therefore additionally include industry fixed effects to account for systematic factors across industries.

3.3. Model Specification

We constructed the following fixed effects model to test the hypotheses proposed:
V O L i , t ( G R O W i , t ) = β 0 + β 1 M C C i , t 1 + β 2 M C S i , t 1 + γ C O N T R O L i , t + μ i + ν i n d + π t + ε i , t
V O L i , t ( G R O W i , t ) = β 0 + β 1 M C C i , t 1 + β 2 M C S i , t 1 + β 3 A I O i , t 1 + β 4 M C C i , t 1 × A I O i , t 1   + β 4 M C S i , t 1 × A I O i , t 1 + γ C O N T R O L i , t + μ i + ν i n d + π t + ε i , t
where i denotes the firm, t denotes time, and CONTROL represents a set of control variables. Firm, industry, and year fixed effects are denoted by μ, υ, and π, respectively, while ε is the error term. We test the main effect using Equation (1), and the moderating effects using Equation (2).

4. Empirical Analysis

4.1. Summary Statistics

Descriptive statistics and pairwise correlations are reported in Table 2. The matrix shows no evidence of strong correlations among the variables. As an additional diagnostic, we examine variance inflation factors (VIFs) for all regressors. None of the VIF values approaches the commonly used cutoff of 10, and the mean VIF is 1.22. These results suggest that multicollinearity does not pose a material concern in our analysis.

4.2. Results

4.2.1. Main Effect

Columns (1), (2), (4), and (5) of Table 3 present the estimates of the main effects. Columns (1) and (4) report the specifications without any control variables or fixed effects, while columns (2) and (5) provide the full specifications with control variables and fixed effects included. As shown in Column (2), when volatility is used as the dependent variable, major customer concentration carries a positive and statistically significant coefficient (β = 0.004, p < 0.05), while major customer stability shows a significantly negative coefficient (β = −0.001, p < 0.01). In terms of economic magnitude, holding other factors constant, a one-standard-deviation increase in major customer concentration raises volatility by 1.31% relative to its mean, whereas a one-standard-deviation increase in major customer stability is associated with a 2.11% decrease in volatility. It suggests that a more concentrated customer base tends to expose suppliers to greater fluctuations, while more stable relationships with key customers help reduce volatility, thus supporting hypotheses H1a and H2a. Column (5) reports the results when growth is used as the dependent variable. The coefficient on major customer concentration is significantly positive (β = 0.343, p < 0.05), while the coefficient on major customer stability is negative and statistically significant (β = −0.027, p < 0.01). Economically, a one-standard-deviation increase in major customer concentration corresponds to a 13.15% increase in growth relative to its mean, whereas a one-standard-deviation increase in major customer stability corresponds to a 6.66% decrease in growth. Therefore, a concentrated customer portfolio may provide firms with growth opportunities, but excessive stability in relationships may constrain the growth potential. H1b and H2b are also supported.

4.2.2. Moderating Effect

Columns (3) and (6) of Table 3 report the results for the moderating effects. In Column (3), the interaction term between major customer stability and AI orientation is significantly negative (β = −0.016, p < 0.01), reinforcing the negative main effect of major customer stability on volatility. This finding suggests that AI-oriented firms are better able to translate stable relationships into lower volatility, which lends support to H3a. Column (6) shows a significantly positive coefficient for the interaction between major customer concentration and AI orientation (β = 9.814, p < 0.01), in line with the positive main effect of major customer concentration on growth. This result indicates that AI orientation enhances the growth benefits associated with a more concentrated customer base, thereby supporting H3b.
We further examine the two remaining interaction effects on an exploratory basis. As shown in columns (3) and (6), the interaction between MCC and AIO is positive but statistically insignificant in the volatility model (β = 0.064), providing no reliable evidence that AI orientation amplifies the volatility associated with customer concentration. Similarly, the interaction between MCS and AIO is positive but insignificant in the growth model (β = 0.326). Thus, AI orientation does not appear to systematically reinforce the growth constraints associated with stable customer relationships. These insignificant estimates should be interpreted cautiously because they do not establish the absence of the underlying mechanisms. One possible explanation is that exploiting information from existing buyers does not necessarily entail greater sales dependence, stronger relationship-specific commitments, or reduced search for new opportunities. In addition, the informational benefits enabled by AI orientation may coexist with the dependence and path-dependence mechanisms associated with existing customer relationships, leaving no clear net moderating effect on these two outcomes. Importantly, the two hypothesized interactions remain significant when both interaction terms are included simultaneously in each model.

4.3. Robustness Checks

4.3.1. Endogeneity Concerns

Volatility and growth may be affected by various unobserved factors, raising concerns about omitted-variable bias. To assess the sensitivity of our findings to this concern, we follow Altonji et al. [68] and use selection on observables as a benchmark for the potential influence of selection on unobservables. Specifically, we compare the coefficient of the core explanatory variable before and after adding controls, and calculate how strong selection on unobservables would have to be, relative to selection on observables, to explain away the estimated effect. As shown in Table 4, under the most parsimonious specification without any control variables or fixed effects, the coefficient difference ratios are relatively small (e.g., with volatility as the dependent variable, the ratio for MCC is approximately 0.99), suggesting that unobservables may lead to substantial bias in simplified models. As fixed effects or controls are introduced, the difference ratios increase markedly across models and generally exceed one. This indicates that selection on unobservables would have to be substantially stronger than selection on observables to fully account for the estimated effects. Therefore, our findings are unlikely to be driven by omitted-variable bias.
As customer relationship information is not subject to mandatory disclosure for listed firms, the research sample may suffer from selection bias. To address this concern, we employ propensity score matching (PSM) and the Heckman two-stage model. First, using the 75th percentiles of major customer concentration and stability as the cutoffs, we divide the sample into treatment and control groups, respectively, and implement a 1:1 nearest neighbor matching strategy to reduce bias arising from differences in observables. After matching, the common support region yields 18,008 observations for concentration and 18,358 observations for stability. The standardized biases of all covariates are reduced to below 10%, and the balance tests are satisfied, indicating sufficient overlap in the propensity score distributions between the matched treatment and control groups and a substantial reduction in differences. We then re-estimate the regressions based on the intersection of the two matched samples. As reported in columns (1) and (2) of Table 5, the results remain consistent with the baseline findings. Second, we further use the Heckman two-stage model to mitigate potential selection bias. In the first stage, the dependent variable is the customer information disclosure indicator (CID), which equals one if a firm discloses specific information about its major customers and zero otherwise. Following He et al. [69] and Mao et al. [62], we use the lagged annual industry-level average customer information disclosure rate (DIR) as the excluded instrument. DIR satisfies the relevance condition because the disclosure practices of industry peers provide managers with an observable benchmark for assessing what constitutes acceptable disclosure behavior. As firms tend to follow prevailing industry practices, a higher industry disclosure rate should increase the likelihood that the focal firm discloses customer information. Consistent with this argument, the first-stage results estimated using the Probit model indicate a significant positive correlation between DIR and CID, as shown in column (3) of Table 4. The exclusion restriction stems from the distinction between disclosure practices and underlying business activities. Conditional on the covariates and fixed effects included in the model, industry-wide propensity to disclose customer information does not independently determine the operating outcomes of focal firms. Instead, it captures the prevailing disclosure environment and therefore affects the likelihood that the focal firm enters the observable sample. In other words, there is no clear theoretical channel through which the industry disclosure rate would directly affect an individual firm’s volatility or growth. In the second stage, we include the inverse Mills ratio (IMR) calculated from the first stage in the baseline regressions. As shown in columns (4) and (5) of Table 5, the estimated effects of the core explanatory variables do not change substantially, suggesting that our main findings remain robust after accounting for potential sample selection bias.
Although the baseline regressions lag the independent variables by one period to alleviate reverse causality concerns, we further employ the IV-2SLS approach to address this issue. Following Dhaliwal et al. [5] and Cao et al. [70], we use the lagged annual industry-region averages of major customer concentration and stability as instrumental variables for the two endogenous regressors. The relevance of these instruments stems from the common market environment faced by firms operating in the same industry and region. These firms draw customers from similar markets and are exposed to common product characteristics, transaction conditions, and other market-level factors. The average customer relationship characteristics of comparable firms should therefore predict those of an individual firm. The exclusion restriction rests on the aggregate and lagged nature of the instruments. Peer-group averages are constructed from the customer relationship characteristics of comparable firms and capture the broader customer-market structure. There is no evident direct channel through which these aggregate measures would affect an individual firm’s subsequent growth or volatility, except through the firm’s own customer relationships. Moreover, because the instruments are measured before the outcome variables, the likelihood that contemporaneous firm performance influences the customer structure observed at the group level is reduced, thereby alleviating concerns about reverse causality. Accordingly, after controlling for firm, industry, and year fixed effects, together with other time-varying firm characteristics, the lagged peer-group averages are expected to affect the focal firm’s subsequent growth and volatility primarily through their influence on its customer structure. They therefore provide a plausibly exogenous source of variation for addressing endogeneity in the estimated effects of customer relationships. We conducted several diagnostic tests to assess the validity of the instruments. The Kleibergen-Paap rk Wald F statistic is approximately 14,000, far exceeding the Stock-Yogo 10% maximal IV size critical value of 7.03, and the Kleibergen-Paap rk LM statistic is 1114.355 (p < 0.01). These results indicate that the model does not suffer from weak instruments or underidentification. The second-stage regression results are reported in columns (8) and (9) of Table 5. The effects of customer concentration and stability on volatility, as well as the effect of stability on growth, remain consistent with the baseline results. The effect of concentration on growth remains positive but no longer reaches conventional levels of statistical significance. Given that this coefficient retains the expected sign while the standard error increases, the loss of significance appears to reflect reduced estimation precision under the stringent model specification, rather than a reversal of the relationship. Overall, the IV-2SLS analysis provides support that is broadly consistent with the baseline findings.

4.3.2. Other Robustness Tests

We conducted several additional analyses to further examine the robustness of our findings. First, we replaced the operationalization of the core variables and re-ran the regressions. We used the standard deviation of monthly stock returns (VOL_M) and the cumulative sales growth over five years (GROW_5Y) as alternative measures of volatility and growth respectively. For AI orientation, we constructed two substitute proxies. AIO_TECH employs a more conservative dictionary that includes only 52 terms related to AI infrastructure and core technologies. By excluding application-scenario terms that may serve as broad promotional rhetoric, it offers a measure of AI orientation that is more technology-specific and less susceptible to symbolic disclosure. AIO_MDA is based on the frequency of AI-related keywords in MD&A sections, which provide a more focused account of management’s assessment of strategic priorities. As reported in Table 6, these findings remain robust.
Second, we examine several subsamples to ensure that our results are not driven by specific factors. Considering that the COVID-19 pandemic may have caused abnormal shocks to firms’ operations and capital market performance, we excluded observations from 2020 and re-estimated the models. Then, given that information-related industries are naturally characterized by a higher degree of digitalization, firms’ AI orientation in these sectors may be systematically shaped by industry-level factors. We therefore excluded firms in the information industry and re-estimated the models to examine the moderating effect of AI orientation. Finally, given the increasing application of AI and growing policy attention since 2018 [71], we restricted the sample period to 2018–2024 and re-examined the role of AI orientation within this subsample. The results of these tests are reported in Table 7, and our conclusions remain robust.

4.4. Heterogeneity Analysis

Contingency theory suggests that the relationship between strategic orientation and performance is subject to boundary conditions, with its effects exhibiting asymmetry across varying contexts [72]. Accordingly, the moderating effects of AI orientation on the relationships of customer concentration and stability with firm volatility and growth may depend on key characteristics of the focal firm, such as its structural position in the supply chain and digital foundation. In the following analysis, we conduct heterogeneity tests along these two dimensions to examine whether the moderating role of AI orientation differs across companies.

4.4.1. Supply Chain Power

Supply chain power (SCPW) refers to the capacity of a supply chain member to influence or even dictate transaction terms by virtue of resource control or dependence asymmetry [73]. Firms with greater supply chain power can exploit their bargaining advantages to stabilize cash flows, offload inventory or financing pressures onto upstream and downstream partners, and coordinate supply chain activities according to their priorities [74]. Companies occupying a weaker structural position lack negotiating leverage, leaving them more exposed to information asymmetry and operational uncertainty, and thus more motivated to turn to AI to offset resource constraints and decision-making delays. Yao et al. also found that the operational efficiency gains from AI technologies are more pronounced in turbulent market environments [49], where the marginal returns to technological empowerment are higher and the scope for performance improvement is greater. We therefore expect that AI orientation is more likely to function as a capability-compensation mechanism for firms in a subordinate supply chain position. It enables organizations to more effectively mine existing transaction data to detect and respond to shifts in customer demand, thereby anticipating volatility risks and identifying potential growth opportunities.
Supply chain power is often reflected in a firm’s ability to transfer capital burdens to its partners, either by negotiating longer payment terms with suppliers or by accelerating the collection of receivables from customers [75]. Accordingly, we proxy this construct using the difference between days payable outstanding (DPO) and days sales outstanding (DSO). We then divide the sample into high- and low-SCPW groups based on the median and estimate the regressions separately. As reported in columns (1) through (4) of Table 8, the interaction terms between AI orientation and both major customer concentration and stability are statistically insignificant in the high-SCPW group, whereas they are highly significant (p < 0.01) in the low-SCPW group. To assess the significance of coefficient differences across groups, we performed the Chow test and Fisher’s permutation test using 1000 permutations. The Chow F-statistics are 4.51 for the volatility specification and 3.62 for the growth specification, both significant at the 1% level, suggesting a structural difference in coefficients between the two groups. The results of Fisher’s permutation tests (with 1000 permutations) show that the empirical p-values for the between group difference in the focal interaction coefficients are significant at the 5% level in both the volatility and growth models. This is consistent with our expectation that AI technologies exert a pronounced compensating effect for firms that are disadvantaged in the supply chain system.

4.4.2. Supply Chain Digitalization

Supply chain digitalization (SCDT) is defined as the process through which firms systematically embed new digital technologies into supply chain activities to develop a more agile, cost-efficient, and flexible end-to-end supply chain system [76,77]. A digitally connected supply chain provides a more coherent and visible information environment by integrating data across procurement, production, logistics, and customer-facing activities [78], which helps AI technologies gain richer data inputs and broader application contexts. We therefore argue that, in organizations with a higher level of supply chain digitalization, AI orientation is more likely to be converted into substantive organizational capabilities and thus exert a stronger moderating effect.
To measure firms’ supply chain digitalization, we employ a text-based approach by counting the frequency of supply chain digitalization-related keywords in the MD&A section of annual reports to obtain a proxy. The keyword dictionary is constructed with reference to Wu et al. [79] and Hu and Ma [80], covering five core supply chain modules: plan, source, make, deliver, and return. We then divide the sample into high- and low-SCDT groups based on the median and run separate regressions for each group. Columns (5) to (8) of Table 8 report the results. In the high-SCDT group, the interaction terms between AI orientation and both major customer concentration and stability are strongly significant (p < 0.01) and relatively higher. In the low-SCDT group, however, the interaction between AI orientation and major customer stability is only marginally significant (p < 0.1), while that with major customer concentration fails to reach conventional significance levels. Similarly, we employed the Chow test and Fisher’s permutation test using 1000 permutations to evaluate the significance of coefficient differences across groups. The Chow F-statistics are 3.50 and 3.48 for the volatility and growth models, respectively, both significant at the 1% level, suggesting the appropriateness of the subgroup estimation. The results of Fisher’s permutation tests (with 1000 permutations) show that the between-group differences in the focal interaction coefficients are not statistically significant in either model. These results provide limited but suggestive evidence consistent with our expectation that the moderating role of AI orientation may be more evident when supply chain digitalization is more advanced.

5. Conclusions and Discussion

5.1. Conclusions

This study examines how two important attributes of major customer relationships, concentration and stability are associated with firm volatility and growth and further investigates the moderating role of AI orientation. Using data from Chinese A-share listed companies between 2013 and 2024, we measure firm risk through stock volatility and capture long-term growth using cumulative sales growth over a certain period. Customer concentration and stability are constructed from disclosed information on major buyers, while companies’ strategic orientation toward AI is assessed through textual analysis of annual reports.
We draw the following conclusions from the empirical analysis and a series of robustness tests. First, greater major customer concentration is associated with higher stock-return volatility and stronger sales growth. Concentration therefore creates a risk–growth tension: dependence on a limited number of buyers increases exposure to customer-specific shocks, while the scale of transactions with major customers supports business expansion through economies of scale. Second, major customer stability exhibits the opposite pattern. Continued relationships with the same major customers reduce stock-return volatility but constrain long-term growth. Stable ties improve the predictability of existing business, while the continued allocation of organizational attention and resources to established relationships limits the exploration of new customers and markets. Third, AI orientation strengthens the beneficial outcomes associated with customer concentration and stability. Stable customer relationships generate comparable longitudinal data, and concentrated customer bases provide dense information and application scale, both facilitating the actualization of AI affordances oriented to exploitation. A stronger AI orientation channels managerial attention and commitment toward these opportunities, thereby strengthening the negative association between customer stability and volatility and the positive association between customer concentration and growth. Fourth, the moderating role of AI orientation is context-dependent. Specifically, the impact of AI orientation is more noticeable when focal firms hold weaker positions in supply chain power structures, indicating that AI orientation may act as a “capability compensation” tool to offset structural disadvantages in resource control. Regarding supply chain digitalization, the subgroup analysis provides limited but suggestive evidence that more developed digital infrastructure may create favorable conditions for realizing the AI affordances embedded in existing customer relationships.

5.2. Practical Implications

Firms could incorporate customer portfolio structure into long-term strategic reviews. Stress testing can help firms that depend on a handful of big clients assess the financial and operational impact of losing a key customer. Companies with stable buyers should periodically check whether they have become too attached to existing ties. Dedicated resources should be reserved for developing alternative sales channels and maintaining production flexibility. Such measures can help firms to maintain the benefits of existing customer relationships while allowing for strategic adjustment.
AI initiatives ought to be structured around clearly defined goals. Every project should outline the business issue it attempts to solve, the improvement it aims to pursue, and the performance metrics used for evaluation. Operational planning should incorporate risk-oriented applications so that model outputs result in prompt managerial actions. Growth-oriented applications should be evaluated based on how they contribute to capacity utilization and new product commercialization. This strategy can help ensure that technical investment results in quantifiable organizational effects and keep AI focus from becoming symbolic.
The execution of AI strategy should be aligned with the operational conditions of the organization. Managers may emphasize AI solutions that enhance demand forecasting and customer coordination to reduce structural vulnerabilities where supply chain power is limited. Firms with lower levels of supply chain digitalization may benefit from first improving data consistency and integrating customer-management systems with production processes. A stronger digital foundation may create more favorable conditions for translating AI orientation into operational value. This tiered strategy matches AI investment with current capabilities and practical requirements.

5.3. Limitations and Future Research

We acknowledge that this study has several limitations. First, our measurement of customer relationships is based on voluntarily disclosed information on top customers and does not account for transaction data with smaller buyers due to data availability and comparability constraints. Future research could employ surveys, interviews, textual analysis, or other approaches to obtain more comprehensive customer maps and develop richer relationship indicators. Second, due to the absence of internal data, our study captures only a snapshot of firms’ strategic AI orientation and may be subject to potential symbolic disclosure. Future research might take into account actual technological investments and application scenario coverage to trace the progress of AI deployment and thus offer stronger evidence in support of our findings. Finally, our sample consists of Chinese listed companies and the results may be impacted by distinct institutional background and relationship-oriented culture. Publicly traded and privately held companies have quite different resource endowments and operating modes. Therefore, future research could be expanded to unlisted companies and other regions to further verify the external applicability of our conclusions through cross-contextual comparisons.

Author Contributions

Conceptualization, T.Q. and A.Z.; methodology, T.Q. and A.Z.; validation, T.H. and X.H.; formal analysis, T.Q. and A.Z.; investigation, T.Q. and A.Z.; data curation, T.Q., A.Z. and X.H.; writing—original draft preparation, T.Q. and A.Z.; writing—review and editing, T.Q., A.Z. and T.H.; visualization, X.H.; supervision, T.H.; project administration, T.Q.; funding acquisition, T.H. All authors have read and agreed to the published version of the manuscript.

Funding

This work was supported by the National Natural Science Foundation of China, Grant No. 72474059.

Data Availability Statement

The data used in this study were obtained from the CSMAR and CNRDS databases. Access to these data is available via institutional subscription.

Conflicts of Interest

The authors declare no conflicts of interest.

References

  1. Ortiz-de-Mandojana, N.; Bansal, P. The long-term benefits of organizational resilience through sustainable business practices. Strateg. Manag. J. 2016, 37, 1615–1631. [Google Scholar] [CrossRef] [Scilit]
  2. Comin, D.; Mulani, S. A theory of growth and volatility at the aggregate and firm level. J. Monet. Econ. 2009, 56, 1023–1042. [Google Scholar] [CrossRef] [Scilit]
  3. Feng, X.; Wu, X. Strategic Orientations and Organizational Resilience: The Moderating Role of Digital Technology. Systems 2026, 14, 159. [Google Scholar] [CrossRef] [Scilit]
  4. Ak, B.K.; Patatoukas, P.N. Customer-base concentration and inventory efficiencies: Evidence from the manufacturing sector. Prod. Oper. Manag. 2016, 25, 258–272. [Google Scholar] [CrossRef] [Scilit]
  5. Dhaliwal, D.; Judd, J.S.; Serfling, M.; Shaikh, S. Customer concentration risk and the cost of equity capital. J. Account. Econ. 2016, 61, 23–48. [Google Scholar] [CrossRef] [Scilit]
  6. Irvine, P.J.; Park, S.S.; Yıldızhan, Ç. Customer-base concentration, profitability, and the relationship life cycle. Account. Rev. 2016, 91, 883–906. [Google Scholar] [CrossRef] [Scilit]
  7. Liao, J.; Zhan, Y.; Liu, K. Customer stability, environmental uncertainty and the cost of debt. Manag. Decis. 2025, 63, 1787–1812. [Google Scholar] [CrossRef] [Scilit]
  8. Geng, Y.; Wang, Y.; Wu, S. Acquaintance means booster? Why stable customers matter for firm productivity. China J. Account. Res. 2025, 18, 100435. [Google Scholar] [CrossRef] [Scilit]
  9. Gu, J.; Shi, X.; Wang, P.; Xu, X. Examining the impact of upstream and downstream relationship stability and concentration on firms’ financial performance. J. Bus. Res. 2022, 141, 229–242. [Google Scholar] [CrossRef] [Scilit]
  10. Zhang, J.; Mo, H.; Hu, Z.; Zhang, T. The effect of stability and concentration of upstream and downstream relationships of focal firms on two-level trade credit. Int. J. Prod. Econ. 2024, 270, 109173. [Google Scholar] [CrossRef] [Scilit]
  11. LeCun, Y.; Bengio, Y.; Hinton, G. Deep learning. Nature 2015, 521, 436–444. [Google Scholar] [CrossRef] [Scilit] [PubMed]
  12. Anthony, C.; Bechky, B.A.; Fayard, A.L. “Collaborating” with AI: Taking a system view to explore the future of work. Organ. Sci. 2023, 34, 1672–1694. [Google Scholar] [CrossRef] [Scilit]
  13. Huang, M.H.; Rust, R.T. A strategic framework for artificial intelligence in marketing. J. Acad. Mark. Sci. 2021, 49, 30–50. [Google Scholar] [CrossRef] [Scilit]
  14. Jarrahi, M.H. Artificial intelligence and the future of work: Human-AI symbiosis in organizational decision making. Bus. Horiz. 2018, 61, 577–586. [Google Scholar] [CrossRef] [Scilit]
  15. Saboo, A.R.; Kumar, V.; Anand, A. Assessing the impact of customer concentration on initial public offering and balance sheet–based outcomes. J. Mark. 2017, 81, 42–61. [Google Scholar] [CrossRef] [Scilit]
  16. Chang, H.; Liu, S.; Mashruwala, R. Customer bargaining power, strategic fit, and supplier performance. Prod. Oper. Manag. 2022, 31, 1492–1509. [Google Scholar] [CrossRef] [Scilit]
  17. Rust, R.T.; Zahorik, A.J. Customer satisfaction, customer retention, and market share. J. Retail. 1993, 69, 193–215. [Google Scholar] [CrossRef] [Scilit]
  18. Reichheld, F.F.; Kenny, D.W. The hidden advantages of customer retention. J. Retail Bank. 1990, 12, 19–24. [Google Scholar]
  19. Fites, D.V. Make your dealers your partners. Harv. Bus. Rev. 1996, 74, 84–95. [Google Scholar]
  20. Gee, R.; Coates, G.; Nicholson, M. Understanding and profitably managing customer loyalty. Mark. Intell. Plan. 2008, 26, 359–374. [Google Scholar] [CrossRef] [Scilit]
  21. Min, S.; Zhang, X.; Kim, N.; Srivastava, R.K. Customer acquisition and retention spending: An analytical model and empirical investigation in wireless telecommunications markets. J. Mark. Res. 2016, 53, 728–744. [Google Scholar] [CrossRef] [Scilit]
  22. Miller, K.D.; Reuer, J.J. Measuring organizational downside risk. Strateg. Manag. J. 1996, 17, 671–691. [Google Scholar] [CrossRef]
  23. Miller, K.D.; Chen, W.R. Risk and firms’ costs. Strateg. Organ. 2003, 1, 355–382. [Google Scholar] [CrossRef] [Scilit]
  24. Konchitchki, Y.; Luo, Y.; Ma, M.L.; Wu, F. Accounting-based downside risk, cost of capital, and the macroeconomy. Rev. Account. Stud. 2016, 21, 1–36. [Google Scholar] [CrossRef] [Scilit]
  25. Florio, C.; Leoni, G. Enterprise risk management and firm performance: The Italian case. Br. Account. Rev. 2017, 49, 56–74. [Google Scholar] [CrossRef] [Scilit]
  26. Delmar, F.; Davidsson, P.; Gartner, W.B. Arriving at the high-growth firm. J. Bus. Ventur. 2003, 18, 189–216. [Google Scholar] [CrossRef] [Scilit]
  27. Demir, R.; Wennberg, K.; McKelvie, A. The strategic management of high-growth firms: A review and theoretical conceptualization. Long Range Plan. 2017, 50, 431–456. [Google Scholar] [CrossRef] [Scilit]
  28. Hamilton, R.T.; Ng, P.Y. What we know about high-growth firms, and what we do not: A systematic review. Int. Small Bus. J. 2025, 43, 420–451. [Google Scholar] [CrossRef] [Scilit]
  29. Bohan, S.; Tippmann, E.; Levie, J.; Igoe, J.; Bowers, B. What is scaling? J. Bus. Ventur. 2024, 39, 106355. [Google Scholar] [CrossRef] [Scilit]
  30. Gormley, T.A.; Matsa, D.A. Playing it safe? Managerial preferences, risk, and agency conflicts. J. Financ. Econ. 2016, 122, 431–455. [Google Scholar] [CrossRef] [Scilit]
  31. Freel, M.; Gordon, I. On the consequences of firm growth. Int. Small Bus. J. 2022, 40, 684–709. [Google Scholar] [CrossRef] [Scilit] [PubMed]
  32. Lian, Y. Financial distress and customer-supplier relationships. J. Corp. Financ. 2017, 43, 397–406. [Google Scholar] [CrossRef] [Scilit]
  33. Mihov, A.; Naranjo, A. Customer-base concentration and the transmission of idiosyncratic volatility along the vertical chain. J. Empir. Financ. 2017, 40, 73–100. [Google Scholar] [CrossRef] [Scilit]
  34. Lee, S.M.; Jiraporn, P.; Song, H. Customer concentration and stock price crash risk. J. Bus. Res. 2020, 110, 327–346. [Google Scholar] [CrossRef] [Scilit]
  35. Campello, M.; Gao, J. Customer concentration and loan contract terms. J. Financ. Econ. 2017, 123, 108–136. [Google Scholar] [CrossRef] [Scilit]
  36. Patatoukas, P.N. Customer-base concentration: Implications for firm performance and capital markets: 2011 American accounting association competitive manuscript award winner. Account. Rev. 2012, 87, 363–392. [Google Scholar]
  37. Wang, X.; Zhang, X.; Lu, Q. Leveraging customer stability to reduce idiosyncratic Risk: Insights from goal interdependence theory. J. Retail. Consum. Serv. 2026, 88, 104519. [Google Scholar] [CrossRef] [Scilit]
  38. Baoyin, Q.; Bo, C. “With Food in Hand, You will not Feel Panic”: Does Customer Stability Improve the Quality of Accounting Information? Foreign Econ. Manag. 2022, 44, 81–94. [Google Scholar]
  39. Ferro-Soto, C.; Padin, C.; Roberts-Lombard, M.; Svensson, G.; Høgevold, N. Economic and non-economic satisfaction as interlocking constructs in B2B sales relationships. S. Afr. J. Bus. Manag. 2024, 55, 3956. [Google Scholar] [CrossRef] [Scilit]
  40. Tuli, K.R.; Bharadwaj, S.G. Customer satisfaction and stock returns risk. J. Mark. 2009, 73, 184–197. [Google Scholar] [CrossRef] [Scilit]
  41. Pfeffer, J.; Salancik, G.R. External Control of Organizations: A Resource Dependence Perspective; Stanford: Stanford, CA, USA, 2003; pp. 100–125. [Google Scholar]
  42. Lin, C.W.; Wu, L.Y.; Chiou, J.S. The use of asset specific investments to increase customer dependence: A study of OEM suppliers. Ind. Mark. Manag. 2017, 67, 174–184. [Google Scholar] [CrossRef] [Scilit]
  43. Sydow, J.; Schreyögg, G.; Koch, J. Organizational path dependence: Opening the black box. Acad. Manag. Rev. 2009, 34, 689–709. [Google Scholar] [CrossRef] [Scilit]
  44. Liu, Y.; Zheng, H.; Kuang, X.; You, J. The dark side of customer-specific innovation: Patent similarity and supplier labor investment efficiency. Pac.-Basin Financ. J. 2025, 90, 102699. [Google Scholar] [CrossRef] [Scilit]
  45. Ford, J.A.; Verreynne, M.L.; Steen, J. Limits to networking capabilities: Relationship trade-offs and innovation. Ind. Mark. Manag. 2018, 74, 50–64. [Google Scholar] [CrossRef] [Scilit]
  46. Govindarajan, V.; Kopalle, P.K.; Danneels, E. The effects of mainstream and emerging customer orientations on radical and disruptive innovations. J. Product. Innov. Manag. 2011, 28, 121–132. [Google Scholar] [CrossRef] [Scilit]
  47. Liu, C.; Masulis, R.W.; Stanfield, J. Why CEO option compensation can be a bad option for shareholders: Evidence from major customer relationships. J. Financ. Econ. 2021, 142, 453–481. [Google Scholar] [CrossRef] [Scilit]
  48. Pan, H.; Zou, N.; Wang, R.; Ma, J.; Liu, D. Artificial intelligence usage and supply chain resilience: An organizational information processing theory perspective. Systems 2025, 13, 724. [Google Scholar] [CrossRef] [Scilit]
  49. Yao, N.C.; Bai, J.; Yu, Z.; Guo, Q. Does AI orientation facilitate operational efficiency? A contingent strategic orientation perspective. J. Bus. Res. 2025, 186, 114994. [Google Scholar] [CrossRef] [Scilit]
  50. van Giffen, B.; Ludwig, H. How Siemens democratized artificial intelligence. MIS Q. Exec. 2023, 22, 1–21. [Google Scholar] [CrossRef] [Scilit]
  51. Markus, M.L.; Silver, M.S. A foundation for the study of IT effects: A new look at DeSanctis and Poole’s concepts of structural features and spirit. J. Assoc. Inf. Syst. 2008, 9, 5. [Google Scholar] [CrossRef] [Scilit]
  52. Majchrzak, A.; Markus, M.L. Technology affordances and constraints in management information systems (MIS). In Encyclopedia of Management Theory; Kessler, E., Ed.; Sage Publications: Thousand Oaks, CA, USA, 2012. [Google Scholar]
  53. Volkoff, O.; Strong, D.M. Critical realism and affordances: Theorizing IT-associated organizational change processes1. MIS Q. 2013, 37, 819–834. [Google Scholar] [CrossRef] [Scilit]
  54. Felin, T.; Holweg, M. Theory is all you need: AI, human cognition, and causal reasoning. Strategy Sci. 2024, 9, 346–371. [Google Scholar] [CrossRef] [Scilit]
  55. Fu, L.; Wei, Y.; Li, R.; Li, Y.; Liu, Z. The effects of digital transformation on exploitation and exploration: Does technological diversity matter? Bus. Process Manag. J. 2024, 30, 2684–2707. [Google Scholar] [CrossRef] [Scilit]
  56. Li, F.; Zhang, N. Digital transformation, innovation investment and quality. Financ. Res. Lett. 2025, 75, 106901. [Google Scholar] [CrossRef] [Scilit]
  57. Li, J.; Wang, Y.; Zeng, W.; Liang, K. Impact of AI on firm ambidextrous innovation: Mediating role of digital knowledge coupling. Int. J. Inf. Manag. 2025, 84, 102935. [Google Scholar] [CrossRef] [Scilit]
  58. Zhong, W.; Ma, Z.; Tong, T.W.; Zhang, Y.; Xie, L. Customer concentration, executive attention, and firm search behavior. Acad. Manag. J. 2021, 64, 1625–1647. [Google Scholar] [CrossRef] [Scilit]
  59. Dew, R.; Ascarza, E.; Netzer, O.; Sicherman, N. Detecting routines: Applications to ridesharing customer relationship management. J. Mark. Res. 2024, 61, 368–392. [Google Scholar] [CrossRef] [Scilit]
  60. Jo, H.; Na, H. Does CSR reduce firm risk? Evidence from controversial industry sectors. J. Bus. Ethics 2012, 110, 441–456. [Google Scholar] [CrossRef] [Scilit]
  61. Hendricks, K.B.; Singhal, V.R. The effect of demand–supply mismatches on firm risk. Prod. Oper. Manag. 2014, 23, 2137–2151. [Google Scholar] [CrossRef] [Scilit]
  62. Mao, S.; Xiao, M.; Kholaif, M.M.N.H.K. Leveraging digital transformation for customer stability in sustainable supply chains: A dynamic capability perspective. Int. J. Logist. Res. Appl. 2025, 1–35. [Google Scholar] [CrossRef] [Scilit]
  63. Chen, W.; Srinivasan, S. Going digital: Implications for firm value and performance. Rev. Account. Stud. 2024, 29, 1619–1665. [Google Scholar] [CrossRef] [Scilit]
  64. Li, J.; Li, M.; Wang, X.; Thatcher, J.B. Strategic directions for AI: The role of CIOs and boards of directors. MIS Q. 2021, 45, 1603–1644. [Google Scholar] [CrossRef] [Scilit]
  65. Mikalef, P.; Gupta, M. Artificial intelligence capability: Conceptualization, measurement calibration, and empirical study on its impact on organizational creativity and firm performance. Inf. Manag. 2021, 58, 103434. [Google Scholar] [CrossRef] [Scilit]
  66. OECD. OECD Framework for the Classification of AI Systems; OECD Digital Economy Papers, No. 323; OECD Publishing: Paris, France, 2022. [Google Scholar] [CrossRef]
  67. Enholm, I.M.; Papagiannidis, E.; Mikalef, P.; Krogstie, J. Artificial intelligence and business value: A literature review. Inf. Syst. Front. 2022, 24, 1709–1734. [Google Scholar] [CrossRef] [Scilit]
  68. Altonji, J.G.; Elder, T.E.; Taber, C.R. Selection on observed and unobserved variables: Assessing the effectiveness of Catholic schools. J. Political Econ. 2005, 113, 151–184. [Google Scholar] [CrossRef] [Scilit]
  69. He, J.; Chen, W.; Ma, X. Does supplier instability affect corporate social responsibility? A theoretical and empirical study. IEEE Trans. Eng. Manag. 2022, 71, 4692–4709. [Google Scholar] [CrossRef] [Scilit]
  70. Cao, Y.; Dong, Y.; Ma, D.; Sun, L. Customer concentration and corporate risk-taking. J. Financ. Stab. 2021, 54, 100890. [Google Scholar] [CrossRef] [Scilit]
  71. Roberts, H.; Cowls, J.; Morley, J.; Taddeo, M.; Wang, V.; Floridi, L. The Chinese approach to artificial intelligence: An analysis of policy, ethics, and regulation. AI Soc. 2021, 36, 59–77. [Google Scholar] [CrossRef] [Scilit]
  72. Donaldson, L. The Contingency Theory of Organizations; Sage: Thousand Oaks, CA, USA, 2001. [Google Scholar]
  73. Cox, A. Understanding buyer and supplier power: A framework for procurement and suppy competence. J. Supply Chain Manag. 2001, 37, 8. [Google Scholar] [CrossRef] [Scilit]
  74. Crook, T.R.; Combs, J.G. Sources and consequences of bargaining power in supply chains. J. Oper. Manag. 2007, 25, 546–555. [Google Scholar] [CrossRef] [Scilit]
  75. Cho, W.; Ke, J.Y.F.; Chu, E.; Han, C. An exploratory study of firms’ bargaining power and cash liquidity performance during the financial crisis. J. Supply Chain Oper. Manag. 2018, 16, 132. [Google Scholar]
  76. Büyüközkan, G.; Göçer, F. Digital Supply Chain: Literature review and a proposed framework for future research. Comput. Ind. 2018, 97, 157–177. [Google Scholar] [CrossRef] [Scilit]
  77. Seyedghorban, Z.; Tahernejad, H.; Meriton, R.; Graham, G. Supply chain digitalization: Past, present and future. Prod. Plan. Control 2020, 31, 96–114. [Google Scholar] [CrossRef] [Scilit]
  78. Zhao, N.; Hong, J.; Lau, K.H. Impact of supply chain digitalization on supply chain resilience and performance: A multi-mediation model. Int. J. Prod. Econ. 2023, 259, 108817. [Google Scholar] [CrossRef] [Scilit] [PubMed]
  79. Wu, Y.; Wang, J.; Xia, S.; He, Q.; Zhang, Q. The impact of supply chain digitalization on firms’ performance: An empirical test of how resource specificity explains the digitalization paradox. J. Bus. Logist. 2025, 46, e70023. [Google Scholar] [CrossRef] [Scilit]
  80. Hu, J.; Ma, J. Supply Chain Digitalization and Its Resilience: A Systematic Framework and Empirical Evidence. Systems 2026, 14, 194. [Google Scholar] [CrossRef] [Scilit]

Table 1. Keywords of AI orientation.
CategoryKeywords
Core TechnologiesArtificial intelligence; Machine translation; Machine learning; Computer vision; Convolutional neural networks; Pattern recognition; Reinforcement learning; Human-machine dialogue; Human-computer interaction; Human-machine collaboration; Facial recognition; Deep neural networks; Deep learning; Neural networks; Biometric recognition; Voiceprint recognition; Data mining; Feature recognition; Feature extraction; Image recognition; Question answering systems; Recurrent neural networks; Speech synthesis; Voice interaction; Speech recognition; Augmented intelligence; Long short-term memory; Support vector machines; Knowledge representation; Knowledge graphs; Intelligent search; Intelligent agents; Intelligent speech; Natural language processing; Supervised learning; Unsupervised learning; Self-supervised learning; Semantic recognition.
InfrastructureAI chips; Edge computing; Big data processing; Big data analytics; Big data management; Big data platforms; Big data operations; Distributed computing; Internet of Things; Cloud computing; Smart sensors; Intelligent computing; Intelligent chips; Computing power.
Application ScenariosAI products; Big data risk control; Big data marketing; Robotic process automation; Wearable products; Business intelligence; Driverless technology; Virtual reality; Augmented reality; Smart finance; Smart banking; Intelligent insurance; Smart environmental protection; Smart homes; Intelligent regulation; Smart education; Intelligent customer service; Smart retail; Smart agriculture; Robo-advisory; Smart eldercare; Smart healthcare; Smart speakers; Intelligent transportation; Smart government services; Autonomous driving; Wearable devices; Mixed reality; Smart terminals; Industrial robots.
Table 2. Correlations and Descriptive Statistics.
Variables(1)(2)(3)(4)(5)(6)(7)(8)(9)(10)(11)(12)(13)
(1) VOL1.00
(2) GROW0.03 *1.00
(3) MCC0.07 *0.04 *1.00
(4) MCS−0.04 *−0.05 *0.09 *1.00
(5) AIO0.08 *−0.010.02 *−0.02 *1.00
(6) AGE−0.12 *−0.10 *−0.05 *0.03 *−0.05 *1.00
(7) SIZE−0.27 *0.08 *−0.13 *0.01−0.11 *0.20 *1.00
(8) LEV−0.03 *0.05 *−0.05 *0.04 *−0.13 *0.17 *0.47 *1.00
(9) ROA−0.10 *0.27 *−0.08 *−0.02 *−0.08 *−0.07 *0.06 *−0.34 *1.00
(10) FIX−0.10 *−0.08 *0.05 *0.09 *−0.22 *0.04 *0.16 *0.10 *−0.04 *1.00
(11) INTAN−0.03 *−0.02 *−0.03 *0.07 *−0.05 *0.02 *0.06 *0.05 *−0.06 *0.09 *1.00
(12) TOP5−0.06 *0.06 *0.04 *−0.02 *−0.13 *−0.13 *0.15 *−0.07 *0.23 *0.08 *0.011.00
(13) SOE−0.13 *−0.08 *0.000.12 *−0.12 *0.20 *0.38 *0.29 *−0.07 *0.21 *0.08 *0.08 *1.00
Mean0.070.600.331.250.013.0022.280.430.030.200.040.520.33
SD0.031.180.231.480.030.301.280.210.070.150.050.150.47
Min0.02−0.730.020.000.002.2019.990.06−0.250.000.000.190.00
Max0.157.870.985.000.173.6426.430.920.200.670.310.871.00
N19,05719,05719,05719,05719,05719,05719,05719,05719,05719,05719,05719,05719,057
Note: * p < 0.05.
Table 3. Results of baseline regression.
VariablesVOLGROW
(1)(2)(3)(4)(5)(6)
MCC0.009 ***0.004 **0.004 **0.229 ***0.343 **0.348 **
(0.0011)(0.0018)(0.0018)(0.0526)(0.1367)(0.1354)
MCS−0.001 ***−0.001 ***−0.001 ***−0.044 ***−0.027 ***−0.027 ***
(0.0001)(0.0001)(0.0001)(0.0062)(0.0076)(0.0076)
AIO −0.040 *** −2.358 ***
(0.0131) (0.8280)
MCC × AIO 0.064 9.814 ***
(0.0503) (3.0460)
MCS × AIO −0.016 *** 0.326
(0.0043) (0.2205)
AGE −0.014 ***−0.013 *** −0.215−0.178
(0.0046)(0.0046) (0.3380)(0.3368)
SIZE −0.007 ***−0.007 *** 0.609 ***0.617 ***
(0.0006)(0.0006) (0.0517)(0.0515)
LEV 0.017 ***0.017 *** 1.438 ***1.436 ***
(0.0020)(0.0020) (0.1652)(0.1649)
ROA 0.014 ***0.013 *** 5.943 ***5.915 ***
(0.0040)(0.0040) (0.2768)(0.2767)
FIX −0.005 *−0.005 * 0.1330.129
(0.0029)(0.0029) (0.2005)(0.2004)
INTAN −0.001−0.001 −1.364 **−1.342 **
(0.0073)(0.0073) (0.5727)(0.5738)
TOP5 0.0020.001 1.756 ***1.712 ***
(0.0032)(0.0033) (0.2525)(0.2515)
SOE −0.000−0.001 −0.282 ***−0.285 ***
(0.0012)(0.0012) (0.0850)(0.0848)
Constant0.063 ***0.251 ***0.248 ***0.579 ***−12.435 ***−12.662 ***
(0.0005)(0.0195)(0.0195)(0.0204)(1.4622)(1.4620)
IndividualNoYesYesNoYesYes
IndustryNoYesYesNoYesYes
YearNoYesYesNoYesYes
N19,05719,05719,05719,05719,05719,057
Adj. R20.010.430.430.000.230.23
Notes: Firm-level clustered robust standard errors in parentheses. *** p < 0.01, ** p < 0.05, * p < 0.1.
Table 4. Results of omitted-variable test.
Model SpecificationVOL: MCCVOL: MCSGROW: MCCGROW: MCS
CoefficientRatioCoefficientRatioCoefficientRatioCoefficientRatio
No FE, no controls0.00870.9931−0.00082.39130.22862.9954−0.04381.6923
With FE, no controls0.00573.0709−0.000518.33330.20982.5732−0.03523.5901
No FE, with controls0.004614.4333−0.000627.50000.44603.3329−0.03285.2281
Table 5. Results of endogeneity concerns.
PSMHeckmanIV-2SLS
First-StageSecond-StageFirst-StageSecond-Stage
VariablesVOLGROWCIDVOLGROWMCCMCSVOLGROW
(1)(2)(3)(4)(5)(6)(7)(8)(9)
MCC0.004 **0.372 *** 0.004 **0.344 ** 0.005 *0.184
(0.0019)(0.1406) (0.0018)(0.1365) (0.0025)(0.1932)
MCS−0.001 ***−0.026 *** −0.001 ***−0.028 *** −0.001 ***−0.039 ***
(0.0001)(0.0078) (0.0001)(0.0076) (0.0002)(0.0096)
DIR 2.674 ***
(0.0971)
IMR 0.005 ***0.096
(0.0014)(0.0989)
MCC_IV 0.717 ***0.013
(0.0140)(0.0688)
MCS_IV −0.001 *0.959 ***
(0.0006)(0.0061)
Constant0.260 ***−13.072 ***−0.692 **0.250 ***−12.465 ***0.453 ***0.7730.251 ***−12.256 ***
(0.0209)(1.4507)(0.3225)(0.0194)(1.4616)(0.1198)(0.7602)(0.0195)(1.4703)
ControlsYesYesYesYesYesYesYesYesYes
IndividualYesYesNoYesYesYesYesYesYes
IndustryYesYesYesYesYesYesYesYesYes
YearYesYesYesYesYesYesYesYesYes
N17,40217,40239,86719,05719,05719,05719,05719,05719,057
Adj. R20.430.23 0.430.230.470.62
Notes: Firm-level clustered robust standard errors in parentheses. *** p < 0.01, ** p < 0.05, * p < 0.1.
Table 6. Results of alternative measures.
VariablesVol_MGrow_5Y
(1)(2)(3)(4)(5)(6)
MCC0.010 **0.010 **0.010 **0.479 *0.475 *0.483 *
(0.0048)(0.0048)(0.0048)(0.2838)(0.2823)(0.2825)
MCS−0.001 ***−0.001 ***−0.001 ***−0.028 *−0.025 *−0.025 *
(0.0004)(0.0004)(0.0004)(0.0144)(0.0143)(0.0143)
AIO_TECH −0.108 ** −5.394 ***
(0.0450) (1.9829)
MCC × AIO_TECH 0.331 ** 18.170 **
(0.1679) (7.2295)
MCS × AIO_TECH −0.035 *** −0.426
(0.0131) (0.5434)
AIO_MDA −0.006 −0.829 ***
(0.0070) (0.2873)
MCC × AIO_MDA 0.063 ** 2.258 **
(0.0276) (1.1047)
MCS × AIO_MDA −0.006 ** −0.033
(0.0024) (0.0855)
Constant0.487 ***0.478 ***0.482 ***−29.038 ***−29.483 ***−29.386 ***
(0.0510)(0.0510)(0.0510)(3.5917)(3.5912)(3.5932)
ControlsYesYesYesYesYesYes
IndividualYesYesYesYesYesYes
IndustryYesYesYesYesYesYes
YearYesYesYesYesYesYes
N19,05719,05719,05719,05719,05719,057
Adj. R20.300.300.300.210.210.21
Notes: Firm-level clustered robust standard errors in parentheses. *** p < 0.01, ** p < 0.05, * p < 0.1.
Table 7. Results of subsample tests.
Excl. the Samples of 2020Excl. Info IndustriesPost-2018 Subsample
VariablesVOLGROWVOLGROWVOLGROW
(1)(2)(3)(4)(5)(6)(7)(8)
MCC0.004 **0.004 **0.325 **0.333 **0.004 **0.373 ***0.0030.506 ***
(0.0019)(0.0019)(0.1455)(0.1440)(0.0019)(0.1437)(0.0027)(0.1688)
MCS−0.001 ***−0.001 ***−0.031 ***−0.030 ***−0.001 ***−0.026 ***−0.000 **−0.010
(0.0001)(0.0001)(0.0080)(0.0080)(0.0001)(0.0082)(0.0002)(0.0092)
AIO −0.035 *** −2.434 ***−0.030 *−2.587 **0.0020.014
(0.0136) (0.8495)(0.0175)(1.3183)(0.0199)(0.8544)
MCC × AIO 0.056 9.058 ***0.0947.373 *0.0695.462 **
(0.0544) (3.1561)(0.0708)(4.1970)(0.0665)(2.7165)
MCS × AIO −0.017 *** 0.297−0.011 *0.472−0.020 ***0.359 *
(0.0046) (0.2323)(0.0059)(0.3592)(0.0058)(0.1930)
Constant0.242 ***0.239 ***−11.755 ***−11.973 ***0.239 ***−12.512 ***0.325 ***−14.450 ***
(0.0199)(0.0199)(1.4271)(1.4276)(0.0203)(1.5131)(0.0368)(2.3118)
ControlsYesYesYesYesYesYesYesYes
IndividualYesYesYesYesYesYesYesYes
IndustryYesYesYesYesYesYesYesYes
YearYesYesYesYesYesYesYesYes
N17,50517,50517,50517,50517,41717,41712,99112,991
Adj. R20.460.460.230.230.440.230.180.24
Notes: Firm-level clustered robust standard errors in parentheses. *** p < 0.01, ** p < 0.05, * p < 0.1.
Table 8. Results of heterogeneity analysis.
VOLGROWVOLGROW
VariablesHigh SCPWLow SCPWHigh SCPWLow SCPWHigh SCDTLow SCDTHigh SCDTLow SCDT
(1)(2)(3)(4)(5)(6)(7)(8)
MCC0.0010.008 ***0.352 *0.1150.0030.0040.2060.188
(0.0027)(0.0027)(0.1946)(0.1801)(0.0035)(0.0024)(0.2113)(0.1862)
MCS−0.000 *−0.001 ***−0.032 ***−0.027 ***−0.000−0.001 ***−0.008−0.038 ***
(0.0002)(0.0002)(0.0114)(0.0102)(0.0002)(0.0002)(0.0105)(0.0110)
AIO−0.036−0.038 **−2.627 *−2.600 **−0.033 *−0.073 ***−1.169−3.405 **
(0.0263)(0.0160)(1.3712)(1.0989)(0.0177)(0.0230)(1.2520)(1.3788)
MCC × AIO0.0220.031−0.48312.007 ***0.0610.0619.678 ***4.441
(0.1138)(0.0685)(5.1301)(3.1806)(0.0659)(0.0954)(3.2789)(6.2151)
MCS × AIO−0.003−0.020 ***0.710 *0.274−0.018 ***−0.017 *0.2480.686
(0.0085)(0.0057)(0.3884)(0.2362)(0.0056)(0.0091)(0.2422)(0.5552)
Constant0.265 ***0.233 ***−12.891 ***−10.957 ***0.277 ***0.232 ***−14.263 ***−12.823 ***
(0.0255)(0.0274)(2.2031)(1.9323)(0.0333)(0.0260)(2.5071)(1.9311)
ControlsYesYesYesYesYesYesYesYes
IndividualYesYesYesYesYesYesYesYes
IndustryYesYesYesYesYesYesYesYes
YearYesYesYesYesYesYesYesYes
N9528952995289529814410,913814410,913
Adj. R20.440.450.230.230.420.450.250.23
Difference−0.017 **12.490 **0.002−5.237
Chow F-statistics4.51 ***3.62 ***3.50 ***3.48 ***
Notes: Firm-level clustered robust standard errors in parentheses. *** p < 0.01, ** p < 0.05, * p < 0.1. Between-group differences are assessed using Fisher’s permutation test with 1000 permutations.
Disclaimer/Publisher’s Note: The statements, opinions and data contained in all publications are solely those of the individual author(s) and contributor(s) and not of MDPI and/or the editor(s). MDPI and/or the editor(s) disclaim responsibility for any injury to people or property resulting from any ideas, methods, instructions or products referred to in the content.