Article

Optimal Coordination of Bail-In and Bailout for Troubled Banks in China: An Interbank Network Contagion Approach

1
Department of Finance, School of Economics, Beijing Technology and Business University, Beijing 100048, China
2
Dongying Yatong Petrochemical Co., Ltd., Dongying 257237, China
*
Author to whom correspondence should be addressed.
Systems 2026, 14(7), 877; https://doi.org/10.3390/systems14070877
Submission received: 30 April 2026 / Revised: 10 July 2026 / Accepted: 15 July 2026 / Published: 22 July 2026
(This article belongs to the Special Issue Risk Engineering in an Era of Global Uncertainty)

Abstract

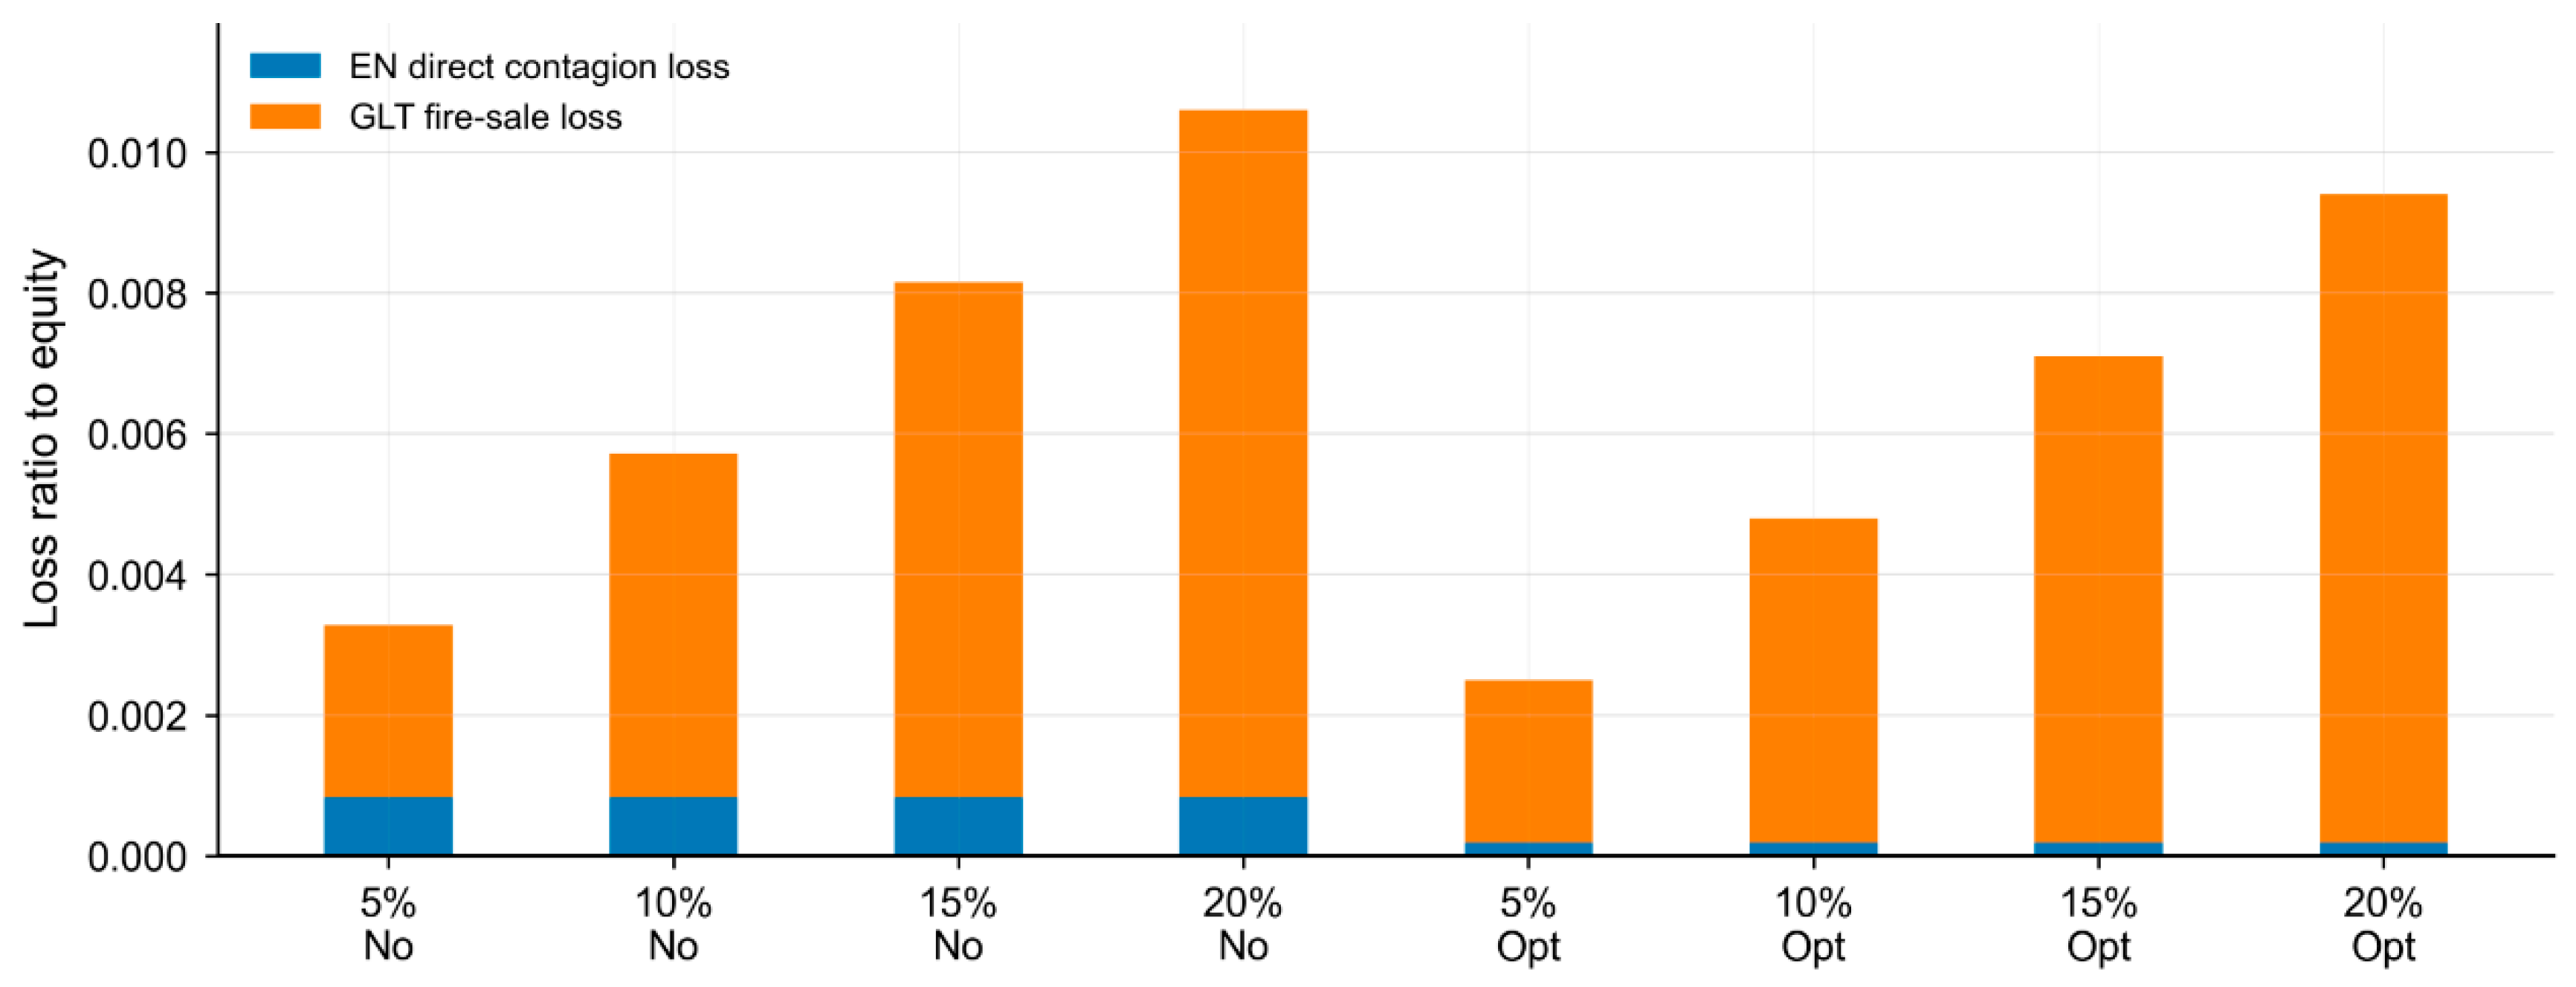
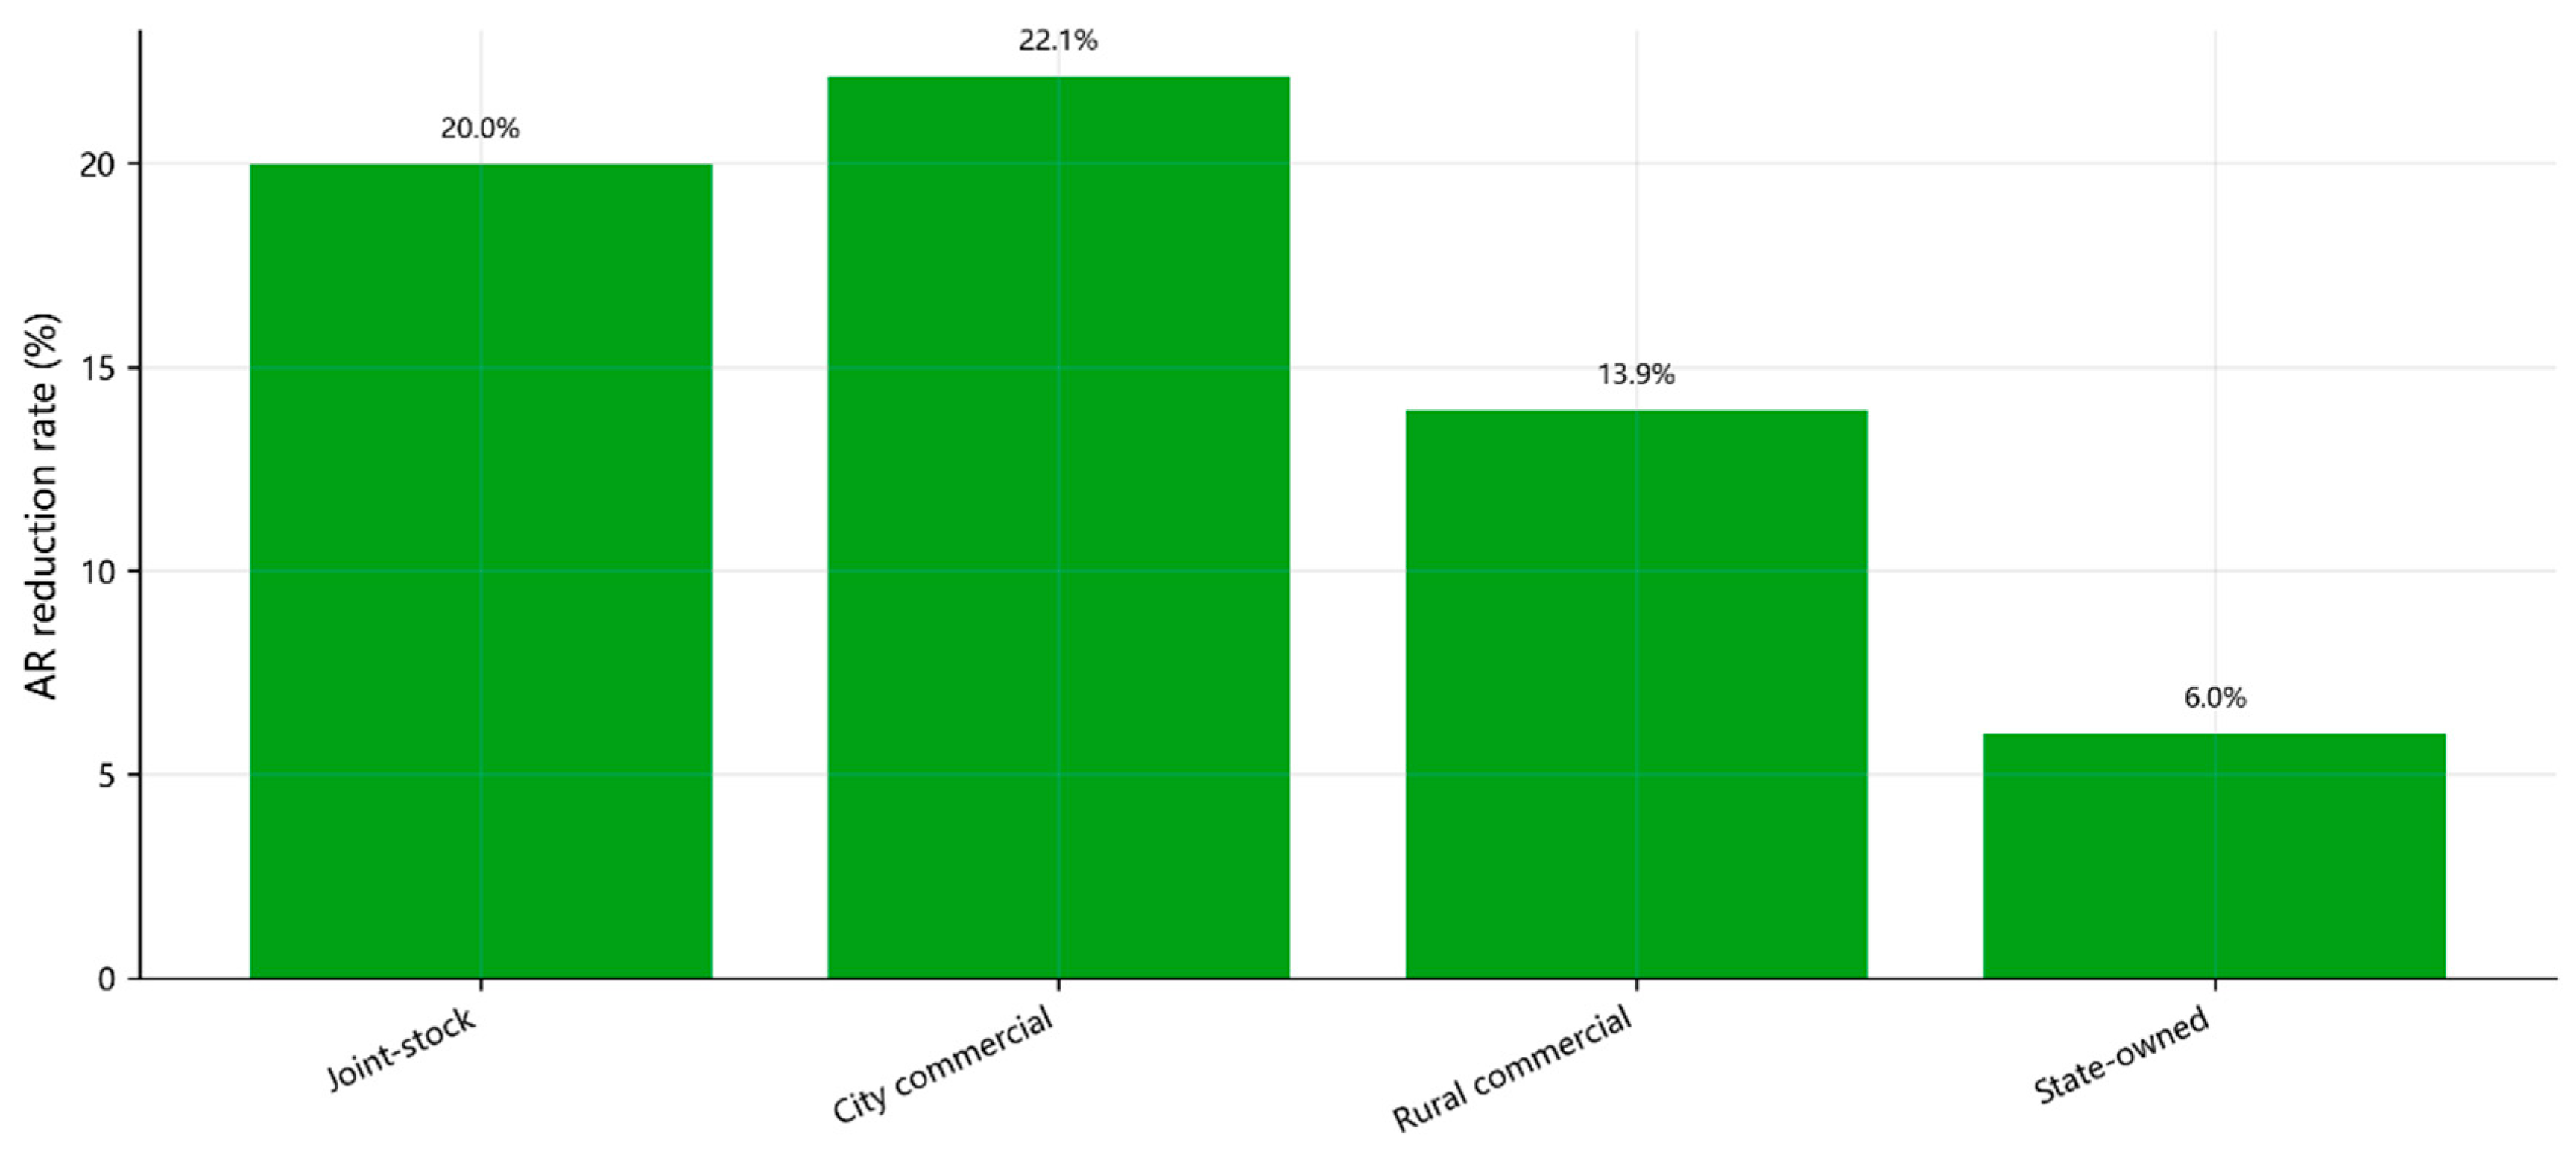
This study examines the optimal coordination of internal and external rescue for troubled banks under systemic contagion. Using annual data for 210 Chinese commercial banks from 2013 to 2024, it constructs a region-constrained minimum-density interbank network and embeds it in an EN-GLT dual-channel contagion framework that captures both direct default losses and asset fire-sale losses. Each bank is sequentially treated as the initially shocked institution, and pure internal rescue, pure external rescue, and mixed rescue strategies are compared under risk-tolerance, rescue-capacity, cost, and moral-hazard constraints. The results show that capital-loss contagion and fire-sale amplification are economically meaningful under the no-rescue scenario and become stronger as the fire-sale markdown rate rises. Mixed rescue outperforms pure internal or pure external rescue in most years, with the optimal internal rescue share mainly concentrated between 30% and 55%. The findings indicate that problem-bank resolution should combine internal loss absorption with external stabilization and should be differentiated according to contagion channels, bank type, and the nature of the crisis.

1. Introduction

The resolution of troubled banks is a central issue in financial stability policy. In a bank-centered financial system, distress at one institution may not remain an isolated balance-sheet event. It can spread to other banks through direct interbank claims, funding-market pressure, creditor confidence, and common asset-price adjustments [1,2,3]. As such, the policy question is not only whether authorities should intervene in a distressed bank, but also how losses should be allocated between internal stakeholders and external public support when contagion is possible.
The theoretical rationale for bank rescue is closely related to the externalities generated by financial distress. When a bank becomes undercapitalized or illiquid, its failure may impose losses on creditors, disrupt credit intermediation, and force other institutions to absorb valuation losses. In the absence of timely intervention, these channels may amplify an initial shock into a system-wide crisis. At the same time, unrestricted public support may weaken market discipline and generate moral hazard [4,5]. Internal loss absorption, such as creditor bail-in, debt write-downs, or debt-to-equity conversion, can help contain fiscal costs and strengthen creditor discipline. However, internal rescue is constrained by the loss-absorbing capacity of bank creditors and may itself transmit losses to other financial institutions. External rescue, such as government capital injection, liquidity guarantees, or deposit insurance support, can stabilize expectations and contain panic in the short run. However, excessive reliance on public funds may weaken market discipline, generate moral hazard, and expose taxpayers to resolution losses, which is why international resolution standards emphasize orderly resolution, loss allocation to shareholders and creditors, and the avoidance of taxpayer-funded solvency support [6,7,8]. From this perspective, internal rescue and external rescue are not simple substitutes. They may be complementary instruments whose effectiveness depends on the structure of financial linkages and the source of systemic pressure.
Recent developments in China provide a particularly relevant setting for examining this issue. Although the Chinese banking sector has remained broadly stable, several small and medium-sized banks have experienced mounting pressure from asset-quality deterioration, liquidity mismatch, weak governance, and regional economic shocks. The resolution of Baoshang Bank illustrates how the failure of a seemingly individual institution can become a broader financial-stability concern [9,10]. More generally, China’s bank-centered financial system, the local orientation of many small and medium-sized banks, and the cross-regional role of national banks imply that problem-bank resolution should be studied within an interbank network rather than through the balance sheet of a single institution alone.
Despite the considerable amount of research devoted to bank risk, financial contagion, and bailout policy, several issues remain insufficiently examined. First, much of the contagion literature focuses either on direct interbank default transmission or on aggregate financial connectedness. Fewer studies explicitly combine direct default losses with fire-sale losses in a unified bank-resolution framework [11,12,13]. This distinction is important because a rescue strategy that is effective in reducing direct creditor losses may not be equally effective in mitigating asset-price spillovers. Second, empirical reconstruction of interbank networks often relies on balance-sheet constraints alone. Such methods may generate overly dense or economically unrealistic links if they ignore the regional operating boundaries of local banks [14,15]. This problem is particularly relevant in China, where local small and medium-sized banks mainly operate within provincial markets, whereas large national banks serve as cross-regional hubs. Third, existing bailout studies often evaluate internal resolution and external public support separately. However, in practice, problem-bank resolution usually involves a combination of creditor discipline, capital support, liquidity stabilization, and confidence management. Little is known about the optimal mixture of internal and external rescue when distress propagates through a heterogeneous banking network.
This paper contributes to the literature by developing a simulation framework that links network reconstruction, contagion dynamics, and bailout design. We construct a region-constrained minimum-density interbank network using bank-level interbank assets and liabilities. The regional constraint allows local banks to connect mainly with same-province banks and national banks, thereby reducing unrealistic cross-regional links among local institutions. On this reconstructed network, we model contagion through two channels. The first is an Eisenberg–Noe-type direct default channel, through which the default of one bank imposes credit losses on its interbank creditors [11]. The second is a fire-sale channel, through which distressed asset sales depress market prices and generate valuation losses for other banks with similar asset exposures [12,13]. We then introduce a dynamic rescue module that compares pure internal rescue, pure external rescue, and mixed rescue strategies under risk-tolerance, rescue-capacity, cost, and moral-hazard constraints.
The empirical analysis uses annual data for 210 Chinese commercial banks from 2013 to 2024, including city commercial banks, rural commercial banks, joint-stock banks, and large state-owned banks. Each bank is sequentially treated as the initially shocked institution, generating exhaustive bank-year stress scenarios. For each scenario, we compute systemic loss, default probability, the number of failed banks, internal and external rescue costs, moral-hazard costs, and a composite policy index. We further examine whether the results are robust to alternative fire-sale markdowns, creditor recovery rates, and external rescue mechanisms.
This paper makes three main contributions. First, it extends network-based research on bank contagion by embedding rescue simulation in a region-constrained exposure network rather than in a generic or fully connected interbank structure. This allows the model to better capture two institutional features of the Chinese banking system: the provincial concentration of local banks and the cross-regional hub role of national banks. Second, it treats internal and external rescue as jointly determined policy instruments. Prior studies tend to analyze bail-in and bailout separately; this paper examines how their interaction affects systemic risk, rescue cost, and moral hazard. Third, it links the design of rescue strategies to specific contagion channels. By distinguishing direct default losses from fire-sale losses, the paper explains why different rescue instruments may perform differently under different sources of systemic pressure.
The results suggest that problem-bank resolution should neither rely mechanically on government-led bailouts nor assume that maximum internal loss absorption is always optimal. Mixed rescue generally performs better than either pure internal or pure external rescue. Under the baseline setting, the optimal internal rescue share is mainly concentrated in the 30–55% range, indicating that a moderate degree of creditor discipline combined with public stabilization can achieve a better balance between contagion control, fiscal cost, and moral-hazard containment. The results also show that fire-sale losses are an important channel through which external rescue mechanisms differ in effectiveness. Liquidity guarantees are more useful when distress is driven by asset sales and liquidity pressure, whereas capital injection is more direct when the main problem is a capital shortfall.
The remainder of this paper is organized as follows. Section 2 reviews the literature on problem banks, risk contagion, and bailout mechanisms. Section 3 presents the research design, including the construction of the region-constrained interbank network, the EN-GLT contagion model, and the dynamic internal–external rescue mechanism. Section 4 reports the empirical results and robustness tests. Section 5 concludes with policy implications.

2. Literature Review and Hypotheses

2.1. Problem Banks and Systemic Contagion

Problem banks are commonly associated with material weaknesses in liquidity, solvency, asset quality, governance, or risk management. Regulatory guidance defines weak banks as institutions whose financial or managerial conditions may threaten their continuing operations and therefore require supervisory attention before formal insolvency occurs [9]. This definition implies that problem-bank identification should not be restricted to ex post bankruptcy events. Rather, it should include institutions whose deterioration may require external support or trigger wider financial-stability concerns.
The academic literature has extended this regulatory view by emphasizing the externalities of bank distress. Distressed banks can transmit private balance-sheet losses to other institutions and borrowers through local credit supply, capital constraints, and lending relationships. As a result, the social cost of bank distress may exceed the private loss borne by the failing institution itself [16]. Market-based evidence reaches a similar conclusion. Adverse information about one bank may generate spillovers in the stock returns of other banks, indicating that the distress signal of one institution can affect otherwise healthy institutions [17]. These studies suggest that a bank becomes a problem bank not only because its own balance sheet weakens, but also because its distress may threaten the stability of the broader financial system.
Early identification is therefore central to problem-bank resolution. Empirical evidence from post-crisis bank failures shows that regulatory forbearance and delayed corrective action can increase resolution costs and allow weak institutions to deteriorate further, whereas timely supervisory intervention and prompt corrective action may help contain losses and reduce systemic risk [18,19,20]. This logic is particularly relevant in bank-centered financial systems, where the failure of one institution may affect payment settlement, interbank funding, and creditor confidence. In the Chinese context, small and medium-sized banks are often more exposed to regional economic shocks, concentrated asset portfolios, and governance weaknesses. These characteristics increase the possibility that local distress becomes a systemic issue once the institution is embedded in a network of interbank claims.
The mechanisms of financial contagion have been widely discussed in the literature. Existing studies generally distinguish among common shocks, spillover effects, and pure contagion. During and after the global financial crisis, bank risk was increasingly treated as a networked phenomenon rather than a purely idiosyncratic event. Billio et al. [21] show that financial institutions are connected through market and balance-sheet linkages even when direct exposures are difficult to observe. Fang et al. [22] construct a network of 711 Chinese banks using media co-occurrence data and show that small and medium-sized banks have become important drivers of systemic risk in China’s banking sector, highlighting the need to analyze bank distress from a network-contagion perspective. Evidence from China also indicates that systemic risk measurement should account for interbank network topology, node importance, and balance-sheet connections [23]. Chen et al. [24] further show that contagion risk is heterogeneous across institutions and changes with the structure of the banking network.
A first contagion channel operates through direct interbank exposures. When a problem bank defaults on its obligations, creditor banks incur credit losses. This mechanism is consistent with the Eisenberg–Noe clearing framework, in which defaults propagate through bilateral liability networks [11]. A second channel operates through asset fire sales. When distressed banks are forced to liquidate assets, the resulting price decline may impose valuation losses on other institutions holding similar assets [12,13]. These two channels are not mutually exclusive. Models that combine interbank exposures with liquidity pressure, common asset holdings, or payment-related linkages show that simultaneous shocks can generate amplification effects greater than those implied by any single channel alone [25].
International evidence also suggests that contagion depends on the structure of financial linkages. Fiala and Havranek [26] show that foreign ownership and cross-border banking connections can transmit shocks to domestic institutions. Duggar and Mitra [27] find that external banking linkages can create shifting sources of contagion over time. Network-based operational-risk models similarly indicate that node degree, the initial location of shocks, and regulatory responses materially affect systemic losses, whereas simple measures of network size provide only limited explanatory power [28]. These studies jointly imply that problem-bank distress should be analyzed through explicit contagion channels and network structures. This motivates the need to move from general contagion mechanisms to the specific network structures through which problem-bank distress is transmitted. Based on the above arguments, we propose the following hypothesis:
Hypothesis 1.
Problem-bank distress generates systemic risk contagion through interbank default and asset fire-sale channels, and contagion intensity increases with market stress.

2.2. Interbank Network Structure, Institutional Heterogeneity, and Rescue Effectiveness

A key empirical challenge in studying bank contagion is that true bilateral interbank exposures are usually unobservable. Upper and Worms [14] note that researchers often need to estimate bilateral exposures from aggregate interbank assets and liabilities. Maximum-entropy methods can satisfy aggregate balance-sheet constraints, but they tend to generate dense networks and may therefore overstate the degree of interbank connectedness [15]. Minimum-density methods provide a more realistic alternative by constructing sparse networks under balance-sheet constraints [29]. However, if such methods ignore institutional and regional characteristics, they may still generate economically unrealistic links.
This issue is particularly important for China. Large national banks operate across regions and can serve as interregional hubs, whereas many city commercial banks and rural commercial banks are locally oriented. If local banks are assumed to connect freely with all other local banks across provinces, the reconstructed network may create artificial contagion paths that are inconsistent with their actual operating boundaries. Therefore, network reconstruction should incorporate both balance-sheet feasibility and institutional realism. A region-constrained minimum-density network can help address this issue by allowing local banks to connect mainly with same-province banks and national banks, while limiting unrealistic cross-regional links among non-national banks.
Network structure matters because contagion is not only determined by the size of the initial shock, but also by the position of the shocked institution in the network. Banks with higher centrality or more direct interbank connections may transmit losses more rapidly. Banks located in locally clustered groups may contribute to repeated rounds of regional contagion. Conversely, large national banks may play a dual role: they can absorb shocks because of stronger capital positions, but they may also serve as conduits through which shocks spread across regions. Aldasoro et al. [30] show that topology, centrality, and prudential policy jointly determine the propagation of shocks in banking networks. This suggests that rescue priorities should not be based solely on asset size, but should also consider debt interlinkages, market activity, and the likely reduction in systemic losses achieved by stabilizing particular nodes.
Existing studies on China also point to the importance of heterogeneous contagion. Evidence from China’s banking network shows that small and medium-sized banks can be both important recipients and transmitters of shocks, while large or state-linked banks may play different roles because of stronger capital positions and implicit support [24]. This implies that treating all banks as identical nodes may obscure the mechanism through which risks are transmitted and absorbed. A more appropriate approach is to evaluate contagion and rescue effectiveness conditional on bank type, network location, and exposure structure.
Institutional heterogeneity may also affect the effectiveness of rescue strategies. For example, external public support may have stronger stabilizing effects for banks whose distress is driven mainly by liquidity pressure or confidence shocks, whereas internal loss absorption may be more effective when creditor discipline can be imposed without triggering additional contagion. Similarly, a bank occupying a central position in the interbank network may require a different rescue design from a peripheral bank because the systemic loss avoided by stabilizing the former may be larger. Therefore, the effect of a rescue strategy cannot be evaluated independently of bank type and network structure. These arguments lead to the following hypothesis:
Hypothesis 2.
The contagion impact and rescue effectiveness of problem-bank distress are heterogeneous across bank types and interbank network structures, implying that institutional characteristics and exposure structures condition systemic risk transmission.

2.3. Internal Loss Absorption, External Public Support, and Mixed Rescue

The rescue of distressed banks has long involved a trade-off between internal loss absorption and external public support. Internal loss absorption, including bail-in, debt write-downs, debt-to-equity conversion, shareholder loss sharing, and capital instrument write-downs, can reduce fiscal burden and strengthen market discipline. Such mechanisms are consistent with the post-crisis policy emphasis on bail-in, creditor discipline, and the allocation of losses to shareholders and creditors within the failing institution [8,31]. However, internal rescue is constrained by the loss-absorbing capacity of shareholders and creditors. If creditor banks are themselves financially fragile, imposing excessive losses on them may intensify contagion rather than contain it.
External public support, including government capital injection, liquidity guarantees, and deposit insurance support, can stabilize market expectations and prevent panic. Classic banking theory shows that deposit insurance and lender-of-last-resort support can prevent inefficient runs when confidence deteriorates [32]. Crisis-resolution models further emphasize that intervention design should consider liquidity conditions, fire-sale risk, and the cost of delayed resolution [33]. Capital injection programs can improve bank performance and credit-risk transfer during crisis periods, but their effectiveness depends on program design and moral-hazard control [7,34]. Similarly, deposit insurance can protect confidence, but it may increase risk-taking if guarantees weaken market discipline [35].
The literature does not imply that bail-in and bailout are simple substitutes. Klimek et al. [36] show that liquidation, bail-in, and bailout policies may perform differently under different macroeconomic conditions. Pandolfi [37] further argues that bail-in and bailout can be complementary because limited public support may reduce funding-cost distortions while preserving incentives for private loss absorption. Sustainable-resolution research also distinguishes among self-rescue, external intervention, and hybrid mechanisms, emphasizing that public support should be embedded within internal restructuring, creditor discipline, and moral-hazard control [38]. From this perspective, the relevant policy question is not whether internal or external rescue is universally superior, but how the two instruments should be combined under different systemic conditions.
The literature on bank resolution planning also supports the need for a structured and staged approach. Avgouleas et al. [39] argue that bank resolution plans, or “living wills,” can improve the resolvability of systemically important financial institutions by clarifying institutional structures, preparing recovery and resolution options ex ante, and reducing expectations of taxpayer-funded bailouts. Deidda and Panetti [40] further show that bank recovery and resolution planning are complementary: ex ante recovery plans can specify liquidity management during runs, while resolution authorities need sufficient powers to enforce such plans under financial fragility. Interbank-contagion models further show that bank capital levels affect both contagion losses and rescue costs, implying that capital adequacy is a key precondition for reducing the fiscal burden of rescue [41]. Evidence from failed-bank sales also indicates that resolution outcomes depend on bank size, asset quality, and the market’s capacity to absorb failed institutions [42].
For China, these arguments are especially relevant because government-led rescue remains an important mechanism for dealing with distressed banks. However, excessive reliance on external public support may reinforce expectations of implicit guarantees. At the same time, pure internal rescue may be insufficient if the capital gap is large or if creditors are themselves connected to other banks. Therefore, a mixed rescue strategy may provide a better balance. Internal loss absorption can impose discipline and reduce public costs, while external public support can stabilize expectations and prevent contagion when internal capacity is exhausted.
The optimal rescue mix should also vary with market stress and the type of external rescue tool. When market stress is high, fire-sale losses and confidence effects may become more important, increasing the value of liquidity guarantees or deposit insurance support. When the main source of distress is a capital shortfall, capital injection may be more direct. However, if public support is too generous, moral-hazard costs may rise. Conversely, if internal loss absorption is too strong, losses may be shifted to creditor banks and amplify interbank contagion. Compared with studies that examine financial stress mainly through market connectedness, this paper further asks how such stress affects the design and performance of problem-bank rescue strategies. A dynamically calibrated mixed rescue strategy is therefore expected to outperform a single mechanism by balancing systemic risk reduction, rescue cost, and moral-hazard control. Based on the above discussion, we propose the following hypothesis:
Hypothesis 3.
A dynamically calibrated mixed rescue strategy that combines internal loss absorption and external public support achieves a more favorable trade-off among systemic risk reduction, rescue cost, and moral-hazard control than a single rescue mechanism; the optimal mix varies with market stress and external rescue tools.

3. Research Design

3.1. Research Framework and Sample Description

3.1.1. Research Logic and Overall Framework

This section examines how internal rescue and external rescue can be coordinated in the resolution of problem banks in China so as to contain risk contagion more effectively within the banking system. To this end, it develops an integrated framework that combines a region-constrained minimum-density network [14], an EN-GLT dual-channel contagion model [11,12,13], and a dynamic internal–external rescue mechanism [36]. The framework first estimates the bilateral interbank exposure matrix from banks’ interbank assets and interbank liabilities. It then simulates the propagation of risk after an external shock on the reconstructed interbank network. Finally, it incorporates internal and external rescue mechanisms and identifies the optimal rescue mix subject to systemic risk control, rescue-cost containment, and moral-hazard mitigation.
Unlike studies that evaluate a single intervention instrument, this study emphasizes the dynamic coordination between internal loss sharing and external public support. Internal rescue can reduce the fiscal burden and restrain moral hazard, but its capacity to absorb losses is constrained by the capital position of the distressed bank and the loss-bearing capacity of its creditors. External rescue can replenish capital quickly and stabilize market expectations, but excessive reliance on government support may intensify moral hazard. Accordingly, the central question is not whether internal rescue is superior to external rescue, or vice versa. Rather, the analysis asks how the two mechanisms should be combined under different risk shocks and network structures in order to balance systemic risk reduction with policy-cost containment.
To ensure the reproducibility of the simulation exercise, the empirical procedure is organized into five steps. First, annual bank-level panel data are cleaned and standardized. Second, a region-constrained minimum-density interbank exposure matrix is constructed. Third, the natural contagion process is simulated under a no-rescue benchmark scenario. Fourth, internal rescue, external rescue, and mixed rescue strategies are introduced, and the associated risk, cost, and moral-hazard implications are calculated under different rescue proportions. Fifth, the optimal rescue proportion is identified subject to a risk-tolerance constraint, and the robustness of the conclusions is examined through parameter sensitivity analyses.

3.1.2. Sample Data and Variable Treatment

This study conducts empirical simulations using annual data for Chinese commercial banks from 2013 to 2024. The data are mainly obtained from the Wind database and banks’ annual reports. To keep the sample consistent with the institutional practice of problem-bank resolution in China, foreign-funded banks are excluded. The final sample contains four types of commercial banks: city commercial banks, rural commercial banks, joint-stock commercial banks, and large state-owned commercial banks. It includes 210 banks and 2520 bank-year observations.
For consistency in variable measurement, all monetary variables are standardized and expressed in units of RMB 100 million. The core variables used for network construction include interbank assets, interbank liabilities, total assets, total liabilities, equity capital, the capital adequacy ratio, province of registration, and bank type. Specifically, interbank assets measure a bank’s claim exposures to other financial institutions, whereas interbank liabilities capture its obligations to other financial institutions. Equity capital reflects the capital buffer available to absorb shocks. Province of registration and bank type are used to impose regional constraints and to conduct heterogeneity analysis. The notation and economic meanings of the key symbols used in the analysis are summarized in Table 1.

3.2. Construction of the Region-Constrained Minimum-Density Network

3.2.1. Network Reconstruction Logic

Actual bilateral interbank exposures are generally unavailable [14]. Therefore, the bilateral exposure matrix must be estimated from disclosed information on interbank assets and interbank liabilities. Although the traditional maximum-entropy approach can satisfy row and column sum constraints, it tends to generate excessively dense network structures and may overestimate universal connectivity among banks, as discussed by Mistrulli [15]. The standard minimum-density method can construct a relatively sparse network [29]. However, if banks’ business scope and regional attributes are ignored, this method may still generate cross-regional linkages that are inconsistent with real economic conditions.
Against this background, this study introduces regional constraints into the minimum-density framework. Specifically, national banks are assumed to have cross-regional operating capacity and can therefore establish interbank linkages with banks located in different regions. By contrast, the business activities of local small and medium-sized banks are mainly concentrated within provincial markets. These banks are therefore assumed to form interbank linkages primarily with banks in the same province and with national banks, while cross-provincial linkages among non-national banks are restricted. In this study, national banks mainly refer to large state-owned commercial banks and joint-stock commercial banks, whereas local banks include city commercial banks and rural commercial banks. This setting better captures the localized business characteristics of small and medium-sized banks in China and the cross-regional operating capacity of large banks.

3.2.2. Formal Constraints for Matrix Construction

The exposure matrix is a balance-sheet allocation device rather than a new asset or liability category. Each row converts one bank’s aggregate interbank assets into claims on counterparties, and each column allocates the corresponding liabilities owed by counterparties after the proportional scaling described below. In this way, the estimated matrix links bank-level asset and liability totals to the bilateral exposures used in the contagion simulation.
Assume that the banking system contains N banks. Let I A i denote bank i’s total interbank assets, namely the row total of claims that bank i holds against other financial institutions. The bilateral exposure matrix X = ( x i j ) N × N is the N-by-N matrix to be estimated. Each element x i j records bank i’s claim on bank j and, from the other side of the balance sheet, bank j’s liability to bank i. Matrix construction therefore allocates aggregate interbank assets and scaled liabilities into bilateral exposures subject to the following marginal and non-negativity constraints:
j = 1 N   x i j   =   I A i ,   i   =   1 ,   2 ,   ,   N j = 1 N   x i j   =   I L ~ j ,   j   =   1 ,   2 ,   ,   N x i j     0 , x i i   =   0
In Equation (1), N is the number of sample banks, and i and j are bank indices. The element x i j denotes the interbank claim exposure from bank i to bank j. I A i is the row total of interbank assets held by bank i. The column total represents bank j’s scaled interbank liabilities after the proportional adjustment described in Equation (2), and x i i = 0 excludes self-exposure. Economically, the row constraint allocates each lending bank’s claims, while the column constraint allocates the scaled borrowing obligations of each counterparty.
Here, the tilde-marked I L j s in Equation (2) denotes the scaled interbank liabilities used as column totals. Because disclosed aggregate interbank liabilities are usually larger than disclosed aggregate interbank assets, the liability side is proportionally scaled before the exposure matrix is estimated. This adjustment is a balancing step only: it makes aggregate columns comparable with aggregate rows and does not create additional bank assets or liabilities.
I L j s = I L j × i   I A i j   I L j
In Equation (2), I L j s denotes the scaled interbank liabilities of bank j; I L j denotes the original interbank liabilities before adjustment; the numerator is the aggregate interbank assets in the system; and the denominator is the aggregate interbank liabilities in the system. After this adjustment, the sum of all column totals equals the sum of all row totals, so the estimated exposure matrix is internally consistent with the available balance-sheet data.
After the marginal constraints have been specified, the network algorithm chooses the sparsest set of economically feasible links. Regional constraints define which bank pairs may be linked before positive exposures are assigned. A link is allowed when the two banks are in the same province or when at least one bank is national; otherwise, it is excluded. The regional constraint is expressed as follows:
G i j = 1 , if   p r o v i n c e i = p r o v i n c e j   or   either   bank   i   or   bank   j   is   a   national   bank , 0 , otherwise .
  min X i j c i j I x i j > 0
s . t .   j = 1 N x i j = I A i ,   i = 1,2 , , N i = 1 N x i j = I L ~ j ,   j = 1,2 , , N x i j 0 ,   x i i = 0 ,   i , j = 1,2 , , N x i j = 0 ,   i f   G i j = 0
In Equations (3) and (4), G i j is the regional constraint variable indicating whether an interbank linkage between bank i and bank j is allowed. P r o v i n c e i and P r o v i n c e j denote the provinces in which banks i and j are registered; I . is an indicator function, and c i j denotes the cost of establishing linkage. X is the bilateral exposure matrix to be estimated. In economic terms, the regional constraint determines whether a bilateral exposure is feasible, whereas X records the exposure amount once feasibility and balance-sheet constraints are jointly satisfied.
Equation (4) indicates that the model constructs a sparse exposure network while preserving the asset-side, liability-side, and regional constraints. The resulting matrix therefore has two roles: it satisfies bank-level balance-sheet totals and removes economically implausible cross-provincial links among local banks.

3.2.3. Network Topological Indicators: Definitions and Interpretations

To assess the structural plausibility of the region-constrained minimum-density network and to explain each bank’s role in contagion, this study calculates degree centrality, closeness centrality, and the clustering coefficient. These are standard network measures [43,44,45]. The adjacency matrix records only whether a feasible exposure exists, not the exposure amount itself. Specifically, the adjacency indicator equals 1 when a positive risk exposure exists between bank i and bank j, and 0 otherwise.
  D C i = j a i j + j a j i 2 ( N 1 )
where D C i denotes the degree centrality of bank i; a i j and a j i are elements of the adjacency matrix and capture the direct link from bank i to bank j and from bank j to bank i, respectively; and N − 1 is the number of potential counterparties other than bank i.
Degree centrality reflects normalized in-degree and out-degree centrality. A higher degree centrality indicates that the bank maintains direct interbank linkages with more institutions, so a risk shock can diffuse more easily through direct creditor–debtor relationships.
  C C i = N 1 j i d i j
where C C i denotes the closeness centrality of bank i; d i j denotes the shortest-path distance between bank i and bank j; the denominator is the sum of the shortest-path distances from bank i to all other banks; and N − 1 is the number of sample banks other than bank i.
Closeness centrality measures the average distance from a bank to other banks in the network. A higher closeness centrality indicates that the bank occupies a more central network position and that shocks can reach other banks through shorter paths.
  C L i = 2 e i k i ( k i 1 )
where C L i denotes the clustering coefficient of bank i; e i denotes the number of actual links among bank i’s neighboring banks; k i denotes the number of neighbors, or the degree, of bank i; and k i ( k i − 1)/2 denotes the maximum number of possible links among these neighboring banks.
The clustering coefficient reflects whether the counterparties of a given bank are also connected to one another. A higher clustering coefficient indicates tighter local connections among banks, suggesting that risk may circulate and be amplified within local network clusters. These indicators are reported in the empirical results to help explain differences in risk contagion across years and bank types.

3.3. EN-GLT Dual-Channel Risk Contagion Model

3.3.1. Balance-Sheet Shock and the No-Rescue Benchmark Scenario

After the interbank exposure matrix is constructed, this study simulates the risk contagion process triggered by external shocks. Bank risk contagion is divided into two channels. The first is the direct default contagion channel based on the Eisenberg–Noe framework [11]. The second is the asset fire-sale contagion channel developed from the literature on forced liquidation and price-mediated losses [12,13]. The former captures direct credit losses imposed on creditor banks after a debtor bank defaults, whereas the latter captures valuation losses imposed on other banks when distressed asset sales depress common asset prices.
Before introducing the shock, the bank’s equity capital is defined as the difference between total assets and total liabilities:
  E i t   =   A i t     L i t
where E i t denotes the equity capital of bank i in period t, A i t denotes its total assets, and L i t denotes its total liabilities. Economically, this identity defines the capital buffer available to absorb losses before the bank becomes insolvent.
Under the no-rescue benchmark scenario, a bank receives no policy intervention after being hit by a shock. Losses are fully absorbed by the bank’s own capital. If the capital buffer is exhausted, the shock may then be transmitted to other banks through interbank creditor–debtor relationships. This scenario characterizes the natural diffusion of risk and provides a benchmark for evaluating the effectiveness of rescue policies.
The initial shock loss is defined as follows:
  S i   = max s · F A i ,   λ E i 0
  A i 0 + = A i 0 S i ,   E i 0 + = E i 0 S i
In Equations (9) and (10), S i denotes the initial shock loss of bank i. The parameter s denotes external asset shock intensity; F A i denotes the external assets of bank i exposed to price shocks. The parameter λ denotes the equity-capital shock multiplier, which captures the leverage amplification from asset-side losses to equity capital. E i 0 denotes the initial equity capital before the shock, while A i 0 + and E i 0 + denote total assets and equity capital immediately after the initial shock.
In the baseline stress scenario, this study sets s = 0.30 and λ = 1.20 . This setting ensures that the shock is sufficiently severe to trigger a problem-bank resolution scenario, but it does not mechanically assume an immediate collapse of the entire banking system. Economically, Equations (9) and (10) translate an asset-side disturbance into the first-round capital impairment that initiates the contagion process.

3.3.2. EN Direct Default Contagion Channel

If a bank’s equity capital falls below the going-concern threshold after the shock, the bank enters default and transmits losses to other banks through interbank creditor–debtor relationships. This study determines default status by comparing equity capital with the threshold:
  D r = i | E i r   <   δ d , i , 0
In Equation (11), δ d , i , 0 denotes the going-concern threshold of bank i. The baseline setting is δ d , i , 0 = 0 , meaning that a bank is classified as unable to continue as a going concern when its equity capital becomes negative. D r denotes the set of banks identified as defaulted in contagion round r. E i r denotes the equity capital of bank i in round r; and r denotes the contagion round. This rule converts post-shock capital impairment into a default indicator used in the next contagion round.
  ρ i r = min A i r L i r ,   1
L o s s j , E N r = i D r 1 1 ρ i r x i j
Equation (12) and (13) define the endogenous creditor recovery rate in the baseline model. When a defaulted bank’s assets are sufficient to cover liabilities, creditor banks recover in full; otherwise, losses are determined by the asset–liability shortfall. For robustness, the creditor recovery rate is also set exogenously at 30%, 50%, and 70%. In the notation, ρ i r denotes the creditor recovery rate of bank i in round r; A r i and L r i denote total assets and total liabilities of bank i in round r; L o s s j , E N r denotes the loss imposed on bank j through the EN direct-default channel in round r; D r 1 denotes the set of banks that defaulted in the previous round; and x i j denotes bank i’s interbank claim exposure to defaulted bank j. Economically, the EN channel converts a debtor bank’s default into credit losses for its creditor banks.

3.3.3. GLT Asset Fire-Sale Contagion Channel

In addition to direct default losses, banks with impaired capital may be forced to sell assets, generating common asset price declines. This study expresses this channel as a function of fire-sale pressure and each bank’s external asset exposure:
ψ r   =   i D r 1 F A i i F A i
  L o s s j , G L T r = θ · ψ r · F A j
In Equations (14) and (15), ψ r denotes the asset fire-sale pressure generated by defaulted banks in round r, and θ denotes the fire-sale markdown rate. This study sets θ to 5%, 10%, 15%, and 20% in the sensitivity analysis. D r 1 denotes the set of banks that defaulted in the previous round; F A i and F A j denote the external asset exposures of banks i and j; and L o s s j , G L T r denotes the valuation loss imposed on bank j through the GLT asset fire-sale channel in round r. Economically, this channel captures the loss imposed on otherwise connected banks when distressed selling depresses common asset prices.

3.3.4. Recursive Propagation Process and Stopping Rule

The model proceeds recursively by contagion rounds. In each round, newly defaulted banks are first identified. The EN direct default loss and the GLT asset fire-sale loss are then calculated separately, and each bank’s equity capital is updated accordingly. If new defaulted banks emerge after the update, the model proceeds to the next contagion round. If no new defaulted banks emerge, or if the maximum number of iterations is reached, the contagion process stops. The maximum number of iterations is set to 30 to avoid infinite recursion in extreme cases.
L o s s j r = L o s s j , E N r + L o s s j , G L T r
  E j r + 1 = E j r L o s s j r + R j , i n r + R j , e x r
In Equations (16) to (17), L o s s j r denotes the total contagion loss of bank j in round r; L o s s j , E N r and L o s s j , G L T r denote losses from the direct-default channel and the asset fire-sale channel; E j r and E j r + 1 denote equity capital before and after the update; and R j , i n r and R j , e x r denote the internal rescue amount and external rescue amount in round r. These equations show how each round’s losses and rescue resources are translated into next-round equity capital.

3.4. Dynamic Internal–External Rescue Mechanism and Optimization Procedure

3.4.1. Rescue Mechanisms and Capacity Constraints

Under the rescue scenarios, this study introduces two types of mechanisms: internal rescue and external rescue. Internal rescue mainly corresponds to debt-to-equity conversion, shareholder loss sharing, and write-downs of capital instruments, in which losses are borne by internal stakeholders of the bank. This treatment is consistent with bail-in, debt write-down, and liability conversion mechanisms in crisis resolution [8,31,46]. External rescue mainly corresponds to public-sector support tools such as government capital injection, liquidity guarantees, and deposit insurance support, which are commonly used for bank recapitalization, crisis liquidity provision, and the stabilization of depositor expectations [5,7,32].
The following equations divide the shortfall between internal loss absorption and external support:
G i = max 0 , E i
R i i n = min α G i , η I B L i
R i e x = min G i R i i n , κ L i
In Equations (18)–(20), G i is bank i’s capital shortfall; E i is equity capital before rescue; and R i i n and R i e x are the internal and external rescue amounts. The symbol α is the share of the shortfall assigned to internal rescue. I B L i is the portion of debt or interbank liabilities that can participate in internal rescue; and L i is total liabilities. The parameters η and κ are capacity ceilings: η limits internal loss absorption and is set to 30%, while κ limits external support and is set to 10% of total liabilities in the baseline scenario. When α   =   1 , rescue is purely internal; when α   =   0 , rescue is purely external; and when 0   <   α   <   1 , rescue is mixed. If the two resources cannot cover the shortfall, the bank remains in default and continues to transmit risk through the EN and GLT channels.

3.4.2. Objective Function for Optimal Rescue

The optimal rescue strategy in this study does not simply minimize risk. Instead, it evaluates rescue effectiveness through a joint trade-off among systemic risk, rescue cost, and moral hazard. The composite objective below is designed to identify a strategy that is feasible for financial stability and incentive compatibility, not merely the strategy with the lowest mechanical loss.
  m i n α   P o l i c y I n d e x α = w 1 N o r m A R + w 2 N o r m P D + w 3 N o r m C e x + w 4 N o r m C i n + w 5 N o r m M H
In Equation (21), P o l i c y I n d e x ( α ) denotes the composite policy index under a given internal rescue share α; w 1 to w 5 are the weights assigned to the evaluation dimensions; and N o r m ( . ) is the normalization operator. A R , P D , C e x , C i n , and M H denote the contagion loss ratio, default probability, external rescue cost, internal rescue cost, and moral-hazard proxy, respectively. To make indicators comparable, all variables are standardized. In the baseline setting, A R , P D , C e x , and C i n receive weights of 1, while M H receives a weight of 0.5. The index therefore formalizes the policy trade-off among stability, fiscal and internal costs, and incentive constraints.
  P D α   P D _ ,   R i i n     η I B L i ,   R i e x     κ L i ,   0 α 1
In Equation (22), P D ( α ) denotes the default probability under rescue share α , and P D _ denotes the risk-tolerance threshold. The threshold is set to 5%, so a strategy enters the candidate set only if its average default probability does not exceed 5%. This prudential filter excludes rescue strategies that leave excessive default diffusion. R i i n and R i e x denote the internal and external rescue amounts of bank i. I B L i and L i denote internally absorbable debt and total liabilities; and η ,   κ and α are defined as above. Among strategies satisfying both the risk-tolerance and capacity constraints, the strategy with the lowest composite policy index is identified as optimal.
Systemic risk reduction is defined relative to the no-rescue benchmark. A R captures the intensity of capital losses, P D captures the breadth of default diffusion, and the average number of defaulted banks captures the scale of default propagation. Rescue cost is measured through external rescue cost C e x and internal rescue cost C i n . Moral-hazard control is captured by M H , which rises with reliance on external public support. P o l i c y   I n d e x is therefore not a single risk indicator, but a composite evaluation measure that integrates systemic risk, rescue cost, and incentive compatibility.

3.4.3. Computational Procedure for the Optimal Internal Rescue Share

Computationally, this study uses a grid-search procedure to identify the optimal internal rescue share. For each year, parameter setting, and initially shocked bank, the simulation evaluates the no-rescue benchmark, pure external rescue, pure internal rescue, and mixed rescue strategies with internal rescue shares from 5% to 95%. The results are averaged across all initial shock scenarios in the same year. The feasible strategy with the lowest Policy Index is then selected as the annual optimal rescue mix.
  α = arg m i n α A P o l i c y I n d e x α ,   A = 0 , 0.05 , 0.10 , , 1.00
In Equation (23), α* denotes the optimal internal rescue share; A denotes the candidate set of rescue shares; and arg m i n α A indicates the rescue share in the candidate set that minimizes P o l i c y I n d e x α .

3.5. Parameter Setting, Shock Generation, and Sensitivity Analysis

3.5.1. Rationale for Key Parameter Settings

To improve the transparency of the simulation results, this study clarifies the economic meaning, baseline setting, and robustness range of the key parameters. These parameter settings are not intended to replicate a single rescue case precisely. Instead, they are used to construct policy scenarios with stress-testing relevance and to examine whether the optimal rescue conclusions depend on specific parameter values. The key parameter settings and corresponding robustness checks are presented in Table 2.
The baseline parameters are designed to represent a severe but controlled stress-testing environment rather than point estimates from a single historical event. The initial shock intensity is set at 30% to ensure that the shocked bank enters a problem-bank resolution scenario while avoiding an unrealistically immediate collapse of the whole banking system. The equity-capital shock multiplier is set at 1.20 to reflect the leverage amplification effect of asset-side losses on bank capital. Together, these two parameters generate a non-trivial contagion environment in which the effectiveness of different rescue mechanisms can be meaningfully compared.
The internal rescue capacity ceiling is set at 30% because internal loss absorption is constrained by the loss-bearing capacity of shareholders, creditors, and convertible liabilities. A very high bail-in capacity would implicitly assume that creditors can absorb losses without generating additional contagion, which is inconsistent with the interbank-network setting of this study. The external rescue capacity ceiling is set at 10% of total liabilities to reflect the fact that public support is fiscally constrained and cannot be treated as unlimited. This assumption also prevents the model from mechanically selecting external support simply because it is powerful enough to cover all capital shortfalls.
The weights in the Policy Index are chosen to reflect a balanced policy trade-off. The risk indicators and explicit rescue-cost indicators are assigned equal weights because both financial stability and resource consumption are central to problem-bank resolution. The moral-hazard proxy is assigned a weight of 0.5 because it captures an indirect incentive cost rather than an immediately observed balance-sheet loss. This weighting scheme prevents moral hazard from being ignored, while avoiding the over-penalization of external public support in cases where external stabilization is necessary to contain contagion.

3.5.2. Shock Generation Process and Number of Simulation Scenarios

The baseline simulation adopts an exhaustive bank-by-bank shock design. This design avoids instability caused by insufficient random sampling and allows direct comparison of risk spillover effects across bank types, years, and network positions. Specifically, in each year, every sample bank is treated sequentially as the initially shocked bank, and its contagion path is simulated under a given parameter combination. Therefore, each parameter combination covers all bank-year initial shock scenarios. After excluding foreign-funded banks, the sample contains 210 banks over 12 years from 2013 to 2024. Each parameter combination therefore corresponds to 210 × 12 = 2520 initial shock scenarios.

3.5.3. Sensitivity Analysis Design

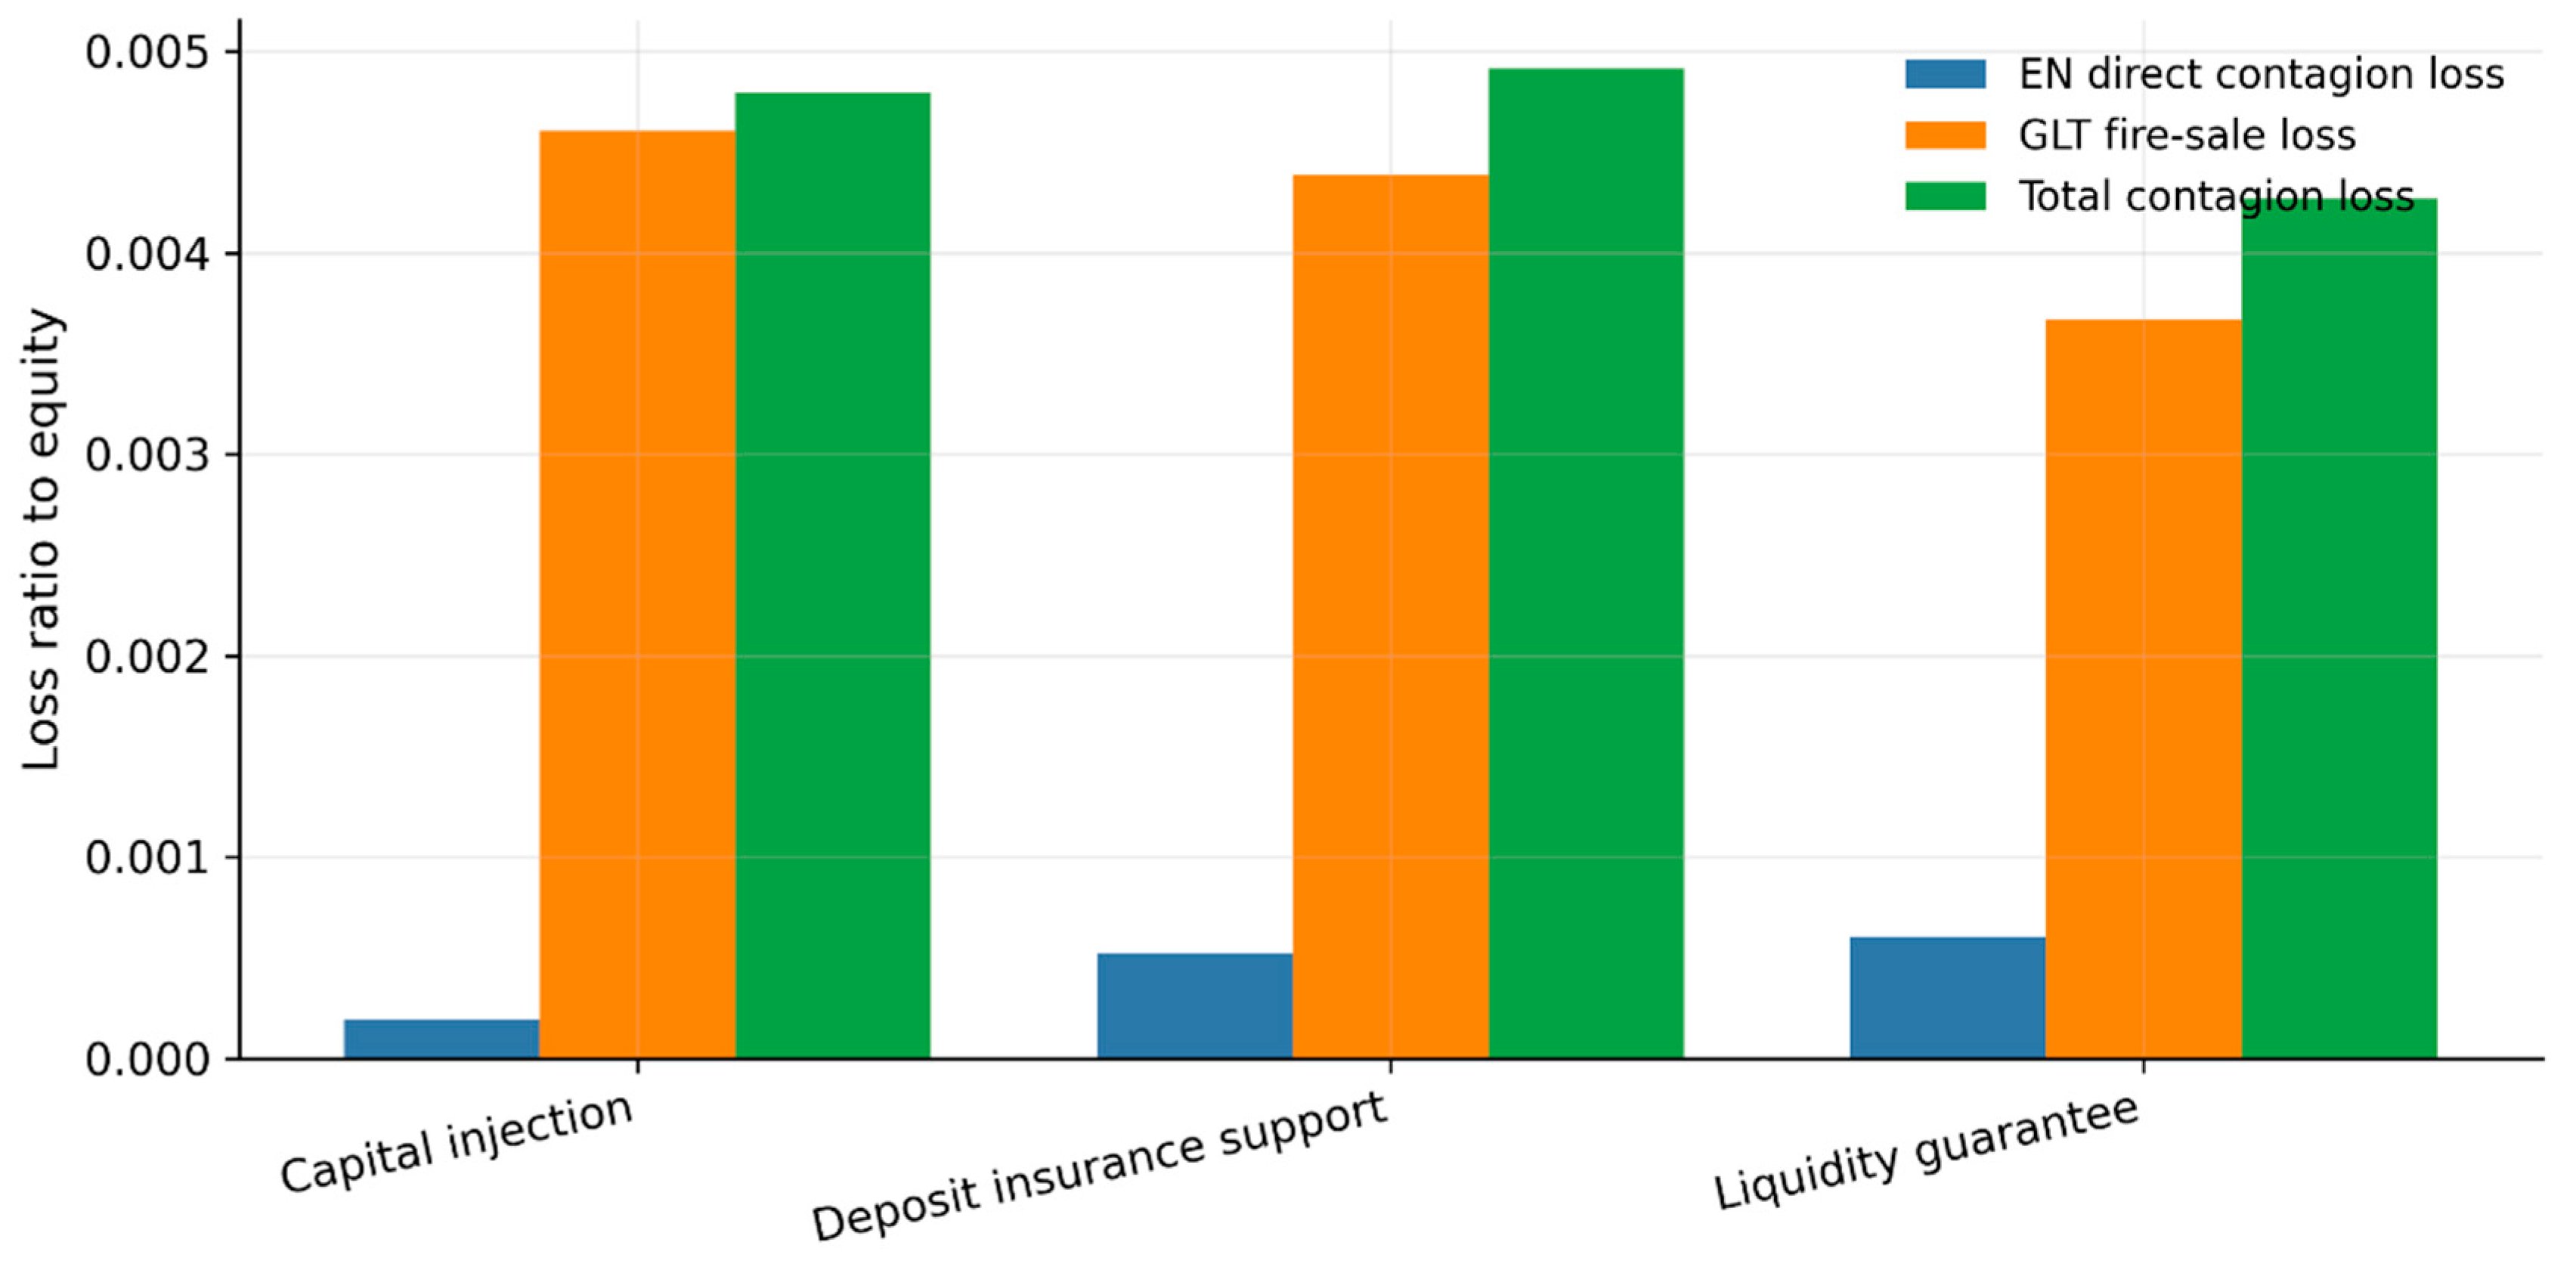
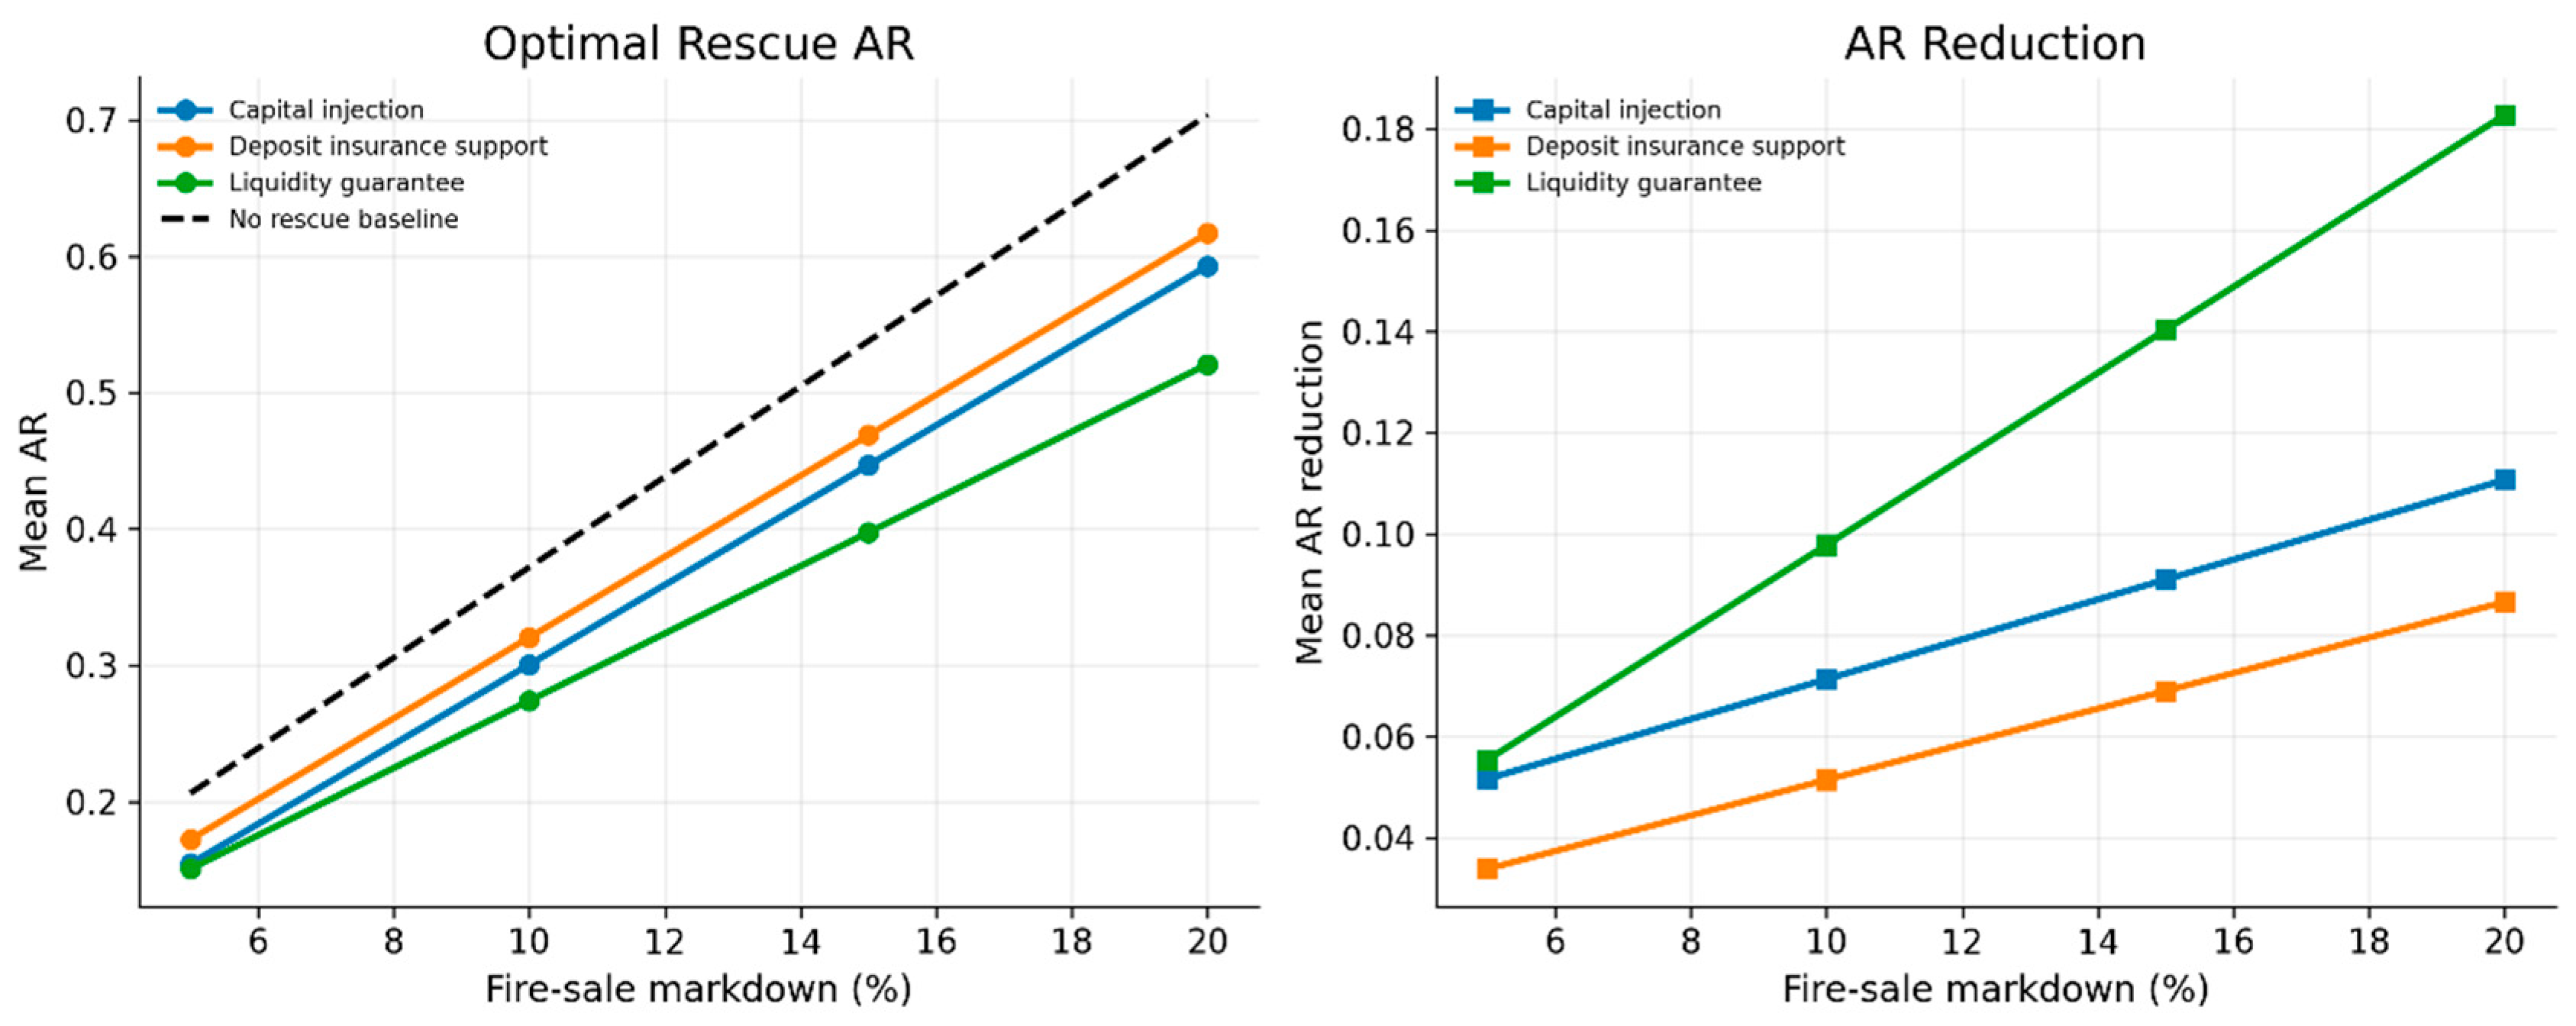
Because key parameters may affect the optimal rescue share, this study conducts sensitivity analyses from three perspectives: the fire-sale markdown rate [12,13], the creditor recovery rate [11,47,48], and the external rescue mechanism [5,7,8]. First, the fire-sale markdown rate θ is varied across 5%, 10%, 15%, and 20% to test whether changes in asset-sale price pressure alter the optimal rescue conclusions. Second, the creditor recovery rate ρ is set to 30%, 50%, and 70% to examine the influence of the EN direct default contagion channel. Third, the external rescue mechanism is extended to three scenarios—government capital injection, liquidity guarantee, and deposit insurance support—to compare A R , P D , rescue costs, and the optimal internal rescue share under different external support tools.
In each sensitivity analysis, the EN-GLT dual-channel contagion process is re-run, and the optimal internal rescue share is recalculated using the same objective function and constraints. This design allows the study to examine whether the conclusions on mixed rescue and optimal internal rescue intensity are robust to parameter changes.
For the extended analysis of external rescue mechanisms, the three instruments are incorporated through different parameter mappings within the same EN-GLT framework. Capital injection is modeled as direct replenishment of the distressed bank’s equity capital. It primarily reduces the EN direct-default channel by narrowing the capital shortfall, but it is associated with a relatively higher explicit fiscal cost and moral-hazard proxy.
Liquidity guarantee is modeled as a mechanism that relaxes fire-sale pressure and reduces forced asset liquidation. Therefore, it mainly affects the GLT channel by lowering fire-sale losses and asset-price spillovers. Compared with direct capital injection, liquidity guarantee is assumed to involve a lower immediate fiscal cost, because it provides contingent liquidity support rather than outright capital transfer.
Deposit insurance support is modeled as a liability-side stabilization tool. It reduces run-related pressure and depositor confidence shocks, thereby weakening default amplification through the liability side. Its direct effect on asset fire-sale losses is weaker than that of liquidity guarantee. The explicit cost and moral-hazard proxy are therefore set between capital injection and liquidity guarantee, reflecting the fact that deposit insurance can stabilize expectations but may also weaken depositor monitoring incentives.

3.6. Risk Evaluation and Network Indicators

This study evaluates risk contagion using three indicators: the absorbing rate ( A R ), the probability of default ( P D ), and the average number of defaulted banks. A R measures the system-wide capital loss generated by contagion. P D measures the breadth of default diffusion across banks. The average number of defaulted banks captures the scale of failures triggered by one initial shock.
A R = i ( E i 0 E i ) i E i 0
  P D = D N
In Equations (24) and (25), the summation over i denotes aggregation across all sample banks; E i 0 denotes the initial equity capital of bank i; E i denotes the equity capital of bank i at the steady state. D denotes the number of defaulted banks at the steady state; and N denotes the number of sample banks. A R can be read as the system-wide equity-loss ratio, while P D is the fraction of banks that ultimately default. Reading the two together separates loss intensity from default breadth.

4. Empirical Results

This section addresses four questions. First, does risk contagion arise in the reconstructed interbank network? Second, do rescue mechanisms reduce systemic losses? Third, which internal–external rescue mix performs best? Fourth, are the conclusions robust across parameters, bank types, and external rescue instruments? The empirical analysis proceeds from sample description and network construction to benchmark contagion, policy evaluation, robustness tests, and heterogeneity analysis.
For consistency across the empirical tables, AR and PD are interpreted as system-level ratios, cost indicators are scaled by equity, and entries such as internal rescue shares, recovery rates, reduction rates, and markdown rates are treated as percentages. This convention keeps indicator names and numerical interpretations comparable across the baseline analysis, robustness tests, and heterogeneity analysis.

4.1. Sample Selection and Descriptive Statistics

This study uses panel data for Chinese commercial banks from 2013 to 2024 for the empirical analysis. The data are obtained from the Wind database. The sample is processed as follows. First, observations with missing values for key variables are excluded to ensure the completeness of the empirical analysis. Second, foreign-funded banks are removed so that the sample banks are more consistent with the institutional environment of problem-bank resolution and regional risk contagion in China. The final sample consists of 210 commercial banks, including 90 city commercial banks, 103 rural commercial banks, 11 joint-stock commercial banks, and 6 large state-owned commercial banks.
The descriptive statistics are reported in Table 3. The sample banks exhibit substantial differences in asset size and capital strength. The mean value of total assets is RMB 1065.63 billion, while the median is RMB 123.38 billion. The fact that the mean is significantly higher than the median indicates a right-skewed distribution of bank asset size, suggesting that a small number of large banks exert a strong upward effect on the sample average. The mean value of equity capital is RMB 81.94 billion, with a median of RMB 9.25 billion, which also reflects considerable differences in capital strength across different types of banks. The mean capital adequacy ratio is 13.62%, which is generally above the minimum regulatory requirement. This indicates that the sample banks, on average, possess a certain degree of capital buffer. However, the capacity to absorb shocks remains heterogeneous at the individual-bank level. These results suggest that assessing banking-system stability solely on the basis of average indicators may obscure two important realities: insufficient capital buffers among some small and medium-sized banks and the disproportionately large weight of major banks in the system. It is therefore necessary to further examine the systemic impact of individual bank shocks within an interbank network framework.
From the perspective of interbank business exposure, the mean value of interbank assets is RMB 68.50 billion, while the mean value of interbank liabilities is RMB 127.62 billion. The larger scale of interbank liabilities relative to interbank assets indicates that some banks perform a stronger funding-absorbing function in the interbank market. This also implies that interbank creditor–debtor relationships are not symmetrically distributed. This feature has direct implications for risk contagion. When a problem bank suffers capital losses or liquidity pressure, risk may be transmitted not only through creditor losses caused by debt write-downs, but also through asset fire sales and price declines that affect banks holding similar assets. Therefore, Table 3 not only presents the basic statistical characteristics of the sample banks, but also provides an empirical foundation for constructing the bilateral risk exposure matrix, identifying network contagion channels, and evaluating the effects of rescue policies in the subsequent analysis.

4.2. Network Construction Results and Topological Characteristics

This study further constructs the interbank risk contagion network. The traditional minimum-density method can effectively estimate the interbank exposure matrix when actual bilateral exposure data are unavailable. However, this approach ignores banks’ business scope and regional attributes, and may therefore generate cross-regional linkage paths that are inconsistent with real economic logic. To correct this potential bias, this study introduces regional constraints into the traditional minimum-density framework. Specifically, small and medium-sized banks are assumed to establish interbank linkages primarily with banks in the same province and with national banks, while cross-provincial linkages among non-national banks are restricted. This setting is more consistent with the institutional reality that the business activities of small and medium-sized banks in China are mainly concentrated within local and provincial markets, as indicated in the People’s Bank of China’s China Financial Stability Report [49].
Specifically, based on banks’ interbank assets and interbank liabilities, this study constructs the annual bilateral risk exposure matrix through the following steps. First, each bank’s interbank assets are used as the row constraints of the matrix, while interbank liabilities are used as the column constraints. Second, the liability side is proportionally adjusted to ensure consistency between total interbank assets and total interbank liabilities within the system. Third, a feasible linkage set is defined according to each bank’s province and type, so that local small and medium-sized banks mainly establish connections with banks in the same province and with national banks. Fourth, the Iterative Proportional Fitting method is applied to iteratively adjust the matrix so that it simultaneously satisfies both row and column constraints, following Fienberg [50]. The resulting risk exposure matrix not only preserves the operational advantage of the minimum-density method under conditions of missing bilateral transaction data, but also incorporates spatial constraints that are consistent with real business boundaries. It therefore better reflects the actual structure of interbank risk linkages.
The core assumption underlying this construction method is that national banks possess cross-regional operating capacity and can therefore form interbank linkages with banks in different regions. By contrast, the business activities of local small and medium-sized banks depend heavily on provincial markets, and their interbank linkages are mainly concentrated among banks within the same province and national banks. Compared with the unconstrained traditional minimum-density method, the introduction of regional constraints can effectively reduce cross-provincial connections among small and medium-sized banks that rarely occur in practice. This reduces contagion-path bias caused by the network construction method itself and ensures that the subsequent risk contagion analysis is based on a more realistic network structure.
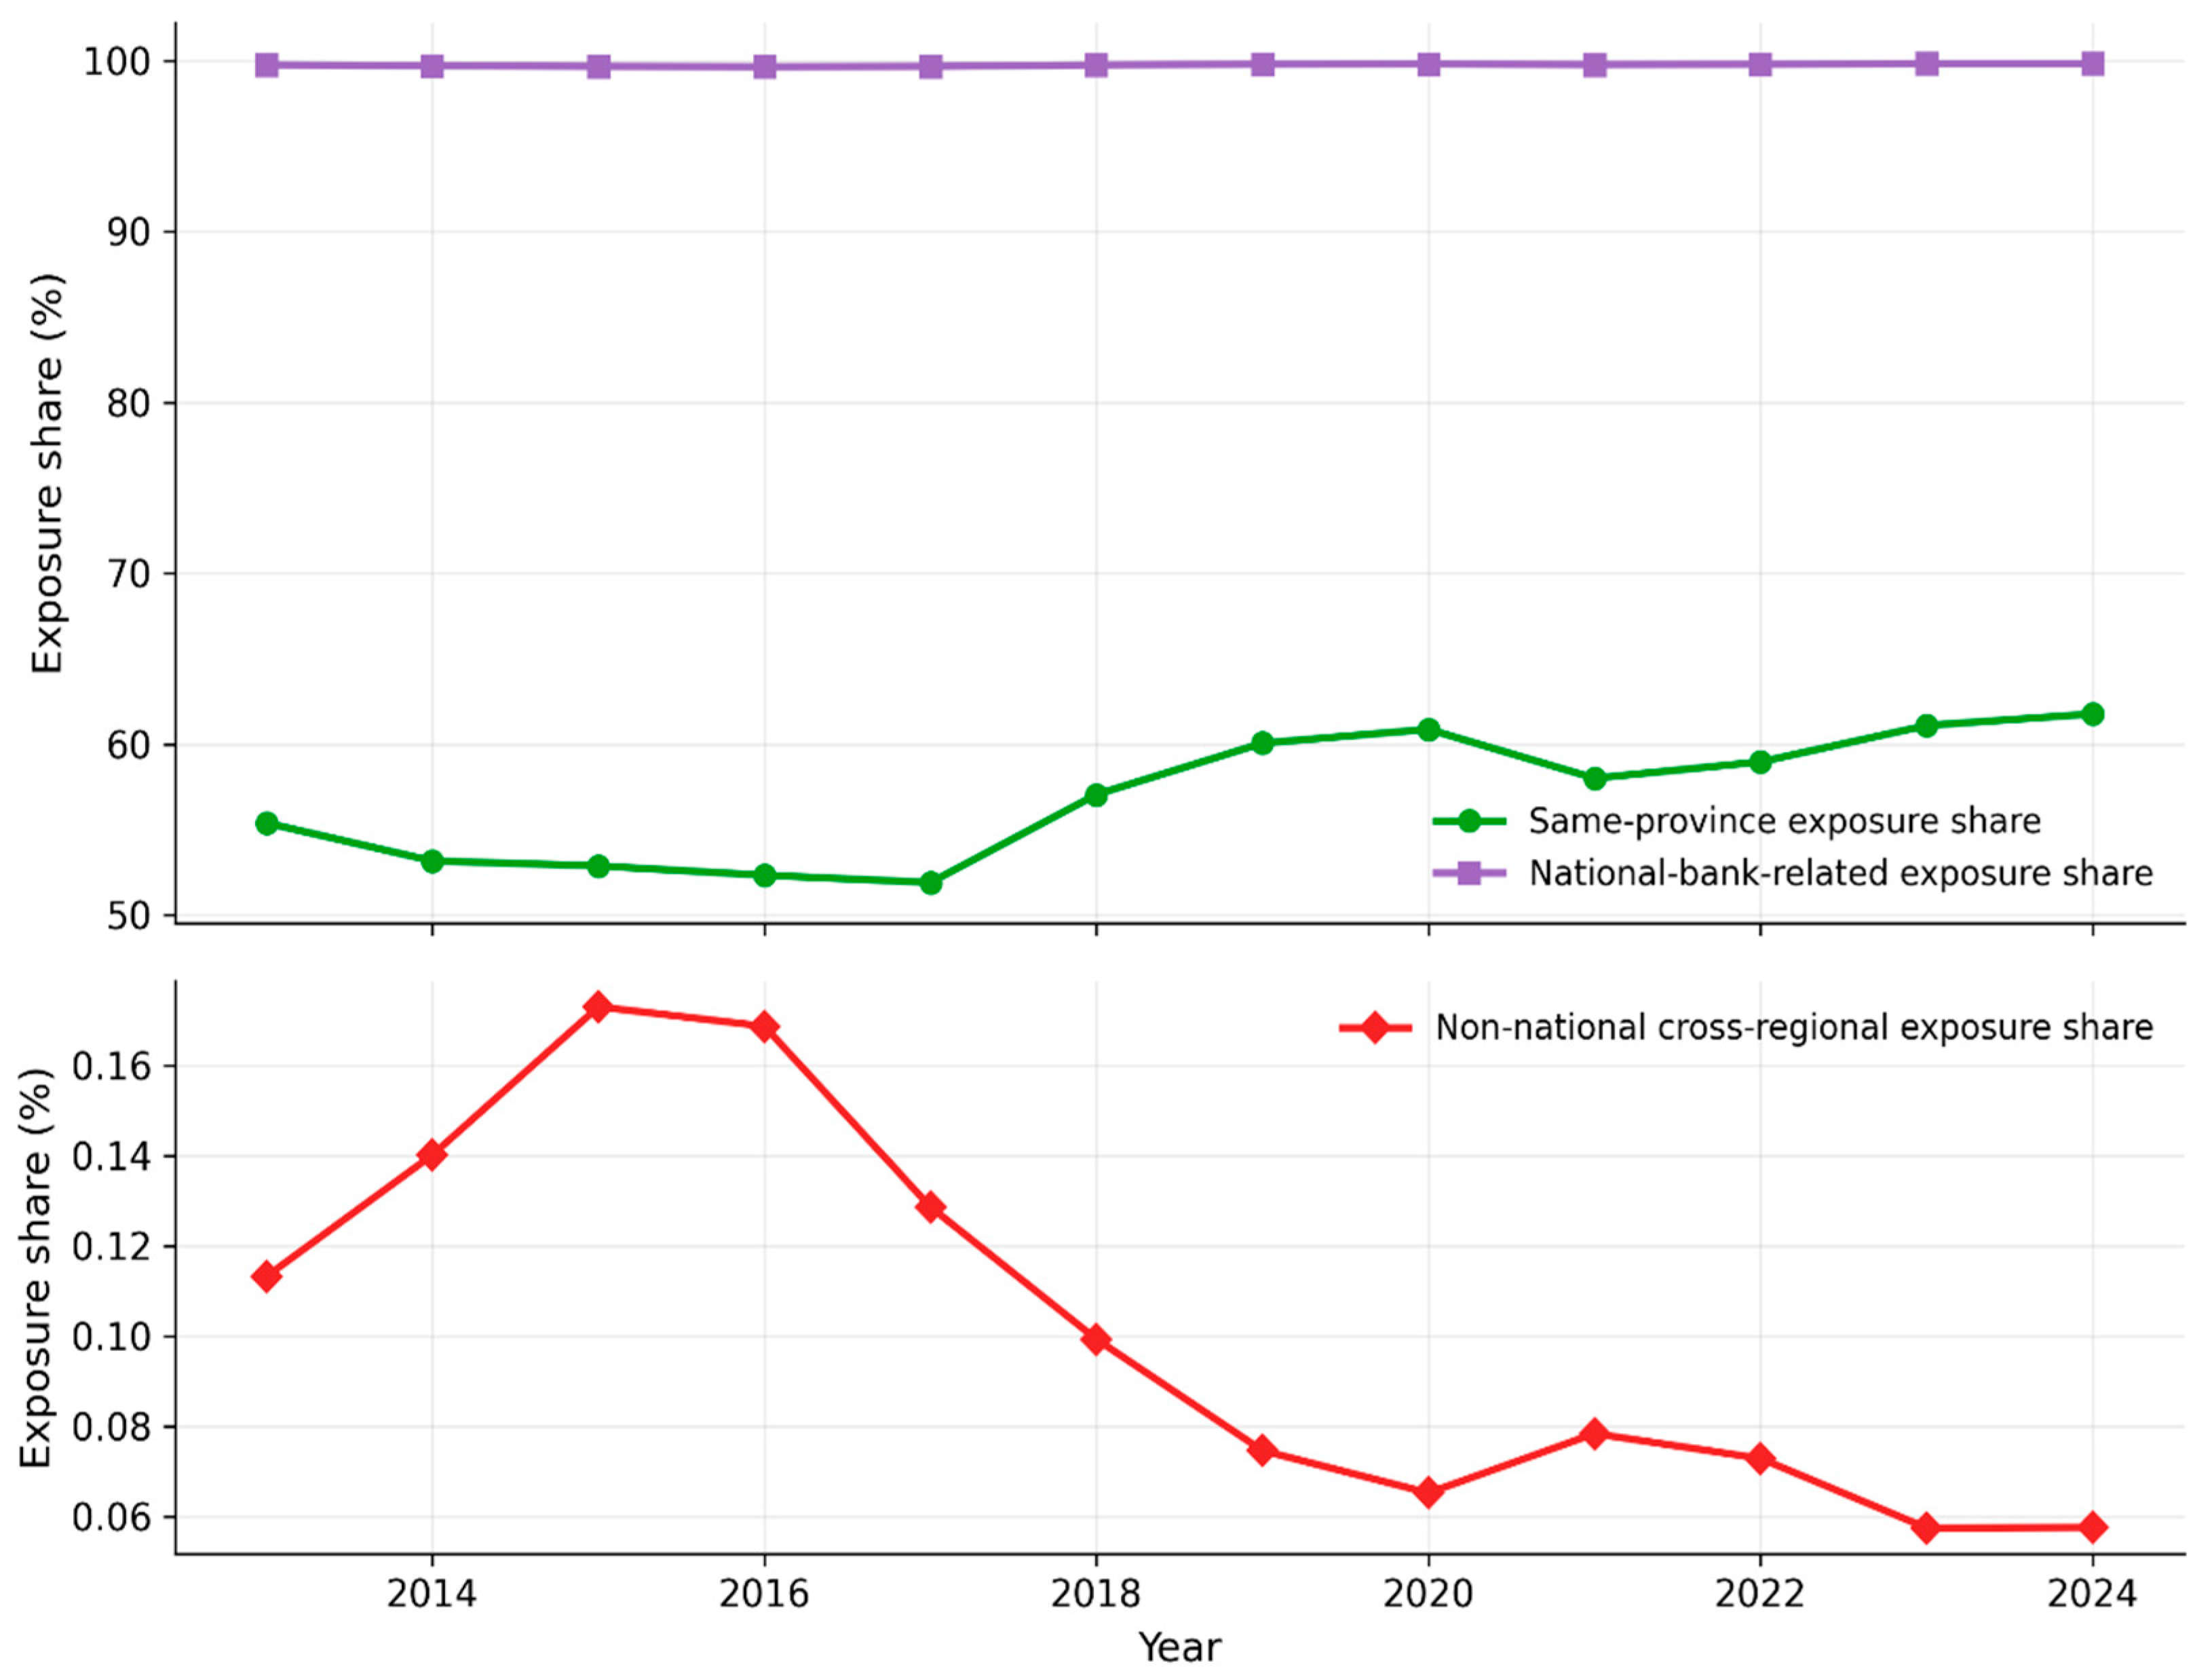
Table 4 reports the core characteristics of the region-constrained minimum-density network. During the sample period, the average number of positive-weight edges is 10,737, and the mean network density is 0.2446. This indicates that the constructed interbank network remains moderately sparse and does not degenerate into a fully connected network. Such moderate sparsity is crucial for the simulation analysis in this study. If the network is excessively dense, risk contagion may be overestimated; if the network is overly sparse, interbank risk linkages may be underestimated. These results suggest that the region-constrained minimum-density method preserves a reasonable level of network connectivity while satisfying the marginal constraints.
In terms of the exposure structure, the mean share of within-province exposure is 56.96%, rising from approximately 55.40% in 2013 to approximately 61.78% in 2024. This indicates that the provincial concentration of interbank linkages among local banks becomes more pronounced in the later part of the sample period. Meanwhile, the share of national-bank-related exposure remains relatively high, suggesting that national banks play a hub role in cross-regional interbank linkages, whereas the risk connections of local small and medium-sized banks are more concentrated within local and provincial markets. The average share of non-national cross-regional exposure is only about 0.10%, with a maximum of merely about 0.17%. This indicates that the model does not artificially generate a large number of cross-provincial linkages among small and medium-sized banks, thereby mitigating, to some extent, the problem of “spurious cross-regional contagion paths” that may arise under the standard minimum-density method.
Furthermore, the share of national-bank-related exposure remains broadly within the range of 99.65% to 99.83%, indicating that large national banks perform the primary hub function in the network. This is consistent with the institutional reality that large banks in China operate across regions and have broader interbank business coverage. It also implies that subsequent risk contagion does not simply spread among local banks, but is also influenced, to a certain extent, by the hub linkages formed by national banks.
With respect to matrix balancing, since the total amount of original interbank liabilities is generally higher than that of interbank assets, this study proportionally adjusts the liability side using the liability scaling factor. The mean value of this adjustment factor is approximately 0.558. After the adjustment, matrix total exposure is exactly consistent with total interbank assets, indicating that the matrix-balancing procedure is effective. Therefore, the subsequent risk contagion simulations are conducted on a network basis in which the asset side and liability side are internally consistent.
Overall, all annual matrices successfully converge, and the dense-matrix fallback mechanism is not triggered. This suggests that the region-constrained minimum-density method can maintain a stable network structure while satisfying both asset-side and liability-side marginal constraints. These results indicate that the interbank network constructed in this study is not only numerically feasible, but also captures key real-world features of China’s banking system, including the limited business scope of local banks, relatively weak cross-regional linkages among them, and the cross-regional hub function of national banks. The constructed network therefore provides a more robust foundation for the subsequent risk contagion simulations.
Figure 1 further illustrates the annual changes in network density, regional exposure structure, and matrix-matching quality. The results show that network density remains relatively stable over the period from 2013 to 2024, indicating that the introduction of regional constraints does not undermine the stability of matrix estimation. The share of within-province exposure exhibits an overall upward trend, suggesting that the provincial concentration of local banks’ interbank linkages becomes more pronounced in the later stage of the sample period. In addition, the row and column errors of the matrix remain close to zero throughout the sample period, further confirming the numerical reliability of the network construction procedure.
Consistent with the summary statistics reported in Table 4, Figure 1 indicates that the constructed interbank network does not exhibit abnormal fluctuations over time and can therefore serve as a stable basis for the subsequent dynamic simulations. On this basis, it remains necessary to further examine whether the network possesses the topological characteristics required to support risk diffusion.
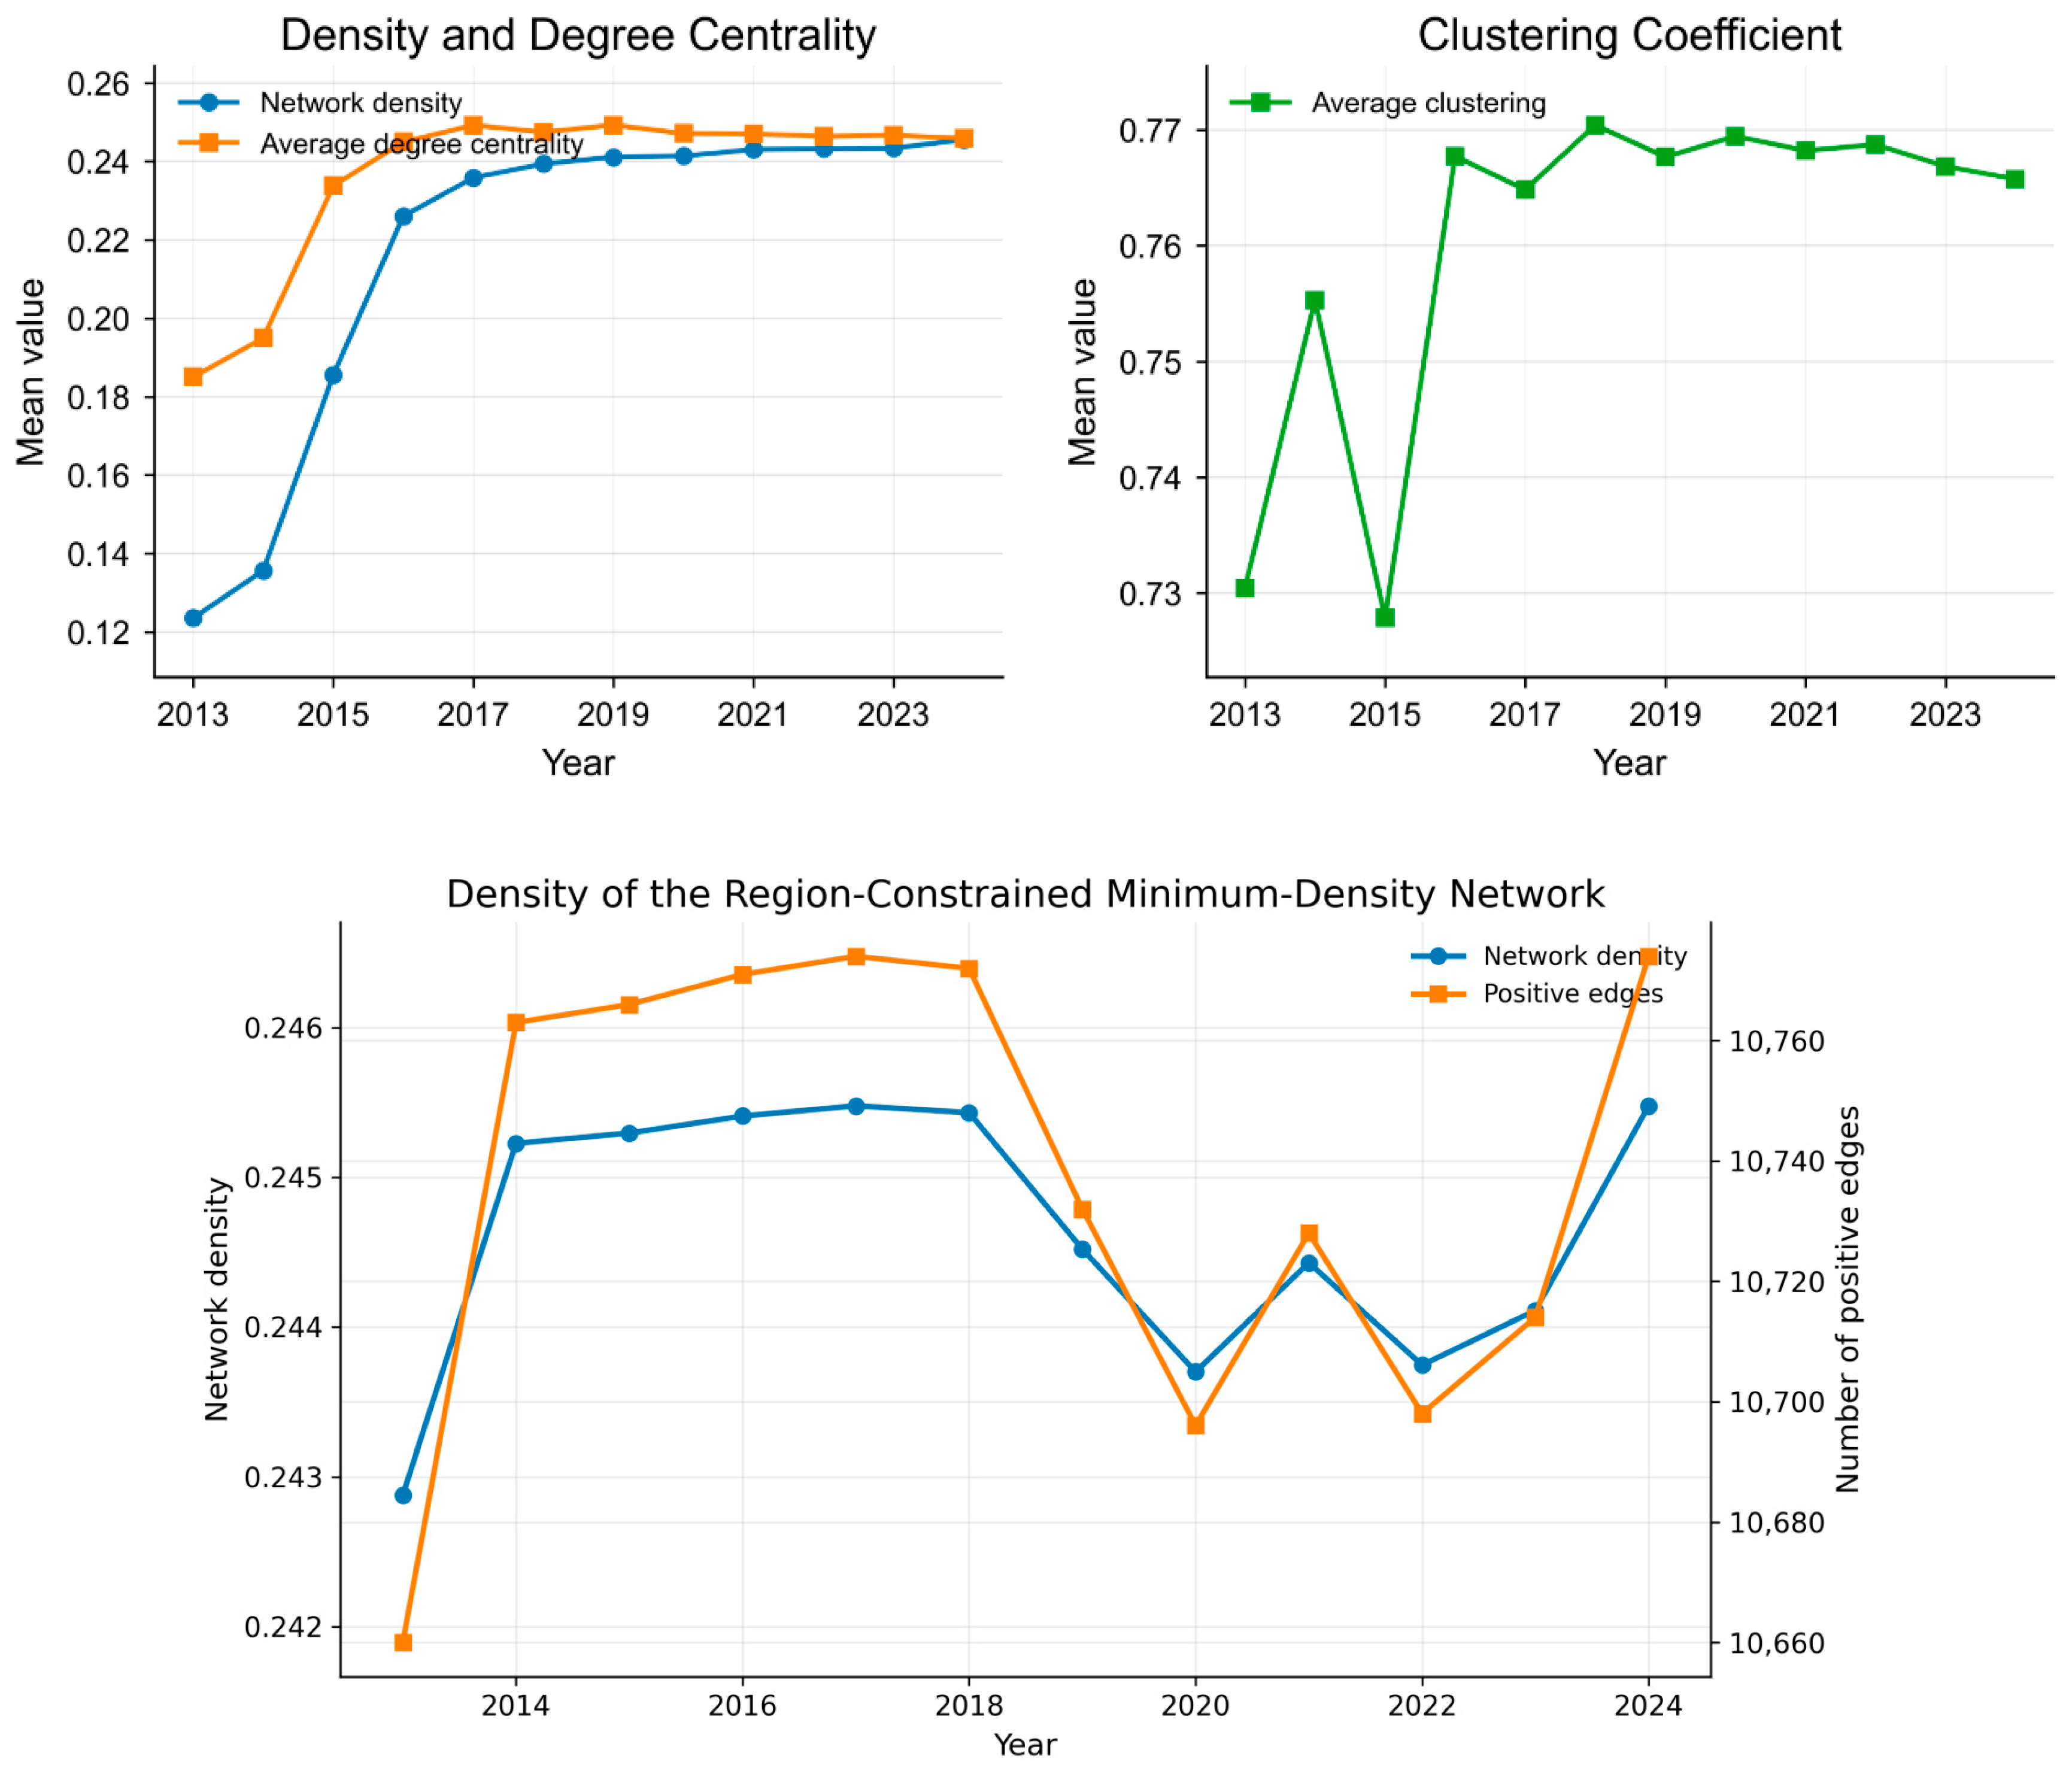
Figure 2 further characterizes the topological features of the region-constrained minimum-density network from the perspective of the contagion network. The left panel shows that contagion-network density and average degree centrality increase rapidly during 2013–2016 and then gradually stabilize. This suggests that potential risk-transmission linkages among banks strengthened in the early stage of the sample period, but did not continue to expand in a disorderly manner in the later stage. The right panel shows that the average clustering coefficient remains at a relatively high level overall, indicating that interbank linkages exhibit pronounced local clustering.
This result implies that risk contagion may diffuse not only through core linkages in the network, but also through clustered amplification within local banking groups. Therefore, before proceeding to the no-rescue scenario analysis, it is necessary to further verify the structural basis of the contagion network by examining annual topological indicators.
Table 5 presents the annual results for the topological indicators of the contagion network. Overall, contagion-network density, average degree centrality, and the number of positive contagion edges increase markedly in the early part of the sample period, indicating that the number of linkages capable of generating effective risk transmission within the interbank network has increased. In the later part of the sample period, these indicators tend to stabilize, suggesting that the network structure enters a relatively stable state. The average clustering coefficient remains at a high level over the long run, further indicating that risk exposure linkages are not randomly distributed, but instead exhibit certain local clustering characteristics. These topological results complement the preceding analysis of regional exposure structure. They show that the network constructed in this study not only satisfies marginal constraints and regional constraints, but also possesses the structural basis required for risk contagion simulations. Based on this, the next section uses the no-rescue scenario as the benchmark to examine the natural diffusion of risk within the network.

4.3. Benchmark Results of Risk Contagion Under the No-Rescue Scenario

Based on the region-constrained interbank network constructed in the previous section, this study first establishes a no-rescue scenario as the benchmark for risk contagion analysis, in order to examine whether interbank risk contagion exists and to identify its basic characteristics. Under the no-rescue scenario, the initially shocked bank does not receive any external intervention, such as government capital injection, liquidity guarantees, deposit insurance support, or debt-for-equity swaps. Losses are absorbed only through the bank’s own capital and interbank creditor–debtor relationships. This setting characterizes the natural diffusion process of risk in the absence of policy intervention, thereby providing a benchmark for evaluating the effectiveness of subsequent rescue policies.
In the simulation procedure, each sample bank is sequentially treated as the initially shocked bank in each year, and the results of all shocks are averaged at the annual level. This produces the average risk exposure of the banking system under the no-rescue scenario for each year. This treatment helps prevent the conclusions from being driven by a single initially shocked bank and enables the benchmark results to more comprehensively reflect the systemic impact of shocks to different banks.
With respect to risk contagion channels, the simulation incorporates two mechanisms. The first is the EN direct-default channel. When the equity capital of the shocked bank is insufficient to cover its losses, its default losses are transmitted to creditor banks according to the creditor recovery rate. The second is the GLT asset fire-sale channel. After a bank suffers capital impairment, it may be forced to sell assets, and the resulting asset-price discount further depresses the value of similar assets held by other banks, thereby generating price-mediated contagion. The simulation proceeds iteratively round by round until no new defaulted banks or additional contagion losses emerge. Accordingly, the three indicators—AR, PD, and the average number of defaulted banks—jointly characterize the level of systemic risk under the no-rescue scenario. The specific results are reported in Table 6 and Figure 3.
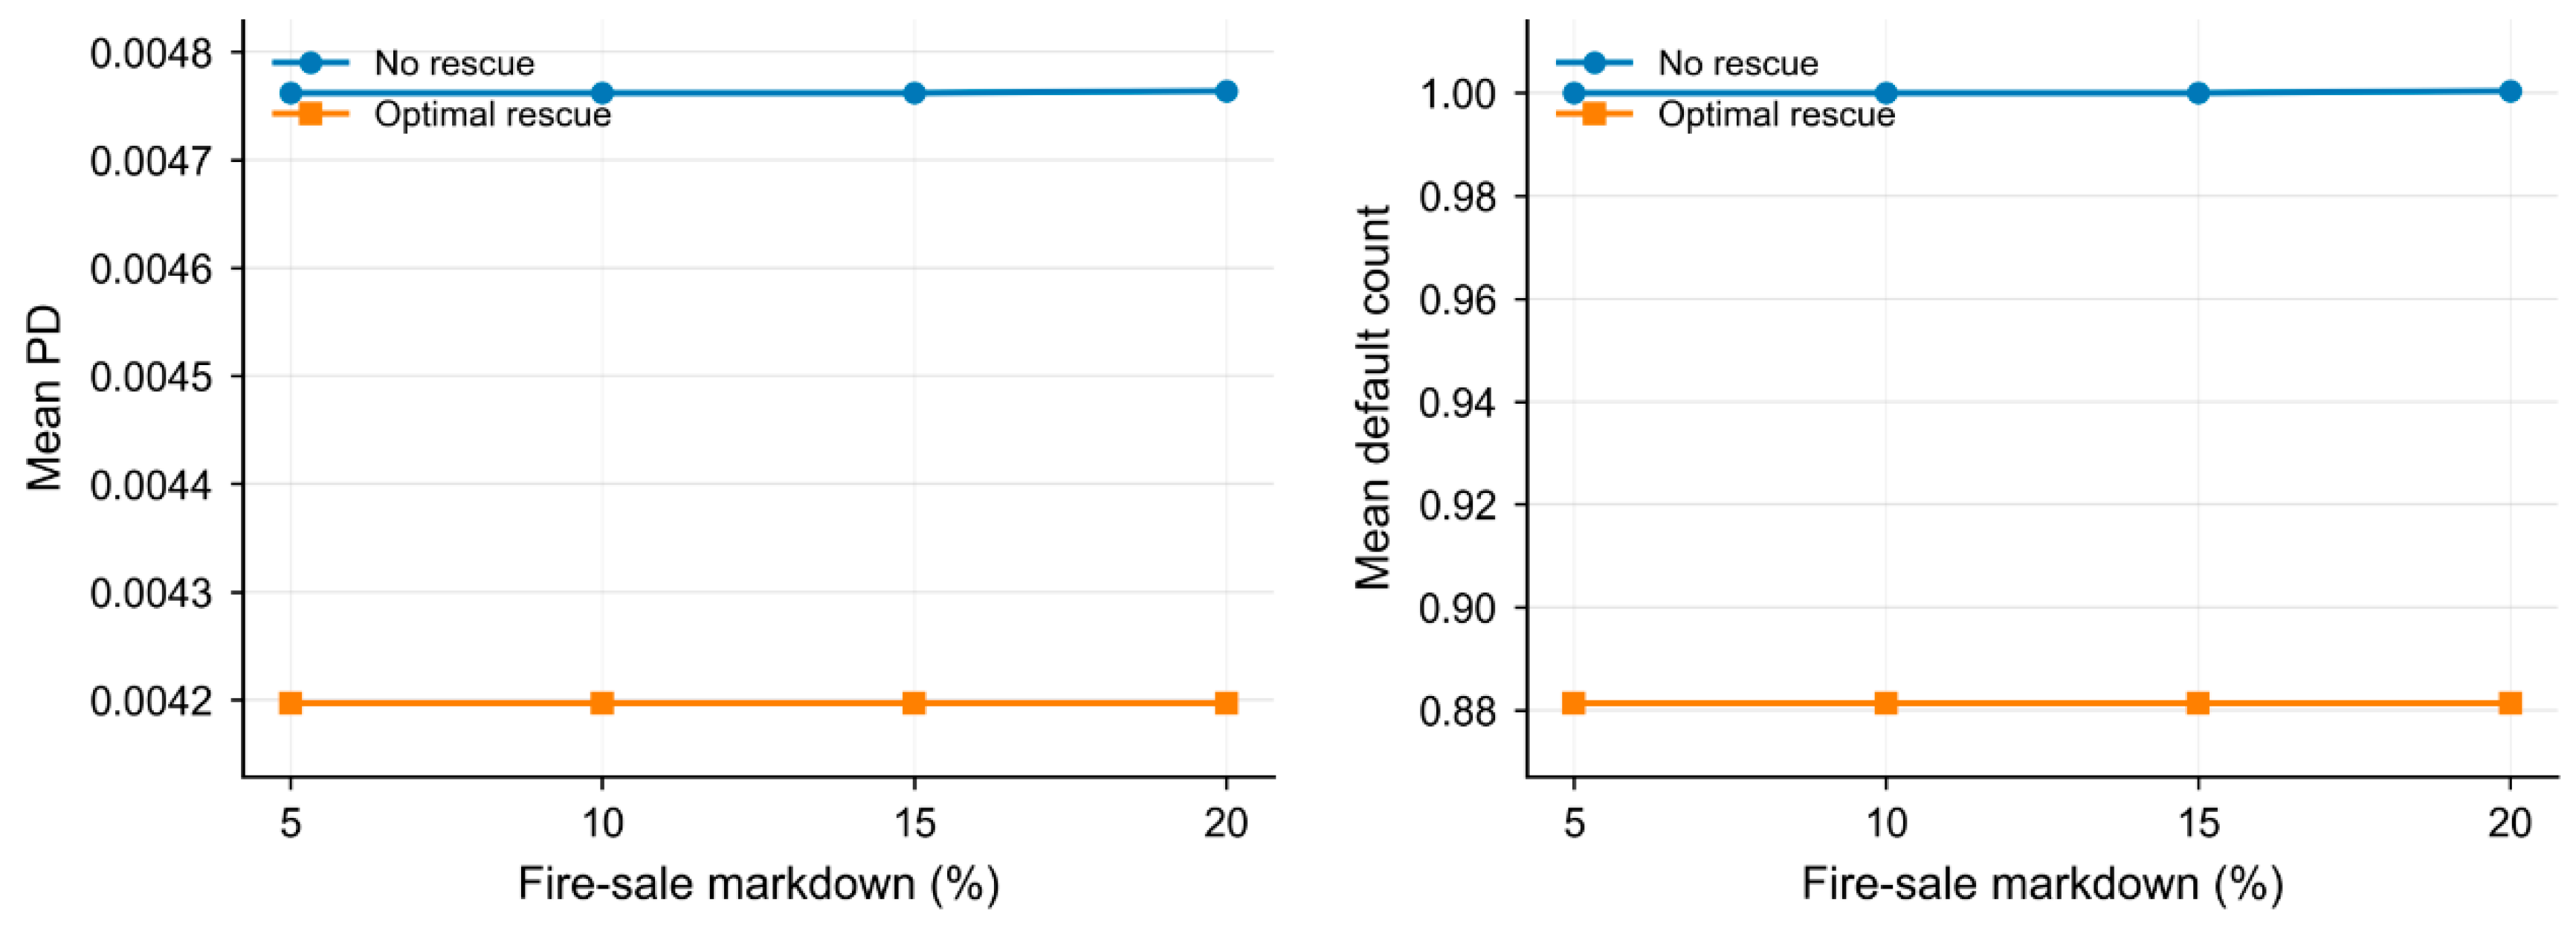
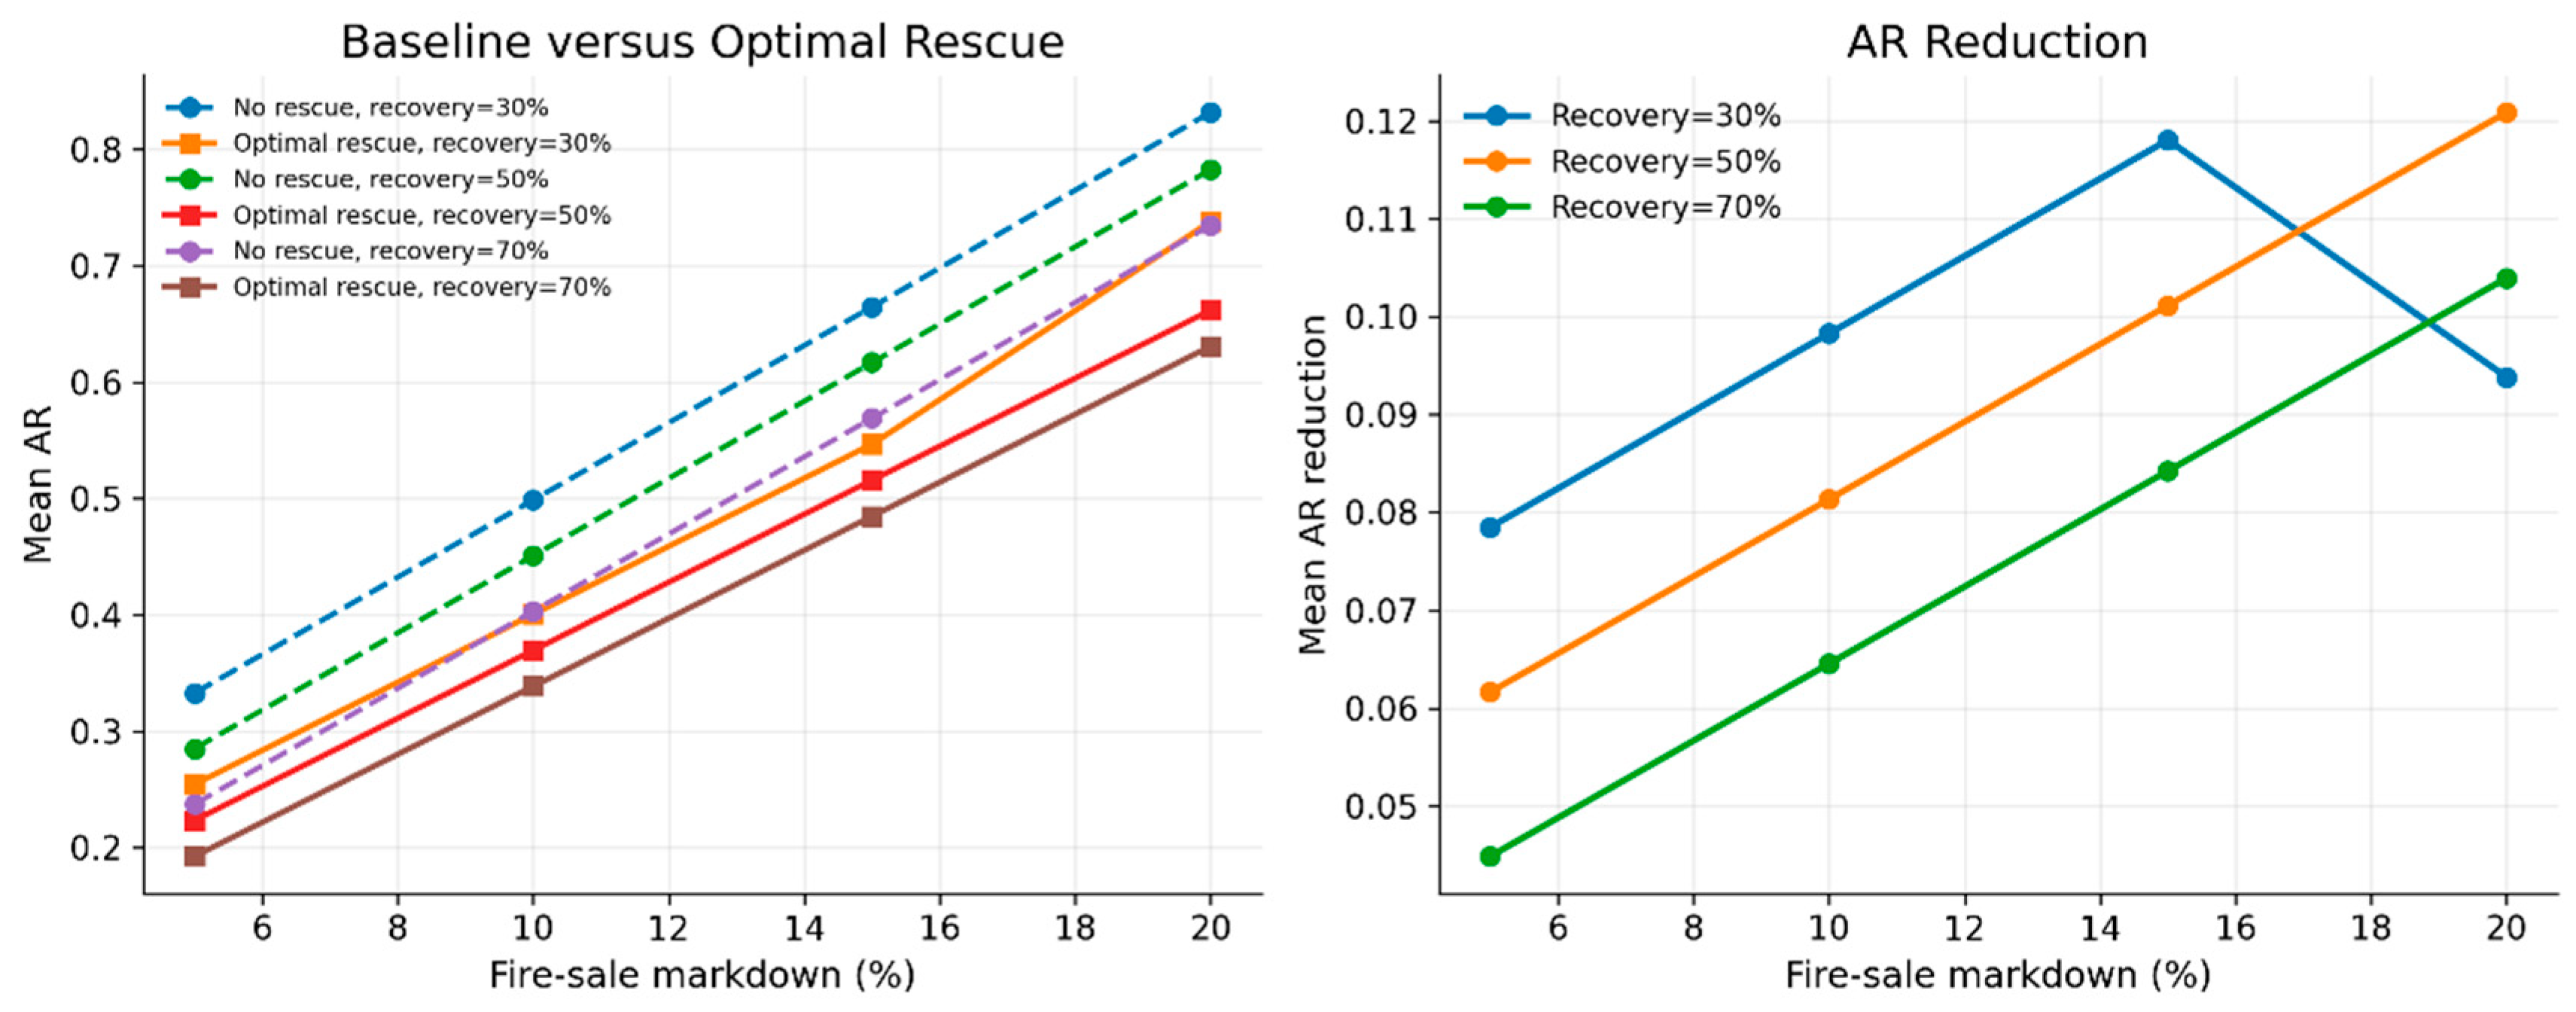
Figure 3 visually illustrates the difference between the no-rescue scenario and the optimal rescue scenario. As the fire-sale markdown rate increases, the slope of the no-rescue curve rises markedly, indicating that market price shocks can rapidly amplify risks within the banking system. The optimal-rescue curve remains consistently below the no-rescue curve, suggesting that the rescue mechanism is not only effective under low-stress conditions, but also continues to play a stabilizing role when the discount rate is relatively high.
More importantly, the gap between the two curves widens as the discount rate increases. This indicates that when asset-price pressure becomes stronger, the marginal risk-mitigation effect of rescue policies becomes more pronounced. These results show that risk contagion does exist under the no-rescue scenario and that its intensity increases with market stress.
As shown in Table 6, under the no-rescue scenario, AR increases substantially as the fire-sale markdown rate rises, from 0.2063 at the 5% discount rate to 0.7037 at the 20% discount rate. This indicates that the fire-sale discount is an important mechanism through which systemic risk is amplified. When asset-price shocks intensify, losses incurred by an individual bank are more likely to spread across the entire system through common asset holdings and price-decline mechanisms.
Compared with the no-rescue scenario, the optimal rescue strategy reduces AR under all discount-rate settings. Moreover, the higher the discount rate, the larger the reduction in AR, suggesting that rescue measures have a more pronounced risk-mitigation effect when market stress is stronger. At the same time, the changes in PD and the average number of defaulted banks indicate that rescue policies do not merely alter the scale of losses, but also reduce, to some extent, the probability of default propagation.
Based on these benchmark results, this study further introduces a dynamic internal–external rescue mechanism to examine the comprehensive performance of different rescue combinations in balancing risk control, cost constraints, and moral-hazard constraints.

4.4. Main Results of the Dynamic Internal–External Rescue Mechanism

Building on the no-rescue benchmark scenario, this study further compares three types of rescue strategies: pure internal rescue, pure external rescue, and mixed rescue. Under a risk-tolerance constraint, the optimal rescue scheme is identified by jointly considering systemic risk, rescue costs, and the moral-hazard proxy. Unlike an approach that simply pursues risk minimization, this study focuses on achieving an integrated balance between rescue costs and moral-hazard constraints while keeping systemic risk under control.
In terms of rescue mechanisms, the dynamic rescue framework introduced in this section consists of internal rescue and external rescue. Internal rescue includes debt-for-equity swaps, shareholder loss sharing, and write-downs of capital instruments, all of which require internal stakeholders of the bank to absorb losses. External rescue mainly refers to public-sector support, such as government capital injections. Pure internal rescue means that rescue resources come entirely from internal loss absorption, whereas pure external rescue indicates that rescue resources rely entirely on external public support. Mixed rescue refers to a strategy in which internal rescue and external rescue jointly absorb losses according to a given proportion.
In the simulation setting, the initial shock intensity is set at 30%. Constraints are imposed on both internal rescue capacity and external rescue capacity in order to avoid the implicit assumption of unlimited rescue resources. The selection of the optimal strategy takes into account three objectives. The first is systemic risk, measured mainly by AR, PD, and the average number of defaulted banks. The second is explicit rescue cost, including both external rescue cost and internal rescue cost. The third dimension concerns moral hazard, which is mainly captured by the degree of reliance on external rescue. Subject to the risk-tolerance constraint, the strategy with the lowest composite indicator value is identified as the annual optimal rescue scheme.
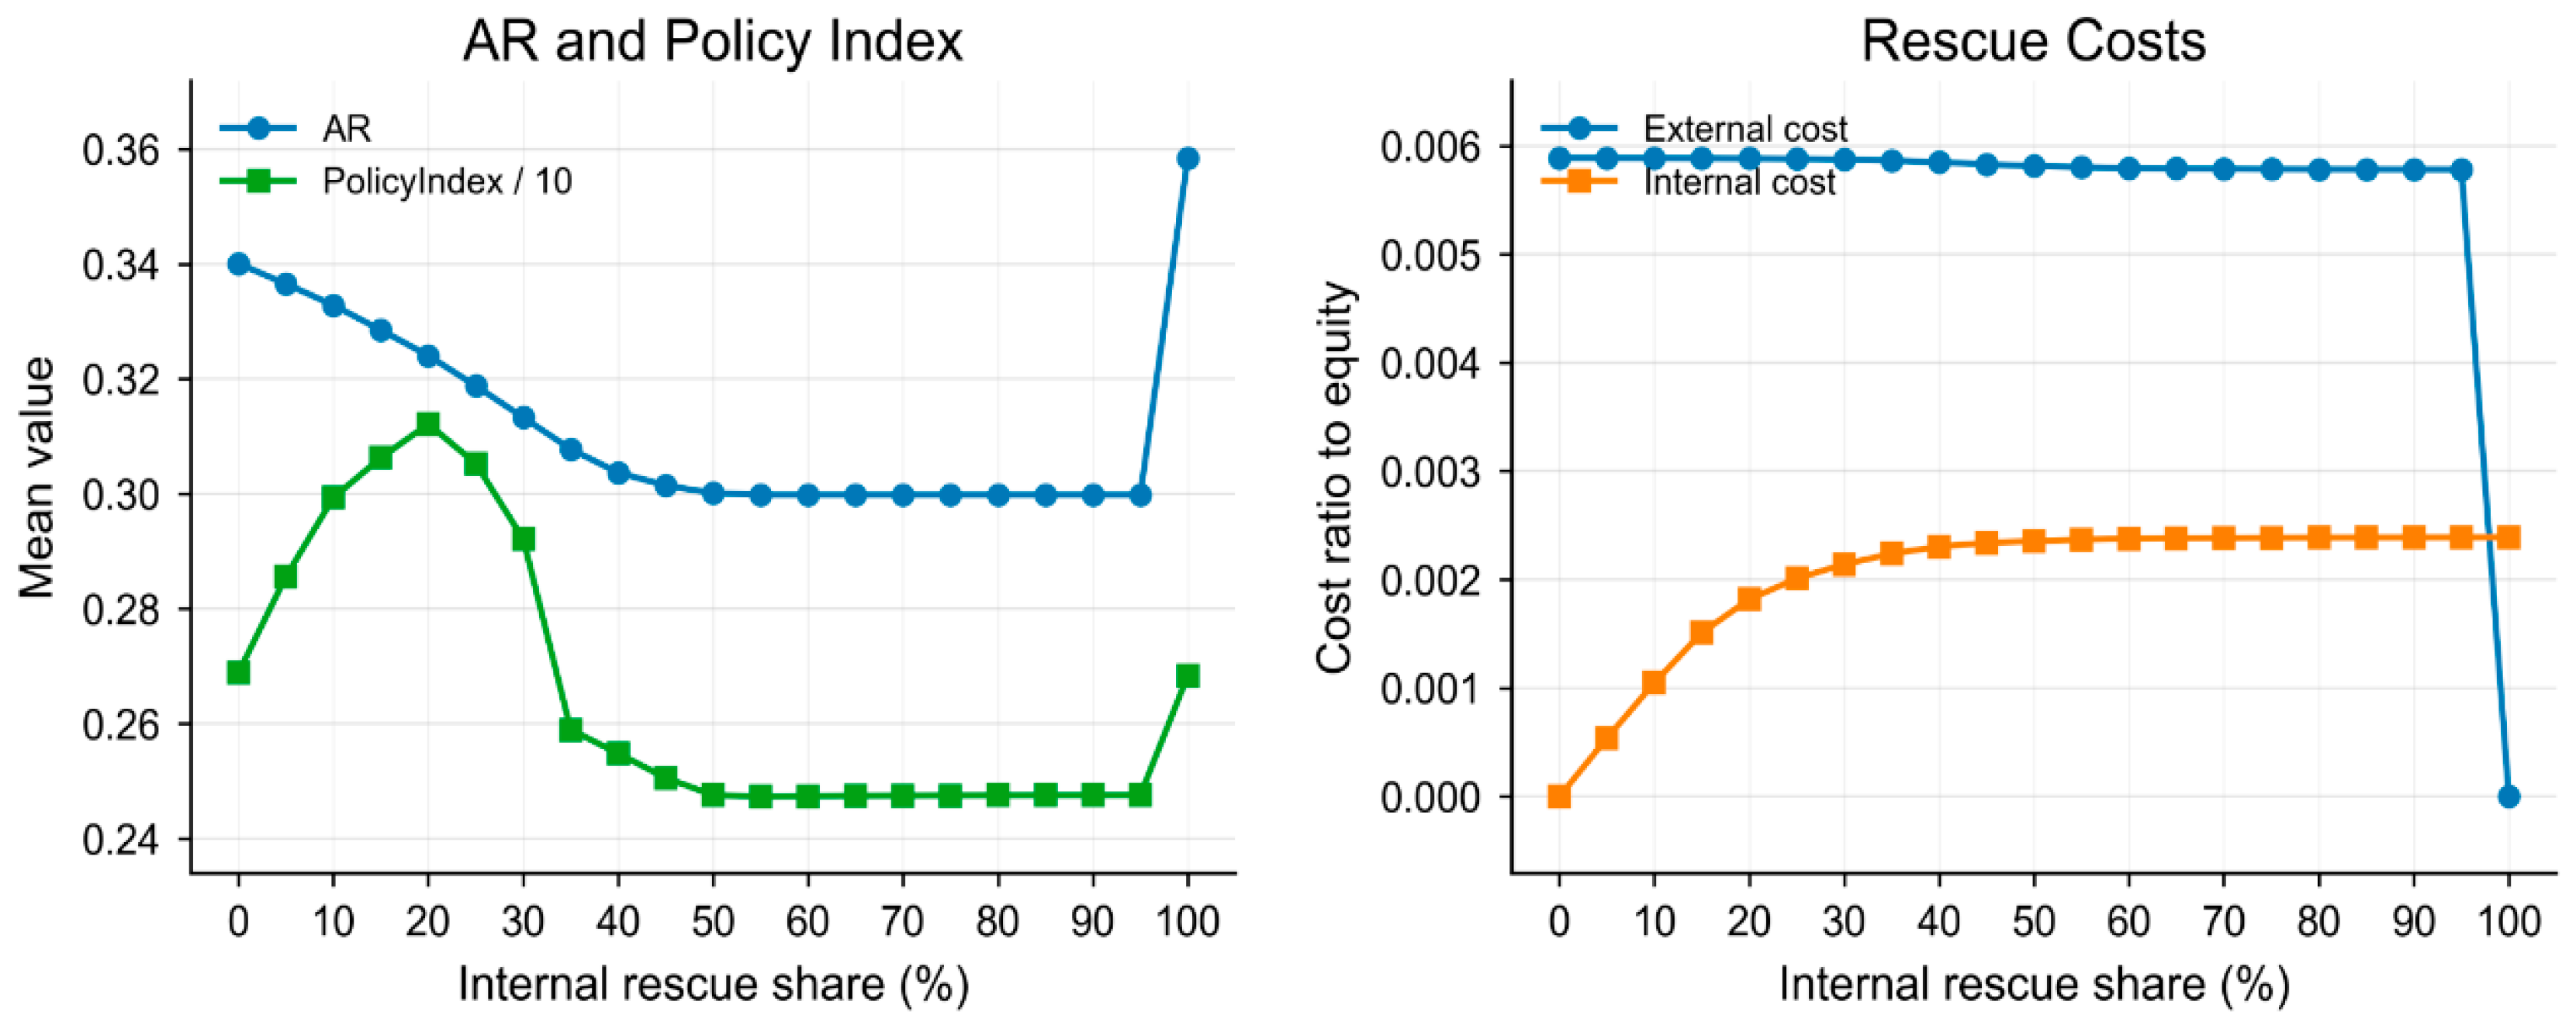
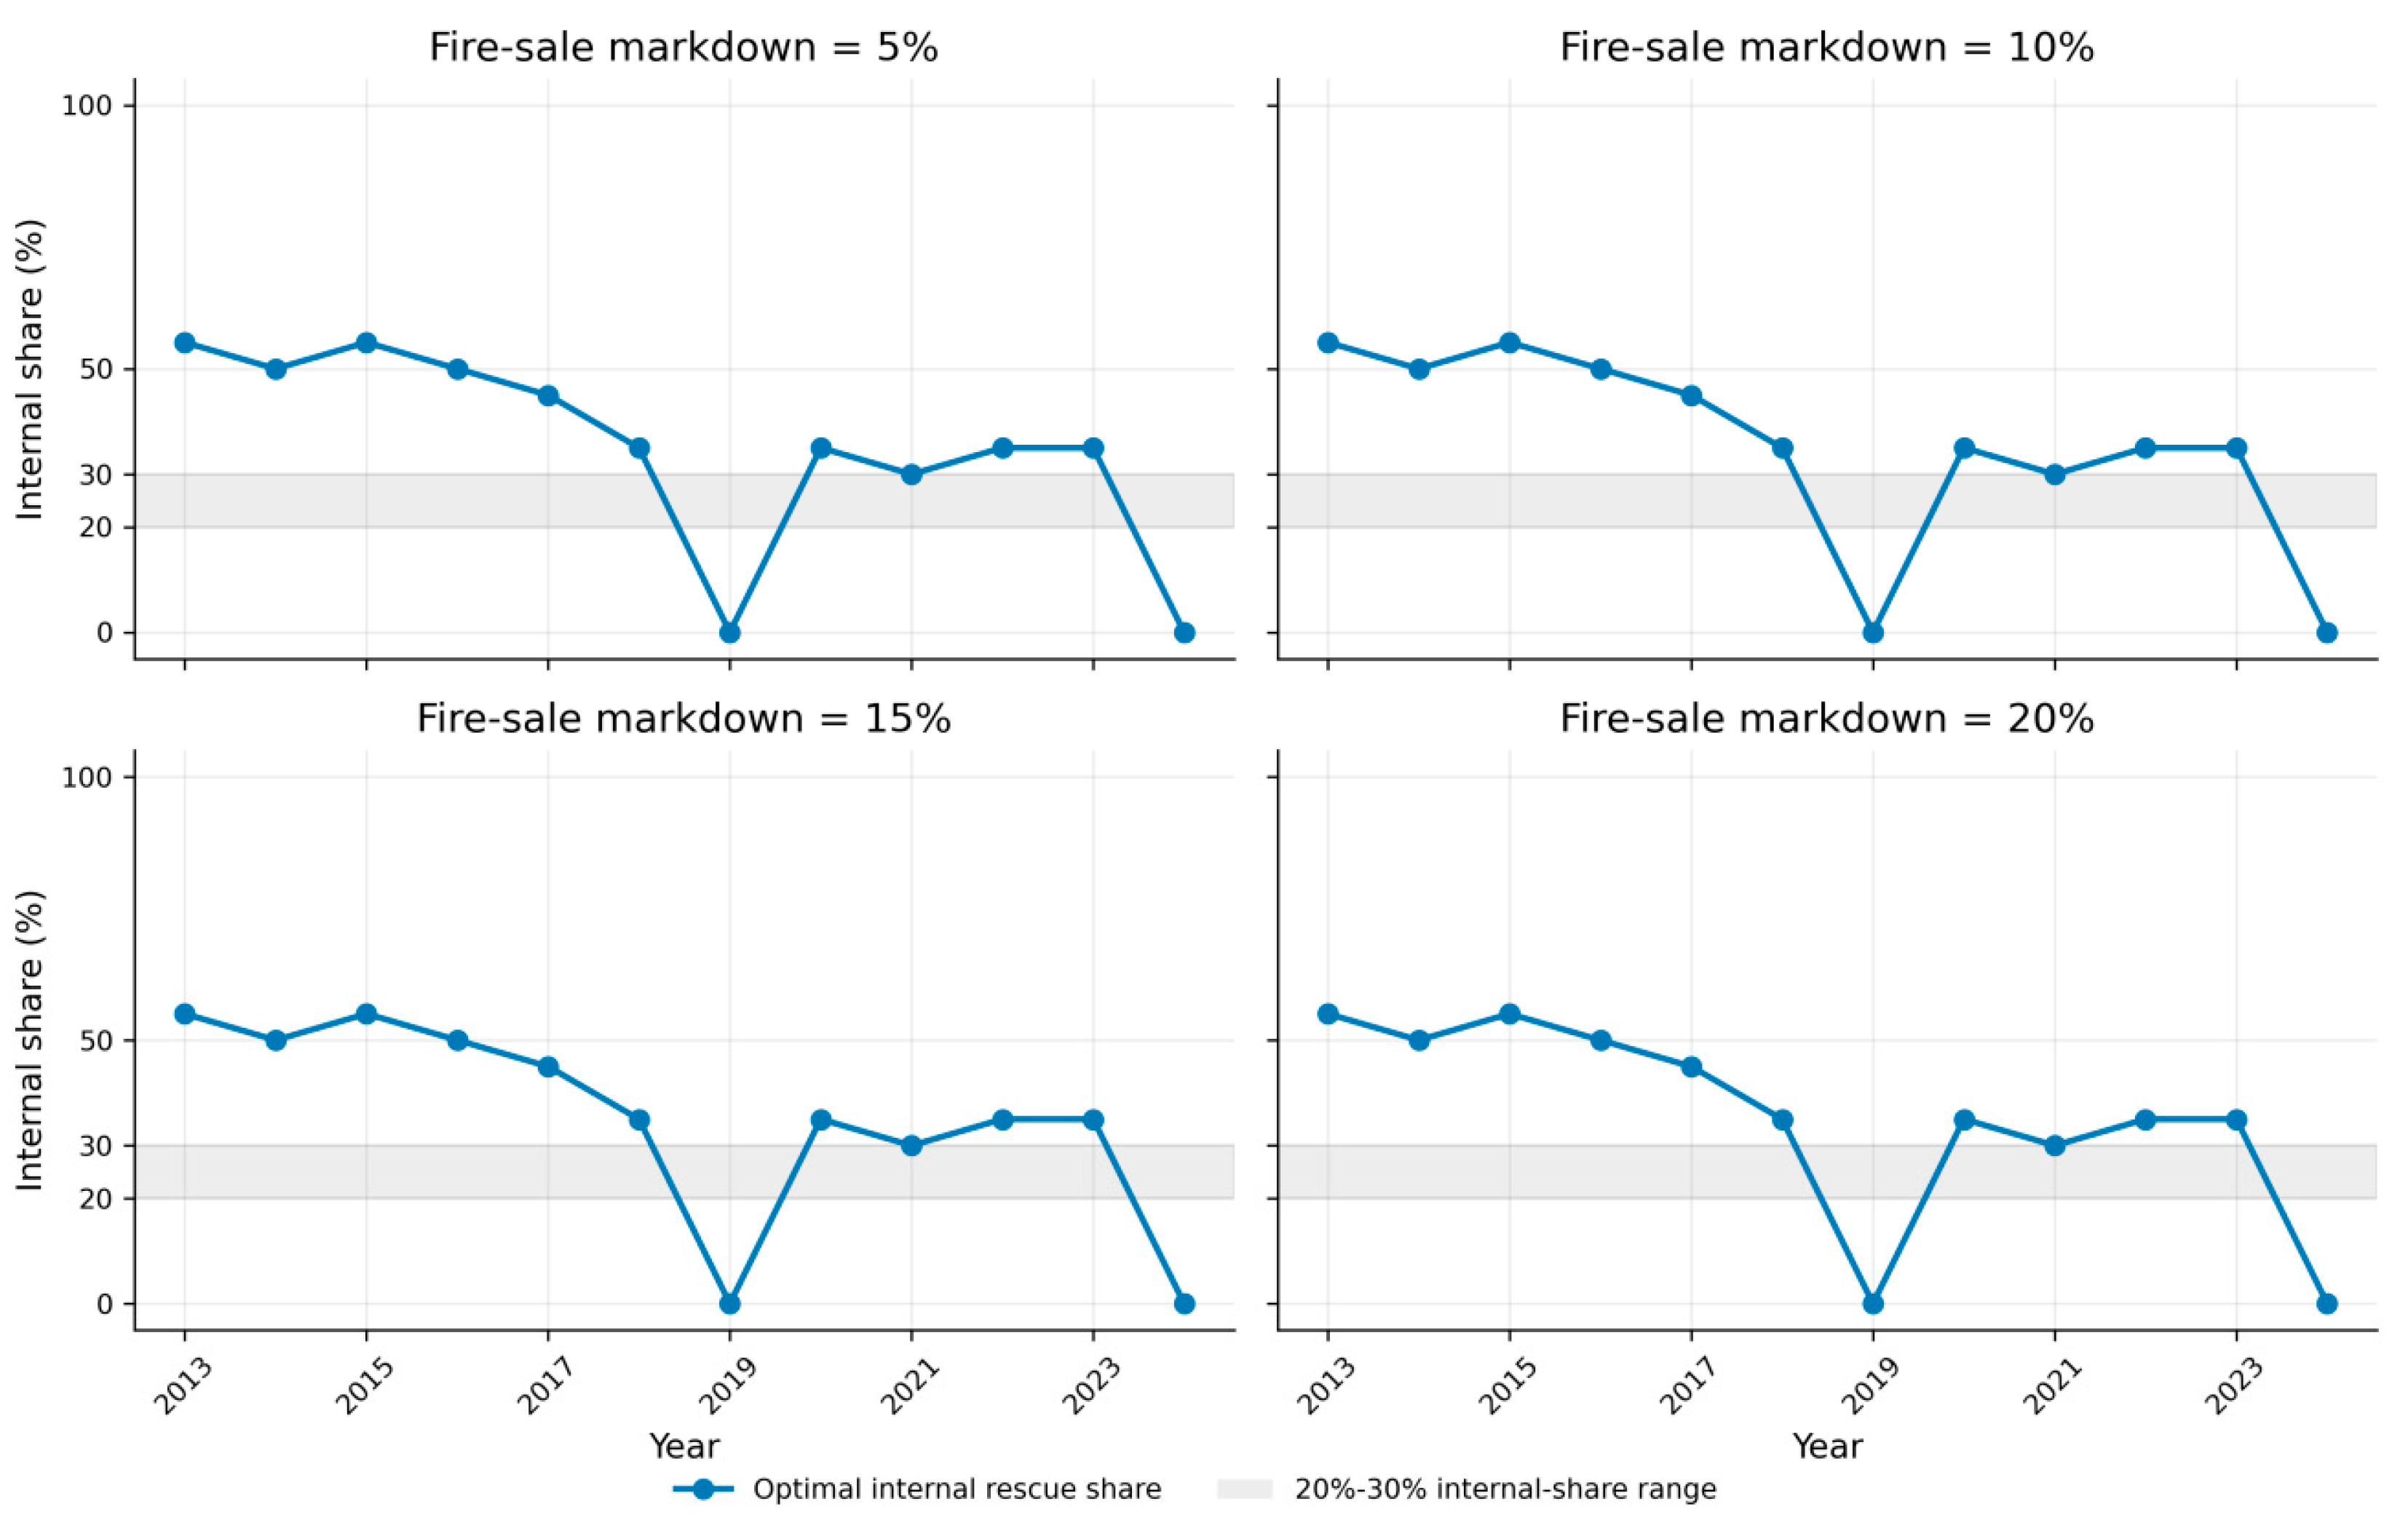
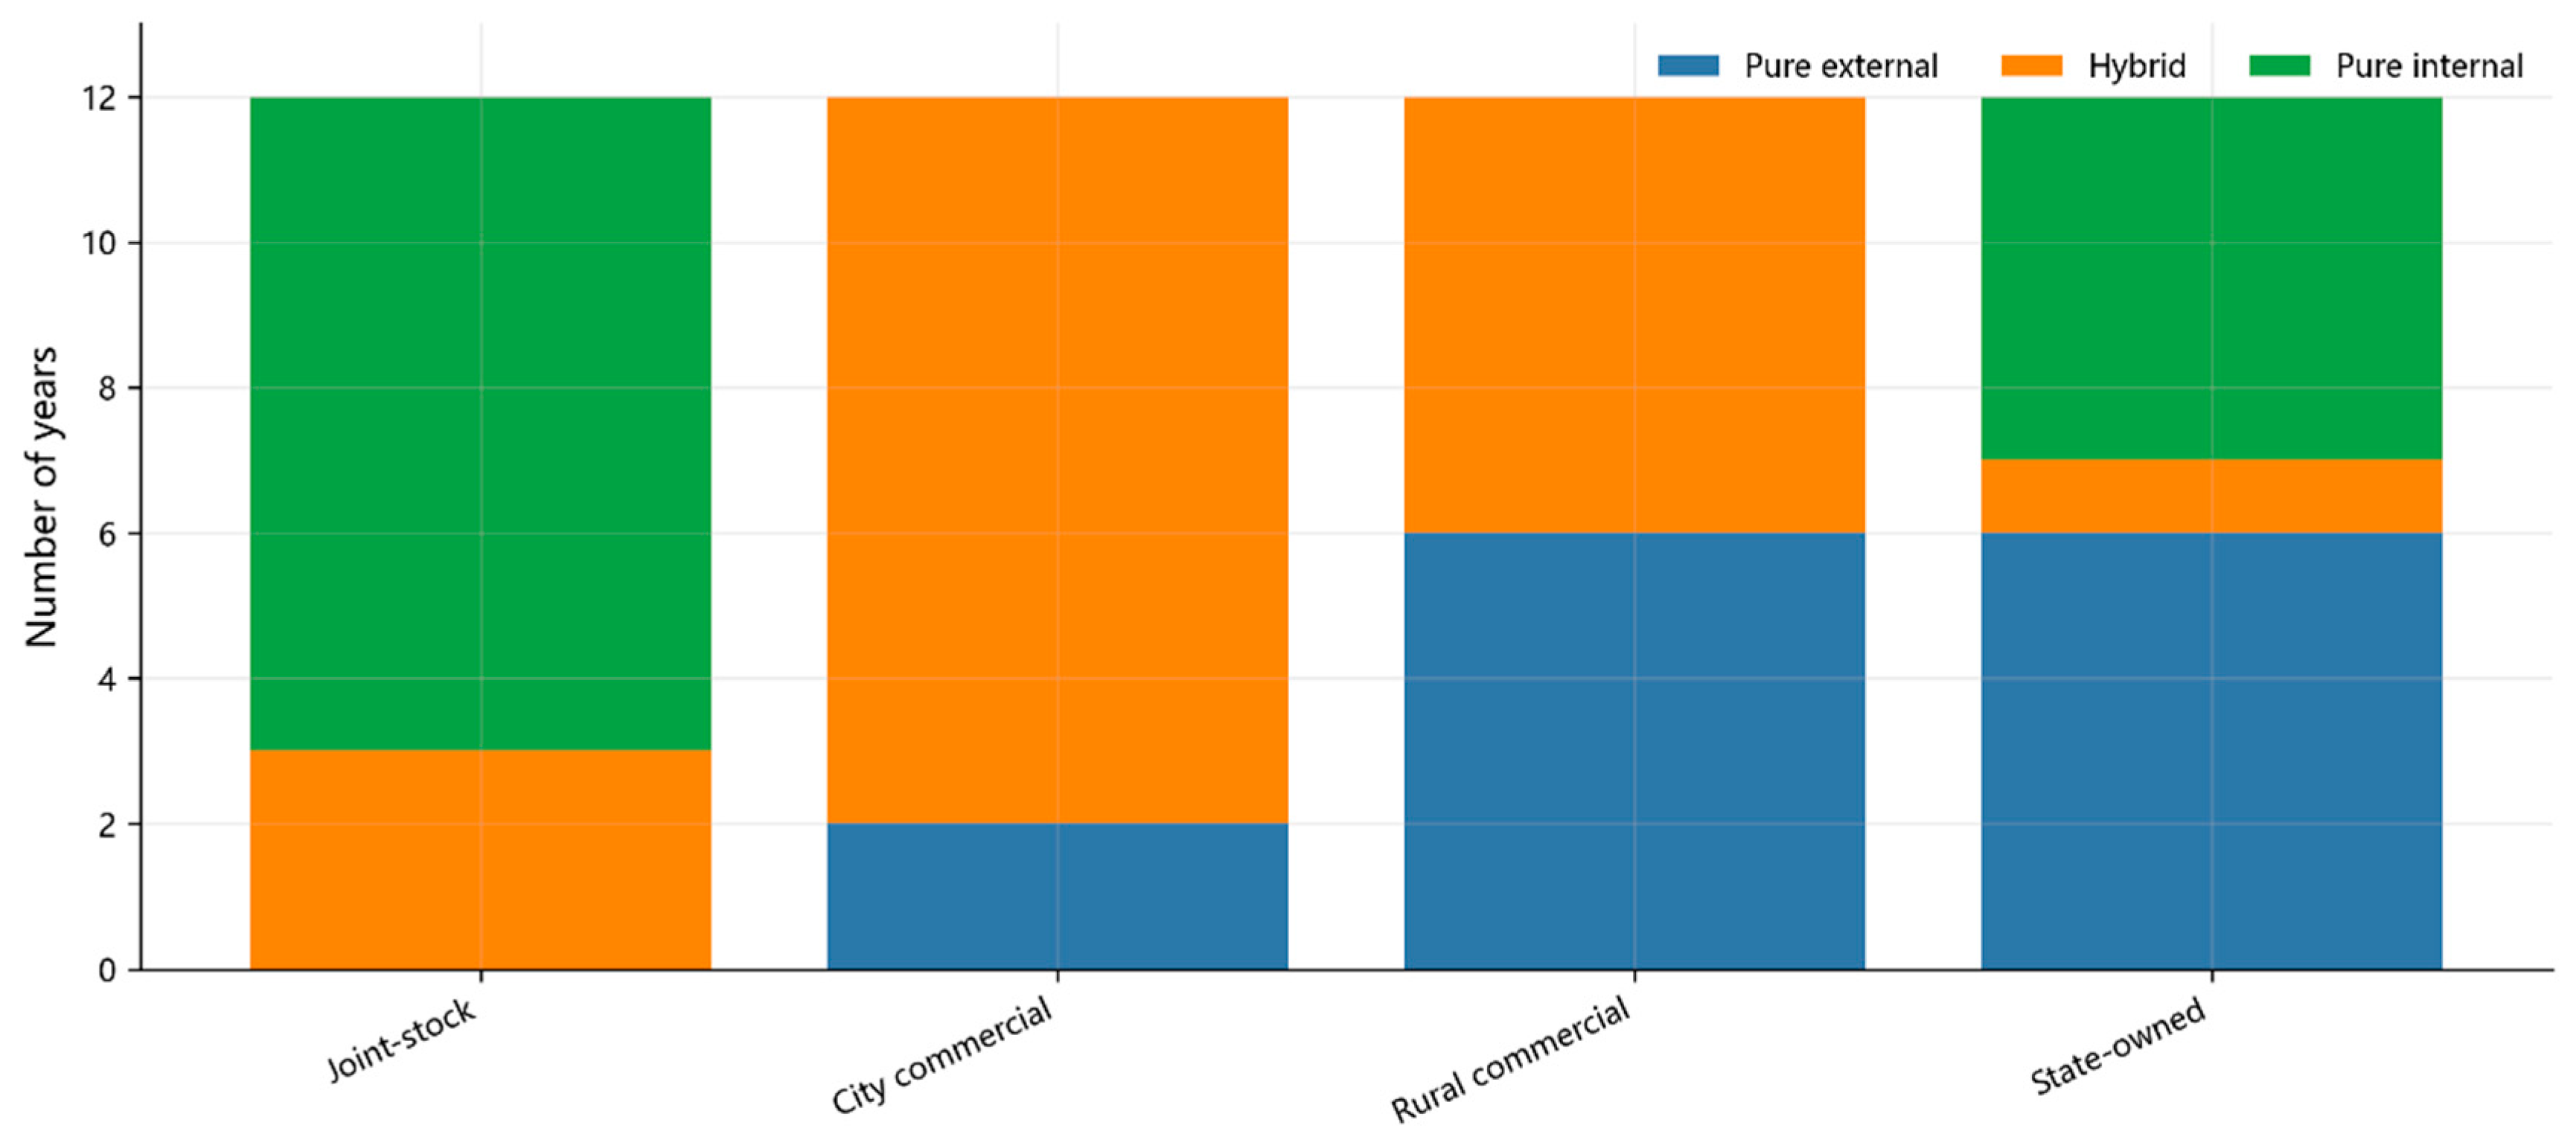
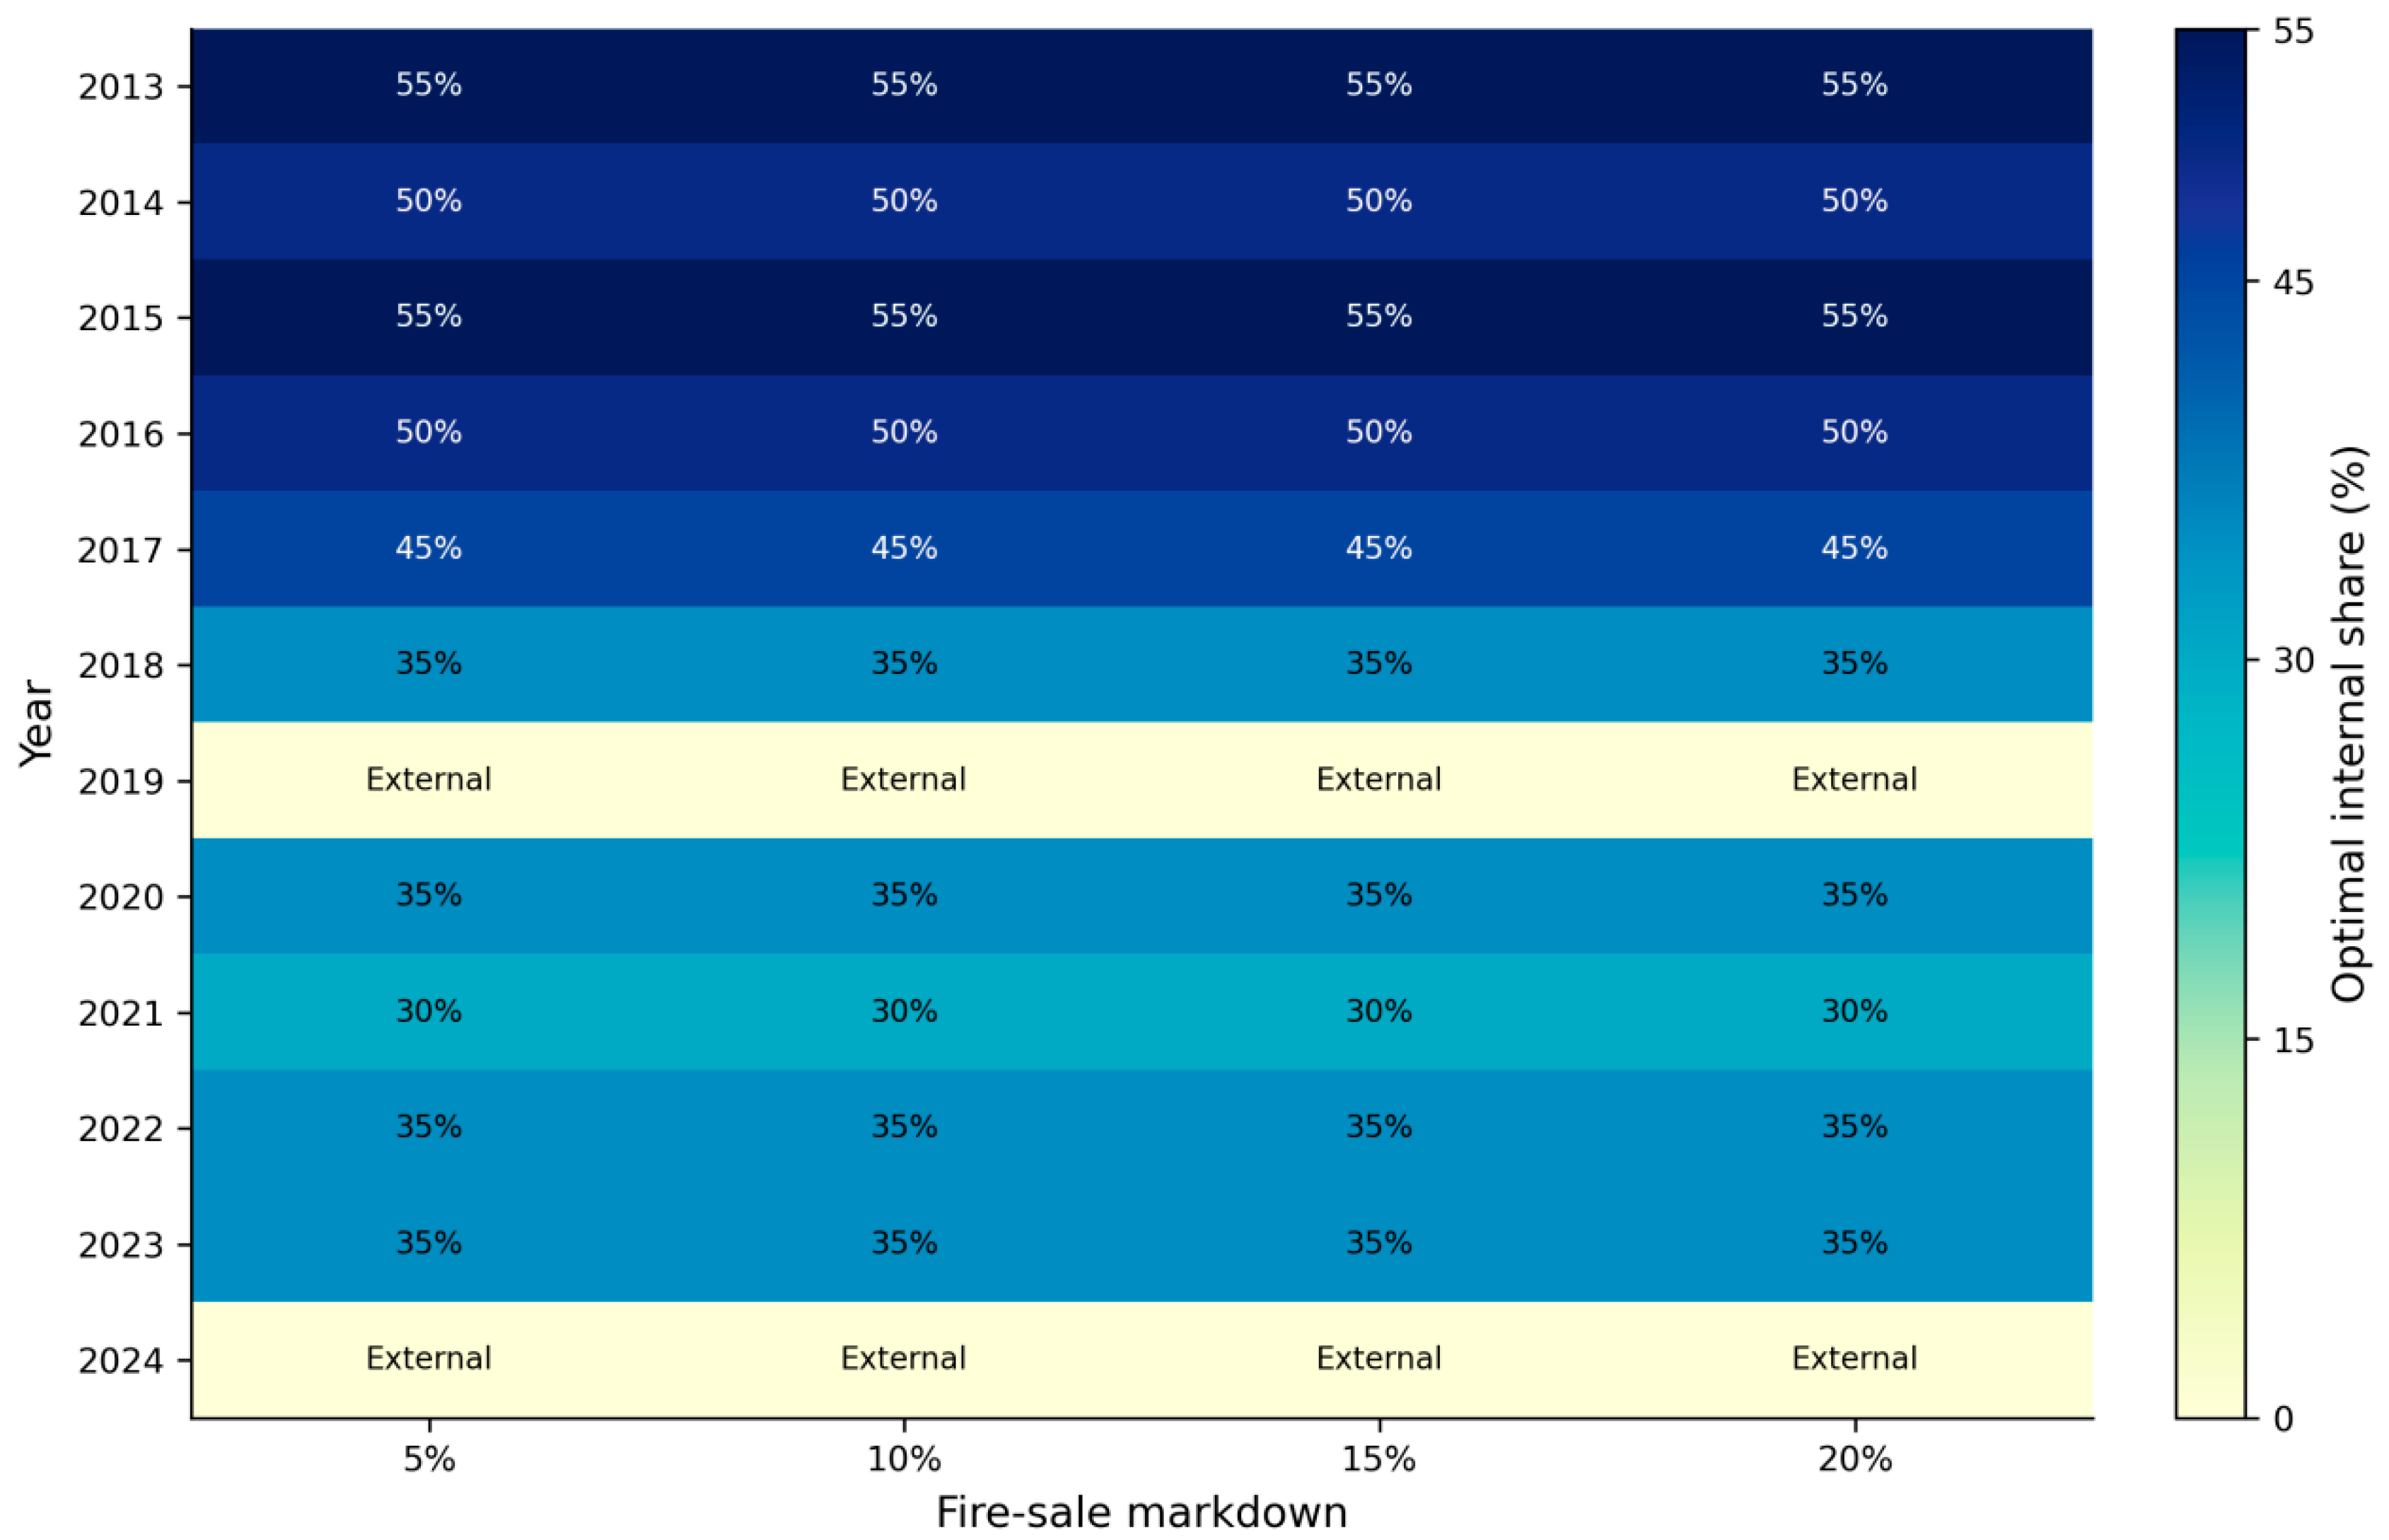
Table 7 reports the annual optimal rescue strategies under the baseline parameter setting. The results show that the optimal internal rescue share is relatively high during 2013–2018, mainly ranging from 35% to 55%. In contrast, pure external rescue is selected as the optimal strategy in 2019 and 2024, suggesting that the marginal stabilizing effect of external rescue becomes stronger in certain years. This result is consistent with the relatively high contagion intensity observed in these two years. Specifically, AR remains above 0.342, PD approaches the upper end of the sample range, and the average number of defaulted banks is close to or equal to one. These patterns indicate that internally reallocating losses may provide only limited additional stabilization when systemic pressure is already elevated. Under such conditions, external rescue can more directly absorb the initial shock, reduce the pressure transmitted to creditor banks, and mitigate potential fire-sale amplification. As a result, a zero internal rescue share becomes preferable in the composite policy evaluation.
Overall, mixed rescue is selected in 10 out of the 12 sample years, indicating that neither pure internal rescue nor pure external rescue can, in most years, simultaneously achieve risk control, cost containment, and moral-hazard mitigation. This finding highlights the dynamic nature of problem-bank resolution. The optimal rescue strategy is not a fixed proportional rule, but varies with annual network structure, risk exposure, contagion intensity, and rescue constraints.
Table 8 further complements the optimal-strategy results reported in Table 7 from the perspectives of cost constraints and moral hazard proxy. The results show a strong consistency between external rescue cost and the moral-hazard proxy, indicating that greater reliance on external public resources is associated with stronger potential policy dependence and higher moral-hazard pressure. By contrast, internal rescue cost reflects the extent to which losses are borne by shareholders, creditors, or other internal stakeholders.
The Policy Index is constructed as a composite measure that jointly reflects systemic risk, rescue cost, and moral-hazard concerns. Its annual variation indicates that the optimal rescue strategy does not simply pursue the lowest AR, but instead involves a trade-off between risk mitigation and the cost of rescue. This table therefore provides a cost-based explanatory foundation for the subsequent analysis of the optimal internal rescue share and the differences across candidate rescue strategies.
Figure 4 displays the distribution of the annual optimal internal rescue share under different fire-sale markdown rates. As shown in Figure 4, the optimal internal rescue share generally remains within a moderate range under different discount-rate settings and does not fluctuate sharply as the discount rate changes. This indicates that the optimal internal rescue share is not determined solely by a single asset-discount parameter, but rather is jointly shaped by contagion intensity, rescue costs, and moral hazard.
In other words, the advantage of mixed rescue does not stem from mechanically increasing the proportion of internal loss absorption, but from achieving an appropriate match between internal discipline and external stabilizing support. To further illustrate this trade-off mechanism, the following analysis combines the results for candidate strategies with the figures showing continuous variation.
Table 9 uses representative candidate strategies under the baseline parameter setting to compare the risk indicators, rescue costs, moral-hazard proxy, and Policy Index associated with different internal rescue shares. The results show that pure external rescue can reduce the pressure of internal loss absorption, but it is associated with relatively high external costs and moral-hazard pressure. As the internal rescue share increases, AR and PD generally decline, indicating that internal loss absorption helps interrupt the diffusion of risk.
However, an excessively high internal rescue share increases internal system-wide costs and may intensify the pressure of loss redistribution within the banking system. Therefore, the comparison of candidate strategies further suggests that the optimal rescue scheme is usually not located at either extreme of pure external rescue or pure internal rescue. Instead, it is achieved through a relatively balanced combination of internal discipline and external support.
Figure 5 illustrates the relationships among the internal rescue share, risk indicators, rescue costs, and Policy Index from the perspective of continuous variation. The left panel shows that AR generally declines as the internal rescue share increases. However, this decline is not linear, and the marginal improvement weakens when the internal rescue share reaches a relatively high range. The right panel shows that external cost decreases as the internal rescue share increases, while internal cost rises accordingly.
These results reveal the core trade-off embedded in rescue policy design. Increasing the internal rescue share can reduce the fiscal burden and external dependence, but excessive reliance on internal loss absorption may raise the internal cost borne by the banking system. Therefore, the optimal point identified by Policy Index is essentially a composite equilibrium jointly determined by risk mitigation, cost allocation, and moral-hazard constraints.
Table 10 further decomposes total risk losses into EN direct-default losses and GLT asset fire-sale losses. The results show that, under the no-rescue scenario, GLT losses increased markedly as the fire-sale markdown rate rises, whereas EN direct-default losses change only to a limited extent. This indicates that the asset fire-sale channel is the primary source of systemic risk amplification when market stress intensifies.
Under the optimal-rescue scenario, both EN losses and GLT losses are reduced, with the mitigation of GLT losses being particularly important. This suggests that coordinated internal–external rescue not only lowers the overall AR, but also reshapes the channel structure of risk contagion by alleviating asset fire-sale pressure.
Figure 6 graphically presents the differences between EN losses and GLT losses under the no-rescue and optimal-rescue scenarios. The figure shows that GLT asset fire-sale losses constitute the main component through which risk expands as the fire-sale markdown rate increases, while the optimal rescue strategy can substantially reduce losses transmitted through this channel.
These results indicate that moderate mixed rescue can generate a relatively more favorable combination among risk control, fiscal cost, and moral-hazard constraints. Its mechanism does not lie merely in capital replenishment, but more importantly in mitigating price-mediated contagion triggered by asset fire sales.
Taken together, the results from strategy selection, cost constraints, and contagion-channel decomposition jointly suggest that moderate mixed rescue achieves a better balance among systemic risk reduction, rescue cost containment, and moral-hazard control. To examine whether these conclusions depend on specific parameter settings, the following section conducts further robustness tests.

4.5. Robustness Tests

Although the baseline parameters are not intended to represent fixed regulatory thresholds, the robustness tests below examine whether the main conclusions are sensitive to key assumptions about fire-sale intensity, creditor recovery, and external rescue instruments. Considering that the EN-GLT dual-channel contagion model is sensitive to two key parameters—the asset fire-sale markdown rate and the creditor recovery rate—this study further conducts robustness tests along these two dimensions. The former captures the intensity of price shocks arising from asset fire sales and directly affects the GLT price-mediated contagion channel. The latter reflects the proportion of assets that creditors can recover after a bank defaults and directly affects the EN default-contagion channel. If the main conclusions remain valid under different parameter settings, this would indicate that the policy implications of coordinated internal–external rescue are supported by relatively robust empirical evidence.

4.5.1. Robustness Test for the Fire-Sale Markdown Rate

This robustness test keeps the sample composition, network structure, initial shock intensity, and rescue-capacity constraints unchanged, and only varies the fire-sale discount-rate parameter. If the structure of the optimal strategy remains stable under different discount-rate settings, this indicates that the main conclusion is not driven by a specific assumption about asset-price discounts, but instead arises from the systematic relationship between internal–external rescue mechanisms and dual-channel risk contagion.
Figure 7 shows that, under the four discount-rate settings of 5%, 10%, 15%, and 20%, the optimal rescue structure is dominated by mixed rescue. As the discount rate increases, systemic risk under the no-rescue scenario rises markedly, but the optimal rescue strategy continues to reduce AR. This indicates that the main conclusion of this study is robust to changes in the asset fire-sale markdown rate. It also suggests that mixed rescue can mitigate risk under different levels of market price pressure. Combined with the preceding EN-GLT channel decomposition, these results indicate that when the discount rate rises, risk amplification mainly stems from the price-mediated contagion channel, while the optimal rescue strategy can restrain the diffusion of this channel by reducing asset fire-sale pressure.

4.5.2. Robustness Test for the Creditor Recovery Rate

The robustness test for the creditor recovery rate is used to examine the parameter sensitivity of the EN direct-default contagion channel. A lower creditor recovery rate implies a higher loss-given-default for creditors of the defaulting bank and therefore a stronger direct-default shock. This study sets the creditor recovery rate at 30%, 50%, and 70%, respectively, while keeping other parameters unchanged, in order to examine whether the conclusions regarding the optimal rescue strategy change fundamentally under different assumptions about creditor recovery.
As shown in Table 11, a lower creditor recovery rate is associated with a higher no-rescue AR, indicating that the creditor recovery assumption has a significant effect on direct-default losses. When the creditor recovery rate decreases from 70% to 30%, the no-rescue AR increases from 0.4861 to 0.5821.
Although the overall risk level varies with the recovery rate, the optimal rescue strategy significantly reduces AR under all three recovery-rate settings. Moreover, the average optimal internal rescue share remains stable within the range of 43.75% to 44.69%. This suggests that the core conclusion regarding coordinated internal–external rescue is not altered by changes in the recovery-rate assumption.
These results indicate that the optimal rescue structure is not driven by a specific assumption about creditor recovery, but instead exhibits strong stability under different levels of default-loss intensity.
From the perspective of the contagion mechanism, a decline in the creditor recovery rate increases direct default losses among banks, thereby pushing up systemic risk. However, the optimal rescue strategy can still reduce the intensity of risk diffusion through a combination of internal loss sharing and external support. Therefore, the robustness test for the creditor recovery rate further confirms the stability of the main conclusions.
Figure 8 further shows that a decline in the creditor recovery rate increases AR under both the no-rescue and optimal-rescue scenarios. However, a clear gap between the two curves is consistently maintained, indicating that the rescue mechanism has a stable risk-mitigation effect under different levels of default-loss intensity. Combined with the results in Table 11, this suggests that the creditor recovery rate mainly affects the level of systemic risk, but does not fundamentally change the advantage of the optimal rescue strategy over the no-rescue scenario. Overall, the robustness tests based on both the fire-sale markdown rate and the creditor recovery rate support the main conclusion: moderately coordinating internal rescue and external rescue can more effectively contain risk contagion in the banking system.

4.6. Heterogeneity Analysis by Bank Type

Building on the validity of the main conclusion, this study further conducts heterogeneity analysis according to the type of the initially shocked bank. Specifically, in each year, city commercial banks, rural commercial banks, joint-stock commercial banks, and large state-owned banks are separately selected as the initial source of shocks. The analysis then systematically compares the heterogeneous effects of shocks to different types of banks on system-wide AR, PD, and the average number of defaulted banks, and identifies the corresponding optimal rescue strategy for each bank type.
As shown in Table 12, the reduction rates in AR are relatively higher when city commercial banks and joint-stock banks are treated as the initially shocked banks, reaching 22.14% and 19.97%, respectively. The corresponding reduction rate is 13.93% for rural commercial banks and 5.99% for large state-owned banks. This indicates that the effectiveness of rescue policies is not evenly distributed across different bank types, but is closely associated with banks’ patterns of interbank network connections, asset size, capital buffers, and risk-spillover capacity.
In particular, city commercial banks and joint-stock banks have a certain degree of cross-regional business linkages, while they may not possess the same level of capital buffers and stabilizing expectations as large state-owned banks. As a result, when these banks are subject to shocks, they are more likely to generate systemic effects that can be substantially mitigated by rescue policies.
Specifically, city commercial banks and joint-stock banks exhibit stronger risk-transmission capacity within the interbank network, making the marginal effect of rescue intervention more pronounced. Although rural commercial banks account for a larger number of institutions, their business linkages are more regionally concentrated and their cross-regional risk spillovers are relatively limited. As a result, the reduction in AR is smaller than that observed for city commercial banks and joint-stock banks. Large state-owned banks, by contrast, have stronger capital buffers and more stable implicit expectations, so the change in AR before and after rescue is relatively limited.
As shown in Figure 9, the above heterogeneity is further confirmed graphically. Under the baseline fire-sale discount scenario, when city commercial banks and joint-stock banks are treated as the initial sources of shocks, the reduction in AR after the optimal rescue intervention is relatively more pronounced. The risk-mitigation effect for rural commercial banks is moderate, while large state-owned banks exhibit the smallest reduction in AR.
This indicates that rescue policies for problem banks should be designed in a differentiated manner by taking into account bank type and network position, rather than mechanically applying a uniform rescue proportion.
As shown in Figure 10, the composition of optimal strategies differs markedly across bank types. Joint-stock banks are more inclined toward higher-intensity internal rescue, reflecting their relatively stronger internal loss-absorption capacity. City commercial banks are more suited to medium-intensity mixed rescue. For rural commercial banks and large state-owned banks, pure external rescue or pure internal rescue appears more frequently, indicating that the rescue strategies for these two types of banks are more strongly constrained by differences in capital buffers, business scope, and systemic importance.
Therefore, regulators should implement differentiated rescue policies by taking into account bank type, regional attributes, and network position, so as to improve the efficiency of policy-resource allocation. These heterogeneity results also suggest that the specific form of external rescue instruments may further affect rescue effectiveness. Accordingly, the next section conducts an extended test of different external rescue mechanisms.

4.7. Extended Test of External Rescue Mechanisms

In addition to parameter settings and bank types, the external rescue instrument itself may also affect rescue effectiveness. This study further distinguishes external rescue into three scenarios: government capital injection, liquidity guarantees, and deposit insurance support. These three mechanisms are based on different functional assumptions. Government capital injection directly replenishes bank capital and can improve capital shortfalls, but it entails relatively high fiscal costs. Liquidity guarantees mainly alleviate asset fire-sale pressure and market liquidity shocks, making them more sensitive to the fire-sale channel. Deposit insurance support primarily stabilizes liability-side expectations and depositor confidence, thereby mitigating direct-default and run-related risks.
This extended test does not reconstruct a complete institutional model. Rather, it compares the relative effects of different external rescue instruments within a unified simulation framework.
As shown in Table 13, the AR reduction is largest under the liquidity guarantee mechanism, reaching 0.1191. Government capital injection ranks second, with an AR reduction of 0.0812, while deposit insurance support reduces AR by 0.0603. This indicates that all three types of external rescue instruments can reduce systemic risk, but their risk-mitigation effects and operating channels differ substantially.
Specifically, liquidity guarantees perform better in alleviating asset fire sales and market liquidity pressure. Government capital injection is more likely to form a stable mixed mechanism with internal rescue, while deposit insurance support mainly operates by stabilizing liability-side expectations. The cost indicators and optimal internal rescue shares reported in the table further show that the choice of external rescue instrument not only affects the magnitude of risk mitigation, but also changes the optimal allocation between internal loss sharing and external public support.
Figure 11 shows that, under different fire-sale markdown rates, the optimal rescue strategy associated with liquidity guarantees yields the lowest AR, and the magnitude of AR reduction increases as the discount rate rises. This suggests that when market price shocks are stronger, alleviating liquidity pressure is more effective in suppressing asset fire-sale contagion than merely replenishing capital.
Government capital injection can still significantly reduce AR, but its risk-mitigation effect is weaker than that of liquidity guarantees. Deposit insurance support has a relatively smaller effect in reducing AR. These results indicate that the choice of external rescue mechanism should be matched with the type of crisis. When risk is mainly driven by asset fire sales and liquidity pressure, liquidity support is more targeted; when risk primarily arises from capital shortfalls, government capital injection plays a more direct role.
Figure 12 further illustrates the operating channels of different external rescue mechanisms. Under the liquidity guarantee mechanism, GLT asset fire-sale losses are the lowest, suggesting that this mechanism mainly functions by mitigating the fire-sale channel. Government capital injection is more directly oriented toward replenishing capital and reducing default pressure. Deposit insurance support helps stabilize market expectations, but its effect on containing asset fire-sale losses is relatively limited.
These results indicate that the choice of external rescue instruments not only affects the level of systemic risk, but also alters the optimal internal rescue share and the pathways of risk contagion. Therefore, in practical policy design, external rescue tools should be selected according to the specific nature and transmission mechanism of the crisis.

5. Conclusions

5.1. Main Findings

This paper examines the optimal coordination between internal loss absorption and external public support in the resolution of troubled banks in China. The resolution of problem banks should not be understood as a simple binary choice between rescue and non-rescue. In a banking system characterized by interbank claims, common asset exposures, and regionally concentrated financial linkages, the allocation of losses between internal stakeholders and external rescue providers can materially affect the path, intensity, and cost of systemic contagion.
Using annual data for 210 Chinese commercial banks from 2013 to 2024, this study constructs a region-constrained minimum-density interbank network and embeds it in an EN-GLT dual-channel contagion framework. The simulation results show that systemic risk contagion is economically meaningful in the absence of rescue intervention. Contagion becomes stronger when asset fire-sale pressure increases, indicating that market-price spillovers are an important amplifier of problem-bank distress. Across different stress scenarios, the optimal rescue strategy reduces systemic losses, lowers default diffusion, and improves the overall policy trade-off between risk control and rescue cost.
The central finding is that neither pure internal rescue nor pure external rescue is generally optimal. In most sample years, a mixed rescue strategy performs better because it combines creditor discipline with external stabilization. Excessive public rescue may increase fiscal costs and weaken market discipline. Excessive internal loss absorption may shift losses to creditor banks and amplify contagion through interbank linkages. An effective resolution framework should therefore balance loss sharing, stabilization, and incentive compatibility. The results further show that rescue effectiveness varies with contagion channels, bank types, and external rescue instruments. Liquidity guarantees are more targeted when distress is mainly driven by fire-sale pressure, whereas capital injection is more direct when the main problem is a solvency gap. Deposit insurance support is more useful when confidence shocks and liability-side pressures dominate.

5.2. Managerial and Policy Implications

These findings provide several managerial implications for commercial banks. Bank managers should not treat resolution planning as an ex post emergency response. Instead, recovery and resolution plans should be prepared before distress occurs. Banks with higher network centrality should maintain stronger capital and liquidity buffers, regularly map their major interbank counterparties, and assess whether potential bail-in losses could be transmitted to creditor institutions. Local small and medium-sized banks should pay particular attention to regional concentration, common asset exposures, and liquidity mismatch, because these factors may transform idiosyncratic distress into regional contagion.
The findings also have direct implications for China’s problem-bank resolution framework. Regulators should not regard internal loss absorption and external public support as mutually exclusive tools. A credible resolution framework should combine creditor loss sharing, public stabilization, liquidity support, and differentiated intervention. Macroprudential supervision should incorporate network-based contagion analysis to identify systemically important nodes, regional contagion clusters, and banks vulnerable to fire-sale pressure. This approach can help regulators distinguish between institutions that require liquidity support, those that need capital replenishment, and those for which internal loss absorption can be imposed without generating excessive contagion.
More broadly, the results support a channel-contingent and institution-specific resolution toolkit. When fire-sale pressure dominates, liquidity guarantees may be more effective in preventing asset-price spirals. When solvency gaps dominate, capital injection may provide more direct stabilization. When confidence and liability-side pressures dominate, deposit insurance support may help contain depositor runs and funding-market stress. Therefore, the design of problem-bank resolution should be based not only on the size of the distressed bank, but also on its network position, balance-sheet structure, contagion channel, and potential moral-hazard effects. For bank managers, this implies strengthening exposure monitoring, capital-buffer planning, and contingency funding arrangements before shocks become systemic; for regulators, it implies calibrating the rescue mix to the dominant contagion channel rather than applying a uniform bailout rule.

5.3. Limitations and Future Research

This study has several limitations that provide directions for future research. First, the interbank network is reconstructed from annual balance-sheet data because actual bilateral exposure data are not publicly available. Although the region-constrained minimum-density method improves the institutional realism of the estimated network, it remains an approximation. Future studies could use higher-frequency transaction-level data or supervisory data to better capture short-term liquidity pressure and time-varying interbank linkages.
Second, the model focuses mainly on interbank default contagion and asset fire-sale contagion. These two channels are central to systemic risk transmission, but they do not exhaust all possible mechanisms of problem-bank distress. Future research could incorporate richer forms of asset-side heterogeneity, depositor behavior, creditor expectations, and market confidence effects. Such extensions would help capture the behavioral responses that may arise during bank-resolution episodes.
Third, this study evaluates internal and external rescue mechanisms under stylized policy settings. This design is useful for identifying the general trade-off among systemic risk, rescue cost, and moral hazard, but it cannot fully capture all institutional details of specific resolution tools. Future research could further examine deposit insurance support, bridge banks, purchase-and-assumption arrangements, and differentiated local government intervention. These extensions would provide more detailed evidence on how resolution design affects systemic risk, fiscal burden, and moral-hazard incentives.


Author Contributions

Conceptualization, R.M. and X.W.; methodology, R.M. and X.W.; software, X.W. and Y.D.; validation, R.M., X.W. and Y.D.; formal analysis, X.W.; investigation and literature review, X.W. and Y.D.; resources, R.M.; data curation, X.W. and Y.D.; writing—original draft preparation, X.W. and Y.D.; writing—review and editing, R.M. and X.W.; visualization, X.W. and Y.D.; supervision, R.M.; project administration, R.M.; funding acquisition, R.M. All authors have read and agreed to the published version of the manuscript.

Funding

This research was funded by the National Social Science Fund of China, grant number 25BJY084.

Data Availability Statement

The data used in this study were obtained from the Wind database. Access to these data is subject to the subscription and licensing restrictions imposed by Wind Information Co., Ltd. The list of sample banks, simulation code, and derived results are available from the corresponding author.

Conflicts of Interest

Author Yuang Duan was employed by Dongying Yatong Petrochemical Co., Ltd. The company had no role in the design of the study; in the collection, analysis, or interpretation of data; in the writing of the manuscript; or in the decision to publish the results. The remaining authors declare that the research was conducted in the absence of any commercial or financial relationships that could be construed as potential conflicts of interest.

References

  1. Allen, F.; Gale, D. Financial contagion. J. Political Econ. 2000, 108, 1–33. [Google Scholar] [CrossRef] [Scilit]
  2. Peek, J.; Rosengren, E.S. Collateral damage: Effects of the Japanese bank crisis on real activity in the United States. Am. Econ. Rev. 2000, 90, 30–45. [Google Scholar] [CrossRef] [Scilit]
  3. Elliott, M.; Golub, B.; Jackson, M.O. Financial networks and contagion. Am. Econ. Rev. 2014, 104, 3115–3153. [Google Scholar] [CrossRef] [Scilit]
  4. Cordella, T.; Yeyati, E.L. Bank bailouts: Moral hazard vs. value effect. J. Financ. Intermediat. 2003, 12, 300–330. [Google Scholar] [CrossRef] [Scilit]
  5. Farhi, E.; Tirole, J. Collective moral hazard, maturity mismatch, and systemic bailouts. Am. Econ. Rev. 2012, 102, 60–93. [Google Scholar] [CrossRef] [Scilit]
  6. Gorton, G.; Huang, L. Liquidity, efficiency, and bank bailouts. Am. Econ. Rev. 2004, 94, 455–483. [Google Scholar] [CrossRef] [Scilit]
  7. Philippon, T.; Schnabl, P. Efficient recapitalization. J. Financ. 2013, 68, 1–42. [Google Scholar] [CrossRef] [Scilit]
  8. Financial Stability Board. Key Attributes of Effective Resolution Regimes for Financial Institutions: Revised Version 2024; Financial Stability Board: Basel, Switzerland, 2024; Available online: https://www.fsb.org/uploads/P250424-3.pdf (accessed on 5 June 2026).
  9. Basel Committee on Banking Supervision. Guidelines for Identifying and Dealing with Weak Banks; Bank for International Settlements: Basel, Switzerland, 2015; Available online: https://www.bis.org/bcbs/publ/d330.pdf (accessed on 22 May 2026).
  10. Liu, K. Chinese banking failure: The case of Baoshang Bank and its implications. J. Financ. Econ. Policy 2021, 13, 424–441. [Google Scholar] [CrossRef] [Scilit]
  11. Eisenberg, L.; Noe, T.H. Systemic risk in financial systems. Manag. Sci. 2001, 47, 236–249. [Google Scholar] [CrossRef] [Scilit]
  12. Cifuentes, R.; Ferrucci, G.; Shin, H.S. Liquidity risk and contagion. J. Eur. Econ. Assoc. 2005, 3, 556–566. [Google Scholar] [CrossRef] [Scilit]
  13. Greenwood, R.; Landier, A.; Thesmar, D. Vulnerable banks. J. Financ. Econ. 2015, 115, 471–485. [Google Scholar] [CrossRef] [Scilit]
  14. Upper, C.; Worms, A. Estimating bilateral exposures in the German interbank market: Is there a danger of contagion? Eur. Econ. Rev. 2004, 48, 827–849. [Google Scholar] [CrossRef] [Scilit]
  15. Mistrulli, P.E. Assessing financial contagion in the interbank market: Maximum entropy versus observed interbank lending patterns. J. Bank. Financ. 2011, 35, 1114–1127. [Google Scholar] [CrossRef] [Scilit]
  16. Rehbein, O.; Ongena, S. Flooded through the back door: The role of bank capital in local shock spillovers. J. Financ. Quant. Anal. 2022, 57, 2627–2658. [Google Scholar] [CrossRef] [Scilit]
  17. Bessler, W.; Nohel, T. Asymmetric information, dividend reductions, and contagion effects in bank stock returns. J. Bank. Financ. 2000, 24, 1831–1848. [Google Scholar] [CrossRef] [Scilit]
  18. Garcia, G.G.H. Failing prompt corrective action. J. Bank. Regul. 2010, 11, 171–190. [Google Scholar] [CrossRef] [Scilit]
  19. Loveland, R. How prompt was regulatory corrective action during the financial crisis? J. Financ. Stab. 2016, 25, 16–36. [Google Scholar] [CrossRef] [Scilit]
  20. Cole, R.A.; White, L.J. When time is not on our side: The costs of regulatory forbearance in the closure of insolvent banks. J. Bank. Financ. 2017, 80, 235–249. [Google Scholar] [CrossRef] [Scilit]
  21. Billio, M.; Getmansky, M.; Lo, A.W.; Pelizzon, L. Econometric measures of connectedness and systemic risk in the finance and insurance sectors. J. Financ. Econ. 2012, 104, 535–559. [Google Scholar] [CrossRef] [Scilit]
  22. Fang, Y.; Lin, H.; Lu, L. Measuring systemic risk from textual analysis: Evidence from Chinese banks. Int. Rev. Econ. Financ. 2025, 103, 104355. [Google Scholar] [CrossRef] [Scilit]
  23. Zou, J.; Fu, X.; Yang, J.; Gong, C. Measuring bank systemic risk in China: A network model analysis. Systems 2022, 10, 14. [Google Scholar] [CrossRef] [Scilit]
  24. Chen, B.; Li, L.; Peng, F.; Anwar, S. Risk contagion in the banking network: New evidence from China. N. Am. J. Econ. Financ. 2020, 54, 101276. [Google Scholar] [CrossRef] [Scilit]
  25. Jiang, S.; Wang, J.; Dong, R.; Li, Y. Systemic risk with multi-channel risk contagion in the interbank market. Sustainability 2023, 15, 2727. [Google Scholar] [CrossRef] [Scilit]
  26. Fiala, T.; Havranek, T. The sources of contagion risk in a banking sector with foreign ownership. Econ. Model. 2017, 60, 108–121. [Google Scholar] [CrossRef] [Scilit]
  27. Duggar, E.; Mitra, S. External linkages and contagion risk in Irish banks. IMF Staff. Pap. 2009, 56, 758–786. [Google Scholar] [CrossRef] [Scilit]
  28. Hao, X.; Han, S. Operational risk transmission model of banks based on a scale-free network. HKIE Trans. 2014, 21, 170–177. [Google Scholar] [CrossRef] [Scilit]
  29. Anand, K.; Craig, B.; von Peter, G. Filling in the blanks: Network structure and interbank contagion. Quant. Financ. 2015, 15, 625–636. [Google Scholar] [CrossRef] [Scilit]
  30. Aldasoro, I.; Delli Gatti, D.; Faia, E. Bank networks: Contagion, systemic risk and prudential policy. J. Econ. Behav. Organ. 2017, 142, 164–188. [Google Scholar] [CrossRef] [Scilit]
  31. Zhou, J.; Rutledge, V.; Bossu, W.; Dobler, M.; Jassaud, N.; Moore, M. From Bail-Out to Bail-In: Mandatory Debt Restructuring of Systemic Financial Institutions; IMF Staff Discussion Note 2012, SDN/12/03; International Monetary Fund: Washington, DC, USA, 2012. [Google Scholar] [CrossRef] [Scilit]
  32. Diamond, D.W.; Dybvig, P.H. Bank runs, deposit insurance, and liquidity. J. Political Econ. 1983, 91, 401–419. [Google Scholar] [CrossRef] [Scilit]
  33. Acharya, V.V.; Shin, H.S.; Yorulmazer, T. Crisis resolution and bank liquidity. Rev. Financ. Stud. 2011, 24, 2166–2205. [Google Scholar] [CrossRef] [Scilit]
  34. Chang, C.P.; Chen, S. Government capital injection, credit risk transfer, and bank performance during a financial crisis. Econ. Model. 2016, 53, 477–486. [Google Scholar] [CrossRef] [Scilit]
  35. Anginer, D.; Demirguc-Kunt, A.; Zhu, M. How does deposit insurance affect bank risk? Evidence from the recent crisis. J. Bank. Financ. 2014, 48, 312–321. [Google Scholar] [CrossRef] [Scilit]
  36. Klimek, P.; Poledna, S.; Farmer, J.D.; Thurner, S. To bail-out or to bail-in? Answers from an agent-based model. J. Econ. Dyn. Control 2015, 50, 144–154. [Google Scholar] [CrossRef] [Scilit]
  37. Pandolfi, L. Bail-in and bailout: Friends or foes? Manag. Sci. 2022, 68, 1450–1468. [Google Scholar] [CrossRef] [Scilit]
  38. Sanchez-Roger, M.; Oliver-Alfonso, M.D.; Sanchis-Pedregosa, C. Bail-in: A sustainable mechanism for rescuing banks. Sustainability 2018, 10, 3789. [Google Scholar] [CrossRef] [Scilit]
  39. Avgouleas, E.; Goodhart, C.; Schoenmaker, D. Bank resolution plans as a catalyst for global financial reform. J. Financ. Stab. 2013, 9, 210–218. [Google Scholar] [CrossRef] [Scilit]
  40. Deidda, L.G.; Panetti, E. Bank recovery and resolution planning, liquidity management and fragility. J. Financ. Stab. 2025, 78, 101395. [Google Scholar] [CrossRef] [Scilit]
  41. Zhang, G. Bank capital, interbank contagion, and bailout policy. J. Bank. Financ. 2013, 37, 2765–2778. [Google Scholar] [CrossRef] [Scilit]
  42. Granja, J.; Matvos, G.; Seru, A. Selling failed banks. J. Financ. 2017, 72, 1723–1784. [Google Scholar] [CrossRef] [Scilit]
  43. Freeman, L.C. Centrality in social networks conceptual clarification. Soc. Netw. 1979, 1, 215–239. [Google Scholar] [CrossRef] [Scilit]
  44. Watts, D.J.; Strogatz, S.H. Collective dynamics of small-world networks. Nature 1998, 393, 440–442. [Google Scholar] [CrossRef] [Scilit] [PubMed]
  45. Newman, M.E.J. Networks: An Introduction; Oxford University Press: Oxford, UK, 2010. [Google Scholar] [CrossRef] [Scilit]
  46. Basel Committee on Banking Supervision. Resolution Policies and Frameworks: Progress So Far; Bank for International Settlements: Basel, Switzerland, 2011; Available online: https://www.bis.org/publ/bcbs200.pdf (accessed on 4 June 2026).
  47. Glasserman, P.; Young, H.P. Contagion in financial networks. J. Econ. Lit. 2016, 54, 779–831. [Google Scholar] [CrossRef] [Scilit]
  48. Rogers, L.C.G.; Veraart, L.A.M. Failure and rescue in an interbank network. Manag. Sci. 2013, 59, 882–898. [Google Scholar] [CrossRef] [Scilit]
  49. People’s Bank of China. China Financial Stability Report 2025. Available online: https://www.pbc.gov.cn/en/3688235/3688414/3710021/index.html (accessed on 5 June 2026).
  50. Fienberg, S.E. An iterative procedure for estimation in contingency tables. Ann. Math. Stat. 1970, 41, 907–917. [Google Scholar] [CrossRef] [Scilit]
Figure 1. Construction Results of the Region-Constrained Minimum-Density Network.
Systems 14 00877 g001
Figure 2. Topological Characteristics of the Region-Constrained Minimum-Density Network.
Systems 14 00877 g002
Figure 3. AR under the No-Rescue and Optimal-Rescue Scenarios.
Systems 14 00877 g003
Figure 4. Heat Map of the Optimal Internal Rescue Share.
Systems 14 00877 g004
Figure 5. Changes in Risk, Cost, and Policy Index under Different Internal Rescue Shares.
Systems 14 00877 g005
Figure 6. Comparison of EN and GLT Losses under No-Rescue and Optimal-Rescue Scenarios.
Systems 14 00877 g006
Figure 7. Annual Optimal Internal Rescue Shares under Alternative Fire-Sale Markdown Rates.
Systems 14 00877 g007
Figure 8. AR Sensitivity to Fire-Sale Markdown and Creditor Recovery Rates.
Systems 14 00877 g008
Figure 9. AR Reduction Rates across Different Bank Types.
Systems 14 00877 g009
Figure 10. Composition of Optimal Strategies by Bank Type.
Systems 14 00877 g010
Figure 11. Comparison of AR under Different External Rescue Mechanisms.
Systems 14 00877 g011
Figure 12. Decomposition of Risk Contagion Channels under Different External Rescue Mechanisms.
Systems 14 00877 g012
Table 1. Notation and Economic Meaning of Key Symbols.
SymbolDefinitionEconomic Meaning
NNumber of banksSize of the banking system.
I A i Interbank assets of bank iBank i’s claims on other financial institutions.
I L j Original interbank liabilities of bank jBank j’s obligations to other financial institutions.
I L ~ j Scaled interbank liabilities of bank jAdjusted liabilities used to balance aggregate
interbank assets and liabilities.
x i j Bilateral exposure from bank i to bank jBank i’s claim on bank j; bank j’s liability to bank i.
X = ( x i j ) N × N Bilateral interbank exposure matrixEstimated interbank network used in contagion
simulation.
G i j Feasible linkage indicatorEquals 1 if a link between banks i and j is allowed.
c i j Linkage costCost used in the minimum-density optimization.
p r o v i n c e i , p r o v i n c e j Provinces of banks i and jRegional attributes used to impose linkage
constraints.
αInternal rescue shareShare of the capital shortfall covered by internal loss absorption.
ηInternal rescue capacity ceilingUpper bound of feasible bail-in or loss absorption.
κExternal rescue capacity ceilingUpper bound of public support.
ρCreditor recovery rateRecovery ratio after debtor default.
θFire-sale markdown rateAsset-price discount under forced sales.
ARAbsorbing rateAggregate capital-loss ratio after contagion.
PDProbability of defaultShare of defaulted banks in the system.
Note: Symbols are defined at first substantive use in the Methods section. Subscripts i and j denote banks, t denotes time, and r denotes the contagion round. Superscripts or markers such as s indicate scaled quantities, and asterisks indicate steady-state values after the contagion process ends.
Table 2. Key Parameter Settings and Robustness Checks.
ParameterMeaningBaseline SettingRobustness Check or
Explanation
sExternal asset shock
intensity
0.30Severe stress scenario to trigger problem-bank
resolution
λEquity-capital shock
multiplier
1.20Captures leverage
amplification from asset losses to equity capital
ηMaximum creditor
debt-to-equity conversion ratio/internal rescue
capacity ceiling
0.30Upper bound of feasible internal loss absorption
κExternal rescue capacity ceiling0.10Fiscal/public-support capacity constraint
δ d , i , 0 Going-concern threshold0Negative equity implies that the bank is unable to continue as a going
concern
ρCreditor recovery rateEndogenously calculatedSet to 30%, 50%, and 70% in robustness tests
θFire-sale markdown rateGroup-specific setting5%, 10%, 15%, and 20%
Maximum number of
iterations
Stopping limit for
contagion recursion
30 roundsPrevents infinite recursion in extreme cases
Table 3. Summary Statistics.
VariableNMeanStd. MinMedianMax
Total assets252010,656.3040,604.1437.551233.80488,217.46
Total liabilities25209836.8637,329.5832.681144.00448,344.80
Equity2520819.443294.832.3092.5139,872.66
Equity ratio25207.63%1.692.22%7.56%32.51%
Interbank assets2520685.042458.910.2662.8034,058.16
Interbank liabilities25201276.194436.04099.3661,145.20
External assets25208984.7434,509.8221.801004.00430,687.42
Loans25195601.1422,636.9621.50577.53276,137.81
Financial investments24992808.2810,670.140266.29141,535.76
Customer deposits25207341.0329,441.8330.78870.62348,369.73
Capital adequacy ratio243913.62%2.19−0.01%13.29%54.09%
Tier 1 capital ratio228611.40%2.233.96%11.00%53.14%
Core Tier 1 capital ratio240811.04%2.413.96%10.63%53.14%
Liquidity coverage ratio8082.13%2.040.76%1.69%48.26%
Provision coverage ratio24062.68%2.390.20%2.11%54.21%
ROE252011.12%5.38−23.30%10.83%35.72%
ROA25200.83%0.40−1.00%0.80%2.70%
Note: Monetary variables are measured in RMB 100 million; N denotes the number of valid observations.
Table 4. Main Characteristics of the Region-Constrained Minimum-Density Network.
IndicatorMeanMinimumMaximum
Number of banks210210210
Positive edges10,73710,66010,774
Network density0.24460.24290.2455
Same-province exposure share0.56960.51910.6178
Cross-regional exposure share0.00100.00060.0017
Liability scale factor0.55840.46550.9406
Max row error4.40 × 10−121.82 × 10−121.46 × 10⁻¹¹
Max column error3.33 × 10−121.82 × 10−125.46 × 10⁻¹²
Table 5. Annual Topological Indicators of the Interbank Contagion Network.
YearContagion Network DensityAverage Degree CentralityAverage Clustering CoefficientNumber of Effective Contagion Edges
20130.12350.18500.73045421
20140.13560.19490.75535953
20150.18550.23380.72788141
20160.22600.24500.76779921
20170.23580.24920.764810,351
20180.23940.24740.770410,506
20190.24110.24930.767710,582
20200.24140.24710.769510,594
20210.24300.24700.768210,667
20220.24320.24640.768710,675
20230.24340.24670.766910,681
20240.24550.24590.765810,777
Table 6. Contagion and Rescue Outcomes across Fire-Sale Markdown Rates.
IndicatorFire-Sale Markdown Rate
5%10%15%20%
No-Rescue AR0.20630.37210.53790.7037
Optimal-Rescue AR0.15460.30070.44690.593
Reduction in AR0.05170.07140.0910.1107
No-Rescue PD0.0047620.0047620.0047620.004764
Optimal-Rescue PD0.0041970.0041970.0041970.004197
Reduction in PD0.0005650.0005650.0005650.000567
Average Number of Defaulted Banks
under No Rescue
1.0001.0001.0001.000
Average Number of Defaulted Banks
under Optimal Rescue
0.8810.8810.8810.881
Reduction in the Number of Defaulted Banks0.1190.1190.1190.119
Average Optimal Internal Rescue Share35.42%35.42%35.42%35.42%
Table 7. Annual Optimal Rescue Strategies under the Baseline Parameter Setting.
YearStrategyInternal ShareARPDAvg.
Defaulted Banks
Avg.
Contagion Rounds
Risk
Constraint: PD ≤ 5%
2013Mixed Rescue (55%)55%0.17830.0025170.5291.529Yes
2014Mixed Rescue (50%)50%0.18350.0025850.5431.543Yes
2015Mixed Rescue (55%)55%0.25240.0035370.7431.743Yes
2016Mixed Rescue (50%)50%0.30170.0042180.8861.886Yes
2017Mixed Rescue (45%)45%0.32270.0045120.9481.948Yes
2018Mixed Rescue (35%)35%0.33120.0046260.9711.971Yes
2019Pure External Rescue0%0.34280.0047170.9901.990Yes
2020Mixed Rescue (35%)35%0.33630.0046940.9861.986Yes
2021Mixed Rescue (30%)30%0.33690.0047170.9901.990Yes
2022Mixed Rescue (35%)35%0.33930.0047390.9951.995Yes
2023Mixed Rescue (35%)35%0.34020.0047390.9951.995Yes
2024Pure External Rescue0%0.34310.0047621.0002.000Yes
Table 8. Annual Rescue Costs, Moral-Hazard Proxy, and Policy Index.
YearExternal Rescue Cost/EquityInternal Rescue Cost/EquityTotal Rescue Cost/EquityMoral-Hazard Proxy Policy Index
20130.0065520.0028890.0094410.0065522.3497
20140.0062260.0028700.0090960.0062262.3836
20150.0061320.0032320.0093640.0061322.4587
20160.0063580.0030600.0094180.0063582.4925
20170.0060800.0025940.0086740.0060802.4947
20180.0057690.0021060.0078750.0057692.4798
20190.0054180.0000000.0054180.0054182.1043
20200.0054200.0018450.0072640.0054202.4958
20210.0052580.0017800.0070380.0052582.4765
20220.0054120.0018820.0072940.0054122.4937
20230.0055440.0019660.0075100.0055442.4900
20240.0055370.0000000.0055370.0055371.7330
Table 9. Representative Candidate Rescue Strategies under the Baseline Setting.
Candidate StrategyInternal Rescue ShareARPDAvg.
Defaulted Banks
External Rescue Cost/
Equity
Internal Rescue Cost/
Equity
Moral-Hazard ProxyPolicy
Index
Pure External Rescue0%0.34010.0046410.9750.0058890.0000000.0058892.6889
Mixed Rescue (25%)25%0.31880.0044430.9330.0058800.0020100.0058803.0526
Mixed Rescue (35%)35%0.30780.0043030.9040.0058650.0022380.0058652.5896
Mixed Rescue (50%)50%0.30010.0041990.8820.0058150.0023560.0058152.4757
Mixed Rescue (55%)55%0.29990.0041950.8810.0058030.0023690.0058032.4733
Mixed Rescue (75%)75%0.29990.0041950.8810.0057850.0023870.0057852.4753
Pure Internal Rescue100%0.35850.0047340.9940.0000000.0023910.0000002.6838
Table 10. Loss Decomposition of EN-GLT Risk Contagion Channels.
IndicatorFire-Sale Markdown Rate
5%10%15%20%
No-Rescue EN Loss/Equity0.0008370.0008370.0008370.000837
No-Rescue GLT Loss/Equity0.002440.0048790.0073190.009759
No-Rescue Total Contagion Loss/Equity0.0032770.0057160.0081560.010596
Optimal-Rescue EN Loss/Equity0.0001910.0001910.0001910.000191
Optimal-Rescue GLT Loss/Equity0.0023030.0046060.0069080.009211
Optimal-Rescue Total Contagion Loss/Equity0.0024940.0047970.00710.009402
Table 11. Robustness Test Results for the Creditor Recovery Rate.
Creditor Recovery RateNo-Rescue AROptimal-Rescue ARReduction
in AR
Average Optimal
Internal Rescue Share
30%0.58210.48490.09720.4469
50%0.53390.44270.09130.4375
70%0.48610.41170.07440.4375
Table 12. Rescue Effects by Bank Type.
Measure/Bank TypeCity Commercial BanksJoint-Stock BanksRural Commercial BanksLarge State-Owned Banks
Number of Initially Shocked Banks90111036
No-Rescue AR0.38410.41270.35900.3416
Optimal-Rescue AR0.29390.32010.30740.3209
Reduction Rate in AR22.14%19.97%13.93%5.99%
No-Rescue PD0.0047620.0047620.0047620.004762
Optimal-Rescue PD0.0040610.0041130.0042960.004696
Avg. Defaulted Banks under
No Rescue
1.0001.0001.0001.000
Avg. Defaulted Banks under
Optimal Rescue
0.8530.8640.9020.986
Average Optimal Internal Rescue Share38.75%92.08%18.75%45.42%
External Rescue Cost/Equity0.0019160.0063120.0006230.064622
Internal Rescue Cost/Equity0.0007880.0165260.0001140.021037
Table 13. Comparison of Different External Rescue Mechanisms.
MeasureGovernment Capital InjectionDeposit Insurance SupportLiquidity Guarantee
AR0.30070.32060.2742
PD0.0041970.0047340.004734
Avg. Defaulted Banks0.8810.9940.994
External Rescue Cost/Equity0.0058090.0013580.000679
Internal Rescue Cost/Equity0.0020190.0014280.001428
Moral-Hazard Proxy0.0058090.0013580.000679
Policy Index2.37101.66031.7048
Average Optimal Internal
Rescue Share
35.42%50.00%50.00%
Disclaimer/Publisher’s Note: The statements, opinions and data contained in all publications are solely those of the individual author(s) and contributor(s) and not of MDPI and/or the editor(s). MDPI and/or the editor(s) disclaim responsibility for any injury to people or property resulting from any ideas, methods, instructions or products referred to in the content.