Article

Unlocking Green Potential: The External Enablement of Digital Infrastructure Development on Urban Green Competitiveness

1
School of Economics and Management, Northeast Forestry University, Harbin 150040, China
2
Department of Public and International Affairs, City University of Hong Kong, Hong Kong 999077, China
*
Author to whom correspondence should be addressed.
Systems 2026, 14(7), 844; https://doi.org/10.3390/systems14070844
Submission received: 29 May 2026 / Revised: 11 July 2026 / Accepted: 14 July 2026 / Published: 16 July 2026

Abstract

In the era of carbon neutrality, urban competition has evolved from single-dimensional economic rivalry to multidimensional competition emphasizing green and sustainable development. However, it remains unclear whether digital infrastructure, the physical backbone of the digital economy, can externally enhance urban green competitiveness. Building on the measurement of urban green competitiveness through the super-efficiency SBM model, this study employs the “Broadband China” policy as an exogenous shock and uses a Staggered difference-in-differences (SDID) model to systematically analyze the impact and mechanisms of digital infrastructure on urban green competitiveness. The SDID model is adopted in this study for the following reason: the Broadband China strategy constitutes a phased rollout policy shock. By treating this policy as a quasi-natural experiment, the SDID framework enables more accurate identification of its causal impact on urban green competitiveness. The results show that the construction of digital infrastructure significantly promotes urban green competitiveness. Further analysis reveals that digital infrastructure enhances green competitiveness primarily through green technological innovation, industrial upgrading, and economic agglomeration, with the effect of economic agglomeration being stronger than that of the other two channels. Heterogeneity analysis shows that moderate government intervention amplifies the green effects of digital infrastructure. Moreover, the direct effect of digital infrastructure on green competitiveness is more significant in western cities than in eastern and central cities. This study provides empirical evidence for optimizing digital infrastructure development and achieving a “dual drive” of digitalization and green transformation.

1. Introduction

In the current stage of global economic development, the focus has shifted towards high-quality growth, with energy conservation and emission reduction becoming essential components of economic advancement [1]. Consequently, urban competition is gradually transitioning towards green competitiveness centered on efficiency improvement and carbon reduction, making it imperative to accelerate the construction of an ecological civilization. Nevertheless, cities still face a range of practical challenges in pursuing green development, including fragmented governance, weak institutional design, and lack of capacity for integrated green innovation [2]. Against this backdrop, the development of digital infrastructure offers a novel pathway to enhance urban green competitiveness. However, existing research on digital infrastructure primarily emphasizes its economic effects [3], leaving it unclear whether digital infrastructure can externally empower cities’ green competitiveness. Thus, several critical questions arise: Can digital infrastructure development, as exemplified by the implementation of the “Broadband China” strategy, drive urban green transformation? If so, through what mechanisms does it enhance green competitiveness? Are there heterogeneous effects across different cities? Addressing these questions holds significant theoretical and practical implications for advancing the construction of a digital ecological civilization. The development of digital infrastructure, driven by new development philosophies and technological innovation, leverages production factors such as knowledge and information as well as information technology to offer new pathways for cities undergoing green transformation.
Relevant literature in this area can be broadly categorized into two main strands. The first strand explores the environmental implications of digital infrastructure. A growing body of research affirms its positive role in enhancing environmental performance through mechanisms such as energy efficiency improvements [4], low-carbon economic restructuring [5], the promotion of green innovation [6], and pollution control via digital monitoring systems [7]. However, some studies caution that the rapid expansion of digital infrastructure, particularly data centers and high-frequency computation, can substantially increase electricity consumption and carbon emissions, potentially offsetting its environmental benefits [8,9].
The second strand focuses on the determinants of urban green competitiveness. At the macro level, scholars have highlighted the significance of industrial clustering [10], green technological capability [11], and the design of environmental regulations [12]. At the micro level, firm-level factors such as innovation orientation [13], carbon pricing and emissions trading systems [14], and corporate governance quality [15] have also been shown to influence urban green performance.
Overall, prior studies provide important insights for this research. However, existing studies often focus on the impact of digital infrastructure on single environmental dimensions and lack a holistic evaluation framework linking digital infrastructure with urban green development. Moreover, measuring urban green competitiveness is inherently complex. Previous studies have mainly employed indicators such as energy emission intensity and green infrastructure levels, which are susceptible to subjectivity. Therefore, building on existing research, this study refines the measurement of urban green competitiveness using the super-efficiency SBM model and non-radial directional distance functions, and constructs a comprehensive evaluation system based on panel data from 285 Chinese cities spanning 2005–2021. Furthermore, this study integrates green technological innovation, industrial upgrading, and economic agglomeration into a unified analytical framework to explore the impact mechanisms of digital infrastructure on urban green competitiveness.
Compared to the existing literature, this study offers the following marginal contributions: First, under the rapid development of digitalization and green transformation, it systematically incorporates economic, technological, and ecological dimensions into a unified analytical framework and evaluates the mechanisms and effects of digital infrastructure on urban green competitiveness from both direct and indirect perspectives, thereby extending research on the economic consequences of digital infrastructure construction and the driving factors of urban green competitiveness. Second, unlike studies relying on single indicators to measure urban green competitiveness, this study constructs a super-efficiency SBM model to provide a more comprehensive and objective evaluation system, thereby addressing gaps in prior research, which further enriches the extant literature on the measurement of urban green competitiveness. Third, by considering heterogeneity dimensions such as the degree of government intervention and geographical location, this study examines the differentiated impacts of digital infrastructure on urban green competitiveness across cities with varying policy environments and resource endowments, offering empirical evidence for optimizing digital infrastructure deployment tailored to local conditions.
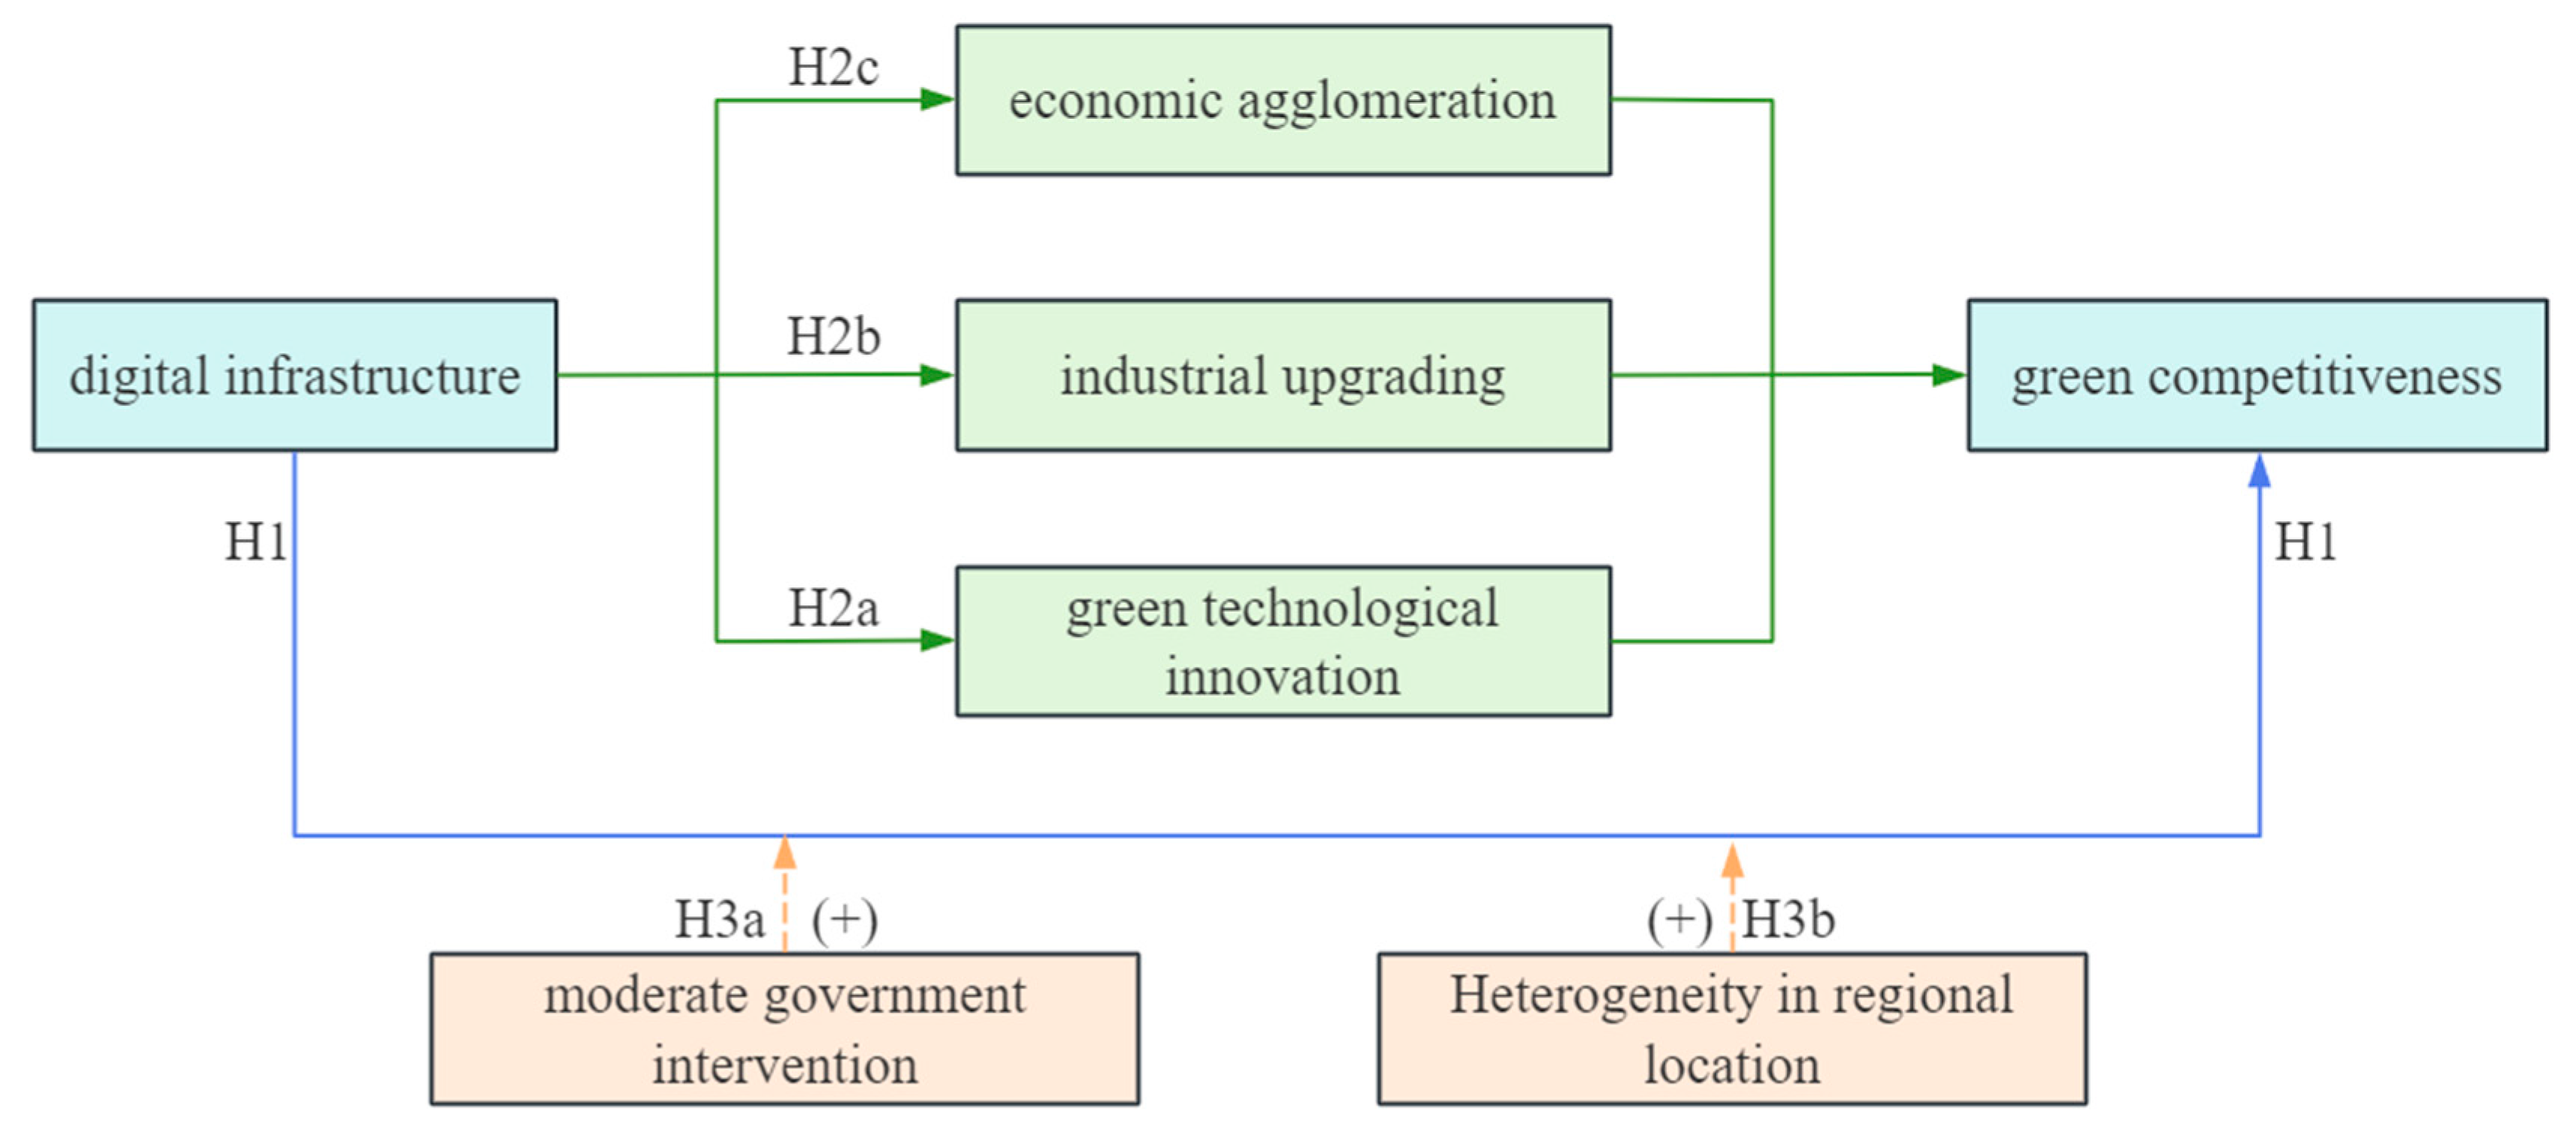
The Conceptual framework is shown in Figure 1.

2. Theoretical Hypotheses

2.1. The Direct Mechanism: How Digital Infrastructure Empowers Urban Green Competitiveness

Compared with traditional infrastructure, digital infrastructure serves as a critical foundation for technological development and innovation, playing a vital role in enhancing resource efficiency, reducing energy consumption, and improving pollution control.
From a production perspective, digital infrastructure facilitates the adoption of technologies such as the internet and big data, enabling enterprises to optimize production processes, improve efficiency and resource utilization, and reduce waste and emissions [16]. In agriculture, digital technologies help minimize ecological impacts and enhance sustainability. From a lifestyle perspective, digital infrastructure decouples information from physical carriers, reshaping traditional lifestyles. Digital communication and remote work reduce the need for travel, thus cutting emissions [17]. Additionally, digital platforms raise public awareness of environmental issues, improve transparency in corporate and governmental behaviors, and promote high-quality green development.
Additionally, the improvement of digital infrastructure has brought about significant changes in environmental governance technologies and models [18]. The structure of environmental regulation has shifted from single-agency supervision to multi-sectoral coordinated governance, and pollution control has evolved from fragmented to integrated approaches, significantly enhancing governance efficiency [19]. Digital infrastructure helps build an open and transparent communication platform among governments, enterprises, and the public, making it possible to establish a vertically integrated and horizontally coordinated environmental governance system. This transformation effectively breaks down information barriers, overcomes the fragmentation in ecological governance, and promotes urban green competitiveness. According to the above theoretical analysis, we propose the following hypothesis:
Hypothesis 1. 
Digital infrastructure development significantly enhances urban green competitiveness.

2.2. The Indirect Mechanisms

2.2.1. Green Technological Innovation

The construction of digital infrastructure contributes to the promotion of green technological innovation, mainly by enhancing information exchange, resource integration, and innovation dynamism [20]. First, digital infrastructure reduces the cost of information exchange and improves the efficiency of interactions among economic agents within cities, thereby lowering the costs of resource discovery and transactions. This reduction in cost facilitates faster knowledge dissemination and absorption, strengthens collaboration among innovation entities, and enhances the vitality of digital technological innovation activities in urban areas, thus providing strong support for technological advancement.
Second, digital infrastructure significantly improves cities’ capacity to integrate resources and promotes the formation of efficient innovation networks. The development of digital infrastructure enhances the efficiency of data collection, processing, and transmission, thereby bolstering the resource integration capabilities of innovation entities [21]. In addition, digital technologies overcome spatial and temporal constraints, facilitate cross-regional resource sharing and collaboration, and help strengthen cooperation among innovation actors, further increasing the fluidity of information and laying a solid foundation for digital innovation in cities [22].
Finally, digital infrastructure effectively broadens innovation opportunities and significantly boosts the dynamism of urban digital technology innovation. It provides entrepreneurs with more convenient access to information, improves the accuracy of information capture, reduces innovation costs, and stimulates enthusiasm for innovation [23]. Meanwhile, with the widespread adoption of digital technologies such as 5G and artificial intelligence, innovation actors can obtain diversified technological information at low cost, enhancing their sensitivity in decision-making, strengthening the local innovation climate, and promoting knowledge dissemination and collaboration [24]. This reduces R&D risks and drives the output of urban digital innovation, injecting new momentum into sustainable urban development. Digital technological innovation offers reliable technical support for energy conservation and emission reduction, thereby playing a positive role in the construction of a digital ecological civilization. Based on the above theoretical analysis, we propose the following hypothesis:
Hypothesis 2a. 
Digital infrastructure promotes green competitiveness through green technological innovation.

2.2.2. Industrial Upgrading

The development of digital infrastructure contributes to industrial upgrading, primarily through technological penetration and the optimization of resource allocation. From the perspective of technological penetration, digital infrastructure, with its efficiency, precision, and intelligence, integrates deeply into the transformation and upgrading of traditional industries, significantly enhancing their productivity and reducing urban carbon emissions [5]. In addition, the construction and improvement of digital infrastructure have given rise to emerging industries such as the Internet of Things and artificial intelligence. These industries are characterized by high knowledge intensity, advanced technological content, and low environmental impact, gradually becoming new growth drivers and leading forces in industrial restructuring due to their unique competitive advantages and growth potential [25].
From the perspective of resource allocation optimization, supported by digital technologies, firms can more accurately forecast market demand and align resource supply accordingly, thus avoiding inefficient resource allocation [26]. In addition, the development of digital infrastructure enhances information exchange and resource sharing across industries, effectively reducing transaction costs and information asymmetry, and improving the overall coordination efficiency of industrial chains [27]. Together, technological penetration and resource optimization jointly facilitate the upgrading and optimization of the industrial structure. Industrial upgrading represents a shift from labor- and capital-intensive industries to knowledge- and technology-intensive sectors [28]. In the digital era, this transformation not only accelerates the digital upgrading of emerging industries, but also promotes the digital and green transformation of traditional industries, thereby contributing positively to the construction of ecological civilization. In line with the theoretical analysis, we propose the following hypothesis:
Hypothesis 2b. 
Digital infrastructure promotes green competitiveness through industrial upgrading.

2.2.3. Economic Agglomeration

The development of digital infrastructure facilitates economic agglomeration through three primary channels: reduced transaction costs, enhanced knowledge spillovers, and optimized factor allocation. First, with the improvement of digital infrastructure, market participants can leverage digital technologies such as big data analytics to determine optimal logistics routes [29]. This enables goods to be transported with lower transaction costs and higher time efficiency, thereby enhancing the intensity of economic agglomeration. Second, digital infrastructure fosters the exchange and sharing of existing knowledge among enterprises, while also promoting the creation and accumulation of new knowledge through internet-based platforms and other digital media [30]. Finally, the development of digital infrastructure improves the matching of resource supply and demand, increasing the level of factor sharing in agglomerated areas [31]. Under conditions of economic agglomeration, once a particular segment of the industrial chain incorporates green attributes, the overall green competitiveness of the urban economy is likely to improve. Based on the above theoretical analysis, we propose the following hypothesis:
Hypothesis 2c. 
Digital infrastructure promotes green competitiveness through economic agglomeration.

2.3. The Heterogeneous Mechanisms

2.3.1. Government Intervention

As the primary provider of public services within a region, the government’s policy guidance and governance actions inevitably influence the development of digital infrastructure to varying degrees. Government intervention includes both the strategic planning of industrial layouts and the policy-driven allocation of digital resources [32]. Moderate relaxation of government control can enhance the efficiency of resource allocation, foster healthy competition among industries, and create pressure on firms to innovate in products and services, thereby facilitating the emergence of new industries and business models. However, if the government fails to maintain a proper balance and the degree of intervention exceeds a certain threshold, the efficiency of market-based resource allocation may decline [33]. Excessive intervention can hinder optimal resource distribution and technological innovation, thereby undermining the environmental benefits that digital infrastructure is expected to deliver. In light of the above theoretical analysis, we propose the following hypothesis:
Hypothesis 3a. 
Reasonable government intervention strengthens the green effects of digital infrastructure.

2.3.2. Regional Differences

The environmental effects of digital infrastructure may vary across cities with different policy orientations and resource endowments. From the perspective of policy direction and resource availability, the western region of China, supported by its natural geographical advantages and strong government backing, possesses abundant hydropower resources and enjoys favorable policy conditions [34]. These advantages make it an ideal location for energy-intensive digital storage and computing centers. However, the foundation for digital application in western cities remains relatively weak, meaning that green digital policies are more likely to stimulate the regional “late-mover advantage” in green development. In contrast, the eastern region, as the economic engine of China, has a well-developed industrial and service sector. Its robust economic development and strong market demand provide powerful momentum and a wide range of application scenarios for the construction of digital infrastructure [35]. Nonetheless, since digitalization in eastern cities began earlier and is more advanced, the policy dividends of green digital transformation may have already been largely realized. Based on the above theoretical analysis, we propose the following hypothesis:
Hypothesis 3b. 
The green effect of digital infrastructure is more significant in western cities than in eastern and central cities.
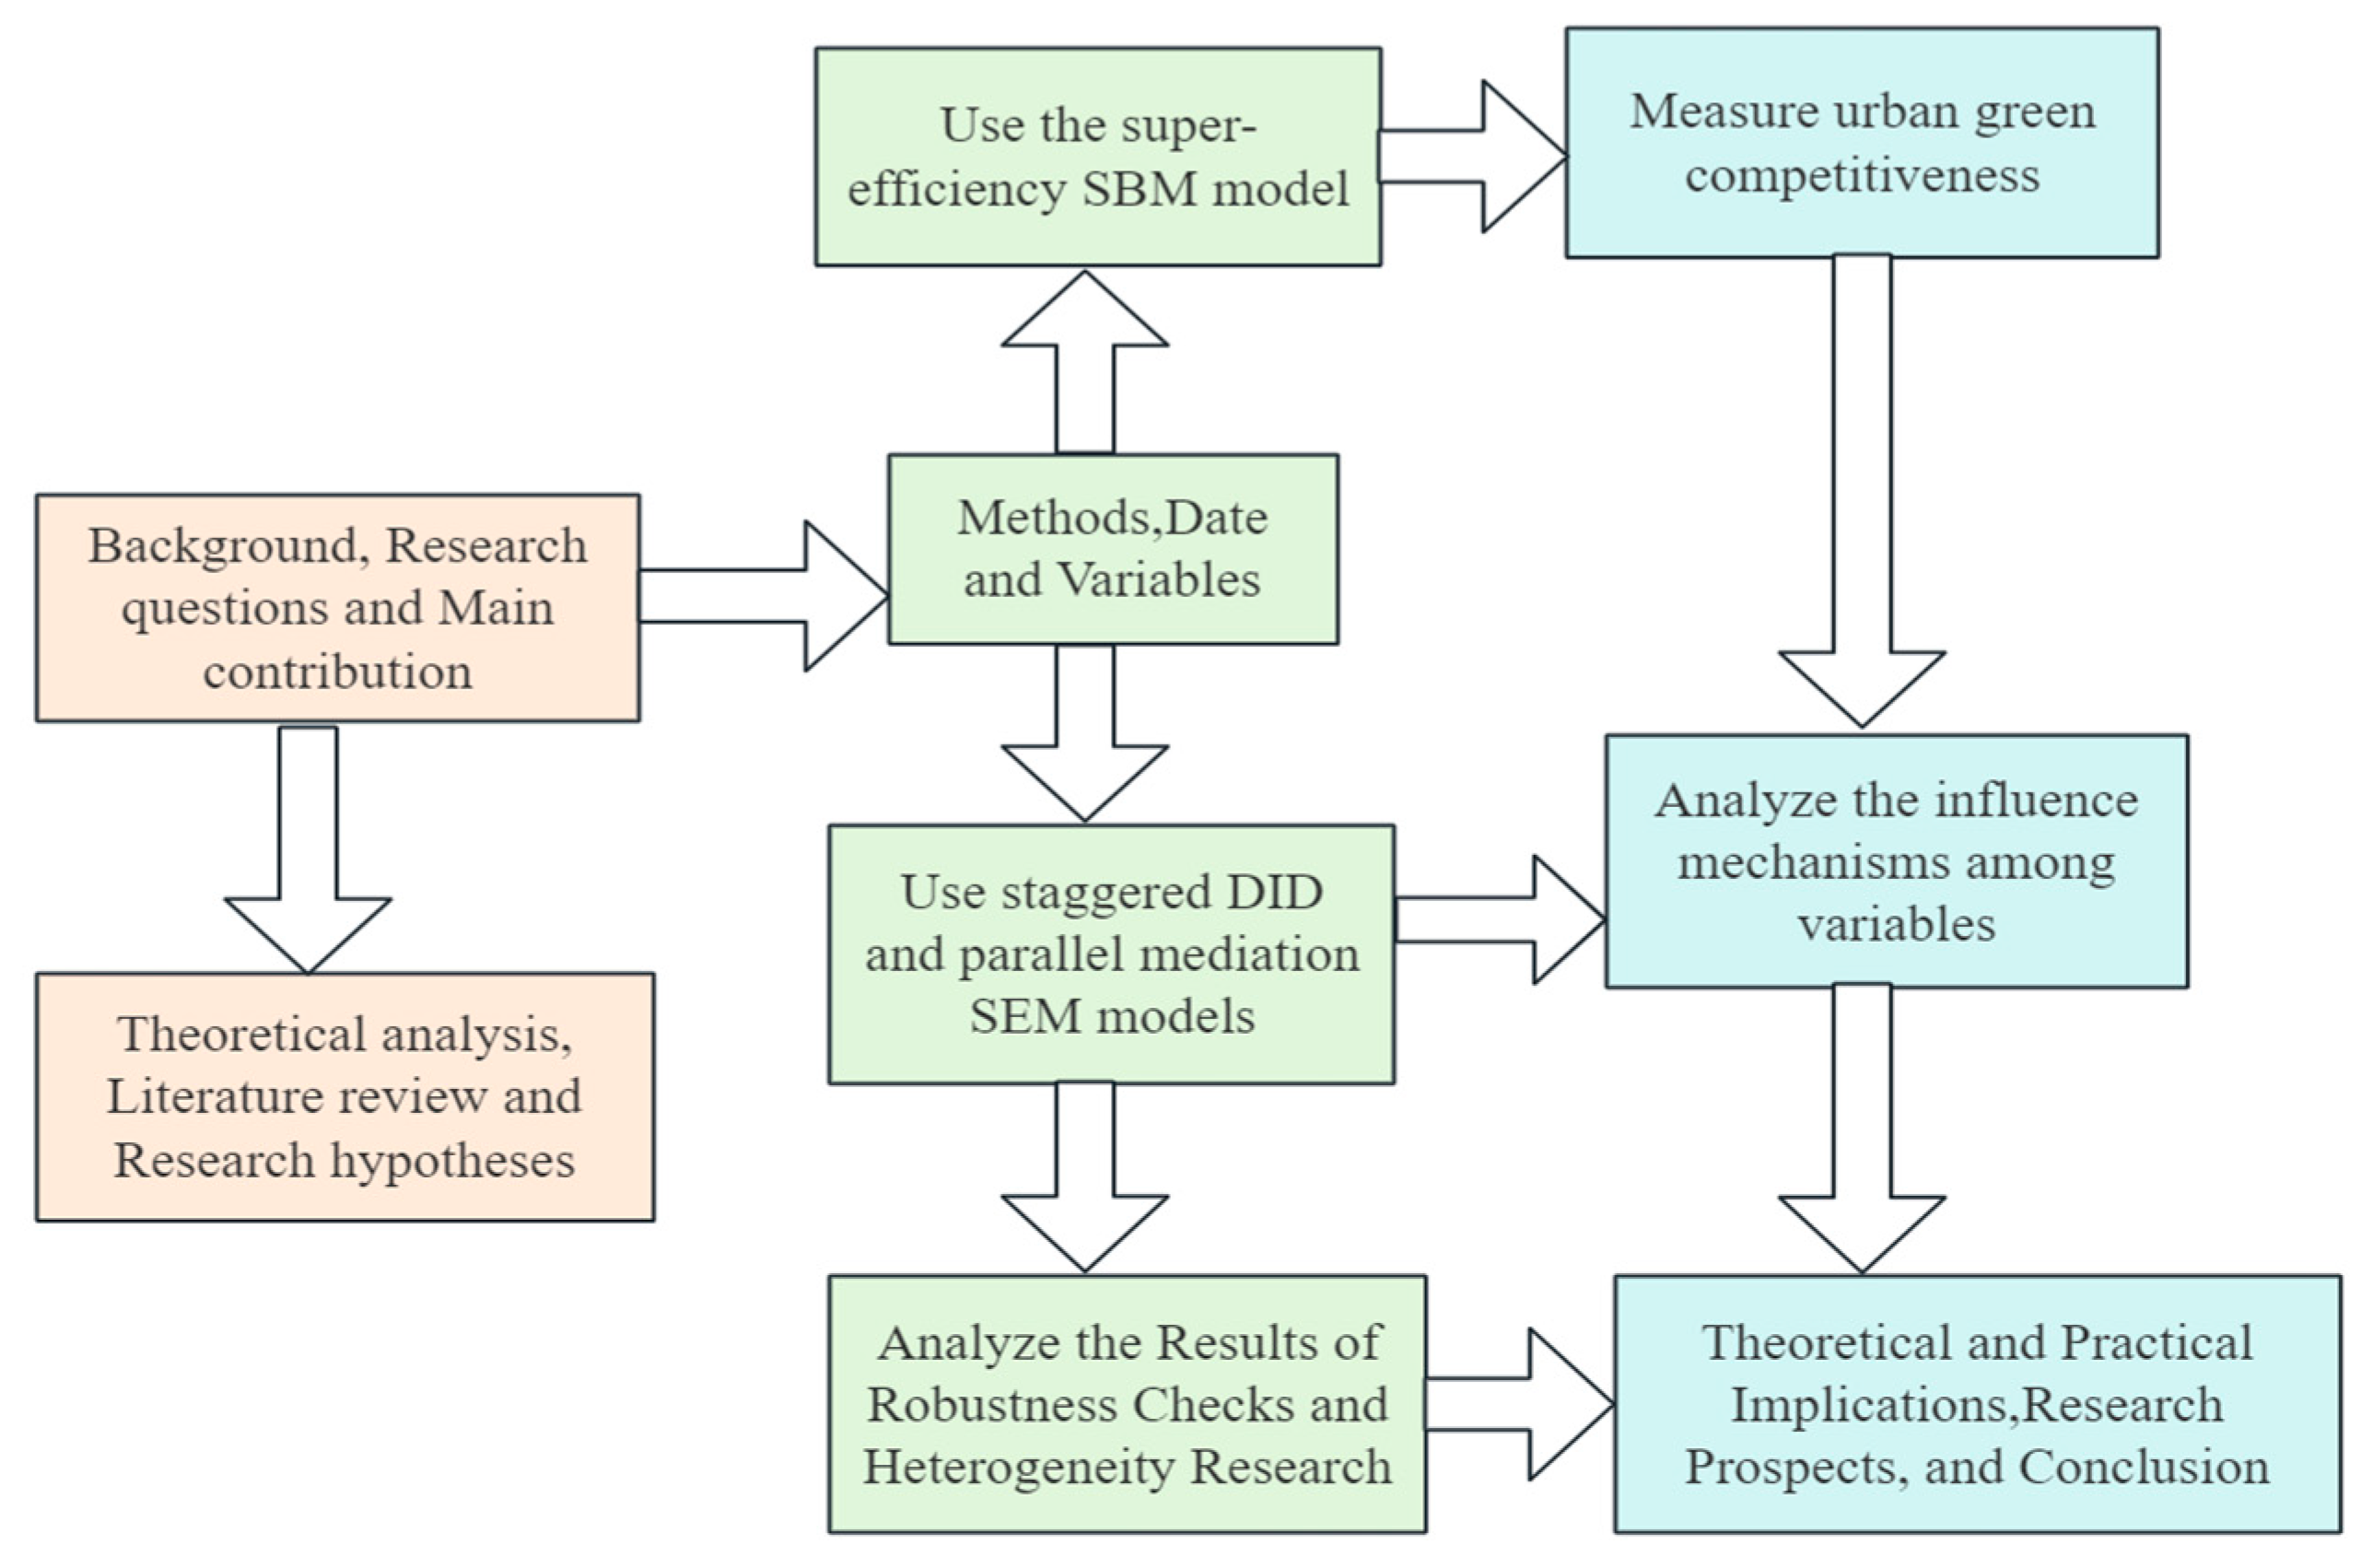
The research framework is shown in Figure 2.

3. Methodology

3.1. Identification Strategy

We construct a Staggered difference-in-differences (SDID) model based on the “Broadband China” policy as an exogenous shock:
U G C i t = α 0 + α 1 Dig i t + α c Control i t + μ i + δ t + ε i t
where i indexes city and t indexes year. The dependent variable U G C i t represents the green competitiveness of city i in year t. The variable Dig i t is a dummy variable indicating whether city i was designated as a pilot city under the “Broadband China” strategy in year t; it takes the value of 1 if selected and 0 otherwise. The coefficient α 1 is the key parameter of interest, capturing the policy’s implementation effect. Control i t represents control variables. μ i and γt are city and year fixed effects. ε i t is the error term.

3.2. Variables

3.2.1. Dependent Variable

Urban green competitiveness (UGC) serves as the dependent variable in this study. Drawing on Tone (2002) [36] and Li et al. (2018) [37], we construct both a super-efficiency SBM model and a non-radial distance function to analyze energy-saving emission-reduction efficiency and measure urban green competitiveness, respectively. Following Tone (2002) [36], the specific formulation and computational steps of the super-efficiency SBM model are constructed as follows.
Assume there are n decision-making units (DMUs), with L types of input indicators, M types of desirable output indicators, and N* types of undesirable output indicators. These can be represented in vector form as: x S L , y a S M , y b S N , x , y a and y b takes the form of a matrix. X = x 1 x n S L × 1 , Y a = y 1 a y n a S M × 1 , Y b = y 1 b y n b S N × 1 .
The construction of the super-efficiency SBM model is as follows:
ρ = min 1 1 L l = 1 L S l x x k l t 1 + 1 M + 1 m = 1 M S m y y k m t + n = 1 N S n b b k n t
s . t . k = 1 , k j K Z k t x k l t + s l x = x k l t , l = 1 , , L k = 1 , k j K Z k t x k l t + s m y = y k l t , m = 1 , , M k = 1 , k j K Z k t x k n t + s n b = b k n t , n = 1 , N Z k t 0 , s l x 0 , s m y 0 , s n b 0 , k = 1 , . K
x k l t , y k l t , b k n t respectively denote the values of the k-th DMU for the l-th input, m-th desirable output, and n-th undesirable output in period t. The slack variables S 1 x , S m y , S n b , are used to measure inefficiency in inputs and outputs. If a slack variable is greater than zero, it indicates that production has not reached its potential level. Specifically: Input slack implies that inputs can be reduced without affecting output levels. Desirable output slack suggests room for increased production. Undesirable output slack reflects potential reductions in pollution or waste. Optimizing these slack variables can improve DMU efficiency.
Following Li et al. (2018) [37], this study constructs a non-radial directional distance function (NDDF) to evaluate urban green competitiveness. As shown in Table 1, we assign equal weights to all input–output factors in the absence of prior information. To isolate inefficiencies in capital and labor, their weights are set to 0, while weights for desirable output, energy input, and undesirable outputs are each set to 1/3. The super-efficiency SBM model is then applied to calculate: (1) The potential expansion ratio of GDP; (2) the possible reduction ratios for energy inputs and pollution emissions. The urban green competitiveness index is formulated as:
U G C i t = 1 2 ( E i t β E , i t * E i t ) ( G i t + β G , i t * G i t ) E i t G i t + 1 6 U = W , S , D ( U i t β U , i t * U i t ) ( G i t + β G , i t * G i t ) U i t G i t
Here, β E , β G , β W , β S , β D represent the optimal solutions derived from the super-efficiency SBM model. A higher value of these solutions indicates stronger green competitiveness.

3.2.2. Core Independent Variable

This paper treats the “Broadband China” pilot policy as a quasi-natural experiment to measure digital infrastructure development (DID). Cities designated as “Broadband China” pilot zones are assigned a value of 1, while non-pilot cities are assigned 0.

3.2.3. Control Variables

To ensure the accuracy of policy effect estimation, this study controls for other factors that may influence urban green competitiveness with reference to previous studies [45,46]: (1) Education investment (EDU): Measured by the logarithmic ratio of education expenditure; (2) R&D investment (RDI): Measured by the logarithm of science and technology expenditure; (3) urban pollution level (POL): Measured using sulfur dioxide (SO2) emissions; (4) economic development level (GDP): Measured by per capita GDP; and (5) financial development level (FID): Measured by the logarithm of year-end deposit and loan balances at the provincial level.

3.3. Data and Sample

This study is based on a panel dataset of 285 prefecture-level cities in China covering the period from 2005 to 2021. The primary data sources include the China City Statistical Yearbook, the China Statistical Yearbook, and the statistical yearbooks of individual prefecture-level cities. Missing values are supplemented using interpolation methods. For monetary variables, all values are deflated using price indices with 2005 as the base year. Since city-level price indices are unavailable, the corresponding provincial-level indices are used as proxies. To mitigate the influence of outliers on the regression results, all variables are winsorized at the 1% level on both tails. Additionally, to address potential heteroscedasticity, all monetary variables are transformed into logarithmic form. Descriptive statistics for the key variables are presented in Table 2.

4. Results

4.1. Baseline Regression Results

Table 3 presents the results of the baseline Staggered DID model. Column (4), which includes both city and year fixed effects, serves as the baseline regression model. After progressively introducing city and year fixed effects, the coefficient of digital infrastructure development remains significantly positive at the 1% level, indicating that the “Broadband China” policy significantly enhances urban green competitiveness. And the coefficient suggests that cities implementing the policy of “Broadband China” achieve a 0.0307-unit increase in green competitiveness compared to non-pilot cities, confirming Hypothesis H1.

4.2. Robustness Checks

4.2.1. Alternative Measures of Digital Infrastructure Development

We attempt to establish a more comprehensive index system for measuring digital infrastructure development, thereby replacing the core independent variable in the baseline regression and conducting a renewed empirical analysis. Following the extant studies [45], a multidimensional index system is constructed as shown in Table 4, which includes various dimensions such as communication infrastructure, the level of optical fiber construction, internet penetration rate, and the proportion of internet users. This comprehensive index system aims to more fully and accurately capture the impact of digital infrastructure development on urban green competitiveness. The results can be seen in Column (1) of Table 5, which indicate that the role of digital infrastructure development in empowering urban green competitiveness remains significant, verifying the robustness of the baseline regression findings.

4.2.2. Sample Adjustment

The city sample we used in the baseline regression includes municipalities directly under the central government, which may lead to biased estimation results due to excessive disparities in economic development and administrative hierarchies among the sampled cities. Therefore, we exclude the samples of municipalities directly under the central government and conduct the regression analysis to reduce the bias when analyzing the development trends of urban green competitiveness. The results, as shown in Column (2) of Table 5, indicate that the role of digital infrastructure development in empowering urban green competitiveness remains significant and is consistent with the baseline regression results.

4.2.3. Dynamic Panel Model

To further validate the impact of digital infrastructure development on urban green competitiveness, we extend the baseline regression model to a dynamic panel model. Specifically, we employ both the Difference GMM (Arellano–Bond estimator) and System GMM (Blundell–Bond estimator) approaches to re-estimate this relationship. The estimation results, presented in Table 6, demonstrate that the regression coefficients for digital infrastructure development remain significantly positive under both GMM methods. These findings robustly confirm that digital infrastructure development exerts a significant positive effect on enhancing urban green competitiveness, thereby providing further empirical support for baseline findings.

4.2.4. Parallel Trend Test

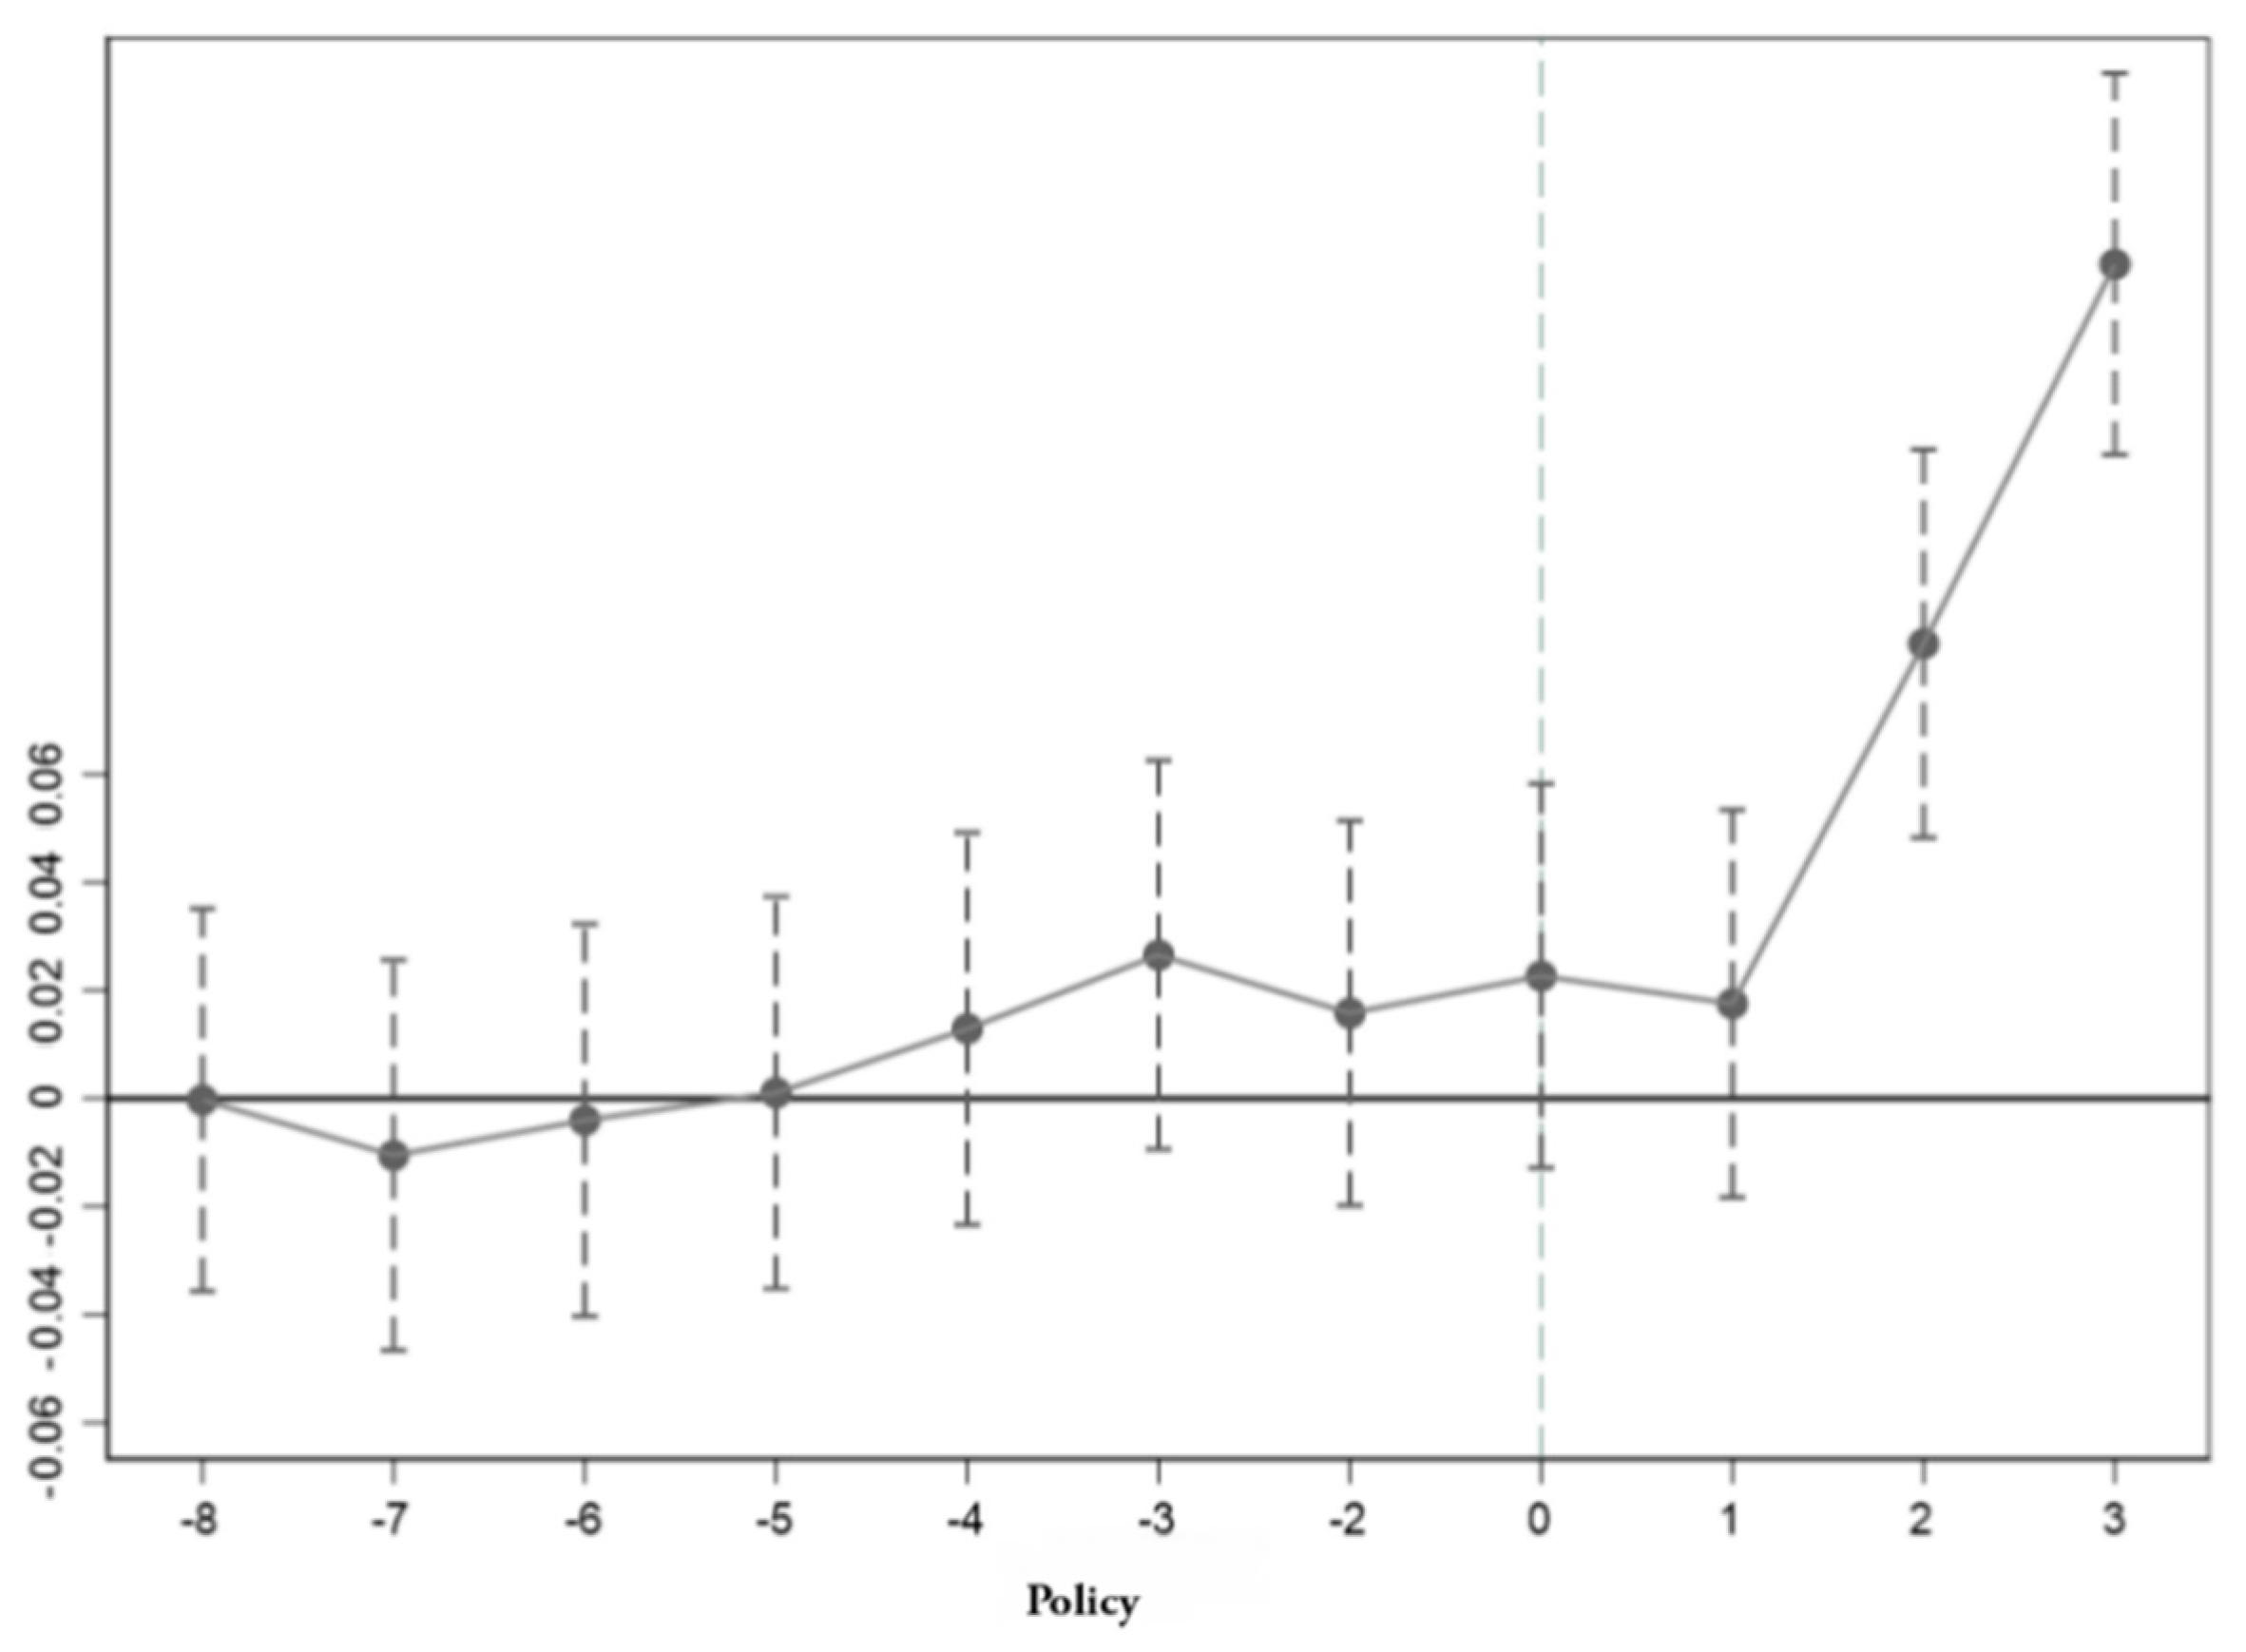
A fundamental assumption of the difference-in-differences approach is that the treatment and control groups must satisfy the parallel trends condition prior to policy implementation-meaning urban green competitiveness should follow similar trends between the two groups before the “Broadband China” pilot policy. Following
U G C = π 0 + k = 1 8 π k p r e k + ζ C u r r e n t + k = 1 3 π k p o s t k + π c C o n t r o l i t + μ i + ε t + δ
The variables pre k and post k represent the policy dummy variables before and after the implementation of the “Broadband China” pilot policy respectively, while Current is the policy dummy variable for the implementation period. The assignment rules are as follows: For the 11 periods before policy implementation: when k ≤ −8, all are set to pre 8   =   1 , otherwise pre k   =   1 else 0. For the 7 periods after policy implementation: when k ≥ 3, all are set to post 3   =   1 , otherwise post k = 1 else 0. During the policy implementation year, Current   =   1, else 0.
Figure 3 shows the regression coefficients and 95% confidence intervals for a series of policy dummy variables. As seen in Figure 3, before policy implementation, the coefficients for urban green competitiveness are all statistically insignificant (not significantly different from 0), indicating that the control and treatment groups followed parallel trends prior to the policy implementation. This demonstrates that our study satisfies the parallel trends assumption. Furthermore, after the policy implementation, we observed that the policy effect of digital infrastructure development on urban green competitiveness has intensified over time, demonstrating the dynamic impact of the policy.

4.2.5. DID Decomposition

Although the results of the baseline regression indicate that digital infrastructure development can significantly enhance urban green competitiveness, and the parallel trend test also supports this conclusion, the inconsistency in the years when different cities implemented the “Broadband China” pilot policy, coupled with the time-dependent effects of the policy, may prevent the use of a staggered difference-in-differences model from completely eliminating estimation biases. Therefore, we adopt the DID decomposition method proposed by Goodman-Bacon [47] and decompose the DID estimation coefficients from the baseline regression into three components: the first group, the DID estimation coefficients and weights between early “Broadband China” pilot cities as the treatment group and later pilot cities as the control group; the second group, the DID estimation coefficients and weights between later “Broadband China” pilot cities as the treatment group and early pilot cities as the control group; and the third group, the DID estimation coefficients and weights between all cities that became “Broadband China” pilots as the treatment group and cities that never participated in the program as the control group. The second component is the root cause of deviations in the estimation results regarding the green competitiveness effect of digital infrastructure development, as early pilot cities had already implemented the “Broadband China” policy but were included in the control group solely due to unchanged treatment status. The DID estimation coefficient from the baseline regression represents a weighted average of these three component coefficients and their respective weights, which are primarily determined by within-group conditional variance and sample size. Group (1) corresponds to the first group, indicating the policy effects and weights of the early-treatment group relative to the late-treatment group; Group (2) corresponds to the second group, showing the estimation biases and weights between the late-treatment group and the early-treatment group; Group (3) corresponds to the third group, representing the policy effects and weights of the treatment group compared to the control group.
The results of the DID decomposition are presented in Table 7. The second group accounts for only 3.1% of the total weight, with a DID estimation coefficient of 0.006, indicating the magnitude of the actual impact of deviations from “Broadband China” pilot policies on urban green competitiveness. The third group carries the highest weight and also exhibits the largest DID estimation coefficient, suggesting that the effect of digital infrastructure development on urban green competitiveness is primarily driven by pilot policies. After incorporating control variables, the magnitude of the time-varying impact of digital infrastructure development on urban green competitiveness becomes observable; the estimation bias stems from the interaction between these two groups (Group (2)), although its contribution is relatively small. The time-varying group (Group (1)) contributes approximately 11.3%, while Group (3) remains the dominant component with a weight of 83.8%. These findings do not contradict those of the baseline regression, thereby further validating its robustness.

5. Further Studies

5.1. Mechanism Test

Based on the preceding theoretical analysis, this study employs a structural equation modeling (SEM) approach to construct a multiple mediation model that simultaneously incorporates three mediators: green technology innovation, industrial structure upgrading, and economic agglomeration. The parallel multiple mediation model is specified as follows:
GTI it   =   α 0   +   a 1 DID it   +   α j Control   it   +   μ i   +   v t   +   ζ it
L . INDA it = β 0   + a 2 DID it   + β j Control   it   + μ i + v t   + ζ it
AGG it = γ 0   + a 3 DID it   + γ j Control   it   + μ i   + v t   + ζ it
UGC it =   θ 0   + c 1 DID it   + b 1 GTI it   + b 2 L . INDA it + b 3 AGG it + θ j Control it   + μ i + v t   + τ it
The second equation uses industrial structure upgrading with a one-period lag as the dependent variable, because previous findings show that industrial restructuring exhibits creative destruction characteristics and its positive effect on urban green competitiveness manifests with a time lag. Based on the coefficients from the above model, the mediation effects for multiple pathways can be calculated. The calculation methods for mediation effects, direct effects, and total effects are as follows:
Mediation   effect   =   a 1   ×   b 1   +   a 2   ×   b 2   +   a 3   ×   b 3
Direct   effect = c
Total   effect = a 1   ×   b 1   + a 2   ×   b 2   + a 3   ×   b 3   + c
Columns (1)~(3) of Table 8 present the regression results of digital infrastructure development on green technology innovation, industrial structure upgrading, and economic agglomeration, respectively. The results demonstrate that the development of digital infrastructure can enhance green technology innovation, industrial structure upgrading, and economic agglomeration, with the strongest effect observed on economic agglomeration. Column (4) shows the regression results of digital infrastructure development on urban green competitiveness after incorporating the three mediating variables. The findings indicate that green technology innovation, industrial structure upgrading, and economic agglomeration all contribute to the improvement of urban green competitiveness to varying degrees, with economic agglomeration exhibiting the most significant promoting effect.

5.2. Heterogeneity Analysis

5.2.1. Heterogeneity in Government Intervention Intensity

To investigate whether the impact of digital infrastructure development on urban green competitiveness differs across varying levels of government intervention, this study categorizes all sample cities into low, medium, and high government intervention groups and conducts separate regressions for each subgroup. Table 9 presents the regression results of heterogeneity in government intervention intensity, showing the impact of digital infrastructure development on urban green competitiveness under different levels of government intervention. The results demonstrate that the government plays a crucial role in enabling digital infrastructure to enhance urban green competitiveness. Moderate government intervention can balance the promoting effects of digital infrastructure (stimulating corporate R&D innovation and generating “innovation compensation”) and its inhibiting effects (diverting resources to pollution control, hindering technological innovation, and preventing misuse and resource crowding-out), thereby fostering improvements in urban green competitiveness. Hypothesis H3a is validated.

5.2.2. Heterogeneity in Regional Location

To examine regional variations in the impact of digital infrastructure development on green competitiveness, we classified cities into three geographic groups: eastern, central, and western regions, and conducted separate regression analyses for each subgroup. Table 10 presents the regional heterogeneity regression results. The results show that the construction of digital infrastructure development can promote the green competitiveness of cities in the east, central, and western regions. Moreover, the promoting effect of digital infrastructure development on the green competitiveness of western cities is more pronounced, followed by eastern and central cities. The main reasons are twofold: on one hand, the western regions, leveraging the “East Data West Computing” policy and advantages in hydropower and geography, have amassed a large amount of digital infrastructure, becoming major producers of data elements. They have rich experience in the green development applications of digital infrastructure, which significantly enhances green competitiveness. On the other hand, although eastern cities have fewer digital infrastructures, they have rapidly completed digital transformation due to their economic advantages, achieving a high degree of digitalization. The rapid spread of digital technology within the industrial chain gives them a latecomer advantage, and their impact on enhancing green competitiveness is second only to that of the western regions. Hypothesis H3b is thus confirmed.

6. Conclusions and Discussion

This study systematically examines the impact of digital infrastructure development on urban green competitiveness using panel data from 285 Chinese cities. A multidimensional evaluation framework for urban green competitiveness is constructed, and a staggered difference-in-differences (SDID) model is employed to analyze the underlying mechanisms. The key findings are as follows: First, digital infrastructure development demonstrates a significant positive effect on enhancing urban green competitiveness. Second, this effect operates through three synergistic pathways: green technology innovation, industrial structure upgrading, and economic agglomeration, with economic agglomeration showing the strongest impact. Third, heterogeneity analysis reveals that: (i) moderate government intervention optimizes policy effectiveness; (ii) western cities benefit the most due to advantages from the “East Data, West Computing” project; and (iii) eastern cities also achieve notable results through digital transformation. From urban planning perspectives, these statistical findings reflect real spatial restructuring driven by digital networks. Varied policy effects stem from differences in urban layout and governance coordination. Digital tools also facilitate public environmental participation to boost urban green performance.
Based on the research results mentioned above, this paper puts forward the following policy recommendations: First, utilize policy measures to further increase investment in digital infrastructure development, enhance the level of digital industrialization, and solidify the foundation of digital infrastructure. Planners should invest in digital infrastructure regionally: western areas build computing networks, and eastern and central areas upgrade facilities. Second, integrate the mechanisms of action, making full use of the significant role of digital infrastructure in green technology innovation, industrial structure upgrading, and economic agglomeration, thereby achieving better ecological efficiency. Governments can cluster low-carbon high-tech industries in industrial parks to develop distinct green models. Third, continuously optimize and refine the construction pathways of digital infrastructure, adapting to local conditions and varying according to needs, and progressively advancing the comprehensive coverage of digital ecological civilization construction. Policymakers should pursue a market-driven green transition with moderate regulation and region-specific industrial policies.
This paper also has certain limitations. Specifically, this study is constrained by the time window for policy evaluation and challenges in measuring green competitiveness. Future research could extend the observation period to assess long-term effects, incorporate firm-level microdata, and develop dynamic computable general equilibrium (CGE) models for more comprehensive and precise conclusions.

Author Contributions

Conceptualization, S.Z. and Y.Y.; methodology, S.Z. and Y.Y.; software, S.Z. and X.R.; validation, X.R.; formal analysis, S.Z., X.R. and Y.Y.; investigation, S.Z., X.R. and Y.Y.; resources, Y.Y.; data curation, S.Z. and X.R.; writing—original draft preparation, S.Z., Y.Y. and X.R.; writing—review and editing, S.Z., Y.Y. and X.R.; visualization, X.R.; supervision, Y.Y.; project administration, S.Z. and Y.Y. All authors have read and agreed to the published version of the manuscript.

Funding

This research was funded by the Fundamental Research Funds for the Central Universities (Grant number: 2572024DZ42) and Heilongjiang Province Philosophy and Social Science Research Planning Project (Grant number: 24GLC022).

Data Availability Statement

Data will be available if requested.

Conflicts of Interest

The authors declare no conflict of interest.

References

  1. Jiang, R.; Jin, C.; Wang, H. Research on energy conservation and emission-reduction effects of green finance: Evidence from China. Sustainability 2024, 16, 3257. [Google Scholar] [CrossRef] [Scilit]
  2. Pallagst, K.; Vargas-Hernández, J.; Hammer, P. Green Innovation Areas—En Route to Sustainability for Shrinking Cities? Sustainability 2019, 11, 6674. [Google Scholar] [CrossRef] [Scilit]
  3. Li, B. Digital infrastructure and regional economic disparities: Evidence from the broadband China strategy. In Economics of Innovation and New Technology; Taylor & Francis: Washington, DC, USA, 2025; pp. 1–20. [Google Scholar] [CrossRef] [Scilit]
  4. Catulli, M.; Fryer, E. Information and communication technology-enabled low carbon technologies: A new subsector of the economy? J. Ind. Ecol. 2012, 16, 296–301. [Google Scholar] [CrossRef] [Scilit]
  5. De Stefano, T.; Kneller, R.; Timmis, J. Broadband infrastructure, ICT use and firm performance: Evidence for UK firms. J. Econ. Behav. Organ. 2018, 155, 110–139. [Google Scholar] [CrossRef] [Scilit]
  6. Sun, S.; Guo, T.; Zhang, S. Guiding corporate green sustainable development: Insights from green public procurement. Econ. Change Restruct. 2025, 58, 56. [Google Scholar] [CrossRef] [Scilit]
  7. Li, J.; Chen, L.; He, J. Digital economy, technological innovation, and green economic efficiency: Evidence from 277 Chinese prefectural cities. Manag. Decis. Econ. 2022, 43, 616–629. [Google Scholar] [CrossRef] [Scilit]
  8. Jones, N. How to stop data centres from gobbling up the world’s electricity. Nature 2018, 561, 163–166. [Google Scholar] [CrossRef] [Scilit] [PubMed]
  9. Andrae, A.S.G.; Edler, T. On global electricity usage of communication technology: Trends to 2030. Challenges 2015, 6, 117–157. [Google Scholar] [CrossRef] [Scilit]
  10. Porter, M.E.; van der Linde, C. Toward a new conception of the environment-competitiveness relationship. J. Econ. Perspect. 1995, 9, 97–118. [Google Scholar] [CrossRef] [Scilit]
  11. Costantini, V.; Crespi, F.; Marin, G.; Paglialunga, E. Eco-innovation, sustainable supply chains and environmental regulation: Evidence from EU manufacturing. J. Clean. Prod. 2017, 155, 141–154. [Google Scholar] [CrossRef] [Scilit]
  12. Johnstone, N.; Haščič, I.; Popp, D. Renewable energy policies and technological innovation: Evidence based on patent counts. Environ. Resour. Econ. 2010, 45, 133–155. [Google Scholar] [CrossRef] [Scilit]
  13. Horbach, J. Determinants of environmental innovation: New evidence from German panel data sources. Res. Policy 2008, 37, 163–173. [Google Scholar] [CrossRef] [Scilit]
  14. Martin, R.; Muûls, M.; de Preux, L.B.; Wagner, U.J. Industry compensation under relocation risk: A firm-level analysis of the EU Emissions Trading Scheme. Am. Econ. Rev. 2014, 104, 2482–2508. [Google Scholar] [CrossRef] [Scilit]
  15. Liao, L.; Luo, L.; Tang, Q. Gender diversity, board independence and environmental disclosure: An analysis of corporate greenhouse gas reporting. J. Bus. Ethics 2015, 132, 593–606. [Google Scholar]
  16. Zhe, J.; Chang, Y.; Fengxiu, Z. Unlocking synergies: How digital infrastructure reshapes the pollution-carbon reduction nexus at the Chinese prefecture-level cities. Sustainability 2025, 17, 7066. [Google Scholar] [CrossRef] [Scilit]
  17. Blum, B.S.; Goldfarb, A. Does the Internet Defy the Law of Gravity? J. Int. Econ. 2006, 70, 384–405. [Google Scholar] [CrossRef] [Scilit]
  18. Bakker, K.; Ritts, M. Smart Earth: A Meta-review and Implications for Environmental Governance. Glob. Environ. Change 2018, 52, 201–211. [Google Scholar] [CrossRef] [Scilit]
  19. Zhang, S.; Yang, Y.; Gan, H. Can Cross-Sector Collaboration Contribute to Boundaries Reshaping of Digital Government Platforms? Empirical Evidence Based on Machine Learning and Text Analysis. Public Adm. 2025, 103, 756–772. [Google Scholar] [CrossRef] [Scilit]
  20. Ren, H.; Zhou, J.; Yu, Y. Carbon emission reduction effects of digital infrastructure construction development: The broadband China strategy as a quasi-natural experiment. Front. Environ. Sci. 2025, 13, 1510118. [Google Scholar] [CrossRef] [Scilit]
  21. Tanveer, U.; Hoang, T.G.; Ishaq, S.; Kamal, M.M.; Attri, R. Enhancing supplier innovation capabilities through digital technology integration: A relational perspective. Technol. Forecast. Soc. Change 2026, 223, 124426. [Google Scholar] [CrossRef] [Scilit]
  22. Song, J.; Lianmei, Z. The impact of digital innovation on carbon productivity: An empirical study based on spatial spillover effects. Sustainability 2026, 18, 2084. [Google Scholar] [CrossRef] [Scilit]
  23. Zhang, S.; Yang, Y.; Gan, H.; Ren, Y. Digital welfare of the value cycle of agribusiness supply chain network: Evidence from China’s listed agriculture-affiliated companies. Technol. Anal. Strateg. Manag. 2025, 37, 3547–3561. [Google Scholar] [CrossRef] [Scilit]
  24. Shen, J.; Pu, B.; Zhang, N. Innovation of new green minimalist digital machine room in mobile communications. In 2025 IEEE International Conference on High Performance Computing and Communications; IEEE: New York, NY, USA, 2025; pp. 1483–1488. [Google Scholar] [CrossRef] [Scilit]
  25. Vărzaru, A.A.; Bocean, C.G. Digital transformation and innovation: The influence of digital technologies on turnover from innovation activities and types of innovation. Systems 2024, 12, 359. [Google Scholar] [CrossRef] [Scilit]
  26. Zhang, S.; Jiang, Q.; Dong, J.; Yang, Y. Sweet temptation or hidden trap: The welfare consequences of rural e-commerce platform for poverty reduction in China. In Applied Economics; Taylor & Francis: Washington, DC, USA, 2025; pp. 1–18. [Google Scholar] [CrossRef] [Scilit]
  27. Wu, S.; Pan, X.Y.; Wang, F. Can the synergy between FinTech and data element market development enhance credit allocation efficiency? Int. Rev. Econ. Financ. 2025, 103, 104515. [Google Scholar] [CrossRef] [Scilit]
  28. Zeng, G.; Wu, P.; Yuan, X. Has the development of the digital economy reduced the regional energy Intensity—From the perspective of factor market distortion, industrial structure upgrading and technological progress? Sustainability 2023, 15, 5927. [Google Scholar] [CrossRef] [Scilit]
  29. Tian, X.H.; Lu, H.Y. Digital infrastructure and cross-regional collaborative innovation in enterprises. Financ. Res. Lett. 2023, 58, 104635. [Google Scholar] [CrossRef] [Scilit]
  30. Yang, C.; Liu, Q. Driving green innovation through digital transformation: Empirical insights on regional variations. Sustainability 2024, 16, 10716. [Google Scholar] [CrossRef] [Scilit]
  31. Wang, X.; Zhou, Y.; Tian, S.; Li, L. Digital-Real Integration and Trade Network Centrality: Evidence From China. World Econ. 2026, 49, 1124–1142. [Google Scholar] [CrossRef] [Scilit]
  32. Qin, B.T.; Yu, Y.W.; Ge, L.M.; Liu, Y.; Zheng, Y.; Liu, Z.X. The role of digital infrastructure construction on green city transformation: Does government governance matters? Cities 2024, 155, 105462. [Google Scholar] [CrossRef] [Scilit]
  33. Song, W.J.; Zhao, M.Y.; Yu, J. Price distortion on market resource allocation efficiency: A DID analysis based on national-level big data comprehensive pilot zones. Int. Rev. Econ. Financ. 2025, 102, 104128. [Google Scholar] [CrossRef] [Scilit]
  34. Zheng, C.; Deng, F.; Li, C. Energy-saving effect of regional development strategy in western China. Sustainability 2022, 14, 5616. [Google Scholar] [CrossRef] [Scilit]
  35. Zhang, S.; Li, Q.; Wang, S.; Yang, J. The impact of dialect distance on firm performance in underdeveloped counties: Evidence from urban agglomerations. Humanit. Soc. Sci. Commun. 2026, 13, 655. [Google Scholar] [CrossRef] [Scilit]
  36. Tone, K. A slacks-based measure of super-efficiency in data envelopment analysis. Eur. J. Oper. Res. 2002, 1, 32–41. [Google Scholar] [CrossRef] [Scilit]
  37. Li, Z.; Tang, D.; Han, M.; Bethel, B.J. Comprehensive Evaluation of Regional Sustainable Development Based on Data Envelopment Analysis. Sustainability 2018, 10, 3897. [Google Scholar] [CrossRef] [Scilit]
  38. Asnor, A.S.; Al-Mohammad, M.S.; Wan Ahmad, S.; Almutairi, S.; Rahman, R.A. Challenges for Implementing Environmental Management Plans in Construction Projects: The Case of Malaysia. Sustainability 2022, 14, 6231. [Google Scholar] [CrossRef] [Scilit]
  39. Zhang, S.; Han, W.; Wu, X. The Causal Impact of Data Elements on Corporate Green Transformation: Evidence from China. Systems 2025, 13, 515. [Google Scholar] [CrossRef] [Scilit]
  40. Cheng, L.; Wang, X.; Zhang, S.; Zhao, M. Public procurement, corporate social responsibility and green innovation: Evidence from China. Environ. Eng. Manag. J. 2023, 22, 2127–2137. [Google Scholar] [CrossRef] [Scilit]
  41. Zhou, L.; Che, L.; Zhou, C.H. Spatio-temporal evolution and influencing factors of urban green development efficiency in China. Acta Geogr. Sin. 2019, 74, 2027–2044. [Google Scholar] [CrossRef]
  42. Tu, X.; Yin, J.; Meng, Y. Interpretable machine learning analysis of industrial carbon emissions efficiency in Chinese cities. Energy Environ. 2025, 1–35. [Google Scholar] [CrossRef] [Scilit]
  43. Waterson, M.; Baute, E.T.; Giulietti, M. Intermittency and the social role of storage. Energy Policy 2022, 165, 112947. [Google Scholar] [CrossRef] [Scilit]
  44. Guo, H.; Xie, Z.; Wu, R. Evaluating Green Innovation Efficiency and Its Socioeconomic Factors Using a Slack-Based Measure with Environmental Undesirable Outputs. Int. J. Environ. Res. Public Health 2021, 18, 12880. [Google Scholar] [CrossRef] [Scilit] [PubMed]
  45. Kouskoura, A.; Kalliontzi, E.; Skalkos, D.; Bakouros, I. Evaluating experts’ perceptions on regional competitiveness based on the ten key factors of assessment. Sustainability 2024, 16, 5944. [Google Scholar] [CrossRef] [Scilit]
  46. Li, C.; Wen, M.; Jiang, S.; Wang, H. Assessing the effect of urban digital infrastructure on green innovation: Mechanism identification and spatial-temporal characteristics. Humanit. Soc. Sci. Commun. 2024, 11, 320. [Google Scholar] [CrossRef] [Scilit]
  47. Goodman-Bacon, A. Difference-In-Differences With Variation In Treatment Timing. J. Econom. 2021, 225, 254–277. [Google Scholar] [CrossRef] [Scilit]
Figure 1. Conceptual framework.
Systems 14 00844 g001
Figure 2. Research framework.
Systems 14 00844 g002
Figure 3. Parallel trend test. Note: The real line shown in the figure has no practical meaning; the dashed line represents the confidence interval.
Systems 14 00844 g003
Table 1. Evaluation index system for measuring urban green competitiveness.
Primary IndicatorSecondary IndicatorMeasurement
InputsLabor (L)Citywide year-end employed population [38]
Capital stock (K)Calculated using the perpetual inventory method [39]
Energy (E)Electricity consumption of prefecture-level cities [40]
Desired outputsGDP (Y)Real GDP at constant 2005 prices (prefecture-level) [41]
Undesired outputsSoot (D)Citywide industrial soot emissions [42]
Sulfur dioxide (S)Citywide industrial SO2 emissions [43]
Waste water (W)Citywide industrial wastewater discharge [44]
Table 2. Descriptive statistics of the main variables.
VariableNMeanSDMinMax
UGC48457.6240.9055.5859.610
DID48450.1550.36201
EDU484512.681.0046.90216.25
RDI48459.7271.7303.52615.53
GDP484510.410.7614.59515.68
POL484510.211.2440.69313.43
FID484517.001.24513.4621.59
Table 3. Results of baseline regression.
Variables(1)(2)(3)(4)
OLSFEFEFE
DID0.0718 ***0.0371 **0.0906 ***0.0307 ***
(2.79)(2.30)(6.37)(3.16)
EDU0.2174 ***0.5458 ***−0.00950.0682 ***
(8.14)(26.57)(−0.38)(4.09)
RDI0.1199 ***0.0647 ***0.00970.0492 ***
(10.30)(8.13)(1.34)(9.01)
GDP0.1178 ***0.4877 ***−0.02380.2112 ***
(6.89)(42.59)(−1.26)(16.98)
POL0.2564 ***0.1013 ***0.0102 *0.0204 ***
(37.52)(20.31)(1.93)(4.96)
FID0.1386 ***0.1858 ***0.1278 ***0.0266
(4.58)(8.31)(5.22)(1.45)
Constant−2.1526 ***−8.7225 ***5.9347 ***3.4860 ***
(−9.55)(−52.77)(37.85)(14.90)
City FEnoyesnoyes
Year FEnonoyesyes
N4845484548454845
R20.5850.8580.9200.970
Note: *, **, and *** indicate significance at the 10%, 5%, and 1% levels, respectively, with t-values in parentheses. Same below.
Table 4. Index system of digital infrastructure development.
Primary IndicatorSecondary IndicatorMeasurementData Source
Digital infrastructure developmentTelecommunications infrastructureTotal investment in information transmission and computer fixed assetsChina Statistical Yearbook
Optical Network DensityLength of long-distance optical fiber cable per unit area of landChina Statistical Yearbook
Internet PenetrationNumber of internet users in each province/Total number of residents in each provinceChina Internet Network Information Center’s annual “China Internet Development Statistical Report
Internet User RatioNumber of internet users/Total populationChina Statistical Yearbook
Table 5. Results after variable substitution and sample adjustment.
Variables(1)(2)
Variable SubstitutionSample Adjustment
DID0.095 ***0.034 ***
(4.51)(3.48)
EDU0.072 ***0.071 ***
(4.36)(4.27)
RDI0.046 ***0.048 ***
(8.49)(8.89)
GDP0.205 ***0.219 ***
(16.37)(17.62)
POL0.018 ***0.021 ***
(4.50)(5.01)
FID0.0200.023
(1.10)(1.25)
Constant3.644 ***3.421 ***
(15.78)(14.69)
N45604777
R20.9710.968
Note: *** indicates significance at the 1% levels, with t-values in parentheses.
Table 6. Results of dynamic panel model.
Variables(1)(2)
Difference GMMSystem GMM
DID0.049 **0.065 *
(2.47)(1.67)
EDU0.073 ***0.559 ***
(2.85)(5.95)
RDI0.066 ***0.074 ***
(5.83)(2.71)
GDP0.202 ***0.583 ***
(2.76)(5.84)
POL0.034 ***0.089 ***
(5.35)(4.12)
FID0.0780.383 ***
(1.50)(2.91)
Constant −11.691 ***
(−6.54)
N42754560
Note: *, **, and *** indicate significance at the 10%, 5%, and 1% levels, respectively, with t-values in parentheses.
Table 7. Results of the DID decomposition.
GroupWithout Control VariablesWith Control Variables
WeightDID CoefficientsWeightDID Coefficients
The first group0.077−0.002
The second group0.0310.006
The third group0.8920.035
Group (1) 0.1130.008
Group (3) 0.0490.031
Group (2) 0.8380.024
Table 8. Results of mechanism test.
Variables(1)(2)(3)(4)
GTIL.INDAAGGUGC
DID0.1313 ***0.2252 ***0.1565 ***0.001
(3.32)(9.51)(3.08)(0.06)
GTI 0.110 ***
(11.80)
L.INDA 0.041 **
(2.41)
AGG 0.190 ***
(25.33)
EDU0.3190 ***−0.00500.8374 ***0.218 ***
(6.21)(−0.11)(12.96)(7.48)
RDI0.5619 ***−0.0665 ***0.7006 ***−0.020
(28.50)(−5.15)(27.99)(−1.59)
GDP0.5696 ***−0.2135 ***0.6937 ***0.024
(19.79)(−6.74)(19.26)(1.23)
POL0.0913 ***−0.0955***0.0457 ***0.207 ***
(7.25)(−10.64)(2.91)(27.13)
FID0.3801 ***0.2938 ***−1.1586 ***0.174 ***
(6.81)(6.77)(−16.46)(5.28)
Constant−18.2151 ***0.5952 **−11.2196 ***0.245
(−43.98)(2.17)(−21.58)(0.86)
N4845456048454560
R20.8170.5590.4900.716
Note: ** and *** indicate significance at the 5%, and 1% levels, respectively, with t-values in parentheses.
Table 9. Results of heterogeneity analysis based on government intervention intensity.
Variables(1) Low Government Intervention(2) Medium Government Intervention(3) High Government Intervention
UGCUGCUGC
DID−0.0194 **0.0464 *0.0108
(−2.03)(1.89)(0.91)
EDU0.0547 ***0.04470.0929 ***
(3.54)(1.46)(5.23)
RDI0.0199 ***0.0330 ***0.0462 ***
(3.55)(2.90)(7.10)
GDP0.2340 ***0.1695 ***0.3092 ***
(14.33)(8.02)(15.33)
POL0.00610.0200 **0.0025
(1.32)(2.54)(0.55)
FID0.1455 ***0.1585 ***0.1077 ***
(5.93)(4.45)(3.98)
Constant2.2474 ***1.5802 **0.9340 **
(5.70)(2.38)(2.04)
N158915271593
R20.9930.9510.988
Note: *, **, and *** indicate significance at the 10%, 5%, and 1% levels, respectively, with t-values in parentheses.
Table 10. Results of heterogeneity analysis based on regional location.
Variables(1) Eastern Region(2) Central Region(3) Western Region
UGCUGCUGC
DID0.0335 **0.02140.0648 ***
(2.00)(1.14)(4.35)
EDU0.1483 ***0.02660.0836 ***
(4.99)(1.30)(3.08)
RDI0.0630 ***0.01140.0208 **
(6.56)(1.06)(2.29)
GDP0.2203 ***0.0467 ***0.3484 ***
(7.58)(2.92)(13.78)
POL0.00740.0136 **0.0210 ***
(0.92)(2.17)(3.07)
FID0.03100.1947 ***0.0249
(0.74)(5.90)(0.87)
Constant2.6140 ***2.8185 ***2.0748 ***
(3.55)(4.80)(4.11)
N14791887952
R20.9650.9780.959
Note: ** and *** indicate significance at the 5%, and 1% levels, respectively, with t-values in parentheses.
Disclaimer/Publisher’s Note: The statements, opinions and data contained in all publications are solely those of the individual author(s) and contributor(s) and not of MDPI and/or the editor(s). MDPI and/or the editor(s) disclaim responsibility for any injury to people or property resulting from any ideas, methods, instructions or products referred to in the content.