Article

Digital Innovation Competition and ESG Trade-Offs: Evidence from Chinese Listed Firms

by
Yanbing Li
1,
Munan Li
1,*,
Yuan Wang
1 and
Sing Lui So
2
1
School of Business Administration, South China University of Technology, Guangzhou 510641, China
2
College of Computing, Georgia Institute of Technology, Atlanta, GA 30332, USA
*
Author to whom correspondence should be addressed.
Systems 2026, 14(7), 792; https://doi.org/10.3390/systems14070792
Submission received: 14 April 2026 / Revised: 19 May 2026 / Accepted: 4 July 2026 / Published: 7 July 2026

Abstract

As digital technologies reshape competitive dynamics, firms face increasing pressure to keep pace with the innovation activities of their peers. While digital transformation is often viewed as a driver of sustainable development, less attention has been paid to how peer firms’ digital innovation relates to corporate environmental, social, and governance (ESG) performance within the broader innovation system. Using panel data from Chinese A-share listed firms from 2012 to 2023, this study constructs an industry-level measure of peer digital technology innovation based on the digital patenting activities of other firms in the same narrowly defined industry. The results show that peer digital technology innovation is significantly associated with a decline in ESG performance, revealing trade-offs between digital competitive adaptation and sustainability outcomes. Mechanism analysis further provides suggestive evidence consistent with two potential channels: heightened digital risk perception and stronger managerial short-term orientation. Heterogeneity analysis shows that this negative association is pronounced in small and medium-sized enterprises, tech-intensive industries, and highly competitive markets. In addition, external governance conditions shape the magnitude of this relationship: stronger intellectual property protection amplifies the negative association, whereas greater investor attention attenuates it. Supplemental analysis of ESG rankings further indicates that digital competition may allow specific firms to enhance their relative standing. These findings provide new evidence on the unintended consequences of digital competition and contribute to the literature on corporate digitalization and sustainability.

1. Introduction

Digital transformation has become a central dimension of firm competition rather than merely an internal strategic choice. As firms adopt technologies such as artificial intelligence, big data analytics, and automation, digital capabilities increasingly function as intangible investments that shape competitive positioning and industry dynamics. At the same time, environmental, social, and governance (ESG) performance has emerged as a key outcome reflecting firms’ long-term value creation and nonfinancial commitments [1,2]. Therefore, understanding how competitive pressures associated with digital technology innovation influence corporate ESG performance has become an important and timely research question [3].
Prior research on digital technology innovation and ESG performance has largely been conducted from a firm-level perspective. However, this literature predominantly treats digital technology innovation as an internally driven strategic choice. Such an approach tends to overlook the competitive environment in which digital innovation unfolds, where technological rivalry and knowledge spillovers across firms are pervasive [4]. In this context, the digital activities of peer firms can generate competitive pressure that reshapes performance benchmarks and alters firms’ risk profiles [5,6]. Despite these systemic dynamics, limited attention has been paid to the relationship between peer digital technology innovation and ESG performance, as distinct from that between a firm’s own digital efforts and ESG performance.
This omission is nontrivial. Digital competition may generate consequences that differ from those implied by firm-level digitalization. On the one hand, competitive pressure arises not only from direct rivals but also from the relative digital proximity between a focal firm and key collaborators or ecosystem orchestrators [7]. As digital innovation intensifies, firms may face increasing pressure to keep pace with industry benchmarks, which can influence their strategic priorities and resource allocation decisions. On the other hand, the relationship between digitalization and ESG performance may exhibit an inverted U-shaped pattern [8]. Moderate digitalization can enhance corporate ESG outcomes by improving governance efficiency and enabling green innovation, whereas excessive digital expansion may intensify organizational complexity, escalate costs, and induce managerial resource strain, ultimately weakening ESG performance. Taken together, these arguments highlight the theoretical complexity surrounding the relationship between digital innovation and ESG performance, suggesting that firm-level analysis alone may provide only a partial understanding. Yet, empirical evidence on this issue remains scarce.
Existing studies generally suggest that digitalization can enhance corporate sustainability by enabling green innovation, improving information transparency, optimizing resource allocation and strengthening internal governance [9,10,11]. However, digital transformation should be distinguished from mere technological innovation, as it encompasses the broader organizational shifts precipitated by digital adoption. In this sense, digital technologies serve as catalysts, that reconfigure not only a firm’s products and operations but also its business models and overall competitive environment [12]. Building on this distinction, this study shifts the focus from firm-level digitalization to industry-level digital competition. Given that digital technology development is inherently embedded in a competitive environment, firms are required not only to respond to internal strategic considerations but also to adapt to the evolving technological intensity of their peers. This competitive dimension suggests that digital innovation may be linked to ESG performance through mechanisms that differ from the commonly discussed empowerment effects. From the perspectives of competitive dynamics and the resource-based view, this study investigates how digital competitive pressure relates to firms’ resource allocation and strategic priorities, and whether these organizational responses are associated with ESG performance. In addition, this relationship is unlikely to be uniform across firms. Differences in firm characteristics, industry conditions, and institutional environments may influence both the intensity of competitive pressure and firms’ capacity to respond. Accordingly, this study further examines the heterogeneity in the relationship between digital competition and ESG performance across different contexts, with the aim of enhancing the external validity and practical relevance of the findings.
Drawing on a sample of Chinese A-share listed firms from 2012 to 2023, this study examines the relationship between peer digital technology innovation and corporate ESG performance. Relative to prior studies, this study makes three main contributions to the literature. First, it extends research on digital technology innovation and corporate ESG performance by shifting the focus from firm-level digitalization to industry-level peer digital innovation. By situating corporate behavior within the broader competitive environment, this study uncovers a potential underexplored source of ESG pressure, providing a more comprehensive understanding of the inherent tensions between digital competitive pressure and sustainability commitments. Second, this study advances the literature by exploring the mechanisms associated with the relationship between peer digital competition and ESG performance. Specifically, it bridges external competitive dynamics and internal resource allocation, providing a theoretically grounded framework for understanding how digital competitive pressures may correspond with managerial responses and organizational outcomes. Third, it enriches the burgeoning literature on the “dark side” of digital innovation by identifying critical boundary conditions and introducing a “relative competition” perspective. The findings suggest that while digital competitive pressure is associated with less favorable ESG outcomes for certain groups of firms, it simultaneously functions as a sorting mechanism that reconfigures the relative ESG standing of firms.
The remainder of this paper is structured as follows. Section 2 presents the literature review and hypothesis development. Section 3 describes the research design. Section 4 reports and discusses the empirical results. Section 5 offers further discussion and extensions of the core analysis. Section 6 concludes with the findings, contributions, implications, and future research directions.

2. Literature Review and Hypothesis Development

2.1. Digital Technology Innovation and Environmental, Social and Governance Performance

The growing adoption of digital technologies has reshaped firms’ operational processes and strategic priorities, with important implications for ESG performance. The existing literature offers two competing perspectives on the relationship between digital technology innovation and ESG outcomes. One stream emphasizes the enabling effects of digital technologies. From this perspective, digital technology innovation enhances information processing efficiency, improves resource allocation, and increases operational transparency [11,13,14]. These improvements are typically associated with stronger environmental management, more effective stakeholder engagement, and better governance practices. For instance, technologies such as cloud computing and big data analytics allow firms to monitor emissions and energy use with greater precision, thereby supporting environmental compliance and sustainability initiatives [15,16]. At the same time, digital platforms facilitate communication with stakeholders and reduce information asymmetry, which can strengthen accountability and governance quality [10,17]. Some studies further suggest that the effects of digital technology innovation are not uniform across ESG dimensions. In particular, digital innovation tends to operate through channels such as green innovation and improved disclosure quality, with the governance pillar benefiting the most. By contrast, there is little evidence that symbolic digital innovation contributes meaningfully to environmental performance [18]. Evidence from emerging market multinational enterprises further shows that digitalization tends to benefit the environmental and governance dimensions, with limited effects on the social dimension [19].
A second stream highlights the potential crowding-out or distortion effects of digitalization. In response to increasing pressures related to sustainability, corporate responsibility, and governance, as well as rising expectations from diverse stakeholders, firms are incentivized to invest in digital technologies to maintain legitimacy and competitive positioning [20]. However, digital innovation may also increase energy consumption and induce short-term competitive behavior, which can offset sustainability gains [21,22]. Prior studies further document a nonlinear relationship between symbolic digital technology innovation and ESG performance, suggesting that excessive symbolic adoption may undermine information credibility and weaken ESG outcomes [23]. In addition, recent work finds that digital technology innovation does not improve ESG performance in highly monopolistic industries, where firms are more likely to use digital technologies to reinforce market power rather than generate broader social value [24]. Taken together, these mixed findings suggest that the relationship between digital technology innovation and ESG outcomes is highly context-dependent. Notably, most existing studies focus on firms’ own digital efforts while paying limited attention to the broader competitive environment in which digitalization unfolds.
Although these two perspectives provide a useful foundation, they share an important limitation in that they predominantly examine firm-level digital adoption and its direct consequences. In practice, firms rarely make decisions in isolation. Instead, they adjust their strategies in response to the actions of comparable organizations, especially those operating in the same industry or region. Such peer influences have been well documented in areas including investment decisions, innovation activities [25,26], financing choices [27], and disclosure practices [28]. The underlying mechanisms are typically attributed to competitive pressure, information-based learning, and legitimacy concerns [7,29,30]. When leading firms adopt new technologies or strategic orientations, others may follow to avoid competitive disadvantages or to signal conformity with prevailing norms. These dynamics suggest that corporate decision-making is embedded in a broader competitive environment characterized by strategic interdependence.
Against this backdrop, while industry-level digital innovation is likely to intensify competitive pressure, it remains unclear whether and how such advancements are related to a focal firm’s ESG performance. Moreover, firms’ responses to external competitive pressure are unlikely to be uniform across the environmental, social, and governance dimensions [23]. This study addresses these gaps by focusing explicitly on the competitive dynamics surrounding peer digital technology innovation and by examining their relationship with overall ESG performance as well as its constituent dimensions. In doing so, it contributes to a more integrated understanding of the interplay between digitalization and corporate sustainability within a competitive environment.

2.2. Peer Digital Technology Innovation and ESG Performance

Digital technology innovation is best conceptualized as a systemic evolutionary process rather than an atomistic strategic choice. As digital technologies permeate an industry, firms become embedded in a dense fabric of interconnected competition, imitation, and resource reallocation [31,32]. In essence, industries are constituted by firms and the networked relationships among them rather than existing independently of firm interactions [33,34]. Within such network structures, peer-level innovation behaviors can spread through competitive and relational channels, thereby incrementally reshaping the competitive landscape [26]. This process fundamentally alters the distribution, strategic value, and deployment logic of resources [35,36] while intensifying competitive pressure and strategic imitation among connected firms. From a systems perspective, peer digitalization exerts dynamic institutional and competitive pressures that reshape a firm’s capability development, risk profile, and managerial incentives, ultimately impacting its ESG performance.
The Resource-Based View (RBV) provides a foundational lens for understanding this transition. Traditionally, this theory posits that sustained competitive advantage stems from the accumulation of VRIN (valuable, rare, inimitable, and non-substitutable) resources [37]. While frontier digital technologies initially provide strategic advantages by enhancing information processing capabilities and operational coordination [38], their widespread diffusion leads to resource homogenization. What begins as a source of idiosyncratic advantage increasingly matures into a “competitive necessity” [39,40]. This shifts the strategic imperative from achieving differentiation to ensuring basic survival.
This shift resonates with the “Red Queen” hypothesis of innovation races, which suggests that firms must accelerate their innovative efforts merely to maintain their relative standing [41,42]. As peer-driven digital intensity rises, the “competitive threshold” escalates, compelling firms to channel disproportionate resources into continuous digital upgrading. Within an RBV framework, this dynamic results in diminishing marginal strategic returns on digital investments. Consequently, organizations may feel pressured to channel financial, human, and managerial capital toward immediate digital upgrading in response to escalating competitive dynamics. Although this strategic shift enhances short-term competitive positioning, it may simultaneously narrow the organizational slack that underpins long-term sustainability initiatives [43], thereby intensifying the tension between digital imperatives and environmental and social commitments [44,45].
Beyond objective market competition, firms navigate normative expectations within their peer groups. In this context, peer firms’ technological innovation activities constitute an important market force and incentive for shaping focal firms’ own innovation decisions [25]. To mitigate reputational risks and avoid being perceived as “technological laggards,” managers benchmark their digital adoption against industry leaders. This peer-induced pressure often triggers reactive or imitative strategies [27] that prioritize speed and signaling over strategic coherence. Over time, this externally driven acceleration further intensifies competitive pressures.
Taken together, these mechanisms create a self-reinforcing dynamic. As digital capabilities become increasingly widespread and lose their distinctiveness, firms intensify innovation efforts to maintain competitive parity, which in turn accelerates digital diffusion and heightens conformity pressures. This escalating dynamic progressively reallocates managerial attention and strategic resources toward sustaining digital competitiveness, crowding out investments in ESG-oriented capabilities that typically entail longer gestation periods and delayed returns. This tension may not be uniform across ESG dimensions, as environmental, social, and governance activities differ in their regulatory exposure, discretion, and time horizon. Consequently, firms confront an intensifying trade-off between short-term digital competitiveness and long-term sustainability commitments. Based on this logic, the following subsections develop testable hypotheses to examine the relationship between peer digital technology innovation and ESG performance, as well as the potential mechanisms underlying this relationship.
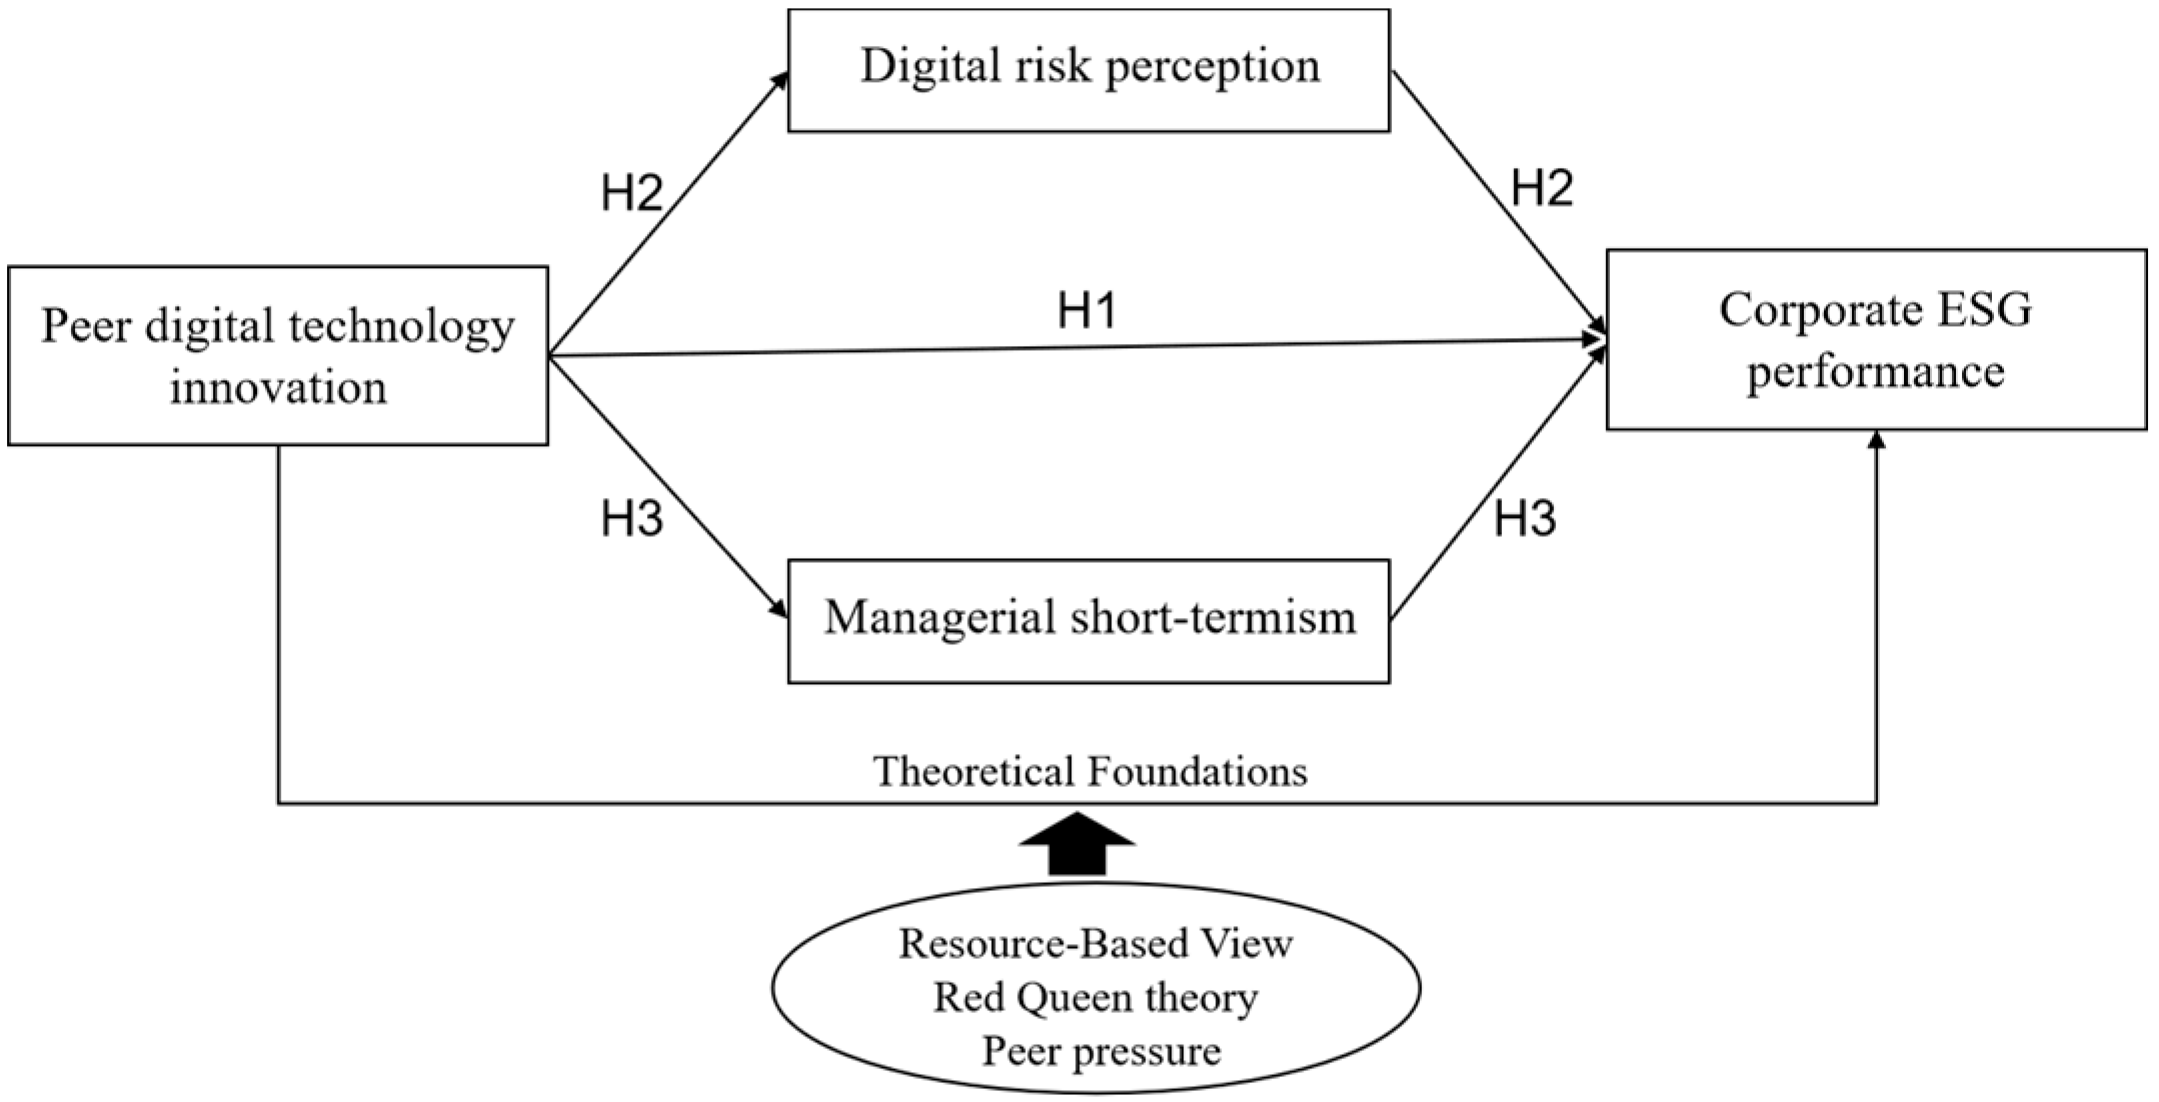
Based on the above analysis, we propose the following hypothesis:
H1. 
There is a negative association between peer digital technology innovation and corporate ESG performance.

2.3. Mediating Effect of Digital Risk Perception

As digitalization advances, industry competitive dynamics are increasingly shaped by data-driven platforms and digital infrastructures [46,47]. When peer firms intensify their digital technology innovation activities, focal firms may face growing competitive and institutional pressures. From a behavioral and cognitive perspective, such developments extend beyond potential technological vulnerabilities and may increase managers’ awareness of challenges related to digital transformation, regulatory compliance uncertainty, and operational stability [48,49]. By closely observing their peers’ digital advancements, firms may become more attentive to the risks associated with digital engagement, including data security breaches, technological path dependence, and digital misalignment [50]. According to the attention-based view of the firm, managerial attention constitutes a scarce organizational resource. As executives devote greater cognitive resources and strategic attention to monitoring digital risks and addressing compliance-related concerns, fewer managerial resources may remain available for long-term ESG initiatives [51]. From a dynamic capability perspective, the need to continuously reconfigure organizational resources in response to peer digital innovation may increase managerial attention to digital adaptation and risk management. Under such conditions, resources devoted to capability renewal may coincide with relatively less emphasis on long-term ESG initiatives. Taken together, peer digital technology innovation may be related to corporate ESG performance through perceived digital risk exposure.
Therefore, the following hypothesis is proposed:
H2. 
Peer digital technology innovation is positively associated with perceived digital risk, which is negatively associated with corporate ESG performance.

2.4. Mediating Effect of Managerial Short-Termism

Beyond technological externalities, peer digitalization may influence ESG performance through managerial behavior. Intensified digital competition places greater emphasis on speed, flexibility, and rapid performance feedback [52], thereby reinforcing immediate evaluation criteria. From an agency perspective, managers operating under heightened competitive and peer pressure are more likely to prioritize short-horizon outcomes that protect immediate competitive positions and career prospects, even when such choices come at the expense of long-term governance and sustainability objectives [53]. In digitally intensive environments, managerial attention may consequently shift toward short-cycle innovation and operational performance, crowding out investments in ESG-related activities that require longer planning horizons and yield fewer immediate returns [54]. Accordingly, managerial short-termism may represent an important behavioral mechanism through which peer digital technology innovation is associated with less favorable ESG performance.
Thus, the following hypothesis is advanced:
H3. 
Peer digital technology innovation is positively associated with managerial short-termism, which is negatively associated with corporate ESG performance.
Taken together, the research framework is shown in Figure 1.

3. Research Design

3.1. Sample and Data

This study focuses on A-share listed firms in China during 2012–2023. Data are primarily obtained from the China Research Data Services (CNRDS) platform and the China Stock Market & Accounting Research (CSMAR) database. The sample is further refined using the following criteria: (1) excluding firms in the financial and insurance industries; (2) removing companies classified as ST, *ST, or PT; (3) eliminating observations with missing values for key variables; and (4) winsorizing all continuous variables at the 1st and 99th percentiles to mitigate the influence of extreme outliers. The final dataset includes 33,611 firm-year observations.

3.2. Variable Definition

3.2.1. Dependent Variable: Environmental, Social and Governance Performance (ESG)

Referring to current studies [55,56], ESG performance is measured using the CNRDS ESG Rating Database, which provides a comprehensive and systematic evaluation of all A-share listed firms. This database is selected for three main reasons. First, its construction methodology is rigorous and informed by prominent international disclosure frameworks, including the GRI Standards [57], the SASB Standards [58], and ISO 26000 [59], thereby helping ensure that the metrics reflect core dimensions of sustainable development widely recognized by the global investment community. Second, the database effectively reconciles international benchmarks with China’s unique institutional environment and ESG disclosure policies, providing a highly context-specific evaluation that captures the nuances of Chinese corporate governance. Third, the database utilizes advanced data processing to synthesize massive amounts of unstructured information into longitudinal scores and rankings, offering a robust multidimensional metric that reflects a firm’s commitment to environmental protection, social responsibility, and corporate governance over time. The annual ESG composite score serves as the main dependent variable, while the Hua Zheng ESG rating from the WIND database is employed for subsequent robustness tests.

3.2.2. Independent Variable: Peer Digital Technology Innovation (PeerDigi)

The primary independent variable is Industry-Level Peer Digital Technology Innovation, which captures the extent of digital innovation activity undertaken by other firms within the same industry and reflects the broader digital competitive environment in which the firm operates. Following the methodological approaches of Gao et al. (2025) [60] and Zhao and Wang (2024) [61], this measure is constructed based on digital technology patent applications filed by a firm’s industry peers. Industry peers are identified according to the third-level industry classification of the China Securities Regulatory Commission (CSRC), which allows firms operating in relatively homogeneous technological and competitive environments to be grouped together. Digital technology innovation patents refer to patents filed by firms that are related to digital economy technologies. In accordance with the Statistical Classification of the Digital Economy and Its Core Industries (2021) issued by the National Bureau of Statistics of China, listed firms’ patent data are identified by matching national economic industry codes with the International Patent Classification (IPC) system [62]. Patent applications are employed because they capture firms’ innovative efforts and provide a timely and observable indicator of digital technological engagement [63]. Specifically, to ensure that the measure captures industry-level digital intensity rather than the focal firm’s own innovation, a “leave-one-out” approach is adopted. This calculation effectively mitigates potential mechanical correlation and reflection concerns. PeerDigii,t is operationalized as the natural logarithm of the mean number of digital patent applications of all other firms within the same industry (based on the CSRC third-level industry classification) in year t, excluding the focal firm i. The mathematical expression is as follows:
P e e r D i g i i , t = ln 1 N j , t 1 k i N j , t 1 D i g i t a l _ P a t e n t s k , t + 1
In Equation (1), D i g i t a l _ P a t e n t s k , t denotes the count of digital technology patent applications for firm k in industry j during year t, and Nj,t represents the total number of firms in that industry, with industry classification determined using three-digit industry codes. To address the highly skewed distribution of patent counts, the peer average is log-transformed after adding one.

3.2.3. Mediating Variables

Digital Risk Perception (DigiRisk): To capture firms’ subjective assessment of digital-related risks rather than their general willingness to discuss digitalization, this study constructs a sentiment-conditioned textual measure of digital risk perception. The concept of digital risk perception reflects managers’ attention to and concern about potential digital threats as expressed in corporate disclosures. Because textual narratives in annual reports provide valuable insights into managerial cognition and strategic priorities [64], they offer an effective means of identifying firms’ perceptions of digital risks under competitive and technological pressures.
Following the method proposed by Lu et al. (2025) [65], we identify digital technology risk-related texts in the MD&A sections of annual reports. To enhance construct validity and distinguish risk perception from general disclosure tendencies, promotional rhetoric, or standardized regulatory language, we construct a net-negative sentiment indicator based on the sentiment characteristics of digital-related disclosures. The indicator is constructed as the difference between the maximum negative sentiment probability of negative digital risk-related texts and the average positive sentiment probability of positive texts. When the resulting value is negative, the indicator is set to zero, indicating that positive digital expectations outweigh risk-oriented concerns and that no net digital risk perception is observed. By incorporating contextual sentiment into digital risk-related disclosures, this measure better reflects managers’ perceptions and concerns regarding digital risks. It thus provides a refined proxy for firms’ digital risk perception while reducing contamination from neutral or overly optimistic digital disclosures.
Managerial Short-termism (ShortInv): To isolate executives’ strategic time horizons from confounding financial operations, we capture managerial temporal orientation using a dictionary-based textual analysis of the MD&A section. Compared with traditional financial-based measures, which may be affected by firms’ operational and financial conditions, this textual approach provides a cleaner and more direct reflection of internal corporate cognition and strategic attention [66]. Managerial short-termism fundamentally manifests as a subjective cognitive bias where executives place disproportionate salience on present-oriented objectives and immediate tactical outcomes over long-term value creation [67]. Accordingly, leveraging the specialized short-term orientation lexicon developed and validated by Hu et al. (2021) [68], the short-termism indicator is calculated as the frequency of explicit “short-term horizon” words relative to the total MD&A word count, multiplied by 100. This normalization reduces variation arising from disclosure intensity and provides a more reliable proxy for managerial short-termism. A higher value thus signifies a more pronounced, present-oriented strategic focus within the organization.

3.2.4. Control Variables

Based on prior research [69,70,71], the following control variables are included to mitigate the impact of firm-specific characteristics. Firm attributes comprise asset size (Size), age of establishment (FirmAge), and the asset–liability ratio (Lev). Additionally, return on assets (ROA) and fixed asset intensity (FIXED) are incorporated, as firms with strong financial performance are more likely to enhance their ESG profiles. Governance and market factors include ownership concentration (Top10) and growth potential (TobinQ), as robust governance structures are generally perceived as more attractive to investors. Finally, firm and year fixed effects are included to account for time-invariant unobserved heterogeneity and common macroeconomic shocks over time. Detailed measurements are reported in Table 1.

3.3. Model Design

3.3.1. Baseline Model

To examine the relationship between peer digital technology innovation and ESG performance, we construct a two-way fixed-effects panel data model as follows:
E S G i , t = α 0 + α 1 P e e r D i g i i , t + γ k C o n t r o l s i , t + μ i + λ t + ϵ i , t
In Equation (2), i and t represent the firm and year, respectively; E S G i , t denotes the firm-level ESG performance, and P e e r D i g i i , t is the average digital technology innovation level of industry peers; α 0 is a constant, and α 1 denotes the estimated coefficient associated with PeerDigi; C o n t r o l s i , t represents the set of control variables; γ k represents the coefficient; μ i and λ t represent firm and year fixed effects; ϵ i , t is the random perturbation term. Standard errors are clustered at the firm level.

3.3.2. Mechanism Model

To further explore potential mediating pathways underlying the relationship between peer digital technology innovation and ESG performance, we conduct mediation analyses. Following the mediation analysis framework [72], we specify the following models:
M e d i a t o r i , t = β 0 + β 1 P e e r D i g i i , t + γ k C o n t r o l s i , t + μ i + λ t + ϵ i , t
E S G i , t = δ 0 + δ 1 P e e r D i g i i , t + δ 2 M e d i a t o r i , t + γ k C o n t r o l s i , t + μ i + λ t + ϵ i , t
In Equations (3) and (4), M e d i a t o r i , t denotes the mediating variables, which are digital risk perception and managerial short-termism. The meanings of other variables are consistent with those in Equation (2). Recognizing that the traditional causal steps approach may suffer from limited statistical power and robustness in panel data settings, we have strengthened our mediation analysis with two primary adjustments. We conducted bootstrap tests of the indirect effects based on 1000 replications to ensure more reliable inference. Additionally, to better capture temporal ordering and mitigate potential simultaneity bias, we re-estimated the models by employing a lagged specification of the independent variable (PeerDigit−1).

4. Empirical Results

4.1. Descriptive Statistics and Correlation Analysis

4.1.1. Descriptive Statistics

The results of the descriptive statistics are presented in Table 2 and indicate meaningful cross-sectional variation in both ESG performance and peer digital innovation. The ESG score has a mean of 28.151 and a standard deviation of 11.069, with values ranging from 2.280 to 79.322, indicating substantial dispersion across firm-year observations. The wide distribution suggests that while some firms exhibit relatively strong engagement in ESG activities, others remain at a comparatively low level of sustainability performance. For peer digital technology innovation (PeerDigi), the mean value is 0.788, with a standard deviation of 0.692. The variable ranges from 0 to 3.657, reflecting that firms operate in markedly different digital competitive environments, where some are embedded in industries with high levels of peer digital innovation, while others face relatively limited digital spillovers.

4.1.2. Pearson’s Correlation Analysis

Table 3 reports the Pearson correlation coefficients between ESG and the core explanatory variables. The findings show that peer digital technology innovation (PeerDigi) is significantly negatively correlated with corporate ESG performance at the 1% level, indicating that higher peer digital innovation intensity is associated with lower ESG performance at the bivariate level. In addition, DigiRisk and ShortInv are also negatively correlated with ESG, with the correlations being statistically significant at the 1% level, although their magnitudes are relatively small. Additionally, the correlation coefficients between ESG and the other variables are also significant at the 1% level, suggesting that the selection of control variables is appropriate.

4.2. Baseline Regression Results

Table 4 presents the benchmark regression results, examining the relationship between peer digital technology innovation and both the aggregate ESG performance and its individual environmental (E), social (S), and governance (G) pillars. Columns (1)–(3) present the main regression results with ESG performance as the dependent variable. The estimated coefficients on PeerDigi are consistently negative and significant at the 1% level, suggesting that greater exposure to peer digital technology innovation is associated with lower ESG performance. These results remain robust after controlling for firm characteristics and incorporating firm and year fixed effects, with standard errors clustered at the firm level. In terms of economic significance, the results in column (3) indicate that a one-standard-deviation increase in PeerDigi is associated with a decrease of 1.755 units in the ESG score, indicating that intensified digital competition may crowd out firms’ long-term ESG investments and commitments. This finding suggests that firms under excessive peer digital innovation pressure may prioritize technological catch-up and competitive positioning over sustainability-oriented activities. Therefore, these results provide evidence consistent with Hypothesis H1.
Recognizing that industry-level pressures may exert heterogeneous effects, we examine the multidimensional nature of ESG by analyzing its three pillars individually. Columns (4)–(6) present the results for its individual E, S, and G pillars, revealing a notable asymmetric association between industry-level peer digital innovation and the domains. While the coefficients remain negative across all dimensions, their magnitudes and statistical significance vary considerably. Specifically, the E dimension bears the brunt of the competitive pressure, with a coefficient of −2.498 (p < 0.01), which is more than double the magnitude of the effects observed for the S and G pillars. One possible explanation is that environmental activities often require substantial long-term investments in green technologies and low-carbon transformation, making them more vulnerable to resource crowding-out effects when firms face intensified digital competition and short-term technological pressure [22].

4.3. Endogeneity Test

The baseline estimates may be subject to endogeneity concerns. Specifically, similarities between focal firms and their peers may arise from shared economic, institutional, and policy environments rather than genuine peer interactions. These unobserved factors may simultaneously influence peer digital technology innovation and ESG performance, thereby biasing the baseline results. To alleviate these concerns, this study adopts an instrumental variable (IV) approach based on the Bartik shift-share framework [73,74]. The IV is constructed as the interaction between the industry-level share of digital investment in 2007 and the lagged growth rate of the national digital economy index excluding the focal firm’s province. The digital economy index is constructed based on prior studies from the dimensions of internet development and digital financial inclusion [75]. The initial industry share captures predetermined differences in digital investment exposure across industries, while the national digital economy growth rate represents an external common shock to digital development. Their interaction generates variation in peer digital technology innovation that is strongly correlated with industry-level digital innovation dynamics and is unlikely to be systematically associated with firm-level ESG performance through channels other than peer digital innovation, improving the plausibility of the relevance and exclusion restrictions, although residual concerns may remain.
Table 5 reports the results of the two-stage least squares (2SLS) estimation. Column (1) presents the first-stage regression results, showing that IV_PeerDigi is positively associated with PeerDigi and statistically significant at the 1% level, indicating strong instrument relevance. The Kleibergen–Paap rk LM statistic is significant at the 1% level, rejecting the null hypothesis of under-identification. In addition, the Kleibergen–Paap Wald rk F statistic is well above the conventional threshold of 10, suggesting that the instrument does not suffer from weak identification concerns. Column (2) reports the second-stage results with ESG performance as the dependent variable. The coefficient of PeerDigi remains negative and statistically significant, consistent with the baseline findings. This result suggests that the negative association between peer digital technology innovation and ESG performance remains statistically significant in the IV specification. Collectively, the IV estimates reinforce the robustness of the baseline conclusions.

4.4. Robustness Tests

4.4.1. Replacing the Dependent Variable

In order to assess whether our findings are sensitive to the measurement of ESG performance, we replace the baseline ESG indicator with alternative measures. Specifically, we employ the Hua Zheng ESG score, a widely used alternative ESG rating in China [76], and further decompose ESG into its environmental (E), social (S), and governance (G) components. Column (1) of Table 6 reports the results using the alternative ESG measure, while Columns (2)–(4) present the results for the three sub-dimensions. The estimated coefficients on PeerDigi remain negative and statistically significant for both the overall ESG score and the E and G dimensions, reinforcing the robustness of our primary conclusions.
Interestingly, the coefficient for the S dimension in Column (3) is positive and significant, which differs from the baseline results. This inconsistency suggests that the impact on the social dimension is less stable and may depend on how ESG components are measured across rating systems [77]. One possible explanation is that, while intensified digital competition may crowd out resource-intensive sustainability investments, it may simultaneously compel firms to enhance specific social sub-dimensions, such as data security and privacy protection, which are more heavily weighted in this alternative index. Thus, despite the variation in the social dimension, the consistently negative associations with aggregate ESG performance and the environmental and governance dimensions suggest that industry-level digital pressure emerges as an important correlate of corporate sustainability.

4.4.2. Replacing the Independent Variable

To ensure that our findings are not sensitive to the measurement of digital technology innovation, we reconstruct the key explanatory variable using digital technology patent citations. This alternative approach effectively captures the technological impact, knowledge spillovers, and commercialization potential inherent in innovation activities. As reported in Column (5) of Table 6, the coefficient on peer digital technology innovation remains negative and statistically significant. This confirms that our primary conclusions are robust to alternative measures of digital technology innovation.

4.4.3. Lagging the Independent Variable

The use of a lagged explanatory variable helps mitigate potential endogeneity concerns by limiting simultaneity and reducing the influence of measurement error and omitted variables. Accordingly, the one-period lag of peer digital technology innovation is used to reduce the possibility that current ESG performance influences contemporaneous digital innovation activities. Column (1) of Table 7 reports the results based on the lagged specification. The estimated coefficient remains negative and statistically significant, consistent with the baseline findings. This finding is consistent with the baseline results and provides additional support for the robustness of the observed relationship.

4.4.4. Controlling for Industry-Specific Time Trends

To address the concern that our results may be driven by unobserved industry-year shocks, we augment the baseline specification by incorporating industry-specific linear time trends (Ind × Year Trends). Specifically, industry trends are defined based on the CSRC second-level industry classification, allowing each broad industry segment to exhibit its own linear evolution over time. This approach helps capture long-run industry evolution and partially mitigates the confounding effects of sector-specific technological waves. As reported in Column (2) of Table 7, the coefficient on peer digital technology innovation remains negative and statistically significant, suggesting that the baseline findings are unlikely to be fully driven by underlying industry trends.

4.4.5. Potential Interference of Digital Policy

In the context of rapid digital economic development, the Chinese government has implemented a series of regional digital policy initiatives, such as the “Smart City” programs, to promote local digital transformation. These policies may simultaneously affect firms’ digital innovation activities and ESG performance, thereby confounding the baseline estimates. To mitigate this alternative explanation, we construct a city-year-level policy indicator (DIDct), which takes the value of one for cities that enter the pilot programs in year t and thereafter, and zero otherwise. We first include this policy variable in the baseline regression to control for the direct impact of policy interventions. In addition, we further exclude observations from policy pilot regions as a supplementary test. Columns (3) and (4) of Table 7 report the results. The estimated coefficients remain stable in both magnitude and significance, suggesting that the findings are unlikely to be driven solely by regional digital policy interventions.

4.4.6. Conducting a Placebo Test

As an additional assessment of empirical validity, we conduct a placebo test to further verify our primary estimates. Specifically, both lagged and future values of peer digital technology innovation are included in the regression. If the baseline results are driven by spurious correlations, future digital pressure should also exhibit significant explanatory power. However, as reported in Column (5) of Table 7, the coefficient on the future peer digital technology innovation variable is statistically insignificant, while the lagged effect remains consistent with the baseline findings. This provides additional support for the conclusion that the documented relationship is not driven by spurious correlations.

4.5. Mediation Analysis

4.5.1. Digital Risk Perception

As shown in column (1) of Table 8, the coefficient of peer digital technology innovation (PeerDigi) is significantly positive at the 1% level, indicating that higher peer digital innovation intensity is associated with greater digital risk perception (DigiRisk). Column (2) shows that DigiRisk is significantly negatively related to ESG performance, while the coefficient of PeerDigi remains significantly negative but declines in magnitude after including the mediating variable, providing evidence consistent with a partial mediation pattern. Bootstrap mediation analyses further provide evidence consistent with a negative pathway involving DigiRisk at the 1% level. The results remain robust when using the lagged independent variable (L.PeerDigi) in Columns (3)–(4). These empirical results are consistent with Hypothesis H2.
From a theoretical perspective, these findings suggest that peer-driven digital technology innovation may contribute to the diffusion of digital risk perceptions across firms. As industry peers accelerate digital technology adoption, firms experience greater pressure to pursue similar digitalization strategies in order to maintain competitiveness and legitimacy within the industry network [78]. Such dynamics may be accompanied by increased concerns regarding system vulnerabilities, data security, and operational complexity. This heightened digital risk perception may be associated with a shift in organizational attention toward immediate digital-related concerns, potentially corresponding with less emphasis on long-term ESG initiatives.

4.5.2. Managerial Short-Termism

As shown in column (1) of Table 9, peer digital technology innovation (PeerDigi) is positively and significantly associated with managerial short-termism (ShortInv) at the 1% level. Column (2) further shows that managerial short-termism is negatively related to ESG performance, while the coefficient on PeerDigi remains negative and significant after including the mediator, with a reduced magnitude. These results are consistent with a partial mediation pattern, suggesting that heightened managerial short-termism may account for part of the observed association between peer digital technology innovation and ESG performance. The negative and significant indirect effects indicate that managerial short-termism is another plausible mediator between peer digital technology innovation and ESG performance. Crucially, the results are robust to a lagged specification of the independent variable (L.PeerDigi), as shown in Columns (3)–(4). Thus, the findings are consistent with Hypothesis H3.
The results suggest that the “Red Queen” competition driven by industry-wide digital technology innovation may induce managerial myopia. To keep pace with peers’ rapid technological progress, managers may place greater emphasis on immediate performance, short-term flexibility, and near-term strategic responses. However, this shift often occurs at the expense of long-term objectives. Since ESG initiatives typically require sustained investment and yield delayed returns, they are more likely to be deprioritized under short-term market pressures [54]. Thus, peer digital innovation pressure may indirectly erode ESG performance by strengthening firms’ short-term managerial orientation.

4.6. Heterogeneity Analysis

The relationship between peer digital technology innovation and ESG performance is unlikely to be uniform across firms. Differences in firm-specific conditions and industry characteristics may shape both the intensity of competitive effects and the channels through which they operate. To further unpack these variations, we conduct a heterogeneity analysis along three dimensions: enterprise scale, technological intensity, and industry competition. This analysis offers a more detailed understanding of the boundary conditions of the baseline results, and it shows how firms may respond differently to peer digital innovation under different external and internal environments.

4.6.1. Enterprise Scale

According to the Organizational Slack Theory, firm size is a decisive factor in determining a company’s ability to navigate external shocks and competitive shifts [79]. To investigate the differential impacts of digital competitive pressure across various organizational scales, we partition the sample into three groups based on the terciles of firm size: large, medium, and small enterprises.
Table 10 reports the results of the heterogeneity analysis based on firm size. The empirical findings reveal that the relationship between peer digital technology innovation and ESG performance is non-uniform across different firm sizes. For large enterprises in Column (1), the coefficient is negative but not statistically significant, indicating no clear association between peer digital technology innovation and ESG performance. Conversely, the coefficients for medium-sized and small enterprises in Columns (2) and (3) are significantly negative, with the strongest association observed among medium-sized firms. These findings suggest that the negative association is more pronounced among small and medium-sized enterprises, whereas it appears weaker among large firms. One possible explanation is that larger firms generally possess greater resource capacity and organizational slack, which may enable them to accommodate digital competitive pressures while maintaining their ESG-related commitments.

4.6.2. Technological Intensity

Because innovation intensity varies across industries, the relationship between peer digital technology innovation and ESG performance may also differ across sectors. Table 11 presents the industry heterogeneity analysis based on technological intensity and industry competition. Columns (1) and (2) divide the sample into technology-intensive and non-technology-intensive industries. The classification follows the high-tech fields defined in the Administrative Measures for the Recognition of High-Tech Enterprises and is mapped to the major categories of the 2012 CSRC industry classification [80]. The results indicate that the coefficient on PeerDigi is significantly negative for firms operating in technology-intensive industries, whereas the coefficient is statistically insignificant for firms in non-technology-intensive industries. These findings indicate that the relationship between peer digital technology innovation and ESG performance differs across industries with varying levels of technological intensity, with a more pronounced negative association observed in technology-intensive sectors.

4.6.3. Industry Competition

The strategic impact of peer digital innovation may vary significantly depending on the competitive landscape of the industry. Columns (3) and (4) of Table 11 further examine heterogeneity across industry competition intensity, measured using industry concentration based on firms’ market shares [81]. The results indicate that PeerDigi is significantly negatively associated with ESG performance in high-competition industries, whereas the effect becomes statistically insignificant in low-competition industries. This pattern suggests that the negative association between peer digital technology innovation and ESG performance may be more pronounced in more competitive environments, while appearing weaker in less competitive settings. Thus, the industry heterogeneity analysis reveals that the relationship between peer digital technology innovation and ESG performance is not uniform across industries but is conditioned by both technological intensity and competitive structure, highlighting important boundary conditions for the baseline results.

5. Further Analysis

5.1. The Moderating Role of External Environment

Corporate strategy is inherently embedded within a broader institutional framework, and a firm’s response to competitive shifts depends on the prevailing external conditions. While peer digital innovation may impose risks and resource pressures, firms do not operate in a vacuum. Their strategic choices are often conditioned by the environment [82], as external institutional and market-based forces can discipline managerial behavior and mitigate the unintended consequences of technological competition. Consistent with the literature on environmental governance and innovation economics [22,83], these external mechanisms may provide the necessary oversight or protection to prevent digital competition from excessively compromising sustainability. Consequently, we examine whether intellectual property protection and investor attention moderate the relationship between peer digital innovation and ESG performance. To test these effects, we estimate a model incorporating interaction terms between peer digital innovation and these external governance variables:
E S G i , t = α + β 1 P e e r D i g i i , t + β 2 M i , t + β 3 ( P e e r D i g i i , t × M i , t ) + γ k C o n t r o l s i , t + μ i + λ t + ϵ i , t
where Mit represents the moderator variables including Intellectual Property Protection (IPP) and Investor Attention (IA). Specifically, following prior research [84], we measure IPP as the ratio of technology market turnover to local GDP at the provincial level, which serves as a proxy for the regional legal environment and the security of intangible assets. Investor attention is proxied by the average turnover rate during the 30 trading days prior to the earnings announcement [85], a volume-based measure that captures the intensity of market scrutiny and information processing by investors leading up to major corporate disclosures. This integrated approach allows us to examine whether formal institutional safeguards and informal market monitoring can mitigate the adverse impact of peer digital innovation on firms’ ESG performance.

5.1.1. Intellectual Property Protection

As shown in Column (1) of Table 12, the results of the moderation analysis using IPP as the moderating variable are reported. The interaction term PeerDigi × IPP is significantly negative at the 1% level, indicating that the negative association between peer digital technology innovation and ESG performance tends to be stronger in environments with stronger intellectual property protection. This result is somewhat unexpected. Intellectual property protection is often viewed as an institutional safeguard that supports innovation and long-term value creation, which could, in principle, complement firms’ sustainability efforts [86]. However, the evidence suggests that stronger IPP may also intensify competitive dynamics surrounding digital technologies. By securing innovation returns and facilitating technology diffusion, stronger IPP can strengthen both competitive and cooperative dynamics among firms [87]. In such an environment, firms may respond more aggressively to peer digital innovation, allocating more resources to technological competition while placing less emphasis on ESG-related investments.

5.1.2. Investor Attention

As shown in Column (2) of Table 12, the results of the moderation analysis using IA as the moderating variable are reported. The interaction term PeerDigi × IA is positive and statistically significant at the 1% level, indicating that greater investor attention attenuates the negative association between peer digital technology innovation and ESG performance. This finding is consistent with the view that investor attention serves as an important informal market-based governance mechanism that strengthens external monitoring and managerial accountability [88]. Under stronger external oversight, managers face greater incentives to maintain responsible corporate behavior and align strategic decisions with broader stakeholder expectations. Consequently, firms are more likely to balance digital innovation efforts with ESG commitments, which partially mitigates the adverse ESG effects associated with intensified peer digital technology innovation.

5.2. The Impact on ESG Rankings

Beyond absolute performance levels, the impact of peer digital technology innovation is further evaluated through firm-level ESG rankings. While scores capture raw performance, rankings reflect a firm’s standing relative to its peers, offering a different perspective on the distributional patterns of corporate sustainability in the context of digital competition. Applying a natural logarithmic transformation to ESG rankings serves to normalize the skewed distribution and dampen the influence of extreme values. Furthermore, this approach linearizes the ranking positions and alleviates heteroscedasticity concerns, thereby enhancing the robustness of the empirical estimation. As reported in Table 13, the coefficient on PeerDigi is positive and statistically significant at the 1% level across both the aggregate index and its three sub-dimensions in Columns (1)–(4). These findings suggest that firms facing intensified peer digital competitive pressure tend to achieve superior relative positions within the ESG hierarchy, pointing to a relative competition effect.
This pattern, while seemingly divergent from the negative baseline results found with ESG scores, reveals a nuanced competitive mechanism. The divergence stems from the fundamental difference between absolute measurement and relative sorting. In a shared competitive environment, industry-wide digital pressure may trigger a broad reallocation of resources, potentially depressing average ESG scores across the board. However, what determines rankings is the cross-sectional variation in firm responses. The positive association with rankings underscores a relative competitive effect: firms that navigate digital technology innovation more effectively or leverage ESG as a strategic differentiator can outpace their peers. This allows them to enhance their relative positioning, even if their absolute ESG investments decline in tandem with industry-wide trends.

6. Conclusions and Discussion

6.1. Main Findings

This study examines the relationship between peer digital technology innovation and corporate ESG performance using a sample of Chinese listed firms from 2012 to 2023. Contrary to the conventional “digital dividend” narrative, the results reveal a significant negative spillover effect: as industry peers intensify their digital innovation, a focal firm’s ESG performance tends to decline. The mechanism analysis provides suggestive evidence for two potential channels underlying this pattern. First, aggressive digital expansion by peers is associated with heightened digital risk perception, which corresponds to greater resource allocation to digital risk-related and operational issues, leaving relatively less attention for sustainability objectives. Second, heightened competitive pressure is accompanied by a stronger short-term managerial orientation, with firms placing relatively greater emphasis on immediate technological catch-up rather than long-term ESG commitments. In addition, heterogeneity tests indicate that this negative association is significant only among small and medium-sized enterprises, firms in technology-intensive industries, and those operating in highly competitive markets, highlighting important boundary conditions for the baseline relationship. Moreover, extended moderation analyses suggest that external governance conditions are related to variation in this association. Strong intellectual property protection is associated with a more pronounced negative relationship, whereas greater investor attention coincides with a weaker relationship. Finally, additional analyses using ESG rankings show a positive association between peer digital technology innovation and firms’ relative ESG positions. This suggests that while digital competition is associated with lower absolute ESG performance, it is also related to a redistribution of relative ESG standings across firms.
Overall, this study highlights the sustainability trade-offs associated with peer digital technology innovation within a competitive innovation ecosystem. By examining the relationship between narrowly defined industry-level digital innovation and corporate ESG performance, it provides evidence of systematic patterns linking digital competition and sustainability outcomes. Although multiple econometric strategies are employed to mitigate endogeneity concerns, the complexity of macro-level shocks and competitive interactions suggests that the findings should be interpreted primarily as strong empirical associations rather than definitive causal effects.

6.2. Theoretical Contributions

This study makes several contributions to the literature. First, it extends research on digital innovation and ESG performance by shifting attention from firms’ own digital activities to the broader peer environment in which they operate. Existing studies largely focus on how firms’ internal digital technology innovation enhances ESG performance [11,14]. In contrast, this study focuses on the competitive externalities associated with peer firms’ digital innovation [7,48,53,89]. The evidence shows that peer digital technology innovation is associated with a decline in focal firms’ ESG performance. By documenting this negative competitive effect, the study complements the predominantly positive view of digitalization in the ESG literature and provides a more balanced understanding of the potential tensions between technological advancement and sustainability commitments in an increasingly competitive environment.
Second, this study advances the understanding of the potential mechanisms and boundary conditions linking digital competition to ESG performance. By identifying digital risk perception and managerial short-termism as relevant channels, this study helps clarify the link between peer pressure and its organizational consequences [90]. Integrating insights from innovation economics, institutional theory, and sustainability research [13,91], the proposed framework suggests that the relationship between digital competition and ESG performance is not uniform across contexts but varies with institutional conditions [84]. While formal mechanisms like intellectual property protection may intensify digital competitive friction [92], informal forces such as investor attention are associated with a more balanced relationship between technological competition and corporate sustainability.
Third, this study also contributes by uncovering important boundary conditions and introducing a relative competition perspective. The negative effect is shown to be concentrated under constrained and competitive conditions, particularly among small and medium-sized enterprises, firms in technology-intensive industries, and those operating in highly competitive markets. This is consistent with the RBV and Organizational Slack Theory [79,93], which suggest that resource-constrained firms are more vulnerable to “resource diversion” when facing exogenous stressors. Furthermore, by examining ESG rankings, the study reveals that digital competition reshapes firms’ relative positions even as it reduces overall ESG performance. This highlights a previously overlooked dimension of digital technology innovation, namely its role in redistributing sustainability outcomes across firms rather than uniformly enhancing them.

6.3. Practical Implications

The findings offer several practical implications for both corporate managers and policymakers. First, for management, the results serve as a caution against reactive strategies that prioritize immediate competitive parity at the cost of long-term sustainability. To navigate the trade-offs between digital competition and ESG performance, firms should refine their digital risk management systems [50] and strengthen internal controls to ensure that executive incentives are structurally aligned with sustainability objectives [94]. Such internal alignment is crucial for preventing the resource diversion and short-termism that often accompany intensified technological rivalry.
Second, for policymakers, the evidence suggests that digital technology innovation initiatives should be more closely aligned with sustainability objectives. Given that peer digital technology innovation increasingly diffuses through supply chain networks and innovation networks, policymakers should encourage firms to build collaborative digital ecosystems that facilitate knowledge sharing and coordinated ESG rather than excessive short-term competition. In particular, strengthening mandatory ESG disclosure requirements and linking digitalization subsidies and R&D tax incentives to verified ESG performance metrics could help firms better balance digital innovation and long-term sustainability objectives.
Finally, the moderating influence of investor attention suggests that enhancing market transparency is a practical lever for better corporate conduct. Improving the accessibility and standardization of ESG data enables investors to exercise more effective oversight, turning market scrutiny into a governance tool that discourages opportunistic behavior. Strengthening the communication channels between firms and institutional investors regarding the long-term value of digital investments can help stabilize corporate strategy, ensuring that the trajectory of technological evolution remains aligned with broader stakeholder interests.

6.4. Limitations and Future Research Directions

Although this study provides robust evidence of a negative link between peer digital innovation and ESG performance, several limitations suggest avenues for further inquiry. First, although our results highlight a significant crowding-out effect, it remains unclear whether this phenomenon represents a transitory friction or a structural shift in corporate priorities. Future research could investigate the long-term dynamics of this relationship to determine if firms eventually reach a digital-ESG equilibrium as their technological capabilities mature and competitive pressures stabilize. Second, this study treats industry-level digital competition as an external force at the aggregate level, which may obscure important structural heterogeneity. Moreover, although the leave-one-out measure helps mitigate the reflection problem and the instrumental variable approach alleviates endogeneity concerns, they cannot fully eliminate remaining identification threats associated with unobserved industry-wide technological and institutional shocks. As a result, the estimated relationship may partly capture broader industry dynamics alongside peer-related competitive pressures. Since competitive interactions are often embedded within multiple network structures [95], future research could incorporate multi-layer network approaches, natural experiments, or exogenous policy shocks to better disentangle the distinct channels through which digital innovation pressure and corporate sustainability are related. Third, the impact of digital competition pressures may differ across the environmental, social, and governance dimensions. The mixed evidence observed for the social pillar in this study suggests that ESG ratings may capture distinct aspects of firm behavior depending on the measurement framework. Future research could employ more granular indicators, such as disaggregated ESG sub-scores or textual disclosure data, to examine how digital competition affects specific components. In addition, comparisons across ESG rating methodologies may help clarify how measurement differences contribute to divergent findings across ESG dimensions.


Author Contributions

Conceptualization, Y.L. and M.L.; methodology, Y.L. and M.L.; software, Y.L.; formal analysis, Y.L.; validation, Y.W. and S.L.S.; investigation, Y.L., Y.W. and S.L.S.; data curation, Y.L.; writing—original draft preparation, Y.L.; writing—review and editing, M.L. and Y.W.; supervision, M.L.; project administration, M.L.; resources, M.L. and Y.W.; funding acquisition, M.L. All authors have read and agreed to the published version of the manuscript.

Funding

This research was funded by the National Natural Science Foundation of China (72074081) and the Natural Science Foundation of Guangdong Province (2024A1515011588, 2025A1515012206).

Data Availability Statement

The datasets used or analyzed during the current study are available from the relevant databases or from the corresponding author upon reasonable request.

Conflicts of Interest

The authors declare no conflicts of interest.

References

  1. de Souza Barbosa, A.; da Silva, M.C.B.C.; da Silva, L.B.; Morioka, S.N.; de Souza, V.F. Integration of Environmental, Social, and Governance (ESG) Criteria: Their Impacts on Corporate Sustainability Performance. Humanit. Soc. Sci. Commun. 2023, 10, 410. [Google Scholar] [CrossRef] [Scilit]
  2. Edmans, A. The End of ESG. Financ. Manag. 2023, 52, 3–17. [Google Scholar] [CrossRef] [Scilit]
  3. Yu, Y.; Chan, H.-L.; Cho, E. Enhancing ESG Performance through Digital Transformation: Recent Development, Cases and Relationships. J. Bus. Res. 2026, 202, 115763. [Google Scholar] [CrossRef] [Scilit]
  4. Ren, X.; Zeng, G.; Sun, X. The Peer Effect of Digital Transformation and Corporate Environmental Performance: Empirical Evidence from Listed Companies in China. Econ. Model. 2023, 128, 106515. [Google Scholar] [CrossRef] [Scilit]
  5. Rachinger, M.; Rauter, R.; Müller, C.; Vorraber, W.; Schirgi, E. Digitalization and Its Influence on Business Model Innovation. J. Manuf. Technol. Manag. 2019, 30, 1143–1160. [Google Scholar] [CrossRef] [Scilit]
  6. Li, W.; Wang, F.; Liu, T.; Xue, Q.; Liu, N. Peer Effects of Digital Innovation Behavior: An External Environment Perspective. Manag. Decis. 2023, 61, 2173–2200. [Google Scholar] [CrossRef] [Scilit]
  7. Wang, J.; Lu, J.; Dabic, M.; Halaszovich, T. Digitalization-Based Competitive Pressure Originating from Coopetitors and the Focal Firm’s Digital Innovation. IEEE Trans. Eng. Manag. 2025, 72, 3433–3448. [Google Scholar] [CrossRef] [Scilit]
  8. Yang, X.; Han, Q. Nonlinear Effects of Enterprise Digital Transformation on Environmental, Social and Governance (ESG) Performance: Evidence from China. Sustain. Account. Manag. Policy J. 2024, 15, 355–381. [Google Scholar] [CrossRef] [Scilit]
  9. Ali, A.; Yang, Q.; Jiang, X.; Fey, C.F.; Ali, A. Digital-Driven Sustainability: The Role of Digitalization in Mitigating Environmental Misconduct in Emerging Economies. IEEE Trans. Eng. Manag. 2026, 73, 1071–1085. [Google Scholar] [CrossRef] [Scilit]
  10. Wang, T.; Chen, C.; Jia, X. Can Digitalization Drive Corporate Transparency? Exploring the Impact of Digital Transformation on Information Disclosure Quality. Inf. Manag. 2026, 63, 104297. [Google Scholar] [CrossRef] [Scilit]
  11. Lu, Y.; Xu, C.; Zhu, B.; Sun, Y. Digitalization Transformation and ESG Performance: Evidence from China. Bus. Strategy Environ. 2024, 33, 352–368. [Google Scholar] [CrossRef] [Scilit]
  12. Fichman, R.G.; Dos Santos, B.L.; Zheng, Z. (Eric) Digital Innovation as a Fundamental and Powerful Concept in the Information Systems Curriculum1. Manag. Inf. Syst. Q. 2014, 38, 329–354. [Google Scholar] [CrossRef] [Scilit]
  13. Liu, Y.; Dong, J.; Mei, L.; Shen, R. Digital Innovation and Performance of Manufacturing Firms: An Affordance Perspective. Technovation 2023, 119, 102458. [Google Scholar] [CrossRef] [Scilit]
  14. Xiao, S.; Xu, J.; Li, R. Are Digital Trends Driving Corporate Environmental, Social, and Governance Practices? Evidence from China. Bus. Strategy Environ. 2024, 33, 5366–5385. [Google Scholar] [CrossRef] [Scilit]
  15. Cao, B.; Li, L.; Zhang, K.; Ma, W. The Influence of Digital Intelligence Transformation on Carbon Emission Reduction in Manufacturing Firms. J. Environ. Manag. 2024, 367, 121987. [Google Scholar] [CrossRef] [Scilit] [PubMed]
  16. He, Z.; Kuai, L.; Wang, J. Driving Mechanism Model of Enterprise Green Strategy Evolution under Digital Technology Empowerment: A Case Study Based on Zhejiang Enterprises. Bus. Strategy Environ. 2023, 32, 408–429. [Google Scholar] [CrossRef] [Scilit]
  17. Ayadi, I.; Hunjra, A.I. Firms in Times of Economic Uncertainty: Digital Integration to Counter Information Asymmetry and ESG Controversies. Bus. Ethics Environ. Responsib. 2026, 35, 99–116. [Google Scholar] [CrossRef] [Scilit]
  18. Wang, Z.; Tang, P. Substantive Digital Innovation or Symbolic Digital Innovation: Which Type of Digital Innovation Is More Conducive to Corporate ESG Performance? Int. Rev. Econ. Financ. 2024, 93, 1212–1228. [Google Scholar] [CrossRef] [Scilit]
  19. Liu, Z.; Pang, Y.; Pan, Y. Emerging Market MNEs, Digital Transformation and ESG Performance: Evidence from China’s Listed Companies. Appl. Econ. 2025, 57, 3758–3775. [Google Scholar] [CrossRef] [Scilit]
  20. Manita, R.; Elommal, N.; Baudier, P.; Hikkerova, L. The Digital Transformation of External Audit and Its Impact on Corporate Governance. Technol. Forecast. Soc. Change 2020, 150, 119751. [Google Scholar] [CrossRef] [Scilit]
  21. Ardito, L. The Influence of Firm Digitalization on Sustainable Innovation Performance and the Moderating Role of Corporate Sustainability Practices: An Empirical Investigation. Bus. Strategy Environ. 2023, 32, 5252–5272. [Google Scholar] [CrossRef] [Scilit]
  22. Song, L.; Yu, Y.; Li, T.; Zhang, J. Crowding out Sustainability? The Trade-off between Digital Technology Innovation and CO2 Emissions: Firm-Level Evidence. J. Clean. Prod. 2025, 523, 146441. [Google Scholar] [CrossRef] [Scilit]
  23. Zhu, S.; Lv, K.; Zhao, Y. Trust (in)Congruence, Digital Technological Innovation, and Firms’ ESG Performance: A Polynomial Regression with Response Surface Analysis. J. Environ. Manag. 2025, 373, 123689. [Google Scholar] [CrossRef] [Scilit] [PubMed]
  24. Wang, J.; Song, Z.; Xue, L. Digital Technology for Good: Path and Influence—Based on the Study of ESG Performance of Listed Companies in China. Appl. Sci. 2023, 13, 2862. [Google Scholar] [CrossRef] [Scilit]
  25. Liu, H.; Cui, C.; Chen, X.; Xiu, P. How Can Regional Integration Promote Corporate Innovation? A Peer Effect Study of R&D Expenditure. J. Innov. Knowl. 2023, 8, 100444. [Google Scholar] [CrossRef] [Scilit]
  26. Machokoto, M.; Gyimah, D.; Ntim, C.G. Do Peer Firms Influence Innovation? Br. Account. Rev. 2021, 53, 100988. [Google Scholar] [CrossRef] [Scilit]
  27. Machokoto, M.; Chipeta, C.; Ibeji, N. The Institutional Determinants of Peer Effects on Corporate Cash Holdings. J. Int. Financ. Mark. Inst. Money 2021, 73, 101378. [Google Scholar] [CrossRef] [Scilit]
  28. Seo, H. Peer Effects in Corporate Disclosure Decisions. J. Account. Econ. 2021, 71, 101364. [Google Scholar] [CrossRef] [Scilit]
  29. Zhong, X.; He, Z.; Ren, G. Unraveling the Impact of Peer Government Digital Procurement on Corporate Digital Innovation: Insights from the AMC Framework. IEEE Trans. Eng. Manag. 2026, 73, 247–260. [Google Scholar] [CrossRef] [Scilit]
  30. Ji, Z.; Chen, Z.; Onwachukwu, C.I. Peer Effect in Corporate Environmental Information Disclosure: Evidence from Listed Firms in China. Environ. Dev. Sustain. 2024, 26, 32387–32407. [Google Scholar] [CrossRef] [Scilit]
  31. Subramaniam, M.; Iyer, B.; Venkatraman, V. Competing in Digital Ecosystems. Bus. Horiz. 2019, 62, 83–94. [Google Scholar] [CrossRef] [Scilit]
  32. Zahra, S.A.; Liu, W.; Si, S. How Digital Technology Promotes Entrepreneurship in Ecosystems. Technovation 2023, 119, 102457. [Google Scholar] [CrossRef] [Scilit]
  33. Zhang, Q.; Wang, X.; Su, C.; Liu, J. Research on the Complex Network Characteristics and Driver Paths of Virtual Agglomeration in Manufacturing. Systems 2026, 14, 426. [Google Scholar] [CrossRef] [Scilit]
  34. Wang, Y.; Li, Z. How Do Core Management Team Network Ties Affect Green Innovation? Evidence from the Chinese ICT Industry. Sustainability 2025, 17, 3217. [Google Scholar] [CrossRef] [Scilit]
  35. Arrow, K.J. Economic Welfare and the Allocation of Resources for Invention. In Readings in Industrial Economics: Volume Two: Private Enterprise and State Intervention; Rowley, C.K., Ed.; Macmillan Education: London, UK, 1972; pp. 219–236. [Google Scholar]
  36. Aghion, P.; Bloom, N.; Blundell, R.; Griffith, R.; Howitt, P. Competition and Innovation: An Inverted-U Relationship. Q. J. Econ. 2005, 120, 701–728. [Google Scholar] [CrossRef] [Scilit]
  37. Barney, J. Firm Resources and Sustained Competitive Advantage. J. Manag. 1991, 17, 99–120. [Google Scholar] [CrossRef] [Scilit]
  38. Li, H.; Wu, Y.; Cao, D.; Wang, Y. Organizational Mindfulness towards Digital Transformation as a Prerequisite of Information Processing Capability to Achieve Market Agility. J. Bus. Res. 2021, 122, 701–712. [Google Scholar] [CrossRef] [Scilit]
  39. Clemons, E.K.; Row, M.C. Sustaining IT Advantage: The Role of Structural Differences. MIS Q. 1991, 15, 275–292. [Google Scholar] [CrossRef] [Scilit] [PubMed]
  40. Carr, N.G. IT Doesn’t Matter. Educause Review, 1 May 2003; pp. 24–28.
  41. Barnett, W.P.; Hansen, M.T. The Red Queen in Organizational Evolution. Strateg. Manag. J. 1996, 17, 139–157. [Google Scholar] [CrossRef] [Scilit]
  42. Breznitz, D.; Murphree, M. Run of the Red Queen: Government, Innovation, Globalization, and Economic Growth in China; Yale University Press: New Haven, CT, USA, 2011. [Google Scholar]
  43. Barnett, W.P.; Pontikes, E.G. The Red Queen, Success Bias, and Organizational Inertia. Manag. Sci. 2008, 54, 1237–1251. [Google Scholar] [CrossRef] [Scilit]
  44. Gregori, P.; Holzmann, P. Digital Sustainable Entrepreneurship: A Business Model Perspective on Embedding Digital Technologies for Social and Environmental Value Creation. J. Clean. Prod. 2020, 272, 122817. [Google Scholar] [CrossRef] [Scilit]
  45. Brenner, B.; Hartl, B. The Perceived Relationship between Digitalization and Ecological, Economic, and Social Sustainability. J. Clean. Prod. 2021, 315, 128128. [Google Scholar] [CrossRef] [Scilit]
  46. Vial, G. Understanding Digital Transformation: A Review and a Research Agenda. J. Strateg. Inf. Syst. 2019, 28, 118–144. [Google Scholar] [CrossRef] [Scilit]
  47. Martín-Peña, M.-L.; Lorenzo, P.C.; Meyer, N. Digital Platforms and Business Ecosystems: A Multidisciplinary Approach for New and Sustainable Business Models. Rev. Manag. Sci. 2024, 18, 2465–2482. [Google Scholar] [CrossRef] [Scilit]
  48. Dąbrowska, J.; Almpanopoulou, A.; Brem, A.; Chesbrough, H.; Cucino, V.; Di Minin, A.; Giones, F.; Hakala, H.; Marullo, C.; Mention, A.-L.; et al. Digital Transformation, for Better or Worse: A Critical Multi-Level Research Agenda. R&D Manag. 2022, 52, 931–954. [Google Scholar] [CrossRef] [Scilit]
  49. Cao, Z.; Tang, C.; Li, Z. The Impact of Digital Transformation on Firm Risk: Effort by Talk or Effort by Walk. Pac.-Basin Financ. J. 2025, 94, 102971. [Google Scholar] [CrossRef] [Scilit]
  50. Uddin, M.H.; Mollah, S.; Islam, N.; Ali, M.H. Does Digital Transformation Matter for Operational Risk Exposure? Technol. Forecast. Soc. Change 2023, 197, 122919. [Google Scholar] [CrossRef] [Scilit]
  51. Ocasio, W. Towards an Attention-Based View of the Firm. Strateg. Manag. J. 1997, 18, 187–206. [Google Scholar] [CrossRef]
  52. Cosa, M.; Torelli, R. Digital Transformation and Flexible Performance Management: A Systematic Literature Review of the Evolution of Performance Measurement Systems. Glob. J. Flex. Syst. Manag. 2024, 25, 445–466. [Google Scholar] [CrossRef] [Scilit]
  53. Su, Y.; Zhu, C.; Albitar, K. Market Competition and Corporate ESG Greenwashing: A Perspective from New Entrants. Bus. Strategy Environ. 2026, 35, 2266–2294. [Google Scholar] [CrossRef] [Scilit]
  54. Liu, H.; Zhang, Z. The Impact of Managerial Myopia on Environmental, Social and Governance (ESG) Engagement: Evidence from Chinese Firms. Energy Econ. 2023, 122, 106705. [Google Scholar] [CrossRef] [Scilit]
  55. Shao, F.; Qin, C.; Wen, C. Unveiling the Link between Firm ESG Performance and CSR Disclosure Quality: The Mediating Impact of Stakeholder Attention. Int. Rev. Financ. Anal. 2026, 110, 104845. [Google Scholar] [CrossRef] [Scilit]
  56. Wang, H.; Liu, H. Effects of Equity Incentives on Corporate ESG Performance–Multiperiod Difference-in-Differences Method. Financ. Res. Lett. 2025, 79, 107191. [Google Scholar] [CrossRef] [Scilit]
  57. GRI Standards; GRI Sustainability Reporting Standards. Global Sustainability Standards Board: Amsterdam, The Netherlands, 2021.
  58. SASB Standards; Sustainability Accounting Standards. Sustainability Accounting Standards Board: San Francisco, CA, USA, 2018.
  59. ISO 26000; Guidance on Social Responsibility. International Organization for Standardization: Geneva, Switzerland, 2010.
  60. Gao, Y.; Liu, S.; Yang, L. The Dynamics of Peer Influence in Corporate ESG Practices. Int. Rev. Financ. Anal. 2025, 103, 104186. [Google Scholar] [CrossRef] [Scilit]
  61. Zhao, T.; Wang, H. The Industry Peer Effect of Enterprise ESG Performance: The Moderating Effect of Customer Concentration. Int. Rev. Econ. Financ. 2024, 92, 1499–1525. [Google Scholar] [CrossRef] [Scilit]
  62. Huang, Q.; Xu, C.; Xue, X.; Zhu, H. Can Digital Innovation Improve Firm Performance: Evidence from Digital Patents of Chinese Listed Firms. Int. Rev. Financ. Anal. 2023, 89, 102810. [Google Scholar] [CrossRef] [Scilit]
  63. Bronzini, R.; Piselli, P. The Impact of R&D Subsidies on Firm Innovation. Res. Policy 2016, 45, 442–457. [Google Scholar] [CrossRef] [Scilit]
  64. Loughran, T.; McDonald, B. When Is a Liability Not a Liability? Textual Analysis, Dictionaries, and 10-Ks. J. Financ. 2011, 66, 35–65. [Google Scholar] [CrossRef] [Scilit]
  65. Lu, Y.; Shi, H.; Zhou, X. Impact of Digital Technology Risk Exposure on Corporate Value in Chinese Firms: Evidence from Text Analysis Using Large Language Models. Econ. Res. J. 2025, 60, 73–89. [Google Scholar]
  66. Smulowitz, S.J.; Cossin, D.; Lu, H. Managerial Short-Termism and Corporate Social Performance: The Moderating Role of External Monitoring. J. Bus. Ethics 2023, 188, 759–778. [Google Scholar] [CrossRef] [Scilit]
  67. Lin, Y.; Shi, W.; Prescott, J.E.; Yang, H. In the Eye of the Beholder: Top Managers’ Long-Term Orientation, Industry Context, and Decision-Making Processes. J. Manag. 2019, 45, 3114–3145. [Google Scholar] [CrossRef] [Scilit]
  68. Hu, N.; Xue, F.; Wang, H. Does Managerial Myopia Affect Long-Term Investment? Based on Text Analysis and Machine Learning. Manag. World 2021, 37, 139–156. [Google Scholar]
  69. Xue, X.; Li, L.; Chen, J.; Luo, T. How Does Digital Technology Innovation Quality Empower Corporate ESG Performance? The Roles of Digital Transformation and Digital Technology Diffusion. Systems 2025, 13, 929. [Google Scholar] [CrossRef] [Scilit]
  70. Hongbin, Y.; Fei, W.; Zhijie, L.; Cifuentes-Faura, J. Private vs. Public: Differential Impacts of Sustainable Innovation on ESG Performance in the Digitalize Era. Bus. Strategy Environ. 2025, 34, 4030–4047. [Google Scholar] [CrossRef] [Scilit]
  71. Zhang, Y.; Wang, J.; Song, Y. Trade Networks and Corporate ESG Performance: Evidence from Chinese Resource-Based Enterprises. J. Environ. Manag. 2024, 367, 122079. [Google Scholar] [CrossRef] [Scilit] [PubMed]
  72. Wen, Z.; Ye, B. Analyses of Mediating Effects: The Development of Methods and Models. Adv. Psychol. Sci. 2014, 22, 731. [Google Scholar] [CrossRef] [Scilit]
  73. Borusyak, K.; Hull, P.; Jaravel, X. Quasi-Experimental Shift-Share Research Designs. Rev. Econom. Stud. 2022, 89, 181–213. [Google Scholar] [CrossRef] [Scilit] [PubMed]
  74. Goldsmith-Pinkham, P.; Sorkin, I.; Swift, H. Bartik Instruments: What, When, Why, and How. Am. Econ. Rev. 2020, 110, 2586–2624. [Google Scholar] [CrossRef] [Scilit]
  75. Zhao, T.; Zhang, Z.; Liang, S. Digital Economy, Entrepreneurship, and High-Quality Economic Development: Empirical Evidence from Urban China. Front. Econ. China 2022, 17, 393. [Google Scholar] [CrossRef]
  76. Ren, X.; Zeng, G.; Zhao, Y. Digital Finance and Corporate ESG Performance: Empirical Evidence from Listed Companies in China. Pac.-Basin Financ. J. 2023, 79, 102019. [Google Scholar] [CrossRef] [Scilit]
  77. Berg, F.; Kölbel, J.F.; Rigobon, R. Aggregate Confusion: The Divergence of ESG Ratings*. Rev. Financ. 2022, 26, 1315–1344. [Google Scholar] [CrossRef] [Scilit]
  78. Li, Z.; Guo, F.; Du, Z. Learning from Peers: How Peer Effects Reshape the Digital Value Chain in China? J. Theor. Appl. Electron. Commer. Res. 2025, 20, 41. [Google Scholar] [CrossRef] [Scilit]
  79. Tognazzo, A.; Gubitta, P.; Favaron, S.D. Does Slack Always Affect Resilience? A Study of Quasi-Medium-Sized Italian Firms. Entrep. Reg. Dev. 2016, 28, 768–790. [Google Scholar] [CrossRef] [Scilit]
  80. Chen, L.; Khurram, M.U.; Gao, Y.; Abedin, M.Z.; Lucey, B. ESG Disclosure and Technological Innovation Capabilities of the Chinese Listed Companies. Res. Int. Bus. Financ. 2023, 65, 101974. [Google Scholar] [CrossRef] [Scilit]
  81. Na, J.; Sim, J.; Park, Y.S. Does Customer Concentration Hinder or Enhance Manufacturing Firms’ ESG Performance? Customer Concentration, Manufacturer Industry Competition and ESG Performance. J. Manuf. Technol. Manag. 2025, 36, 1119–1140. [Google Scholar] [CrossRef] [Scilit]
  82. Shou, M.; Chen, H.; Huang, Z. Institutional Environment and Firms’ Market Value: An Uncertainty Reduction Perspective. J. Eng. Tech. Manag. 2025, 76, 101882. [Google Scholar] [CrossRef] [Scilit]
  83. Wei, R.; Yu, Z.; Zhen, D. The Differentiated Effect of China’s New Environmental Protection Law on Corporate ESG Performance. Econ. Anal. Policy 2025, 85, 2126–2141. [Google Scholar] [CrossRef] [Scilit]
  84. Ren, S.; Hao, Y.; Wu, H. The Role of Outward Foreign Direct Investment (OFDI) on Green Total Factor Energy Efficiency: Does Institutional Quality Matters? Evidence from China. Resour. Policy 2022, 76, 102587. [Google Scholar] [CrossRef] [Scilit]
  85. Loh, R.K. Investor Inattention and the Underreaction to Stock Recommendations. Financ. Manag. 2010, 39, 1223–1252. [Google Scholar] [CrossRef] [Scilit]
  86. Adomako, S.; Tran, M.D. Intellectual Property Rights Protection and Sustainable Innovation Performance: The Mediating Role of Technology Spillover. Sustain. Dev. 2025, 33, 1879–1891. [Google Scholar] [CrossRef] [Scilit]
  87. Telg, N.; Lokshin, B.; Letterie, W. How Formal and Informal Intellectual Property Protection Matters for Firms’ Decision to Engage in Coopetition: The Role of Environmental Dynamism and Competition Intensity. Technovation 2023, 124, 102751. [Google Scholar] [CrossRef] [Scilit]
  88. Sun, Z.; Sun, X.; Wang, W.; Wang, W. Digital Transformation and Greenwashing in Environmental, Social, and Governance Disclosure: Does Investor Attention Matter? Bus. Ethics Environ. Responsib. 2025, 34, 81–102. [Google Scholar] [CrossRef] [Scilit]
  89. Zhao, Y.; Cao, L.; Yu, F. The Power of Peers: How Common Ownership Networks Shape Corporate Digitalization. Chin. Manag. Stud. 2025, 20, 1345–1379. [Google Scholar] [CrossRef] [Scilit]
  90. Ma, X.; Li, S.; Sun, X.; Che, T. When Green Meets Institutional Pressures: How TMT Environmental Awareness Affects Radical Green Innovation. J. Bus. Ethics 2026. [Google Scholar] [CrossRef] [Scilit]
  91. Edacherian, S.; Panicker, V.S.; Chizema, A. R&D Investments in Emerging Market Firms: The Role of Institutional Investors and Board Interlocks. R&D Manag. 2024, 54, 993–1015. [Google Scholar] [CrossRef] [Scilit]
  92. Acemoglu, D.; Akcigit, U. Intellectual Property Rights Policy, Competition and Innovation. J. Eur. Econ. Assoc. 2012, 10, 1–42. [Google Scholar] [CrossRef] [Scilit]
  93. Zhu, S.; Gao, P.; Tang, Z.; Tian, M. The Research Venation Analysis and Future Prospects of Organizational Slack. Sustainability 2022, 14, 2585. [Google Scholar] [CrossRef] [Scilit]
  94. Guo, X.; Li, M.; Wang, Y.; Mardani, A. Does Digital Transformation Improve the Firm’s Performance? From the Perspective of Digitalization Paradox and Managerial Myopia. J. Bus. Res. 2023, 163, 113868. [Google Scholar] [CrossRef] [Scilit]
  95. Liu, Y.T.; Rhee, S.Y.; Hyun, E.J. Knowledge Exploitation, Inventor Characteristics, and Green Innovation Performance in Automotive Firms. Systems 2025, 13, 6. [Google Scholar] [CrossRef] [Scilit]
Figure 1. Research framework.
Systems 14 00792 g001
Table 1. Variables and measurements.
TypeVariablesSymbolMeasurement
Dependent variableESG PerformanceESGThe ESG score of the firm provided by CNRDS.
Independent variablePeer Digital Technology
Innovation
PeerDigiThe average level of digital technology innovation of all other firms within the same industry and year, as defined above.
Mediating variableDigital Risk PerceptionDigiRiskThe difference between the maximum negative sentiment probability and the average positive sentiment probability within digital technology risk-related texts identified from the MD&A section.
Managerial Short-termismShortInvThe frequency of “short-term horizon” words in the MD&A section divided by the total MD&A word count, multiplied by 100.
Control variableFirm SizeSizeThe natural logarithm of the firm’s total assets.
Firm AgeFirmAgeThe natural logarithm of the number of years since the firm’s incorporation.
LeverageLevTotal liabilities divided by total assets.
Return on AssetsROANet income divided by total assets.
Fixed Asset IntensityFIXEDNet fixed assets divided by total assets.
Ownership ConcentrationTop10The aggregate shareholding percentage of the top ten shareholders.
Market ValuationTobinQThe ratio of the firm’s market value to its replacement cost.
Table 2. Statistical description of variables.
VariableNMeanStd. D.MinMax
ESG33,61128.15111.0692.28079.322
PeerDigi33,6110.7880.6920.0003.657
DigiRisk33,6110.1860.3880.0001.000
ShortInv33,6110.0350.0310.0000.457
Size33,61122.2861.29019.58526.440
FirmAge33,6112.9740.3141.6093.638
Lev33,6110.4210.2040.0350.925
ROA33,6110.0360.066−0.3750.254
FIXED33,6110.2080.1560.0020.725
Top1033,6110.5780.1520.2080.910
TobinQ33,6112.0341.3530.78916.647
Table 3. Pearson’s correlation coefficients.
VariableESG PeerDigiDigiRiskShortInvSizeFirmAge
ESG1
PeerDigi−0.262 ***1
DigiRisk−0.082 ***0.277 ***1
ShortInv−0.055 ***−0.026 ***−0.065 ***1
Size0.132 ***−0.147 ***−0.011 **0.101 ***1
FirmAge0.122 ***−0.081 ***−0.006000.055 ***0.174 ***1
Lev0.018 ***−0.123 ***−0.070 ***0.126 ***0.489 ***0.160 ***
ROA0.042 ***−0.028 ***−0.019 ***−0.084 ***0.038 ***−0.089 ***
FIXED0.149 ***−0.149 ***−0.158 ***0.160 ***0.104 ***0.014 ***
Top100.015 ***−0.069 ***−0.049 ***0.0050.132 ***−0.184 ***
TobinQ−0.060 ***0.099 ***0.068 ***−0.089 ***−0.372 ***−0.051 ***
LevROAFIXEDTop10TobinQ
Lev1
ROA−0.347 ***1
FIXED0.088 ***−0.060 ***1
Top10−0.087 ***0.243 ***0.037 ***1
TobinQ−0.246 ***0.149 ***−0.105 ***−0.086 ***1
Note: ***, and ** represent the significance levels at 1% and 5%, respectively.
Table 4. Benchmark regression results.
(1)(2)(3)(4)(5)(6)
VariablesESGESGESGESG
PeerDigi−4.188 ***−1.798 ***−1.755 ***−2.498 ***−1.010 **−1.141 ***
(0.167)(0.306)(0.309)(0.584)(0.466)(0.288)
Size 0.725 ***1.579 ***0.3190.261
(0.166)(0.304)(0.236)(0.161)
FirmAge −2.271 *−1.8850.198−2.661 **
(1.162)(2.211)(1.679)(1.192)
Lev 1.554 ***−2.412 **1.1415.198 ***
(0.596)(1.086)(0.845)(0.576)
ROA 0.4662.810 *−2.0770.484
(0.923)(1.691)(1.302)(1.003)
FIXED 1.751 **6.113 ***2.523 **−0.247
(0.806)(1.532)(1.119)(0.778)
Top10 2.116 ***6.486 ***−2.481 **5.284 ***
(0.807)(1.484)(1.139)(0.807)
TobinQ −0.0240.009−0.158 **0.112 **
(0.052)(0.097)(0.077)(0.055)
Constant31.451 ***23.763 ***11.710 ***−24.218 ***16.122 **18.347 ***
(0.233)(0.252)(4.418)(8.164)(6.522)(4.560)
Firm FENoYesYesYesYesYes
Year FENoYesYesYesYesYes
Observations33,61133,61133,61133,61133,61133,611
R-squared0.0690.1610.1640.4460.0390.191
Note: T values are in parentheses. ***, **, and * represent the significance levels at 1%, 5%, and 10%, respectively.
Table 5. Instrumental variable test.
(1)(2)
First-StageSecond-Stage
VariablesPeerDigiESG
IV_PeerDigi1.694 ***−7.126 **
(11.31)(−2.36)
Size0.0040.862 ***
(0.40)(4.59)
FirmAge0.083−1.618
(1.44)(−1.13)
Lev−0.059 *0.992
(−1.96)(1.48)
ROA−0.032−0.128
(−0.85)(−0.13)
FIXED−0.0011.921 **
(−0.03)(2.09)
Top10−0.072 *1.325
(−1.94)(1.44)
TobinQ−0.0020.024
(−0.70)(0.42)
Firm FEYesYes
Year FEYesYes
Observations28,37728,377
R-squared0.0050.141
Kleibergen–Paap rk LM statistic104.07 ***
Kleibergen–Paap Wald rk F statistic127.83
Note: T values are in parentheses. ***, **, and * represent the significance levels at 1%, 5%, and 10%, respectively.
Table 6. Robustness test results of alternative measures.
(1)(2) (3)(4)(5)
Replacing ESGReplacing E Replacing SReplacing GReplacing PeerDigi
VariablesESG_HZE_HZS_HZG_HZESG
PeerDigi−0.063 **−1.283 ***0.976 ***−0.390 *
(0.029)(0.275)(0.306)(0.228)
PeerDigi_cite −0.002 *
(0.001)
Size0.219 ***1.260 ***1.368 ***1.112 ***0.723 ***
(0.018)(0.144)(0.177)(0.123)(0.166)
FirmAge−0.1450.187−0.321−2.206 ***−2.254 *
(0.129)(1.047)(1.314)(0.832)(1.158)
Lev−0.815 ***−1.648 ***0.893−9.699 ***1.620 ***
(0.061)(0.513)(0.611)(0.495)(0.590)
ROA0.251 **−1.658 **5.873 ***3.945 ***0.525
(0.103)(0.804)(0.972)(0.895)(0.918)
FIXED−0.284 ***1.664 **−2.942 ***−1.395 **1.808 **
(0.083)(0.653)(0.846)(0.622)(0.803)
Top100.0520.3700.708−0.2092.270 ***
(0.086)(0.680)(0.860)(0.608)(0.801)
TobinQ−0.018 ***−0.066−0.021−0.020−0.027
(0.006)(0.043)(0.052)(0.045)(0.051)
Constant0.36132.079 ***42.895 ***68.540 ***10.428 **
(0.492)(3.944)(4.757)(3.250)(4.386)
Firm FEYesYesYesYesYes
Year FEYesYesYesYesYes
Observations33,61133,61133,61133,61133,611
R-squared0.0430.1120.0820.1190.162
Note: T values are in parentheses. ***, **, and * represent the significance levels at 1%, 5%, and 10%, respectively.
Table 7. Further robustness test results.
(1)(2) (3)(4)(5)
One-Period Lagged TestControlling for Industry-Year Trends Controlling for Digital Policy ShocksExcluding Digital Policy SamplesPlacebo Test
VariablesESGESGESGESGESG
PeerDigi −2.170 ***−1.760 ***−1.680 ***
(0.514)(0.309)(0.348)
L.PeerDigi−1.318 *** −1.650 ***
(0.335) (0.398)
DIDct 0.582
(0.370)
F.PeerDigi −0.193
(0.368)
Size0.774 ***0.702 ***0.728 ***0.897 ***0.603 ***
(0.187)(0.166)(0.166)(0.189)(0.211)
FirmAge−2.071−2.079 *−2.279 **−3.516 ***−1.587
(1.457)(1.156)(1.161)(1.339)(1.694)
Lev1.541 **1.605 ***1.557 ***1.607 **1.353 *
(0.663)(0.593)(0.595)(0.671)(0.750)
ROA1.317−0.0280.4500.6931.462
(0.989)(0.920)(0.923)(1.027)(1.120)
FIXED1.813 **0.8031.743 **2.007 **1.170
(0.923)(0.799)(0.806)(0.934)(1.040)
Top102.474 ***1.938 **2.108 ***1.792 *2.285 **
(0.911)(0.796)(0.807)(0.927)(1.009)
TobinQ0.033−0.019−0.023−0.0180.062
(0.057)(0.051)(0.052)(0.058)(0.061)
Constant10.731 **8.44011.697 ***11.243 **13.776 **
(5.403)(5.182)(4.418)(5.113)(6.248)
Firm FEYesYesYesYesYes
Year FEYesYesYesYesYes
Ind × Year TrendsNOYesNONONO
Observations27,23233,61133,61133,61121,822
R-squared0.1430.1730.0430.1640.147
Note: T values are in parentheses. ***, **, and * represent the significance levels at 1%, 5%, and 10%, respectively.
Table 8. Mediation Test Results: Digital Risk Perception.
(1)(2)(3)(4)
VariablesDigiRiskESGDigiRiskESG
PeerDigi0.054 ***−1.693 ***
(0.015)(0.310)
L.PeerDigi 0.050 ***−1.258 ***
(0.019)(0.333)
DigiRisk −1.154 *** −1.192 ***
(0.173) (0.194)
Size0.040 ***0.771 ***0.037 ***0.819 ***
(0.007)(0.166)(0.008)(0.187)
FirmAge−0.013−2.286 **−0.045−2.124
(0.056)(1.163)(0.071)(1.458)
Lev−0.077 ***1.464 **−0.090 ***1.435 **
(0.024)(0.594)(0.027)(0.662)
ROA−0.085 **0.368−0.0641.241
(0.040)(0.921)(0.043)(0.988)
FIXED−0.069 **1.670 **−0.088 **1.708 *
(0.035)(0.807)(0.039)(0.923)
Top10−0.113 ***1.986 **−0.101 **2.354 ***
(0.036)(0.808)(0.042)(0.913)
TobinQ−0.000−0.024−0.0020.031
(0.002)(0.051)(0.003)(0.057)
Constant−0.614 ***11.002 **−0.457 *10.186 *
(0.210)(4.429)(0.259)(5.412)
Indirect effect−0.0622 ***−0.0595 ***
Direct effect−1.6931 ***−1.2581 ***
Firm FEYesYesYesYes
Year FEYesYesYesYes
Observations33,61133,61127,23227,232
R-squared0.0260.1660.0230.145
Note: T values are in parentheses. ***, **, and * represent the significance levels at 1%, 5%, and 10%, respectively.
Table 9. Mediation Test Results: Managerial Short-termism.
(1)(2)(3)(4)
VariablesShortInvESGShortInvESG
PeerDigi0.003 ***−1.727 ***
(0.001)(0.309)
L.PeerDigi 0.002 *−1.293 ***
(0.001)(0.334)
ShortInv −9.650 *** −10.582 ***
(1.665) (1.844)
Size−0.002 ***0.707 ***−0.002 ***0.755 ***
(0.001)(0.167)(0.001)(0.187)
FirmAge0.004−2.233 *0.006−2.002
(0.004)(1.163)(0.005)(1.457)
Lev0.004 *1.592 ***0.0031.575 **
(0.002)(0.595)(0.002)(0.662)
ROA−0.030 ***0.176−0.029 ***1.008
(0.003)(0.922)(0.004)(0.988)
FIXED0.021 ***1.953 **0.023 ***2.054 **
(0.003)(0.807)(0.004)(0.924)
Top10−0.0022.094 ***−0.0042.435 ***
(0.003)(0.807)(0.003)(0.911)
TobinQ−0.001 ***−0.031−0.001 ***0.026
(0.000)(0.052)(0.000)(0.057)
Constant0.063 ***12.319 ***0.056 ***11.324 **
(0.015)(4.423)(0.019)(5.404)
Indirect effect−0.0279 **−0.0245 **
Direct effect−1.7273 ***−1.2932 ***
Firm FEYesYesYesYes
Year FEYesYesYesYes
Observations33,61133,61127,23227,232
R-squared0.0200.1650.0200.144
Note: T values are in parentheses. ***, **, and * represent the significance levels at 1%, 5%, and 10%, respectively.
Table 10. Heterogeneity test based on enterprise scale.
(1)(2)(3)
Large EnterprisesMedium EnterprisesSmall Enterprises
VariablesESGESGESG
PeerDigi−0.668−3.125 ***−1.923 ***
(−1.179)(−5.203)(−3.655)
Size0.1161.044 **1.104 ***
(0.287)(2.027)(2.711)
FirmAge−2.395−2.979−2.994
(−0.977)(−1.166)(−1.268)
Lev3.508 **1.1591.756 *
(2.319)(1.035)(1.658)
ROA4.612 **−0.922−0.689
(2.116)(−0.597)(−0.464)
FIXED1.2013.873 **0.742
(0.741)(2.203)(0.523)
Top10−0.3270.7483.850 **
(−0.205)(0.464)(2.163)
TobinQ−0.009−0.0390.003
(−0.061)(−0.303)(0.048)
Constant25.210 **8.1345.363
(2.374)(0.636)(0.533)
Firm FEYesYesYes
Year FEYesYesYes
Observations11,20311,20411,204
R-squared0.1460.1190.119
Note: T values are in parentheses. ***, **, and * represent the significance levels at 1%, 5%, and 10%, respectively.
Table 11. Heterogeneity test based on industry characteristics.
(1)(2)(3)(4)
Tech-IntensiveNon-Tech-IntensiveHigh CompetitionLow Competition
VariablesESGESGESGESG
PeerDigi−3.753 ***0.054−3.267 ***−0.538
(−7.987)(0.089)(−7.117)(−1.211)
Size0.865 ***0.663 **0.965 ***0.380
(4.184)(2.371)(4.106)(1.570)
FirmAge−2.635 *−0.615−2.552−1.489
(−1.926)(−0.307)(−1.601)(−0.819)
Lev0.9962.452 **0.4552.540 ***
(1.323)(2.477)(0.540)(2.915)
ROA−0.6561.274−0.6342.029
(−0.627)(0.726)(−0.495)(1.521)
FIXED1.0581.1132.272 *0.603
(0.958)(0.928)(1.936)(0.532)
Top101.764 *1.9432.066 *2.301 *
(1.661)(1.487)(1.863)(1.910)
TobinQ−0.010−0.025−0.003−0.056
(−0.163)(−0.264)(−0.038)(−0.726)
Constant12.890 **7.3519.52015.668 **
(2.371)(0.926)(1.506)(2.313)
Firm FEYesYesYesYes
Year FEYesYesYesYes
Observations18,56015,05116,10917,502
R-squared0.1660.1600.1760.142
Note: T values are in parentheses. ***, **, and * represent the significance levels at 1%, 5%, and 10%, respectively.
Table 12. Moderating effects results.
(1)(2)
VariablesESGESG
PeerDigi × IPP−38.755 ***
(5.378)
PeerDigi × IA 11.654 ***
(2.869)
IPP7.858
(8.078)
IA 0.940
(2.324)
PeerDigi−1.3911 ***−1.744 ***
(0.353)(0.309)
Constant9.656 **9.8969 **
(4.805)(4.453)
ControlsYesYes
Firm FEYesYes
Year FEYesYes
Observations29,03833,611
R-squared0.1730.164
Note: T values are in parentheses. ***, and ** represent the significance levels at 1% and 5%, respectively.
Table 13. Impact of peer digital technology innovation on ESG rankings.
(1)(2)(3)(4)
VariablesESG_RankE_RankS_RankG_Rank
PeerDigi0.089 ***0.125 ***0.074 **0.111 ***
(0.027)(0.033)(0.037)(0.026)
Constant7.552 ***8.043 ***7.172 ***7.799 ***
(0.426)(0.484)(0.547)(0.433)
ControlsYesYesYesYes
Firm FEYesYesYesYes
Year FEYesYesYesYes
Observations33,61133,61133,61133,611
R-squared0.1200.1170.1000.067
Note: T values are in parentheses. ***, and ** represent the significance levels at 1% and 5%, respectively.
Disclaimer/Publisher’s Note: The statements, opinions and data contained in all publications are solely those of the individual author(s) and contributor(s) and not of MDPI and/or the editor(s). MDPI and/or the editor(s) disclaim responsibility for any injury to people or property resulting from any ideas, methods, instructions or products referred to in the content.