


Abstract
Artificial intelligence applications are rapidly integrated into supply chain management systems, and play a vital role in coping with supply chain disruption risks from external shocks. From the perspective of a production network, based on the data of Chinese listed companies from 2013 to 2023, this paper systematically examines the direct effect and network spillover effect of artificial intelligence application on supply chain disruption risk. The results show that: First, artificial intelligence applications can significantly reduce supply chain disruption risks. The adoption of AI by upstream enterprises produces spillover effects through production networks, and indirectly cuts down the disruption risks of downstream enterprises. Second, AI applications mainly function through three paths: supply chain concentration, corporate agency cost and physical flow efficiency of enterprises. Third, the risk reduction effect of AI applications is more prominent in eastern regions, low-tech industries and state-owned enterprises. The research conclusions have important theoretical and practical implications for enterprises to build risk management systems and enhance system resilience.
1. Introduction
In recent years, impacted by global public health crises, extreme climate and geopolitical events, supply chain disruption risks have risen sharply [1]. Countries are gradually shifting their strategic orientation from efficiency priority to security and stability in resource allocation and industrial spatial layout [2]. Supply chain disruptions seriously interfere with enterprises’ normal production and delivery processes. They not only cause output loss and cost increase, but also exert systematic impacts on firms’ long-term competitive advantage and sustainable development [3]. How to effectively identify, early warnings and resolve supply chain disruption risks, and improve the risk management capability of supply chain systems, have become critical issues for enterprise survival and development.
Looking back on the evolution of supply chains, every upgrade relies on the empowerment of key technologies [4]. Against the backdrop of rising supply chain vulnerability [1], advanced digital and intelligent technologies are needed to reshape resilient and stable supply chains [5]. As the most representative and forward-looking digital-intelligent technology, artificial intelligence boasts unique advantages in data perception, pattern recognition, dynamic optimization and intelligent decision-making, providing new solutions for risk prevention and control of supply chain systems [6,7]. Existing studies show that artificial intelligence applications realize continuous knowledge innovation and algorithm iteration based on big data [8]. They improve the accuracy of supply chain management decisions, help firms identify, assess and cope with potential disruption risks more accurately, and further sustain competitive advantages in the complex and volatile market environment [9,10]. Most existing studies only focus on the one-way mechanism of artificial intelligence in internal enterprise optimization and external supply chain management. They fail to systematically reveal the dynamic interaction and spillover effects of AI between upstream and downstream supply chains. This limitation makes it difficult for current research to accurately depict how AI realizes value transmission and capability diffusion through supply chain networks.
Accordingly, from the perspective of production networks, this paper focuses on the direct effect and network spillover effect of artificial intelligence applications on supply chain disruption risks, so as to supplement the existing literature. This study contributes to the literature in three ways:
First, from the research perspective and theoretical dimension, we clarify the boundaries of core concepts and improve the theoretical system of spillover effects. We strictly distinguish the single-firm application of artificial intelligence from spillover effects in production networks, and abandon the one-sided view that technology popularization equals spillover. Based on information economics and the theory of network externalities, we construct a complete theoretical framework of “artificial intelligence application—mechanism transmission—supply chain risk mitigation”. We focus on explaining the exclusive logic of AI network spillover, which differs from general digital efficiency improvement. This study addresses the drawbacks of vague concepts and insufficient theoretical support in the existing literature. It not only enriches research on the economic effects of artificial intelligence application, but also provides a new perspective for supply chain risk governance.
Second, in terms of research methods, the study breaks the limitations of individual-level research and focuses on the collaborative value of industrial networks. It moves beyond the traditional research paradigm of internal corporate efficiency optimization. A production network model is built based on China’s industrial input–output linkages. The model accurately identifies spillover transmission paths of artificial intelligence along upstream and downstream industrial chains. Differentiated impacts of direct effects and network spillover effects are clearly separated. Supply chain networks are proven to serve as core carriers for technology value diffusion and risk hedging. These findings offer empirical evidence for understanding the industrial collaborative value of artificial intelligence application.
Third, regarding heterogeneity analysis and research boundaries, this study anchors China’s local characteristics and clarifies the applicable scope of the research. China’s policies and institutions, regional digital infrastructure, industrial technical features, and corporate ownership attributes are fully integrated into theoretical analysis and empirical tests. It explains how local contexts shape the risk mitigation effect and spillover transmission characteristics of artificial intelligence. Differentiated heterogeneous mechanisms are revealed to avoid overgeneralization of research conclusions. New micro-level evidence is provided to identify the functional boundaries of artificial intelligence application.
2. Literature Review
Research closely related to this paper fall into two categories. The first focuses on corporate supply chain risks, exploring their economic consequences and mitigation approaches. The second examines the application of artificial intelligence from the efficiency-driven perspective. On the basis of sorting out the existing literature, this study mainly addresses two deficiencies in previous research: overemphasis on direct efficiency while ignoring network spillovers, and preference for general scenarios while neglecting local Chinese characteristics. Centering on the core logic of production network spillovers, this paper aligns its theoretical framework with the research theme.
2.1. Research on Enterprise Supply Chain Risk
Relevant literature focuses on enterprise supply chain risks and mainly develops along two lines. The first discusses the economic consequences caused by supply chain risks. Supply chain risk refers to potential deviations from initial goals within supply chains, which reduce value-added activities at all levels [11,12,13]. With deepening global division of labor and increasingly customized production, enterprises become highly reliant on supply chain relationships [14]. Supply chain disruptions will push firms into shutdown predicaments and raise the cost of searching for and rebuilding subsequent supply chain ties [15,16]. Even if enterprises barely maintain supply chain relationships, supply chain dependence causes power imbalance between suppliers and buyers and weakens firms’ bargaining power. Consequently, enterprises exposed to supply chain risks face higher production costs and poorer profitability [17,18]. Meanwhile, supply chain risks feature network transmission effects. The trigger of any risk source may rapidly turn local fluctuations into systematic disruptions, posing a serious threat to the stability and security of the entire network [19,20,21]. Such network-based risk characteristics form the core theoretical premise for exploring the production network spillover effects of artificial intelligence in this study. The networked transmission of supply chain risks means technological empowerment at the individual firm level cannot achieve full-range risk governance. Systematic risk hedging can only be realized through the collaborative spillover effects of industrial networks.
The other line focuses on how to mitigate enterprises’ supply chain risks. As part of an open system, efficient physical flow, smooth information flow and in-depth capital flow of enterprises all help reduce supply chain risks [15,22,23]. Supply chain restructuring through localization, diversification and leading-partner strategy enables firms to strengthen supply chain intervention and avoid disruptions [24,25]. In recent years, the development of digital and intelligent technologies has triggered profound changes in supply chain management [4,26]. Many scholars have analyzed the impacts of the Internet of Things, big data and cloud computing on supply chain regulation capability [27,28,29]. Nevertheless, due to the cutting-edge nature of artificial intelligence, research on how AI affects supply chain disruption risks is still in its infancy [30]. Unfortunately, most existing technical research focuses on the efficiency empowerment of basic digital tools, and fails to thoroughly explore the governance value of network spillovers generated by artificial intelligence, a digital-intelligent technology. In particular, few studies examine governance mechanisms for cross-firm transmission of supply chain risks from the perspective of production networks.
2.2. Economic Effects of Artificial Intelligence Application
Existing studies mainly explore the economic effects of artificial intelligence applications from an efficiency-driven perspective. Artificial intelligence can broaden the application scope of various factors, promote their cross-industry and cross-field flow, and improve the efficiency of resource allocation [31,32]. By rapidly retrieving, analyzing and integrating high-dimensional data, AI accelerates technological R&D, facilitates the iteration of new technologies and products, and enhances corporate innovation efficiency [33,34,35]. In addition, intelligent algorithm optimization and real-time information analysis can automatically resolve complex decision-making problems, reduce delays and biases in human judgment, and improve firms’ decision-making efficiency [7,36]. Some literature further explores the impact of artificial intelligence on firm efficiency from the perspective of supply chain resilience. It points out that AI not only optimizes the setting of supply chain decoupling points such as inventory buffers, production scheduling adjustment nodes, logistics transit hubs and information flow coordination nodes [37,38,39], but also perceives and predicts various potential risks in supply chains, thereby effectively improving supply chain resilience [9,40,41]. However, concerns over the decision transparency of artificial intelligence are growing. Some studies argue that over-reliance on AI technology may undermine supply chain flexibility, marginalize human decision-making, and leave firms unable to cope with technical failures, thereby triggering systemic ripple effects [42].
However, the existing literature suffers from two core limitations that hinder the improvement of the theoretical system and the depth of research conclusions.
First, vague conceptual definitions blur the distinction between technology adoption behavior and network spillover effects. Most studies equate the popularization of artificial intelligence and the expansion of technology application scale at the individual firm or industrial level directly with spillover effects without strictly clarifying their essential boundaries. In fact, corporate AI adoption refers to technology uptake and operational optimization by a single entity, which only affects the supply chain system of the firm itself. By contrast, production network spillover effects represent the passive transmission and value diffusion of technological value across firms and entities through industrial input–output linkages. This unique network transmission phenomenon differs from simple industrial correlations or variable correlations, featuring distinct transmission carriers, pathways and cascade amplification characteristics. Failure to effectively distinguish between the two in prior studies results in ambiguous core research contributions.
Second, existing theoretical frameworks mismatch research themes and overlook the core theoretical logic of network spillovers. Previous works mostly concentrate on direct economic effects of artificial intelligence such as efficiency improvement and cost reduction, emphasizing internal empowerment within individual enterprises. They fail to draw on production network theory and network externality theory to elaborate the dynamic interaction, value transmission and risk mitigation mechanisms of AI technologies along upstream and downstream industrial chains. Thus, these studies cannot explain how artificial intelligence diffuses cross-firm risk governance value via industrial networks.
More importantly, most existing studies are conducted under general industrial scenarios without targeted analysis tailored to China’s institutional and industrial context. Unlike highly decentralized and market-oriented supply chain systems abroad, China boasts a complete industrial system, close upstream and downstream production linkages, and a policy-driven digital economy development pattern. Meanwhile, it is characterized by unbalanced regional digital infrastructure, differentiated governance between state-owned and private enterprises, and obvious technological stratification across industries. Moreover, the Chinese government has continuously promoted technology implementation and enhanced industrial chain resilience through the “AI Plus” initiative and special policies for digital-intelligent supply chains. The unique institutional environment, supply chain structure and technology application scenarios in China lead to native particularities in how artificial intelligence affects supply chain risks and how its network spillover transmits. Hence, relevant research conclusions cannot be universally applied worldwide. Based on production network theory and network externality theory, this study incorporates China’s institutional and industrial context, and focuses on both the direct effects and network spillover effects of artificial intelligence application on supply chain disruption risks. It aims to provide empirical evidence for corporate risk prevention and high-quality development.
3. Theoretical Analysis and Research Hypotheses
Drawing on information economics, production network theory and network externality theory, this study strictly distinguishes between individual corporate AI adoption behavior and production network spillover effects. The former refers to internal corporate activities where firms voluntarily adopt artificial intelligence to optimize internal information processing, production operations and supply chain management, generating only direct empowering effects. The latter means the value of artificial intelligence technology spreads passively across firms and network nodes via the exclusive carrier of industrial input–output linkages. As a unique network effect separate from ordinary digital efficiency gains and simple industrial correlations, it has clear transmission paths and cascade characteristics. Combined with China’s digital policy orientation, tight industrial network connections, as well as regional and industrial heterogeneous features, this paper systematically unpacks the direct mechanism and asymmetric upstream–downstream spillover mechanism through which artificial intelligence affects supply chain disruption risks.
3.1. Direct Effect of Artificial Intelligence Application on Corporate Supply Chain Disruption Risk
According to information economics theory, sufficient information is a necessary condition for enterprises to make optimal decisions. Nevertheless, information asymmetry is generally unavoidable in supply chains. Due to long information transmission chains or blocked transmission channels, information often suffers from time lags and frictional losses in the process of transmission. Information asymmetry is one of the key causes of supply chain risks. Information asymmetry in supply chains reduces firms’ decision accuracy and agility in responding to external changes [43]. It also hinders cooperation and collaboration among supply chain participants, bringing potential risks such as inefficiency and disruptions [44]. The application of artificial intelligence provides strong support for lowering supply chain disruption risks by reducing information barriers and improving demand forecasting and planning capabilities. This direct effect only acts on firms that adopt the technology itself and represents individual technological empowerment, which can be realized without relying on industrial network linkages, distinguishing it from the subsequent network spillover effects.
On the one hand, artificial intelligence application reduces information barriers between upstream and downstream enterprises in the supply chain. Artificial intelligence application promotes digitalized decision-making, intelligent production and timely communication for enterprises, and improves collaboration efficiency among supply chain firms [45]. By establishing information sharing and incentive mechanisms with suppliers, enterprises can obtain real-time key data such as supplier production capacity and logistics information. This effectively shortens the information transmission chain, improves firms’ responsiveness to demand fluctuations and environmental changes [46], and reduces supply chain disruption risks caused by information asymmetry and prediction errors [47,48].
On the other hand, artificial intelligence application enhances enterprises’ capabilities in demand forecasting and planning. Internally, artificial intelligence application facilitates information sharing and resource integration among cross-functional departments [49], reducing the risk of decision errors caused by internal information asymmetry. Meanwhile, it promotes organizational process optimization and business model innovation, and improves enterprises’ adaptability to changes in the external environment [50]. By deeply analyzing historical operational data and real-time market information, artificial intelligence enables enterprises to accurately forecast demand changes and identify potential risks. It dynamically adjusts raw material procurement plans and production strategies, effectively lowering the risk of supply chain disruption caused by market demand fluctuations and other factors [51].
Thus, the following hypothesis is proposed:
H1.
The application of artificial intelligence can reduce the risk of corporate supply chain disruption.
3.2. Network Spillover Effect of Artificial Intelligence Application on Supply Chain Disruption Risk
Enterprises form complex industrial chain production networks through inter-industry input–output linkages [52]. The adoption of artificial intelligence by a single firm not only affects its own operation, but also influences upstream- and downstream-related enterprises through network transmission, highlighting the transmission and amplification effect of production networks on external shocks [53]. Within China’s industrial system, upstream and downstream enterprises form a highly coordinated and interdependent production network through close input–output linkages. Coupled with the nationwide rollout of national policies on digital and intelligent supply chains, favorable conditions are created for the cross-firm spillover and transmission of artificial intelligence technology. Different from individual corporate technology adoption, the core essence of AI production network spillover effect lies in the passive cross-agent diffusion and value spillover of technological empowerment via network carriers including supply–demand linkages, production collaboration and information sharing, rather than mere industrial technology popularization or simple data correlation.
Artificial intelligence is deeply embedded in production and operation processes to accurately capture market information, optimize business workflows and enhance supply chain collaboration efficiency, thereby effectively diversifying supply chain disruption risks. This effect generates two-way spillovers. On the one hand, productivity gains from AI adoption by upstream firms are transmitted downstream by improving raw material supply efficiency and cutting costs, indirectly driving productivity growth of downstream enterprises, which constitutes the upstream spillover effect. On the other hand, AI application by downstream enterprises stimulates demand growth, drives upstream firms to expand production scale, and further improves their productivity, forming the downstream spillover effect. In addition, such spillover effects continue to spread within the production network and generate cascade effects [19].
Combined with the industrial structural feature of China’s supply chains, where upstream suppliers dominate and downstream players adapt to demand, as well as the reality that domestic supply chain disruptions mostly stem from supply-side fluctuations, spillover effects between upstream and downstream sectors show obvious asymmetry. Such asymmetry is a unique network characteristic that cannot be explained by ordinary digital efficiency improvements. For supply chain risk control, AI adoption by upstream firms plays a more critical role. As providers of raw materials and core components across supply chains, upstream enterprises’ production stability, inventory management efficiency and delivery accuracy directly determine the stable operation of the entire supply chain. After deploying artificial intelligence, upstream firms can significantly reduce supply-side risks including production volatility, inventory shortages and delivery delays through intelligent production scheduling, dynamic inventory regulation and logistics route optimization. Meanwhile, taking advantage of the highly coordinated industrial networks in China, they share real-time core data such as production progress, inventory surplus and delivery cycles with their downstream partners, enabling downstream enterprises to predict supply risks in advance and adjust production plans dynamically [54]. This transmission process constitutes a distinctive spillover behavior built on supply–demand linkages within production networks. Downstream firms can passively obtain risk mitigation benefits without independently adopting artificial intelligence, which is entirely different from a firm’s own technology adoption and the uniform efficiency gains brought by general digitalization.
In contrast, the spillover effects generated by artificial intelligence adoption among downstream enterprises are relatively limited. Technological empowerment of downstream firms mainly focuses on demand-side optimization. It improves the matching efficiency between supply and demand by accurately forecasting market demand and alleviating the bullwhip effect, yet cannot directly upgrade core supply-side capacities of upstream enterprises such as production, logistics and inventory management [55]. Since supply chain disruption risks in China mainly arise from supply-side issues including upstream capacity fluctuations, raw material shortages and logistics blockages, demand-side optimization at the downstream level fails to hedge systemic risks on the supply side. Accordingly, the risk mitigation function of downstream spillover effects remains weak.
Further analysis incorporating the unique features of China’s local context is presented as follows. First, China boasts the world’s most complete industrial system with far denser upstream and downstream production linkages than foreign economies. Industrial networks here deliver higher transmission efficiency and coordination intensity, which serve as natural carriers for the diffusion of AI spillover effects. Second, domestic digital infrastructure follows a pattern where eastern regions take the lead while nationwide construction moves forward steadily. Supported by strong policy incentives including the national “AI Plus” initiative and special policies for digital-intelligent supply chains, enterprises demonstrate much stronger willingness for digital coordination and information sharing than their overseas counterparts, greatly amplifying the transmission strength of network spillovers. Third, state-owned enterprises and leading domestic firms occupy dominant core positions in industrial chains, exerting stronger radiation and driving effects of technological empowerment and further magnifying the asymmetric characteristics of upstream spillovers.
Accordingly, the following hypothesis is proposed:
H2.
The application of artificial intelligence generates significant upstream and downstream spillover effects along production networks with obvious asymmetric characteristics. The risk-mitigating spillover effect brought by artificial intelligence adoption of upstream enterprises is substantially stronger than that of downstream enterprises.
3.3. Mechanism of Artificial Intelligence Application Affecting Supply Chain Disruption Risk
3.3.1. Reducing Supply Chain Concentration
Existing studies show that when enterprises rely on only a few specific supply chain partners, the lack of alternative supply and distribution channels makes their supply chains less resilient to internal disturbances and external shocks, resulting in supply chain vulnerability and instability [37,56]. Therefore, supply chain concentration is one of the key factors affecting supply chain disruption risk.
Manufacturing supply chains in China are generally characterized by concentrated leading firms and solidified cooperative relationships. Most enterprises rely on fixed suppliers and distributors for a long time, leading to high supply chain concentration. Single-point risks can easily trigger disruptions across the whole chain, which constitutes a core cause of supply chain vulnerability for domestic firms. Artificial intelligence application can reduce supply chain concentration through two channels. Specifically, AI curbs supply chain concentration and mitigates risks via dual paths of direct empowerment and network spillovers. Distinct from simple information sharing enabled by traditional digitalization, this mechanism features network coordination.
In terms of direct effects, artificial intelligence application facilitates information sharing and collaborative cooperation between upstream and downstream supply chain partners and cuts external transaction costs, thereby reducing firms’ incentives for supply chain concentration [57]. On the other hand, AI technologies such as neural network algorithms and computer vision can collect multi-source big data including videos, images and text corpora on a larger scale and at a faster speed. This helps firms break the inertia of localized knowledge search, expand the breadth and depth of corporate knowledge search [32], support enterprises in identifying and evaluating alternative suppliers worldwide, broaden supply chain cooperation networks, and lower supply chain concentration.
In terms of spillover effects, the industrial information transparency and efficient resource matching brought by AI empowerment of upstream enterprises can boost resource flow efficiency across the entire industrial chain. It provides network support for downstream firms to develop diversified supply chain systems and further mitigates overall supply chain concentration risks.
A lower supply chain concentration helps node enterprises reduce reliance on single suppliers or markets. It mitigates single-point failures and geopolitical risks, and avoids production and delivery disruptions caused by single-source interruptions, price fluctuations and regional crises [37]. Meanwhile, lower supply chain concentration also enhances enterprises’ discourse power in the supply chain [58]. It not only strengthens their bargaining power, but also enables them to establish flexible cooperation mechanisms with supply chain partners, thereby reducing the risk of supply chain disruption [59]. In addition, lower supply chain concentration grants enterprises greater autonomy in supplier selection. By real-time monitoring of supplier performance data and public opinion risks, firms can establish a dynamic order allocation mechanism, achieve efficient matching with high-quality suppliers, and reduce supply chain operational risks.
Accordingly, the following hypothesis is proposed:
H3a.
The application of artificial intelligence can further reduce corporate supply chain disruption risk by lowering supply chain concentration.
3.3.2. Reducing Corporate Agency Costs
According to principal-agent theory, there exists inconsistency between the interests of management and shareholders. To pursue short-term performance, personal reputation or risk aversion, managers may make decisions deviating from the long-term goal of minimizing supply chain risks.
Chinese enterprises, especially state-owned enterprises and large conglomerates, adopt multi-layer governance structures. Severe information asymmetry and incomplete contracts prevail in supply chain operations. Frequent managerial opportunism and hold-up behavior of partners raise supply chain agency costs and aggravate operational risks. Artificial intelligence application cuts coordination frictions by optimizing agency procedures, thus lowering supply chain disruption risks. Standardized decision-making procedures, strengthened network supervision and reduced cooperation frictions enabled by AI can fundamentally ease agency problems. Moreover, network spillover effects realize overall governance optimization across the entire supply chain.
At the direct mechanism level, the smart contract, algorithmic decision-making and data traceability functions of artificial intelligence can standardize the whole process of corporate supply chain procurement, cooperation and contract performance, reduce room for managerial opportunism stemming from subjective decision-making, and cut internal agency costs [60]. By adopting artificial intelligence, enterprises can lower the information search costs and contract enforcement costs of external supply chains [61], making firms more inclined to rely on efficient market-based collaboration. This further mitigates rigid risks arising from internalization or out-of-control risks brought by externalization.
In terms of spillover effects, the standardized digital and intelligent operation of upstream firms within production networks generates demonstration and supervision effects across industrial chains. This standardizes the implementation of cooperation contracts between upstream and downstream partners, reduces partners’ incentives for breach of contract and hold-up conduct, and cuts coordination frictions and potential risks in supply chains. Such governance mechanism delivers network-based collaborative governance outcomes unattainable through conventional digital transformation.
Coase pointed out that asset specificity in long-term cooperation may trigger the hold-up problem, where one party takes advantage of the partnership to coerce the other, leading to cooperation breakdown or sharp cost increases [61]. With powerful data analysis capability, artificial intelligence helps enterprises improve decision-making efficiency and reduce decision costs and risks. Through dynamic game algorithms and credible data sharing, it cuts negotiation costs and default incentives among partners [62]. It not only safeguards specific asset investments and enhances supply chain resilience, but also fundamentally mitigates supply chain disruption risks caused by inefficient coordination and opportunistic behaviors.
Accordingly, the following hypothesis is proposed:
H3b.
The application of artificial intelligence can further reduce corporate supply chain disruption risk by lowering corporate agency costs.
3.3.3. Improvement of Corporate Logistics Efficiency
An inefficient logistics system directly causes delivery delays, material losses and production disruptions, which weaken supplier collaboration and customer satisfaction and raise supply chain volatility risks [51]. Meanwhile, it leaves the supply chain insufficient capability to cope with external environments and further increases the risk of supply chain disruption. Umar and Wilson (2024) [22] conducted a case study of two regions in Pakistan and found that an efficient logistics system plays a vital role in maintaining food supply chain stability under uncertain environments. Artificial intelligence enables intelligent control over the entire supply chain process and boosts logistics efficiency through dual paths of direct optimization and network coordination. Different from single-link optimization under traditional logistics digitalization, it features full-chain and network-based empowerment.
The application of artificial intelligence facilitates collaboration across all supply chain links, shifting decentralized decision-making toward global optimization and forming an efficient closed loop of demand-production-logistics. At the level of direct empowerment, in the production stage, the adoption of artificial intelligence enables automatic raw material feeding and finished goods outbound delivery, enhances the coordination and efficiency of intra-workshop production logistics, and lifts the overall logistics efficiency of the supply chain. In the warehouse stage, AI greatly boosts warehousing operation efficiency, promotes unmanned warehouse management, and reduces labor costs [63]. In the inventory inbound and outbound management, RPA robots can automatically extract, verify and input massive commodity information, reduce manual operational errors and accelerate inventory turnover speed [64]. In transportation and distribution, artificial intelligence dynamically adjusts transportation routes and delivery modes by real-time analyzing weather and traffic data, thus improving commodity circulation efficiency [35].
From the perspective of network spillovers, the construction of intelligent logistics systems by upstream enterprises can drive unified logistics standards and coordinated processes across the industrial chain. This optimizes the material circulation efficiency of the entire production network, alleviates overall supply–demand mismatches, improves the agility of supply chains in responding to changes in the external environment, and effectively reduces disruption risks.
Accordingly, the following hypothesis is proposed:
H3c.
The application of artificial intelligence can further reduce corporate supply chain disruption risk by improving corporate logistics efficiency.
The research framework of this paper is shown in Figure 1.
Figure 1.
Research framework.
4. Research Design
4.1. Sample Selection and Data Sources
This paper selects China’s A-share listed companies from 2013 to 2023 as the research sample. The Guidelines for Industry Classification of Listed Companies issued by the CSRC came into effect in October 2012, thus the sample starts from 2013. Data after 2023 suffers from missing values and untimely updates. To improve sample reliability, this paper conducts data screening following four criteria: (1) Exclude financial listed companies; (2) eliminate ST, *ST and PT listed firms; (3) remove enterprises with missing data and abnormal operating status; and (4) apply winsorization at the 1% level for continuous variables. Annual report information of listed companies is sourced from the China Research Data Service Platform (CNRDS); basic enterprise information and financial data are obtained from the China Stock Market and Accounting Research Database (CSMAR); regional data are sourced from the National Bureau of Statistics of China; and input–output data come from the Asian Development Bank (ADB).
4.2. Model Specification
From the perspective of production networks, this paper systematically examines the direct effect and network spillover effect of corporate artificial intelligence application on supply chain disruption risk. Referring to the research on technology spillover effects in supply chains by Isaksson (2016) [65], this paper constructs the following benchmark regression model.
where denote firm and year respectively. represents corporate supply chain disruption risk, and denotes corporate artificial intelligence application. refers to the set of control variables. is the constant term, and is the regression coefficient. stands for the coefficient matrix of control variables. , denote upstream and downstream spillover effects, reflecting the spillover impact of artificial intelligence application of upstream and downstream firms on firm along the production network. denotes industry fixed effect. represents time fixed effect, and is the random disturbance term.
4.3. Variable Selection
4.3.1. Explained Variable
The explained variable is corporate supply chain disruption risk (SCDR). Given the wide-ranging sources of supply chain risk, it cannot be accurately measured by a single indicator. Text big data such as annual reports and performance briefings contain managers’ in-depth summary of current operational risks and forward-looking judgment on future development trends, serving as an important source for perceiving operational risks of enterprises [66,67]. Ersahin et al. (2024) [25] adopted text mining techniques to extract supply chain risk information from big text data, effectively solving the difficulty in measuring supply chain risks mentioned above and providing an important reference for constructing indicators in this paper. On this basis, this paper attempts to construct a supply chain-related dictionary tailored to the Chinese context, and makes improvements in sentiment tendency control, indicator calculation and other aspects, so as to accurately construct the measurement index of supply chain risks for Chinese listed enterprises.
This study selects the Management Discussion and Analysis (MD&A) section in the annual reports of A-share listed companies as the text source. It measures corporate supply chain risk by calculating the proportion of non-positive content related to both “supply chain” and “risk” in the text. A higher proportion indicates a higher level of corporate supply chain risk. The specific steps are as follows:
Step 1: Download and clean the analytical texts. This paper first downloads the texts of the “Management Discussion and Analysis” section from the annual reports of A-share listed companies from the China Stock Market & Accounting Research Database (CSMAR). Since sentences serve as the basic unit of Chinese writing, the texts are segmented by full stops, while numbers, English letters and irrelevant punctuation marks are removed. Afterwards, the jieba module in Python (3.11) is adopted to segment the sentences. During word segmentation, a user-defined dictionary is specified to avoid incorrect segmentation of enterprise names and accounting subjects.
Step 2: Dictionary construction. The selection of keywords determines the accuracy of subsequent index construction, so dictionary construction is of vital importance. The keywords involved in this paper fall into two categories, “supply chain” and “risk”. Among them, the vocabulary of the “risk” category has been fully refined in previous studies, so this paper focuses the keyword selection on the construction of the “supply chain” theme dictionary. Sources of the “supply chain” theme dictionary are as follows. (1) Textbook information. Referring to the method of Ersahin et al. (2024) [25], this paper selects high-frequency words in textbooks as basic keywords. Specifically, word frequency statistics are conducted on all words appearing in the Chinese version of Supply Chain Management (6th Edition), and are theme-related words selected in descending order of word frequency. (2) Policy and news information. This article reviews all trade-related news in government open information documents and picks out frequently occurring words related to the “supply chain” theme. (3) Manual retrieval information. This study randomly reads the MD&A sections of 100 annual reports to test the rationality of keywords selected from textbooks, policies and news, and deletes or supplements words accordingly. A total of 92 words related to the “supply chain” theme are finally selected, such as “supplier”, “distributor”, “raw material”, “transportation”, etc. In addition, further supplements are made for specific risk scenarios of supply chains, and a total of 176 words related to the “risk” theme are finally selected, such as “uncertainty”, “instability”, “uncontrollable”, etc. Words of the “supply chain” and “risk” themes are listed in Table A1.
Step 3: Construction of supply chain risk measurement indicators. This paper first judges whether each sentence meets the following two requirements simultaneously. (1) The sentence contains both words of the supply chain theme and words of the risk theme. (2) The sentence does not contain positive emotional words, so as to avoid including expressions such as “the company holds an optimistic outlook on future supply chain risks”. The positive emotional words are derived from the emotional vocabulary ontology dictionary developed by Dalian University of Technology. This paper constructs a firm-level supply chain disruption risk indicator by calculating the proportion of the total word frequency of words in the dictionary within MD&A texts.
4.3.2. Core Explanatory Variable
The core explanatory variable is artificial intelligence application (AIT). AI application features strong permeability and dependency, making it difficult to separate and measure independently via traditional methods. Text analysis is widely accepted in academic research for such measurement. Following Yao et al. (2024) [68], this paper adopts machine learning to count the word frequency of AI keywords in listed companies’ annual reports, with the feature word database consistent with that in Yao et al. (2024) [68]. The complete lexicon is provided in Table A2. Given the typical right-skewed distribution of the data, the natural logarithm is taken after adding one to the word frequency of feature words to obtain the level of corporate artificial intelligence application (AIT).
4.3.3. Measurement of Network Spillover Effect Indicators
From the micro perspective of firm-level production networks, this paper draws on the methods of Isaksson et al. (2016) [65] and Di Giovanni et al. (2018) [69]. It adopts annual China input–output data provided by the Asian Development Bank and combines firm-level artificial intelligence application indicators to construct network spillover indicators, including upstream spillover effect (up) and downstream spillover effect (down). The specific construction method is as follows:
where firm belongs to industry , and denotes the artificial intelligence application level of firm in year . denotes the direct consumption coefficient matrix, Its element in row and column is defined as , representing the value of products from industry consumed per unit output of industry . refers to the value of goods and services from industry consumed in the production of industry , and is the total output of industry . Similarly, represents the value of products from industry consumed per unit output of industry . denotes the intermediate input density of industry , measured by the ratio of intermediate input to total income of industry . denotes the intermediate output density of industry , measured by the ratio of intermediate use output to total output of industry .
4.3.4. Control Variables
This paper further controls firm-level factors that may affect corporate supply chain disruption risk, including firm size (Size), asset-liability ratio (Lev), firm age (Age), capital intensity (CI), return on assets (ROA), cash ratio (Cash Ratio), operating revenue growth rate (Growth), Tobin’s Q (TQ), ownership proportion of the largest shareholder (Top1), board size (Board) and accounts receivable ratio (Rec).
In addition, regional control variables are also introduced, namely regional economic development level (lnGDP) and regional economic growth rate (GDPgro). The definitions of all relevant variables are presented in Table 1.
Table 1.
Variable definitions.
4.4. Descriptive Statistics
The descriptive statistics of variables are presented in Table 2. The mean and standard deviation of supply chain disruption risk (SCDR) are 0.028 and 0.039, with a minimum of 0.000 and a maximum of 0.181, indicating a moderately high level of supply chain disruption risk in the sample. The mean value of artificial intelligence application (AIT) is 0.736, and its standard deviation is 1.122, which is larger than the mean, suggesting substantial heterogeneity in AI application across firms. The statistical results of other variables are consistent with the existing literature and within reasonable ranges.
Table 2.
Descriptive statistics of main variables.
5. Empirical Results Analysis
5.1. Benchmark Regression Results
Table 3 reports the benchmark regression results. Column (1) presents the direct effect of artificial intelligence application on supply chain disruption risk. The regression coefficient of AI application is significantly negative at the 1% level, indicating that enterprise AI application effectively reduces supply chain disruption risk, which verifies Hypothesis H1. Columns (2) and (3) further add the upstream and downstream spillover effects of artificial intelligence application based on Column (1), respectively. Column (4) incorporates both upstream and downstream spillover effects simultaneously. The results show that the coefficient of artificial intelligence application remains significantly negative, and the coefficient of upstream spillover effect is also significantly negative, while that of downstream spillover effect is insignificant. It indicates that the AI application of upstream firms can transmit to downstream firms along the production network, whereas such transmission from downstream firms to upstream firms is blocked. Therefore, the AI application of upstream firms can reduce the supply chain disruption risk of downstream firms, while the impact of downstream firms’ AI application on upstream firms is insignificant. That is, the network spillover effect of AI application presents an asymmetry dominated by upstream spillover, which verifies Hypothesis H2.
Table 3.
Benchmark regression results.
5.2. Endogeneity Test
5.2.1. IV-2SLS and System GMM Test
To alleviate endogeneity caused by the reverse causality that firms with lower supply chain disruption risk adopt more artificial intelligence, this paper follows Fisman and Svensson (2007) [70]. We construct the average AI application level of other firms within the same city and industry, excluding the focal firm, as the instrumental variable (IV.Sisc). The artificial intelligence application level of enterprises within the same industry may be correlated with unobservable regional shocks such as regional supply chain shocks, local industrial policies and regional digital infrastructure. Such shocks will simultaneously affect the supply chain disruption risks of all local enterprises, violating the exclusion restriction of instrumental variables. To address the exclusion restriction issue, this paper adopts the one-period lagged average artificial intelligence application level of firms in the same city and same industry (L.IV.Sisc) as a new instrumental variable to conduct the placebo test.
To further improve the reliability of the results, we select two types of exogenous instrumental variables to replace the original instrumental variable.
- (1)
- Regional artificial intelligence policy intensity (IV2). Regional AI policies are exogenous, which only affect enterprises’ artificial intelligence application without directly impacting individual firms’ supply chain risks.
- (2)
- Regional digital infrastructure coverage rate (IV3). Digital infrastructure is a prerequisite for artificial intelligence application, exogenous to individual corporate supply chain risks, and satisfies the relevance and exogeneity conditions.
The results are shown in Columns (1)–(4) of Table 4, the LM statistic is significant at the 1% level, rejecting the null hypothesis of underidentification. The Wald F statistic is much larger than the 10% critical value of 16.38, ruling out the weak instrumental variable problem. The regression coefficients and significance are consistent with the benchmark results, indicating that the baseline findings remain reliable after addressing potential endogeneity.
Table 4.
Endogeneity test results.
5.2.2. System GMM Estimation
Further, this paper incorporates the one-period lag of the explained variable into the model to construct a dynamic panel framework, and employs the system GMM method for estimation to correct potential dynamic endogeneity and omitted variable bias. The estimation results of system GMM are shown in Column (5) of Table 4. In terms of diagnostic tests, the p-value of the AR (2) test is insignificant, indicating no second-order serial correlation in the model. Meanwhile, the Hansen overidentification test fails to reject the null hypothesis, which verifies the validity of instrumental variables and the absence of overidentification. These results further support the research findings of this paper.
5.2.3. Heckman Two-Step Method Test
Given that corporate supply chain disruption risk may not be randomly distributed, and the evaluation of enterprise AI application may suffer from statistical bias, the benchmark regression may produce biased estimates. This paper sets a dummy variable (AIT_dum) based on the median of AI application, which equals 1 if above the median and 0 otherwise. The Heckman two-step method is adopted accordingly. In the first stage, the instrumental variable (IV.Sisc) is incorporated into the Probit regression to calculate the inverse Mills ratio (IMR). In the second stage, the IMR is added to the regression. The corresponding results are presented in Columns (6) of Table 4. The results in Column (6) show that the IMR coefficient is significant at the 1% level. After correcting sample selection bias, the influence of artificial intelligence application on supply chain disruption risk remains consistent with the benchmark regression, further verifying the robustness of the research conclusions.
5.3. Robustness Test
5.3.1. Replacement of Core Variables
To address potential measurement bias of variables, this paper first replaces the explained variable. For supply chain disruption risk, two alternative indicators SCDR2 and SCDR3 are constructed by adjusting word set similarity. The similarity thresholds for keyword screening are tightened from 0.5 to 0.6 and 0.7 respectively, followed by re-estimation. On the other hand, this paper replaces the explanatory variable by adopting the number of AI-related patents (AIT2) as an alternative indicator. The regression results after replacement are reported in Columns (1), (2) and (3) of Table 5. The results are consistent with the benchmark regression, verifying the robustness of the research conclusions.
Table 5.
Endogeneity test result.
5.3.2. Adjustment of Fixed Effects
To further control unobserved heterogeneity at the firm and industry-year levels, this paper adjusts the fixed effect settings and sequentially introduces firm fixed effects as well as interactive fixed effects of industry and year for regression. The results in Columns (4) and (5) of Table 5 are consistent with the benchmark regression, confirming the robustness of the findings.
5.3.3. Adjustment of Sample Scope
To avoid interference from China’s 2015 stock market crash and the 2020 global public health emergency, this paper excludes the samples of 2015 and 2020 for re-regression. The results in Column (6) of Table 5 are consistent with the benchmark regression, indicating the robustness of the core conclusions.
5.4. Mechanism Test
Based on the foregoing theoretical analysis, this paper further explores the roles of supply chain concentration, agency cost and corporate logistics efficiency in the process of artificial intelligence application reducing supply chain disruption risk. Following the research idea of Jiang (2022) [71], this paper constructs the mechanism model as follows. To address the simultaneity endogeneity between mechanism variables and artificial intelligence application as well as the issue that only correlation can be reflected, this paper adopts one-period lagged values of the three mechanism variables to alleviate simultaneity bias arising from contemporaneous two-way causality. Meanwhile, the KHB mediation decomposition method is adopted to conduct formal mediation effect tests instead of the traditional stepwise regression, so as to quantify the direct effect and the proportion of mediating effect.
where denotes the mechanism variables, including supply chain concentration (SCC), agency cost (AC) and corporate logistics efficiency (Days). The specific measurement methods are as follows. Supply chain concentration is measured by the average of the ratio of purchases from the top five suppliers to total annual purchases and the ratio of sales to the top five customers to total annual sales. Agency cost is proxied by the administrative expense ratio, calculated as the ratio of administrative expenses to operating income; a higher value implies higher agency costs. Corporate logistics efficiency is measured by inventory turnover days. The definitions of other variables remain consistent with those in the benchmark model.
It should be clarified that the three transmission channels selected in this article contain two types of logic simultaneously. The first refers to the general transmission channel through which artificial intelligence acts on enterprises themselves, which applies to all market entities adopting artificial intelligence. The second is the exclusive spillover transmission mechanism formed relying on production networks. Specifically, the artificial intelligence adoption of upstream enterprises exerts cross-firm impacts on downstream enterprises via industrial chain linkages, which constitutes the core logic distinguishing this mechanism from mere technology adoption and efficiency gains from conventional digitalization.
Table 6 reports the regression results. It examines how AI application affects supply chain disruption risk via supply chain concentration. AI application and upstream spillover effect both significantly reduce supply chain concentration. Enterprise AI adoption lowers supply chain concentration. Upstream AI application spills over downstream along the production network, and further reduces the supply chain concentration of local firms.
Table 6.
Mechanism test: supply chain concentration.
From the perspective of general channels, enterprises deploying artificial intelligence technologies can leverage big data and intelligent retrieval algorithms to expand the scope of supplier and customer screening, break inherent cooperative circles, actively reduce reliance on a small number of partners, and realize diversified layout of supply chains. In terms of the exclusive mechanism of network spillovers, after upstream enterprises fully adopt artificial intelligence, the information transparency of industrial chains is greatly improved. Data such as upstream and downstream supply and demand information, cooperative qualifications and performance capabilities can circulate efficiently within production networks. On the one hand, downstream enterprises can rely on industrial information released by upstream firms to quickly identify and connect with more high-quality upstream suppliers instead of being confined to original cooperation channels, which effectively reduces supply chain concentration. On the other hand, the intelligent operation of upstream enterprises promotes the standardization and transparency of the whole industrial supply system and boosts the competitive vitality of market suppliers, thereby creating external conditions for downstream enterprises to expand diversified cooperation networks.
The estimated coefficient of supply chain concentration on supply chain disruption risk is significantly positive. This means a decline in supply chain concentration reduces supply chain risk. Thus, AI application mitigates corporate supply chain risk by lowering supply chain concentration. AI use weakens firms’ incentive for supply chain concentration and improves their ability to expand supply chain networks. It promotes supply chain diversification and effectively disperses risks. Hypothesis H3a is therefore verified.
Table 7 presents the regression results. It analyzes how AI application affects supply chain disruption risk through corporate agency cost. AI application and upstream spillover effect both have a significantly negative impact on agency cost. Firm-level AI adoption can reduce agency cost. Upstream AI application spills over downstream along the production network and indirectly cuts down the agency cost of downstream firms.
Table 7.
Mechanism test: corporate agency cost.
From the perspective of general channels, enterprises adopting artificial intelligence can standardize internal management procedures through data tracing, smart contracts, algorithm-based decision-making and other functions, restrain managerial opportunism, mitigate information asymmetry, and control agency costs from within the firm. From the exclusive logic of production network spillovers, after upstream enterprises complete intelligent transformation, full-process data covering supply–demand cooperation, performance progress and payment settlement becomes open and traceable, greatly improving the standardization of contract enforcement across the industrial chain. For downstream enterprises, on the one hand, a transparent cooperation environment lowers information barriers and negotiation frictions between upstream and downstream partners, cutting external agency costs arising from incomplete contracts and insufficient trust. On the other hand, the standardized and intelligent operation model of upstream enterprises generates a demonstration effect within production networks, forcing downstream firms to optimize internal governance and standardize business operations, which further curbs room for managerial opportunism. Accordingly, AI adoption by upstream enterprises exerts a negative inhibitory impact on the agency costs of downstream firms through network linkages.
The coefficient of agency cost on supply chain disruption risk is significantly positive. Reducing agency cost can significantly lower supply chain disruption risk. Hypothesis H3b is verified accordingly.
Table 8 reports the regression results. It examines how AI application affects supply chain disruption risk via corporate logistics efficiency. AI application and upstream spillover effect both show significantly positive effects on logistics efficiency. Firm AI adoption shortens product delivery time and improves logistics efficiency. Upstream AI application spills over downstream along the production network, and indirectly enhances downstream firms’ logistics efficiency.
Table 8.
Mechanism test: corporate logistics efficiency.
This channel can also be divided into general channels and network spillover mechanisms. At the general level, enterprises independently introducing artificial intelligence technologies can realize intelligent upgrading of warehousing, scheduling, transportation and other links, so as to directly optimize internal material circulation efficiency. In terms of spillover mechanisms, upstream firms serve as the material suppliers of supply chains. After they deploy artificial intelligence to carry out intelligent production scheduling, dynamic inventory management and logistics route optimization, the stability of supply and punctuality of delivery are greatly improved. Steady and efficient material supply from upstream helps downstream enterprises reasonably arrange production and inventory, and reduce problems such as raw material waiting, material overstock and mismatch between production and sales. Meanwhile, upstream and downstream enterprises collaboratively share logistics data and scheduling standards via production networks, driving the coordinated upgrading of logistics systems across the entire industrial chain. Consequently, AI adoption by upstream enterprises generates outward spillovers and simultaneously boosts the physical logistics efficiency of downstream enterprises.
The estimated coefficient of logistics efficiency on supply chain disruption risk is significantly negative. Improved logistics efficiency significantly reduces supply chain disruption risk. Hypothesis H3c is thus verified.
The KHB mediation decomposition method is further adopted to test the mediating effects and calculate the proportion of mediating effects, and the results are shown in Table 9. The p-values of the Sobel test for all three transmission paths are less than 0.01, which rejects the null hypothesis of no mediating effect, indicating significant causal mediation rather than mere correlation. The proportions of mediating effects all exceed 50%, demonstrating that the three mechanisms serve as the core transmission channels through which artificial intelligence and its spillover effects affect supply chain risks.
Table 9.
KHB mediation effect decomposition and sobel test.
5.5. Heterogeneity Analysis
Industry, regional and firm differences may cause the mitigating effect of AI application on supply chain disruption risk to vary. This paper further explores the heterogeneity from three dimensions: industry attribute, geographical location and enterprise ownership.
5.5.1. Regional Heterogeneity
Economic activities are more active and infrastructure is better developed in eastern China, with a higher level of artificial intelligence technology. By contrast, central and western China lag in economic development and have weaker capacity to adopt emerging technologies. To test the regional heterogeneity of AI application on supply chain stability, this paper divides sample firms into eastern and central-western regions based on location. The regression results are shown in Columns (1) and (2) of Table 10. The results show that the absolute value of the regression coefficient of AI application is larger in the eastern region group. The upstream spillover effect is only significant in the eastern group and insignificant in the central and western group. It indicates that AI application has a stronger mitigating effect on supply chain disruption risk for enterprises in eastern China. Meanwhile, the spillover effect of upstream AI adoption is more prominent in the eastern region.
Table 10.
Heterogeneity test results.
The possible reasons are as follows. First, differences in network transmission carriers. Eastern regions feature high industrial agglomeration and closer input–output linkages among enterprises, forming denser production networks that serve as natural carriers for the cross-firm transmission of artificial intelligence technology along industrial chains. Technological empowerment, information sharing and process optimization of upstream enterprises can efficiently generate spillover effects on downstream counterparts. By contrast, central and western regions have relatively scattered industrial layouts and low industrial chain coordination with loose production network connections. Without effective transmission media for spillover effects, upstream AI adoption barely delivers risk mitigation benefits to downstream firms.
Second, linkage with impact channels. Eastern regions enjoy sound digital infrastructure and high market openness, allowing artificial intelligence to function to its full potential. On the one hand, superior information exchange continuously reduces supply chain concentration and expands diversified cooperation networks. On the other hand, digital governance systems cut agency costs, while mature logistics support further improves logistics efficiency. All three transmission channels operate efficiently. In central and western regions, however, shortcomings persist in technology application, information circulation and logistics coordination. This weakens the direct effects of artificial intelligence and blocks the channels through which spillover effects function via the three mechanisms above.
Third, disparities in technology absorption capacity. Enterprises in eastern regions possess stronger human capital, management proficiency and technology adoption capabilities, enabling them to rapidly absorb spillover dividends generated by the intelligent transformation of upstream firms. Enterprises in central and western regions face higher barriers to technology absorption. Even if upstream players complete intelligent upgrading, downstream firms struggle to capture spillover value, resulting in insignificant spillover effects.
5.5.2. Industry Heterogeneity
There are obvious differences in AI adoption and application across industries with different technology intensities. Based on the Classification of High-tech Industries (Manufacturing, 2017) and Classification of High-tech Industries (Service, 2018) released by China’s National Bureau of Statistics, the sample is divided into high-tech and low-tech industries. This paper estimates the impact of AI application on corporate supply chain disruption risk for the two subsamples separately. The results are presented in Columns (3) and (4) of Table 10. The results show that the absolute value of the regression coefficient of AI application is larger in the low-tech industry group. The upstream spillover coefficient is only significant in the low-tech group and insignificant in the high-tech group. It suggests that AI application exerts a stronger inhibitory effect on supply chain disruption risk in low-tech industries. The spillover effect of upstream AI adoption is also more prominent in low-tech industries.
Possible reasons are as follows. AI spillover effects mitigate risks mainly through three channels, optimizing supply chain structure, alleviating governance problems, and upgrading logistics systems. This logic yields more prominent marginal utility in low-tech industries. Firms in high-tech industries already boast solid foundations of digitalization and intelligence as well as sophisticated supply chain management systems. Their supply chain concentration, agency costs and logistics efficiency have reached relatively optimal levels, leaving minimal room for marginal improvement brought by internal AI adoption and external spillovers. Accordingly, both direct effects and upstream network spillover effects remain weak in such industries.
In contrast, low-tech industries are generally plagued by rigid traditional management models, single supply chain partnerships, inefficient internal governance and backward logistics operation—precisely the scenarios where the three mechanisms proposed in this paper take effect. On the one hand, corporate in-house AI deployment can directly break the original closed cooperation framework, standardize internal management and streamline material circulation. On the other hand, low-tech industries feature simple industrial chain tiers and strong interdependence between upstream and downstream partners, along with short transmission links and low resistance within production networks. After upstream enterprises complete intelligent transformation, information, management models and logistics standards can quickly spill over to downstream entities through production networks, markedly lowering downstream firms’ supply chain concentration and agency costs while boosting their physical logistics efficiency.
This also verifies the core argument of this paper, the magnitude of production network spillover effects hinges on the original shortcomings and network connection characteristics of an industry. The industrial structure and management status of low-tech industries allow spillover effects to be fully unleashed.
5.5.3. Firm Heterogeneity
Firms with different ownership types differ systematically in resource access, technology absorption, governance structure and external relational embedding. This paper divides the sample into state-owned and non-state-owned enterprises by ownership and conducts re-estimation. The results are shown in Columns (5) and (6) of Table 10. The absolute values of regression coefficients for AI application and upstream spillover effect are larger in state-owned enterprises. It indicates that AI application has a stronger risk-reduction effect on supply chain disruption for state-owned enterprises. The upstream AI spillover effect is also more prominent in the state-owned enterprise group.
The possible reasons for this phenomenon are as follows. First, the core position within production networks amplifies spillover effects. Most state-owned enterprises (SOEs) occupy core nodes in industrial chains and wield strong radiation and influence in domestic production networks. After upstream SOEs deploy artificial intelligence technologies, their standardized production processes, transparent information disclosure and stable supply systems are rapidly transmitted to affiliated firms in the network, leading to far higher spillover transmission efficiency than industrial chains led by non-state-owned enterprises.
Second, trust mechanisms strengthen spillover transmission and the functioning of relevant channels. There exists an inherent trust foundation among SOEs as well as between SOEs and their upstream and downstream partners, accompanied by higher standardization in contract implementation. On the one hand, intelligent information sharing by upstream SOEs effectively alleviates information asymmetry between cooperating parties and continuously improves supply chain concentration and agency costs. On the other hand, the integrated logistics systems built under SOE leadership synchronously elevate the physical logistics efficiency of the entire chain via network linkages, fully activating the three transmission channels.
Third, differences in resource endowments restrict non-state-owned enterprises’ capacity to absorb spillovers. Non-state-owned enterprises generally suffer from financing constraints, insufficient policy support and unstable cooperative relationships. Even if they absorb AI spillovers from upstream firms, they struggle to sustain improvements in supply chain structure and internal governance, making spillover transmission chains prone to interruption. Meanwhile, the supply chain cooperation networks of non-state-owned enterprises are flexible yet lacking in stability, which further weakens the long-term impacts of network spillovers.
6. Discussion
Against the macro backdrop of fragmented global industrial chains and networked transmission of supply chain risks, leveraging digital and intelligent technologies to enhance supply chain resilience and defuse systemic disruption risks has become a core priority for the high-quality industrial development and secure, stable supply chains of China. The existing literature has fully verified the significant value of artificial intelligence in improving corporate operational efficiency and supply chain risk management capabilities; yet, it generally suffers from ambiguous conceptual definitions, generalized theoretical scenarios, insufficient elaboration on spillover mechanisms, and a lack of localization adaptability. Most studies conflate “individual firms’ adoption of artificial intelligence” with “spillover effects within industrial production networks”, simply equating technology popularization and industrial digitalization trends with network value spillovers. Moreover, most analyses are conducted based on generic industrial scenarios without defining research boundaries in combination with China’s unique institutional environment, industrial network structure and characteristics of digital economy policies, resulting in weak theoretical explanatory power and insufficient targeted conclusions. Against this backdrop, grounded in China’s local industrial context and production network theory, this paper strictly distinguishes the differentiated logic between direct AI empowerment and network spillover transmission. It systematically verifies the direct effects, asymmetric spillover effects and multi-layer transmission mechanisms through which artificial intelligence affects supply chain disruption risks, effectively addressing the deficiencies of the existing literature and achieving in-depth alignment between theory and empirical evidence.
First, the empirical results of this paper verify the direct mitigating effect of artificial intelligence adoption on supply chain disruption risks, which is consistent with the core conclusions of existing studies regarding digital and intelligent technologies empowering supply chain resilience [7,27,28,30,37]. Relying on technical advantages including transparent information penetration, intelligent decision-making and process optimization, artificial intelligence can effectively eliminate supply chain information asymmetry, reduce decision bias and optimize supply–demand matching, realizing internal risk prevention and control within enterprises. On this basis, this paper further clarifies three exclusive transmission channels and confirms that artificial intelligence can mitigate supply chain risks by reducing supply chain concentration, curbing corporate agency costs and improving physical logistics efficiency. This conclusion echoes the core viewpoints of existing research that resource flexibility, governance optimization and efficient logistics operation enhance supply chain resilience [22,57,58,60,61,62,63,64,72]. Unlike prior studies that only focus on single-dimensional efficiency improvement, this paper takes China’s local pain points such as solidified supply chain cooperation, prominent agency problems and stratified regional logistics into consideration, identifies the localized adaptability of the three mechanisms, and refines the micro transmission logic of artificial intelligence in risk governance.
Second, the core theoretical contribution of this paper lies in breaking through the traditional single-firm research paradigm, strictly defining and verifying the production network spillover effect of artificial intelligence, and clarifying the core conceptual boundary between “technology adoption” and “value spillover”. Existing studies only focus on the internal empowering effect of artificial intelligence adopted by individual enterprises, fail to explain how technological value transmits across entities through industrial chain networks, and do not distinguish the gap between efficiency gains from general digitalization and exclusive spillover effects embedded in production networks. Based on the characteristics of China’s highly interconnected production networks with strong interdependence between upstream and downstream participants, this study confirms that artificial intelligence generates significant asymmetric network spillover effects. Specifically, AI adoption by upstream enterprises can transmit risk-mitigating value to downstream firms through input–output linkages via information sharing, supply optimization and standardized empowerment, yielding additional governance effects independent of firms’ own technology deployment. By contrast, spillover effects originating from downstream enterprises are limited. This result effectively supports the theoretical hypotheses proposed in this paper, and proves that the industrial synergy value of artificial intelligence does not stem from simple correlation driven by industry-wide technology popularization, but from exclusive cascading effects carried by production networks. It further improves the theoretical framework of supply chain network governance enabled by digital and intelligent technologies.
Finally, the heterogeneity results of this paper further define the applicable research boundaries under China’s local context and form a closed logical loop between theoretical mechanisms and empirical findings. Unlike the market-oriented and decentralized supply chain systems in foreign economies, China’s industrial characteristics including unbalanced regional digital infrastructure, stratified industrial technology levels, and state-owned enterprises dominating core industrial chain nodes bring about differentiated effects of AI empowerment. Dense industrial networks and sound digital infrastructure in eastern regions serve as transmission carriers for spillover effects; managerial deficiencies in low-tech industries leave ample room for the marginal empowering effects of artificial intelligence; and the core network position and credit advantages of state-owned enterprises strengthen the transmission efficiency of spillovers. This indicates that the research conclusions of this paper are only applicable to China’s institutional and industrial context with Chinese characteristics rather than universally applicable worldwide. The findings effectively remedy the drawbacks of over-generalized scenarios and ambiguous boundaries in the existing literature, and provide targeted theoretical support for localized digital and intelligent governance of supply chains.
7. Conclusions and Implications
7.1. Conclusions
Based on China’s distinctive industrial institutions, digital economy policy context and production network characteristics, this paper takes the panel data of China’s A-share listed companies from 2013 to 2023 as the research sample. It strictly distinguishes individual corporate adoption of artificial intelligence from production network spillover effects, systematically decomposes the direct impacts, asymmetric spillover mechanisms, internal transmission channels and heterogeneous boundary conditions through which artificial intelligence affects supply chain disruption risks, and clarifies the differentiated logic between direct empowerment and network collaborative empowerment of digital and intelligent technologies. The main research conclusions are as follows:
First, the adoption of artificial intelligence can significantly reduce enterprises’ supply chain disruption risks, accompanied by prominent asymmetric production network spillover effects originating from upstream firms. In terms of direct effects, enterprises that independently deploy artificial intelligence technologies can directly offset disruption risks caused by supply–demand mismatches and information frictions in supply chains through optimized information processing, operational decision-making and resource allocation. As for network spillover effects, AI adoption by upstream enterprises generates cross-firm spillovers of production information, supply capacity and operational standards via industrial chain input–output linkages, passively lowering supply chain disruption risks of downstream firms. In contrast, technology adoption by downstream enterprises can hardly reverse core risks on the upstream supply side, leading to remarkable asymmetry in spillover effects. Such effects represent exclusive network governance outcomes distinct from conventional digital transformation and general industrial linkages.
Second, AI adoption and its network spillover effects can mitigate supply chain risks via three localized adaptive channels, constructing a complete logical chain of “technology empowerment–network transmission–mechanism optimization–risk mitigation”. Specifically, the adoption of artificial intelligence by individual firms and upstream enterprises can effectively break rigid traditional cooperation modes and reduce supply chain concentration, addressing the vulnerability of Chinese enterprises arising from over-reliance on limited supply partners. It can standardize contract performance across industrial chains, restrain opportunistic behaviors and cut corporate agency costs, which conforms to the institutional characteristics of multi-layered governance and incomplete contracts among domestic firms. Additionally, it can optimize the full-chain material circulation system and raise corporate logistics efficiency to tackle practical dilemmas such as inadequate logistics coordination and unbalanced cross-regional material flows, thereby reducing supply chain disruption risks from multiple dimensions in the end.
Third, the direct empowerment and network spillover effects of artificial intelligence present obvious heterogeneity under China’s local context, which clarifies the applicable boundary of the research conclusions in this paper. From a regional perspective, eastern regions are equipped with sound digital infrastructure and dense industrial production networks that can effectively absorb and transmit the spillover value of artificial intelligence, yielding much stronger direct and spillover effects. In central and western regions, however, loose network connections and insufficient technology absorption capacity restrain the release of spillover effects. From an industrial perspective, low-tech industries suffer from prominent inherent defects in supply chain management and feature simple industrial chain structures, thus enjoying substantial marginal empowerment and network spillover effects brought by artificial intelligence. In contrast, high-tech industries have well-established digital foundations, resulting in diminishing marginal returns of technological empowerment. In terms of corporate ownership, state-owned enterprises occupy core network nodes of industrial chains and possess resource advantages as well as trust foundations, enabling them to efficiently generate and absorb network spillover dividends, with remarkably superior risk mitigation effects compared with non-state-owned enterprises.
7.2. Managerial Implications
Based on the conclusions regarding direct effects and asymmetric network spillovers derived from China’s local context, combined with the boundary characteristics of differentiated AI empowerment, this paper puts forward targeted management implications from three dimensions: corporate industrial chain governance, coordinated industrial development, and government ecological construction, so as to facilitate the construction of China’s supply chain resilience system.
First, micro enterprises should actively promote the in-depth implementation of artificial intelligence to consolidate their own foundation for resisting supply chain risks. Enterprises need to shift artificial intelligence from superficial digital publicity to substantive technology deployment. Relying on machine learning, big data analysis, intelligent scheduling and other technologies, they should build a full-process digital management platform to break data barriers covering procurement, production, inventory and logistics across the whole chain. Such platforms enable accurate prediction of market fluctuations and supply risks. By optimizing internal operations, reducing information frictions and improving physical logistics systems, enterprises can cut down individual supply chain disruption risks from the source. Meanwhile, enterprises in low-tech industries, central and western regions, and non-state-owned enterprises should prioritize remedying their deficiencies in digital and intelligent transformation to narrow the gap in technological empowerment.
Second, at the meso industrial level, industries should build a collaborative empowerment system based on production networks to fully release spillover dividends generated by upstream artificial intelligence adoption. Core participants in industrial chains should take the initiative to assume industrial empowerment responsibilities. Leveraging their own advantages in intelligent transformation, they can construct industrial chain platforms for information sharing and collaborative operation, open core data including production schedules, inventory status and delivery cycles, and unify supply standards and logistics coordination systems across the industrial chain. By strengthening the connection density of upstream and downstream networks and smoothing transmission channels for AI spillovers, industries can address the long-standing problems of fragmented information, rigid cooperation and out-of-control risk transmission within traditional industrial chains, thus realizing the shift from risk control by individual firms to resilience enhancement of the entire industrial chain.
Third, at the macro governmental level, authorities shall optimize the digital industrial ecosystem tailored to local conditions and accurately match the contextual boundaries of artificial intelligence empowerment. Local governments should implement targeted policies based on regional and industrial disparities. Eastern regions shall focus on developing digitally collaborative industrial clusters, boosting the connection efficiency of production networks and amplifying technological spillover effects. Central and western regions shall prioritize the improvement of digital infrastructure and cultivation of digital talents to consolidate the foundation for technology absorption. Special support policies for digital and intelligent transformation shall be introduced for low-tech industries and private enterprises to remove resource constraints and technical barriers. Relying on China’s institutional strengths to upgrade the industrial digital ecosystem, the supply chain governance value of artificial intelligence can be maximized.
7.3. Limitations and Future Research Prospects
This article grounds its analysis in China’s local production network context and clarifies the conceptual boundaries, functional mechanisms, and heterogeneous characteristics of the direct empowerment and network spillover effects of artificial intelligence, thereby enriching the theoretical framework governing supply chain risk management enabled by digital and intelligent technologies. Nevertheless, this study bears certain limitations that can point to avenues for future research.
First, limitations exist in the risk measurement dimension. This paper measures supply chain disruption risks via word embedding based on annual report texts. While this approach effectively captures firms’ overall annual risk exposure, it fails to fully cover diverse categories and subtle attributes of supply chain risks. It lacks sufficient sensitivity to identify short-cycle, sudden, and phased supply chain shocks and entails a certain time lag. Subsequent research may integrate multi-modal high-frequency information including annual reports, quarterly reports, corporate announcements, and public sentiment data to construct a multi-dimensional, dynamic, and high-precision indicator system for supply chain disruption risks, so as to more accurately depict the dynamic evolution of risks.
Second, the research context can be further refined and expanded. The study focuses on the overall domestic industrial context of China and defines research boundaries as distinct from those of overseas markets; yet, it fails to differentiate the heterogeneous characteristics between firms’ domestic supply chains and cross-border supply chains. Against the backdrop of globalization, disparities in firms’ domestic and overseas business layouts lead to notable differences in the sources of supply chain risks, risk transmission paths, and the effectiveness of technological empowerment. Cross-border supply chains face fundamentally different risks including geopolitical conflicts, trade barriers and cross-border logistics disruptions compared with domestic supply chains. Restricted by data availability, this paper does not conduct an in-depth exploration of this issue. Future research may combine first-hand survey data and micro-level cross-border business data to comparatively analyze the differential effects of artificial intelligence on risk governance within domestic and cross-border supply chains, so as to enrich research on digital and intelligent supply chain governance from a globalized perspective.
Third, the boundary conditions of spillover effects can be further deepened. This article has verified the heterogeneity of spillover effects from the dimensions of region, industry and ownership; yet, it fails to further investigate the moderating boundary roles of factors such as digital policies, industrial chain concentration and firms’ digital investment intensity. Future research can thoroughly explore the variation in the magnitude of AI network spillover effects under different institutional policies and industrial competition landscapes, so as to further improve the theoretical framework on the boundary conditions of industrial spillovers generated by digital and intelligent technologies.
Fourth, this study adopts the word frequency of artificial intelligence keywords in the annual reports of listed companies as the core explanatory variable. Although this quantification method is widely used in existing textual empirical research, it has certain limitations. The word frequency indicator of annual reports can only reflect enterprises’ information disclosure preferences and textual expression tendencies, and cannot accurately depict the actual implementation and application level of artificial intelligence technologies. Some enterprises deliberately pile up artificial intelligence-related words for publicity without carrying out substantial technology implementation, leading to disclosure bias, and the single textual indicator suffers from validity defects. To address this limitation, future research can expand multi-dimensional proxy variables for robustness and validity tests, and integrate objective financial and patent data such as the number of artificial intelligence patents, R&D expenditure, and investment in digital software and hardware to construct a composite measurement indicator. Meanwhile, typical enterprise samples can be selected for manual textual verification to distinguish promotional disclosure from genuine technological layout of enterprises, so as to further improve the measurement accuracy of artificial intelligence application level and optimize the relevant empirical identification framework.
Fifth, this article mainly focuses on the positive governance effect and positive network spillover value of artificial intelligence in supply chain risk management, and fails to conduct a dialectical discussion on the potential negative problems of artificial intelligence application combined with cutting-edge research. In practice, the implementation of artificial intelligence may be accompanied by issues such as algorithm bias, algorithm black box, system vulnerabilities, data leakage and hidden cyber security risks. Excessive automation will also weaken the flexible adjustment capacity of supply chains. Moreover, its network transmission characteristics can not only mitigate risks, but also amplify local technical failures and decision-making biases, resulting in industrial chain cascading fluctuations and systemic risks. Future research can construct an analytical framework of the dual effects of artificial intelligence, dialectically examine the game relationship and applicable boundaries between its positive risk mitigation mechanism and negative technical risks as well as network amplification effects, and improve the theoretical system of digital-intelligent supply chain governance.
Author Contributions
Methodology, H.L. and Y.C.; formal analysis, Y.C.; investigation, H.L.; writing—original draft, H.L.; writing—review and editing, H.L. and Y.C.; supervision, Y.C.; funding acquisition, H.L. and Y.C. All authors have read and agreed to the published version of the manuscript.
Funding
This research was funded by the Ministry of Education Humanities and Social Sciences Research Project of China [grant number 24YJC790091]; The Henan Provincial Soft Science Research Program [grant number 262400411235].
Data Availability Statement
The data presented in this study are available on request from the corresponding author.
Acknowledgments
The authors declare that Gen AI (Doubao Seed2.1) was used in the creation of this manuscript. The ideas, data processing, and composition of this paper were independently conducted by our team members. Due to limited proficiency in English, we utilized translation software (dou bao) to polish and embellish the manuscript’s expression.
Conflicts of Interest
The authors declare no conflicts of interest.
Appendix A. Supply Chain Disruption Risk Lexicon
Table A1.
Lexicon of supply chain and risk themes.
Typical Event Validity Test
To verify the rationality of the indicator, this paper selects two typical supply chain shock events, namely the COVID-19 outbreak in 2020 and the floods in Henan Province in 2021, to carry out group tests.
The circulation of corporate supply chains nationwide was hindered by the COVID-19 outbreak in 2020. The average value of SCDR in our sample for 2020 is 0.047, which is significantly higher than the full sample average of 0.028. During the Henan floods in 2021, logistics and production in disaster-hit areas were completely suspended. The average SCDR of listed companies located in Henan Province reached 0.052, noticeably higher than that of firms in non-disaster areas. The indicator rises significantly under both external shocks, which proves that the supply chain disruption risk indicator constructed in this paper can effectively capture real-world disruption events and possesses satisfactory validity.
Appendix B. Artificial Intelligence Lexicon and Validation
Table A2.
Artificial intelligence lexicon.
Appendix B.1. Comparative Test of Manual Scoring and Word Frequency in Annual Reports
We randomly selected 20 annual reports of listed companies and invited two practitioners with industry experience in artificial intelligence. The two practitioners scored the artificial intelligence technology level of listed companies based on their annual reports, which were divided into two levels: high and low. Afterwards, the scoring results were compared with the word frequency of artificial intelligence terms in the annual reports.
For instance, in the 2017 Annual Report of Guangzhou Yinyin Technology Co., Ltd. (Stock Code: 002177), the core competitiveness analysis in Section 3 Company Business Overview mentions “exploring artificial intelligence technologies” and “the company’s exclusive intelligent management cloud platform containing massive information”. In Section 4 Discussion and Analysis of Operating Conditions, the application status of the company’s artificial intelligence technologies is summarized in terms of intelligent equipment and biometrics. Based on the above information, this company was rated a high score.
In the 2016 Annual Report of Zhangjiagang Free Trade Zone Logistics Co., Ltd. (Stock Code: 600794), the company only analyzed its core competitiveness from the perspectives of corporate reputation, brand advantages, scale advantages and geographical advantages, without including technological advantages. In addition, other parts of the annual report contain no descriptions related to the application of artificial intelligence technologies. Based on the above information, this company was rated a low score.
A comparison between manual scoring results and word frequency in annual reports shows that annual reports of companies with high scores have higher word frequency of artificial intelligence terms, with an average word frequency of 41.70; annual reports of companies with low scores have lower word frequency of artificial intelligence terms, with an average word frequency of 1.40. To a certain extent, this indicates that the word frequency of artificial intelligence terms in listed companies’ annual reports can reflect enterprises’ artificial intelligence technology levels. Detailed results are presented in Table A3.
Table A3.
Comparison results of manual scoring and word frequency in annual reports.
Appendix B.2. Analysis of Noise from General Vocabulary
General terms such as “data, price, cost” in the lexicon contain semantic ambiguities and tend to generate measurement noise. For instance, “data” may refer to supply chain risk data or enterprises’ digital construction; “cost” can represent regular operating costs or additional costs triggered by risks. This paper mitigates noise via a dual filtering rule. First, a term is counted only if it appears in the same sentence as supply chain-related vocabulary. Second, sentences describing regular business operations and digital construction are eliminated based on contextual semantics. After processing, the proportion of noise originating from general vocabulary drops from the initial 18.3% to 4.5%, and measurement bias is effectively controlled.
Appendix C. Explanation of Network Spillover Effect Indicators
Only formulas were listed in the original text. We now supplement in the appendix the logic for aggregating firm-level artificial intelligence application levels to the industry level, economic implications of parameters, numerical examples, basis for weight setting, and discussion on the endogeneity of network linkages.
The upstream spillover (Up) and downstream spillover (Down) indicators are constructed based on industrial input–output tables. The formulas, detailed interpretations and calculation logic are presented as follows.
Appendix C.1. Review of Basic Variable Definitions
Appendix C.2. Logic of Aggregating Firm-Level AIT to Industry Spillovers
This study converts micro-firm indicators into industry spillover indicators through three steps.
Step 1: Based on the input–output weight , we conduct a weighted sum of for all related firms j within the same industry to reflect the heterogeneous impacts of different affiliated enterprises.
Step 2: Take the industry average of the summed results by dividing by to eliminate disparities in firm scale across industries.
Step 3: Multiply the above average by the industry intermediate input utilization density to ultimately obtain the industry-level network spillover value faced by firm i.
In short, we first weight and integrate the AIT levels of all enterprises along the industrial chain, and then combine the strength of industrial production linkages to form spillover effects acting on the target firm.
Appendix C.3. Basis for the Setting of Intermediate Input Density θm
This paper selects as the spillover weight. Its core economic rationale is that a higher intermediate input density indicates that industry m has stronger dependence on upstream raw materials and components, tighter production network connections, and higher transmission efficiency of technology, information and risks. Input–output theory suggests that industrial linkage intensity serves as the core carrier of spillover effects; higher dependence leads to more significant value spillovers of upstream artificial intelligence applications to downstream sectors. Combined with China’s industrial characteristics, the manufacturing sector generally features higher intermediate input density and stronger industrial chain coordination than the service sector, accompanied by more prominent spillover effects of artificial intelligence applications. Therefore, this weight is consistent with the actual conditions of domestic industries.
Appendix C.4. Complete Numerical Example
Table A4.
Numerical calculation example.
The comprehensive spillover value of artificial intelligence applications in the upstream component industry received by this automobile manufacturing enterprise is 39.6, and a larger value indicates stronger spillover intensity of upstream artificial intelligence applications.
Appendix C.5. Overall Economic Interpretation of the Formula
Direct consumption coefficient depicts the intensity of production dependence between industries. A higher degree of dependence means a larger weight of the impact of upstream artificial intelligence applications on downstream industries.
Weighted average of firm-level AIT. It reflects the overall intelligence level of the industrial chain. More widespread adoption of artificial intelligence among affiliated firms generates stronger spillover effects.
Intermediate input density . It measures the tightness of industrial networks and acts as the base spillover benchmark to amplify transmission effects brought by industrial linkages.
Implication of the overall formula: The upstream spillover effect of artificial intelligence applications received by the target firm is jointly determined by three factors: inter-industry production dependence, overall intelligence of the industrial chain, and industrial network density.
Appendix D. Further Tests on Transmission Channels
To fully verify that the estimated effects in this paper reflect the genuine AI spillover mechanism operating through production networks rather than correlated industrial or regional trends, we introduce high-dimensional interactive fixed effects to isolate industrial and regional synchronous trends, and further conduct placebo network tests and randomized input–output matrix simulations to confirm that the estimated effects originate from the transmission channel of production networks.
Appendix D.1. Model Specification Upgrade: Introducing High-Dimensional Interactive Fixed Effects to Isolate Synchronous Industrial and Regional Trends
The spillover effect of artificial intelligence application identified in this paper may merely stem from the synchronous digital development trends of firms within the same industry or region, instead of the exclusive spillover driven by supply–demand linkages of production networks. To address this confounding variable issue, we first upgrade the baseline model by incorporating industry-by-year interactive fixed effects and province-by-year interactive fixed effects to absorb macro common shocks including annual digital policies, technological cycles within each industry, yearly regional industrial support and digital infrastructure expansion. Meanwhile, two additional control variables are added: the annual average artificial intelligence application level within the same industry (Ind_AIT) and the annual average artificial intelligence application level within the same province (Pro_AIT), which directly capture the overall synchronous digital fluctuations at the industry and regional levels and accurately separate the pure spillover effect of production networks. The upgraded model is specified as follows:
where denotes the industry to which a firm belongs and denotes the province where the firm is located; represents industry-by-year interactive fixed effects, and represents province-by-year interactive fixed effects; refers to the average artificial intelligence application level of all firms in industry in year , and refers to the average AI level of all firms in province in year . Definitions of other variables remain consistent with those stated above.
Appendix D.2. Placebo Network Tests
To verify that the significantly negative effect of upstream spillover is generated solely by real supply–demand linkages of industrial chains rather than random industrial clustering or regional synchronous trends, we construct fake placebo production networks to conduct permutation tests. We keep each firm’s affiliated industry, year, all control variables and fixed effects unchanged; randomly disrupt the upstream and downstream matching relationships of firms within each industry, assign virtual upstream and downstream firms randomly, and construct the fake upstream spillover indicator ; repeat the random permutation and regression procedures 1000 times and store the coefficient of from each regression; and summarize the distribution characteristics of the 1000 placebo coefficients and compare them with the coefficient of obtained from the real baseline regression.
The results of the placebo network test are shown in Column (2) of Table A5. The absolute value of the placebo coefficient is 0.013, far smaller than the absolute value of the upstream spillover coefficient of 0.115 derived from the real network. After stripping out common industrial and regional trends, the upstream spillover coefficient of the real production network remains significantly negative at the 5% significance level, while the placebo network exhibits no significant risk-mitigating effect. The results confirm that the observed spillover effect of artificial intelligence application in this paper is not a spurious correlation caused by random industrial and firm clustering or synchronous regional digitalization, and only exists within genuine input–output production network linkages.
Table A5.
Further tests of transmission mechanisms.
Appendix D.3. Randomized Input–Output Matrices
The upstream and downstream indicators in this paper are constructed based on the original input–output direct consumption coefficient matrix W. If the spillover effect is only driven by inherent broad industrial characteristics and overall regional trends, the effect will remain significant after randomly reshuffling industrial linkage weights; if the effect relies on real supply–demand connections of industrial chains, the network spillover indicators constructed from randomized IO matrices will become insignificant.
The operation steps are as follows:
Randomly reshuffle all industrial linkage weights within the original annual input–output matrices to generate a randomized matrix without real economic supply–demand relationships; recalculate the fake upstream spillover indicator and downstream spillover indicator using the randomized matrix; re-estimate the full model containing industry-by-year and province-by-year interactive fixed effects.
The results are presented in Column (3) of Table A5. The coefficient of the fake upstream spillover Uprandom constructed based on the randomized IO matrix is −0.027 and fails to pass the significance test, and the downstream spillover indicator is also insignificant. Compared with the regression results of the real IO matrix in Column (1), the upstream spillover effect under real industrial chain linkages remains stably significant after eliminating common industrial and regional trends. Therefore, the spillover effect of artificial intelligence application relies on genuine supply–demand input–output linkages across industries.
Combining three identification strategies including high-dimensional interactive fixed effects, placebo network permutation, and randomized input–output matrices, we find that after fully absorbing annual common industrial technological trends and yearly regional digital policy shocks, and controlling the average artificial intelligence application levels by industry and province, the spillover effect of artificial intelligence application relying on real production networks remains significantly negative. In contrast, the spillover effect completely disappears under fake random networks and randomized industrial linkage matrices. It verifies that the effect captured by the baseline regression of this paper is a genuine spillover mechanism transmitted through industrial production networks, rather than spurious correlation caused by synchronous fluctuations at the macro level.
References
- Benedito, E.; Martínez-Costa, C.; Rubio, S. Introducing risk considerations into the supply chain network design. Processes 2020, 8, 743. [Google Scholar] [CrossRef] [Scilit]
- Kano, L.; Hoon Oh, C. Global value chains in the post-COVID world: Governance for reliability. J. Manag. Stud. 2020, 57, 1773–1777. [Google Scholar] [CrossRef] [Scilit]
- Wieland, A.; Wallenburg, C.M. Dealing with Supply Chain Risks: Linking Risk Management Practices and Strategies to Performance. Int. J. Phys. Distrib. Logist. Manag. 2012, 42, 887–905. [Google Scholar] [CrossRef] [Scilit]
- Wu, L.; Yue, X.; Jin, A.; Yen, D.C. Smart supply chain management: A review and implications for future research. Int. J. Logist. Manag. 2016, 27, 395–417. [Google Scholar] [CrossRef] [Scilit]
- Ivanov, D.; Dolgui, A. Viability of intertwined supply networks: Extending the supply chain resilience angles towards survivability. A position paper motivated by COVID-19 outbreak. Int. J. Prod. Res. 2020, 58, 2904–2915. [Google Scholar] [CrossRef] [Scilit]
- Liu, J.; Chang, H.; Forrest, J.Y.; Yang, B. Influence of artificial intelligence on technological innovation: Evidence from the panel data of China’s manufacturing sectors. Technol. Forecast. Soc. Change 2020, 158, 120142. [Google Scholar] [CrossRef] [Scilit]
- Sharma, R.; Shishodia, A.; Gunasekaran, A.; Min, H.; Munim, Z.H. The role of artificial intelligence in supply chain management: Mapping the territory. Int. J. Prod. Res. 2022, 60, 7527–7550. [Google Scholar] [CrossRef] [Scilit]
- Song, H.; Chang, R.; Cheng, H.; Liu, P.; Yan, D. The impact of manufacturing digital supply chain on supply chain disruption risks under uncertain environment—Based on dynamic capability perspective. Adv. Eng. Inform. 2024, 60, 102385. [Google Scholar] [CrossRef] [Scilit]
- Ivanov, D.; Dolgui, A.; Sokolov, B. The impact of digital technology and Industry 4.0 on the ripple effect and supply chain risk analytics. Int. J. Prod. Res. 2019, 57, 829–846. [Google Scholar] [CrossRef] [Scilit]
- Zhao, N.; Hong, J.; Lau, K.H. Impact of supply chain digitalization on supply chain resilience and performance: A multi-mediation model. Int. J. Prod. Econ. 2023, 259, 108817. [Google Scholar] [CrossRef] [Scilit] [PubMed]
- Kumar, S.K.; Tiwari, M.K.; Babiceanu, R.F. Minimisation of supply chain cost with embedded risk using computational intelligence approaches. Int. J. Prod. Res. 2010, 48, 3717–3739. [Google Scholar] [CrossRef] [Scilit]
- Chapman, P.; Christopher, M.; Juttner, U.; Peck, H. Identifying and managing supply chain vulnerability. Logist. Transp. Focus 2002, 4, 59–70. [Google Scholar]
- Christopher, M.; Peck, H. Building the resilient supply chain. Int. J. Logist. Manag. 2004, 15, 1–13. [Google Scholar] [CrossRef] [Scilit]
- Sreedevi, R.; Saranga, H. Uncertainty and supply chain risk: The moderating role of supply chain flexibility in risk mitigation. Int. J. Prod. Econ. 2017, 193, 332–342. [Google Scholar] [CrossRef] [Scilit]
- Lee, H.L.; Padmanabhan, V.; Whang, S. The bullwhip effect in supply chains. Sloan Manag. Rev. 1997, 38, 93–102. [Google Scholar]
- Singh, S.; Kumar, R.; Panchal, R.; Tiwari, M.K. Impact of COVID-19 on logistics systems and disruptions in food supply chain. Int. J. Prod. Res. 2021, 59, 1993–2008. [Google Scholar] [CrossRef] [Scilit]
- Costello, A.M. Credit market disruptions and liquidity spillover effects in the supply chain. J. Political Econ. 2020, 128, 3434–3468. [Google Scholar] [CrossRef] [Scilit] [PubMed]
- Bonadio, B.; Huo, Z.; Levchenko, A.A.; Pandalai-Nayar, N. Global supply chains in the pandemic. J. Int. Econ. 2021, 133, 103534. [Google Scholar] [CrossRef] [Scilit] [PubMed]
- Acemoglu, D.; Carvalho, V.M.; Ozdaglar, A.; Tahbaz-Salehi, A. The network origins of aggregate fluctuations. Econometrica 2012, 80, 1977–2016. [Google Scholar] [CrossRef] [Scilit]
- Alessandria, G.; Khan, S.Y.; Khederlarian, A.; Mix, C.; Ruhl, K.J. The aggregate effects of global and local supply chain disruptions: 2020–2022. J. Int. Econ. 2023, 143, 103788. [Google Scholar] [CrossRef] [Scilit]
- Carvalho, V.M.; Nirei, M.; Saito, Y.U.; Tahbaz-Salehi, A. Supply chain disruptions: Evidence from the Great East Japan earthquake. Q. J. Econ. 2021, 136, 1255–1321. [Google Scholar] [CrossRef] [Scilit]
- Umar, M.; Wilson, M.M.J. Inherent and adaptive resilience of logistics operations in food supply chains. J. Bus. Logist. 2024, 45, e12362. [Google Scholar] [CrossRef] [Scilit]
- Dey, P.K.; Chowdhury, S.; Abadie, A.; Yaroson, E.V.; Sarkar, S. Artificial intelligence-driven supply chain resilience in Vietnamese manufacturing small-and medium-sized enterprises. Int. J. Prod. Res. 2023, 62, 5417–5456. [Google Scholar] [CrossRef] [Scilit]
- Todo, Y.; Oikawa, K.; Ambashi, M.; Kimura, F.; Urata, S. Robustness and resilience of supply chains during the COVID-19 pandemic. World Econ. 2023, 46, 1843–1872. [Google Scholar] [CrossRef] [Scilit] [PubMed]
- Ersahin, N.; Giannetti, M.; Huang, R. Supply chain risk: Changes in supplier composition and vertical integration. J. Int. Econ. 2024, 147, 103854. [Google Scholar] [CrossRef] [Scilit]
- Gupta, S.; Modgil, S.; Choi, T.M.; Kumar, A.; Antony, J. Influences of artificial intelligence and blockchain technology on financial resilience of supply chains. Int. J. Prod. Econ. 2023, 261, 108868. [Google Scholar] [CrossRef] [Scilit]
- Belhadi, A.; Kamble, S.; Jabbour, C.J.C.; Gunasekaran, A.; Ndubisi, N.O.; Venkatesh, M. Manufacturing and service supply chain resilience to the COVID-19 outbreak: Lessons learned from the automobile and airline industries. Technol. Forecast. Soc. Change 2021, 163, 120447. [Google Scholar] [CrossRef] [Scilit] [PubMed]
- Katsaliaki, K.; Galetsi, P.; Kumar, S. Supply chain disruptions and resilience: A major review and future research agenda. Ann. Oper. Res. 2022, 319, 965–1002. [Google Scholar] [CrossRef] [Scilit] [PubMed]
- Dohale, V.; Akarte, M.; Gunasekaran, A.; Verma, P. Exploring the role of artificial intelligence in building production resilience: Learnings from the COVID-19 pandemic. Int. J. Prod. Res. 2022, 62, 5472–5488. [Google Scholar] [CrossRef] [Scilit]
- Baryannis, G.; Validi, S.; Dani, S.; Antoniou, G. Supply chain risk management and artificial intelligence: State of the art and future research directions. Int. J. Prod. Res. 2019, 57, 2179–2202. [Google Scholar] [CrossRef] [Scilit]
- Acemoglu, D. Robots and Jobs: Evidence from US Labor Markets. J. Political Econ. 2020, 128, 2188–2244. [Google Scholar] [CrossRef] [Scilit]
- Babina, T.; Fedyk, A.; He, A.; Hodson, J. Artificial intelligence, firm growth, and product innovation. J. Financ. Econ. 2024, 151, 103745. [Google Scholar] [CrossRef] [Scilit]
- Aghion, P.; Howitt, P.W. The Economics of Growth; MIT Press: Cambridge, MA, USA, 2008. [Google Scholar]
- Kaplan, A.; Haenlein, M. Siri, Siri, in my hand: Who’s the fairest in the land? On the interpretations, illustrations, and implications of artificial intelligence. Bus. Horiz. 2019, 62, 15–25. [Google Scholar] [CrossRef] [Scilit]
- Toorajipour, R.; Sohrabpour, V.; Nazarpour, A.; Oghazi, P.; Fischl, M. Artificial intelligence in supply chain management: A systematic literature review. J. Bus. Res. 2021, 122, 502–517. [Google Scholar] [CrossRef] [Scilit]
- Hoffman, R.; Casnocha, B.; Yeh, C. The Alliance: Managing Talent in the Networked Age; Harvard Business Press: Cambridge, UK, 2014. [Google Scholar]
- Modgil, S.; Singh, R.K.; Hannibal, C. Artificial intelligence for supply chain resilience: Learning from COVID-19. Int. J. Logist. Manag. 2022, 33, 1246–1268. [Google Scholar] [CrossRef] [Scilit]
- Sundarakan, B.; Pereira, V.; Ishizaka, A. Robust facility location decisions for resilient sustainable supply chain performance in the face of disruptions. Int. J. Logist. Manag. 2021, 32, 357–385. [Google Scholar] [CrossRef] [Scilit]
- Ivanov, D.; Dolgui, A.; Sokolov, B. Cloud supply chain: Integrating industry 4.0 and digital platforms in the supply-chain-as-a-service. Transp. Res. Part E Logist. Transp. Rev. 2022, 160, 102676. [Google Scholar] [CrossRef] [Scilit]
- Fosso Wamba, S.; Queiroz, M.M.; Trinchera, L. Dynamics between blockchain adoption determinants and supply chain performance: An empirical investigation. Int. J. Prod. Econ. 2020, 229, 107791. [Google Scholar] [CrossRef] [Scilit]
- Pettit, T.J.; Croxton, K.L.; Fiksel, J. The Evolution of Resilience in Supply Chain Management: A Retrospective on Ensuring Supply Chain Resilience. J. Bus. Logist. 2019, 40, 56–65. [Google Scholar] [CrossRef] [Scilit]
- Ralston, P.; Blackhurst, J. Industry 4.0 and resilience in flexible supply chain: A driver of capability enhancement or capability loss? Int. J. Prod. Res. 2020, 58, 5006–5019. [Google Scholar] [CrossRef] [Scilit]
- Rao, S.; Goldsby, T.J. Supply chain risks: A review and typology. Int. J. Logist. Manag. 2009, 20, 97–123. [Google Scholar] [CrossRef] [Scilit]
- Shen, B.; Choi, T.M.; Minner, S. A review on supply chain contracting with information considerations: Information updating and information asymmetry. Int. J. Prod. Res. 2019, 57, 4898–4936. [Google Scholar] [CrossRef] [Scilit]
- Chen, H.; Chiang, R.H.; Storey, V.C. Business intelligence and analytics: From big data to big impact. MIS Q. 2012, 36, 1165–1188. [Google Scholar] [CrossRef] [Scilit]
- Vosooghidizaji, M.; Taghipour, A.; Canel-Depitre, B. Supply chain coordination under information asymmetry: A review. Int. J. Prod. Res. 2020, 58, 1805–1834. [Google Scholar] [CrossRef] [Scilit]
- Grover, P.; Kar, A.K.; Dwivedi, Y.K. Understanding artificial intelligence adoption in operations management: Insights from the review of academic literature and social media discussions. Ann. Oper. Res. 2022, 308, 177–213. [Google Scholar] [CrossRef] [Scilit]
- Chapman, C.S.; Kihn, L.A. Information system integration, enabling control and performance. Account. Organ. Soc. 2009, 34, 151–169. [Google Scholar] [CrossRef] [Scilit]
- Haefner, N.; Wincent, J.; Parida, V.; Gassmann, O. Artificial intelligence and innovation management: A review, framework, and research agenda. Technol. Forecast. Soc. Change 2021, 162, 120392. [Google Scholar] [CrossRef] [Scilit]
- Tran, K.; Ulissi, Z.W. Active learning across intermetallics to guide discovery of electrocatalysts for CO2 reduction and H2 evolution. Nat. Catal. 2018, 1, 696–703. [Google Scholar] [CrossRef] [Scilit]
- Richey, J.G.J.; Chowdhury, S.; Davis-Sramek, B.; Giannakis, M.; Dwivedi, Y.K. Artificial intelligence in logistics and supply chain management: A primer and roadmap for research. J. Bus. Logist. 2023, 44, 532–549. [Google Scholar] [CrossRef] [Scilit]
- Acemoglu, D.; Akcigit, U.; Kerr, W. Networks and the Macroeconomy: An Empirical Exploration. NBER Macroecon. Annu. 2016, 30, 273–335. [Google Scholar] [CrossRef] [Scilit] [PubMed]
- Fantazy, K.; Tipu, S.A.A. Linking Big Data Analytics Capability and Sustainable Supply Chain Performance: Mediating Role of Knowledge Development. Manag. Res. Rev. 2024, 47, 512–536. [Google Scholar] [CrossRef] [Scilit]
- Iansiti, M.; Lakhani, K.R. Competing in the age of AI. Harv. Bus. Rev. 2020, 98, 60–67. [Google Scholar]
- Hu, B.; Kostamis, D. Managing Supply Disruptions When Sourcing from Reliable and Unreliable Suppliers. Prod. Oper. Manag. 2015, 24, 808–820. [Google Scholar] [CrossRef] [Scilit]
- Birge, J.R.; Capponi, A.; Chen, P.C. Disruption and rerouting in supply chain networks. Oper. Res. 2023, 71, 750–767. [Google Scholar] [CrossRef] [Scilit]
- Acemoglu, D.; Restrepo, P. The Race between Man and Machine: Implications of Technology for Growth, Factor Shares, and Employment. Am. Econ. Rev. 2018, 108, 1488–1542. [Google Scholar] [CrossRef] [Scilit]
- Namdar, J.; Li, X.; Sawhney, R.; Pradhan, N. Supply chain resilience for single and multiple sourcing in the presence of disruption risks. Int. J. Prod. Res. 2018, 56, 2339–2360. [Google Scholar] [CrossRef] [Scilit]
- Tukamuhabwa, B.R.; Stevenson, M.; Busby, J.; Zorzini, M. Supply chain resilience: Definition, review and theoretical foundations for further study. Int. J. Prod. Res. 2015, 53, 5592–5623. [Google Scholar] [CrossRef] [Scilit]
- Stiebale, J.; Vencappa, D. Acquisitions, Markups, Efficiency, and Product Quality: Evidence from India. J. Int. Econ. 2018, 112, 70–87. [Google Scholar] [CrossRef] [Scilit]
- Jarrahi, M.H. Artificial intelligence and the future of work: Human-AI symbiosis in organizational decision making. Bus. Horiz. 2018, 61, 577–586. [Google Scholar] [CrossRef] [Scilit]
- Berente, N.; Gu, B.; Recker, J.; Santhanam, R. Managing artificial intelligence. MIS Q. 2021, 45, 1433–1450. [Google Scholar] [CrossRef] [Scilit]
- Albayrak Unal, O.; Erkayman, B.; Usanmaz, B. Applications of artificial intelligence in inventory management: A systematic review of the literature. Arch. Comput. Methods Eng. 2023, 30, 2605–2625. [Google Scholar] [CrossRef] [Scilit]
- Flechsig, C.; Anslinger, F.; Lasch, R. Robotic process automation in purchasing and supply management: A multiple case study on potentials, barriers, and implementation. J. Purch. Supply Manag. 2022, 28, 100718. [Google Scholar] [CrossRef] [Scilit]
- Isaksson, O.H.D.; Simeth, M.; Seifert, R.W. Knowledge Spillovers in the Supply Chain: Evidence from the High Tech Sectors. Res. Policy 2016, 45, 699–706. [Google Scholar] [CrossRef] [Scilit]
- Hassan, T.A.; Hollander, S.; van Lent, L.; Tahoun, A. Firm-level political risk: Measurement and effects. Q. J. Econ. 2019, 134, 2135–2202. [Google Scholar] [CrossRef] [Scilit]
- Sautner, Z.; Van Lent, L.; Vilkov, G.; Zhang, R. Firm-level climate change exposure. J. Financ. 2023, 78, 1449–1498. [Google Scholar] [CrossRef] [Scilit]
- Yao, J.; Zhang, K.; Zhang, L.; Feng, X. How Does Artificial Intelligence Improve Firm Productivity? Based on the Perspective of Labor Skill Structure Adjustment. J. Manag. World 2024, 40, 101–122,133. [Google Scholar] [CrossRef]
- Di Giovanni, J.; Levchenko, A.A.; Méjean, I. The micro origins of international business-cycle comovement. Am. Econ. Rev. 2018, 108, 82–108. [Google Scholar] [CrossRef] [Scilit]
- Fisman, R.; Svensson, J. Are corruption and taxation really harmful to growth? Firm level evidence. J. Dev. Econ. 2007, 83, 63–75. [Google Scholar] [CrossRef] [Scilit]
- Jiang, T. Mediating Effects and Moderating Effects in Causal Inference. China Ind. Econ. 2022, 5, 100–120. [Google Scholar] [CrossRef]
- Ang, E.; Iancu, D.A.; Swinney, R. Disruption Risk and Optimal Sourcing in Multitier Supply Networks. Manag. Sci. 2017, 63, 2397–2419. [Google Scholar] [CrossRef] [Scilit]
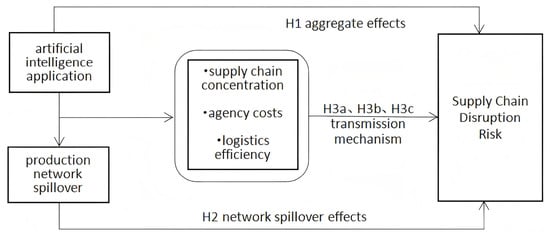
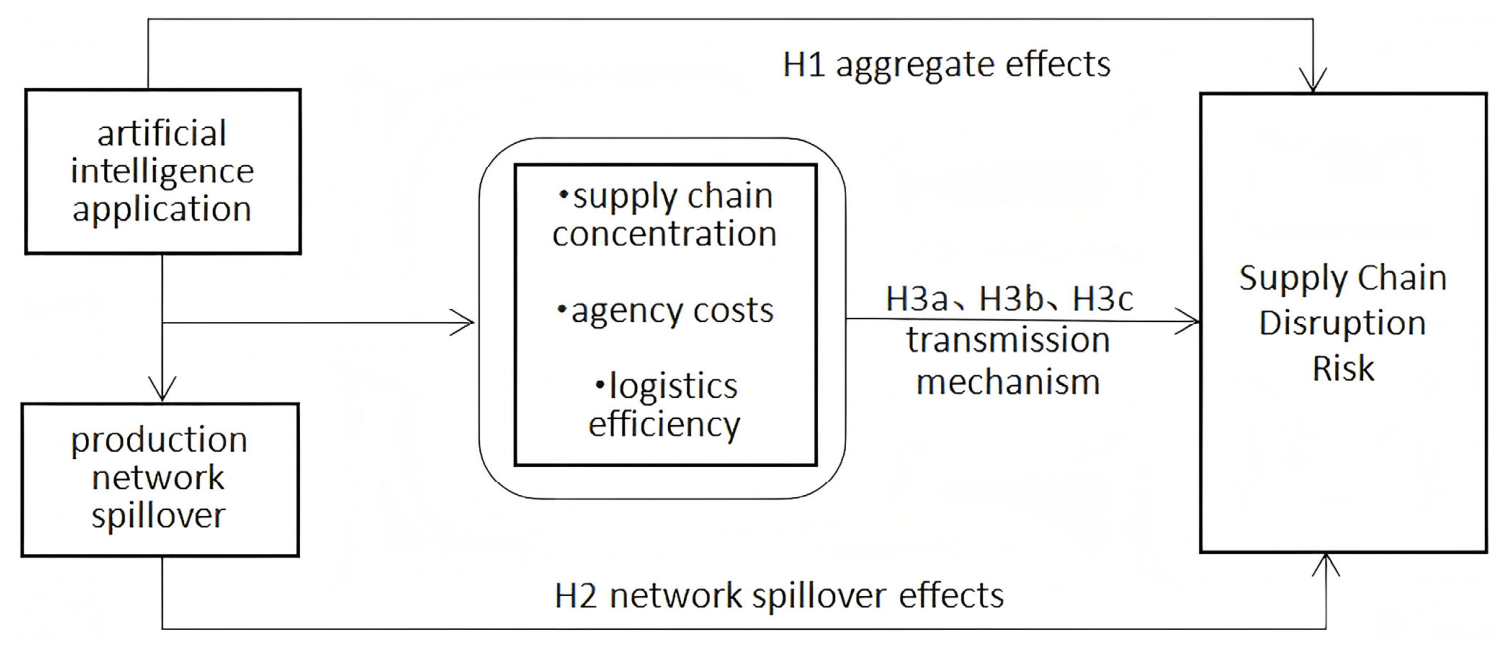

Disclaimer/Publisher’s Note: The statements, opinions and data contained in all publications are solely those of the individual author(s) and contributor(s) and not of MDPI and/or the editor(s). MDPI and/or the editor(s) disclaim responsibility for any injury to people or property resulting from any ideas, methods, instructions or products referred to in the content. |
© 2026 by the authors. Licensee MDPI, Basel, Switzerland. This article is an open access article distributed under the terms and conditions of the Creative Commons Attribution (CC BY) license.