Skip to Content
SystemsSystems
  • Article
  • Open Access

11 June 2026

Policy Complementarity Between AI Innovation Pilot Zones and Supply Chain Innovation Pilots: Evidence from Enterprise Resilience in China

and
1
School of Business Administration, Northeastern University, Shenyang 110001, China
2
School of Business and Management, Jilin University, Changchun 130012, China
*
Author to whom correspondence should be addressed.
This article belongs to the Section Supply Chain Management

Abstract

Firms increasingly face disruptions arising from technological change, supply chain instability, and uncertain policy environments, making enterprise resilience a key concern for both managers and policymakers. As firms operate within interconnected digital and supply chain systems, this study examines whether digital intelligence policy and supply chain coordination policy are jointly associated with enterprise resilience. Using a firm-year panel of Chinese A-share listed companies from 2010 to 2024, we investigate AI innovation pilot zones and supply chain innovation pilots, with a particular focus on whether their coexistence is associated with a complementarity premium. The results suggest that both AI innovation pilot zones and supply chain innovation pilots are positively associated with enterprise resilience. The interaction between the two policies is significantly positive, providing evidence consistent with an additional joint-policy association beyond their separate associations. Dynamic analysis supports the parallel trend assumption and suggests that the estimated complementarity association becomes stronger over time. Mechanism tests provide channel-consistent evidence that joint policy exposure is associated with higher values of the digital-transformation indicator, stronger supply chain coordination, and greater resource reconfiguration. Heterogeneity analysis further suggests that this association is more pronounced among non-state-owned firms, firms in supply-chain-dependent industries, firms located in cities with stronger digital infrastructure, and firms with higher risk exposure. These findings highlight the potential importance of coordinated policy design for supporting firm-level resilience.

1. Introduction

Enterprise resilience has become an increasingly important issue under external shocks, supply chain disruptions, technological change, and policy uncertainty. Resilient firms are expected not only to survive adverse events, but also to maintain essential operations, recover performance, and adapt to changing environments [1]. At the same time, firms are embedded in complex interactions among digital technologies, supply chain systems, and policy environments. Supply chain disruptions have shown that firm-level resilience depends heavily on coordination, flexibility, and recovery capacity across connected production and logistics networks [2,3]. Therefore, examining whether external policy environments are associated with stronger enterprise resilience is both theoretically important and practically relevant.
China’s AI innovation pilot zones and supply chain innovation pilots provide a suitable setting for examining this issue. AI innovation pilot zones represent a policy effort to promote digital intelligence, technological application, and AI-related industrial upgrading. Recent empirical research has shown that AI pilot zone construction can affect firm-level outcomes such as ESG development, suggesting that this policy can reshape corporate behavior through digital and technological channels [4]. Supply chain innovation pilots, in contrast, emphasize supply chain modernization, inter-firm coordination, platform-based collaboration, and operational integration. From the perspective of digital strategy and digital innovation, digital technologies can reshape business value creation, innovation processes, and organizational capabilities [5,6]. These two policies therefore represent distinct but potentially complementary policy instruments: one is oriented toward digital intelligence, whereas the other is oriented toward supply chain coordination.
Existing research has not sufficiently examined this type of policy complementarity. First, the literature on digital transformation has mainly focused on firm-level digital strategy, technology adoption, and organizational transformation [7,8,9]. Second, studies on supply chain resilience and AI-enabled supply chain innovation have increasingly emphasized the importance of information processing, digital integration, and operational coordination [10,11]. However, these studies rarely examine whether city-level AI policy and city-level supply chain policy are jointly associated with firm-level resilience. Third, the complementarity literature suggests that the value of one practice or policy instrument may depend on the presence of another mutually reinforcing element [12]. This raises the central research question of this study: is the coexistence of AI innovation pilot zones and supply chain innovation pilots associated with a complementarity premium in enterprise resilience?
Recent studies have examined links among artificial intelligence, digital transformation, supply chain resilience, and enterprise resilience. For example, recent evidence links AI adoption to supply chain resilience through preparation, response, recovery, reduced supply chain dependence, and operational continuity and efficiency [13]. Studies based on Chinese manufacturing firms also suggest that AI-enabled organizational change can improve supply chain resilience through organizational restructuring and internal-control improvement [14]. At the policy level, recent research revealed that China’s AI pilot policies can strengthen enterprise supply chain resilience by improving absorptive capacity, resource integration capability, and innovation ability [15]. Similarly, the digital-transformation literature links enterprise digitalization to supply chain resilience through resistance, recovery capacity, supply chain power, and supply chain transparency [16,17]. Recent research also shows that digital transformation can enhance enterprise resilience by improving information transmission efficiency and strengthening firms’ ability to withstand and recover from external shocks [18]. Policy evaluation studies also associate the Supply Chain Innovation and Application Pilot policy with higher firm-level productivity through organizational coordination and resource allocation efficiency [19]. However, most of these studies examine a single technology, policy instrument, or resilience dimension. Less is known about the joint role of AI-oriented and supply-chain-coordination policies in firm-level resilience. This gap motivates the present study.
To answer this question, this study constructs a firm-year panel of Chinese A-share listed companies from 2010 to 2024 and matches firm-level data with city-level information on AI innovation pilot zones and supply chain innovation pilots. The empirical design focuses on the interaction between the two policy indicators, which captures joint exposure to both policies after accounting for their separate associations. The results show that both AI innovation pilot zones and supply chain innovation pilots are positively associated with enterprise resilience. More importantly, the interaction term is positive and statistically significant, providing evidence consistent with an additional joint-policy association beyond the two separate policy associations. The estimated total association under joint policy exposure is economically meaningful, equivalent to approximately 9.4% of the sample mean of enterprise resilience. Mechanism tests provide channel-consistent evidence related to enterprise digital transformation, supply chain coordination, and resource reconfiguration. Heterogeneity analyses further suggest that the positive association is more pronounced among non-state-owned firms, firms in supply-chain-dependent industries, firms located in cities with stronger digital infrastructure, and firms with higher risk exposure.
This study makes three contributions. First, it advances the enterprise resilience literature by shifting attention from internal firm resources or single policy shocks to the complementarity of external policy systems. Existing studies have examined how digital transformation, AI-enabled supply chains, or supply chain resilience are related to firm outcomes, but they have rarely considered whether digital-intelligence policy and supply-chain-coordination policy are jointly associated with additional resilience benefits. Second, it contributes to the policy complementarity literature by providing firm-level evidence consistent with the view that two city-level policy instruments may be associated with an additional joint-policy premium beyond their separate associations. By distinguishing AI-only exposure, supply-chain-pilot-only exposure, dual-policy exposure, and the complementarity premium, the study clarifies the empirical meaning of policy complementarity. Third, it connects digital transformation and supply chain resilience research within a systems perspective. The findings suggest that AI-oriented policy support may become more valuable when embedded in supply chain coordination contexts, indicating that enterprise resilience is related to the joint operation of digital infrastructure, inter-firm coordination, and resource reconfiguration. The remainder of this paper is organized as follows. Section 2 reviews the literature and develops the hypotheses. Section 3 describes the data, variables, and empirical strategy. Section 4 presents the empirical results. Section 5 discusses the findings, implications, and limitations. Section 6 concludes the paper.

2. Literature Review and Hypothesis Development

2.1. Institutional Background and Research Context

In recent years, China has increasingly relied on policy pilots to promote digital transformation, supply chain modernization, and high-quality economic development. Two policy initiatives are particularly relevant to this study: the National New Generation Artificial Intelligence Innovation and Development Pilot Zones and the Supply Chain Innovation and Application Pilots. Although these two policies differ in their immediate policy objectives, both aim to improve the technological, organizational, and coordination capacities of local economies and enterprises. The National New Generation Artificial Intelligence Innovation and Development Pilot Zones were introduced to promote the deep integration of artificial intelligence (AI) with economic and social development. According to the policy guidelines issued by the Ministry of Science and Technology, these pilot zones are designed to encourage technological demonstration, policy experimentation, social experimentation, and institutional innovation related to AI development [20]. In practice, AI pilot zones are expected to improve local digital infrastructure, expand AI application scenarios, attract AI-related resources, and accelerate the diffusion of intelligent technologies into manufacturing, logistics, finance, public services, and urban governance.
The Supply Chain Innovation and Application Pilots were launched by the Ministry of Commerce and other government departments to promote modern supply chain development. The official document emphasizes city- and firm-level pilots, supply chain platforms, cross-regional coordination, industrial chain collaboration, supply–demand matching, and the integration of finance, logistics, and information flows [21]. Compared with AI pilot zones, the supply chain pilot policy focuses less on a specific technology and more on improving coordination among upstream and downstream enterprises, enhancing supply chain governance, and building efficient industrial supply chain ecosystems. These two policies provide a suitable context for examining policy complementarity. AI pilot zones mainly strengthen digital intelligence, information processing, prediction, and intelligent decision-making capabilities, whereas supply chain innovation pilots mainly strengthen inter-firm coordination, supply chain integration, logistics efficiency, and resource matching. Enterprise resilience depends on both types of capabilities. Therefore, the coexistence of the two policies may be associated with additional benefits beyond those linked to either policy alone.

2.2. Enterprise Resilience: Concept and Theoretical Foundation

Enterprise resilience refers to a firm’s capacity to withstand external shocks, maintain essential operations, recover from disruption, and adapt to changing environments. It is broader than short-term profitability or financial performance. A resilient firm should be able to anticipate risks, absorb shocks, reorganize resources, restore operations, and adjust strategic or operational routines after disruption. The organizational resilience literature emphasizes that resilience is a dynamic and capability-based construct. Duchek [1] conceptualizes organizational resilience as a meta-capability consisting of three successive stages: anticipation, coping, and adaptation. This perspective suggests that resilience is not only a passive ability to “bounce back” after a shock, but also a proactive capability to sense threats, prepare resources, respond effectively, and learn from disruption.
Dynamic capability theory provides an important theoretical foundation for understanding enterprise resilience. Teece et al. [22] argue that firms operating in rapidly changing environments need capabilities to integrate, build, and reconfigure internal and external competences. From this perspective, enterprise resilience can be understood as the manifestation of dynamic capabilities under uncertain and disruptive conditions. Firms with stronger sensing, coordination, and reconfiguration capabilities are more likely to identify risks earlier, respond more quickly, and recover more effectively. Supply chain resilience theory further highlights that firm-level resilience is closely related to external network relationships. Christopher and Peck [2] argue that supply chain vulnerability increases under complex sourcing, lean operations, and globalized production, making resilience a key requirement for risk management. Ponomarov and Holcomb [23] define supply chain resilience as the adaptive capability of a supply chain to prepare for unexpected events, respond to disruptions, and recover by maintaining continuity of operations. Thus, enterprise resilience is not merely an internal attribute of the firm; it is also shaped by supply chain visibility, collaboration, flexibility, and coordination.
Accordingly, this study views enterprise resilience as a multidimensional capability influenced by both internal firm resources and external policy environments. Digital intelligence may support information processing and risk prediction, while supply chain coordination may support operational stability and resource mobilization. These theoretical insights provide the basis for examining whether AI innovation pilot zones, supply chain innovation pilots, and their complementarity are associated with enterprise resilience. Beyond internal firm capabilities and supply chain relationships, enterprise resilience can also be understood from the perspective of innovation network resilience. Firms are embedded in inter-organizational systems that include suppliers, customers, digital platforms, research institutions, local governments, and regional innovation systems. Under uncertainty, resilience depends not only on a firm’s own resources, but also on whether these networks can maintain knowledge flows, collaboration ties, technological diffusion, and innovation capacity. Recent research on multilayer innovation network resilience emphasizes that innovation systems consist of interdependent knowledge-exchange and collaboration layers, so disruptions in one layer may cascade across the broader innovation ecosystem [24]. This perspective is directly relevant to the present study. AI innovation pilot zones may support digital infrastructure, data resources, platform ecosystems, and knowledge spillovers, while supply chain innovation pilots may support supplier–customer collaboration, inter-firm coordination, and resource matching. Their complementarity may therefore be linked to enterprise resilience not only through internal firm capabilities, but also through the innovation and collaboration networks in which firms are embedded.

2.3. AI Innovation Pilot Zones and Enterprise Resilience

AI innovation pilot zones may be associated with enterprise resilience through several channels. First, AI-related policies can improve the local digital environment in which firms operate. By promoting AI infrastructure, data resources, application scenarios, and technology demonstration, pilot zones may reduce the cost of adopting digital and intelligent technologies. Firms located in such zones are more likely to access AI-related knowledge, digital services, specialized talent, and policy support. Second, AI technologies may support firms’ information-processing and decision-making capabilities. Digital technologies enable firms to collect and analyze large amounts of internal and external data, identify market changes, forecast demand fluctuations, monitor operational risks, and optimize production and logistics decisions. Prior research on digital business strategy emphasizes that digital technologies reshape the scope, scale, speed, and sources of business value creation [5]. Digital innovation research also suggests that digital technologies change innovation processes by increasing flexibility, generativity, and connectivity [6]. These capabilities are directly relevant to enterprise resilience because timely information and flexible decision-making are essential for responding to shocks. Third, AI innovation pilot zones may promote technological innovation and managerial upgrading. Recent empirical studies have begun to treat China’s AI pilot zone policy as a quasi-natural experiment and find that the construction of national AI innovation pilot zones can affect firm-level outcomes such as ESG development [4]. Although existing studies have not fully examined enterprise resilience, their findings suggest that AI pilot policies can influence corporate behavior through technology adoption, innovation, and managerial improvement.
Therefore, AI innovation pilot zones are expected to be positively associated with enterprise resilience by supporting firms’ digital sensing, intelligent decision-making, innovation capacity, and adaptive response to uncertainty. This leads to the first hypothesis:
Hypothesis 1.
AI Innovation Pilot Zones are positively associated with enterprise resilience.

2.4. Supply Chain Innovation Pilots and Enterprise Resilience

Supply chain innovation pilots may also be associated with enterprise resilience. Firms are embedded in upstream and downstream relationships, and their ability to withstand disruption depends heavily on the stability, flexibility, and coordination efficiency of their supply chains. Supply disruptions, logistics delays, customer demand shocks, and financial constraints among partners can all weaken a firm’s resilience even when the focal firm itself has relatively strong internal resources. The supply chain resilience literature emphasizes the importance of collaboration, visibility, flexibility, and rapid recovery. Christopher and Peck [2] argue that resilient supply chains require flexibility, agility, and coordination rather than excessive dependence on lean and fragile structures. Ponomarov and Holcomb [23] further highlight that resilience depends on preparation, response, and recovery capabilities across the supply chain. During major disruptions, resilience also requires the viability of interconnected supply networks rather than the survival of isolated firms [3]. These arguments imply that policies supporting supply chain coordination and platform-based collaboration may be associated with stronger firm-level resilience.
China’s Supply Chain Innovation and Application Pilot policy is designed to promote modern supply chain development through city-level policy support and firm-level implementation. The policy encourages pilot cities to improve public services, optimize the institutional environment, and explore cross-departmental and cross-regional supply chain governance. It also encourages pilot firms to apply modern information technologies, innovate supply chain models, construct industrial coordination platforms, and improve the integration of upstream and downstream enterprises [21]. These policy objectives are closely related to the determinants of enterprise resilience. Specifically, supply chain innovation pilots may be associated with enterprise resilience by supporting supply chain visibility, reducing coordination frictions, improving inventory and logistics management, strengthening supplier–customer collaboration, and facilitating access to supply chain finance. Firms in pilot cities may benefit from more efficient resource matching, stronger platform services, and better coordination among enterprises, financial institutions, logistics providers, and local governments. These improvements can help firms absorb shocks and recover from disruptions more effectively.
Therefore, the second hypothesis is proposed as follows:
Hypothesis 2.
Supply Chain Innovation Pilots are positively associated with enterprise resilience.

2.5. Policy Complementarity Between AI Innovation Pilot Zones and Supply Chain Innovation Pilots

Although AI innovation pilot zones and supply chain innovation pilots may each support enterprise resilience, the central argument of this study is that their joint implementation may be associated with an additional complementarity premium. Policy complementarity means that one policy’s contribution is larger when a mutually reinforcing policy is also present. This logic follows complementarity theory in organizational economics, which argues that practices, technologies, and strategies can reinforce each other when the adoption of one element raises the marginal value of another [12]. Applied to this study, AI pilot zones and supply chain innovation pilots are not treated as interchangeable interventions. The former primarily support digital intelligence, data processing, algorithmic prediction, and intelligent decision support; the latter primarily support inter-firm coordination, logistics integration, inventory coordination, and resource matching.
The complementarity arises because resilience requires both sensing and coordinated response. AI-related policy support can help firms identify demand fluctuations, supplier risks, and operational disruptions earlier, while supply chain coordination policies provide the organizational and inter-firm channels through which these signals can be translated into procurement, inventory, logistics, production, and financing adjustments. Supply chains also provide concrete application scenarios for AI, such as demand forecasting, supplier-risk monitoring, route optimization, inventory management, and supply chain finance. Thus, when the two policies coexist, AI capabilities are more likely to be embedded in operational coordination, and supply chain coordination is more likely to be supported by digital intelligence.
This argument implies an additional joint-policy association beyond the separate associations of either policy alone. In empirical terms, the paper examines whether dual exposure to the two policies is associated with higher enterprise resilience relative to the additive benchmark of AI-only and supply-chain-pilot-only exposure. Therefore, the third hypothesis is proposed:
Hypothesis 3.
The coexistence of AI Innovation Pilot Zones and Supply Chain Innovation Pilots is positively associated with a policy complementarity premium in enterprise resilience.

2.6. Mechanism Hypotheses

The complementarity between AI innovation pilot zones and supply chain innovation pilots may be linked to enterprise resilience through several channel-consistent mechanisms. This study focuses on three channels: enterprise digital transformation, supply chain coordination, and resource reconfiguration.

2.6.1. Enterprise Digital Transformation

Digital transformation is a key channel through which AI and supply chain policies may be associated with enterprise resilience. AI pilot zones provide digital infrastructure, AI-related resources, application scenarios, and policy support, which can reduce firms’ cost of adopting digital technologies. Supply chain innovation pilots provide practical contexts in which digital technologies can be applied to procurement, production, logistics, sales, and customer relationship management. Digital transformation can support enterprise resilience by improving information transparency, decision speed, operational flexibility, and risk monitoring. Firms with stronger digital capabilities can identify changes in demand and supply more quickly, optimize production and inventory decisions, and coordinate internal and external resources more effectively. In this sense, the complementarity between AI and supply chain policies may be associated with stronger digital transformation, which is consistent with stronger enterprise resilience.
Hypothesis 4a.
The policy complementarity between AI Innovation Pilot Zones and Supply Chain Innovation Pilots is positively associated with enterprise digital transformation, a channel consistent with stronger enterprise resilience.

2.6.2. Supply Chain Coordination

Supply chain coordination is another important mechanism. Supply chain innovation pilots directly aim to improve upstream and downstream collaboration, supply chain platform construction, logistics coordination, and industrial chain integration. AI pilot zones can further support these processes by improving data sharing, intelligent forecasting, supplier monitoring, and real-time decision support. Better supply chain coordination helps firms reduce operational uncertainty, improve inventory and logistics efficiency, stabilize supplier and customer relationships, and respond to disruptions more quickly. When firms can coordinate more effectively with their supply chain partners, they are better able to maintain production continuity and recover from adverse shocks. Therefore, the complementarity between AI and supply chain policies may be associated with stronger supply chain coordination, which is consistent with stronger enterprise resilience.
Hypothesis 4b.
The policy complementarity between AI Innovation Pilot Zones and Supply Chain Innovation Pilots is positively associated with supply chain coordination, a channel consistent with stronger enterprise resilience.

2.6.3. Resource Reconfiguration

Enterprise resilience also depends on firms’ ability to reconfigure resources under uncertainty. Dynamic capability theory emphasizes that firms need to integrate, build, and reconfigure internal and external resources in response to changing environments [22]. In the context of this study, resource reconfiguration refers to firms’ capacity to adjust long-term assets, upgrade production facilities, reorganize operational processes, and allocate resources toward activities that improve adaptability and recovery. The coexistence of AI innovation pilot zones and supply chain innovation pilots may be associated with stronger resource reconfiguration capacity. AI pilot zones can improve firms’ access to digital technologies, intelligent equipment, data-based decision tools, and technology application scenarios. Supply chain innovation pilots can support resource matching, logistics coordination, upstream–downstream collaboration, and production adjustment along the supply chain. The two policies may be linked to capital investment, production and logistics upgrading, and resource allocation adjustment under external uncertainty. Therefore, the complementarity between AI and supply chain policies may be associated with stronger resource reconfiguration capacity, which is consistent with stronger enterprise resilience.
Hypothesis 4c.
The policy complementarity between AI Innovation Pilot Zones and Supply Chain Innovation Pilots is positively associated with resource reconfiguration capacity, a channel consistent with stronger enterprise resilience.

3. Data, Variables, and Empirical Strategy

3.1. Data Sources and Sample Construction

This study constructs an unbalanced firm-year panel of Chinese A-share listed companies from 2010 to 2024. Firm-level financial and accounting data are obtained from the CSMAR and CNRDS databases. Annual report text data are used to construct the digital transformation variable, and firm-level accounting information is matched by stock code and year. City-level economic data are obtained from the China City Statistical Yearbook and official city statistical materials.
The policy data are manually collected from official government documents. The list and approval years of National New Generation Artificial Intelligence Innovation and Development Pilot Zones are obtained from the Ministry of Science and Technology [20]. The list of Supply Chain Innovation and Application Pilot Cities is obtained from the official notice issued by the Ministry of Commerce and other departments [21]. Each firm-year observation is matched to policy variables according to the firm’s registered city in the corresponding year. Appendix A Table A1 and Table A2 report the official policy lists, approval years, approval dates, and source documents used to construct the AI innovation pilot and supply chain innovation pilot variables. The Supply Chain Innovation and Application Pilot Cities reported in Table A2 were announced in the same official notice in 2018. Therefore, the baseline S C I variable treats all listed pilot cities as entering the policy in 2018.
The sample is processed as follows. First, financial firms are excluded because their accounting structure and regulatory environment differ substantially from those of non-financial firms. Second, observations with missing values for the dependent variable, core policy variables, and control variables are removed. Third, all continuous variables are winsorized at the 1st and 99th percentiles to reduce the influence of extreme values. ST and *ST firms are retained in the baseline sample because financial distress is part of the economic meaning of enterprise resilience. Financial data from 2008 onward are used only to construct lagged and rolling-window variables, while the estimation sample covers 2010–2024.

3.2. Variable Measurement

3.2.1. Dependent Variable: Enterprise Resilience

The dependent variable is enterprise resilience, denoted as R e s i l i e n c e i c t , where i indexes firms, c indexes cities, and t indexes years. Enterprise resilience is measured by an entropy-weighted composite index. The entropy-weighting method assigns larger weights to indicators with greater cross-sectional information content, following the information entropy logic originally [25].
The construction of the index is guided by the view that enterprise resilience is not equivalent to general financial performance. Rather, it refers to a firm’s ability to prepare for adverse shocks, absorb disruption, maintain operational continuity, and recover after performance deterioration. Accordingly, the index is constructed from eight indicators grouped into three dimensions. The first dimension is financial preparedness and absorption capacity. Cash holdings, operating cash flow ratio, current ratio, interest coverage ratio, and operating profit margin capture whether a firm has sufficient liquidity buffers, internal cash-flow support, short-term solvency, debt-service capacity, and operating surplus to withstand shocks and maintain essential operations. In particular, operating profit margin is not used as a stand-alone profitability measure; it is included because the ability to maintain a basic operating surplus helps firms absorb adverse shocks and avoid operational breakdown. The second dimension is operational continuity and stability. The inverse of three-year rolling ROA volatility and the inverse of three-year rolling sales-growth volatility capture the stability of profitability and operating scale under uncertainty. The third dimension is recovery capacity, measured by ROA recovery, defined as the difference between current ROA and the minimum ROA over the previous two years. This indicator captures the firm’s ability to rebound from a recent performance trough. Higher values of all eight indicators represent stronger resilience after direction adjustment.
To make the conceptual mapping more explicit, the eight indicators correspond to different resilience capabilities rather than to ordinary firm quality alone. Cash holdings and the current ratio capture anticipation or preparedness capacity because they reflect liquid reserves and short-term payment capacity before shocks materialize. Operating cash flow ratio, interest coverage ratio, and operating profit margin capture absorption capacity because they reflect whether firms can withstand cash-flow pressure, debt-service pressure, and operating stress during disruption. The inverse volatility indicators capture operational continuity and adaptive stability because they measure whether firms can maintain relatively stable profitability and sales growth under uncertainty. ROA recovery captures recovery and adaptive adjustment because it reflects whether firms can rebound from a recent performance trough. Therefore, the index is intended to measure the observable financial–operational manifestations of enterprise resilience rather than general profitability, firm quality, or financial strength alone.
For each indicator m, the raw value is first normalized into Z m , i t using min–max normalization. For positive indicators, the normalized value is calculated as:
Z m , i t = Q m , i t min ( Q m ) max ( Q m ) min ( Q m ) .
For negative indicators, the direction is reversed before normalization so that a larger value always indicates stronger resilience. The information share of indicator m for firm i in year t is defined as:
P m , i t = Z m , i t i , t Z m , i t .
The entropy value of indicator m is:
E m = 1 ln ( N ) i , t P m , i t ln ( P m , i t ) ,
where N denotes the total number of firm-year observations used in the index construction. When P m , i t = 0 , the term P m , i t ln ( P m , i t ) is set to zero. The entropy weight is calculated as:
W m = 1 E m m ( 1 E m ) .
The final enterprise resilience index is:
R e s i l i e n c e i c t = m W m Z m , i t .
A larger value of R e s i l i e n c e i c t indicates stronger enterprise resilience. Table 1 reports the theoretical dimensions, indicator directions, resilience interpretations, and entropy weights used to construct the enterprise resilience index.
Table 1. Construction and Entropy Weights of the Enterprise Resilience Index.

3.2.2. Core Explanatory Variables: Policy Pilots and Policy Complementarity

The first policy variable is the AI innovation pilot variable, denoted as A I c t . It equals one if city c has been approved as a National New Generation Artificial Intelligence Innovation and Development Pilot Zone by year t, and zero otherwise. The second policy variable is the supply chain innovation pilot variable, denoted as S C I c t . It equals one for Supply Chain Innovation and Application Pilot Cities from 2018 onward, and zero otherwise.
For interpretation, each city-year observation can be classified into one of four policy-exposure statuses. The first is no-policy exposure, where A I c t = 0 and S C I c t = 0 . The second is AI-only exposure, where A I c t = 1 and S C I c t = 0 . The third is supply-chain-pilot-only exposure, where A I c t = 0 and S C I c t = 1 . The fourth is dual-policy exposure, where A I c t = 1 and S C I c t = 1 . If a city is first exposed to one policy and later exposed to the other, it is treated as one-policy-only during the initial period and as dual-policy exposed only from the first year in which both policy indicators equal one. For cities that eventually become jointly exposed, the dual-treatment year is defined as:
T c D u a l = min { t : A I c t = 1 and S C I c t = 1 } .
The core explanatory variable is the interaction between the two policy variables:
C o m p l e m e n t a r i t y c t = A I c t × S C I c t .
This interaction term captures joint exposure to AI innovation pilot zones and supply chain innovation pilots in the same city-year. Importantly, it does not simply label firms as being located in generally favorable policy environments. Because the empirical model simultaneously includes the two main policy indicators, the coefficient on A I c t × S C I c t is interpreted as the additional joint-exposure association relative to the additive benchmark implied by AI-only and supply-chain-pilot-only exposure. In this sense, a positive coefficient provides evidence consistent with policy complementarity: enterprise resilience is higher under dual-policy exposure than would be expected from the sum of the two separate policy associations.

3.2.3. Control Variables

The vector of control variables is denoted as X i , c , t 1 . The study uses a set of seven control variables throughout the empirical analysis: firm size, firm age, leverage, sales growth, asset tangibility, state ownership, and city-level GDP per capita. All time-varying control variables are lagged by one year to reduce reverse-causality concerns. Firm size ( S i z e ) is measured as the natural logarithm of total assets. Firm age ( A g e ) is measured as the natural logarithm of one plus the number of years since establishment. Leverage ( L e v ) is measured as total liabilities divided by total assets. Sales growth ( G r o w t h ) is measured as the annual growth rate of operating revenue. Asset tangibility ( T a n g i b i l i t y ) is measured as fixed assets divided by total assets. State ownership ( S O E ) equals one if the firm’s ultimate controller is the state, and zero otherwise. City-level economic development ( G D P p c ) is measured as the natural logarithm of GDP per capita in the firm’s registered city. No additional control variables are added in the baseline regressions, mechanism tests, heterogeneity tests, or robustness checks. This fixed control-variable design avoids over-controlling for potential channels through which the two pilot policies may be associated with enterprise resilience.

3.2.4. Mechanism Variables

Three mechanism variables are used to examine channel-consistent pathways linking policy complementarity and enterprise resilience. First, enterprise digital transformation ( D i g i t a l ) is measured using annual report textual analysis. Following the textual analysis literature in accounting and finance [26], this study counts the frequency of digital transformation-related keywords in each firm’s annual report. The keyword dictionary includes Chinese terms for artificial intelligence, big data, cloud computing, blockchain, industrial internet, the Internet of Things, intelligent manufacturing, digital platforms, data elements, and digital transformation. The variable is calculated as:
D i g i t a l i t = ln ( 1 + Digital keyword frequency i t ) .
The keyword dictionary structure, construction logic, and validation discussion for the digital-transformation indicator are reported in Appendix A Table A3.
Second, supply chain coordination ( S C C ) is measured by inventory turnover, calculated as operating cost divided by average inventory. A higher inventory turnover rate indicates faster inventory circulation and stronger operational coordination along the supply chain. Third, resource reconfiguration capacity ( R e s o u r c e ) is measured by capital expenditure intensity. Specifically, it is calculated as cash paid for the acquisition and construction of fixed assets, intangible assets, and other long-term assets divided by lagged total assets:
R e s o u r c e i t = C a p i t a l E x p e n d i t u r e i t T o t a l A s s e t s i , t 1 .
A larger value of R e s o u r c e i t indicates stronger resource reconfiguration capacity and reflects the firm’s ability to adjust long-term assets, upgrade production capacity, and reallocate resources under changing external conditions.
These mechanism variables should be interpreted as observable channel indicators rather than complete measures of the underlying mechanisms. Annual-report keyword frequency captures the extent to which firms disclose digital-transformation-related activities, but it may also reflect differences in disclosure style and managerial communication. Inventory turnover captures one observable aspect of supply chain coordination, namely the speed of inventory circulation, but it may also be affected by demand conditions, production intensity, and inventory policies. Capital expenditure intensity captures resource reconfiguration through long-term asset investment, but it does not fully capture other forms of reconfiguration, such as organizational restructuring, human-capital redeployment, or supplier-network adjustment. Therefore, the mechanism analysis is used to provide channel-consistent evidence rather than definitive causal mediation evidence. Table 2 summarizes the definitions of the dependent variable, core explanatory variables, control variables, mechanism variables, and heterogeneity variables.
Table 2. Variable Definitions.

3.3. Empirical Models

3.3.1. Baseline Policy Effects

The baseline analysis first estimates the separate associations of AI innovation pilot zones and supply chain innovation pilots with enterprise resilience. The association with AI innovation pilot zones is estimated using the following model:
R e s i l i e n c e i c t = α + β 1 A I c t + γ X i , c , t 1 + μ i + λ t + η j × t + ε i c t .
The association with supply chain innovation pilots is estimated as:
R e s i l i e n c e i c t = α + β 2 S C I c t + γ X i , c , t 1 + μ i + λ t + η j × t + ε i c t .
In Equations (10) and (11), μ i denotes firm fixed effects, λ t denotes year fixed effects, and η j × t denotes industry-by-year fixed effects. Firm fixed effects absorb time-invariant firm characteristics, year fixed effects control for common macroeconomic shocks, and industry-by-year fixed effects account for time-varying industry-level shocks. The vector X i , c , t 1 contains the seven control variables defined above.

3.3.2. Policy Complementarity Model

To test the core hypothesis on policy complementarity, the following model is estimated:
R e s i l i e n c e i c t = α + β 1 A I c t + β 2 S C I c t + β 3 A I c t × S C I c t + γ X i , c , t 1 + μ i + λ t + η j × t + ε i c t .
The coefficient of interest is β 3 . It should be interpreted relative to an additive policy benchmark. When A I c t = 1 and S C I c t = 0 , the estimated policy association is β 1 . When A I c t = 0 and S C I c t = 1 , the estimated policy association is β 2 . When both policies coexist, the estimated total dual-policy association is β 1 + β 2 + β 3 . Therefore, β 3 captures the additional component of dual-policy exposure that remains after accounting for the two separate policy associations. A positive and statistically significant β 3 is thus interpreted as evidence consistent with policy complementarity rather than as a mere indicator of policy coexistence. Standard errors are clustered at the city level because the policy variables vary at the city-year level and because difference-in-differences estimates with serially correlated policy shocks require clustered inference [27].
This interpretation distinguishes policy complementarity from a simple late-treatment association. A city that receives only one policy is not considered dual-policy exposed until the second policy arrives. The main terms of A I c t and S C I c t absorb the average associations of one-policy exposure, while the interaction term captures whether the outcome under dual-policy exposure exceeds the additive benchmark of the two separate policies. Therefore, β 3 is interpreted as an empirical complementarity premium rather than as the total association of receiving a second policy. This interpretation is conditional on the fixed-effects structure, observed controls, and the validity of the pre-treatment trend evidence.

3.3.3. Event-Study Specification and Parallel-Trend Assessment

The validity of the difference-in-differences design requires treated and untreated firms to exhibit comparable pre-treatment trends. To examine this assumption and describe the dynamic pattern of policy complementarity, we estimate an event-study specification based on the first year of dual-policy exposure. For city c, the dual-treatment year is defined as:
T c D u a l = min { t : A I c t = 1 and S C I c t = 1 } .
This definition means that if a city is first exposed to one policy and later to the other, the city is treated as one-policy-only before the arrival of the second policy and as dual-policy exposed only from the year in which both A I c t and S C I c t equal one.
Treatment cohorts are defined according to the first year of dual-policy exposure, that is, cities with the same value of T c D u a l belong to the same dual-treatment cohort. The comparison group in the event-study analysis consists of firm-year observations in cities that have not yet entered dual-policy exposure in year t, including never-dual cities and not-yet-dual cities. Thus, city-years with AI-only or supply-chain-pilot-only exposure are not treated as dual-policy observations before the city becomes jointly exposed to both policies.
The event-time indicators are defined as:
D c , t k = 1 ( t T c D u a l = k ) .
The dynamic specification is:
R e s i l i e n c e i c t = α + k { 4 , , 2 , 0 , 1 , 2 , 3 , 4 + } θ k D c , t k + γ X i , c , t 1 + μ i + λ t + η j × t + ε i c t .
The year immediately before dual-policy exposure, k = 1 , is used as the omitted reference period. Event times earlier than four years before treatment are grouped into k 4 , and event times four or more years after treatment are grouped into k 4 . The coefficients θ k for k < 0 are used to examine the parallel-trend assumption, while the coefficients for k 0 describe the dynamic effects after dual-policy exposure.

3.4. Mechanism and Heterogeneity Tests

3.4.1. Mechanism Tests

The mechanism analysis examines whether policy complementarity is associated with enterprise digital transformation, supply chain coordination, and resource reconfiguration capacity. For each mechanism variable, the following model is estimated:
M e c h a n i s m i c t = α + β 1 A I c t + β 2 S C I c t + β 3 A I c t × S C I c t + γ X i , c , t 1 + μ i + λ t + η j × t + ε i c t .
The dependent variable M e c h a n i s m i c t is replaced by D i g i t a l i t , S C C i t , and R e s o u r c e i t , respectively. A positive and significant coefficient on A I c t × S C I c t indicates that joint policy exposure is associated with changes in the corresponding channel variable. These tests are interpreted as channel-consistent evidence rather than as strict causal mediation estimates, because the channel variables are observable proxies and the analysis does not decompose the total policy association into formally identified direct and indirect effects.

3.4.2. Heterogeneity Tests

The heterogeneity analysis examines whether the complementarity association differs across firms and local conditions. Equation (12) is estimated separately for subsamples defined by ownership type, industry supply-chain dependence, city digital infrastructure, and firm risk exposure. Ownership heterogeneity is examined by splitting firms into state-owned enterprises and non-state-owned enterprises. Industry supply-chain dependence is measured by the industry’s pre-2018 average inventory-to-operating-revenue ratio; industries above the sample median are classified as high supply-chain-dependence industries. City digital infrastructure is measured by the pre-2018 average number of internet broadband users per capita; cities above the sample median are classified as high digital-infrastructure cities. Firm risk exposure is measured by lagged leverage; firms above the annual sample median are classified as high-risk-exposure firms.

3.5. Identification Strategy

The empirical design addresses three identification issues. First, pilot cities are not randomly selected. Cities included in AI innovation pilot zones or supply chain innovation pilots differ from non-pilot cities in economic development, industrial base, policy resources, and innovation capacity. The baseline model addresses this concern using firm fixed effects, year fixed effects, industry-by-year fixed effects, and the fixed set of seven lagged control variables. Firm fixed effects remove time-invariant firm heterogeneity, year fixed effects absorb aggregate macroeconomic shocks, and industry-by-year fixed effects control for industry-specific time-varying shocks.
A related identification concern is that cities jointly exposed to the two pilot policies may also receive other contemporaneous pro-digital, innovation-oriented, or industrial policies, such as smart-city initiatives, big-data pilot zones, industrial internet policies, or targeted digital-infrastructure investment. These policies may be correlated with dual-policy exposure and may also be associated with enterprise resilience. The empirical design mitigates this concern by including firm fixed effects, year fixed effects, industry-by-year fixed effects, lagged controls, and event-study tests of pre-treatment trends. Nevertheless, unobserved time-varying city-level policies cannot be completely ruled out. The results should therefore be interpreted as evidence consistent with policy complementarity conditional on the fixed-effects structure, observed controls, event-study evidence, and robustness checks.
To further assess the sensitivity of the results to pilot-city selection, regional heterogeneity, and omitted local trends, we conduct additional robustness checks using more demanding specifications. Specifically, we re-estimate the complementarity model with province-by-year fixed effects, city-specific linear trends, additional time-varying city-level controls, and a sample excluding the four municipalities directly under the central government.
Second, the difference-in-differences framework requires comparable pre-policy trends between treated and untreated observations. The event-study specification in Equation (15) directly tests pre-treatment trends by estimating the dynamic coefficients before and after joint policy exposure. The omitted reference period is the year immediately before joint exposure to the two policies.
Third, the two policies are introduced at different times across cities, and the timing of dual-policy exposure is therefore staggered. Conventional two-way fixed-effects estimates can be affected by treatment-effect heterogeneity under staggered adoption [28,29]. To address this concern, we supplement the baseline specification with a staggered difference-in-differences estimator based on group-time average treatment effects [30]. In this estimator, the treatment cohort g is defined by the first year in which a city becomes jointly exposed to both policies, namely g = T c D u a l . For each cohort and year, the group-time treatment effect A T T ( g , t ) compares firms in cities that have entered dual-policy exposure with firms in cities that have not yet become jointly exposed, including never-dual and not-yet-dual cities. The coefficient reported in the robustness analysis is the aggregated post-treatment ATT across dual-treatment cohorts and post-treatment years. This design helps verify that the estimated policy complementarity effect is not driven by the weighting structure of the conventional two-way fixed-effects estimator.
For concision, the robustness table reports the aggregated post-treatment ATT rather than the full set of cohort-time-specific A T T ( g , t ) estimates and aggregation weights. We interpret the reported coefficient as the average post-treatment dual-policy association across treatment cohorts and post-treatment years under the group-time DID framework.

4. Empirical Results

4.1. Descriptive Statistics

Table 3 reports the descriptive statistics of the main variables. The sample contains 38,452 firm-year observations from Chinese A-share listed companies during 2010–2024. The mean value of R e s i l i e n c e is 0.438, with a standard deviation of 0.174, indicating substantial variation in enterprise resilience across firms and years. The mean values of A I and S C I are 0.186 and 0.231, respectively, suggesting that 18.6% of the firm-year observations are located in AI innovation pilot zones and 23.1% are located in supply chain innovation pilot cities. The mean value of A I × S C I is 0.127, indicating that 12.7% of the observations are jointly exposed to both policies. These values indicate that the two pilot policies provide sufficient variation for estimating their separate and complementary associations. The control variables are within reasonable ranges for Chinese listed firms. The average leverage ratio is 0.425, and state-owned enterprises account for 34.2% of the sample. The mechanism variables also show meaningful dispersion: the mean value of D i g i t a l is 1.763, the mean inventory turnover rate is 5.109, and the mean capital expenditure intensity is 0.058. These patterns provide a suitable empirical basis for the subsequent regression analyses.
Table 3. Descriptive Statistics.

4.2. Baseline Results and Policy Complementarity Effects

Table 4 reports the baseline regression results. Columns (1) and (2) examine the separate associations of AI innovation pilot zones and supply chain innovation pilots with enterprise resilience. The coefficient on A I is 0.0152 and statistically significant at the 1% level, indicating a positive association between AI innovation pilot zones and enterprise resilience. The coefficient on S C I is 0.0174 and also statistically significant at the 1% level, suggesting a positive association between supply chain innovation pilots and enterprise resilience as well. These findings support Hypotheses 1 and 2.
Table 4. Baseline Results and Policy Complementarity Effects.
Column (3) includes both policy variables simultaneously. The coefficients on A I and S C I remain positive and statistically significant, indicating that each policy has an independent positive association with enterprise resilience. Column (4) further introduces the interaction term A I × S C I . The coefficient on A I × S C I is 0.0217 and statistically significant at the 1% level, supporting Hypothesis 3. This result provides evidence consistent with an additional complementarity premium associated with the coexistence of AI innovation pilot zones and supply chain innovation pilots. To make the interpretation of the interaction term more intuitive, we decompose the estimates in Column (4). The AI-only association is β 1 = 0.0092 , and the supply-chain-pilot-only association is β 2 = 0.0103 . In contrast, the total estimated association under dual-policy exposure is β 1 + β 2 + β 3 = 0.0092 + 0.0103 + 0.0217 = 0.0412 . The difference between the total dual-policy association and the additive benchmark, β 1 + β 2 = 0.0195 , is the complementarity premium, β 3 = 0.0217 . This decomposition shows that the interaction term does not simply identify cities with two favorable policies; rather, it measures the additional resilience-enhancing component associated with joint exposure after the two separate policy effects have been accounted for. The total association under joint policy exposure is equivalent to approximately 9.4% of the sample mean of enterprise resilience, suggesting that policy complementarity has both statistical and economic significance.
The magnitude is also meaningful when interpreted relative to the dispersion of enterprise resilience and to the separate policy associations. Based on the descriptive statistics in Table 3 and the estimates in Column (4) of Table 4, the interaction coefficient of 0.0217 corresponds to approximately 5.0% of the sample mean and 12.5% of one standard deviation of R e s i l i e n c e . The total dual-policy association of 0.0412 corresponds to approximately 23.7% of one standard deviation. In addition, the complementarity premium is about 2.36 times the AI-only effect and 2.11 times the supply-chain-pilot-only effect. Compared with the additive benchmark of the two separate policies, β 1 + β 2 = 0.0195 , the total dual-policy association is approximately 2.11 times larger. These comparisons suggest that the economic relevance of joint policy exposure is not only statistically detectable, but also substantively meaningful relative to the observed distribution of enterprise resilience and to the effects of the individual policies.

4.3. Dynamic Effects and Parallel Trend Test

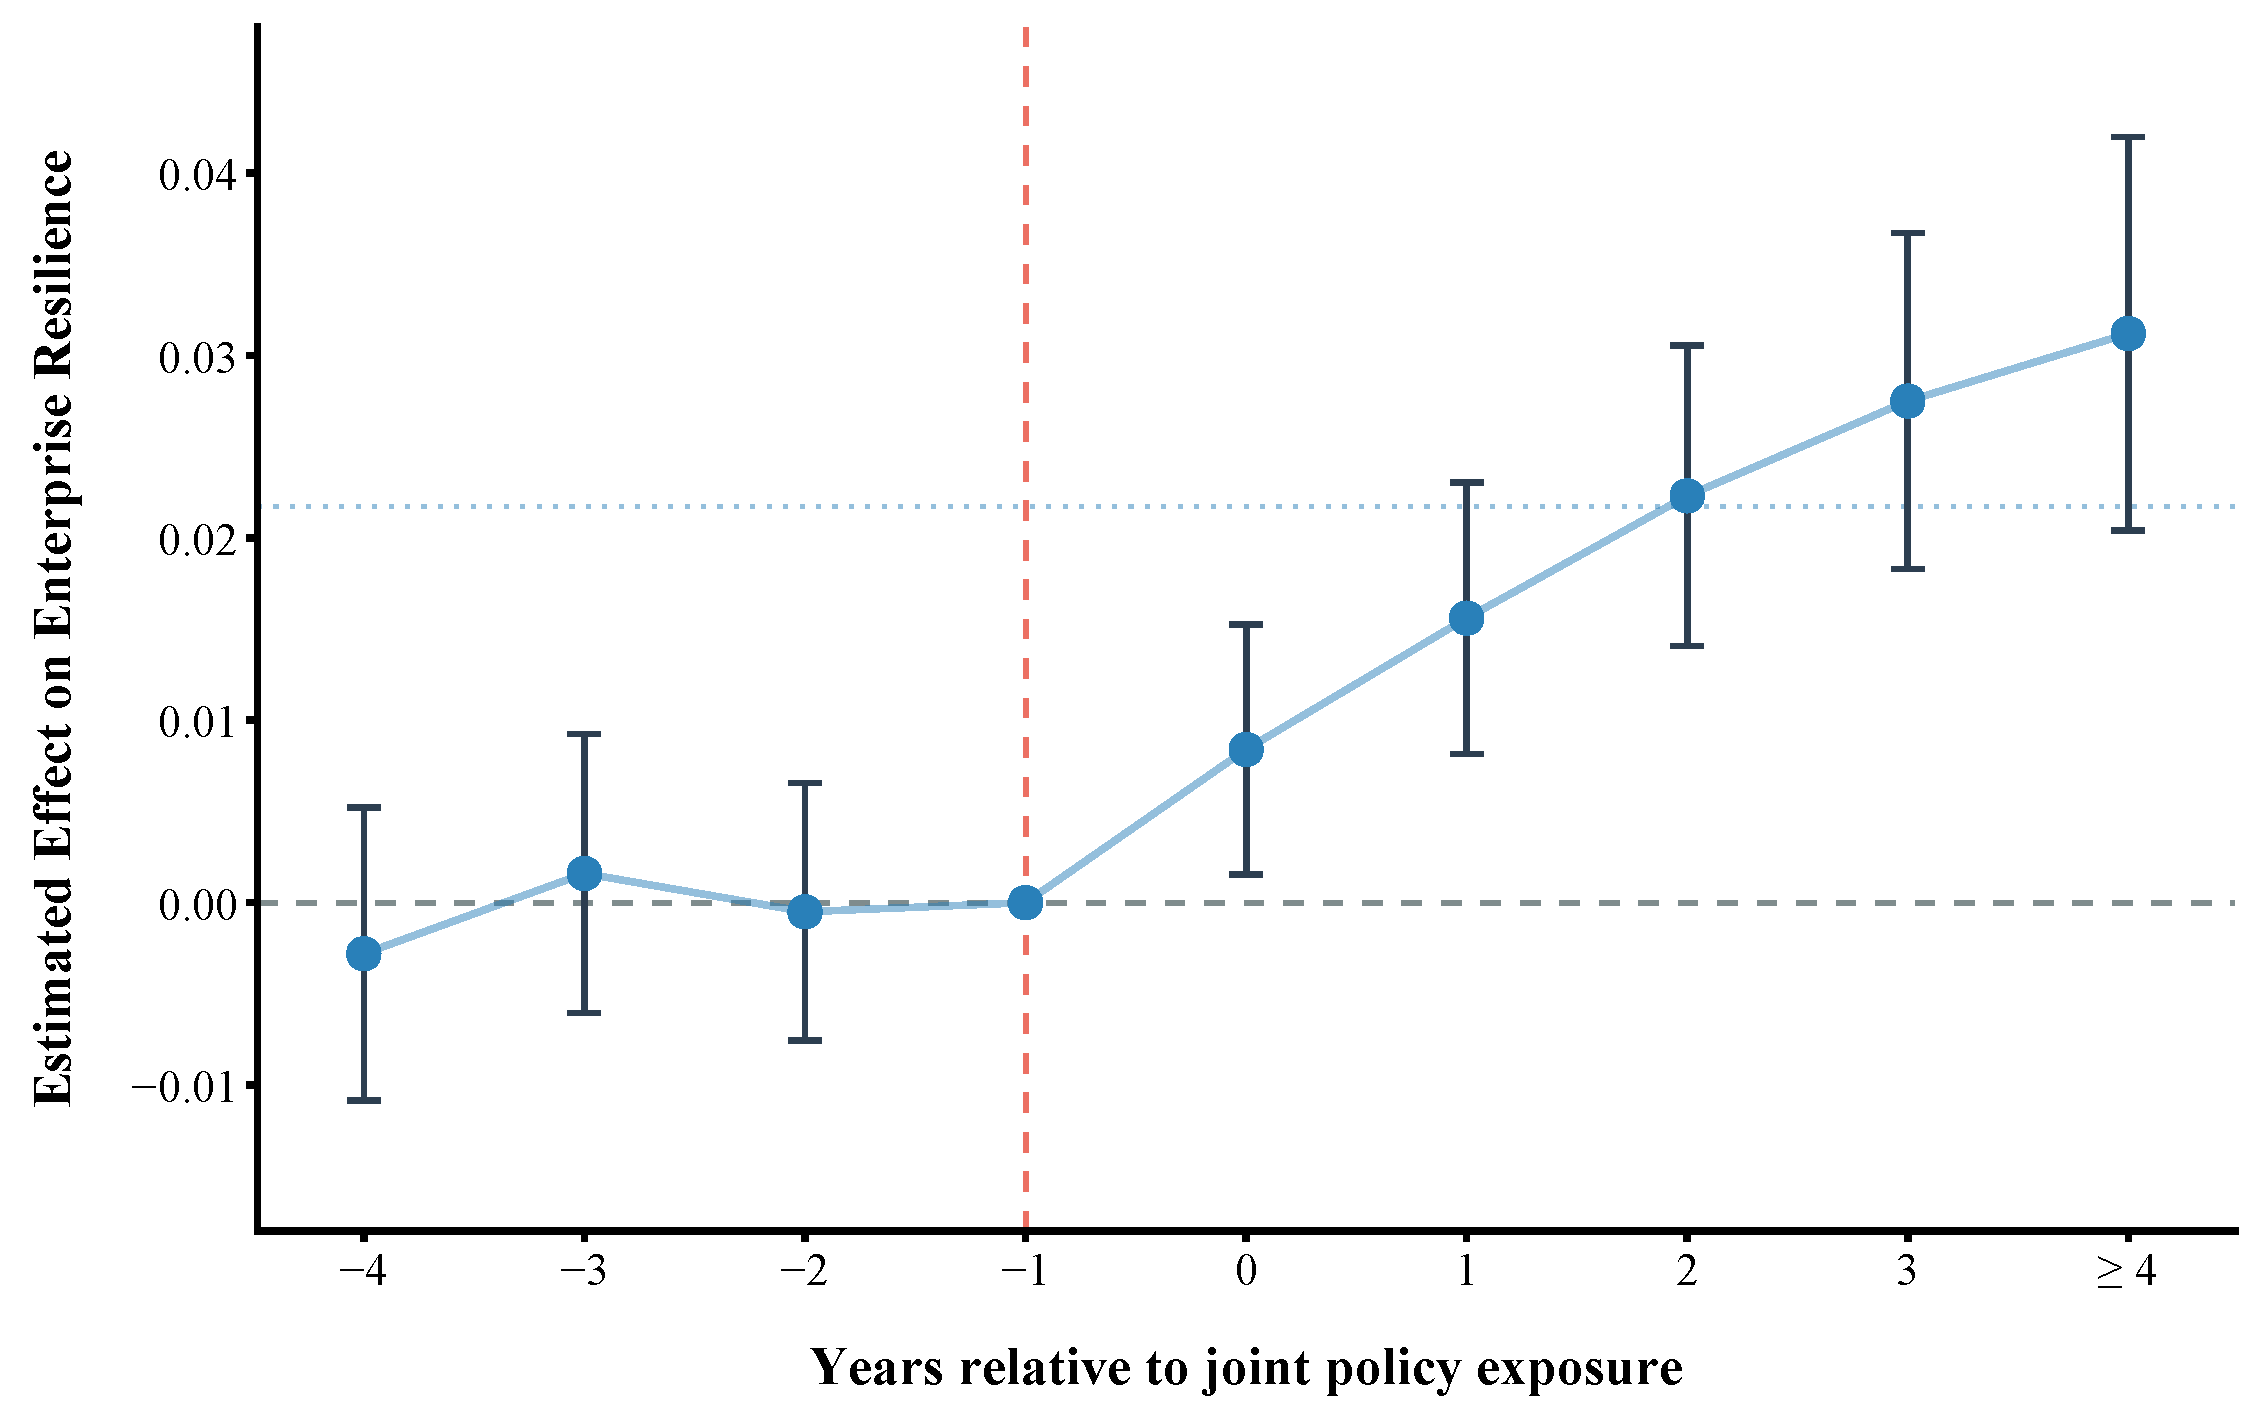
Figure 1 and Table 5 report the event-study estimates around the first year of joint policy exposure. The pre-treatment coefficients for k 4 , k = 3 , and k = 2 are small in magnitude and statistically insignificant. The joint test of the pre-treatment coefficients yields a p-value of 0.814, indicating that the null hypothesis of no differential pre-treatment trends cannot be rejected. These results support the parallel-trend assumption for the dual-policy event-study design. After the first year of dual-policy exposure, the coefficients become positive and increase gradually over time. The coefficient is already positive and statistically significant in the treatment year, and it rises from 0.0084 at k = 0 to 0.0312 at k 4 . This pattern suggests that the estimated complementarity association begins to appear when the two policies jointly operate and becomes stronger as digital capabilities, supply chain coordination, and resource reconfiguration accumulate over time.
Figure 1. Dynamic Effects and Parallel Trend Test. Notes: The dependent variable is R e s i l i e n c e . The blue dots indicate coefficient estimates. The point at k = −1 is the omitted reference period and is normalized to zero. The vertical bars represent 95% confidence intervals based on standard errors clustered at the city level. The horizontal dotted line indicates the baseline estimate of A I × S C I .
Table 5. Event-Study Coefficients for the Dynamic Effects of Dual-Policy Exposure.

4.4. Mechanism Analysis

Table 6 reports the mechanism analysis. Consistent with the empirical design, these tests are interpreted as channel-consistent evidence rather than definitive causal mediation estimates. Column (1) uses enterprise digital transformation as the dependent variable. The coefficient on A I × S C I is 0.1853 and statistically significant at the 1% level, indicating that joint policy exposure is positively associated with the digital-transformation indicator. This finding is consistent with the proposed digital-transformation channel in Hypothesis 4a. Column (2) uses supply chain coordination, measured by inventory turnover, as the dependent variable. The coefficient on A I × S C I is 0.3472 and statistically significant at the 5% level, suggesting that joint policy exposure is associated with faster inventory circulation and stronger observable supply chain coordination. This finding is consistent with the proposed supply-chain-coordination channel in Hypothesis 4b. Column (3) uses resource reconfiguration capacity, measured by capital expenditure intensity, as the dependent variable. The coefficient on A I × S C I is 0.0048 and statistically significant at the 5% level. Relative to the mean value of R e s o u r c e reported in Table 3, this coefficient corresponds to an increase of approximately 8.3% in capital expenditure intensity. This finding is consistent with the proposed resource-reconfiguration channel in Hypothesis 4c. Overall, the mechanism results show that dual-policy exposure is positively associated with observable indicators of digital transformation, supply chain coordination, and resource reconfiguration. Because these variables are proxies for broader organizational channels, the results should be interpreted as evidence consistent with the proposed mechanisms rather than as definitive proof of causal mediation.
Table 6. Mechanism Analysis.

4.5. Heterogeneity Analysis

Table 7 reports the heterogeneity analysis. The coefficient on A I × S C I is positive and significant for both state-owned and non-state-owned enterprises, but the magnitude is larger for non-state-owned enterprises. This suggests that the complementarity association is more pronounced among non-state-owned firms, possibly because they rely more heavily on external policy support, market-based coordination, and digital resources. The complementarity association is also more pronounced among firms in high supply-chain-dependence industries. The coefficient is 0.0331 and statistically significant at the 1% level for high-dependence industries, whereas the coefficient is smaller and insignificant for low-dependence industries. This pattern is consistent with the argument that supply chain coordination is an important channel linking the two policies to enterprise resilience. In addition, the association is stronger in cities with high digital infrastructure. The coefficient is 0.0315 and statistically significant at the 1% level, while the coefficient for low-digital-infrastructure cities is smaller and insignificant. This suggests that local digital conditions may facilitate the translation of AI-related policy support into firm-level resilience. Finally, the coefficient is larger for firms with high risk exposure, suggesting that policy complementarity is particularly valuable for firms facing greater financial and operational pressure. The heterogeneity results show that the resilience-enhancing effect of policy complementarity is more evident among non-state-owned firms, firms in supply-chain-dependent industries, firms located in cities with stronger digital infrastructure, and firms with higher risk exposure.
Table 7. Heterogeneity Analysis.

4.6. Robustness Checks

Table 8 reports the main robustness checks. Column (1) replaces the entropy-weighted enterprise resilience index with a PCA-based index. The coefficient on A I × S C I remains positive and statistically significant at the 1% level, indicating that the baseline result is not driven by the entropy-weighting method. Column (2) uses one-year lagged policy variables to account for delayed policy effects. The coefficient on A I c , t 1 × S C I c , t 1 is 0.0205 and statistically significant at the 1% level, suggesting that the complementarity effect persists after allowing for policy implementation lags. Column (3) reports the result from a staggered DID estimator. The coefficient remains positive and statistically significant, indicating that the main conclusion is not driven by treatment-effect heterogeneity under staggered policy adoption. Column (4) excludes firms directly selected as supply chain innovation pilot enterprises. The coefficient on A I × S C I remains positive and significant at the 5% level, suggesting that the estimated complementarity effect mainly reflects the broader city-level policy environment rather than direct firm-level selection into the supply chain pilot program.
Table 8. Robustness Checks.
To further address the concern that the main results may be driven by the entropy-weighting procedure or by a particular component of the composite index, we conduct additional robustness checks using alternative resilience measures. Table 9 reports the results. Column (1) replaces the dependent variable with an equal-weighted resilience index, calculated as the simple arithmetic average of the eight normalized indicators. Columns (2) and (3) use the unweighted sub-indices for financial preparedness and absorption capacity and operational continuity and stability, respectively. Column (4) uses the recovery-capacity measure based on ROA recovery. The coefficient on A I × S C I remains positive and statistically significant across all four specifications. These results indicate that the estimated policy complementarity effect is not driven by the entropy-weighting method or by a single financial-performance component, and they strengthen the interpretation of enterprise resilience as a multidimensional construct.
Table 9. Robustness Checks Using Alternative Resilience Measures.
To further address concerns about pilot-city selection, regional heterogeneity, and omitted local trends, we conduct additional robustness checks in Table 10. Column (1) adds province-by-year fixed effects, Column (2) controls for city-specific linear trends, Column (3) includes additional time-varying city-level controls, and Column (4) excludes the four municipalities directly under the central government. The coefficient on A I × S C I remains positive and statistically significant across all specifications, ranging from 0.0154 to 0.0206. These results suggest that the estimated policy complementarity effect is not driven by province-level shocks, differential city trends, observable city-level conditions, or the special administrative status of municipalities.
Table 10. Additional Robustness Checks Addressing Pilot-City Selection and Local Trends.
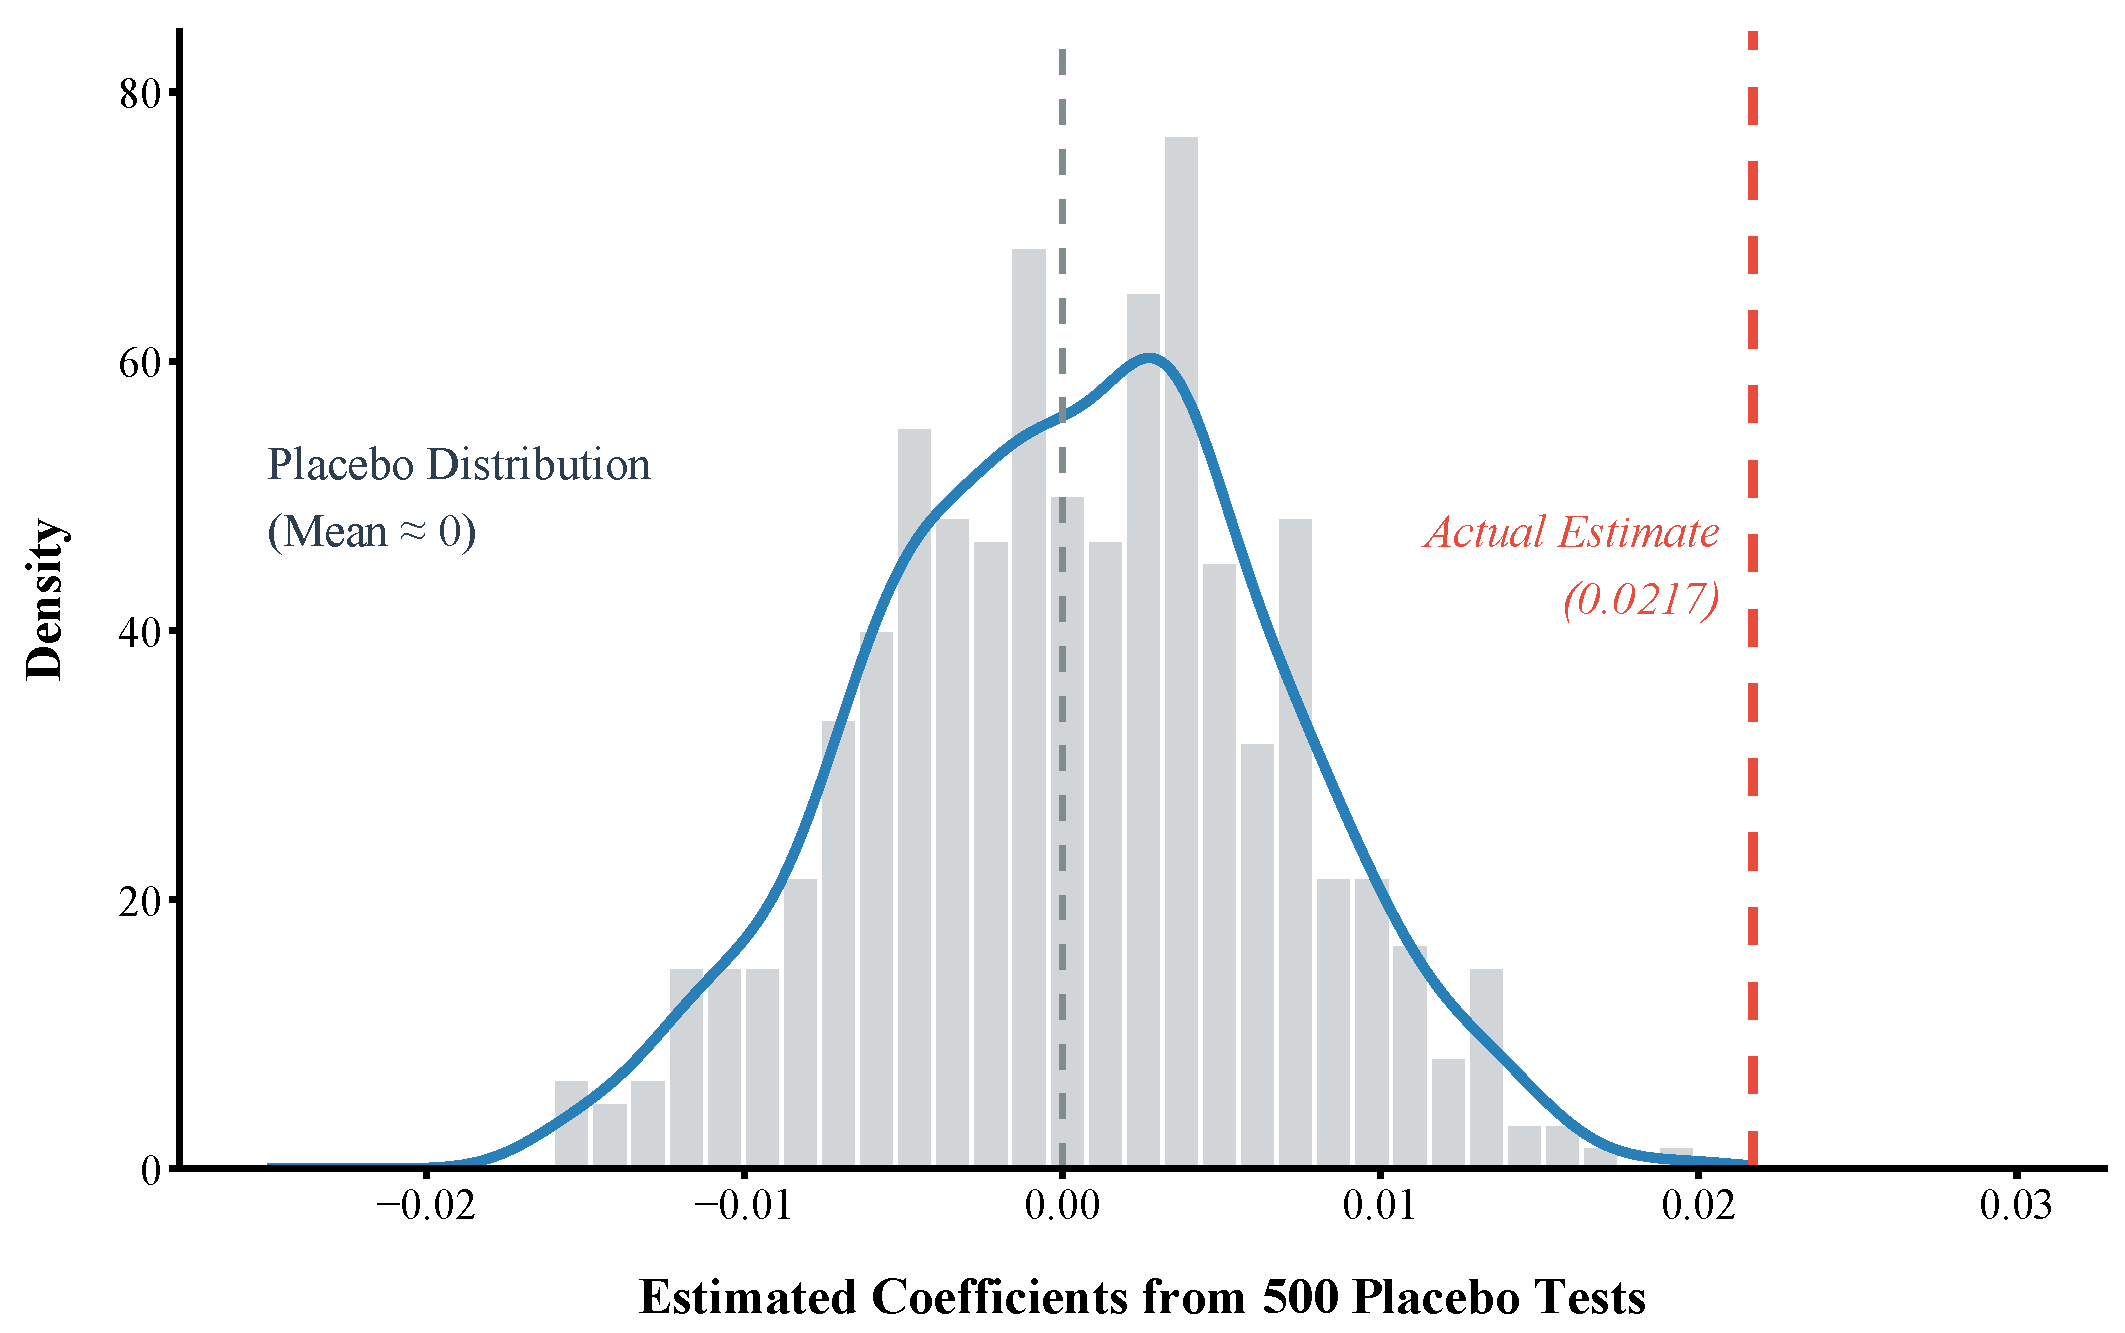
Figure 2 presents the placebo test based on 500 random assignments of pilot-city status. The placebo coefficients are centered around zero, whereas the actual estimate of 0.0217 lies in the far right tail of the placebo distribution. This result suggests that the baseline policy complementarity effect is unlikely to be driven by random policy assignment or spurious city-level trends.
Figure 2. Placebo Test. Notes: This figure plots the distribution of placebo coefficients obtained from 500 random assignments of pilot-city status. The gray dashed line indicates zero, and the red dashed line indicates the actual estimated coefficient of A I × S C I from the baseline model.

5. Discussion

5.1. Interpreting the Complementarity Between AI and Supply Chain Policies

The main finding of this study is that AI innovation pilot zones and supply chain innovation pilots are each positively associated with enterprise resilience, and that their coexistence is associated with a significant complementarity premium in the same city. This finding is consistent with the logic of complementarity, which emphasizes that the value of one organizational or policy element may increase when it is combined with another mutually reinforcing element [12]. It also echoes the ecosystem view that value creation depends on the coordination of interdependent actors, resources, and capabilities rather than on isolated interventions [31]. In this sense, the contribution of this study is not simply to show that digital policy or supply chain policy matters, but to provide evidence consistent with an additional joint-policy association when the two policies coexist. The dynamic results further suggest that the estimated complementarity association becomes stronger over time. This pattern is theoretically meaningful because enterprise resilience is not an immediate policy outcome; rather, it emerges through the gradual accumulation of sensing, coordination, adaptation, and resource reconfiguration capabilities. This interpretation is consistent with dynamic capability theory and the capability-based view of organizational resilience [1,22]. Recent studies also suggest that digital transformation can upgrade firms’ adaptive capacity during crises and help firms develop resilience as a higher-order capability [32,33]. Therefore, the increasing post-treatment coefficients observed in this study are consistent with the time required for AI-related resources and supply chain coordination mechanisms to be translated into firm-level resilience.

5.2. Mechanisms and Boundary Conditions

The mechanism analysis provides channel-consistent evidence that policy complementarity is associated with higher digital transformation, stronger supply chain coordination, and greater resource reconfiguration. These relationships help explain why dual policy exposure may be linked to stronger enterprise resilience, but they should not be interpreted as strict causal mediation evidence. The three channels are mutually connected. AI pilot zones may improve the digital environment and encourage firms to adopt data-driven tools, while supply chain innovation pilots provide concrete operational scenarios in which digital technologies can be applied. This interpretation is consistent with the broader digital transformation literature, which views digital technologies as strategic resources that reshape value creation, organizational processes, and innovation activities [5,6,7,8,34]. It also aligns with recent evidence that digital transformation can strengthen enterprise resilience rather than merely improve short-term efficiency [9].
The heterogeneity results help clarify the boundary conditions of the complementarity association. The effect is more pronounced among non-state-owned firms, firms in supply-chain-dependent industries, firms located in cities with stronger digital infrastructure, and firms with higher risk exposure. These findings suggest that policy complementarity may be especially relevant when firms have stronger demand for external coordination, digital resources, and adaptive investment. This interpretation is consistent with supply chain resilience research, which emphasizes that resilience depends on visibility, collaboration, flexibility, and recovery capacity across supply chain relationships [2,3,23,35]. It also supports recent empirical evidence that AI-enabled innovation and digital transformation can enhance supply chain resilience through improved information processing and operational integration [10,11].

5.3. Implications, Limitations, and Future Research

The findings have direct policy and managerial implications. For policymakers, the results suggest that industrial policies should not be designed as isolated instruments. AI-oriented policies may be more useful when they are coordinated with supply chain modernization, logistics coordination, industrial platform construction, and firm-level digital transformation. Local governments may therefore consider policy bundles that combine digital infrastructure, AI application scenarios, supply chain platforms, and support for enterprise upgrading. For firms, especially non-state-owned and high-risk firms, the results suggest that policy environments may provide opportunities to support digital adoption, supply chain coordination, and long-term capital investment. This study also has limitations. First, the sample is limited to Chinese A-share listed firms, and future research can extend the analysis to private firms, small and medium-sized enterprises, and non-listed firms. Second, this study identifies policy exposure at the city level, whereas future studies can further examine firm-level participation intensity, supply chain network position, and supplier–customer linkages. In addition, this study uses the firm’s registered city to match city-level policy exposure. This approach is consistent with the availability of standardized listed-firm location information and with the city-level design of the two pilot policies. However, the registered city may not fully capture the firm’s actual operating geography, production sites, supply chain network, or locations of digital-transformation activities. This may introduce measurement error in policy exposure, especially for firms with cross-city operations. Future research could use more granular information on headquarters, subsidiaries, production bases, supplier–customer networks, and firm-level policy participation to measure policy exposure more precisely. Third, although this study constructs a multidimensional enterprise resilience index, future research may use more granular operational data to capture disruption responses, recovery speed, and supply chain network adaptation. Finally, future studies can examine whether policy complementarity is associated with spatial spillovers across neighboring cities or along interregional supply chain networks.

6. Conclusions

This study examines whether AI innovation pilot zones and supply chain innovation pilots are jointly associated with enterprise resilience in China. Using a firm-year panel of Chinese A-share listed companies from 2010 to 2024, we find that both AI innovation pilot zones and supply chain innovation pilots are positively associated with enterprise resilience. The interaction between the two policies is significantly positive, providing evidence consistent with a policy complementarity premium. The dynamic analysis supports the parallel trend assumption and suggests that the estimated association becomes stronger over time. Mechanism tests further provide channel-consistent evidence related to enterprise digital transformation, supply chain coordination, and resource reconfiguration. Heterogeneity analyses suggest that the association is more pronounced among non-state-owned enterprises, firms in supply-chain-dependent industries, firms located in cities with stronger digital infrastructure, and firms with higher risk exposure. These findings suggest that enterprise resilience may be supported not only by individual policy instruments, but also by the coordinated design of complementary policies. For policymakers, AI-oriented industrial policies may be more useful when connected with supply chain modernization, platform construction, logistics coordination, and firm-level digital upgrading. For firms, especially non-state-owned and high-risk firms, the results highlight the importance of using policy environments to support digital capabilities, supply chain coordination, and long-term resource allocation. Although this study focuses on listed firms and city-level policy exposure, future research may extend the analysis to non-listed firms, small and medium-sized enterprises, firm-level policy participation, and interregional supply chain spillovers.

Author Contributions

Conceptualization, K.L. and H.C.; methodology, K.L.; software, K.L.; validation, K.L. and H.C.; formal analysis, K.L.; investigation, K.L.; resources, K.L. and H.C.; data curation, K.L.; writing—original draft preparation, K.L.; writing—review and editing, H.C.; visualization, K.L.; project administration, K.L. All authors have read and agreed to the published version of the manuscript.

Funding

This research received no external funding.

Institutional Review Board Statement

Not applicable.

Data Availability Statement

The firm-level financial and accounting data used in this study were obtained from the CSMAR and CNRDS databases, which are available under license and are not publicly redistributable. City-level data were obtained from the China City Statistical Yearbook and official city statistical materials. The processed data supporting the findings of this study are available from the corresponding author upon reasonable request.

Conflicts of Interest

The authors declare no conflicts of interest.

Appendix A. Policy Lists and Approval Years

Table A1. Official list and approval years of AI innovation pilot zones.
Table A2. Official list and approval year of supply chain innovation and application pilot cities.

Digital Transformation Keyword Dictionary and Validation

The digital-transformation indicator is constructed from annual-report textual analysis. We first clean and segment the annual-report text, then count the frequency of a dictionary of digital-transformation-related terms. The final variable is calculated as ln ( 1 + Digital keyword frequency ) . Table A3 reports the dictionary structure, technology domains, construction logic, and representative English descriptions of the keyword categories. The dictionary covers major digital-technology domains commonly used in the digital-transformation literature, including artificial intelligence, big data analytics, cloud computing, blockchain, industrial internet, Internet of Things, intelligent manufacturing, digital platforms, digital finance, and organizational digitalization. The measure should be interpreted as a disclosure-based proxy for firms’ digital-transformation orientation and digital-technology application, rather than as a complete measure of actual digital investment.
Table A3. Digital transformation keyword dictionary structure and construction logic.

References

  1. Duchek, S. Organizational Resilience: A Capability-Based Conceptualization. Bus. Res. 2020, 13, 215–246. [Google Scholar] [CrossRef] [Scilit]
  2. Christopher, M.; Peck, H. Building the Resilient Supply Chain. Int. J. Logist. Manag. 2004, 15, 1–14. [Google Scholar] [CrossRef] [Scilit]
  3. Ivanov, D.; Dolgui, A. Viability of Intertwined Supply Networks: Extending the Supply Chain Resilience Angles Towards Survivability. A Position Paper Motivated by COVID-19 Outbreak. Int. J. Prod. Res. 2020, 58, 2904–2915. [Google Scholar] [CrossRef] [Scilit]
  4. Huang, Y.; Liu, S.; Gan, J.; Liu, B.; Wu, Y. How Does the Construction of New Generation of National AI Innovative Development Pilot Zones Drive Enterprise ESG Development? Empirical Evidence from China. Energy Econ. 2024, 140, 108011. [Google Scholar] [CrossRef] [Scilit]
  5. Bharadwaj, A.; El Sawy, O.A.; Pavlou, P.A.; Venkatraman, N. Digital Business Strategy: Toward a Next Generation of Insights. MIS Q. 2013, 37, 471–482. [Google Scholar] [CrossRef] [Scilit]
  6. Nambisan, S.; Lyytinen, K.; Majchrzak, A.; Song, M. Digital Innovation Management: Reinventing Innovation Management Research in a Digital World. MIS Q. 2017, 41, 223–238. [Google Scholar] [CrossRef] [Scilit]
  7. Vial, G. Understanding Digital Transformation: A Review and a Research Agenda. J. Strateg. Inf. Syst. 2019, 28, 118–144. [Google Scholar] [CrossRef] [Scilit]
  8. Verhoef, P.C.; Broekhuizen, T.; Bart, Y.; Bhattacharya, A.; Dong, J.Q.; Fabian, N.; Haenlein, M. Digital Transformation: A Multidisciplinary Reflection and Research Agenda. J. Bus. Res. 2021, 122, 889–901. [Google Scholar] [CrossRef] [Scilit]
  9. Li, C.; Wang, Y. Digital Transformation and Enterprise Resilience: Enabling or Burdening? PLoS ONE 2024, 19, e0305615. [Google Scholar] [CrossRef] [Scilit]
  10. Belhadi, A.; Mani, V.; Kamble, S.S.; Khan, S.A.R.; Verma, S. Artificial Intelligence-Driven Innovation for Enhancing Supply Chain Resilience and Performance under the Effect of Supply Chain Dynamism: An Empirical Investigation. Ann. Oper. Res. 2024, 333, 627–652. [Google Scholar] [CrossRef] [Scilit]
  11. Yuan, Y.; Tan, H.; Liu, L. The Effects of Digital Transformation on Supply Chain Resilience: A Moderated and Mediated Model. J. Enterp. Inf. Manag. 2024, 37, 488–510. [Google Scholar] [CrossRef] [Scilit]
  12. Milgrom, P.; Roberts, J. Complementarities and Fit: Strategy, Structure, and Organizational Change in Manufacturing. J. Account. Econ. 1995, 19, 179–208. [Google Scholar] [CrossRef] [Scilit]
  13. Tang, H.; Wu, K.; Zhou, J. Smarter supply chains, stronger resilience? The impact of AI on preparation, response, and recovery. Econ. Lett. 2025, 254, 112488. [Google Scholar] [CrossRef] [Scilit]
  14. Guo, X.; Chen, Y.; Xie, J.; Wang, H.; Lei, X. Research on supply chain resilience mechanism of AI-enabled manufacturing enterprises—Based on organizational change perspective. Sci. Rep. 2025, 15, 31177. [Google Scholar] [CrossRef] [Scilit]
  15. Cheng, G.; Zhang, H. The impact of China’s artificial intelligence pilot policies on enterprise supply chain resilience. Sci. Rep. 2026, 16, 5382. [Google Scholar] [CrossRef] [Scilit]
  16. Qi, R.; Ma, G.; Liu, C.; Zhang, Q.; Wang, Q. Enterprise digital transformation and supply chain resilience. Financ. Res. Lett. 2024, 66, 105564. [Google Scholar] [CrossRef] [Scilit]
  17. Li, P.; Chen, Y.; Guo, X. Digital transformation and supply chain resilience. Int. Rev. Econ. Financ. 2025, 99, 104033. [Google Scholar] [CrossRef] [Scilit]
  18. Sheng, X.; Shao, J. Digital transformation and enterprise resilience in Chinese listed firms: Evidence from information transfer efficiency. Humanit. Soc. Sci. Commun. 2026, 13, 816. [Google Scholar] [CrossRef] [Scilit]
  19. Zhang, X.; Tian, S.; Liu, J. Supply chain innovation pilot policy and enterprise total factor productivity. Financ. Res. Lett. 2025, 86, 108714. [Google Scholar] [CrossRef] [Scilit]
  20. Ministry of Science and Technology of the People’s Republic of China. Guidelines for the Construction of National New Generation Artificial Intelligence Innovation and Development Pilot Zones; Ministry of Science and Technology of the People’s Republic of China: Beijing, China, 2019.
  21. Ministry of Commerce of the People’s Republic of China and Other Departments. Notice on Carrying Out Supply Chain Innovation and Application Pilots; Ministry of Commerce of the People’s Republic of China and Other Departments: Beijing, China, 2018.
  22. Teece, D.J.; Pisano, G.; Shuen, A. Dynamic Capabilities and Strategic Management. Strateg. Manag. J. 1997, 18, 509–533. [Google Scholar] [CrossRef] [Scilit]
  23. Ponomarov, S.Y.; Holcomb, M.C. Understanding the Concept of Supply Chain Resilience. Int. J. Logist. Manag. 2009, 20, 124–143. [Google Scholar] [CrossRef] [Scilit]
  24. Zhang, H.; Liu, H.; Chen, R. Multilayer innovation network resilience: A framework for digital economy vulnerability assessment. iScience 2026, 29, 114295. [Google Scholar] [CrossRef] [Scilit]
  25. Shannon, C.E. A Mathematical Theory of Communication. Bell Syst. Tech. J. 1948, 27, 379–423, 623–656. [Google Scholar] [CrossRef] [Scilit]
  26. Loughran, T.; McDonald, B. Textual Analysis in Accounting and Finance: A Survey. J. Account. Res. 2016, 54, 1187–1230. [Google Scholar] [CrossRef] [Scilit]
  27. Bertrand, M.; Duflo, E.; Mullainathan, S. How Much Should We Trust Differences-in-Differences Estimates? Q. J. Econ. 2004, 119, 249–275. [Google Scholar] [CrossRef] [Scilit]
  28. Goodman-Bacon, A. Difference-in-Differences with Variation in Treatment Timing. J. Econom. 2021, 225, 254–277. [Google Scholar] [CrossRef] [Scilit]
  29. Sun, L.; Abraham, S. Estimating Dynamic Treatment Effects in Event Studies with Heterogeneous Treatment Effects. J. Econom. 2021, 225, 175–199. [Google Scholar] [CrossRef] [Scilit]
  30. Callaway, B.; Sant’Anna, P.H.C. Difference-in-Differences with Multiple Time Periods. J. Econom. 2021, 225, 200–230. [Google Scholar] [CrossRef] [Scilit]
  31. Jacobides, M.G.; Cennamo, C.; Gawer, A. Towards a Theory of Ecosystems. Strateg. Manag. J. 2018, 39, 2255–2276. [Google Scholar] [CrossRef] [Scilit]
  32. Khurana, I.; Dutta, D.K.; Ghura, A.S. SMEs and Digital Transformation during a Crisis: The Emergence of Resilience as a Second-Order Dynamic Capability in an Entrepreneurial Ecosystem. J. Bus. Res. 2022, 150, 623–641. [Google Scholar] [CrossRef] [Scilit]
  33. Browder, R.E.; Dwyer, S.M.; Koch, H. Upgrading Adaptation: How Digital Transformation Promotes Organizational Resilience. Strateg. Entrep. J. 2024, 18, 128–164. [Google Scholar] [CrossRef] [Scilit]
  34. Kraus, S.; Jones, P.; Kailer, N.; Weinmann, A.; Chaparro-Banegas, N.; Roig-Tierno, N. Digital Transformation in Business and Management Research: An Overview of the Current Status Quo. Int. J. Inf. Manag. 2022, 63, 102466. [Google Scholar] [CrossRef] [Scilit]
  35. Hohenstein, N.O.; Feisel, E.; Hartmann, E.; Giunipero, L. Research on the Phenomenon of Supply Chain Resilience: A Systematic Review and Paths for Further Investigation. Int. J. Phys. Distrib. Logist. 2015, 45, 90–117. [Google Scholar] [CrossRef] [Scilit]
Disclaimer/Publisher’s Note: The statements, opinions and data contained in all publications are solely those of the individual author(s) and contributor(s) and not of MDPI and/or the editor(s). MDPI and/or the editor(s) disclaim responsibility for any injury to people or property resulting from any ideas, methods, instructions or products referred to in the content.

Article Metrics

Citations

Article Access Statistics

Multiple requests from the same IP address are counted as one view.