1. Introduction
Urban governance increasingly operates through interfaces that combine media exposure, citizen complaint, administrative response, and public evaluation. Public value scholarship asks whether public action is valuable, publicly authorized, and operationally supported, rather than merely whether it generates visible managerial output [
1,
2,
3,
4,
5,
6]. Accountability scholarship adds a second boundary condition: accountability is not simply any form of responsiveness, but a relation in which an actor is called to explain and justify conduct before a forum that can question, judge, and sometimes impose consequences [
7,
8,
9,
10]. The question for urban governance is therefore not only whether officials respond, but what sort of accountability-relevant public value a governance interface can produce.
Televised accountability in China differs from both conventional town-hall meetings and ordinary interview programs. In the Nanning program examined here, local governance problems are organized into issue chains built around citizen complaints, investigative reporting, and program-prepared evidence. A typical chain begins with host introduction, background narration, complaint material, investigative clips, or documentary evidence. Responsible officials from municipal departments, districts, townships, development zones, or other public organizations then answer in the studio before hosts, cameras, audience members, and supervisory authorities. During the exchange, hosts may replay evidence, ask follow-up questions, name responsible units, and move the discussion toward a commitment segment in which officials are expected to state what will be done. Later review episodes or post-program reporting may revisit previously exposed problems and give the format a visible follow-up component [
11,
12,
13].
Research on smart cities and data-rich urban governance similarly emphasizes that public value is shaped through coupled relationships among technologies, organizations, and civic actors rather than through isolated tools alone [
14,
15,
16,
17,
18]. Chinese televised accountability programs are one such interface. They do not merely publicize failure after the fact. They assemble evidence, allocate attention, identify responsibility, and press officials to respond before viewers, hosts, and supervising authorities within the same staged sequence [
19,
20,
21,
22]. In many cities, this kind of broadcast arena coexists with online inquiry channels, government hotlines, platform-based complaint handling, and other digital responsiveness arrangements, but television remains distinctive because it synchronizes issue selection, evidentiary display, official reply, and public evaluation within one visible sequence [
23,
24,
25,
26]. The empirical case is Nanning’s long-running “Commitment to the People—TV Accountability” program. The question is therefore not only how officials react when accountability goes public, but how a publicly staged oversight process reorganizes response inside an urban governance system.
Existing research shows why this setting matters, but it has not fully examined the internal response process inside the accountability scene. Chinese studies often treat televised accountability as media supervision, mediated governance, or a channel that translates public demands into administrative action [
19,
20,
23,
27]. Other work focuses on later outcomes such as rectification, satisfaction, or agenda pressure. What remains less clear is how different informational inputs, pressure cues, and program stages are converted into immediate official response within the oversight interface itself.
The broader literature on blame avoidance helps explain why this gap matters. Political and administrative actors manage blame rather than simply absorb it [
28]. Transparency and publicity can intensify strategic adaptation instead of guaranteeing substantive correction [
29,
30,
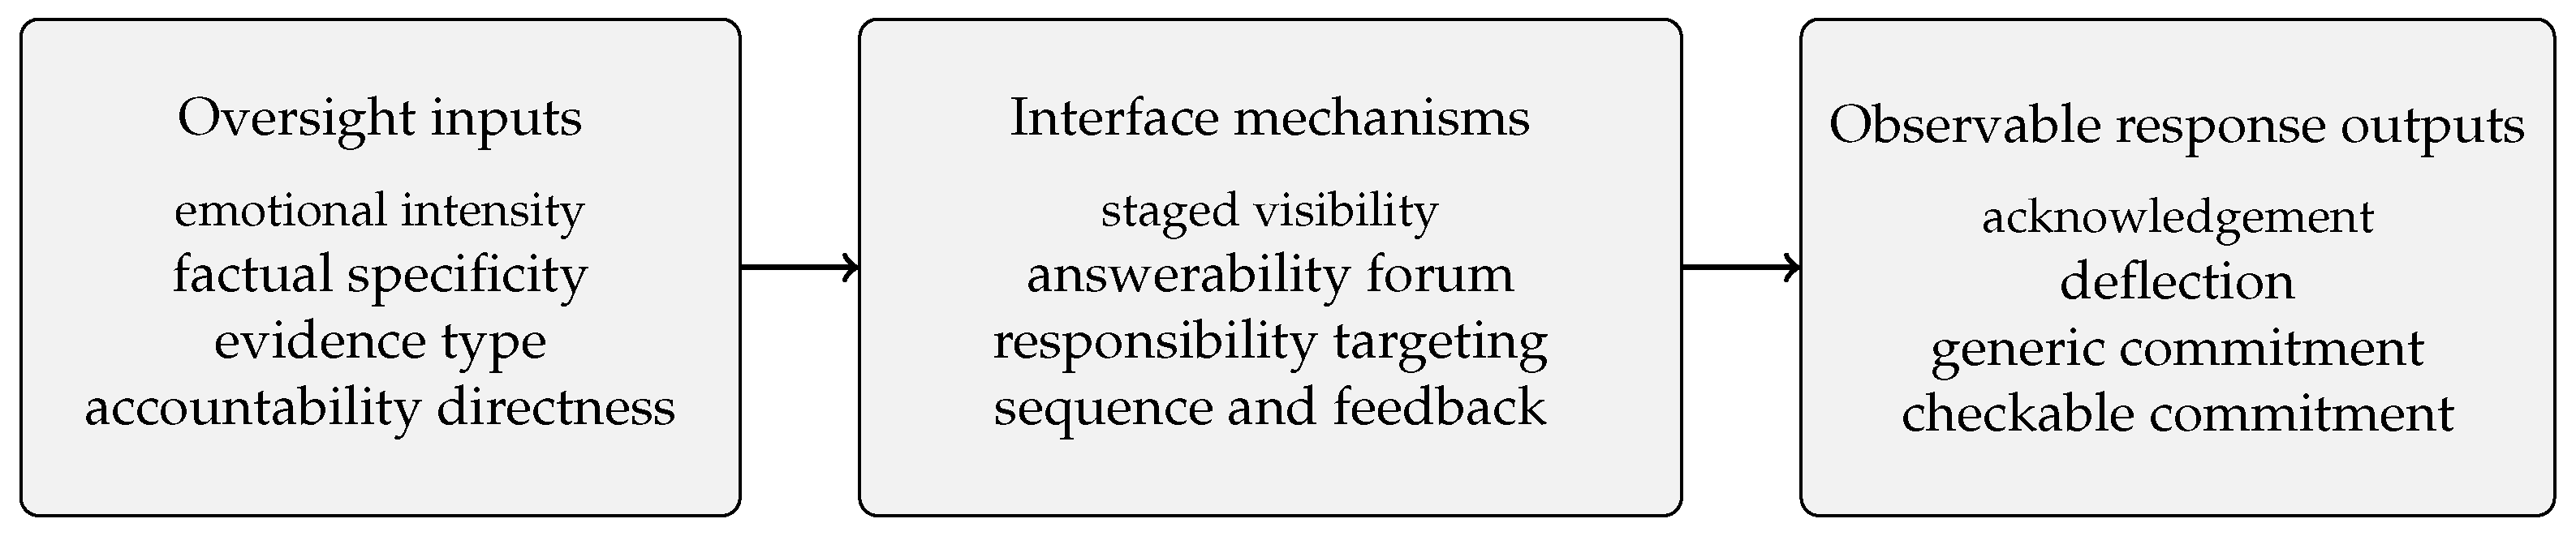
31]. In a televised setting, once silence and procedural delay become harder to use, officials may turn to faster and more interactional forms of defense, including partial acknowledgement, technical explanation, responsibility dilution, symbolic commitment, or combinations of these moves. What looks like a simple public reply is therefore better understood as a system output shaped by staged visibility, evidentiary form, responsibility targeting, and sequence position.
This setting is especially useful because televised accountability is structured rather than spontaneous. Hosts intervene, clips are prepared in advance, turn order is managed, and later program stages explicitly invite commitment and evaluation [
32,
33,
34]. The scene is public, but it is also curated. Treating it as an ordinary deliberative forum therefore misses its defining feature: pressure is staged, sequenced, and socially amplified. In urban-governance terms, this makes televised accountability a useful site for examining how mediated visibility shapes official response.
Public confrontation also adds an interactional-processing layer. It concentrates visibility, explicit judgment, and limited control over the timing of reply. Research on stress, threat rigidity, and decision pressure suggests that such conditions can narrow information processing and encourage short-horizon defensive adjustment rather than careful problem solving [
35,
36,
37,
38]. The analysis therefore focuses on observable response patterns rather than direct measurement of officials’ internal psychological states.
The analysis centers on official response strategies within that staged setting, using Nanning’s program as a focused city-level case rather than a random national sample. The design is not fully exogenous, and it does not directly estimate governance improvement after broadcast. The question is narrower and more system-oriented: how are different forms of pre-response pressure associated with the current official reply, and what does the resulting sequence reveal about the public value and accountability outputs this oversight interface tends to organize?
The article links concept, method, and empirical substance in three ways. Conceptually, it recasts televised accountability as a socio-technical governance interface in which public pressure is assembled through media production, evidentiary presentation, and program sequence. This framing connects public value to accountability by asking whether visible answerability is associated mainly with legible response or with more checkable commitments that can support later verification and learning. Methodologically, the analysis uses a response-level design based on sequential transcripts and pressure windows, making it possible to analyze the individual official reply rather than the episode as a whole. Empirically, the Nanning case shows that officials rarely rely on a single response line. They assemble response packages, and the distinction between generic and specific commitment turns out to be crucial for understanding when public oversight is linked to symbolic accommodation and when it is linked to more checkable commitments. More broadly, visible pressure is associated with low-cost, publicly legible adjustment more readily than high-cost commitment, a point with wider relevance for systemic governance, urban accountability, and public value in data-mediated oversight settings.
The article proceeds in four steps.
Section 2 develops the theoretical framing and research focus.
Section 3 describes the Nanning corpus, the response-chain design, the measurement strategy, and the model specifications.
Section 4 reports the descriptive, model-based, robustness, stage, and sequence results.
Section 5 discusses the implications for systemic accountability, public value, practical design, limitations, and future research, before the conclusion summarizes the argument.
3. Materials and Methods
3.1. Data Source and Sample Construction
The empirical material comes from a sequential corpus of Nanning’s long-running “Commitment to the People—TV Accountability” program from 2014 to 2023. Public reporting indicates that the program began in March 2014, combined live questioning with explicit post-program rectification pressure, and later added review episodes to track whether previously exposed problems were actually rectified [
11,
12,
13]. The same reporting also points to a stable and institutionalized format rather than episodic experimentation: within the first year there were already 14 live episodes and 53 participating departments, while later retrospective reports described repeated cycles of exposure, follow-up, and review [
12,
13]. These features make Nanning a useful case. It captures a mature and problem-focused accountability arena with enough temporal stability to observe repeated response patterns under a routinized televised format. Because the program is organized around municipal departments, district-level actors, and concrete local problems, it also provides a useful window into how an urban accountability interface processes city-level governance failures under public visibility. The evidence should still be read as a focused city-level case rather than a random sample of all Chinese televised accountability programs. The analytical value lies in the stabilized accountability format, not in statistical representativeness of every regional governance ecology.
The publicly accessible transcript archive is not complete: some earlier episodes have been removed from official webpages, the latest retrievable transcript material available for this study ends in 2023, and several episode records contain severe transcript gaps. After excluding unavailable or seriously incomplete records, the 73 analyzed episodes contain 15,162 speaking turns across hosts, officials, citizens, commentators, clips, and narration. Before response-level coding, speaker roles, organizational units, and turn order were standardized across the sequential transcripts.
Among these turns, 4561 are spoken by identifiable officials. Because the analysis focuses on public-sector actors who can credibly bear and articulate commitment, it excludes clearly non-governmental market actors, enterprise representatives, and ambiguous speaker records. After restricting the data to eligible official responses with complete coded variables, the final analytical sample contains 3675 valid official responses from 73 episodes, 327 issue chains, and 840 unit-chain observations.
The analytical sample is not identical to the full transcript universe. It includes the official responses that meet the actor, chain, and variable-completeness criteria described above. Quantitative inference in what follows is therefore based on the effective response-level sample rather than on an undifferentiated treatment of all program turns.
3.2. Analytical Unit, Chains, and Pressure Windows
Analysis proceeds at the level of the single official response, with each response interpreted within a sequential context. The data structure follows three levels: episode, chain, and turn. An episode is a program installment, a chain is an issue-specific accountability exchange, and a turn is an individual speaking turn.
Chain identifiers were constructed from physical and programmatic boundaries visible in the transcripts. Recurrent host markers such as “let us watch the clip”, “next we focus on”, “welcome back”, “commitment time”, and “please vote” provide repeatable boundary cues. The segmentation used these recurring markers, with review of ambiguous boundaries where needed. The goal was not to reconstruct the finest semantic topic boundary, but to obtain a stable and reproducible chain structure for defining pressure windows.
For response-level modeling, each official response is paired with a pressure window. Within the same chain, the pressure window includes all non-official turns that occur after the previous official turn and before the current official turn. If an official response occurs at the beginning of a chain, the window starts from the chain’s first turn. This rule preserves temporal order, avoids contaminating the current pressure measure with earlier same-unit official speech, and gives each response its nearest external pressure environment.
3.3. Text Coding and Measurement
The text variables are based on interpretive content coding rather than keyword counts alone. For response outcomes, the primary text is the current official reply; pressure-window text, previous same-unit text, episode, chain, and stage provide context only when the local meaning is ambiguous. The measurement scheme records a broader set of response dimensions and uses the theoretically relevant dimensions as the analytical variables described below. This design follows standard guidance in content analysis, which stresses explicit categories, clear decision rules, and documented agreement checks when interpretive judgments are converted into analyzable variables [
65,
66].
Initial classification used the ‘qwen3.6-plus’ model release through the Alibaba Cloud DashScope interface (Alibaba Cloud, Hangzhou, China), followed by researcher review of ambiguous or substantively important cases before analysis. The same model was used for the response outcomes and the pressure variables under task-specific prompts. At the time of coding, ‘qwen3.6-plus’ was the current release in the Qwen Plus line on DashScope. It was selected because the source material consists of Chinese television transcripts with colloquial compression, administrative terminology, and context-dependent references, making a high-capacity Chinese-language model appropriate for this material.
This approach follows a broader text-as-data view in public administration and political methodology, which argues that automated text coding should be paired with concept-specific checks and close reading rather than treated as sufficient on its own [
64,
67]. Recent work on LLM-based annotation further suggests that model-assisted coding can perform well for short texts and well-specified codebooks, but that performance remains task-dependent and requires independent assessment [
68,
69,
70,
71]. Other methodological work points to risks of validity drift, replicability loss, and opaque prompt dependence, which reinforces the need to report coding rules and coder-agreement results rather than rely on model classifications alone [
72,
73].
The prompts did not ask for free-form interpretation. They specified the categories, inclusion and exclusion rules, boundary cases, and required categorical answers. This design was intended to reduce the risk that the model would generate unsupported summaries or infer unobserved motives. It does not remove model-related risks altogether. A Chinese-language model trained in a Chinese information environment may still reproduce genre-specific assumptions about administrative speech, miss irony or pragmatic ambiguity, or classify formulaic official language too confidently. For that reason, the model supported classification, while researcher judgment remained central for difficult cases and for the agreement checks reported below. The final analytical variables should therefore be understood as model-assisted content codes followed by targeted researcher review and independent human agreement checks, not as unverified LLM outputs.
3.4. Outcome Variables
The response scheme records multiple non-mutually exclusive dimensions. The main models focus on four core strategies while retaining additional categories for descriptive context and for distinguishing routine bureaucratic talk from the absence of meaningful content.
The selection of the four core outcomes is theory-driven rather than prevalence-driven. They capture the main strategic contrast examined here: whether public pressure is associated with visible acknowledgement, displacement of responsibility, vague future-oriented settlement, or checkable commitment. Some additional categories are empirically common, especially routine informational response, but they do not map as directly onto this central contrast between concession, defense, and commitment. Because official replies often combine several speech functions, the outcome dimensions are coded as separate binary indicators rather than as one mutually exclusive typology. A single response can therefore contain acknowledgement together with deflection, one form of commitment, or routine bureaucratic talk. The only deliberate exception is the commitment pair: if a response satisfies the higher threshold for specific commitment, it is not also counted as generic commitment. This rule keeps vague promise-making analytically separate from more checkable commitment. The models estimate whether each pressure cue is associated with the presence of a given response component.
The first core outcome is the acknowledgement indicator, which equals 1 when the response explicitly acknowledges the existence of a problem or responsibility. This includes statements of acceptance, criticism-taking, apology, shame, or self-reproach, but it does not require full acceptance of all responsibility.
The second is the deflection family indicator. It equals 1 when the response weakens immediate responsibility through boundary claims, historical legacy, procedural constraints, coordination difficulties, objective conditions, or outward responsibility shifting. The coding logic does not equate this category with crude blame dumping. Its core criterion is whether the response functionally reduces the focal unit’s immediate responsibility burden.
The third is the generic-commitment indicator. It records future-oriented commitment language that contains a promise to address the issue but does not meet the higher threshold for verifiable specificity. Responses that already qualify as specific commitment are therefore not counted again as generic commitment.
Although both deflection and generic commitment can serve defensive purposes, they are not treated as the same speech function. Deflection operates through spatial or causal displacement, that is, it reduces the focal unit’s immediate responsibility burden by contesting where responsibility lies or why the failure occurred. Generic commitment operates through temporal displacement. It accepts the need to respond, but defers resolution into an underspecified future. Separating the two therefore distinguishes between contesting present responsibility and delaying concrete settlement.
The fourth is the specific-commitment indicator. Under the final coding rule, a response must contain explicit commitment language and satisfy at least two of four action-specificity elements: a clear time element, a clear action, a clear responsible actor, or a clear target or object of rectification. This is the outcome closest to a high-cost, trackable commitment. Consistent with the theoretical argument above, it is treated as an accountability-relevant public output because it gives later actors more material for verification, not because the coding itself proves that the promised remedy was completed.
In addition to these four core outcomes, the broader response scheme includes categories such as routine informational response, effort claiming, policy or technical explanation, low-information response, and sanction threat. These dimensions reduce the size of the residual category and make the surrounding bureaucratic speech environment more interpretable. The main models do not center on these categories because they do not bear as directly on the article’s core contrast between concession, defense, and commitment. Sanction threat is retained as an additional outcome. Classic blame-avoidance theory can plausibly treat downward punishment as a form of deflection, because responsibility is shifted onto subordinates or lower-level implementers. In the present setting, however, punitive signaling serves a dual function. It can deflect immediate blame downward, but it can also perform visible rectification, political alignment, and administrative resolve before superiors, hosts, and viewers. For that reason, sanction threat is modeled separately rather than subsumed completely within the broader deflection family.
3.5. Pre-Response Pressure Variables
The main models use pressure measures built from rubrics rather than simple dictionary-based counts. Each pressure variable is scored from observable textual cues specified in advance, such as factual anchors, direct responsibility signals, or the tone of the pressure window. This avoids treating repeated keywords as equivalent to substantive pressure and follows the broader text-as-data principle that automated measures are strongest when coding rules are tightly aligned with the substantive concept [
64,
67]. This strategy is also consistent with content-analysis guidance on making latent constructs traceable to observable indicators and with recent recommendations for LLM-assisted coding under fixed rubrics [
65,
72,
73].
The factual-specificity measure is a 0–3 variable constructed from five factual anchors: numerical anchors, time anchors, place or organizational anchors, process-detail anchors, and documentary-evidence anchors. Higher values indicate that the pressure window contains more verifiable and concretely locatable factual content.
The emotional-intensity measure is also coded from 0 to 3. Unlike simple word-count approaches, it evaluates the overall semantic intensity and moral pressure of the pressure window under a fixed ordinal rubric. It is therefore closer to the overall pressure tone of the accountability scene than to a simple tally of negative words, which matters because the relevant construct is pragmatic pressure rather than mere lexical negativity [
55,
67,
73].
The accountability-directness measure is a 0–3 variable composed from three direct-accountability signals: explicit naming or pointing to a responsible actor, attribution of failure or neglect, and a demand for immediate on-site explanation or action. Higher values indicate that the pressure is more directly aimed at a responsibility bearer rather than framed as a generic problem.
The evidence dimension is modeled not as a single binary exposure variable but through three separate indicators: general non-clip evidence, clearly negative exposure clips, and rectification follow-up clips. This disaggregation is necessary because different evidence forms embed different program logics and do not operate as a single undifferentiated treatment.
3.6. Controls and Structural Variables
The models include four sets of controls. Program stage captures whether the response occurs during issue introduction, clip presentation, transition, commitment, or voting. This is a substantive structural control rather than a routine background variable because commitment patterns vary sharply across stages. Unit type controls for whether the actor is a bureau or functional department, a district or township government, a development-zone body, a party-discipline actor, or another public organization. Calendar year absorbs temporal heterogeneity across 2014–2023.
A final control, and the most important one for addressing omitted problem seriousness, is coded problem severity. This chain-level ordinal measure ranges from 0 to 3 and is coded from clip and host-background text only, with official response content excluded. The score is based on five observable seriousness cues: public-safety or health risk, economic or property loss, affected population scale, repeated exposure or long-term unresolved failure, and explicit illegality or rule violation. These cues guide the ordinal judgement; they are not mechanically added into a five-point count. Each chain score is then assigned to the corresponding response observations. The measure is therefore best understood as a source-separated severity score rather than an estimate of absolute ground-truth harm. The clips and host narratives remain media texts, and media framing can dramatize problem presentation. This design reduces same-text contamination and limits direct conceptual overlap with the pressure variables in the main regressions [
64,
65,
67].
3.7. Intercoder Agreement
An independent second coder assessed agreement on 400 response-level observations and 100 chain-level severity cases. The choice of Cohen’s
for nominal indicators and linearly weighted
for ordered scales follows standard guidance in content analysis and annotation research, where agreement measures are expected to account for chance agreement and where weighted coefficients are preferable when disagreements are ordinal rather than purely nominal [
66,
74]. Both pressure and response variables were included in this check, so the final variables are assessed through human agreement rather than only through the model used for initial classification.
For the four core response outcomes, Cohen’s
was 0.929 for acknowledgement, 0.873 for deflection, 0.923 for generic commitment, and 0.734 for specific commitment. For the ordinal response-level pressure variables, linearly weighted
was 0.943 for factual specificity, 0.942 for emotional intensity, and 0.884 for accountability directness; clip valence reached a Cohen’s
of 0.970. For the independently coded severity control, kappas for the five seriousness cues ranged from 0.696 to 0.888, and the resulting 0–3 problem-severity score reached a linearly weighted
of 0.760.
Table A1 summarizes these results, and
Appendix B gives additional measurement details.
3.8. Model Strategy
The quantitative design combines three complementary components.
The baseline specification works at the row level. Using single official responses as observations, separate binary logit models are estimated for acknowledgement, deflection, generic commitment, and specific commitment. A sanction-threat indicator is reported separately as an additional outcome that captures downward punitive language rather than one of the core strategic dimensions. Standard errors are clustered at the episode level.
Parallel binary models are used rather than forcing the response package into a mutually exclusive multinomial outcome because the central phenomenon is the co-occurrence of acknowledgement, defense, and commitment. This specification also fits the multi-label structure of the coded text, which preserves overlapping response components rather than collapsing them into a single label [
54,
64]. Although the latent errors across strategy dimensions may be correlated, parallel logits are retained as the baseline specification because they map directly onto the odds of each interactional strategy and avoid imposing a stronger joint-normal-error structure on non-mutually exclusive speech acts at this stage of the analysis. Because the televised setting is highly interactive, however, the row-level models should be read as estimating contemporaneous associations between the current pressure window and the current official reply rather than clean one-way causal effects. It is entirely plausible that evasive or defensive behavior in turn
provokes stronger emotional intensity or greater accountability directness in turn
t. That concern is addressed only partially through chain fixed effects, historical-maximum specifications, sequence analysis, and an additional lagged-feedback diagnostic reported in
Table A2. Those devices reduce but do not eliminate bidirectional feedback.
The second component is a unit-chain terminal model in which the observation is the final response of the same unit within the same chain. For each unit-chain, historical-maximum pressure measures are constructed prior to the terminal response, including the maximum factual specificity, emotional intensity, accountability directness, and evidence indicators experienced earlier in the chain, as well as the number of responses by that unit within the chain. This model addresses a narrower question than full step-by-step causal transition modeling: whether the highest pressure encountered earlier in the chain relates to the strategic character of the final statement.
The third component is a sequence analysis. Because the data preserve within-chain order, the analysis also examines adjacent state transitions and estimates discrete-time first-event hazards for two events: first visible concession, defined as acknowledgement or specific commitment, and first specific commitment. Here, visible concession refers to observable concessionary language, not evidence that a substantive remedy has already occurred.
Studies of e-government responsiveness show that actual contact attempts can reveal whether public interfaces deliver timely and usable responses, rather than merely whether institutions have adopted digital channels [
75,
76]. Adaptive-governance research likewise frames responsiveness as a temporal balancing problem between adaptation, stability, and accountability [
77]. Methodologically, discrete-time event-history models provide standard tools for analyzing the timing of transitions in ordered response sequences [
78,
79]. Sequence analysis complements them by foregrounding path dependence in ordered interaction [
80]. In this study, they illuminate timing and path dependence without forcing inference to rest on sparse global transition cells alone.
Finally, an additional lagged-feedback diagnostic reverses the direction of the row-level question. Using the same adjacent-transition sample, it estimates whether official response at turn
predicts pressure at turn
t, conditional on lagged pressure, current stage, unit type, year, problem severity, and within-chain turn order. The data consist of uneven interaction sequences rather than balanced panel waves, so this diagnostic is not presented as a full cross-lagged panel model or a causal identification strategy. Its results are reported with the robustness checks and in
Table A2.
3.9. Robustness Strategy
The robustness checks address three concerns. Row-level models are re-estimated on a pre-commitment subsample restricted to the earlier stages of the program, testing whether the main findings are merely artifacts of the highly scripted commitment stage. The clustering level is then varied from episodes to chains, and chain fixed effects are introduced in the row-level models to absorb time-invariant chain heterogeneity and reduce sensitivity to omitted problem-level characteristics. This fixed-effects specification is deliberately conservative because it absorbs stable within-chain differences in political sensitivity, problem complexity, and underlying scandal seriousness before the pressure variables are evaluated. Together with the severity control and the sequence analysis, these checks assess whether the core patterns are reducible to one modeling choice.
4. Results
4.1. Descriptive Overview of the Response Structure
The empirical analysis uses 3675 valid official responses drawn from 73 episodes, 327 issue chains, and 840 unit-chain observations. In raw frequency terms, acknowledgement of problem or responsibility is the most common core response dimension, appearing 1496 times and accounting for 40.7% of the sample. Routine informational response is also frequent, accounting for 26.3% of the sample; generic commitment accounts for 25.5%; and deflection or shared-responsibility language appears in 22.1%. By contrast, specific commitment accounts for only 7.6%, and sanction-threat language for 8.2%. The descriptive pattern is clear: the most common responses in the televised accountability arena are not high-cost, verifiable concessions, but lower- to medium-cost moves such as acknowledgement, explanation, routine information, and generic commitment.
The responses also show a pronounced composite structure.
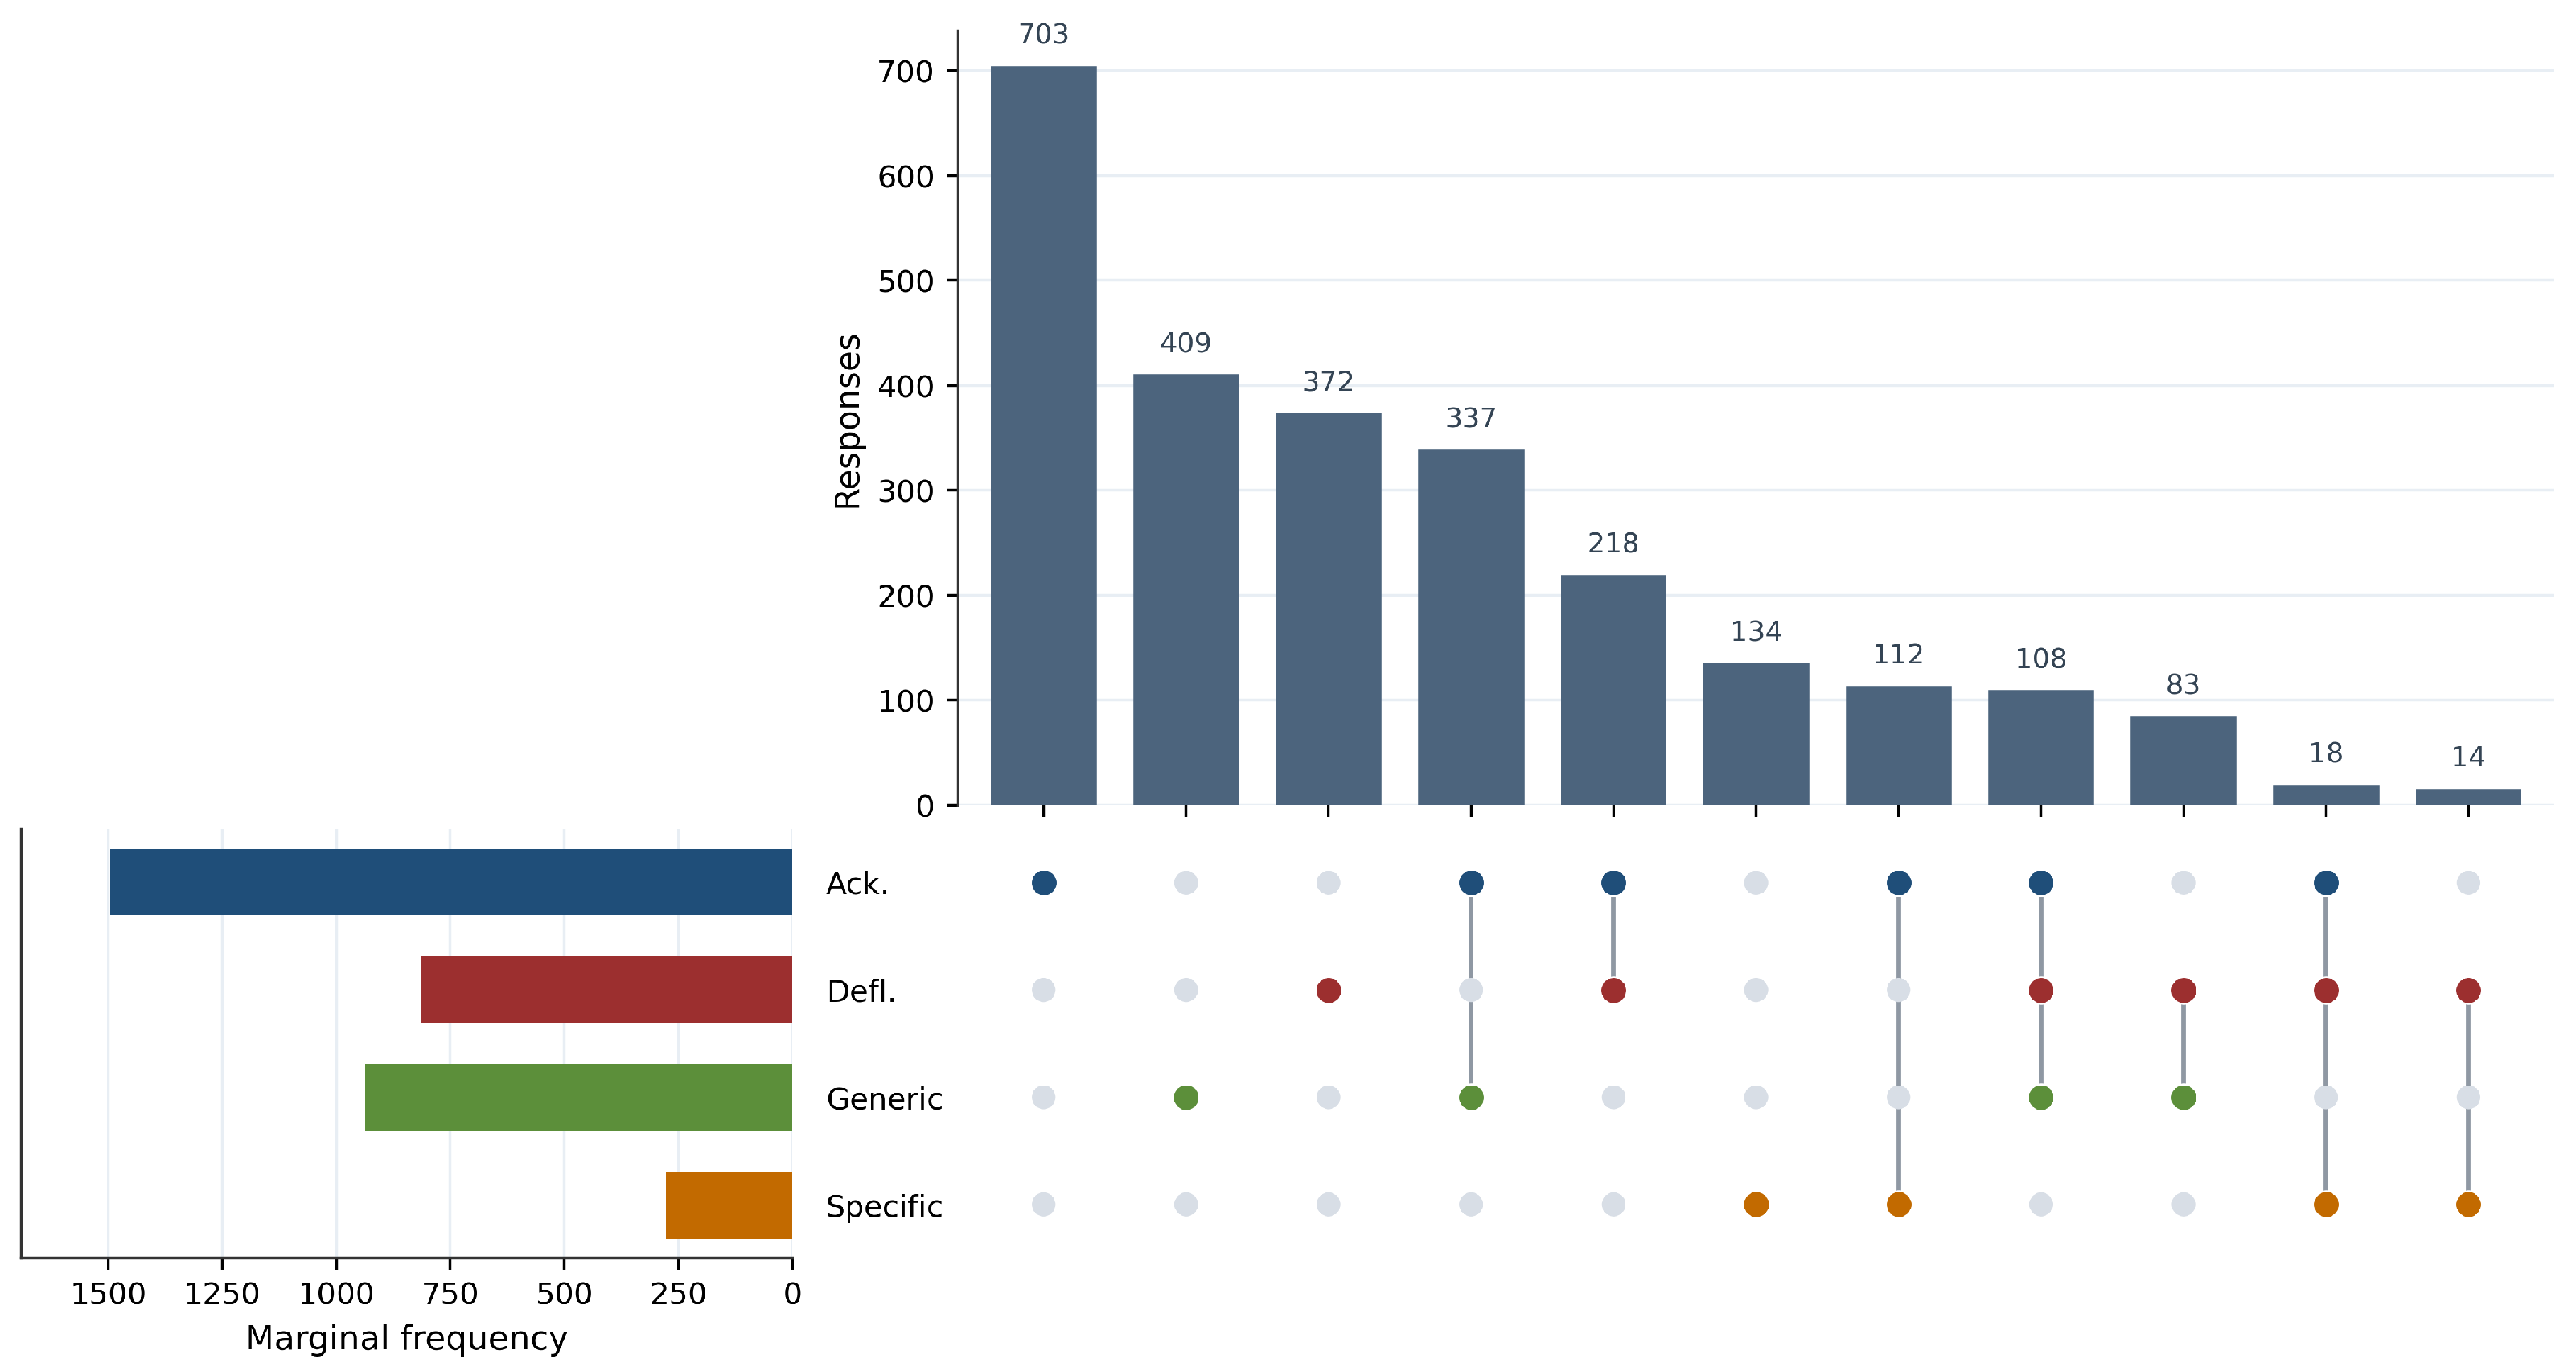
Figure 2 maps the non-empty co-occurrence patterns across the four core response dimensions. Frequent combinations include not only single-strategy cases but also acknowledgement plus generic commitment, acknowledgement plus deflection, and acknowledgement plus deflection plus generic commitment. Acknowledgement co-occurs with generic commitment 445 times and with deflection 344 times. Although acknowledgement-only replies remain the largest non-empty core pattern, the broader structure is plainly combinatory rather than mutually exclusive. This is direct evidence against a simple admit-versus-deny reading of official behavior. The accountability scene is better understood as a setting in which multiple rhetorical resources are jointly mobilized.
The additional response categories also clarify the residual category. If one looks only at the five reported outcome dimensions, 1104 responses have none of those labels, or about 30.0% of the sample. Once routine informational response, low-information response, effort claiming, and related categories are taken into account, 1006 of those cases receive at least one additional substantive classification. Only 98 responses remain unclassified within the broader response scheme, or 2.7% of the total sample. The data therefore do not contain a large residual category with no interpretable content. Instead, the bureaucratic speech environment contains a substantial layer of technical and routine talk that is kept analytically separate from the more theoretically consequential strategies of acknowledgement, deflection, and commitment.
4.2. Row-Level Main Models
The row-level binary logit models examine how the pre-response pressure variables are associated with the four core response outcomes while controlling for stage, unit type, year, and coded problem severity.
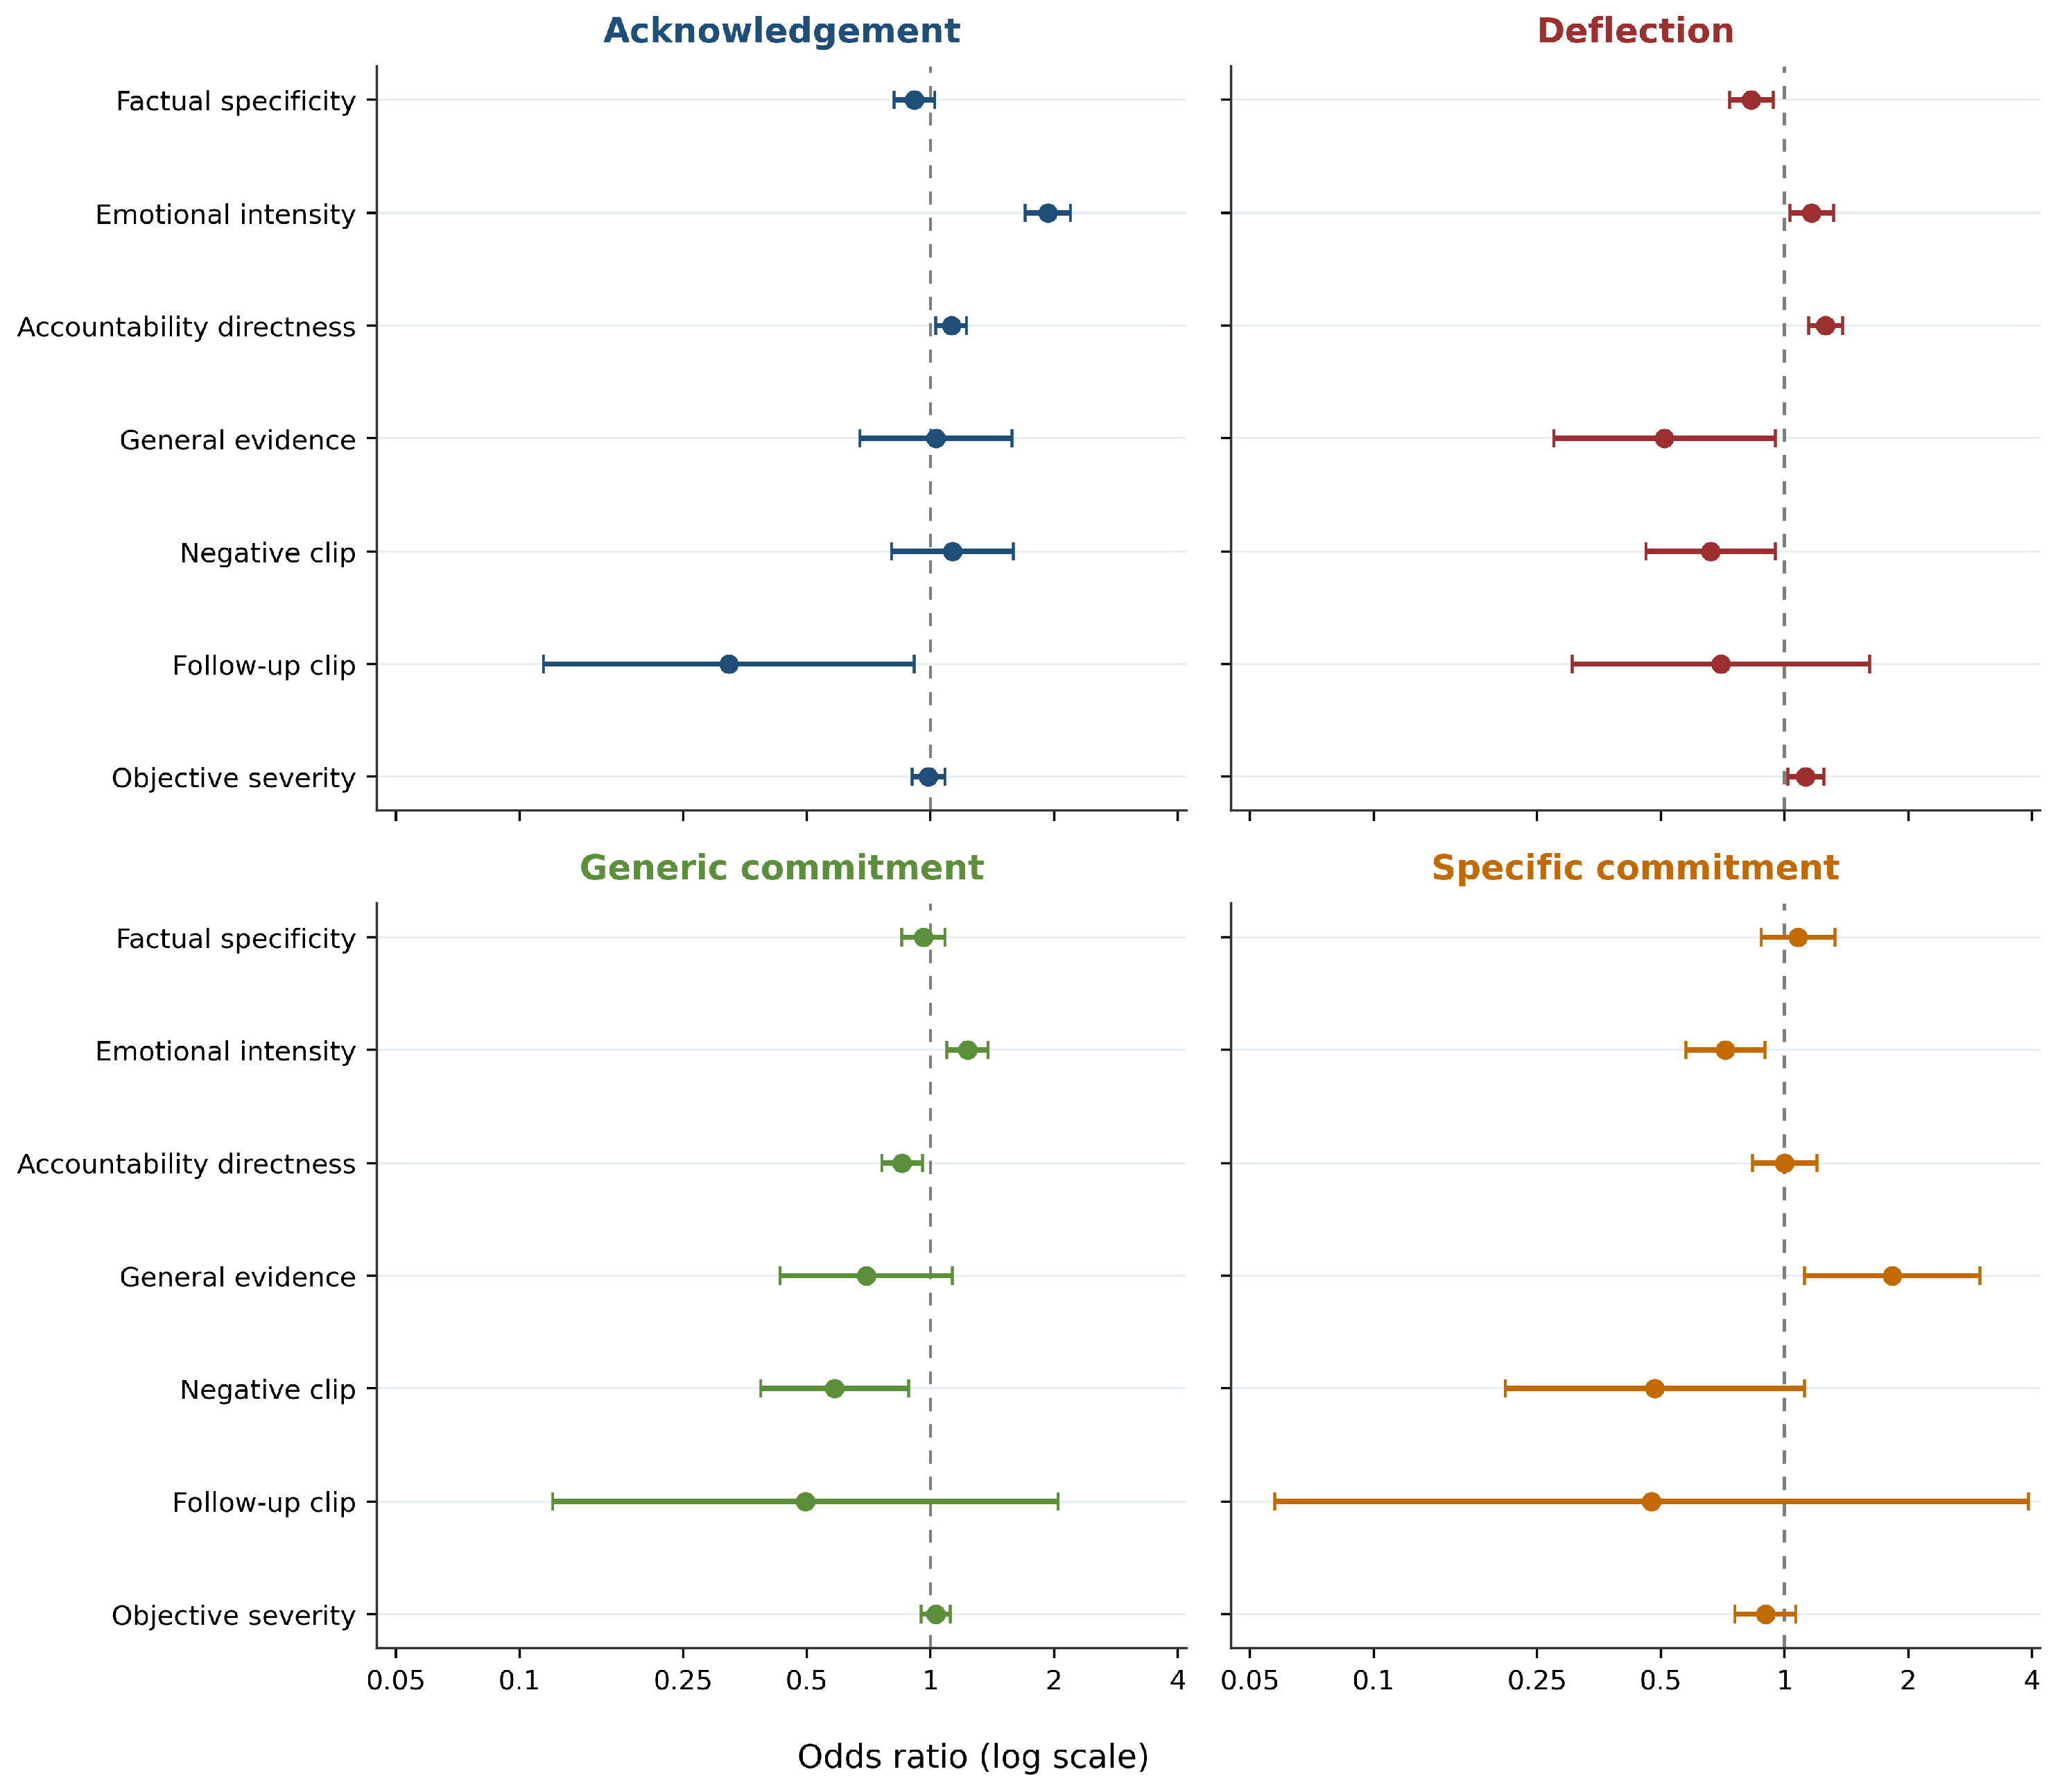
Table 1 reports the main coefficients in odds-ratio form for the four core outcomes and the separately reported sanction-threat outcome, while
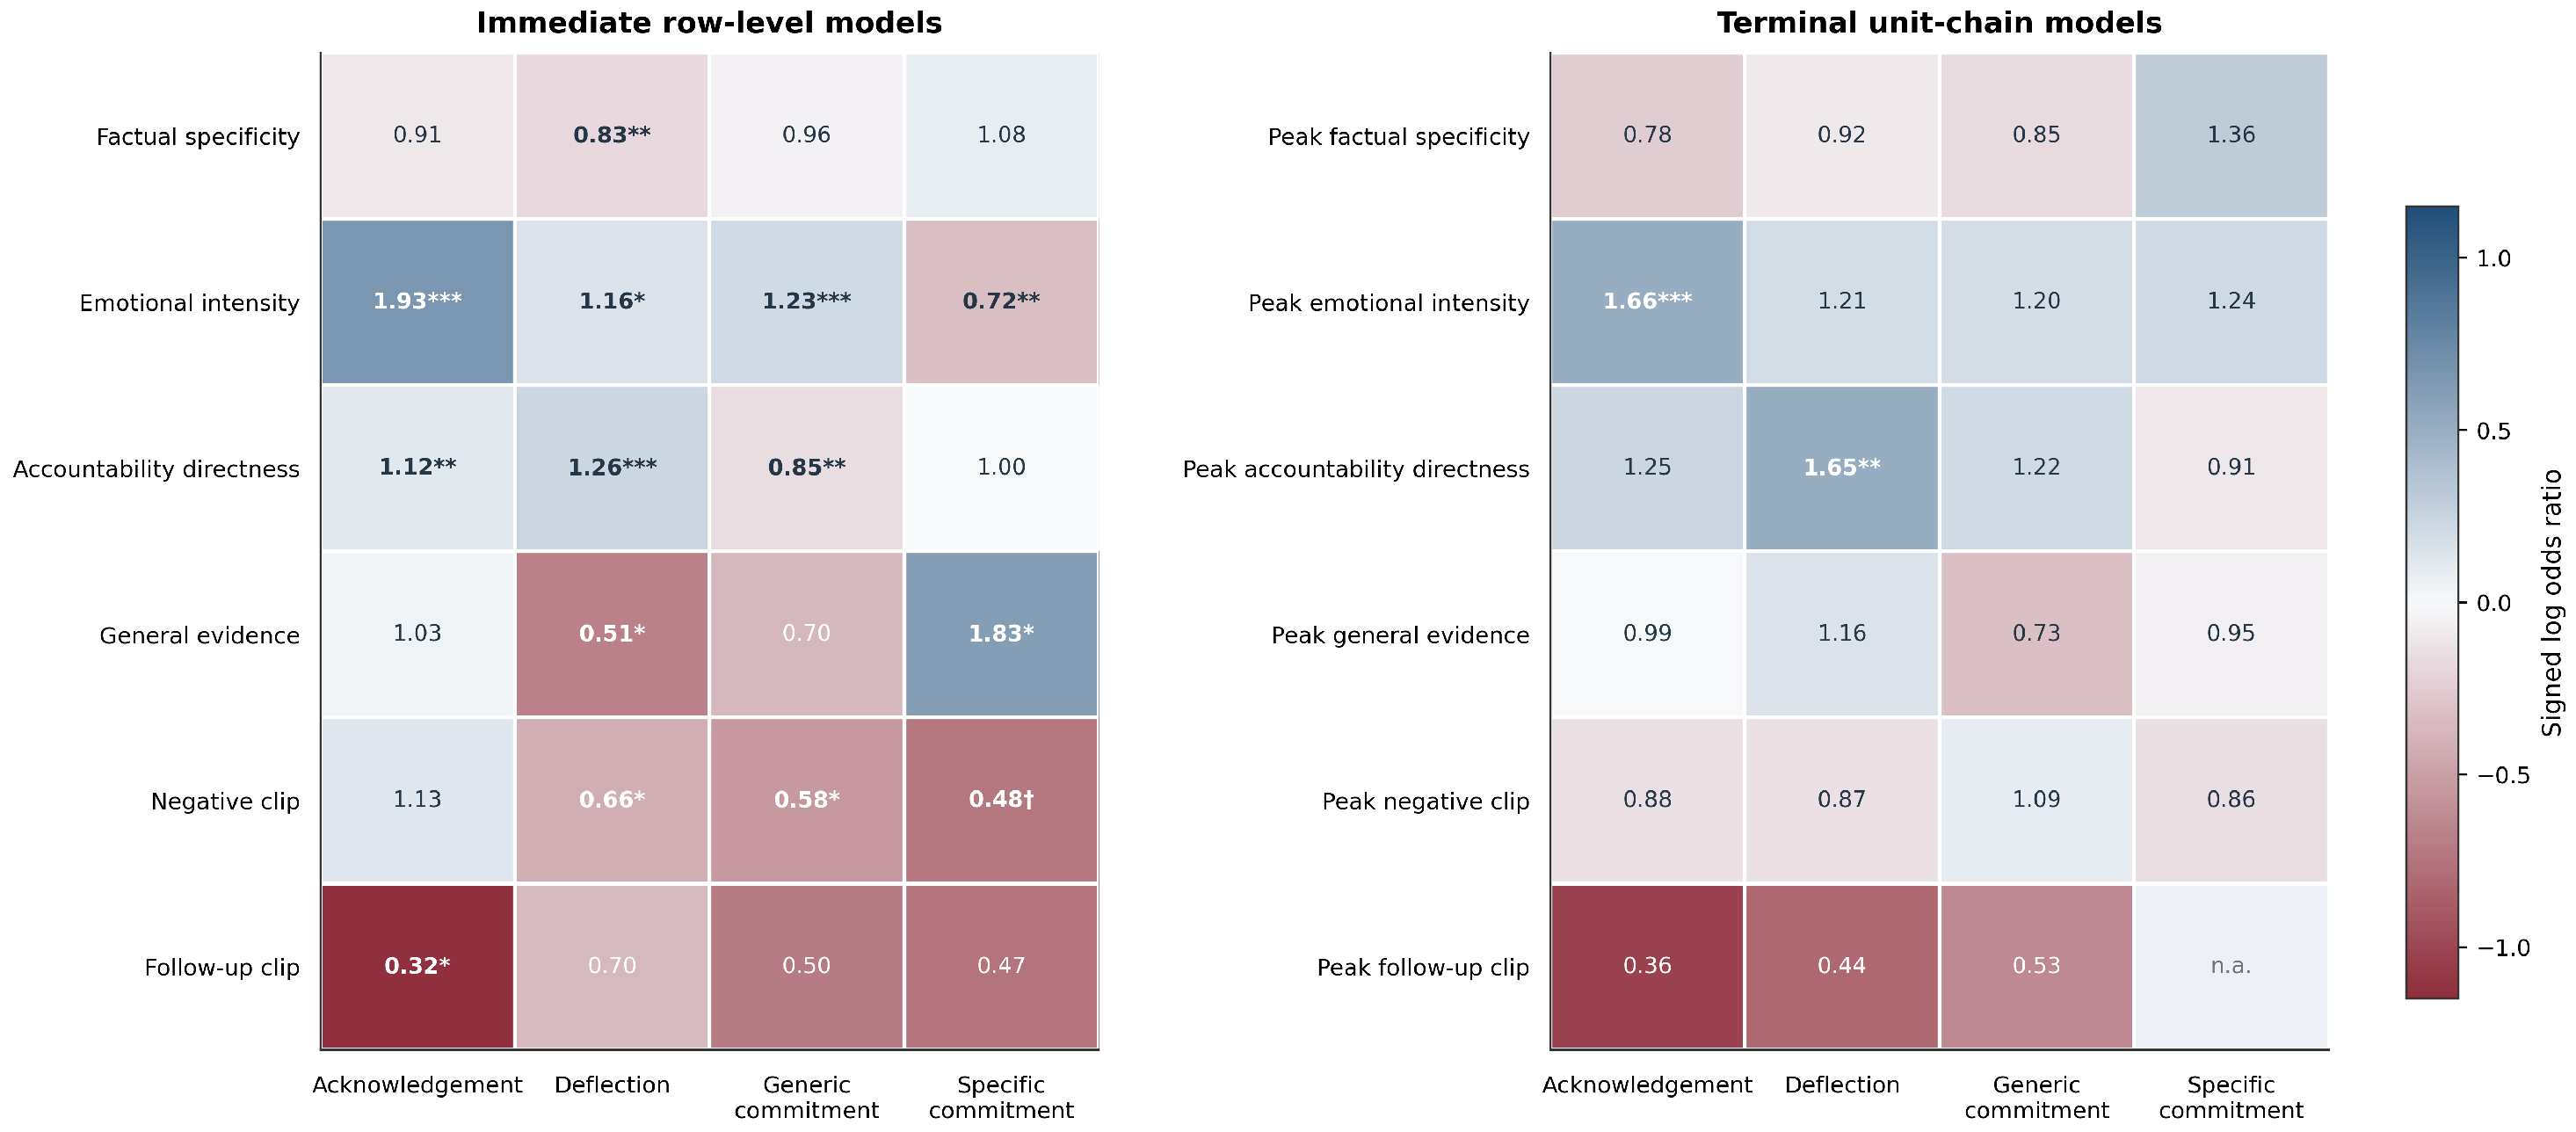
Figure 3 visualizes the same patterns for the four core outcomes.
Emotional intensity provides the most consistent pressure-response pattern in the row-level specification. Higher emotional intensity is associated with higher odds of acknowledgement (OR = 1.931, ), deflection (OR = 1.164, ), generic commitment (OR = 1.230, ), and sanction-threat language (OR = 1.316, ). It is simultaneously associated with lower odds of specific commitment (OR = 0.718, ). That contrast is central to the argument. Emotional escalation does not linearly coincide with more high-cost concession. Instead, it is linked to more immediate public response and a broader mix of strategies deployed on air.
Accountability directness shows a different but equally important pattern. It is associated with higher odds of acknowledgement (OR = 1.123, ) and deflection (OR = 1.259, ), while being associated with lower odds of generic commitment (OR = 0.853, ). One clear implication is that concession and defense can coexist under highly visible pressure. Direct naming and responsibility targeting do not map onto simple submission. They often correspond to an acknowledge-and-defend package in which acceptance and boundary work move together.
The evidence split reveals marked internal heterogeneity. Non-clip general evidence is associated with lower odds of deflection (OR = 0.511, ) and higher odds of specific commitment (OR = 1.828, ). Negative exposure clips are associated with lower odds of deflection (OR = 0.661, ) and generic commitment (OR = 0.585, ). Rectification follow-up clips are associated with lower odds of acknowledgement (OR = 0.323, ). These patterns underscore why evidence cannot be treated as a simple binary category. Different evidentiary forms map onto different parts of the official response space.
Factual specificity also has a more focused pattern than an undifferentiated pressure interpretation would imply. It is not robustly associated with higher odds of acknowledgement or specific commitment, but it is associated with lower odds of deflection (OR = 0.830, ) and sanction-threat language (OR = 0.829, ). When the problem is already more concrete, more locatable, and more verifiable, the space for boundary-based reinterpretation and symbolic downward punishment talk appears to shrink.
The severity control does not eliminate the core findings. It is significantly positive only in the deflection model (OR = 1.126, ), which suggests that more severe problems can themselves be associated with defensive talk. The larger pattern remains intact: emotional intensity, accountability directness, and evidence type each have distinct and nontrivial relationships with response structure beyond a simple projection of issue seriousness.
4.3. Unit-Chain Terminal Models
The unit-chain terminal model captures a limited but substantively meaningful form of chain dynamics. The observation here is the final response of the same unit within the same issue chain, while the key predictors are historical maximum pressure values encountered earlier in that unit-chain. The purpose is not to estimate full step-by-step causal transitions, but to examine whether accumulated peak pressure leaves a trace in the strategic character of the unit’s final on-air statement.
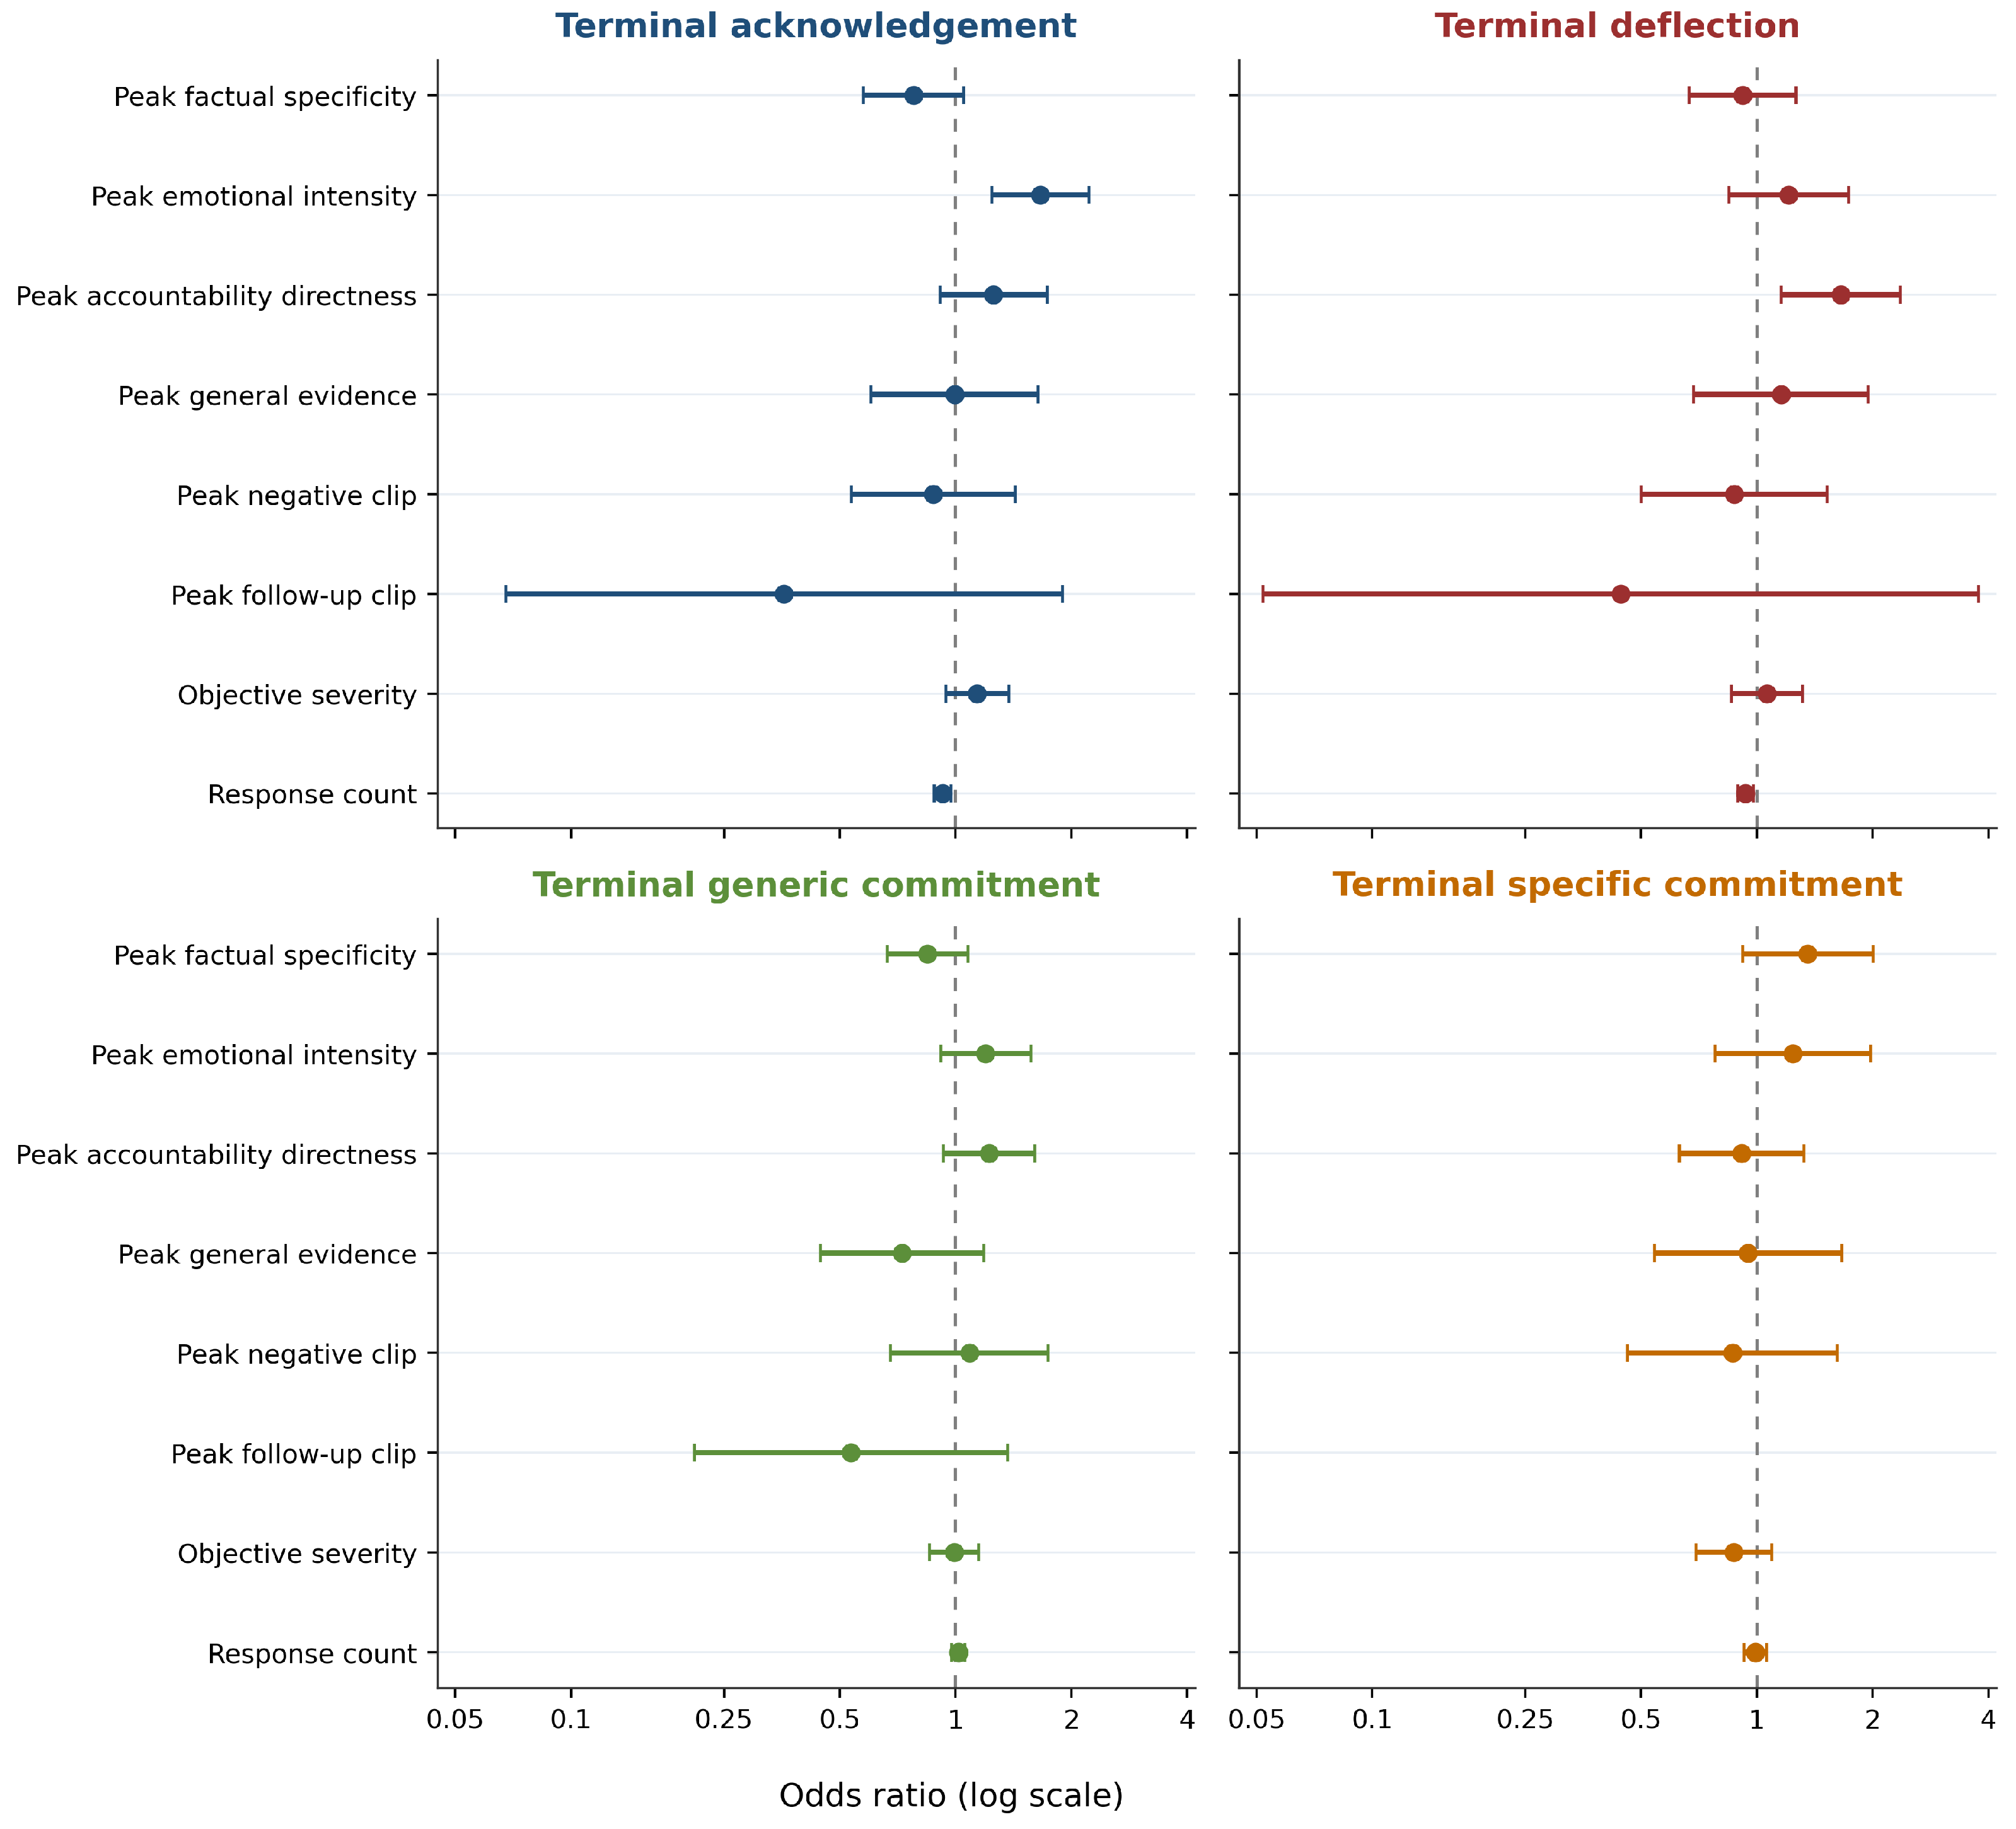
Table 2 reports the corresponding odds ratios, and
Figure 4 provides a compact visual summary.
This model points to a more selective and less linear dynamic than a simple accumulation story would predict. Historical maximum emotional intensity is associated with higher odds of terminal acknowledgement (OR = 1.662, ). Historical maximum accountability directness is associated with higher odds of terminal deflection (OR = 1.655, ). These findings complement the row-level results by suggesting that emotional pressure leaves behind a stronger trace of public acceptance, while accumulated accountability directness is linked to boundary maintenance and responsibility dilution by the end of the chain.
There is, however, little support for the idea that accumulated pressure is reliably associated with terminal specific commitment. The key historical maximum pressure indicators do not yield a stable positive association with terminal specific commitment, and terminal generic commitment is likewise not robustly linked to the core historical pressure terms. Even when pressure is summarized as the highest level previously encountered in the chain, the final response does not follow a simple pattern in which more pressure corresponds to more concrete concession.
The estimates also show that the more times the same unit speaks within the chain, the less likely the final statement is to contain acknowledgement language (OR = 0.925, ) or deflection language (OR = 0.935, ). Longer interaction is therefore not associated with a more comprehensive final statement. One plausible explanation is that final statements become increasingly absorbed into closure scripts, commitment-stage expectations, and end-of-chain formulae as the chain progresses.
The separately reported sanction-threat model shows a similar pattern. Historical maximum emotional intensity (OR = 1.898, ) and accountability directness (OR = 1.933, ) are both positively associated with terminal sanction-threat language, whereas historical maximum factual specificity is negatively associated with it (OR = 0.504, ). This pattern is consistent with the view that intense and directly targeted pressure can sometimes be redirected into downward punitive signaling rather than translated into higher-cost commitment.
Figure 5 compresses the same estimates into a cross-model association grid. The comparison is useful because it makes the contrast between immediate and accumulated pressure visually explicit. Emotional intensity is the most consistent positive correlate of acknowledgement in both panels, while accountability directness is the clearest stable correlate of deflection. By contrast, the terminal panel is visibly sparser than the row-level panel, reinforcing the claim that accumulated pressure leaves a narrower and more selective trace than immediate on-air confrontation.
4.4. Stage Heterogeneity
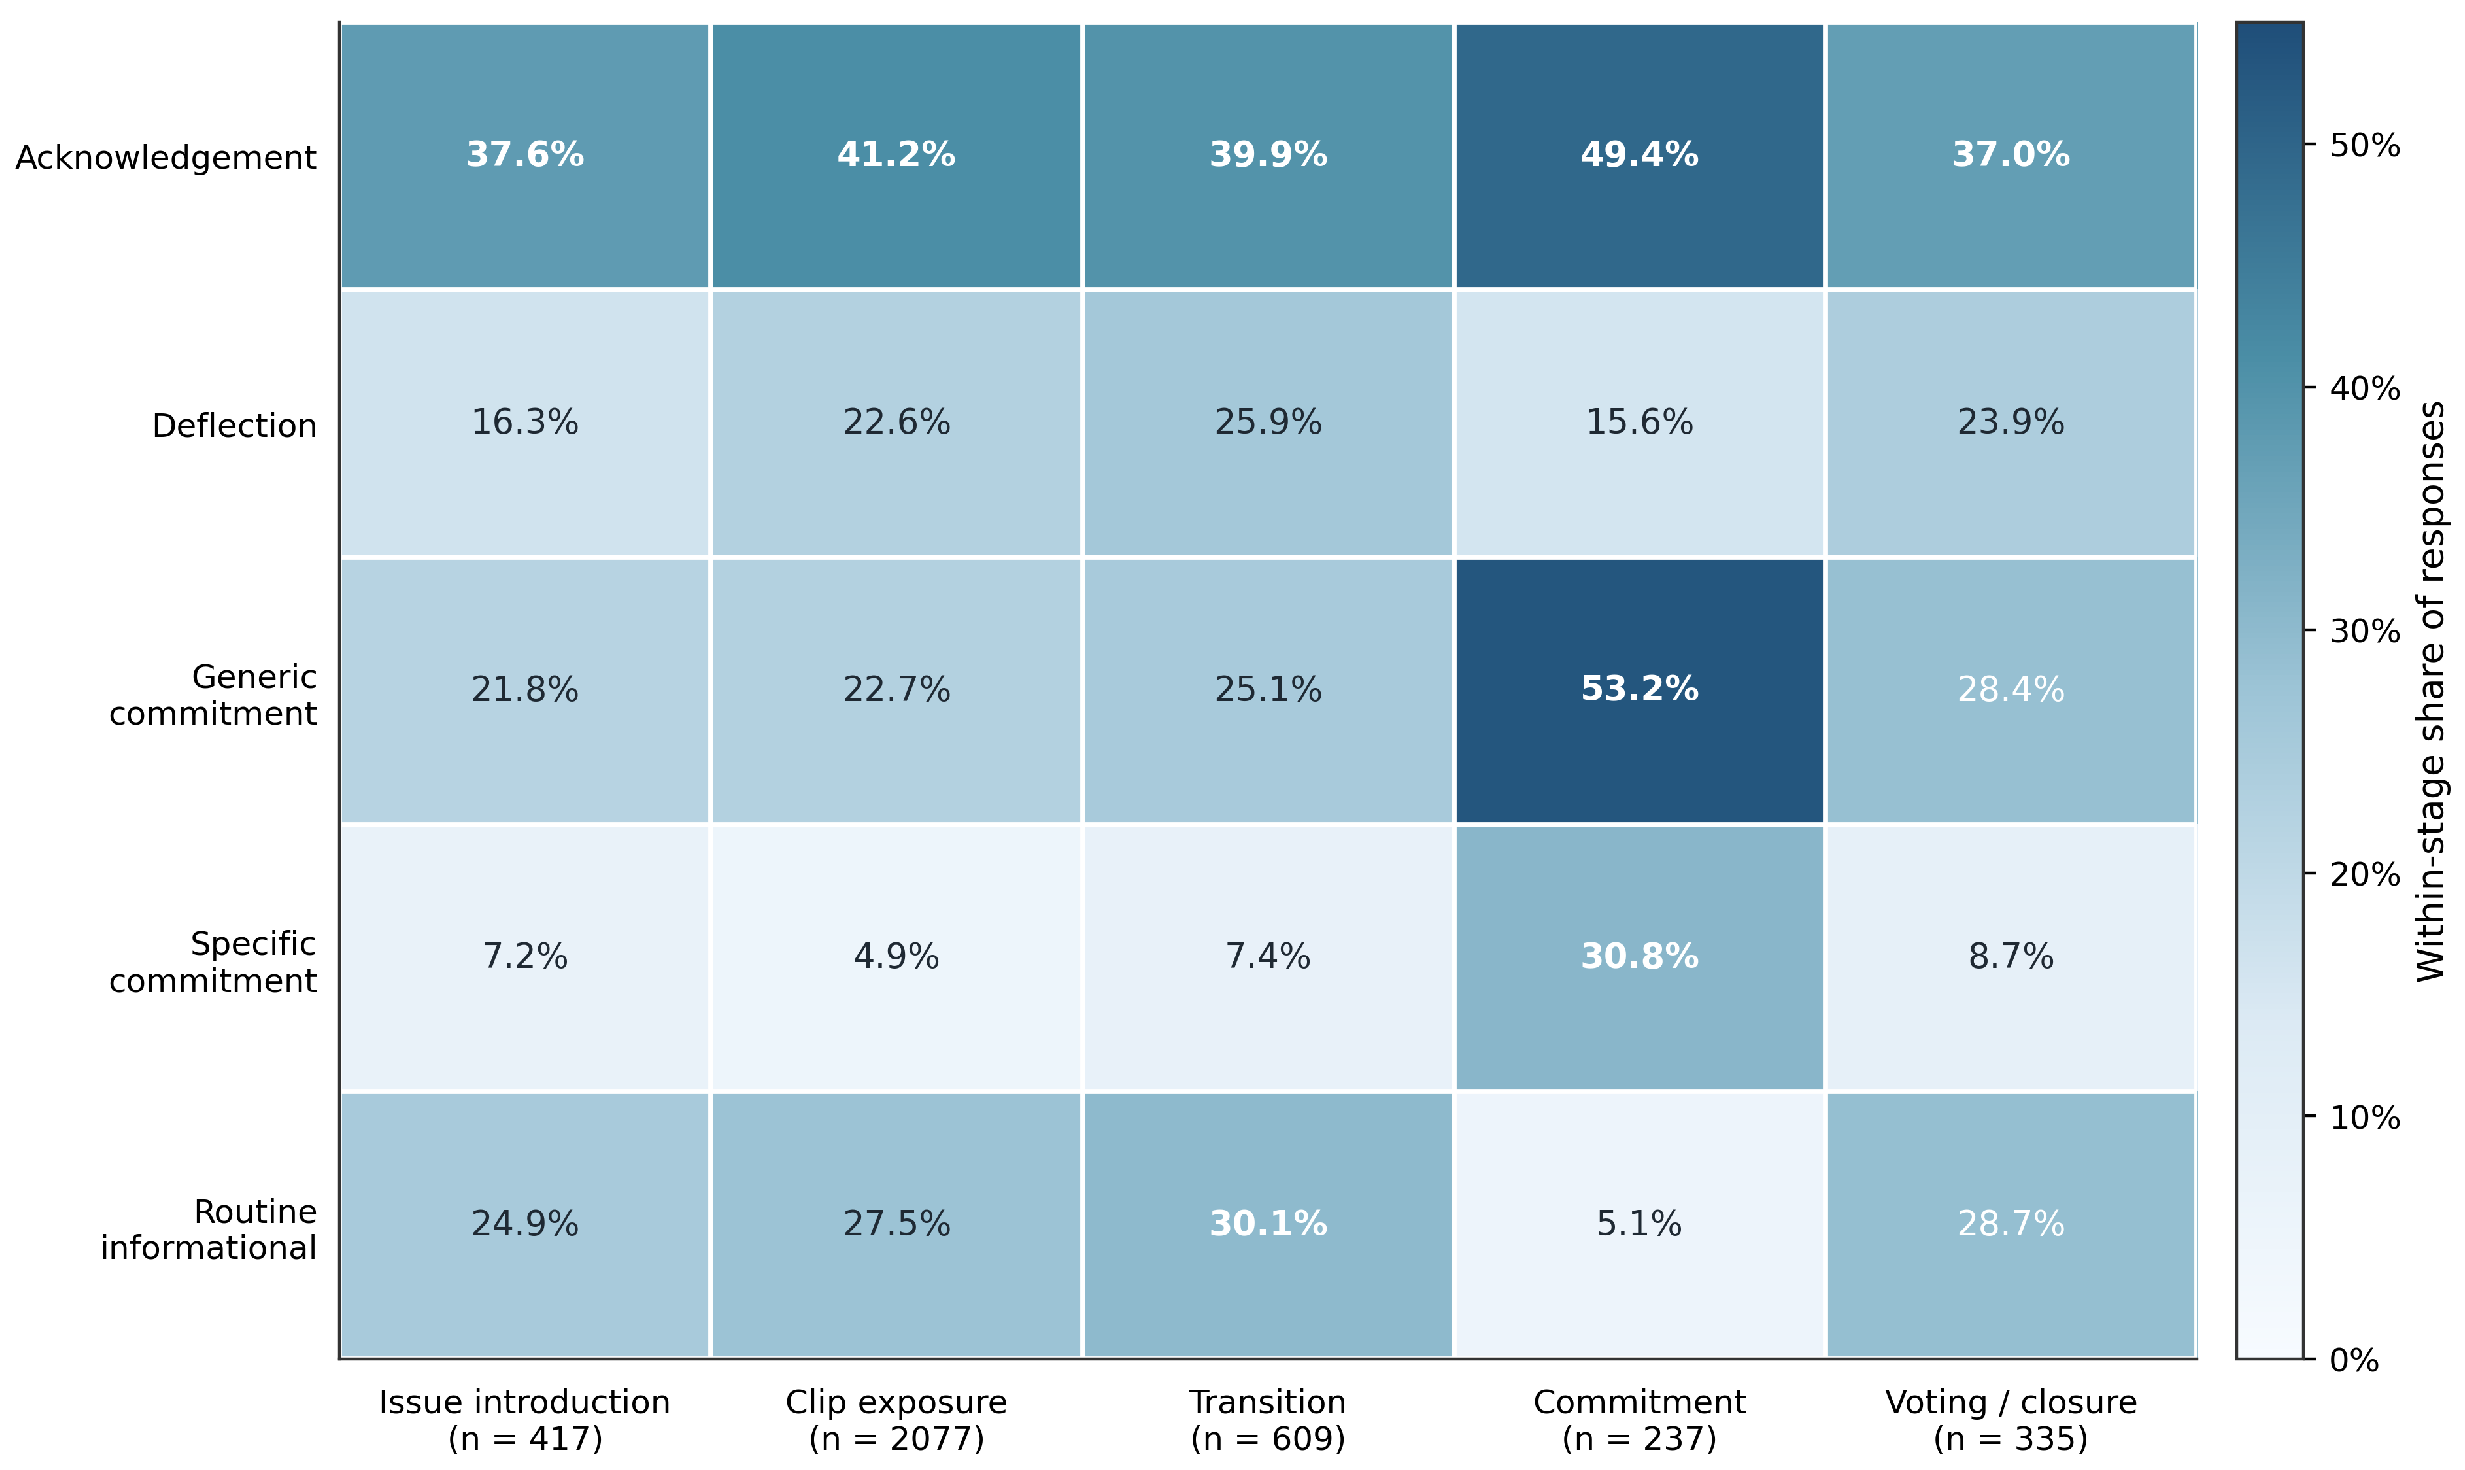
Stage-level descriptive patterns reinforce the claim that not all response types occupy the same place in the program sequence. In the commitment stage, generic commitment reaches 53.2% and specific commitment 30.8%. In the issue-exposition stages, by contrast, specific commitment appears in only 4.9% of responses. Earlier stages are instead dominated by acknowledgement (41.2%), deflection (22.6%), generic commitment (22.7%), and routine informational talk (27.5%). The program thus exhibits strong process dependence: early and middle stages are primarily devoted to pressure input, explanation, defense, and provisional stance-taking, whereas commitment production is concentrated in later stages.
This is particularly important for interpreting specific commitment. If specific commitment is treated as a response form fully parallel to acknowledgement and deflection, one risks overstating its status as an immediate product of pressure. The stage distribution suggests a more cautious reading. Specific commitment behaves partly like a structured output of the program’s later stages rather than a pure contemporaneous reaction to the immediately preceding pressure window. In that sense, the late emergence of specific commitment reflects not only short-horizon strategic adjustment under pressure but also the dramaturgy of televised accountability itself, in which checkable resolutions are often reserved for the concluding commitment segment.
Figure 6 visualizes this stage-specific response structure directly.
4.5. Robustness Checks
The robustness analysis asks whether the core findings depend on one specific stage mix, clustering choice, or chain-level structure.
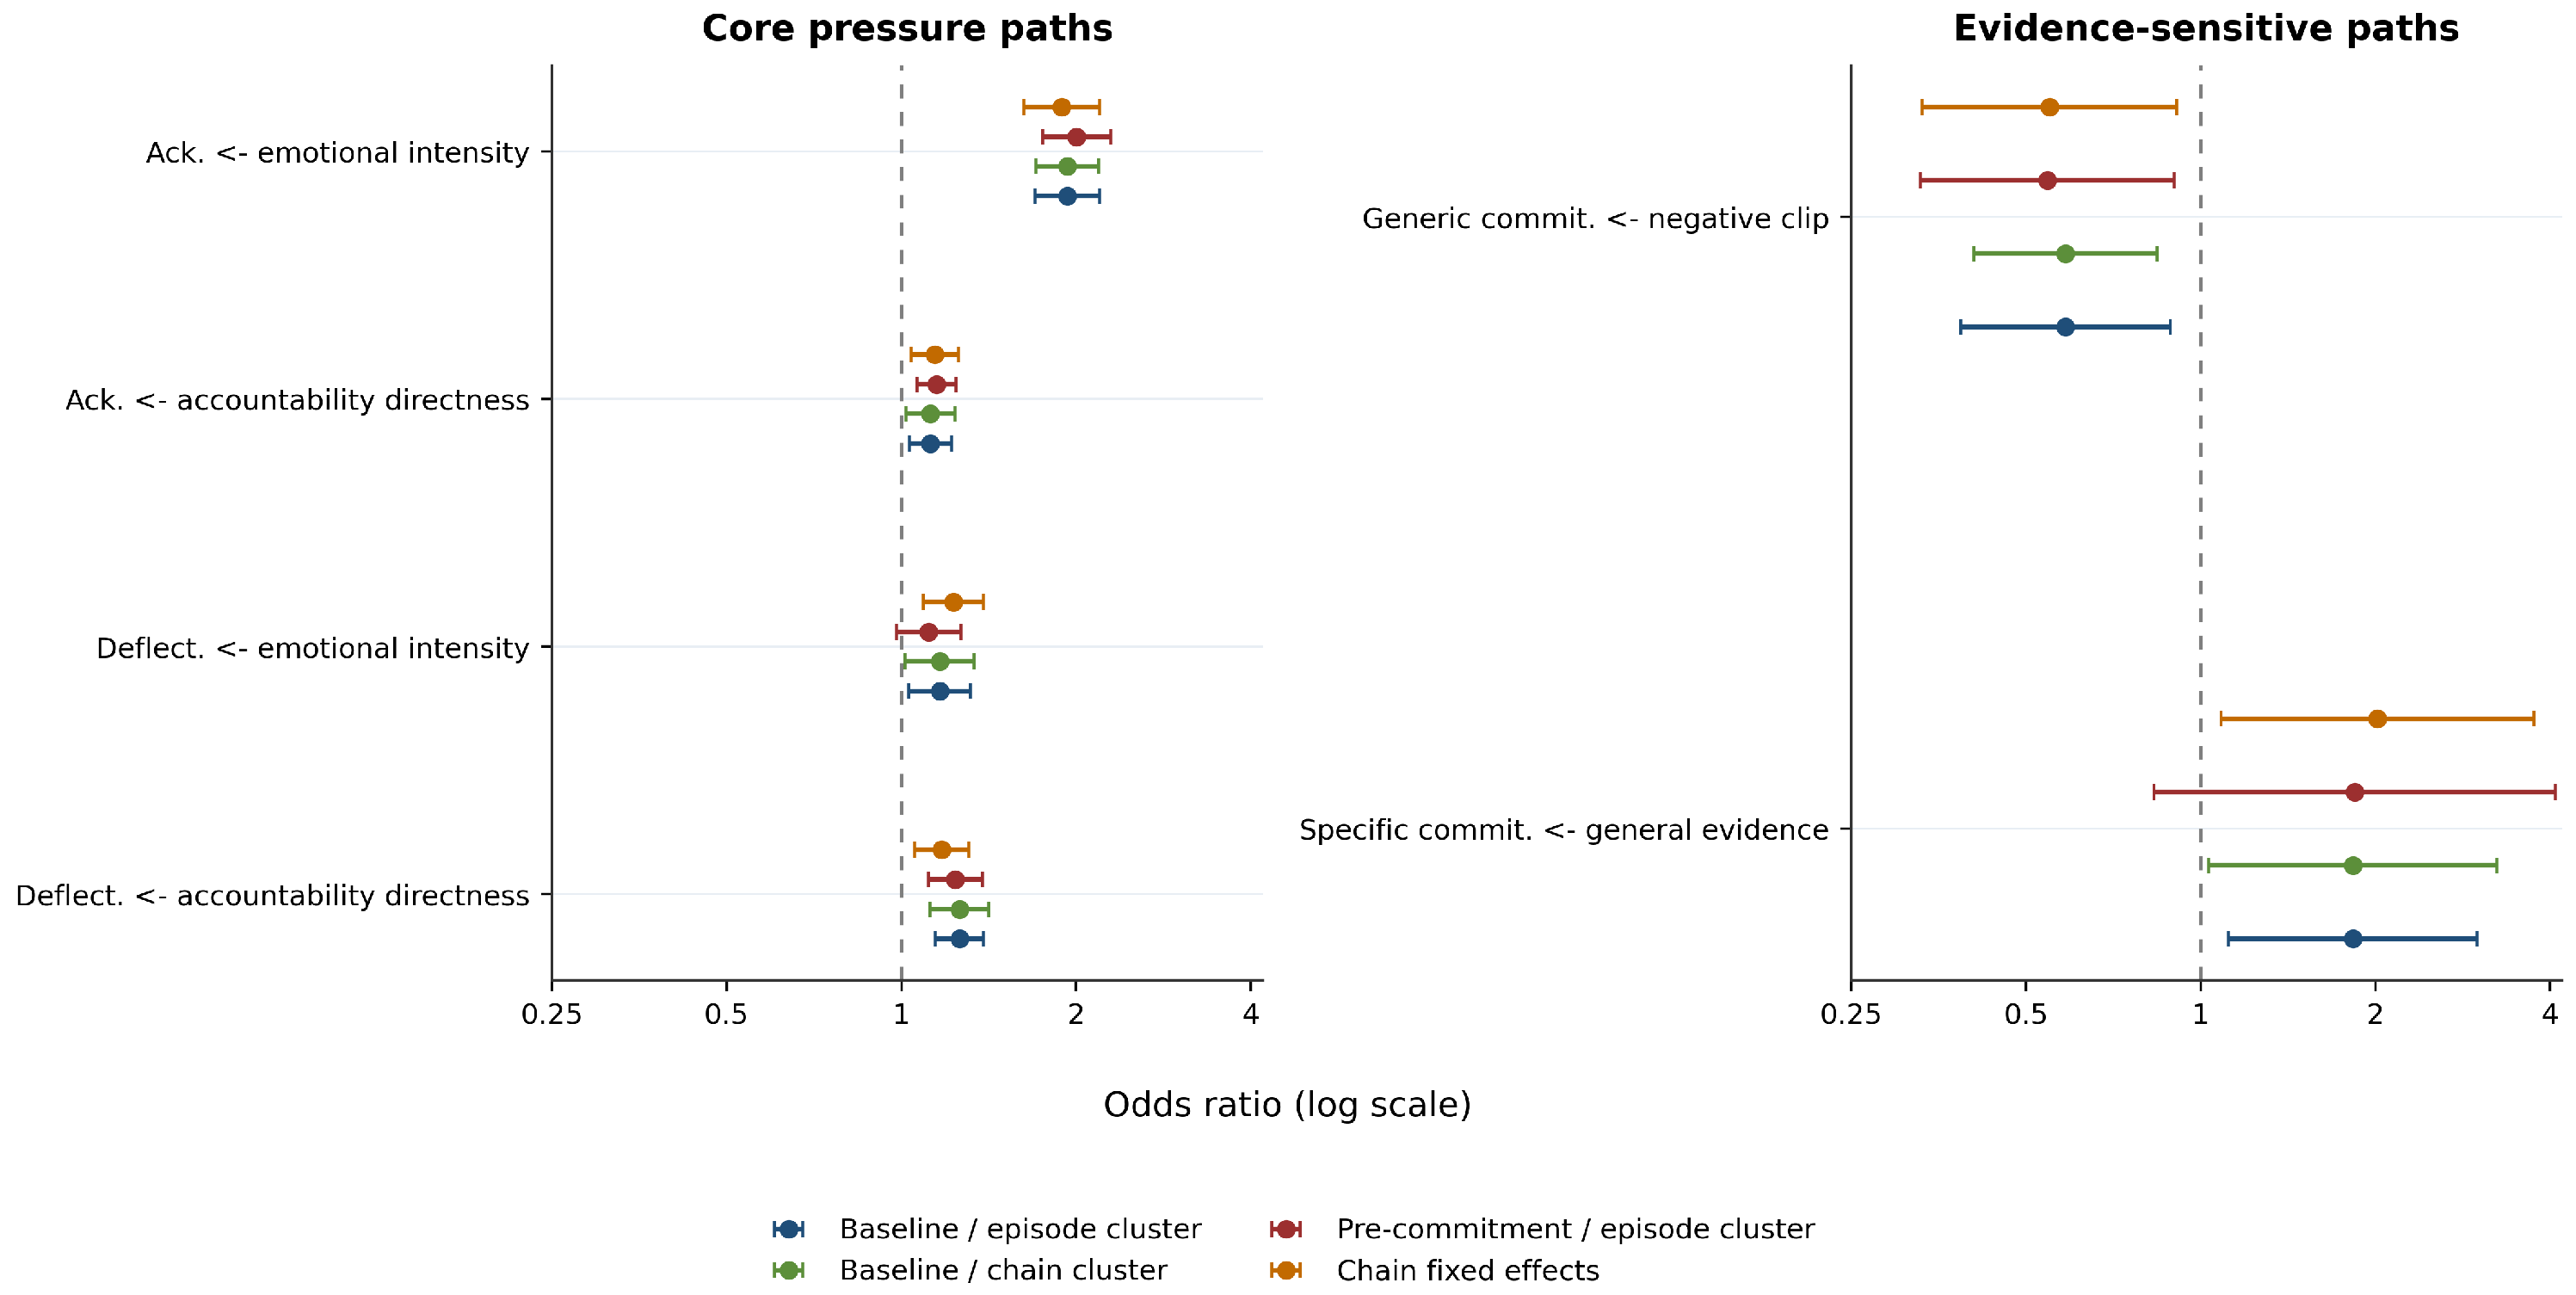
Figure A1 summarizes several of the most consequential comparisons.
When the row-level models are re-estimated on a pre-commitment subsample restricted to the issue-introduction, clip, and transition stages, the positive association between emotional intensity and acknowledgement not only survives but becomes stronger (OR = 2.003, ). The positive association between accountability directness and deflection also remains stable (OR = 1.239, ). These results indicate that the main findings are not simply artifacts of the later commitment stage.
The same holds when the clustering level changes from episode to chain. Emotional intensity remains positively associated with acknowledgement, accountability directness remains positively associated with deflection, and the negative association between negative exposure clips and generic commitment remains significant. The substantive story therefore does not depend on one clustering rule.
The core theoretical relationships also survive when chain fixed effects are introduced. Emotional intensity remains positively associated with acknowledgement (OR = 1.890, ), and accountability directness remains positively associated with deflection (OR = 1.174, ). This is a conservative within-chain test because the fixed effects absorb all time-invariant issue-level features, including stable differences in political sensitivity, problem complexity, and baseline scandal seriousness. This specification cannot remove all omitted-variable concerns, but it shows that the article’s central claims are not driven entirely by between-chain heterogeneity.
A final diagnostic addresses possible reverse feedback from official response to subsequent pressure.
Table A2 shows that prior deflection is associated with higher subsequent accountability directness (coefficient = 0.102,
), prior acknowledgement is associated with higher subsequent emotional intensity (coefficient = 0.117,
), and prior generic and specific commitment are associated with higher subsequent factual specificity (coefficients = 0.186 and 0.243, both
). Some weaker negative associations also appear between prior deflection and later exposure or review clips. These patterns indicate that interactional feedback is present: later pressure can partly respond to earlier official behavior. At the same time, the feedback is selective rather than uniform, and the diagnostic does not overturn the main interpretation of structured pressure-response associations. It is therefore best read as a caution against one-way causal claims, not as a replacement for the main models.
4.6. Sequential Patterns and Discrete-Time Event Histories
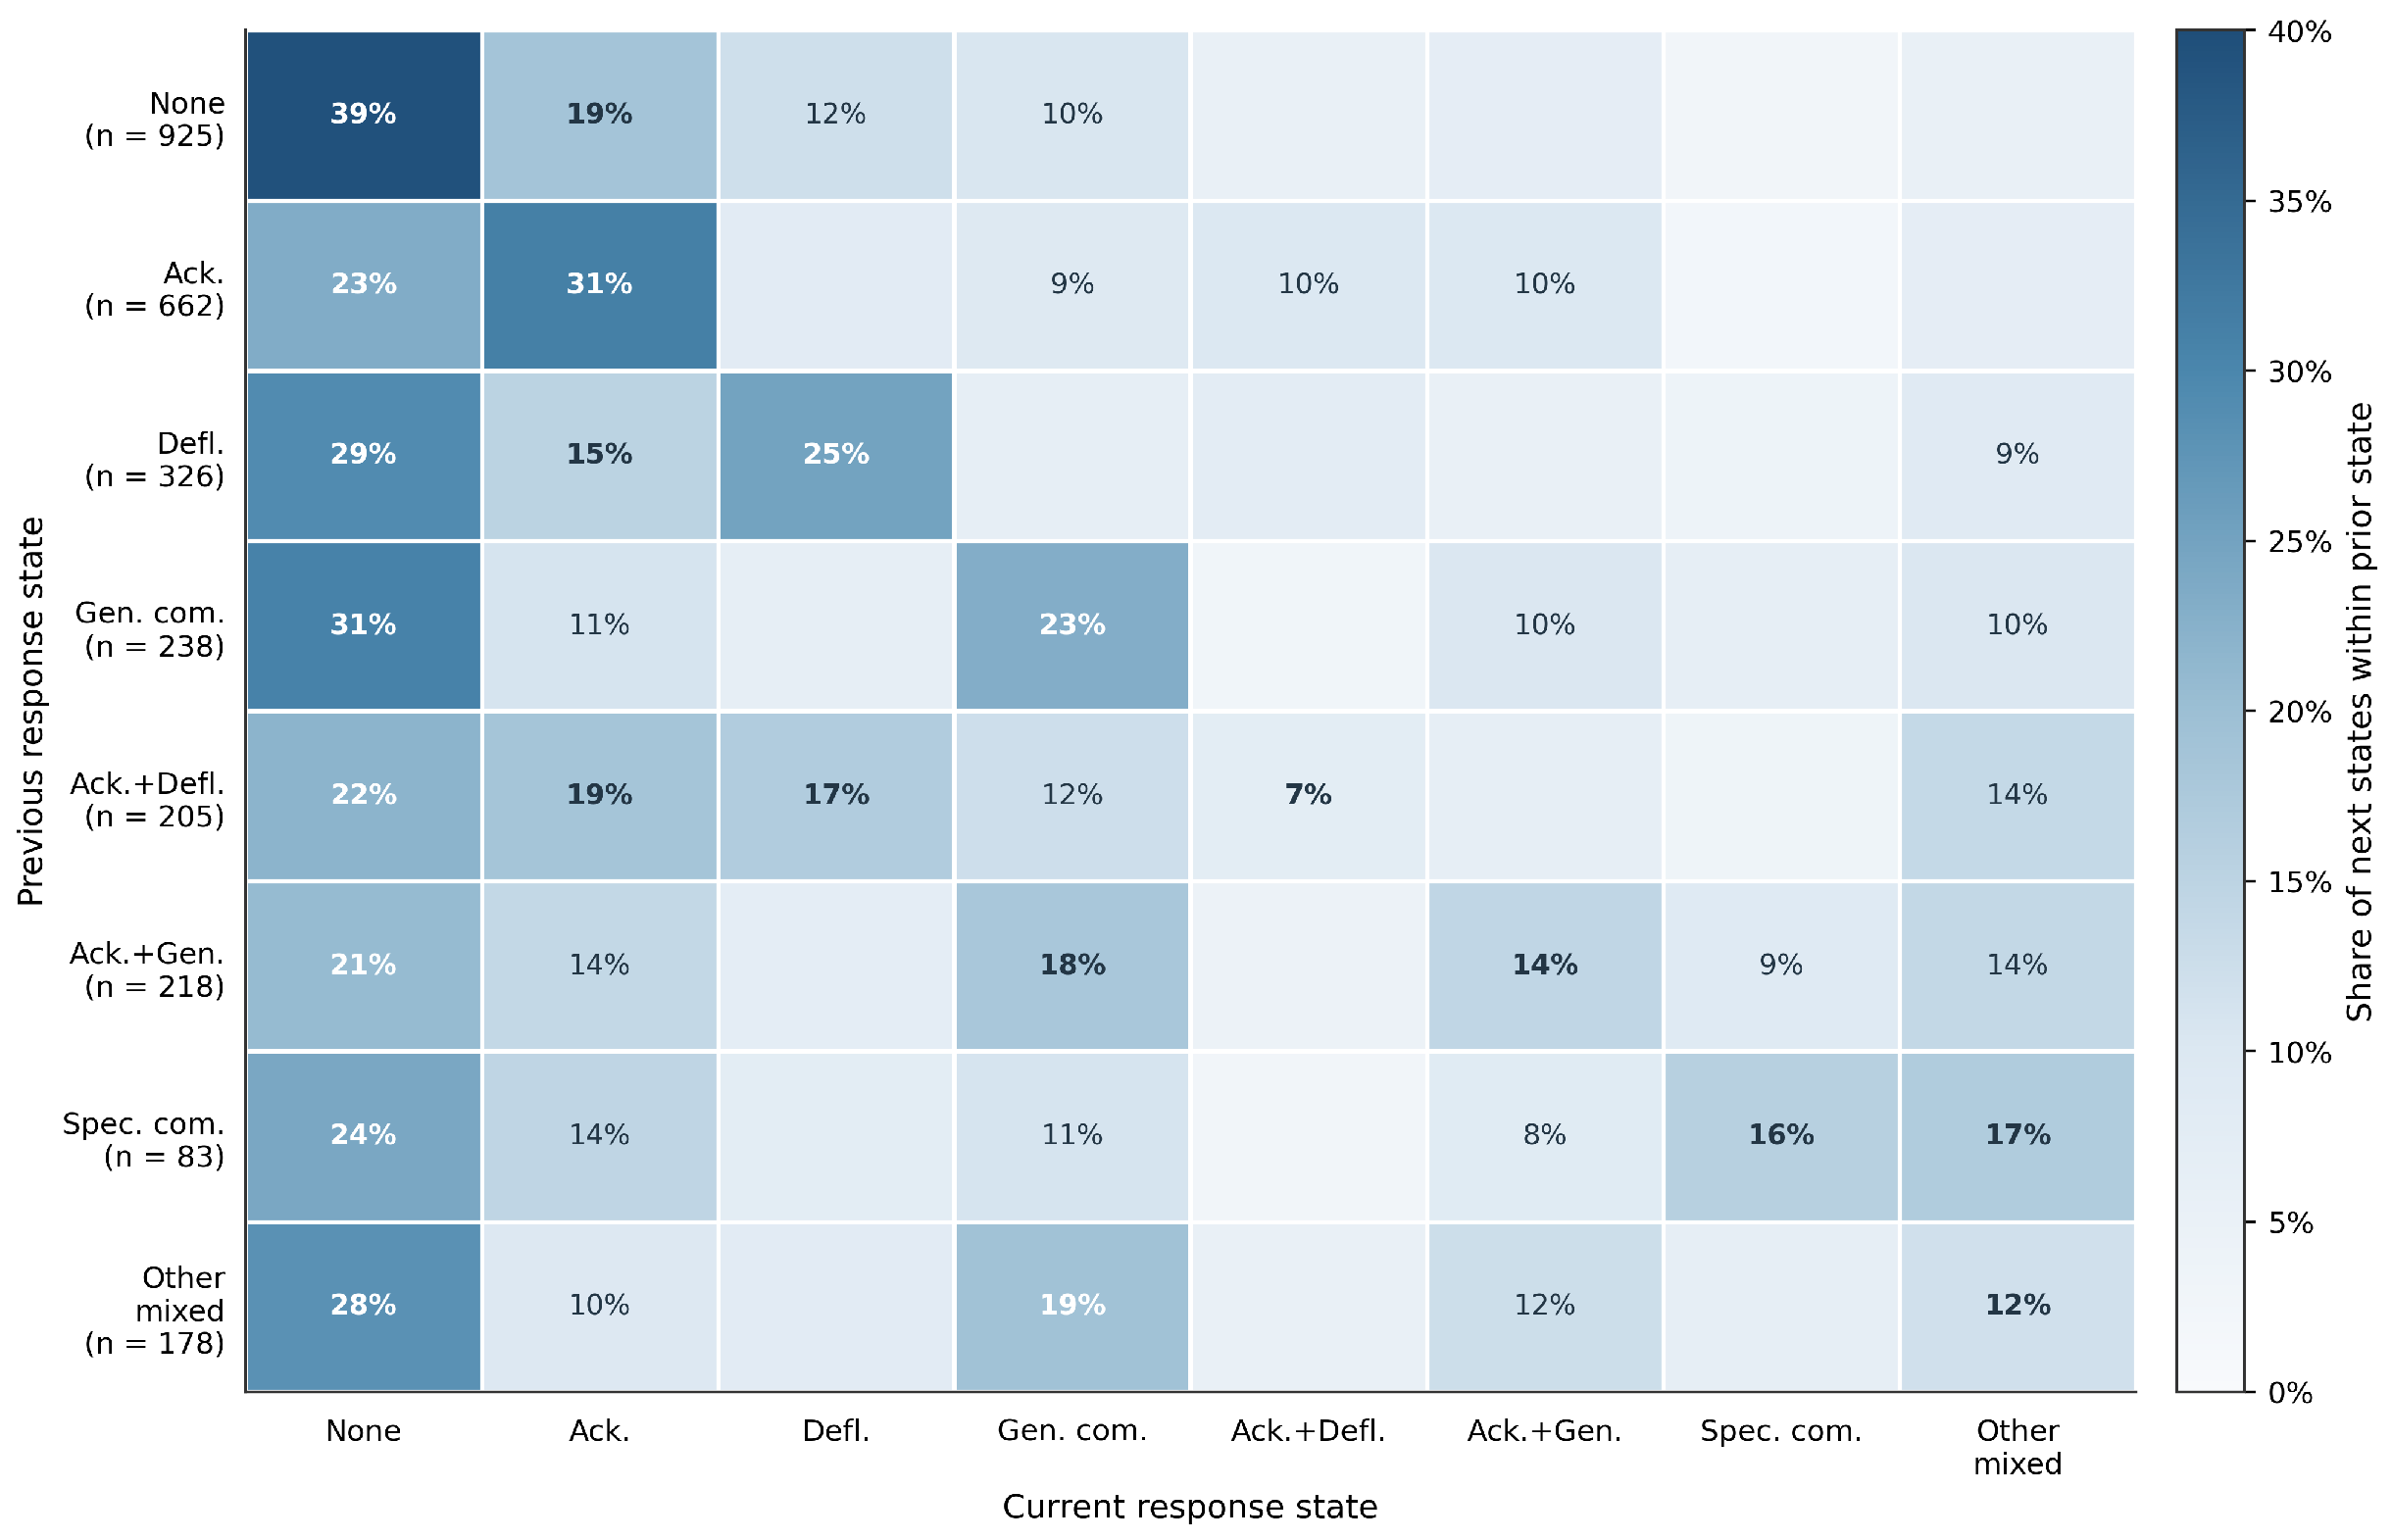
Because the data preserve repeated response order within issue chains, the analysis also examines unit-chains with at least two responses by the same unit. This yields 447 repeated unit-chains and 2835 adjacent transitions.
The most frequent adjacent transitions are 0 to 0, A to A, 0 to A, A to 0, 0 to D, 0 to G, D to 0, and D to D. Here, 0 denotes none of the four core strategies, A acknowledgement, D deflection, G generic commitment, and S specific commitment. The dominance of these transitions shows that repeated official responses do not simply follow a monotonic escalation path. Officials move back and forth between routine response, acknowledgement, and defense rather than progressing mechanically toward ever stronger concession.
Figure 7 adds a fuller row-normalized view of those state changes. Two points stand out. First, the diagonal cells for none, acknowledgement, deflection, and generic commitment remain relatively dark, which indicates meaningful short-run persistence. Second, many off-diagonal moves flow back into the none or acknowledgement states rather than toward specific commitment. The sequential process therefore looks less like steady escalation and more like repeated repositioning under pressure.
The path-specific evidence is also suggestive. When the previous response contains deflection and the current pressure does not include a negative exposure clip, the current-turn visible-concession rate is 38.7%. When the previous response contains deflection and the current pressure includes a negative exposure clip, the current-turn visible-concession rate rises to 63.6%. The exposed cell is small, but the contrast illustrates why sequence matters for interpreting the same pressure cue.
Table 3 reports this path-specific contrast together with the discrete-time event-history models.
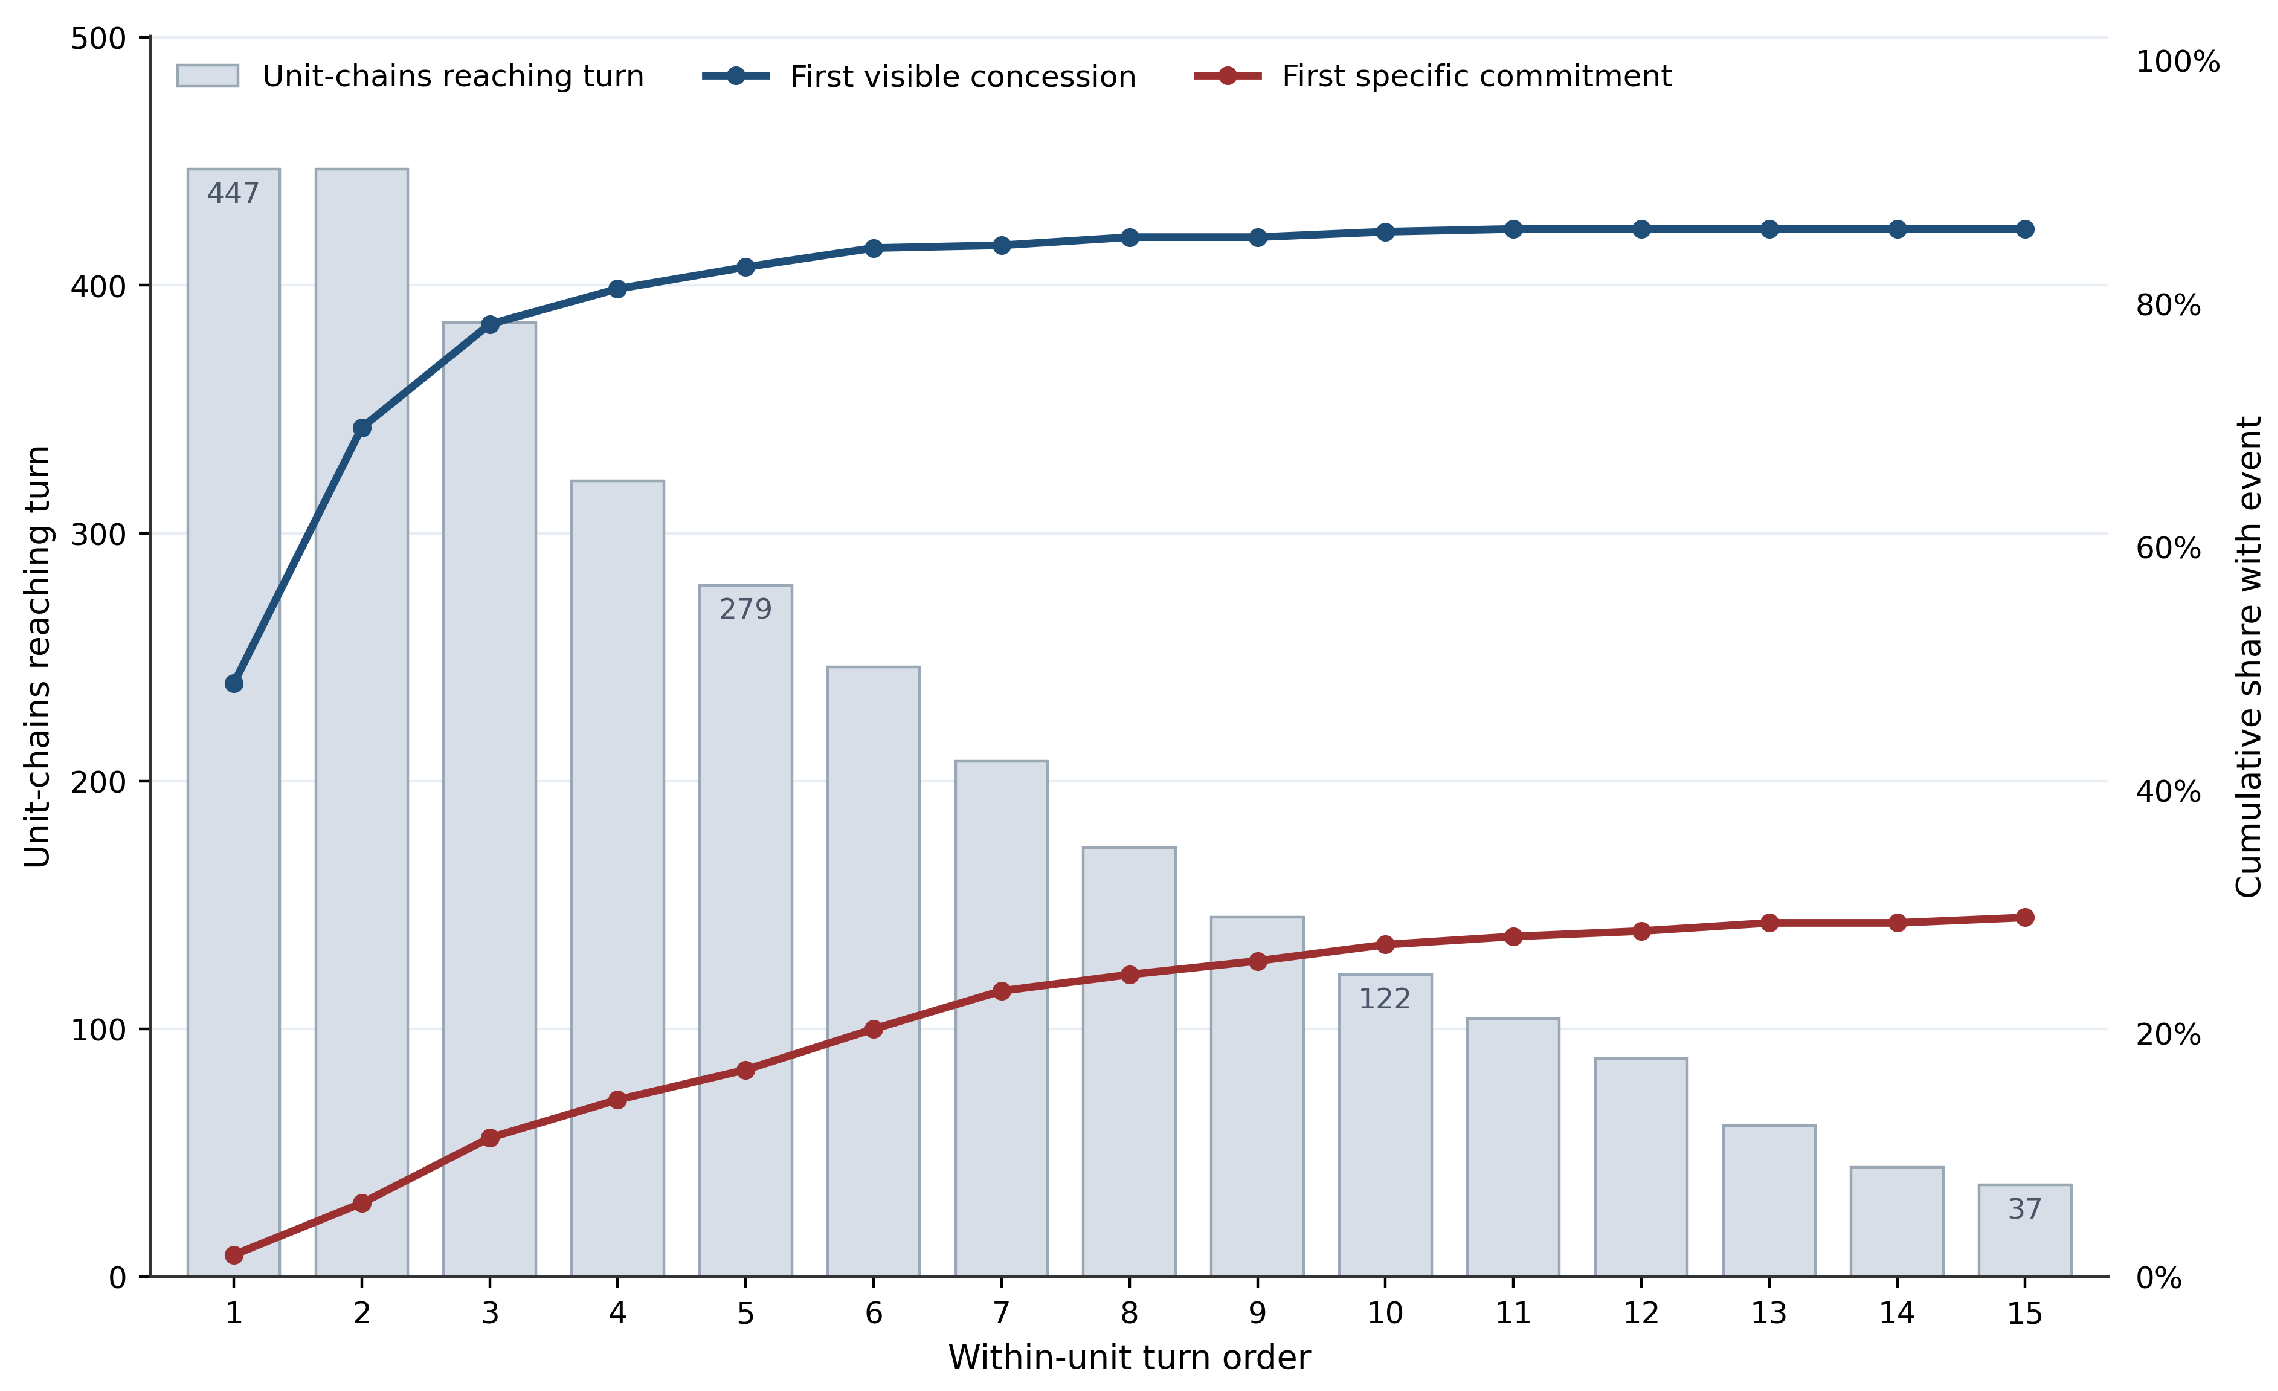
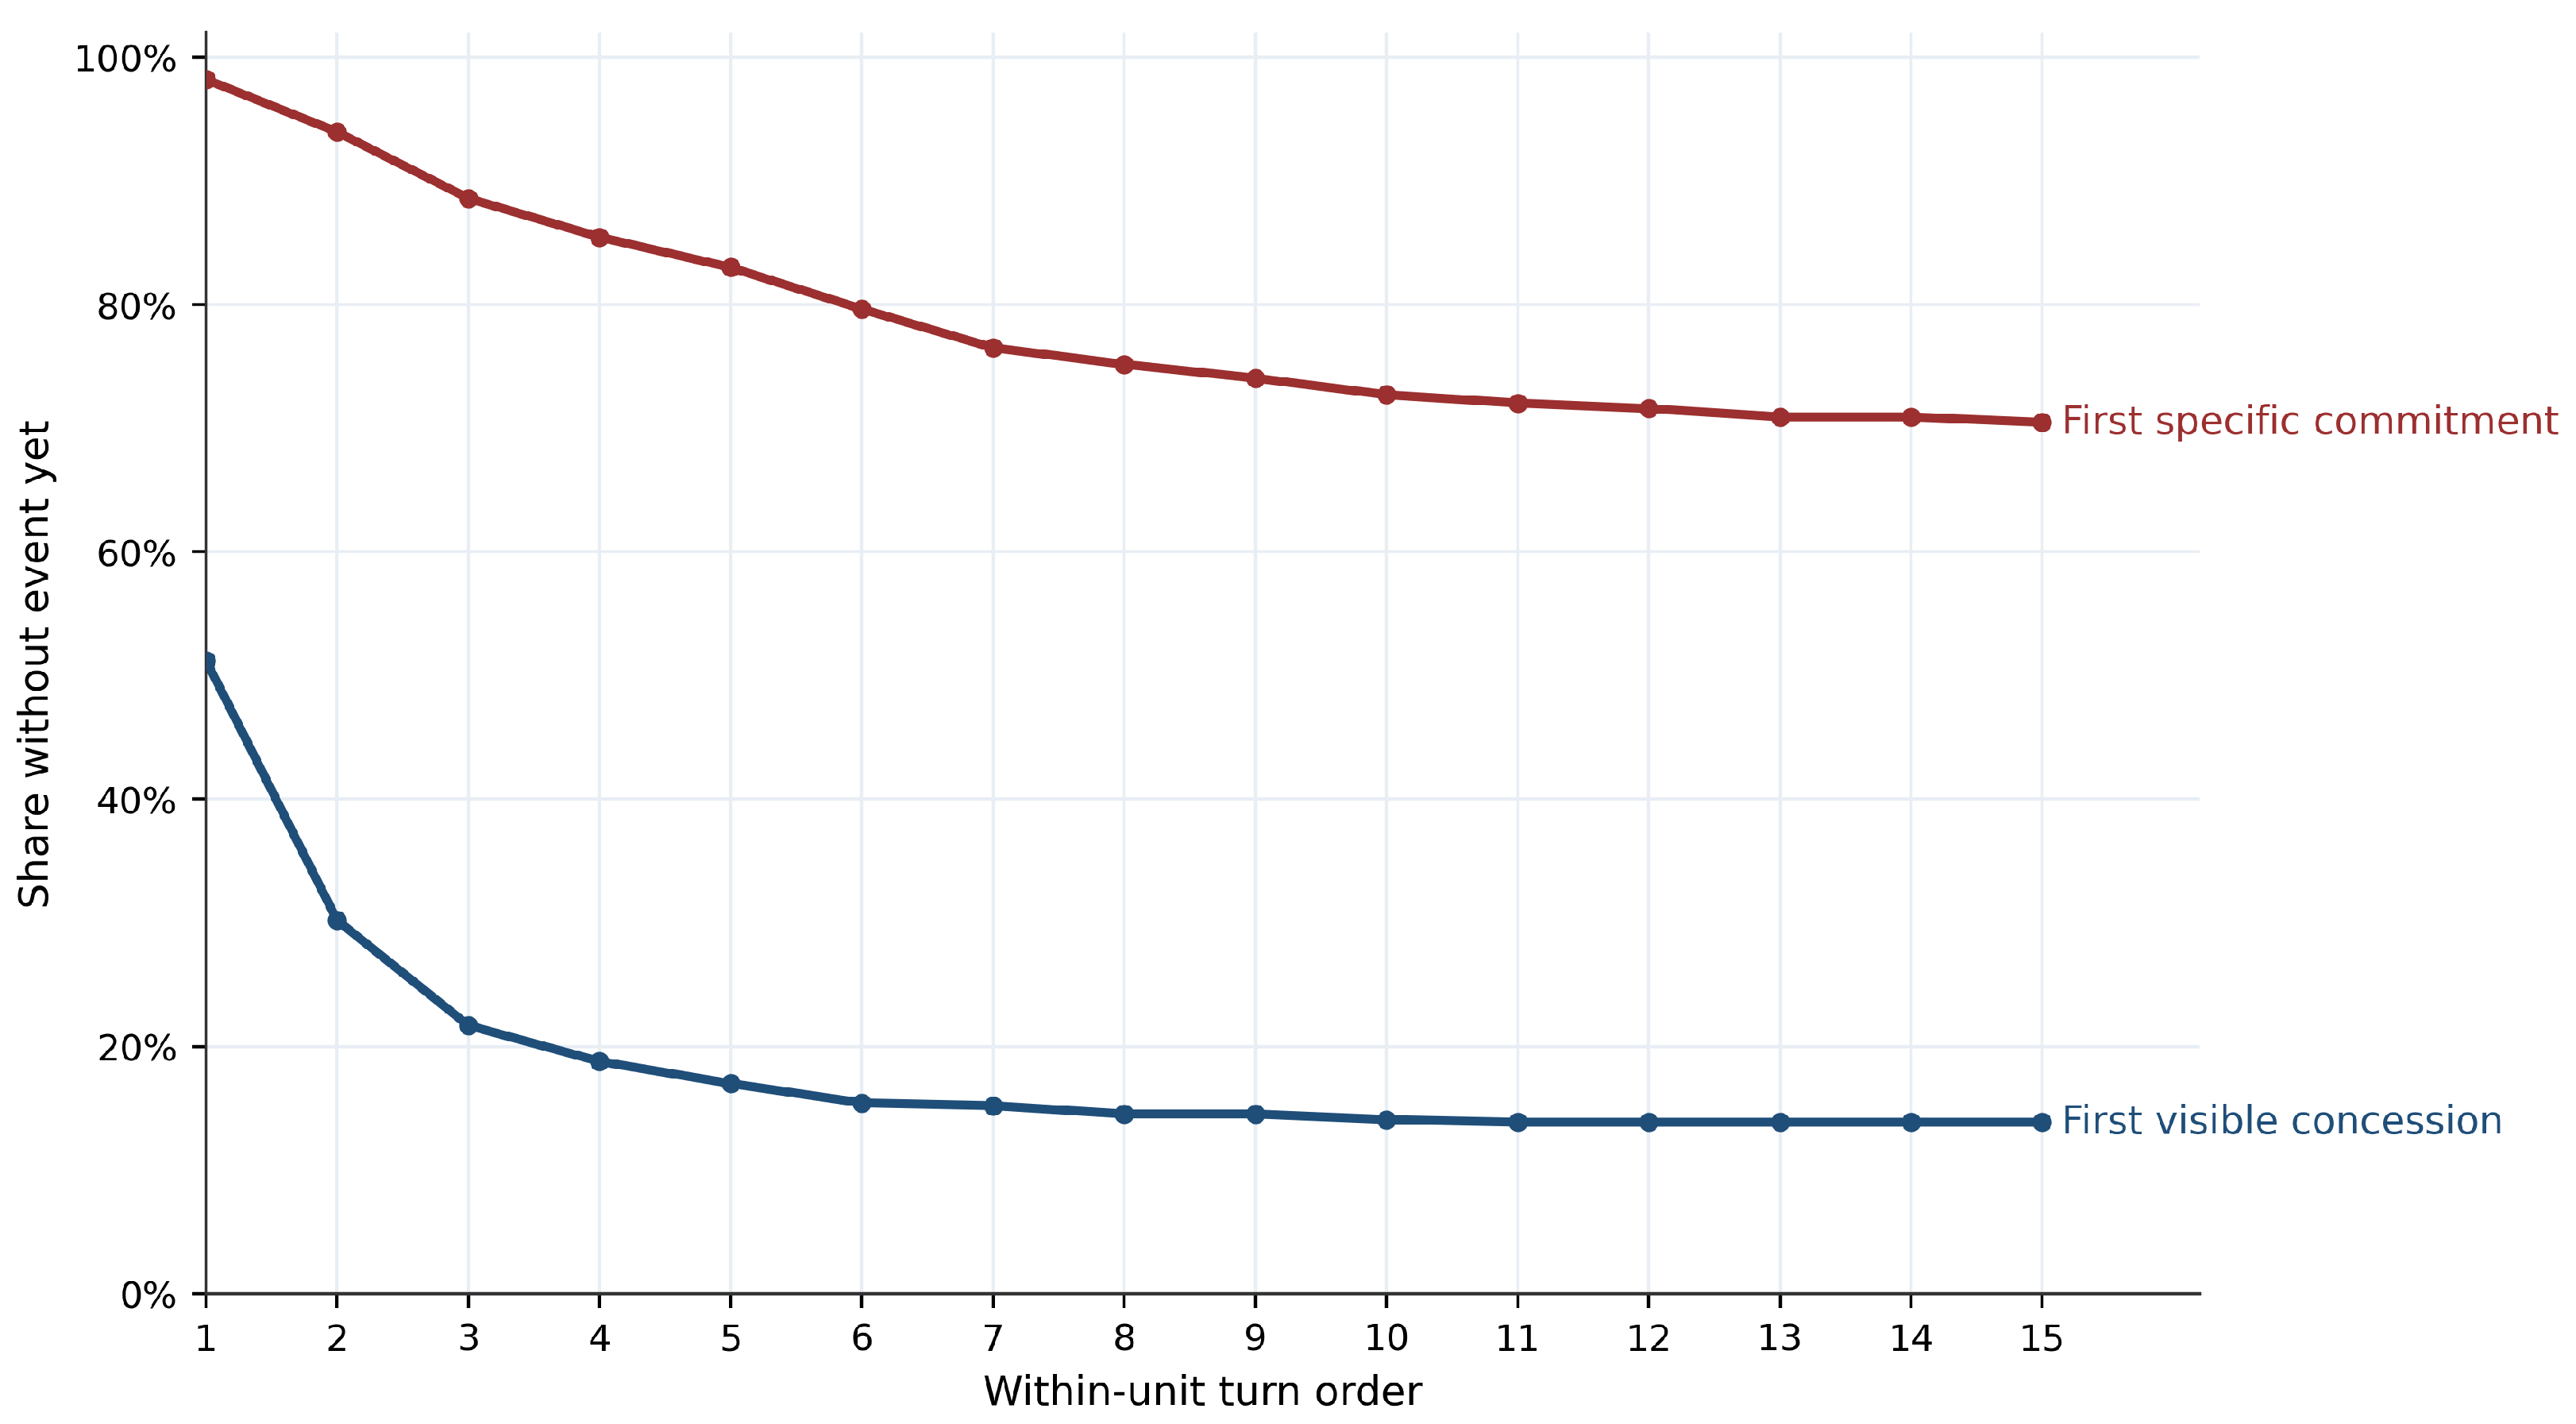
The sequential evidence becomes especially informative in discrete-time event-history form. For first visible concession, defined as acknowledgement or specific commitment, 385 of the 447 eligible unit-chains experience the event, an event rate of 86.1%. The median event turn is 1 and the mean is 1.86. Emotional intensity is associated with a higher hazard of first visible concession (OR = 2.088, ), while the unit’s order within the chain is significantly negative (OR = 0.895, ). Visible concession therefore tends to occur very early, and stronger emotional pressure is linked to faster occurrence.
The pattern is different for first specific commitment. Only 140 of the 447 eligible unit-chains experience the event, an event rate of 31.3%. The median event turn is 5 and the mean is 6.12. Emotional intensity is associated with a lower hazard of first specific commitment (OR = 0.661,
), while the unit’s order within the chain is significantly positive (OR = 1.047,
). Within-chain turn order is, however, highly collinear with programmatic stage progression, so this positive later-turn baseline is interpreted as partly capturing the institutional shift into the program’s concluding commitment phase rather than as a pure temporal clock. This pattern indicates that the kind of pressure most closely linked to immediate public concession is not the same as the kind of pressure linked to higher-cost specific commitment.
Figure 8 adds a descriptive view of this timing pattern by combining chain reach at each turn with the cumulative incidence of the two first-event outcomes.
Figure 9 presents the corresponding survival curves for the two first-event outcomes.
5. Discussion
The results speak to public accountability and to wider debates on systemic governance in data-mediated urban settings. Smart-governance and public-value research has emphasized that accountability depends on the configuration of information flows, organizations, and civic-facing interfaces [
15,
16,
18]. The Nanning evidence adds a response-level view of that configuration. What matters here is not simply whether an official sounds cooperative, but what kind of public response is produced by a staged oversight interface under visibility, time constraint, and reputational threat. Chinese research on televised and mediated governance similarly treats these formats as organized governance processes rather than as simple acts of disclosure [
20,
21,
22]. In that sense, the main finding is that public pressure redistributes response across acknowledgement, defense, and commitment instead of converting directly into substantive correction.
5.1. Systemic Pressure and Visible Adjustment
The clearest result is that emotional intensity does not simply make officials more compliant. Classic work on blame avoidance explains why public officials have incentives to combine concession with responsibility management [
28,
30], and discursive accounts further show that acceptance, justification, distancing, and responsibility shifting can appear in the same public response [
53,
54]. The Nanning models show this mixed pattern directly. Emotional intensity is associated with higher odds of acknowledgement, deflection, and generic commitment while being associated with lower odds of specific commitment. An additional pattern for sanction-threat language points in the same direction: visible pressure can be partly absorbed by redirecting punitive signals toward subordinate actors. Emotional escalation therefore corresponds to more immediate strategic activity rather than moving officials in one uniform direction.
A plausible interpretation is that highly emotional pressure compresses the decision space and increases the value of immediate encounter management. Research on social-evaluative threat, coping, threat rigidity, and decision-making under stress provides a useful interpretive lens for this pattern [
35,
36,
37,
38]. In the present data, acknowledgement can reduce immediate interpersonal tension, deflection can protect the self or organization, and generic commitment can defer resolution to a safer future point. Specific commitment, by contrast, requires more precise forward planning and a more checkable public pledge, which helps explain why it is less common under acute emotional pressure.
The sequence evidence reinforces this interpretation. Work on media events and mediatized political communication treats public performance as structured sequence rather than free exchange [
32,
33,
34]. In the Nanning setting, emotional intensity is associated with a higher hazard of first visible concession but a lower hazard of first specific commitment. Emotional pressure is therefore more closely tied to on-air concession in the sense of visible acknowledgement or surface accommodation. It does not automatically correspond to high-cost, checkable commitments.
The results also clarify the double-edged nature of accountability directness. Direct responsibility targeting is associated with acknowledgement and deflection at the same time, and in the terminal model its cumulative maximum value remains associated with final deflection. When a host or clip explicitly identifies responsibility, officials face stronger response pressure. But the modal response is not simple submission. It is a mixed package in which acknowledgement coexists with boundary work, coordination claims, or shared-responsibility language.
In this case, highly visible naming does not collapse bureaucratic defense into pure confession. Comparative work on blame games and boundary work is useful here because it treats public responsibility claims as relational and contested rather than automatic [
31,
56]. Direct responsibility targeting raises the interpersonal and reputational stakes of the moment, which can make a defensive response package more likely even when some acknowledgement is unavoidable. The televised scene therefore reveals not a clean shift from denial to honesty, but a more complex coexistence of concession and defense under intense public visibility.
5.2. Constraint, Evidence, and the Limits of High-Cost Commitment
If emotional intensity mainly corresponds to response activation, factual specificity and evidence appear to work more by narrowing the available maneuvering space. Work on transparency and blame avoidance has long warned that visibility can coexist with strategic responsibility management [
29,
30]. The present findings specify one condition under which that room narrows: factual specificity is associated with lower odds of deflection, negative exposure clips are associated with lower odds of deflection and generic commitment, and non-clip evidence is associated with higher odds of specific commitment. These results also support the interpretation of generic commitment as a form of temporal blame displacement. Vague future-oriented promises are most useful when immediate pressure can still be absorbed rhetorically; once a problem is framed in more concrete, verifiable, and documentable terms, that room shrinks.
The evidence split is therefore essential. A negative exposure clip, a rectification review clip, and general documentary evidence all count as evidence in a broad sense, but they do not work in the same way. Negative clips seem especially effective at limiting low-information verbal maneuvering. General non-clip evidence is more closely associated with specific commitment, likely because it is often tied to named targets, documents, data records, dates, lists, or procedural traces that create a more stable factual anchor. A video clip can be powerful and morally vivid, but it remains a staged, selected, and formatted presentation of the problem, a point consistent with work on media events and mediatized political communication [
32,
34]. That form of evidence may leave officials more room to dispute representativeness than documents, records, or named procedural traces do. Documentary or data-based evidence is less easily reframed as a visual impression alone, and this interpretation fits wider data-governance work that treats information flows as structuring accountability and public value arrangements [
16,
18]. It can narrow the reply space by making the object of rectification easier to name and the later promise easier to check. Treating all evidence as one binary input would flatten the heterogeneity that matters most in this setting.
The timing evidence also helps explain the row-level results. First visible concession usually occurs early, with a median turn of 1. Specific commitment appears much later, with a median turn of 5. The two events therefore occupy different parts of the interaction: one is immediate and publicly visible, whereas the other is rarer, later, and more dependent on continued program progression.
This timing pattern also helps explain why emotional intensity is associated with higher odds of acknowledgement and generic commitment but lower odds of specific commitment. The literature on mediatization emphasizes that political communication is shaped by staged formats, phases, and media logics [
32,
33]. In this case, emotional escalation is linked to a quicker shift into visible response, but not directly into high-cost commitment. Specific commitment depends much more heavily on later-stage interaction, stage-specific expectations, and, in some cases, harder evidence. High-cost commitment is therefore not simply a delayed by-product of pressure. It is also an institutional product of the televised sequence, where the program format helps determine when checkable commitments become speakable.
This does not mean that pressure is irrelevant for specific commitment. Non-clip evidence is positively associated with it. The broader pattern, however, suggests that specific commitment is not mainly an immediate function of preceding pressure. It is a later-stage structured output shaped by program sequence, response turn order, and only some pressure types. In this setting, specific commitment is more valuable than generic commitment, but it is not equivalent to accountability success.
This interpretation also aligns with systems-oriented work on smart-city governance. Studies of smart public services and big-data-assisted urban governance emphasize how performance depends on the configuration of services, data, and stakeholder relations across the wider interface [
26,
81]. In systemic-governance terms, visibility is therefore not a neutral transparency input. It is a structuring force that can increase legible response without guaranteeing higher-value response.
These results do not directly measure officials’ internal states. They show a narrower pattern: observed responses in a high-visibility bureaucratic setting are consistent with short-horizon adjustment under public pressure, and this account helps explain why emotional escalation broadens visible response while failing to produce more frequent high-cost commitment.
5.3. Implications for Systemic Accountability and Public Value in Smart-City Governance
Televised accountability is better understood as a governance interface than as a simple transparency device. Smart-city governance research makes a similar move when it analyzes the relationships among technology, organizational arrangements, public information, and civic-facing interfaces [
14,
15,
59,
60]. Public value governance scholarship likewise treats public value as a product of institutional arrangements and multi-actor problem solving, not managerial output alone [
2,
6]. Televised accountability links media production, evidentiary presentation, bureaucratic hierarchy, and public evaluation in one staged sequence. Within that interface, the observed pattern is not one uniform response to pressure, but a redistribution of output across different response components. Emotional pressure is associated with broader visible response, but not in a way that reliably corresponds to the most substantively costly output. This helps clarify how systemic accountability can generate legibility and movement without necessarily generating high-cost commitment.
The accountability implication is that televised oversight strengthens answerability more clearly than it proves accountability effectiveness. Bovens’s actor–forum formulation is helpful here: officials are made to answer before a forum, but the forum is composite, with hosts, viewers, municipal superiors, and later administrative follow-up all partly present [
7]. That structure explains why visibility can produce immediate acknowledgement and defense together. Mulgan’s warning against treating accountability as a loose synonym for responsiveness is also important [
8]. The Nanning results show responsiveness under public questioning, but they do not show that every response produces sanction, correction, or learning. Evaluated against the democratic, constitutional, and learning functions of accountability, the program’s strongest observed effect is to make official answer-giving visible and sequentially traceable; its weaker point is the selective and delayed production of checkable commitment [
9,
10].
Informational architecture matters as well. Accountability and blame management need to be analyzed together with the arrangements that make response publicly visible. Factual specificity and evidentiary form do not simply add more pressure. They change the structure of the reply space itself. Concrete documentary inputs narrow room for rhetorical maneuvering, whereas some forms of exposure mainly force immediate visible adjustment. This bears directly on current debate over urban accountability, because oversight quality depends not only on whether exposure occurs, but also on how information is curated, staged, and sequenced. The same point carries over to smart-city governance. Research on big data, open government data, and data-driven accountability links public value to the movement of information across organizational boundaries [
16,
17,
18,
26]. The Nanning results suggest that complaint signals need to be converted into replies specific enough to support later verification, coordination, and learning.
The public value implication is equally specific. Moore’s account directs attention to whether public action connects a value proposition to authorization and operational capacity, while Bozeman’s work warns that visible activity can still coexist with public-value failure when public values are weakly articulated, aggregated, or sustained over time [
1,
3,
4]. If visible accountability is mainly associated with quick acknowledgement, mixed defense, and generic commitment, then system performance cannot be judged solely by whether officials respond on air. A more demanding standard asks whether the oversight interface produces responses that are specific enough to support later verification, follow-up, and learning. On that criterion, the Nanning case suggests both the value and the limit of public exposure: it is linked to greater legibility and movement, but it does not by itself guarantee higher-quality commitment.
The distinction between symbolic accommodation and checkable commitment therefore has broader implications for mediated accountability arrangements. For public value creation, a generic promise can preserve the appearance of action while leaving the link among public purpose, authorization, and operational capacity underspecified. A specific commitment does not prove that public value has been created, but it gives later actors a more determinate object around which implementation, verification, and operational adjustment can be organized [
1,
3,
5]. For governance legitimacy, the televised interface can demonstrate that grievances have been heard and that officials are publicly answerable, a function that is especially important in managed participatory settings [
46,
52,
58,
62]. Yet legitimacy grounded only in visible responsiveness remains fragile if response does not become checkable. For institutional learning, the key issue is whether the public account creates a traceable object for later questioning, correction, and feedback. Specific commitment is analytically important because it is the response form most likely to leave such an object, even though the present study cannot verify whether the object is later acted on [
9,
10,
77]. This distinction is therefore not only a measurement issue; it identifies a core systems-governance problem: whether public visibility can be converted into accountable follow-up, institutional learning, and public value.
Sequence and feedback deserve equal attention. The distinction between early visible concession and later specific commitment matters because it separates two governance problems. One concerns how the interface manages the immediate encounter under public scrutiny. The other concerns when it yields a more checkable and costly response mode. The timing of accountability output is therefore part of the governance process rather than a secondary detail. Adaptive governance research stresses learning and adjustment over time [
77], while sequence analysis gives a vocabulary for identifying path-dependent ordering in social processes [
80]. The Nanning sequence results fit that logic: immediate concession is often part of managing the public moment, whereas specific commitment is more likely to emerge later, under stronger factual and evidentiary constraint and under stage-specific expectations. This connects the findings to systemic governance in complex urban settings: evidence flows, staged interaction, hierarchical pressure, and public evaluation interact over time, so the quality of accountability depends on the response pathway that the interface activates rather than on visibility alone.
This interpretation also clarifies the balance between theatrical accountability and authoritarian responsiveness. The televised format can work as a partial safety valve: by drawing grievances into a managed media sequence, it channels social pressure into acknowledgement, explanation, and symbolic movement. Work on Chinese media politics shows that public communication may reduce or intensify pressure depending on how agenda control and publicity interact [
58]. But the format is not merely a safety valve, because it can also place concrete failures, named agencies, and public commitments into a visible sequence. At the same time, it does not suspend the hierarchical and managed character of Chinese participatory channels. Studies of authoritarian deliberation and consultative authoritarianism show that controlled voice and consultation may coexist with concentrated agenda control, while research on authoritarian responsiveness and conditional receptivity shows that public-facing response is selective and institutionally filtered [
43,
44,
46,
62]. The Nanning evidence fits that mixed picture. The interface can absorb social discontent, but it can also create some moments in which evidentiary constraint makes more checkable commitment possible. Its systemic significance therefore lies less in either pure performance or full democratic accountability than in the way staged publicity reorganizes responsibility signals inside an urban administrative hierarchy.
5.4. Practical Implications
For organizers of televised accountability and related public-evaluation formats, the results separate two design goals that are often conflated. Emotional escalation can coincide with immediate visible response. It is much less useful for producing checkable commitment and may even work against it. More concrete factual anchors, documentable evidence, and continued follow-up appear more useful when the aim is to anchor response in higher-cost commitment. Contemporary urban oversight systems therefore need more than visibility technologies and exposure mechanisms alone. They also need evidentiary discipline and follow-up pathways if they are to generate public value beyond symbolic adjustment.
For public organizations, the practical implication is equally clear. In high-visibility accountability settings, officials are likely to default toward low-commitment and reputationally defensive language unless they enter the interaction with enough factual preparation, clearer responsibility mapping, and a realistic basis for committing to specific action. Response protocols built around those needs may reduce the drift from public concession to vague future promises.
5.5. Limitations and Future Research Directions
Several limits remain. The analysis identifies structured associations in a highly organized accountability setting rather than strong exogenous causal effects. This boundary is important because pressure and response are produced inside the same unfolding interaction. Hosts may intensify questioning after evasive answers, officials may anticipate later commitment stages, and program editors may select evidence in ways related to issue seriousness. The pressure-window design preserves temporal order at the turn level, and the models add severity controls, stage controls, chain fixed effects, historical-maximum specifications, sequence analysis, and an additional lagged-feedback diagnostic. In that diagnostic, some prior response components predict subsequent pressure: prior deflection is associated with higher subsequent accountability directness, prior acknowledgement is associated with higher subsequent emotional intensity, and prior generic or specific commitment is associated with higher subsequent factual specificity. These patterns confirm that interactional feedback is present rather than negligible. At the same time, the diagnostic models have limited explanatory power and do not overturn the main interpretation that the results should be read as structured pressure-response associations. A full cross-lagged panel design, an experimental vignette, or a setting with quasi-random variation in evidence presentation would be needed for stronger causal claims.
Because the empirical material comes from Nanning, the evidence represents a mature city-level case rather than a direct estimate of all Chinese televised accountability programs. The value of the case lies in its routinized and institutionalized format, which keeps sustained response patterns observable, but future multi-city and multi-province work is still needed to test how far these response packages travel across different regional governance ecologies. Nor does the study cover the full ecology of urban complaint handling, which in many cities also includes hotlines, online inquiry systems, platform complaint channels, and internal administrative dashboards. The coded problem-severity control partially adjusts for problem seriousness but does not eliminate omitted-variable concerns.
The intercoder agreement results further show that agreement is generally high but not equally strong across all constructs: specific commitment remains harder to identify than acknowledgement or generic commitment, and the chain-level severity score still contains some one-step disagreements. The sequence analysis makes better use of temporal structure, but some high-pressure cells remain too small to support a full global state-transition model. Specific commitment is also not equivalent to downstream rectification, so the analysis does not estimate ultimate governance effectiveness. A commitment that names an action, actor, time, or target is more checkable than a vague promise, but it can still be delayed, diluted, or unfulfilled after the broadcast. For that reason, the article treats specific commitment as a meaningful proxy for the quality of public answerability inside the program, not as a direct measure of completed governance improvement.
A separate measurement limitation concerns model-assisted text coding. Fixed prompts, deterministic settings, targeted researcher review, and independent agreement checks reduce the risk that the LLM generates unsupported interpretations, but they do not make automated classification neutral. The model may still overread formulaic administrative speech, miss pragmatic ambiguity, or reproduce genre-specific assumptions about Chinese official language. The reported agreement statistics are therefore best understood as evidence that the final variables are sufficiently reliable for the present analysis, not as evidence that model-assisted coding removes interpretive judgement [
64,
67,
72,
73]. Future work could compare multiple models and use larger fully human-coded validation sets.
Future work can strengthen the micro-mechanism side of the design more directly. One route would be to combine transcript analysis with expert surveys, coder-based ratings of perceived threat, or experiments that manipulate emotional pressure, evidence form, and direct responsibility cues. Another would be to compare public officials with other professional groups who also operate under social evaluation and time pressure. A third would be to extend the analysis across regions and program formats to see whether the same pressure-response pathway appears in less institutionalized accountability settings. It would also be valuable to connect televised accountability to broader urban data and complaint infrastructures and to collect follow-up evidence on whether checkable commitments are actually implemented after broadcast.
6. Conclusions
Using a sequential corpus from Nanning’s long-running televised accountability program, this study offers a response-level account of televised oversight as a systemic accountability interface. Emotional intensity emerges as the most stable pressure dimension, but it is mainly linked to immediate and mixed public response rather than high-cost commitment. Factual specificity and evidence types work more by reorganizing the available rhetorical space. Accountability directness has a double-edged pattern, with acknowledgement and defense moving together. Sequence analysis further shows that visible concession is heavily front-loaded, whereas specific commitment is delayed and confined to a smaller subset of chains. An additional finding is that emotional intensity is also associated with more sanction-threat language, which is more consistent with downward punitive signaling than with substantive correction.
Taken together, the findings support a view of televised accountability as a socio-technical governance arrangement in which media staging, evidentiary presentation, and bureaucratic response are tightly coupled. Official response in that setting is not a simple choice between admitting and denying, nor does stronger pressure linearly produce better governance. The observed pattern is a redistribution of acknowledgement, deflection, and commitment across a highly structured and mediatized sequence. Generic commitment often carries the logic of temporal blame displacement, whereas specific commitment is more likely to emerge as a later-stage and more institutionally structured output. The Nanning evidence does not by itself exhaust all regional variation, but it does show the value of treating televised oversight as a structured urban-governance process rather than only as a media event or a governance slogan.
The emphasis therefore shifts from whether televised accountability works in the abstract to how a public oversight interface organizes response under visibility. For smart-city governance, the main implication is that visible data, complaint inputs, and exposure mechanisms cannot be evaluated apart from the response pathways they activate. For public value and accountability research, the point is parallel: answerability becomes more visible, but higher-quality public value depends on whether the interface can convert that visibility into checkable commitments, follow-up, and learning. Future work can refine the boundary of specific commitment, improve chain-level severity measurement, connect televised accountability to broader complaint and data infrastructures, and extend the sequential models. Even within its current limits, the findings show that understanding urban accountability requires close attention to how information inputs, staged interaction, and feedback timing jointly shape the public outputs of governance.