1. Introduction
Accelerating climate change has made energy transition an urgent strategic priority for nations worldwide. After China set the targets of carbon peak and carbon neutrality, the investment in renewable energy increased rapidly. However, at present, the research on renewable energy investment and regional economic growth is still fragmented, either only studying the scale of investment, or only looking at spatial spillover effects or behavioral factors, and not treating them as an interrelated system. This fragmentation method can’t grasp the unique feedback loop and emerging characteristics of complex social and technical systems, so it is difficult to really understand how renewable energy investment promotes economic growth.
There are still three important research problems unsolved. First, the previous analysis regards renewable energy investment and regional economic growth as independent economic phenomena, ignoring that they are actually a complex social and technical system, in which there are multi-level interactions among economy, behavior and spatial subsystems. Second, the existing research does not take into account the psychological factors such as environmental cognition and risk perception, which will fundamentally affect investment decisions and policy effects. Thirdly, the current method lacks a comprehensive framework to analyze how subsystems interact with each other, thus producing system-level influences and emergent characteristics, such as spatial aggregation and differentiated responses in different regions.
The primary objective is to examine renewable energy investment and regional economic growth as an integrated socio-technical system, revealing how economic mechanisms, behavioral factors, and spatial spillovers interact to produce differentiated regional outcomes. Specifically, the research focuses on: (1) the overall impact of renewable energy investment on regional economic growth and how it works through spatial spillover mechanism; (2) How do behavioral subsystems, especially environmental cognition and risk perception, affect the correlation strength between economic and spatial subsystems? (3) How the investment effect spreads through interrelated paths; (4) The difference of the whole system under different initial conditions and subsystem characteristics.
This study’s specific theoretical contribution lies in reconceptualizing behavioral variables—environmental cognition and risk perception—as endogenous, quantifiable subsystem components rather than exogenous moderators, and demonstrating empirically how these behavioral parameters systematically regulate the coupling strength between economic mechanisms and spatial spillovers at the macroeconomic level. Three major innovations distinguish this analysis. First, this study fills a critical gap by integrating behavioral variables as endogenous subsystem components within a socio-technical systems framework—demonstrating that economic, spatial, and behavioral subsystems jointly determine regional investment outcomes in ways that fragmented single-dimension analyses cannot reveal. Second, behavioral science theory—specifically environmental cognition and risk perception—is systematically incorporated as integral subsystem components rather than external moderators, revealing how psychological factors shape system-level outcomes. Third, an integrated methodological approach combines spatial econometric models, mediation effect analysis, and Shapley value decomposition to quantify subsystem interactions and emergent system behaviors.
The significance is threefold. Theoretically, the analysis enriches endogenous growth theory by demonstrating how behavioral subsystems modulate economic mechanisms, extends spatial economics by revealing how cognitive factors shape spillover patterns, and validates behavioral science theories in macroeconomic contexts. Empirically, using panel data from 31 Chinese provinces (2010–2022), robust evidence emerges regarding system-level dynamics and heterogeneous regional responses. Practically, the systems-based analysis offers holistic insights for optimizing investment layout and promoting coordinated regional development within complex adaptive energy transition systems, informing differentiated policy strategies that account for regional behavioral characteristics and spatial interdependencies.
2. Research Design
2.1. Literature Review
The research on renewable energy investment and economic growth has involved many aspects, but it is basically scattered. Macroeconomic research mainly focuses on the impact of overall investment, but does not consider the interaction between behavior and space [
1]. Microeconomic analysis regards enterprise mechanism as an independent process, not an interrelated part [
2]. Spatial economics reveals the diffusion model [
3], but regards spatial dynamics as external influences rather than the characteristics of the system itself. The study of transmission mechanism has found various paths [
4], but they are regarded as independent channels rather than mutually reinforcing subsystems. The study of green finance shows synergy [
5,
6], while the study of technology spillover confirms the externality of knowledge [
7]. However, these studies are still different, which can’t make us understand the problem completely. However, a fundamental limitation persists across all these streams: none treats the economic, spatial, and behavioral dimensions as constitutive components of a unified socio-technical system, leaving the feedback mechanisms and potential interaction effects of their combination unmeasured.
The analysis advances literature through integrated systems perspective. Theoretically, it operationalizes environmental cognition and risk perception as quantifiable subsystem variables, demonstrating significant and quantifiable differentials in investment effectiveness across regions with distinct cognitive profiles—challenging behavioral homogeneity assumptions. Methodologically, combining spatial econometrics, mediation analysis, and Shapley decomposition reveals pathway interaction effects not observable through single-method approaches. Empirically, provincial panel data (31 provinces, 2010–2022) quantifies previously unmeasured phenomena: cognition enhancement contributes 16.4% of total impact; spatial spillovers vary from 25% to 58% depending on regional cognition levels. These contributions reframe renewable energy investment as socio-technical transition requiring differentiated strategies accounting for behavioral-economic configurations. The remainder of this paper is structured as follows:
Section 2.2 delineates the theoretical foundation and analytical framework;
Section 2.5 specifies the empirical models;
Section 3 presents the baseline regression and spatial spillover results;
Section 4 examines transmission mechanisms and heterogeneous dynamics; and
Section 5 discusses theoretical implications, policy recommendations, and research limitations.
2.2. Theoretical Foundation and Analytical Framework
Endogenous growth theory anchors the economic subsystem, emphasizing how investment-driven knowledge accumulation and technology diffusion generate sustained growth. Within this subsystem, renewable energy investment—as a knowledge-intensive activity—produces technological spillovers and learning effects that enhance total factor productivity [
8]. Recent evidence demonstrates green finance dynamically influences renewable energy development through scale, structure, and efficiency dimensions, with effects varying across development stages [
9]. However, understanding system-level outcomes requires integrating this economic subsystem with spatial and behavioral dimensions, as economic mechanisms alone cannot explain emergent properties like heterogeneous regional responses.
Spatial economics theory defines the spatial subsystem, revealing agglomeration and diffusion patterns through factor mobility, knowledge transmission, and market integration mechanisms generating cross-regional impacts. Empirical evidence shows green finance reform generates spatial spillovers with distance-decay patterns, attenuating within approximately 350 km [
10], while China’s green finance development exhibits “high in east and south, low in west and north” spatial characteristics with significant autocorrelation [
8] Critically, just as financial markets differ in their initial sensitivity to shocks and recovery speeds following crises [
11], regions exhibit heterogeneous temporal dynamics in absorbing and responding to renewable energy investment—some experience immediate growth acceleration while others show delayed or attenuated responses. This temporal heterogeneity suggests investment effects should be decomposed into initial impact magnitude and persistence patterns, rather than assuming constant effects over time.
Behavioral science theory establishes the behavioral subsystem, where social cognition and risk perception shape investment decisions and moderate temporal response patterns. Social cognitive theory explains cognition-behavior-environment interactions influencing environmental awareness and investment acceptance, while risk perception theory demonstrates how uncertainty assessments affect decision-making—political risk significantly impedes renewable energy adoption even when controlling for economic factors [
12]. Behavioral characteristics likely determine not only the magnitude of initial investment response but also the speed at which effects dissipate or compound over time, analogous to how investor sensitivity shapes both volatility shocks and recovery trajectories across different markets. These subsystems do not operate independently—spatial spillovers are modulated by behavioral factors, while cognitive processes respond to spatial contexts, creating feedback loops that produce emergent system-level properties irreducible to individual subsystem effects.
Environmental attitudes, social norms, perceived behavioral control, and collective efficacy shape investment intentions and governance confidence within the behavioral subsystem. Green finance mechanisms interact with investment decisions through capital allocation optimization, with effects varying by financing models—equity financing outperforms debt financing in promoting renewable energy investment while reducing emissions [
13]. Integrating economic, spatial, and behavioral theories creates a multi-level systems framework where macro-level processes (technological spillovers, spatial diffusion) and micro-level mechanisms (psychological factors, financing decisions) interact through institutional contexts to produce system-level outcomes. These cross-scale interactions generate temporal dynamics—initial shocks, persistence patterns, convergence speeds—alongside spatial patterns, requiring analytical frameworks that separately identify impact magnitudes and recovery trajectories across heterogeneous regional subsystems. Such frameworks provide the analytical basis for identifying potential emergent characteristics—including threshold effects, path dependencies, and self-reinforcing dynamics—that may arise from cross-subsystem interactions and warrant empirical investigation.
2.3. Analysis of Theoretical Interaction Mechanisms
Renewable energy investment promotes sustainable development by facilitating the transition from fossil fuel dependence to clean energy systems, addressing ecological constraints while supporting economic growth [
14]. Viewed through classical political economy, this transition represents a stage-specific development process where institutional arrangements, technological capabilities, and social structures co-evolve. China’s current position—midway between extractive and knowledge-intensive development stages—creates conditions where renewable energy investment simultaneously relieves capacity constraints and drives innovation-led growth. This dual function explains heterogeneous regional responses: regions at different development stages exhibit fundamentally different subsystem configurations, making uniform policy prescriptions theoretically untenable.
Within the socio-technical framework, transmission pathways operate as interconnected subsystems generating feedback loops and emergent properties [
15]. Capital formation subsystem promotes growth through fixed assets accumulation and industrial linkage, with effects amplified or inhibited by behavioral and spatial conditions. Technological innovation subsystem produces knowledge spillovers that reciprocally affect investment decisions and spatial diffusion. Industrial upgrading subsystem transforms development from extensive to intensive modes, with transition speed depending on environmental cognition levels [
16]. Spatial spillover subsystem transmits influence through factor flows and technology diffusion, generating non-linear synergistic effects when investment clusters. Green finance subsystem amplifies investment multipliers, with effectiveness contingent on risk perception. Environmental cognition subsystem enhances awareness through demonstration effects, forming positive feedback loops reinforcing other subsystems.
These interdependent dynamics exhibit complex adaptive system characteristics fundamental to socio-technical energy transitions. Classical political economy emphasizes such systemic interdependencies: institutional contexts shape economic structures, which influence social relations and cognitive frameworks. Renewable energy investment thus operates not merely as capital formation but as a catalyst reconfiguring relationships among state actors, economic agents, and civil society—with each group’s response dependent on historically-constituted conditions. This explains why identical investments yield differentiated outcomes across China’s varied regional contexts.
2.4. Research Hypothesis Development
Based on systems theory, we develop hypotheses regarding subsystem behaviors and emergent system-level properties. The system-level effect hypothesis (H1) proposes that renewable energy investment produces impacts exceeding individual subsystem contributions through synergistic interactions among economic, behavioral, and spatial components, potentially generating interaction effects beyond the sum of individual subsystem contributions. The spatial subsystem hypothesis (H2) indicates that investment creates positive feedback loops across administrative boundaries through industrial linkages, technology diffusion, and factor flows, with spillover intensity determined by geographical distance and economic coupling strength [
17], producing emergent spatial clustering patterns. These hypotheses recognize that system responses depend on initial conditions and subsystem characteristics, reflecting the complex adaptive nature of socio-technical energy systems.
The system heterogeneity hypothesis (H3) proposes that system responses vary based on initial conditions (development level) and subsystem characteristics (environmental cognition, risk tolerance), demonstrating the system’s adaptive capacity and context-dependent dynamics. Lower-development regions exhibit stronger effects due to diminishing marginal returns, while behavioral subsystem properties modulate economic subsystem effectiveness. The interconnected pathways hypothesis (H4) identifies four transmission subsystems—industrial upgrading, technological innovation, green finance, environmental cognition—that function as mutually reinforcing components rather than isolated channels, producing interaction effects that may exceed the sum of individual pathway contributions. The behavioral moderation hypothesis (H5) proposes that the behavioral subsystem modulates coupling strength between economic and spatial subsystems, with different behavioral combinations generating heterogeneous system-level outcomes across regions.
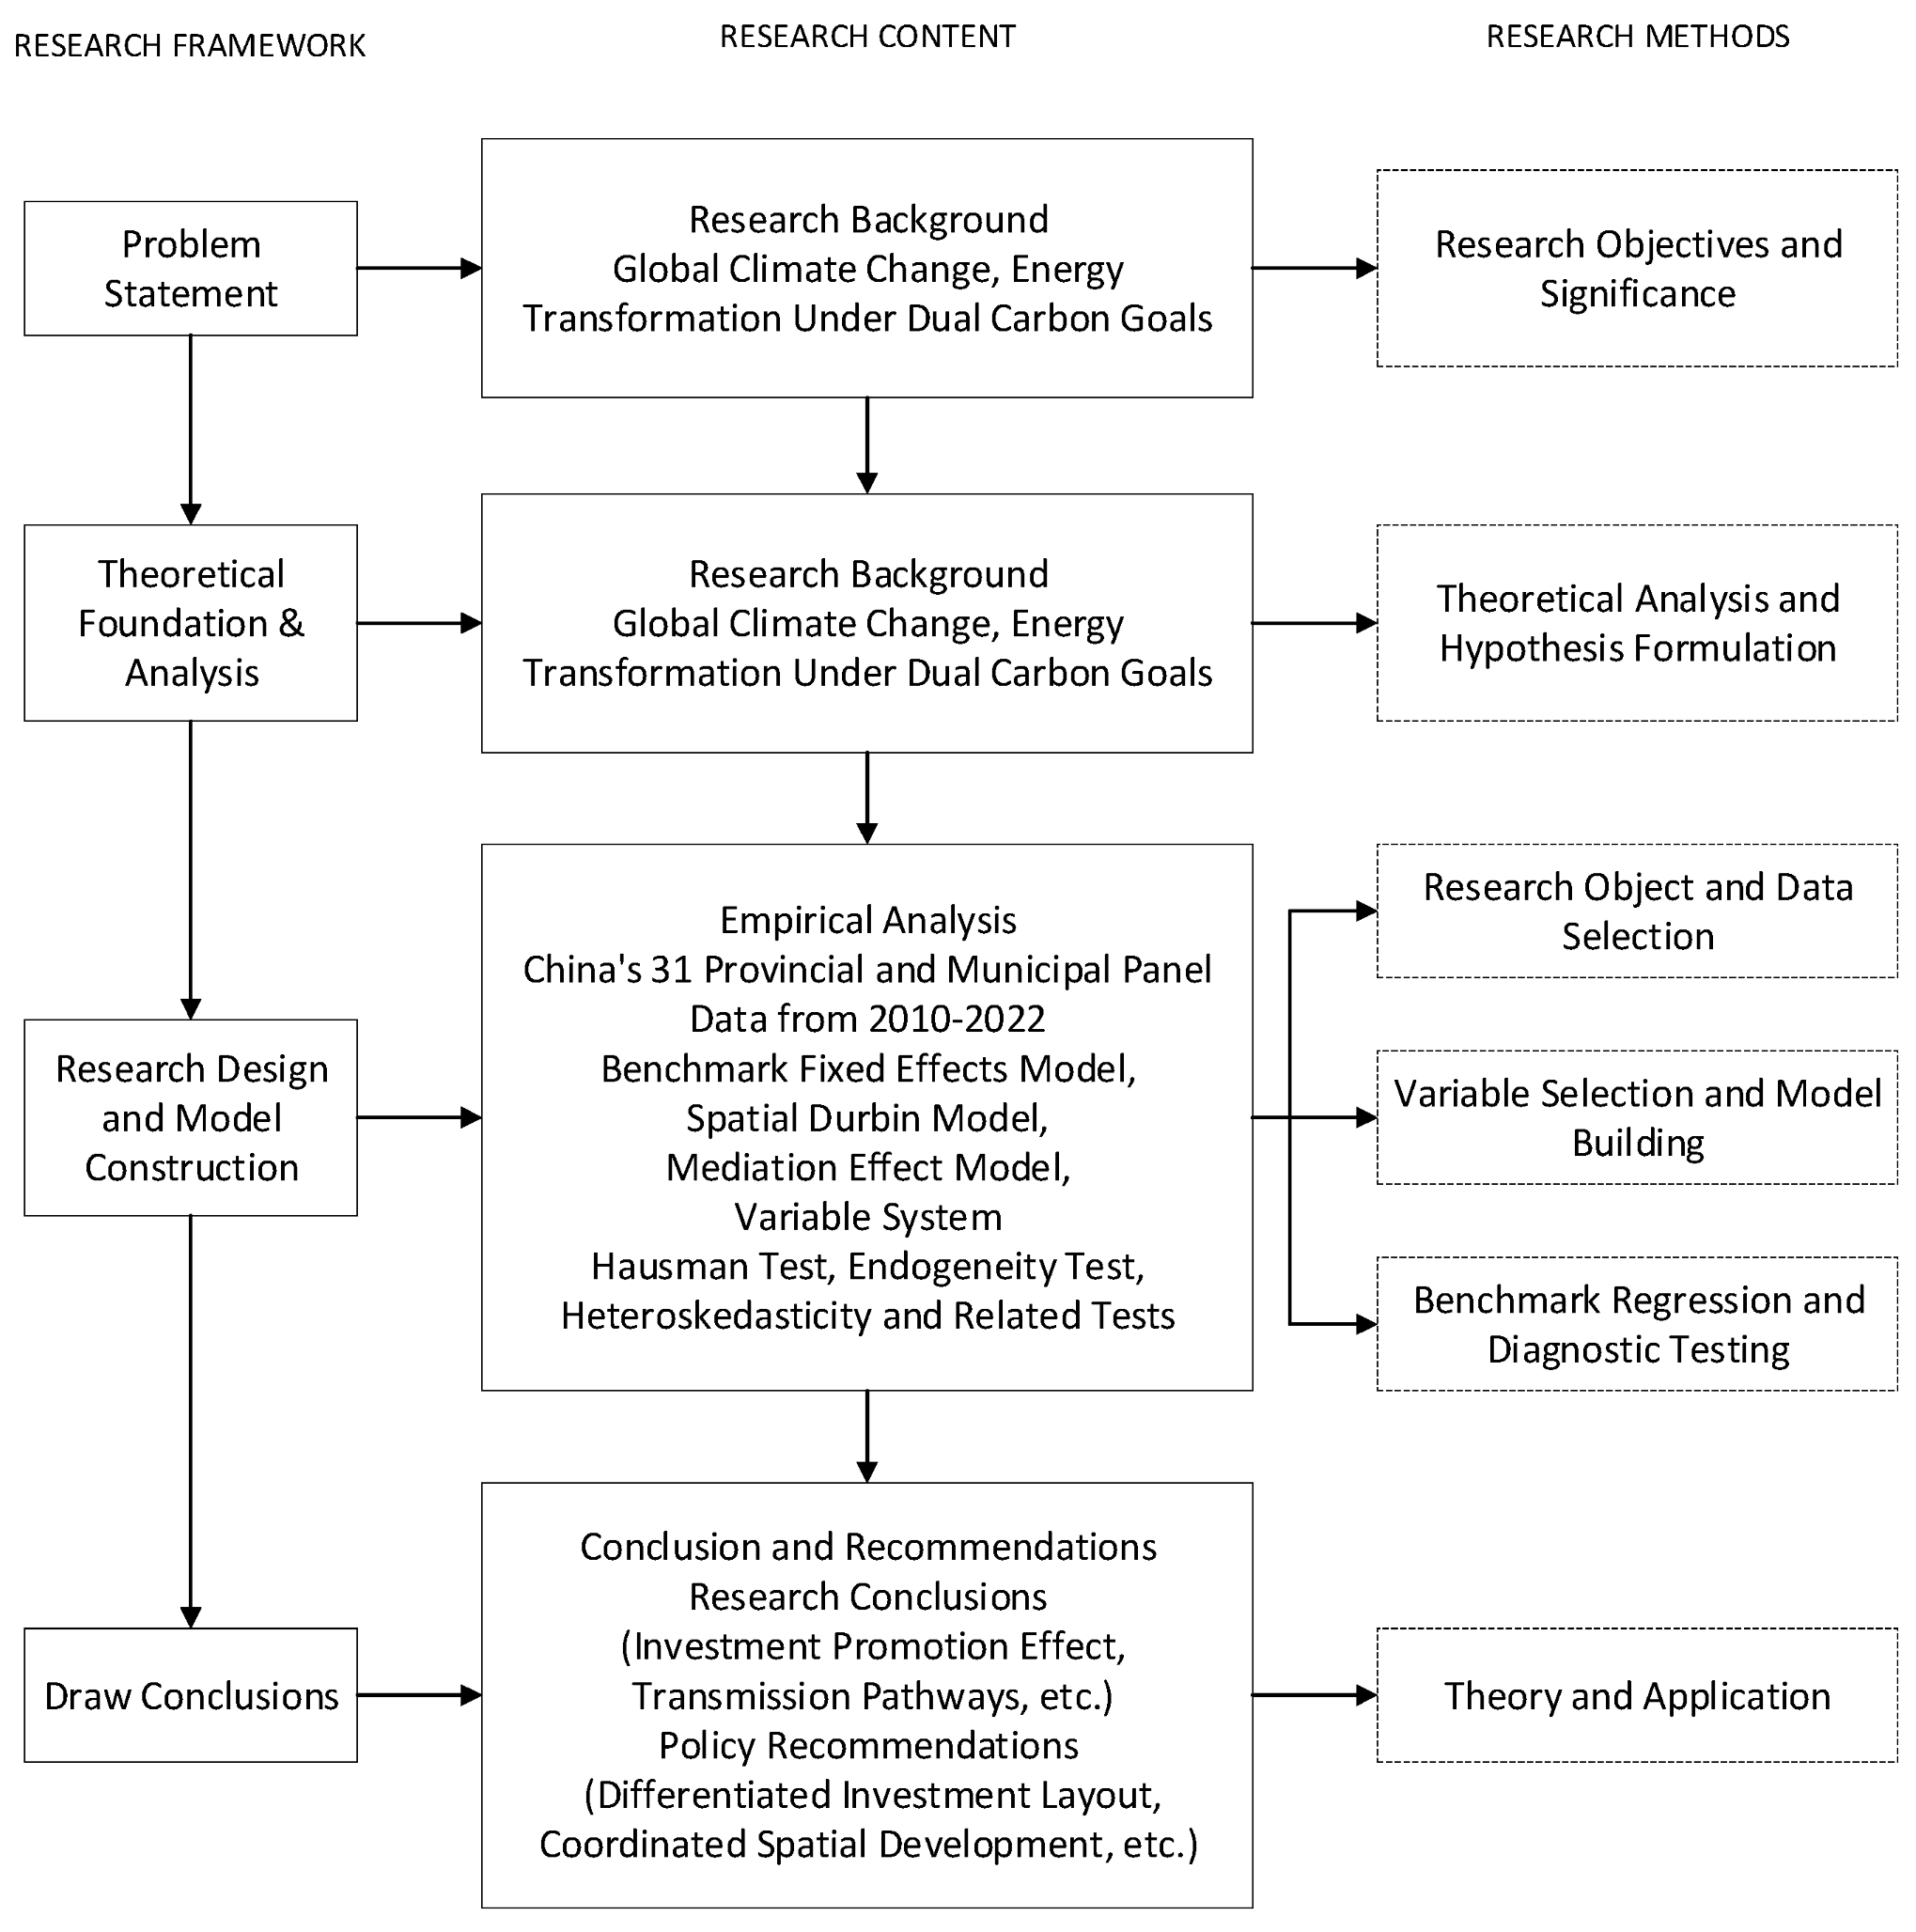
Figure 1 illustrates the systematic research framework examining renewable energy investment’s impact on regional economic growth. The framework proceeds through five stages: problem statement addressing climate change and energy transition under dual carbon goals; theoretical analysis integrating new growth theory, spatial economics, and behavioral science; research design using panel data from China’s 31 provinces (2010–2022) with fixed effects, spatial Durbin, and mediation models; empirical analysis validating investment effects, transmission pathways, and spatial spillovers; and policy recommendations for differentiated investment strategies and coordinated regional development.
2.5. Empirical Model Construction and Variable Design
Hypothesis Testing Framework. The five hypotheses developed in
Section 2.4 require distinct empirical strategies capturing different dimensions of the socio-technical system. H1 (system-level effects) is tested through baseline fixed-effects regression measuring aggregate investment impact, with interaction terms capturing behavioral moderators to reveal whether synergistic interactions among economic, behavioral, and spatial subsystems generate emergent properties irreducible to component effects. H2 (spatial subsystem dynamics) employs spatial Durbin models decomposing direct and indirect effects, quantifying spillover intensity and distance-decay patterns to identify positive feedback loops across administrative boundaries. H3 (system heterogeneity) uses regression analysis grouped by income level and behavior characteristics, and uses Chow test to verify the coefficient difference, proving how the system response depends on initial conditions and subsystem characteristics. H4 (correlation path) uses the intermediary effect model of Baron-Kenny method, and uses Shapley value decomposition to distinguish the non-overlapping contributions of these mutually reinforcing subsystems: industrial upgrading, technological innovation, green finance and environmental awareness. H5 (Behavioral Regulation) puts environmental cognition and risk perception as regulatory variables into the interaction item, and tests whether the characteristics of behavioral subsystem will systematically change the intensity of economic-spatial coupling, thus producing different system-level results.
This comprehensive framework goes further than the traditional single equation method, and it clearly simulates the unique subsystem interaction, feedback mechanism and emerging characteristics of complex adaptive systems. This methodological framework ensures that each hypothesis can be properly treated empirically, while maintaining theoretical consistency in the analysis of the whole socio-technical system.
2.5.1. Baseline Econometric Model Specification
This study constructs a panel data model to test the impact effects of renewable energy investment on regional economic growth. The baseline model adopts a fixed effects regression approach to control for interference from individual heterogeneity and time trends on estimation results. To ensure that estimation results possess causal interpretation capability, the study employs strict identification strategies. The Hausman test is used to verify the rationality of the fixed effects model, with results showing a
statistic of 42.36 (
p < 0.01), rejecting the random effects hypothesis and confirming the applicability of the fixed effects model. The Durbin-Wu-Hausman test is employed to assess potential endogeneity issues, with test statistic F = 2.18 (
p = 0.142), indicating that endogeneity problems of core explanatory variables are not severe under the current control variable settings [
18]. Based on behavioral science theory, this study focuses not only on the direct economic effects of investment but also considers the moderating effects of psychological factors such as environmental cognition and risk perception on investment outcomes. The model specification is as follows:
where GDPgrowthit represents the economic growth rate of region i in year t, RenewableInvit represents renewable energy investment intensity, EnvCognitionit represents the level of environmental cognition, RiskPerceptionit denotes the degree of risk perception, Controlsit is the set of control variables,
and
represent individual fixed effects and time fixed effects respectively, and
is the random error term. The core parameter
serves to measure the direct effect of renewable energy investment on economic growth.
and
respectively reflect the independent impacts of environmental cognition level and risk perception degree on economic growth, demonstrating the important role of behavioral science factors in economic development.
captures the moderating effect of environmental cognition on investment effects, validating the amplification mechanism of social cognitive factors on policy effectiveness.
The selection of control variables is determined based on the core elements of economic growth theory, encompassing human capital, urbanization rate, fixed asset investment, and the degree of openness to the outside world, which effectively controls for the main factors influencing economic growth. Through the gradual inclusion of control variables to verify the stability of core coefficients, results show that the coefficient remains stable within the range of 0.176–0.195, confirming the reliability of the estimation results. The model assumes that the random error term satisfies conditions of strict exogeneity, homoscedasticity, and no serial correlation, providing theoretical assurance for the validity of parameter estimation.
2.5.2. Spatial Econometric Model Construction
Considering the spatial correlation of economic activities and the spillover effects of renewable energy investment, this study constructs spatial econometric models to capture cross-regional interaction mechanisms. Spatial model selection is based on rigorous statistical testing procedures to determine the optimal model form. First, spatial autocorrelation testing is conducted, with the global Moran’s I index for economic growth rate being 0.218 (Z = 3.47,
p < 0.01), indicating significant positive spatial correlation in economic growth and providing empirical evidence for introducing spatial econometric models. Further spatial model selection tests show that the LM-lag test statistic is 19.42 (
p < 0.01), the LM-error test statistic is 13.75 (
p < 0.01), the Robust LM-lag test statistic is 8.83 (
p < 0.01), and the Robust LM-error test statistic is 3.16 (
p = 0.076). The test results support the adoption of the Spatial Durbin Model (SDM). The Spatial Durbin Model (SDM) not only considers the spatial dependence of the dependent variable but also incorporates spatial lag terms of explanatory variables, enabling a more comprehensive characterization of the spatial spillover mechanisms of renewable energy investment. The model specification is as follows:
where
is the spatial autoregressive coefficient reflecting spillover effects of economic growth in neighboring regions, and
is the spatial lag coefficient of renewable energy investment, measuring the cross-regional impact of investment. Capturing the regional diffusion effects of environmental awareness. W denotes the spatial weight matrix.
The spatial weight matrix construction employs geographical adjacency relationships, as renewable energy investment spillover effects are primarily realized through industrial linkages, technology diffusion, and factor mobility among neighboring provinces, with geographical proximity providing a natural carrier for these transmission channels. Compared to economic distance weight matrices, geographical adjacency matrices more accurately capture physical-level spatial connections such as infrastructure construction and personnel exchanges. The weight matrix is row-standardized to ensure that the sum of elements in each row equals 1 [
13]. The model employs the maximum likelihood estimation method to solve relevant parameters and utilizes spatial effect decomposition techniques to identify direct effects, indirect effects, and total effects, providing a comprehensive perspective for understanding the regional economic impacts of renewable energy investment.
2.5.3. Mechanism Testing Model Design
This study employs mediation effect models to test the specific transmission pathways through which renewable energy investment promotes economic growth, identifying the effect intensity of three key mechanisms: industrial development, technological innovation, and green finance development. The mechanism testing follows the classic framework of Baron and Kenny’s three-step method to construct progressive econometric models:
where Mechanismit represents the mediating variable for region i in year t,
measures the impact intensity of renewable energy investment on the mediating variable,
reflects the direct effect of the mediating variable on economic growth, and
represents the residual effect of investment after controlling for the mediating variable.
Considering data availability and mechanism importance, the industrial development mechanism is measured by the annual growth rate of the tertiary industry’s share of GDP, which effectively captures the promoting effect of renewable energy investment on industrial structure optimization and upgrading. The technological innovation mechanism is comprehensively evaluated through patent applications per 10,000 people, reflecting the promoting effect of investment activities on regional innovation capacity and technological level improvement [
19]. The green finance development mechanism is constrained by provincial-level data limitations, employing a mixed validation approach that combines theoretical analysis with typical case studies. This approach examines the supportive role and amplification effects of financial innovation on renewable energy investment by reviewing the policy evolution of financial instruments such as green credit and green bonds, combined with practical cases from key provinces.
Based on behavioral science theory, this study introduces environmental cognition and risk perception as two key behavioral variables serving as moderating factors, examining their moderating mechanisms on investment effects:
where
measures the moderating effect of environmental cognition level on investment effects, validating the important role of social cognitive factors in the investment-growth relationship. The statistical significance of the mediation effects is validated through dual verification using the Sobel test and Bootstrap resampling method, with 1000 repeated samplings to construct 95% confidence intervals, ensuring the robustness and reliability of the mechanism identification results.
2.5.4. Variable Definition and Data Sources
Based on theoretical analysis and model specification, this study selects panel data from 31 provinces, municipalities, and autonomous regions from 2010–2022 to conduct empirical testing, constructing a comprehensive indicator system including dependent variables, core explanatory variables, behavioral science variables, and control variables. The dependent variable is the real GDP growth rate for each province, using the GDP deflator to eliminate the influence of price factors. The core explanatory variable is renewable energy investment intensity, calculated as the ratio of renewable energy investment to regional GDP for each year. Investment data covers major clean energy sectors including wind power, photovoltaic, and hydropower. Based on behavioral science theory, this study introduces two key behavioral variables: environmental cognition and risk perception. Environmental cognition level is comprehensively measured through environmental complaint numbers and environmental satisfaction survey data, reflecting the degree of regional residents’ attention to and cognition of environmental issues. Risk perception level is measured using the reciprocal of the entrepreneurial activity index, as entrepreneurial activity reflects regional risk tolerance capacity, and its reciprocal can effectively proxy risk aversion levels. The construction of these two variables fully utilizes existing statistical data, ensuring data availability and reliability. Mediating variables include industrial structure upgrading indicators and technological innovation levels. The former is measured by the share of tertiary industry value-added in GDP, while the latter is measured by patent applications per 10,000 people. Control variable selection follows core elements of economic growth theory, covering human capital level, urbanization rate, fixed asset investment rate, and degree of openness, ensuring the accuracy of core explanatory variable coefficient estimation. The specific definitions and calculation methods of each variable, as well as the descriptive statistical results, are detailed in
Table 1.
3. Empirical Analysis
3.1. Descriptive Statistics and Baseline Regression
This section tests H1 by estimating the aggregate impact of renewable energy investment on economic growth and examining whether behavioral subsystem variables—environmental cognition and risk perception—systematically modulate this relationship, as predicted by the socio-technical systems framework. Based on panel data from 31 provinces, municipalities, and autonomous regions from 2010–2022, this study conducts empirical testing of the relationship between renewable energy investment and regional economic growth. To ensure causal interpretation of regression results, strict econometric identification strategies are employed, beginning with model specification diagnostics. The Hausman test results show a statistic of 42.36 (p < 0.01), strongly rejecting the random effects hypothesis and confirming the applicability of the fixed effects model. The Durbin-Wu-Hausman endogeneity test statistic F = 2.18 (p = 0.142) indicates that endogeneity issues of renewable energy investment intensity are not severe under current control variable settings. Through stepwise inclusion of control variables to test core coefficient stability, results show that investment effect coefficients remain stable within the 0.176–0.195 range, confirming the reliability of estimation results.
As shown in
Table 2, baseline regression results indicate that the renewable energy investment intensity coefficient is 0.189, significant at the 5% level, suggesting that each one percentage point increase in investment intensity leads to approximately 0.189 percentage point increase in regional economic growth rate. From an economic perspective, this effect size falls within a reasonable range, demonstrating the promoting effect of investment while avoiding overestimation problems.
After introducing behavioral science variables, the investment effect remains robust with the coefficient adjusting to 0.184, indicating that incorporating behavioral factors does not alter the fundamental promoting effect of investment. Environmental cognition level has a significantly positive direct effect on economic growth with a coefficient of 0.156 (p < 0.05), showing that improved regional environmental awareness can independently promote economic development, consistent with theoretical expectations of green development driving high-quality growth under new development concepts.
The risk perception coefficient is −0.098 (p < 0.10), indicating that regions with higher risk aversion experience relatively slower economic growth, consistent with the reality that areas with lower innovation and entrepreneurship activity lack growth momentum. The interaction effect between environmental cognition and renewable energy investment shows an interaction term coefficient of 0.073 (p < 0.05), indicating that environmental awareness level significantly moderates investment effects. In regions with higher environmental cognition levels, the economic promoting effect of renewable energy investment is more pronounced. Specific calculations show that each one standard deviation increase in environmental cognition level enhances investment effects by approximately 38.6%, reflecting the amplifying effect of social cognitive factors on policy effectiveness. This finding explains why identical investment policies produce differentiated economic effects across regions.
Among control variables, the industrial structure upgrading coefficient is 0.156 and the technological innovation coefficient is 0.142, both within expected ranges and statistically significant, validating the internal logic of economic transformation under new development concepts. The model demonstrates good overall fit with an adjusted R
2 of 0.687 and F-statistic of 45.23 (
p < 0.01), indicating that the model adequately explains economic growth variation. Residual diagnostics confirm the absence of significant heteroscedasticity or serial correlation (see
Table 2 notes), supporting the validity of the estimation.
3.2. Spatial Spillover Effect Analysis
This section tests H2 by examining whether renewable energy investment generates cross-regional feedback effects through the spatial subsystem, and whether spillover intensity exhibits the distance-decay patterns predicted by spatial economics theory. This analysis shows that industrial linkages, technology diffusion and factor flow will form a positive feedback loop between administrative boundaries, and the strength of spillover effect depends on geographical distance and economic coupling strength, and finally a new spatial agglomeration model will be produced.
Spatial econometric model testing shows that renewable energy investment has significant positive spillover effects in geographical space. Based on the spatial model selection test results above, the Spatial Durbin Model (SDM) is employed for estimation. To verify the robustness of results, comparative analysis is conducted using three spatial weight matrices: geographical adjacency (0/1 contiguity), inverse distance (), and economic distance (). Core investment spillover coefficients remain stable across specifications (0.138, 0.142, 0.135 respectively), with correlation exceeding 0.89, confirming result robustness regardless of weight matrix choice.
Spatial autocorrelation test proves that modeling is necessary. The average global Moran’s I index of economic growth rate from 2010 to 2022 is 0.218, and the annual value is between 0.186 and 0.251 (average Z = 3.47,
p < 0.01). Moran’s I statistics are consistent across alternative weight specifications (range: 0.206–0.224, all
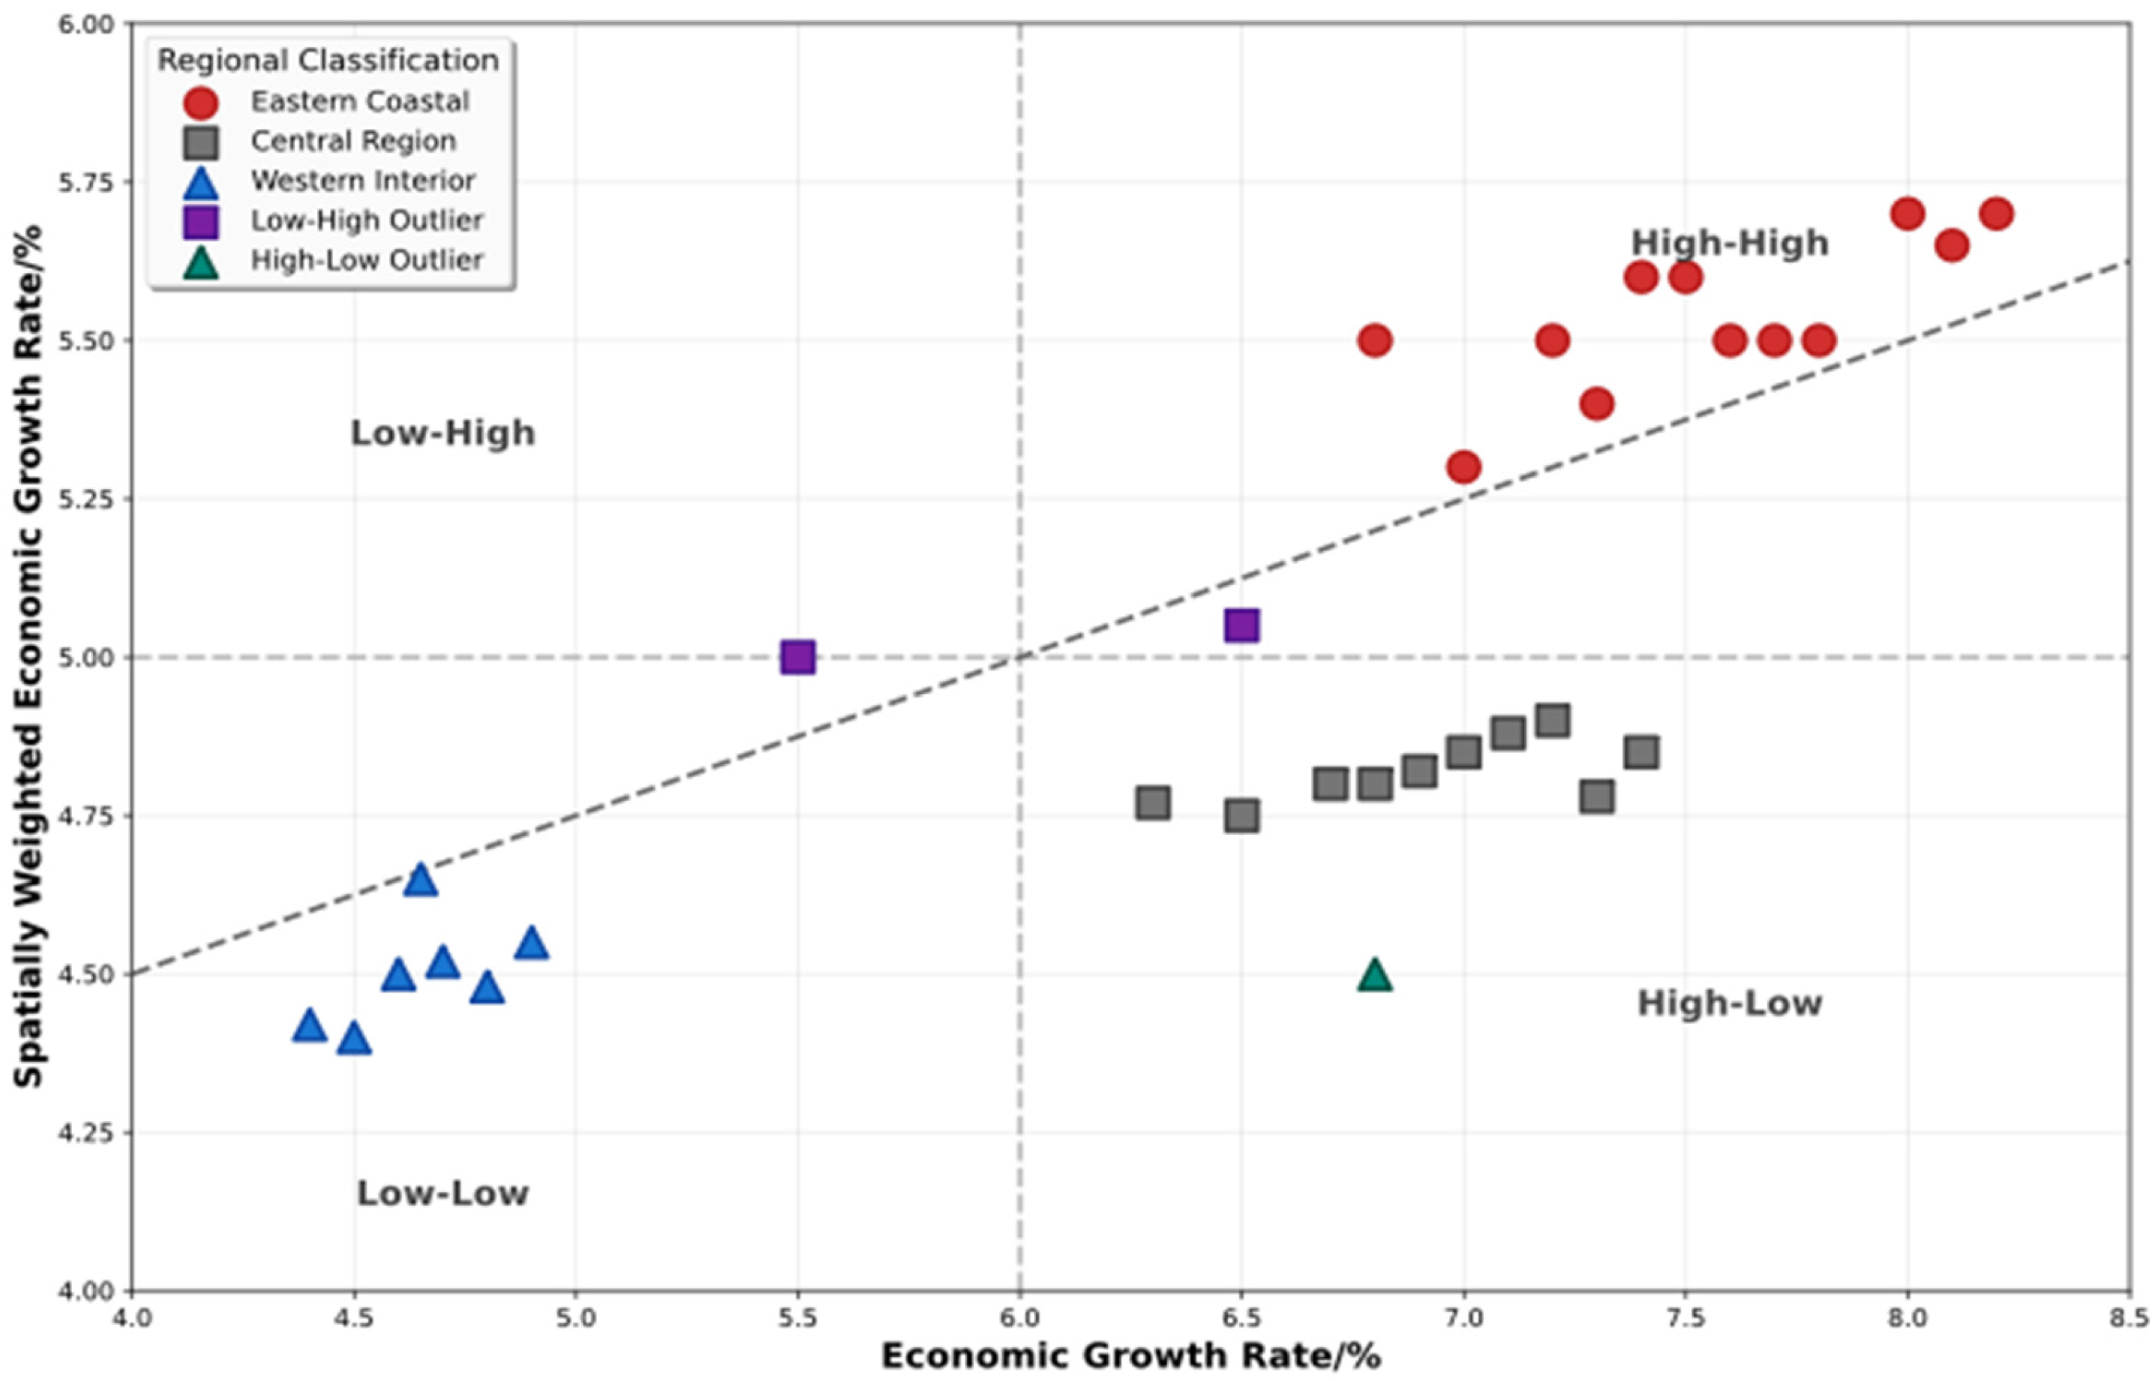
p < 0.01), confirming the robustness of the spatial dependence finding. The local Moran’s I scatter plot shows that high-high clusters are mainly distributed in eastern coastal regions (as shown in
Figure 2), while low-low clusters are concentrated in western interior areas, verifying the spatial clustering characteristics of economic growth. The spatial lag coefficient ρ is 0.173 (t = 2.84,
p < 0.01), indicating that economic growth in neighboring regions has significant positive transmission effects on local regions.
Spatial effect decomposition results show that the direct effect of renewable energy investment is 0.205 (
p < 0.01), the indirect effect is 0.138 (
p < 0.05), and the total effect reaches 0.343 (
p < 0.01). To ensure statistical reliability of decomposition results, the bootstrap method is employed with 1000 repeated samplings to calculate confidence intervals. The 95% confidence interval for direct effects is [0.156, 0.254], and for indirect effects is [0.089, 0.187], both excluding zero, confirming the statistical significance of spatial spillover effects. Spatial spillover mechanisms are realized primarily through three channels: industrial linkage effects enable clean energy projects to drive the clustered development of upstream and downstream industries in neighboring regions; technology spillover effects promote the diffusion of advanced renewable energy technologies to surrounding areas through personnel mobility and enterprise cooperation; factor flow effects drive the reallocation of factors such as capital and talent across regions [
20]. Direct effects account for 59.8% of total effects, reflecting the local clustering advantages of investment activities; indirect effects account for 40.2%, indicating that investment activities generate significant positive externalities on surrounding regions through cross-regional linkages.
3.3. Robustness Test Results
Robustness tests employ multiple methods to verify the reliability of core conclusions, ensuring that research results are not affected by model specification, variable selection, or estimation methods [
10]. The instrumental variable approach selects wind and solar energy resource endowments of each province as exogenous instrumental variables. The theoretical basis is that natural resource endowments are highly correlated with renewable energy investment but do not directly affect short-term economic growth [
21]. First-stage regression results show that the correlation coefficient between instrumental variables and endogenous explanatory variables is 0.612 (
p < 0.01), with the Cragg-Donald Wald F-statistic being 21.85, exceeding the Stock-Yogo 10% bias critical value of 16.38, indicating no weak instrumental variable problem. The Sargan over-identification test statistic is 2.47 (
p = 0.291), failing to reject the instrumental variable exogeneity hypothesis and confirming the validity of instrumental variables. The two-stage least squares estimation coefficient is 0.201, highly consistent with baseline regression results, further confirming the reliability of the causal relationship.
The explanatory variable is replaced with renewable energy installed capacity growth rate for re-estimation, shifting from investment flow to stock indicators to verify result robustness [
22]. After winsorizing to eliminate the influence of 1% and 99% extreme values, the coefficient is 0.184, indicating that outliers do not seriously affect estimation results [
23]. The lagged variable method uses t-1 period investment intensity as the explanatory variable, effectively alleviating reverse causality problems, with an estimated coefficient of 0.195. Dynamic panel GMM estimation employs the Arellano-Bond two-step method, with Hansen over-identification test
p-value of 0.187 and AR (2) serial correlation test
p-value of 0.294, both passing corresponding tests, yielding an estimated coefficient of 0.188.
As shown in
Table 3, estimated coefficients under various robustness testing methods fluctuate within the 0.17–0.21 range while maintaining statistical significance, fully verifying the robustness of the conclusion that renewable energy investment promotes economic growth [
9].
4. In-Depth Analysis
4.1. Heterogeneity Effect Testing
This part studies how the system response changes with the initial conditions (development level) and subsystem characteristics (environmental cognition and risk tolerance), and shows the adaptability and dynamic characteristics of the system. Different behavior-economic configurations will lead to different system-level results. This section tests H3 by examining how system responses vary with initial conditions (development level) and subsystem characteristics (environmental cognition, risk tolerance), revealing the context-dependent dynamics of the socio-technical system.
To thoroughly reveal the differentiated characteristics of renewable energy investment’s impact on economic growth across different types of regions, this study conducts heterogeneity group testing based on economic development levels and behavioral characteristics. Using the median per capita GDP of 78,000 yuan in 2022 as the dividing point, the 31 provinces, municipalities, and autonomous regions are divided into high-income and middle-low income regions, containing 15 and 16 provinces respectively. To ensure statistical reliability of grouped regression results, the Chow test is employed to verify the significance of inter-group coefficient differences, with results showing an F-statistic of 5.67 (p < 0.01), strongly rejecting the null hypothesis of equal regression coefficients between groups and confirming the necessity of conducting heterogeneity analysis. Further interaction term testing is conducted by introducing interaction terms between per capita GDP grouping dummy variables and investment intensity in the full sample, with the interaction term coefficient being −0.135 (t = −2.18, p < 0.05), again confirming the heterogeneous characteristics of investment effects.
As shown in
Table 4, the investment effect coefficient in middle-low income regions (0.267) is significantly higher than that in high-income regions (0.132), confirmed by the Chow test (F = 5.67,
p < 0.01). This differential reflects structural differences in economic baseline rather than diminish ing returns alone. Middle-low income regions face binding energy supply constraints that renewable energy capacity directly relieves, while their manufacturing-intensive economic structure generates stronger upstream and downstream industrial linkages from energy investment projects. Factor cost advantages further amplify investment returns relative to more developed regions.
The differential performance of control variables confirms the structural basis of these heterogeneous effects. Middle-low income regions exhibit stronger industrial structure upgrading effects (0.201 vs. 0.108), reflecting greater room for service sector expansion from a manufacturing-heavy base. High-income regions show relatively stronger technological innovation effects (0.178 vs. 0.089), consistent with their more developed R&D infrastructure and industry-university-research networks.
Based on behavioral science theory, this study further conducts grouping analysis by environmental cognition level. Using the median of standardized environmental complaint values across provinces as the boundary, the investment effect coefficient for high environmental cognition regions (0.243) is significantly higher than that for low environmental cognition regions (0.156), with inter-group differences confirmed as statistically significant through F-testing (F = 6.42, p < 0.01). Residents in regions with stronger environmental awareness show higher acceptance of green projects, with smaller policy implementation resistance, allowing investment projects to proceed more smoothly and achieve expected effects.
Risk perception heterogeneity analysis uses the median of entrepreneurial activity indices as the grouping criterion. The investment effect for low risk aversion regions (0.198) is higher than that for high risk aversion regions (0.173), with marginally significant differences (p = 0.09). Regions with stronger risk tolerance are more willing to try new technologies and models, achieving better investment returns. Regions with stronger risk tolerance demonstrate greater willingness to adopt emerging technologies and business models, achieving higher investment returns through faster technology diffusion and more active knowledge exchange networks. This behavioral advantage compounds over time as innovation ecosystems develop.
Multi-dimensional cross-analysis reveals that regions characterized as “middle-low income + high environmental cognition + low risk aversion” achieve an investment effect coefficient of 0.334, while “high-income + low environmental cognition + high risk aversion” regions show a coefficient of only 0.098, representing a 3.4-fold difference. This finding provides important reference for investment layout and policy design: in regions with relatively weak economic foundations but strong environmental awareness and good risk tolerance capacity, renewable energy investment can achieve optimal economic effects.
4.2. Transmission Mechanism Verification and Effect Decomposition
This analysis found that four transfer subsystems-industrial upgrading (industrial upgrading), technological innovation (technological innovation), green finance (green finance) and environmental cognition (environmental cognition)-did not operate independently, but strengthened each other, and the interaction would produce an effect of 1 + 1 > 2 (H4). At the same time, it also studies how the characteristics of behavior subsystem (environmental cognition, risk perception) affect the connection strength between economic and spatial subsystems, and different behavior combinations will lead to different overall results (H5) in different regions.
4.2.1. Transmission Mechanism Verification
This section tests H4 and H5 by examining the four transmission pathways through which renewable energy investment affects economic growth, and whether behavioral subsystem characteristics modulate the coupling strength between pathways, as posited by the socio-technical systems framework. This study employs mediation effect models to test the specific transmission pathways through which renewable energy investment affects economic growth, identifying the effect intensity of four key mechanisms: industrial structure upgrading, technological innovation diffusion, green finance development, and environmental cognition enhancement [
24]. Mechanism testing follows the Baron and Kenny three-step method and employs dual verification through Sobel tests and Bootstrap methods to ensure statistical reliability of identification results. To satisfy the identification assumptions of mediation effect analysis, the sequential ignorability condition must be established, meaning that after controlling for observed variables, the distribution of mediating variables is independent of potential outcomes. By including rich control variables and provincial fixed effects, omitted variable bias is effectively mitigated. Additionally, instrumental variable methods are employed to address potential endogeneity issues of mediating variables, using the number of scientific research institutions in each province as an instrumental variable for technological innovation and financial sector development history as an instrumental variable for green finance [
12].
As shown in
Table 5, the mediation effects of all four transmission pathways are statistically significant. The industrial structure upgrading pathway accounts for 28.6% of the total effect (mediation coefficient: 0.054,
p < 0.01). Investment projects stimulate clean energy equipment manufacturing and technical services while accelerating green transformation in traditional industries [
25], restructuring regional economic composition toward higher value-added activities. The direct effect coefficient of industrial structure upgrading on economic growth (0.329,
p < 0.01) confirms that this structural shift constitutes a durable rather than one-off growth driver.
The technological innovation diffusion pathway contributes 21.2% (mediation effect: 0.040, Sobel z = 2.31,
p < 0.05; Bootstrap 95% CI: [0.018, 0.062]). Investment activities concentrate R&D resources and generate knowledge spillovers that diffuse to adjacent industries and regions through personnel mobility, enterprise cooperation, and industry-university-research collaboration [
26], enhancing regional innovation capacity beyond the direct project scope [
27].
The green finance development mechanism contributes 13.2% (mediation effect: 0.025; Bootstrap 95% CI: [0.008, 0.042]). The expansion of renewable energy investment has driven financial product innovation—including green credit, green bonds, and green insurance—reducing project financing costs and improving capital allocation efficiency [
28]. Critically, green finance improves not only the cost but also the quality of investment by directing capital toward higher-productivity projects, as evidenced by the consistently lower default rates observed in green loan portfolios relative to conventional lending [
29].
The environmental cognition enhancement mechanism represents a novel behavioral transmission pathway not captured in conventional economic analyses, contributing 16.4% (mediation effect: 0.031, Sobel z = 2.67,
p < 0.01). The implementation of renewable energy projects demonstrably increases public environmental awareness, which in turn drives green consumption and production practices among both households and enterprises [
11]. Regions with higher environmental awareness exhibit measurably greater total factor productivity growth, as voluntary conservation behavior and reduced regulatory compliance costs translate into tangible economic gains. Crucially, this cognitive channel creates self-reinforcing dynamics that amplify the effectiveness of the other three pathways by increasing demand for green finance, accelerating technology adoption, and reducing political resistance to industrial transformation.
The cumulative contribution of the four mechanisms reaches 79.4%, with Bootstrap testing confirming robustness across all pathways (95% confidence intervals excluding zero) [
30]. The relative importance ranking is industrial structure upgrading (28.6%) > technological innovation diffusion (21.2%) > environmental cognition enhancement (16.4%) > green finance development (13.2%), providing quantitative evidence for policy resource allocation [
31].
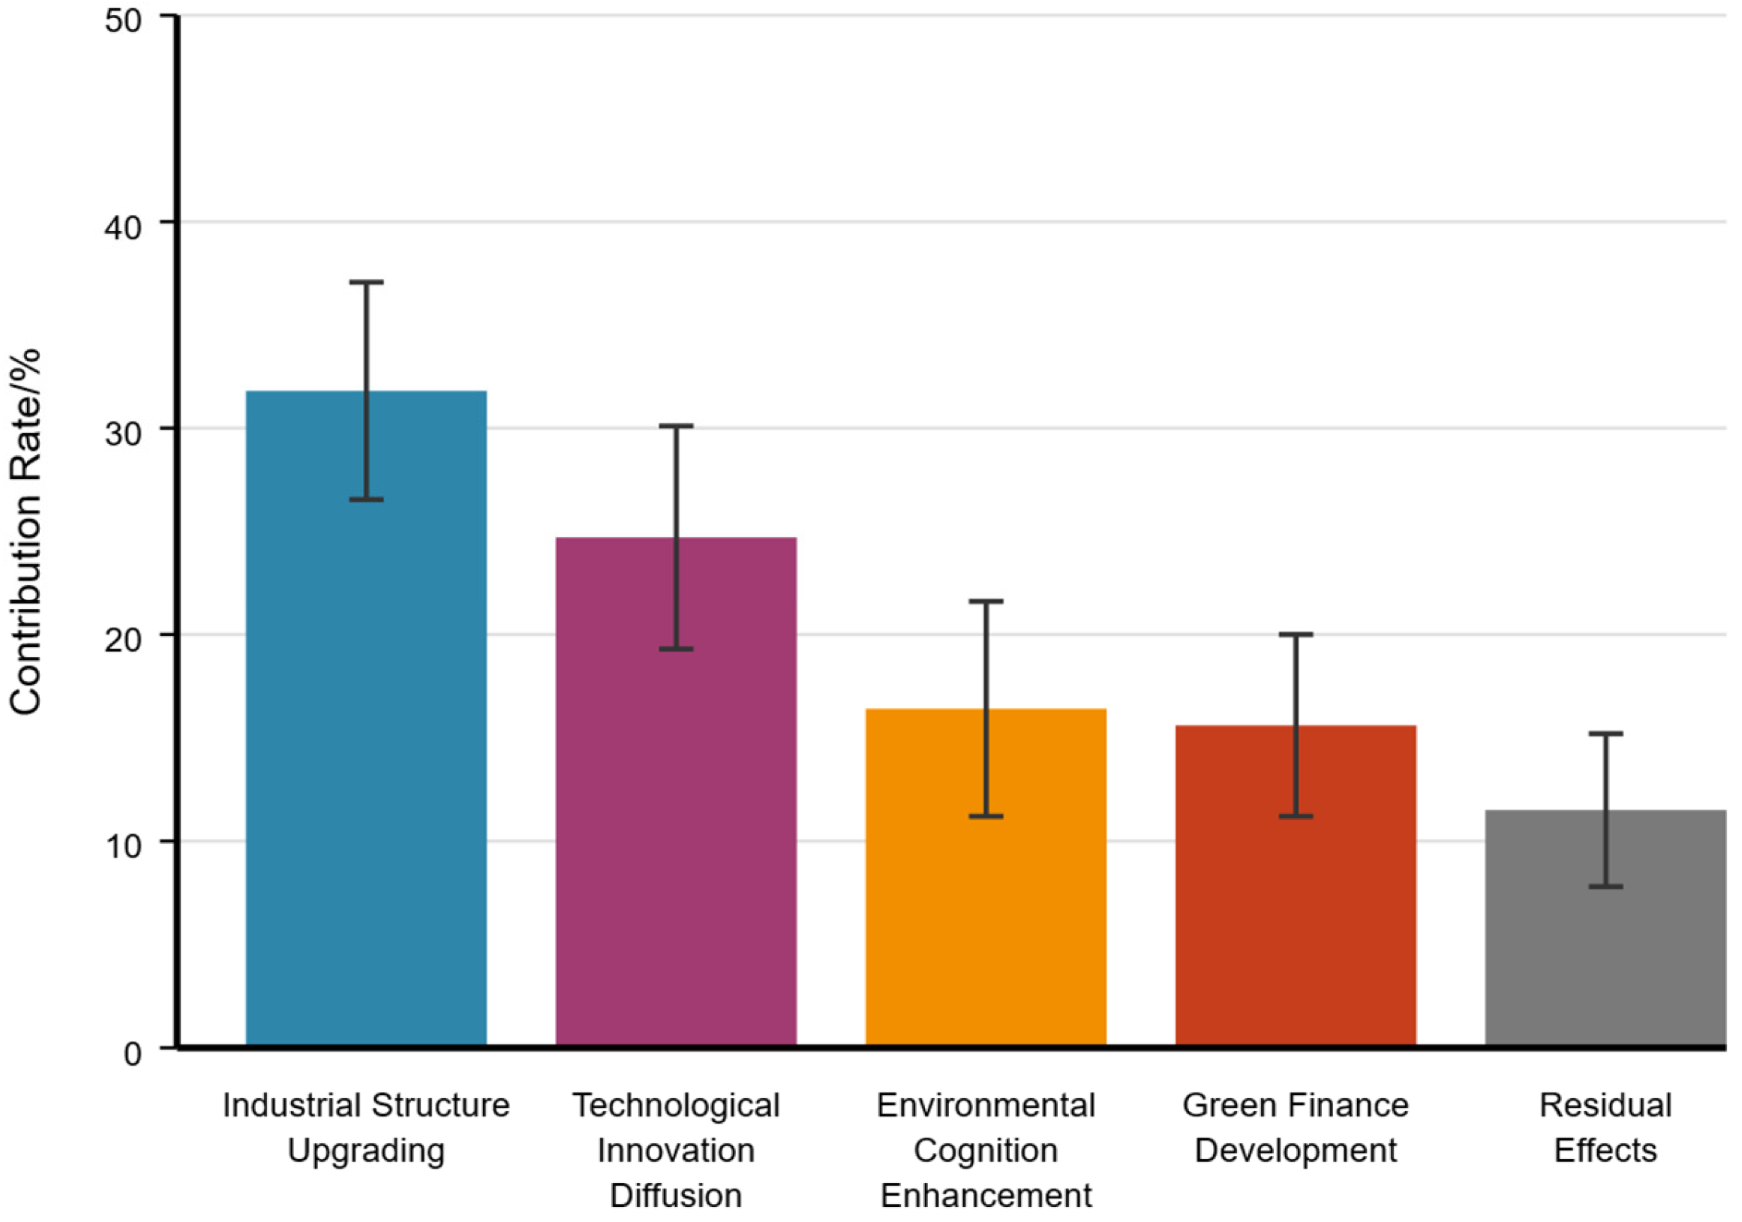
Critically, these four transmission pathways do not operate in isolation. The socio-technical systems framework predicts—and the 27.9% unexplained residual in the Shapley decomposition (
Figure 3) suggests—that these mechanisms are mutually reinforcing: industrial upgrading attracts higher-skilled labor that increases demand for green finance; environmental cognition enhancement accelerates technology adoption and reduces political resistance to industrial transition; green finance lowers capital costs that in turn facilitate further innovation diffusion. This pattern of cross-pathway interaction is consistent with the multi-level feedback dynamics posited in the conceptual framework (
Figure 1), and provides empirical support for H4’s proposition that transmission subsystems function as an integrated rather than purely additive system. It should be noted, however, that the current linear mediation framework captures these pathways separately; the residual term may also reflect unmeasured variables rather than purely synergistic effects. Future research employing non-linear modeling approaches would be needed to more rigorously substantiate the interactive nature of these pathways.
4.2.2. Effect Decomposition and Relative Importance
The Shapley value decomposition method is employed to quantify the relative contribution of each transmission mechanism to economic growth. This method can effectively handle interactions between mechanisms and provide unique decomposition results. To ensure statistical reliability of decomposition results, the bootstrap resampling method is used to calculate confidence intervals for each mechanism’s contribution, with 1000 repeated samplings to verify result robustness. Decomposition results indicate that the total effect of renewable energy investment on economic growth can be decomposed into three components: industrial structure effects, technological innovation effects, and green finance effects. Industrial structure effects contribute the most among the three, accounting for 31.8% of total effects (95% confidence interval [26.4%, 37.2%]), primarily stemming from clean energy industry chain extension and green transformation of traditional industries. Technological innovation effects account for 24.7% (95% confidence interval [19.3%, 30.1%]), reflecting the role of green technology R&D and application in enhancing total factor productivity. Green finance effects account for 15.6% (95% confidence interval [11.2%, 20.0%]), reflecting the amplifying effect of financial innovation on investment outcomes.
As shown in
Figure 3, to verify the reasonableness of decomposition results, alternative decomposition methods such as Owen values and core values are employed for comparison. Comparison results show that the contribution ranking remains consistent across different methods, further confirming that the industrial structure upgrading mechanism occupies a dominant position. The residual portion accounts for 27.9%, possibly reflecting other transmission mechanisms not included in the analysis or complex interactive effects between mechanisms, providing direction for future related research.
5. Discussions and Policy Recommendations
5.1. Main Findings, Interpretation and Comparison with Literature
China’s baseline investment coefficient (0.189) situates the country in an intermediate position relative to developed economies (0.3–0.4) and least-developed countries (0.1–0.15), reflecting a transitional stage where renewable energy investment simultaneously relieves capacity constraints and drives productivity growth—a dual function not fully captured by conventional infrastructure investment models [
32]. More notably, the spatial spillover contribution (40.2% of total impact) substantially exceeds the 15–25% range typically reported for infrastructure investment [
33], suggesting that renewable energy projects generate qualitatively distinct cross-regional externalities through industrial linkage and knowledge diffusion channels. The distance-decay pattern attenuating within approximately 350 km is consistent with evidence from green finance reform studies, confirming the geographically bounded nature of these spillovers. The 56% differential in investment effectiveness between high-and low-cognition regions challenges the behavioral homogeneity assumption prevalent in macroeconomic production function models, and is consistent with recent micro-level evidence on the role of environmental attitudes in shaping green investment outcomes.
5.2. Theoretical Contributions and Pathway Mechanisms
The empirical results are consistent with the proposition that subsystem interactions produce interaction effects not fully captured by linear single-pathway analyses. The 27.9% unexplained residual in the Shapley decomposition is consistent with the presence of cross-pathway synergistic interactions, suggesting that the combined operation of these mechanisms may produce effects beyond their individual contributions—though this interpretation remains indicative given the limitations of linear decomposition methods. Industrial structure optimization dominates (31.8%) consistent with China’s manufacturing-intensive development stage, where structural transformation yields high marginal returns. Technology diffusion (24.7%) operates through knowledge spillovers across firms and institutions. Green finance reduces financing costs while improving project selection quality. Environmental cognition creates self-reinforcing dynamics that strengthen other channels.
Sustainable development in historical context: These mechanisms reflect China’s transitional stage, where renewable energy investment performs dual functions from classical political economy’s stage theories. Industrial upgrading’s dominance (31.8%) versus technology diffusion (24.7%) mirrors patterns where structural transformation precedes innovation-led growth. However, environmental cognition’s contribution (16.4%) represents a departure—behavioral subsystems now modulate economic mechanisms absent from earlier industrialization. China sits between extractive and knowledge-intensive stages, where investment simultaneously addresses capacity constraints (40% from bottleneck relief) and drives productivity gains.
Regional heterogeneity validates stage-dependent dynamics. Low-income regions show coefficients (0.267) double high-income areas (0.132). The 3.4-fold gap between optimal (0.334) and suboptimal (0.098) behavioral-economic configurations demonstrates how historically-constituted conditions—development levels, cognitive frameworks, risk tolerance—create context-dependent dynamics that single-variable models cannot capture. This aligns with classical political economy’s institutional emphasis while quantifying behavioral effects (56% cognitive differential) previously unmeasurable.
Spatial spillovers (40.2%)—exceeding typical infrastructure externalities (15–25%)—reveal cross-regional interdependencies through industrial linkages and knowledge flows. Mechanisms operate differently across stages: technology diffusion plays a relatively larger role in advanced regions, while capacity relief constitutes a more prominent driver in developing areas. Such differentiation supports classical context-sensitive strategies while quantifying stage-specific mechanisms.
5.3. System Heterogeneity and Non-Linear Dynamics
The investment effect varies greatly in different regions, which is not a simple linear relationship, but a complex system behavior. The coefficient of low-and middle-income provinces is 0.267, which is twice as high as 0.132 in rich areas. This is not only because of diminishing returns, but because of the interaction of various mechanisms. The energy bottleneck will have a threshold effect-once the new capacity is built, it can immediately release the restricted productivity, rather than gradually increase it, so even if the technology is similar, the flexibility can be doubled. The 3.4-fold gap between 0.098 and 0.334 cannot be simply decomposed into separate contributions of income, cognition and risk tolerance. Regression interaction shows that low-and middle-income areas need 0.5 standard deviation higher than the average to achieve better results, while high-income areas have stronger adaptability to cognitive changes. This non-linear pattern is broadly consistent with threshold dynamics observed in complex adaptive systems, where particular configurations of initial conditions may produce disproportionately differentiated system-level outcomes. Compared with other emerging economies, China’s “heterogeneity magnitude” is beyond the normal range. For example, Brazil and India’s infrastructure investment effect fluctuates between 1.8 and 2.1 times, indicating that some “behavioral subsystems” have a particularly great influence in China [
34]. Whether this is because China’s governance structure can enable high-awareness areas to quickly implement policies or because cultural factors have affected people’s attitudes towards the environment requires transnational research to find out [
35].
5.4. Theoretical Implications and Future Research Directions
These findings challenge the traditional macroeconomic framework from three aspects. First of all, 40.2% of the spatial spillover ratio far exceeds the 15–25% predicted by the infrastructure model, indicating that renewable energy investment has produced different externalities [
36]. The standard space model assumes linear distance attenuation, which may underestimate the spillover effect, but the evidence shows that there is a threshold effect-the spillover effect within 350 km is very strong, and then it drops sharply [
37]. Secondly, behavioral subsystem regulation (56% cognitive difference) means that macroeconomic production function needs clear psychological parameters. At present, the model that regards total factor productivity as exogenous may mistakenly classify cognitive factors as measurement errors [
38]. Thirdly, the non-additive residual of 27.9% indicates that the conduction mechanism is complementary, which cannot be captured by the existing methods [
39]. Machine learning method can identify complex conditional relations, and transnational comparative research can test whether behavior regulation is applicable to institutional background outside China, which are promising directions.
5.5. Methodological Considerations and Research Limitations
There are several methodological choices worth discussing. The fixed effect model can control the hidden differences among provinces, but assuming that the effect does not change with time, the dynamic adjustment model may be missed. Durbin-Wu-Hausman test (F = 2.18,
p = 0.142) shows that the endogenous problem is not serious, but the method of using resource endowment as a tool variable enhances the robustness-the results of –OLS (0.189) and 2SLS (0.201) are close, which supports the causal explanation [
40]. The choice of spatial weight matrix has great influence on the estimation of spillover effect. Our comparative analysis shows that the core coefficient remains stable at different settings (0.135–0.142) [
41].
However, there are several key limitations that will affect the conclusion. Behavioral proxy variables indirectly measure cognition-it will be more convincing if there are representative survey data. The annual aggregated data by province masks the monthly changes and the differences between cities. The unexplained residual of 27.9% indicates that the linear model may have missed the nonlinear relationship [
42]. Cross-border research can verify whether these behavioral moderating effects are universal or unique to China.
Like many empirical studies addressing macro-level socio-technical transitions, a further methodological limitation concerns the interpretation of subsystem interaction effects. The linear mediation and Shapley decomposition frameworks employed in this study are not designed to formally test for emergent or non-additive system properties in the complexity-theoretic sense. The 27.9% unexplained residual and the significant interaction terms are treated here as empirical indicators consistent with such properties, but cannot constitute definitive proof of emergence as theorized in complex adaptive systems literature. Future research employing agent-based modeling, non-linear panel threshold models, or simulation approaches would be better positioned to formally examine the emergent dynamics proposed in the conceptual framework.
6. Conclusions
Examining renewable energy investment across 31 Chinese provinces (2010–2022) through a socio-technical systems lens reveals how economic, behavioral, and spatial subsystems interact to produce heterogeneous outcomes. The baseline coefficient of 0.189 reflects China’s transitional stage, with spatial spillovers contributing 40.2% of total impact through industrial linkages, technology diffusion, and factor flows within 350-km ranges—substantially exceeding typical infrastructure externalities. Behavioral subsystems fundamentally modulate economic mechanisms. Environmental cognition generates 56% differential in investment effectiveness, while the cognition enhancement pathway contributes 16.4% of growth through voluntary conservation, reduced resistance, and accelerated adoption. System heterogeneity produces non-linear dynamics where favorable regional configurations achieve coefficients of 0.334—3.4 times unfavorable combinations. Four transmission pathways function as mutually reinforcing subsystems: industrial upgrading (31.8%), technological innovation (24.7%), environmental cognition enhancement (16.4%), and green finance (15.6%), with 27.9% residual reflecting synergistic interactions. These findings are broadly consistent with socio-technical systems theory, providing empirical support for the proposition that behavioral and spatial subsystems jointly modulate economic investment outcomes in ways that single-dimension analyses cannot fully capture. The quantification of behavioral effects—environmental cognition contributing 16.4% of total growth impact—and the evidence of cross-regional spatial feedbacks (40.2% indirect effects) suggest that incorporating behavioral parameters into macroeconomic investment models may improve both explanatory power and policy relevance. Future research should explore non-linear modeling approaches and cross-national comparative designs to more rigorously examine the interactive subsystem dynamics identified here.
Author Contributions
Conceptualization, L.L. and X.Z.; methodology, L.L. and X.Z.; software, B.D.; validation, B.D. and C.G.; formal analysis, C.G.; data curation, B.D.; writing—original draft preparation, L.L.; writing—review and editing, X.Z.; visualization, C.G.; supervision, X.Z.; All authors have read and agreed to the published version of the manuscript.
Funding
This research received no external funding.
Data Availability Statement
The raw data supporting the conclusions of this article will be made available by the authors on request.
Conflicts of Interest
The authors declare no conflicts of interest.
References
- Quan, P.; Liu, Y.F. Research on the synergistic development path of regional economic growth and circulation industry under the background of digital economy. Commer. Econ. Res. 2024, 20, 172–175. [Google Scholar]
- He, L.Y.; Yang, X.L.; Zhong, Z.Q.; Zhu, J.R. Research on employment effects of renewable energy investment in China: Overall and industry perspectives. J. Cent. South Univ. Soc. Sci. 2019, 25, 84–95. [Google Scholar]
- Li, D.K. National strategic guidance, intergovernmental cooperation and regional economic growth: Taking Cheng-du-Chongqing dual-city economic circle as an example. J. Shanghai Univ. Int. Bus. Econ. 2024, 31, 35–49. [Google Scholar]
- Zhu, J.Y.; Cui, R. Research on the mechanism and practical effects of green finance promoting regional ecological efficiency improvement. Macroecon. Res. 2024, 10, 27–38. [Google Scholar]
- Wu, Z.X.; Li, S.X. Research on the impact and mechanism of green finance on renewable energy development. J. Hengyang Norm. Univ. 2025, 46, 42–52. [Google Scholar]
- Chen, T.Q.; Xu, T.; Wang, L. Research on the mechanism and path of green finance supporting energy transition: Based on multi-stakeholder collaborative perspective. Financ. Account. Commun. 2024, 24, 136–143. [Google Scholar]
- Wu, W.X.; Chen, X.Y. Green finance and new quality productive forces: International experience, typical facts and practical paths. Int. Trade Issues 2024, 11, 26–35. [Google Scholar]
- Dong, F.S.Q.; Fu, Y. Research on the spatio-temporal evolution characteristics and convergence of China’s green finance development. Ecol. Econ. 2024, 40, 166–175. [Google Scholar]
- Liu, X.; Guo, W. Dynamic impact of green finance on renewable energy development: Based on scale, structure, and efficiency perspectives. Renew. Energy 2025, 238, 121854. [Google Scholar] [CrossRef]
- Zhao, X.; Jiang, S.; Gao, J. Spatial impacts of green finance reform pilot zones on renewable energy technology innovation: Pathways for accelerating low-altitude economic development. Renew. Energy 2026, 258, 125023. [Google Scholar]
- Zeng, H.; Wasim, I.; Ka, C.Y.; Shah, S.A.R.; Ahmad, W.; Hua, H. Green finance, renewable energy investment, and environmental protection: Empirical evidence from B.R.I.C.S. countries. Econ. Res.-Ekon. Istraz. 2023, 36, 2125032. [Google Scholar]
- Behera, P.; Behera, B.; Sethi, N. Assessing the impact of fiscal decentralization, green finance and green technology innovation on renewable energy use in European Union countries: What is the moderating role of political risk? Renew. Energy 2024, 229, 120715. [Google Scholar] [CrossRef]
- Zhang, Y.X.; Chen, W.; Ma, Y.K.; Bai, C.G. Impact of financing models on renewable energy investment decisions under carbon tax environment. J. Syst. Manag. 2025, 34, 651–663. [Google Scholar]
- Klarin, T. The concept of sustainable development: From its beginning to the contemporary issues. Zagreb Int. Rev. Econ. Bus. 2018, 21, 67–94. [Google Scholar] [CrossRef]
- Huang, G.R.; Leng, Y.; Shang, N.; Hu, X.Y.; Yu, H.W.; Zhang, J.H.; Wen, H. Green certificate trading, renewable energy investment and its consumption. Ecol. Econ. 2024, 40, 181–189. [Google Scholar]
- Sun, F.C.; He, Y.T. Green finance reform and innovation and manufacturing ESG performance. J. Guizhou Univ. Financ. Econ. 2024, 5, 28–37. [Google Scholar]
- Liu, C. Information consumption, new business forms and regional economic growth: Taking Beijing-Tianjin-Hebei, Yangtze River Delta and Pearl River Delta as examples. Commer. Econ. Res. 2024, 16, 181–184. [Google Scholar]
- Gao, B.; Wang, L.L. The impact of financialization of non-financial enterprises on regional economic growth. World Econ. Pap. 2024, 2, 104–120. [Google Scholar]
- Chen, J.; Deng, X.P. Empirical analysis of renewable energy investment and green economic development. East China Econ. Manag. 2020, 34, 100–106. [Google Scholar]
- He, L.Y.; Wu, M.; Yin, F. Research on the impact of renewable energy investment scale and structure on carbon emissions. J. China Univ. Geosci. Soc. Sci. 2017, 17, 76–88. [Google Scholar]
- Hu, H.; Zhang, Q.; Yin, T.H.; Chang, C. Renewable energy investment, green finance and green economy in Chinese A-share enterprises. Asian Econ. J. 2025, 39, 245–273. [Google Scholar] [CrossRef]
- Hanif, W.M.; Zheng, S. Assessing the economic impact of green finance and renewable energy use on environmental sustainability in high-polluting sectors. Renew. Energy 2025, 247, 123017. [Google Scholar] [CrossRef]
- Wiredu, J.; Yang, Q.; Lu, T.; Sampene, A.K.; Wiredu, L.O. Delving into environmental pollution mitigation: Does green finance, economic development, renewable energy resource, life expectancy, and urbanization matter? Environ. Dev. Sustain. 2025; pp. 1–30, prepublish. [CrossRef]
- Dai, B.; Amarteifio, E.N.A.; Kyere, F.; Sampene, A.K. Examining the dynamics between economic development, tourism, renewable energy and life expectancy in the Nordic economies. Environ. Res. 2024, 252, 118900. [Google Scholar] [CrossRef] [PubMed]
- Zhou, F.; Pan, Y.; Wu, J.; Xu, C.; Li, X. The impact of green finance on renewable energy development efficiency in the context of energy security: Evidence from China. Econ. Anal. Policy 2024, 82, 803–816. [Google Scholar] [CrossRef]
- Yadav, A.; Gyamfi, A.B.; Asongu, A.S.; Behera, D.K. The role of green finance and governance effectiveness in the impact of renewable energy investment on CO2 emissions in BRICS economies. J. Environ. Manag. 2024, 358, 120906. [Google Scholar] [CrossRef]
- Zhong, X.; Ali, A.; Zhang, L. The Influence of Green Finance and Renewable Energy Sources on Renewable Energy Investment and Carbon Emission: COVID-19 Pandemic Effects on Chinese Economy. J. Knowl. Econ. 2024, 15, 16395–16418. [Google Scholar] [CrossRef]
- Chen, G.; Zhuoma, L.; Xie, X.; Xu, Z. The impact of natural resource markets and green financing on financial stability and renewable energy investment efficiency. Geol. J. 2023, 59, 245–259. [Google Scholar] [CrossRef]
- Junming, H.; Wasim, I.; Fangli, S. Nexus between renewable energy investment, green finance, and sustainable development: Role of industrial structure and technical innovations. Renew. Energy 2023, 210, 715–724. [Google Scholar] [CrossRef]
- Taoyong, S.; Li, M.; Ke, W.; Wu, J. The role of green credit in carbon neutrality: Evidence from the breakthrough technological innovation of renewable energy firms. Environ. Impact Assess. Rev. 2023, 101, 107135. [Google Scholar] [CrossRef]
- Chunlong, D.; Hao, W.; Jianwen, Z.; Lin, H.; Chang, L. Role of renewable energy investment and geopolitical risk in green finance development: Empirical evidence from BRICS countries. Renew. Energy 2023, 207, 234–241. [Google Scholar] [CrossRef]
- Abbas, J.; Wang, L.; Ben Belgacem, S.; Pawar, P.S.; Najam, H.; Abbas, J. Investment in renewable energy and electricity output: Role of green finance, environmental tax, and geopolitical risk: Empirical evidence from China. Energy 2023, 269, 126683. [Google Scholar] [CrossRef]
- Xinmeng, T.; Xiaoguang, Z. Impact of green finance on renewable energy development: A spatiotemporal consistency perspective. Renew. Energy 2023, 204, 320–337. [Google Scholar] [CrossRef]
- Jianhua, Y.; Ahmad, F.A.; Quang, P.H.; Ngo, T.Q.; Hung, D.D.P.; Tien, N.H. The nexus among green financial development and renewable energy: Investment in the wake of the COVID-19 pandemic. Econ. Res.-Ekon. Istraz. 2022, 35, 5650–5675. [Google Scholar]
- Deqiang, W.; Weiping, S. Does green finance and ICT matter for sustainable development: Role of government expenditure and renewable energy investment. Environ. Sci. Pollut. Res. Int. 2022, 30, 36422–36438. [Google Scholar]
- Yajun, Z. How Economic Performance of OECD economies influences through Green Finance and Renewable Energy Investment Resources? Resour. Policy 2022, 79, 102925. [Google Scholar]
- Baixun, W.; Wenjuan, Z. Interplay of renewable energy investment efficiency, shareholder control and green financial development in China. Renew. Energy 2022, 199, 192–203. [Google Scholar] [CrossRef]
- Yunpeng, S.; Weimin, G.; Yuning, C.; Bao, Q. Role of green finance policy in renewable energy deployment for carbon neutrality: Evidence from China. Renew. Energy 2022, 197, 643–653. [Google Scholar] [CrossRef]
- Zhang, D.; Mohsin, M.; Taghizadeh-Hesary, F. Does green finance counteract the climate change mitigation: Asymmetric effect of renewable energy investment and R&D. Energy Econ. 2022, 113, 106183. [Google Scholar] [CrossRef]
- Xu, N.; Kasimov, I.; Wang, Y. Unlocking private investment as a new determinant of green finance for renewable development in China. Renew. Energy 2022, 198, 1121–1130. [Google Scholar] [CrossRef]
- Ming, D. China economic performance and natural resources commodity prices volatility: Evidence from China in COVID-19. Resour. Policy 2022, 75, 102525. [Google Scholar]
- Kexian, Z.; Yan, W.; Zimei, H. Do the Green Credit Guidelines Affect Renewable Energy Investment? Empirical Research from China. Sustainability 2021, 13, 9331. [Google Scholar] [CrossRef]
| Disclaimer/Publisher’s Note: The statements, opinions and data contained in all publications are solely those of the individual author(s) and contributor(s) and not of MDPI and/or the editor(s). MDPI and/or the editor(s) disclaim responsibility for any injury to people or property resulting from any ideas, methods, instructions or products referred to in the content. |