Article

Correlation Coefficient-Based Group Decision-Making Approach Under Probabilistic Dual Hesitant Fuzzy Linguistic Environment to Resilient Supplier Selection

1
School of Management, Zhejiang University of Finance & Economics, Hangzhou 310018, China
2
College of Economics and Management, Zhejiang Normal University, Jinhua 321004, China
3
School of Management, Hefei University of Technology, Hefei 230009, China
*
Authors to whom correspondence should be addressed.
Systems 2026, 14(3), 334; https://doi.org/10.3390/systems14030334
Submission received: 11 November 2025 / Revised: 11 March 2026 / Accepted: 13 March 2026 / Published: 23 March 2026
(This article belongs to the Section Systems Practice in Social Science)

Abstract

In order to tackle resilient supplier selection (RSS) of high uncertainty in resilient supply chain management, an effective correlation coefficients-based multicriteria group decision-making (MCGDM) methodology has been constructed. The major contribution of the present study is twofold. Firstly, in view of that extant criteria systems are all in lack of theoretical rationality, this paper establishes a capabilities-based analytical framework for intensive evaluation of supplier resilience by taking processual viewpoints of dynamic capabilities theory and risk management theory. Secondly, to empower the proposed correlation coefficients-based MCGDM methodology, probabilistic dual hesitant fuzzy uncertain unbalanced linguistic set (PDHF_UUBLS) is employed to capture hybrid uncertainties in decision processes of RSS. Then, theoretically compliant correlation coefficients (CCs) for PDHF_UUBLS are developed, including statistics-based CC, information energy-based CC and their weighted versions. Especially, information energy-based CCs overcome limitations of statistics-based CCs in special cases, thus exhibiting general applicability. In addition, a compatibility-based programming model has also been developed to objectively derive an unknown weighting vector for DMUs. Furthermore, illustrative case studies and comparative experiments have been carried out to verify effectiveness and stability of the proposed methodology. Taken together, this paper satisfies the new normal demand of resilience building in supply chain management and presents an effective MCGDM methodology for handling the key problems of RSS.

1. Introduction

The advancement of globalization and digitalization has characterized business environments with high volatility, uncertainty, complexity and ambiguity (VUCA) [1,2]. In adapting to the VUCA business environments successfully, focal companies in many industries [3,4] have been seeking out supply chain collaboration to gain market competitiveness. However, in the face of continuously dynamic fluctuations and disturbances in VUCA environments, supply chains with conventional risk-management mechanisms often exhibit vulnerabilities, and even slight events could cause disorders, disruptions and breakdowns [5]. These facts prompt resilience building in supply chains so as to act proactively and effectively in tackling supply chain risks [6]. Obviously, an imperative precondition of a resilient supply chain is the presence of resilient suppliers upstream and downstream of the focal company [7]. Therefore, resilient supplier selection (RSS) has been increasingly attracting research attention in supply chain management [8,9].
Supplier selection is generally recognized as a typical type of uncertain multicriteria decision making (MCDM) problem which aims to rank alternative suppliers according to results of comprehensive evaluations on multiple criteria or attributes [4,9,10,11,12]. Establishing rational criteria frameworks and constructing appropriate comprehensively evaluative approaches are the two fundamental stepping stones [13] to resolving supplier selection. With respect to resilient supplier selection (RSS) in the literature, criteria frameworks have been generally put forward by integrating conventional sustainability-oriented criteria and partial resilience-oriented criteria, such as those probed by Rajesh et al. [10], Valipour Parkouhi et al. [11], Amindoust [14], Majumdar et al. [4], Sahu et al. [15], Varchandi et al. [16], Ulutaş et al. [9], among others. As can be seen, while these overarching criteria frameworks unanimously hold the purpose of facilitating focal companies to reconsider and reconfigure all their suppliers, they all lack in deriving resilience criteria by considering requirements in resilience conceptualization. In addition, given the long-term contracts with strategic suppliers in practice, another purpose of RSS manifests as determination of ranking orders of strategic suppliers according to their resilience performance rather than total requalification as required by evaluative frameworks in the above-mentioned pioneering research. With the above consideration in mind, in this paper, we take the viewpoint of processual characteristics in resilience conceptualization and build a corresponding criteria framework that comprises key capability attributes as demanded in the resilience process.
In order to effectively tackle RSS problems which intrinsically show high uncertainty during comprehensive evaluation, many efforts have been paid to develop effective MCDM approaches in the light of various methodologies such as the grey AHP-ANP model [10], grey VIKOR [11], hybrid FIS-DEA model [14], trapezoidal intuitionistic fuzzy TOPSIS [4], extended MOORA [15], BWM-TOPSIS based on correlation coefficient [17], BWM-TOPSIS-PageRank model with Z-numbers [18], AHP-DEMATEL model with D-numbers [19], rough MAXC-LOPCOW-MACONT [9], extended rough TOPSIS [20], among others. As can be observed in the above-mentioned research, group decision-making arrangements were increasingly carried out to overcome the limitations of a single decision maker’s capacity [21,22,23,24]. Meanwhile, involvement of multiple decision-making units (DMUs) often gives rise to decision hesitancy [25,26] in decision-making processes. Therefore, of particular note, current research on RSS has started to employ hesitant variables [27] and hesitant linguistic variables [28] as expression tools for addressing decision hesitancy in supplier resilience evaluation from various angles. Alimohammadlou et al. [27] utilized hesitant fuzzy set to depict decision hesitancy in group opinions. Chang [29] introduced a hesitant Fermatean fuzzy framework to accommodate heterogeneous uncertain decision information. Lei et al. [30] used a dual hesitant fuzzy set to address the bipolar phenomena of group judgments. Sun et al. [17] further incorporated the probabilistic uncertain linguistic term set to capture the probabilistic complementary information in the voted linguistic variable. However, these expression tools are all still incapable of conveying hybrid characteristics in hesitant evaluations, especially given RSS’s problems with low-structured definitions.
Toward this end, compound expression tools [12,31] are thus advocated in parallel MCDM studies to empower DMUs to depict their most preferred hesitant comprehensive evaluations. Especially with regard to linguistic decision-making settings, DMUs generally also often hold bipolar hesitant judgments (i.e., membership degrees and nonmembership degrees) [32] on voted linguistic terms, and group opinions will naturally exhibit as a probabilistic distribution to complement group hesitancy [31,33]. Therefore, based on the compound expression tool of the probabilistic linguistic term set as firstly introduced by Pang et al. [31], Xie et al. [33] put forward another extended expression tool called the dual probabilistic linguistic term set to accommodate probabilities as assigned to both membership and nonmembership terms. In responding to linguistic decision-making scenarios where majority-vote rules apply [34,35,36,37], Zhang et al. [12] proposed another compound expression tool known as the interval-valued dual hesitant fuzzy uncertain unbalanced linguistic set (IVDHF_UUBLS). IVDHF_UUBLS utilizes majority rule as an effective strategy to achieve general opinion consensus and also reflects DMU’s dual decision hesitancy to the consensus opinion, but fails to include collective probabilistic attitudes at the dual hesitancy. With this shortcoming in consideration, Zhang et al. [37] then extended IVDHF_UUBLS to probabilistic environments and constructed a more powerful compound expression tool called the probabilistic dual hesitant fuzzy uncertain unbalanced linguistic set (PDHF_UUBLS). With support from the powerful unbalanced linguistic scales [38], PDHF_UUBLS is capable of approximating the most pertinent consensus linguistic interval in group settings, depicting bipolar epistemic phenomena of DMUs through incorporation of dual hesitant fuzzy rationale, and capturing complementary probabilistic information to dual hesitancy, thus managing to elicit evaluative preferences of high uncertainty more comprehensively and precisely. Despite these advantages in elicitation of uncertainties, PDHF_UUBLS’s compound structure prevents its direct application to the aforementioned extant methodologies in the current RSS literature. Therefore, in order to empower decision-making processes for RSS with capabilities of more comprehensively capturing hybrid evaluative uncertainties, effective operational tools and decision-making methodologies deserve further investigations under a PDHF_UUBLS environment.
Correlation coefficient measures are intended to objectively investigate association relations between two fuzzy sets or fuzzy variables, and thus play a central role in uncertain decision making modelling [39,40,41,42,43,44], such as those scenarios with evaluative preferences in the form of intuitionistic fuzzy sets [39], interval-valued intuitionistic fuzzy sets [40], neutrosophic sets [45], Pythagorean fuzzy sets [46], hesitant fuzzy sets [47], etc. Correlation coefficients-based decision-making methodologies substantially enrich multicriteria decision-making frameworks, and their derived approaches have been successfully applied to resolve many real-life problems [44,47,48,49,50,51]. Generally, correlation coefficients generally fall into two classes [44]: statistics-based measures and information energy-based measures. Statistics-based correlation coefficients focus on the statistical traits (mean, standard deviation, etc.) of elements in fuzzy sets while neglecting values of elements [49,52,53]. Information energy-based correlation coefficients prefer exploiting information energy implied in fuzzy elements to derive association degrees [44,47]. However, in the special cases of hesitant fuzzy decision making where two hesitant fuzzy sets share the same mean and standard deviation, statistics-based correlation coefficients will generate counter-intuitive products thus lose applicability [48,49]. Of particular note, this specific dysfunction still holds for decision-making scenarios where evaluative preferences are expressed in the form of PDHF_UUBLS. Comparatively, information energy-based correlation coefficients manage to overcome the dysfunction by bypassing the pathways of statistics-based correlation coefficients, and thus manifest as more flexible and effective in addressing decision-making environments with compound hesitant fuzzy evaluative preferences [54,55,56]. Therefore, in this paper, we focus on developing information energy-based correlation coefficients for PDHF_UUBLS by considering its particular compound information structure, and then construct an effective correlation coefficients-based multicriteria group decision-making (MCGDM) methodology for RSS under PDHF_UUBLS environments.
Overall, current MCDM literatures on RSS are still lack an appropriate criteria system for intensive evaluation of supplier resilience and are inadequate in comprehensively depicting hybrid uncertainties in group evaluative preferences. In responding to these gaps, this paper establishes the corresponding contributions as follows.
Firstly, by reflecting generic dynamic process features in resilience conceptualization as implied in dynamic capabilities theory and risk management theory, this paper puts forward a capability attributes-based analytical framework as a criteria system for intensive evaluation of supplier resilience. In comparison with extant criteria systems in the RSS literature, the developed analytical framework systematically points out fundamental capability attributes and their indicators that enable resilience performance of suppliers, thus presenting a conceptionally clearer pathway for supporting RSS practices in various industrial scenarios.
Secondly, with the aim to tackle RSS with low-structured definitions more effectively, this paper constructs a correlation coefficients-based MCGDM methodology by incorporating PDHF_UUBLS for accommodating hybrid decision uncertainties in group decision-making settings. PDHF_UUBLS takes advantages of group judgment capacity and thus ensures the proposed MCGDM methodology is capable of being flexibly applied to concrete industrial applications where an increase or decrease in indicators of resilience capability is needed. The incorporation of theoretically compliant information energy-based correlation coefficients for PDHF_UUBLS, which is newly defined to overcome potential dysfunctions of statistics-based correlation coefficients in hesitant decision-making environments, also empowers the proposed MCGDM methodology with effectiveness and applicability.
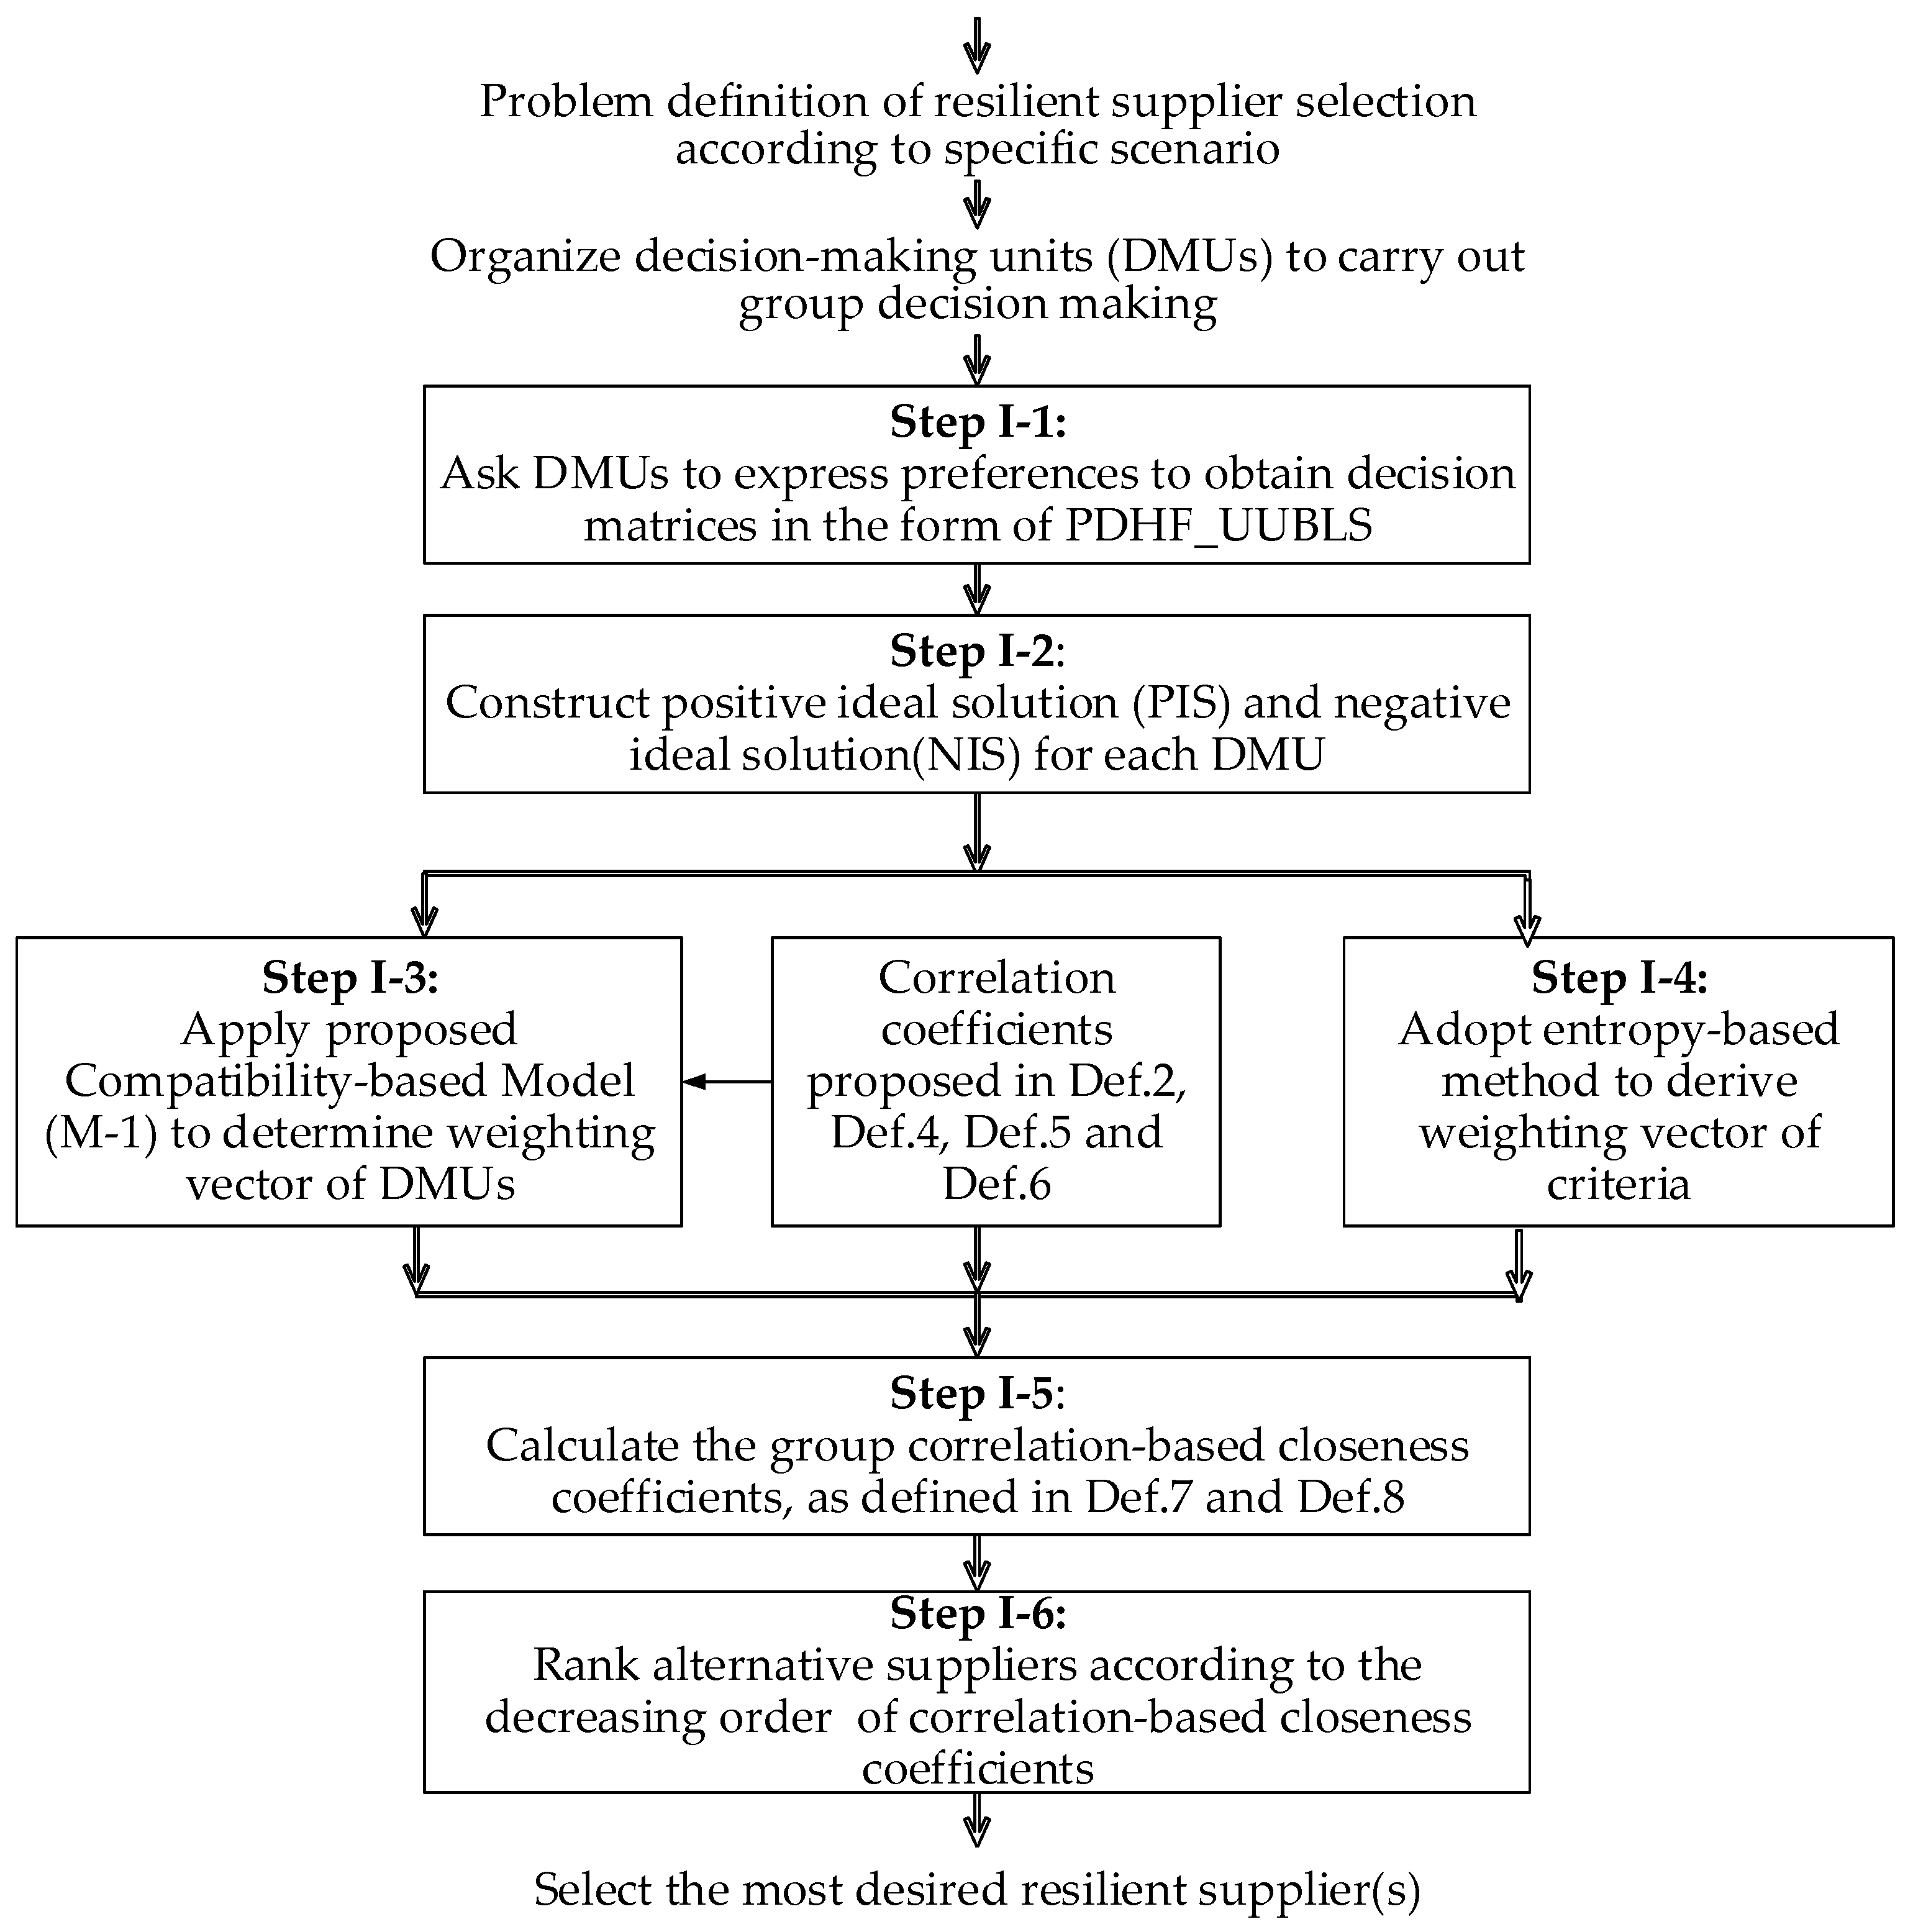
The remainders of this paper is organized as follows. Section 2 presents a literature review to show the obvious lack of systematic criteria for intensive evaluation of supplier resilience in the RSS literatures and to demonstrate the advantages of PDHF_UUBLS in conveying hybrid decision uncertainties in hesitant decision-making scenarios. From the processual view of resilience, Section 3 elaborates the fundamental capability attributes of suppliers as required in resilience processes, which then will be utilized as a criteria system in RSS for comprehensive evaluation of supplier resilience. Section 4 focuses on developing an effective multicriteria decision making approach for resilient supplier selection. To this end, we firstly put forward a series of correlation coefficients for decision-making modelling under PDHF_UUBLSs, including a statistics-based correlation coefficient, information energy-based correlation coefficient, and their weighted versions. Alongside this, corresponding analyses have been conducted to verify the theoretical compliance of all proposed correlation coefficients. Then, on the basis of these correlation coefficients of PDHF_UUBLSs and by use of extended correlation-based closeness coefficients, an effective MCGDM approach has been constructed, where a compatibility-based programming model has been introduced to obtain unknown weighting vectors for DMUs. Furthermore, an illustrative case study and comparative experiments have been carried out to verify the effectiveness of our proposed approach in Section 5. Section 6 presents some managerial insights from the perspective practical applications. Section 7 concludes our research, points out existing limitations and outlines some critical suggestions to enrich future research in the current domain.

2. Literature Review

2.1. Criteria Systems Adopted in Extant RSS Literatures

Criteria systems reflect the conceptualizations in various supplier selection problems. With special respect to RSS, extant studies mainly constructed their criteria systems by integrating conventional sustainability-oriented criteria and resilience-oriented criteria, because of the mutually supportive relations between sustainability and resilience. Representatively, Rajesh et al. [10] constructed a criteria system for RSS which advocated some resilience criteria (responsiveness and risk reduction) as well as primary economic and technical performance. Therein, sustainability was denoted as a safety and environmental concern, partially by comparing the classic three bottom lines in definitions of sustainability. In the light of the criteria system for RSS by Rajesh et al. [10], Valipour Parkouhi et al. [11] derived a hybrid BOCR (Benefits, Opportunities, Costs and Risks) model to accommodate concerns in the three bottom lines as required by sustainability. The hybrid BOCR still designated risk-oriented indicators to indirectly reflect the resilience performance of suppliers. Based on a comprehensive literature analysis, Amindoust [14] put forward a sustainable-resilient criteria system that included three dimensions of general, resilient and sustainable. And indicators in the criteria system showed clearer belonging relations to resilient criteria and sustainable criteria, respectively. In their criteria system of six attributes for RSS, Majumdar et al. [4] took two attributes (Cost and Quality) for primary concern, one for social sustainability specifically, and three (absorptive capacity, adaptive capacity and restorative capacity) for resilience performance. Although their research skipped systematic analysis of capabilities as required by resilience performance, Majumdar et al. [4] did derive indicators for resilience from the view of its conceptualization. Sahu et al. [15] presented a criteria system for lean-agile-resilient-green supplier selection, where the indicators of resilience were finer grained basically according to absorptive capacity, adaptive capacity and restorative capacity. Varchandi et al. [16] also integrated the three bottom line model of sustainability and resilience to form a criteria system for resilient-sustainable supplier selection, where all indicators are selected from pioneering studies according to appearance frequency. Most recently, Ulutaş et al. [9] continued to adopt the integrative framework of social, economic, environmental and resilience as a criteria system for green-resilient supplier selection, but utilized robustness, responsiveness and reliability as indicators to imply resilience, etc. As can be seen from the above RSS literature, their criteria systems only addressed supplier resilience by taking in certain indicators that mainly fall into categories of absorptive capacity, adaptive capacity and restorative capacity.
Actually, apart from sustainability’s classic social–economic–environmental framework, resilience conceptualization places more emphasis on the indispensability of transformative capabilities in upholding systems’ everlasting development in the form of adaptive-gain loops [57,58]. Jiang et al. [59] further pointed out that the adaptive-gain loops of resilience basically needed processual capabilities of sensing, seizing and transforming. Hence, it can be seen that criteria systems of the current literatures obviously lack in systematicity with regard to comprehensive evaluation of supplier resilience. Furthermore, the inadequacy prohibits the above pioneering research from direct applications to some common RSS problems. For instance, given operating marketplaces with increasingly fierce competition and high uncertainty, focal companies have to accordingly increment purchase quota for best contacted resilient strategic supplier(s); hence, RSS based on a criteria system for intensive evaluation of supplier resilience will be the core task. Therefore, to fill this gap, this paper takes the processual view of resilience and focuses on developing a more systematic criteria system for RSS.

2.2. MCDM Approaches Established in Extant RSS Literatures

Because of resilience criteria, RSS problems more explicitly exhibit low-structured features in their definitions. To this end, uncertain MCDM methodologies generally have been introduced and extended to tackle RSS scenarios of high uncertainties. Rajesh et al. [10] proposed an AHP-ANP model by use of linguistic terms and grey numbers to depict uncertainty in evaluative preferences. Valipour Parkouhi et al. [11] developed an grey VIKOR on the basis of fuzzy ANP. Amindoust [14] introduced a hybrid FIS-DEA model with linguistic evaluative preferences. Majumdar et al. [4] offered an extended TOPSIS to the trapezoidal intuitionistic fuzzy decision making environments. Sahu et al. [15] constructed a fuzzy decision support framework based on the integration of AHP, DEMATEL, ANP, MOORA and SAW. Zhang et al. [18] built a BWM-TOPSIS-PageRank model which has scenario-varying Z-numbers to represent preferences. Gökler et al. [19] put forward another integrative DAHP-DEMATEL model which employed D-numbers to describe uncertainty in decision preferences. By use of rough information to depict decision uncertainty, Ulutaş et al. [9] proposed a rough MAXC-LOPCOW-MACONT decision-making approach. Based on Choquet integral and prospect theory, Song et al. [20] devised another extended TOPSIS framework where evaluative preferences can be flexibly captured by variable precision rough set.
Torra [25] pointed out that decision makers often hesitated among alternative assessments for entities under evaluation due to low-structured definitions in complicated decision-making problems; thus, they put forward the hesitant fuzzy set to express decision hesitancy. Zhu et al. [32] further noticed that decision hesitancy holds bipolar features and introduced the dual hesitant fuzzy set to indicate bipolar hesitant judgments. Along with more incorporation of group decision-making mechanisms, MCGDM approaches based on hesitant expression tools have been increasingly established in the RSS literature. With respect to the green-resilient supplier selection problems, Alimohammadlou et al. [27] employed hesitant fuzzy set to capture decision hesitancy, then extended BWM and EDS to construct a MCDM model. In view of RSS problems with fuzzy and incomplete decision information, Chang [29] introduced a hesitant fuzzy framework to accommodate heterogeneous uncertain decision information and developed a corresponding flexible MCDM method. By hiring the probabilistic uncertain linguistic term set to capture the probabilistic complementary information in voted linguistic variables, Sun et al. [17] constructed a correlation coefficient-based MCGDM methodology for resolving RSS problems of high uncertainty. Most recently, Lei et al. [30] used a dual hesitant fuzzy set to address the bipolar phenomena under large group decision-making settings, then constructed a group decision-making methodology based on three-way decision and prospect theory. As can be seen, although they managed to address low-structured RSS problems from the specific concern of uncertainty of heterogeneous fuzziness, bipolar hesitancies or probabilistic feature in collective opinions, the above extant methodologies still lack capabilities for accommodating RSS problems of hybrid uncertainties. Toward this end, more powerful expression tools for handling hybrid uncertainties with respect to various complicated RSS tasks should be introduced and developed, and their corresponding effective methodologies deserve continuous investigations.

2.3. Hesitant Linguistic Expression Tools Suitable for RSS

Linguistic labelling systems serve as effective tools to approximate collectively acceptable opinions in decision-making processes [60]. Especially, the unbalanced linguistic labelling systems [38] allow decision-making units to utilize their most preferable labelling systems and manage to conveniently conform preferred labelling systems to a unified one by use of a linguistic hierarchy [61]. Unbalanced linguistic labelling systems include balanced labelling systems, which have been widely adopted in complex applications [62] as special cases, and thus manage to endow MCDM methodologies with greater flexibility and adaptability in tackling complicated problems of high uncertainties [63].
As indicated in above, there is an urgent need to introduce powerful expression tools to capture hybrid uncertainties in RSS of low-structured definitions so as to establish effective methodologies. Fittingly, advancements in the literature on linguistic expression tools have gradually exhibited pertinent pathways. Zadeh [64] first systematically introduced the linguistic variable to approximate reasoning, and then the linguistic variable was widely applied to various decision-making scenarios. Xu [22] extended linguistic variables to the uncertain form, which is capable of helping decision makers approximate their preferred linguistic label more easily and conveniently. However, along with increases in definitive complexity of uncertain problems, decision makers often hold additional attitudes to the preferred linguistic label. For this purpose, intuitionistic linguistic fuzzy sets have been introduced to depict the additional attitudes by use of membership degree and nonmembership degree, such as intuitionistic linguistic fuzzy set [65], intuitionistic uncertain linguistic variables [66], interval-valued intuitionistic uncertain linguistic [67], intuitionistic Z-linguistic variables [68], etc.
When it comes to decision-making problems of higher complexity, such as RSS, group decision-making mechanisms were increasingly incorporated to surpass the cognitive limits of single decision maker [21,22,23,24]. But, involvement of multiple decision makers often brings about decision hesitancy [25]. For this reason, hesitant fuzzy set then has been extended to develop hesitant fuzzy linguistic expression tools. Generally, the hesitant fuzzy linguistic term set [69] and hesitant fuzzy linguistic set [34] respectively entail their extended effective expression tools. The expression tools based on the hesitant fuzzy linguistic term set advocate multiple linguistic labels to represent decision hesitancy, such as extended hesitant fuzzy linguistic term sets [70], intuitionistic hesitant fuzzy linguistic term sets [56], multigranular unbalanced hesitant fuzzy linguistic term sets put forward most recently in Ref. [63], and others. The expression tools based on the hesitant fuzzy linguistic set emphasize multiple membership degrees and nonmembership degrees to denote decision hesitancy in additional attitudes to the collectively preferred linguistic label, such as interval-valued hesitant fuzzy linguistic sets [34], among others. Further, the bipolar phenomena of decision hesitancy was acknowledged in the literature, and dual hesitant fuzzy sets [32] were then utilized to enhance the above hesitant linguistic expression tools. For representative instances, Tao et al. [71] recently proposed the linguistic dual hesitant fuzzy term set that denoted both membership and nonmembership degrees by use of the hesitant fuzzy linguistic term set. Based on the information structure in the hesitant fuzzy linguistic set [34], Qi et al. [72] devised the interval-valued dual hesitant fuzzy linguistic set to additionally consider hesitant nonmembership degrees in interval values. Feng et al. [73] further generalized this method by introducing the interval-valued q-rung dual hesitant linguistic set.
In another respect, Pang et al. [31], for the first time, systematically introduced the probabilistic linguistic term set, which captures probabilistic features of collective attitudes to preferred linguistic label(s) in group decision-making settings. Since then, hesitant fuzzy linguistic expression tools have been gradually customized to more compound structures for conveying hybrid features of decision uncertainty. Typically, Xie et al. [33] further introduced the dual probabilistic linguistic term set in which both membership and nonmembership terms were assigned with collective probabilities. By use of newly defined probabilistic linguistic term pairs to describe probabilistic distribution associated with linguistic terms, Wang et al. [74] recently introduced the probabilistic hesitant fuzzy linguistic term set. Gong et al. [75] extended the probabilistic linguistic dual hesitant fuzzy set to consider probabilities for both membership and nonmembership degrees. By taking advantage of the unbalanced linguistic scale system in approximating group consensus opinions, Zhang et al. [37] recently developed the probabilistic dual hesitant fuzzy uncertain unbalanced linguistic set (PDHF_UUBLS).
Most recently, efforts in the hesitant linguistic literature also continue to take on developmental studies on uncertainty measures and application investigations on practical applications. For example, Zhao et al. [63] introduced an entropy measure by simultaneously considering hesitation and fuzziness for the hesitant fuzzy linguistic term set. Fang [76] developed some hybrid entropy and cross-entropy measures for the probabilistic linguistic term set. To facilitate MCDM decision-making modelling, Zhang et al. [37] put forward effective distance and entropy measures for their probabilistic dual hesitant fuzzy uncertain unbalanced linguistic set, among others. With regard to application investigations, Yue et al. [77] developed a probabilistic linguistic MCDM approach based on prospect theory to resolve the carpooling matching problems. To rationally recommend tourism attractions according to online reviews, Yang et al. [78] developed an evidence theory-based MCDM methodology by use of the probabilistic linguistic term set. Guo et al. [79] constructed an effective probabilistic linguistic MCDM framework for offshore photovoltaic risk assessment, where consensus-reaching mechanisms were designed and integrated.
To more clearly show the comparative advantages of various hesitant linguistic expression tools, the aforementioned representative studies and their features have been recorded in Table 1. For full explanations of the nomenclatures in Table 1, one can refer to the Abbreviations section at the end of the paper. As seen from Table 1, the adopted expression tools in extant RSS studies are all incapable of comprehensively addressing decision hesitancy and other hybrid uncertainties of evaluative preferences in group decision-making settings. Comparatively, PDHF_UUBLS [37] is capable of approximating the most pertinent consensus linguistic interval by use of an unbalanced linguistic scaling system, depicting bipolar epistemic phenomena of DMUs through incorporation of dual hesitant fuzzy rationale, and capturing complementary probabilistic information for dual hesitancy. PDHF_UUBLS thus manages to delineate collective evaluative preferences characterized with decision hesitancy and hybrid uncertainties more appositely and comprehensively, thereby enabling itself as a pertinent expression tool to tackle RSS problems with lower-structured definitions. Therefore, this paper employs PDHF_UUBLS to handle expression of decision preferences for supplier resilience evaluation, focuses on developing correlation coefficients for PDHF_UUBLS in accordance with current domain research trends, and then establishes effective correlation coefficients-based MCGDM methodology to complicate RSS solving. In the following section, we firstly derive capability attributes from the processual view of resilience process, which will work as a criteria system for RSS in this paper.

3. Capability Attributes of Suppliers Required in Resilience Process

Resilience thinking provides another effective pathway to explain why focal company and suppliers survive from dynamic disturbances in business environments [6,91]. Resilience essentially empowers the continuous achievement of multiple sources of competitive advantages, and thus has been recognized as an imperative type of dynamic capability which supply chain players must develop [92,93,94]. Resilience building includes the development of not just one capability but a set of capabilities that uphold the whole resilience process [91]. Scholten et al. [95] emphasized that capabilities for supply chain resilience building should be identified and developed according to their stages in the resilience process. Therefore, the processual view of resilience offers a rational perspective to derive capability attributes for comprehensive evaluation of supplier resilience.
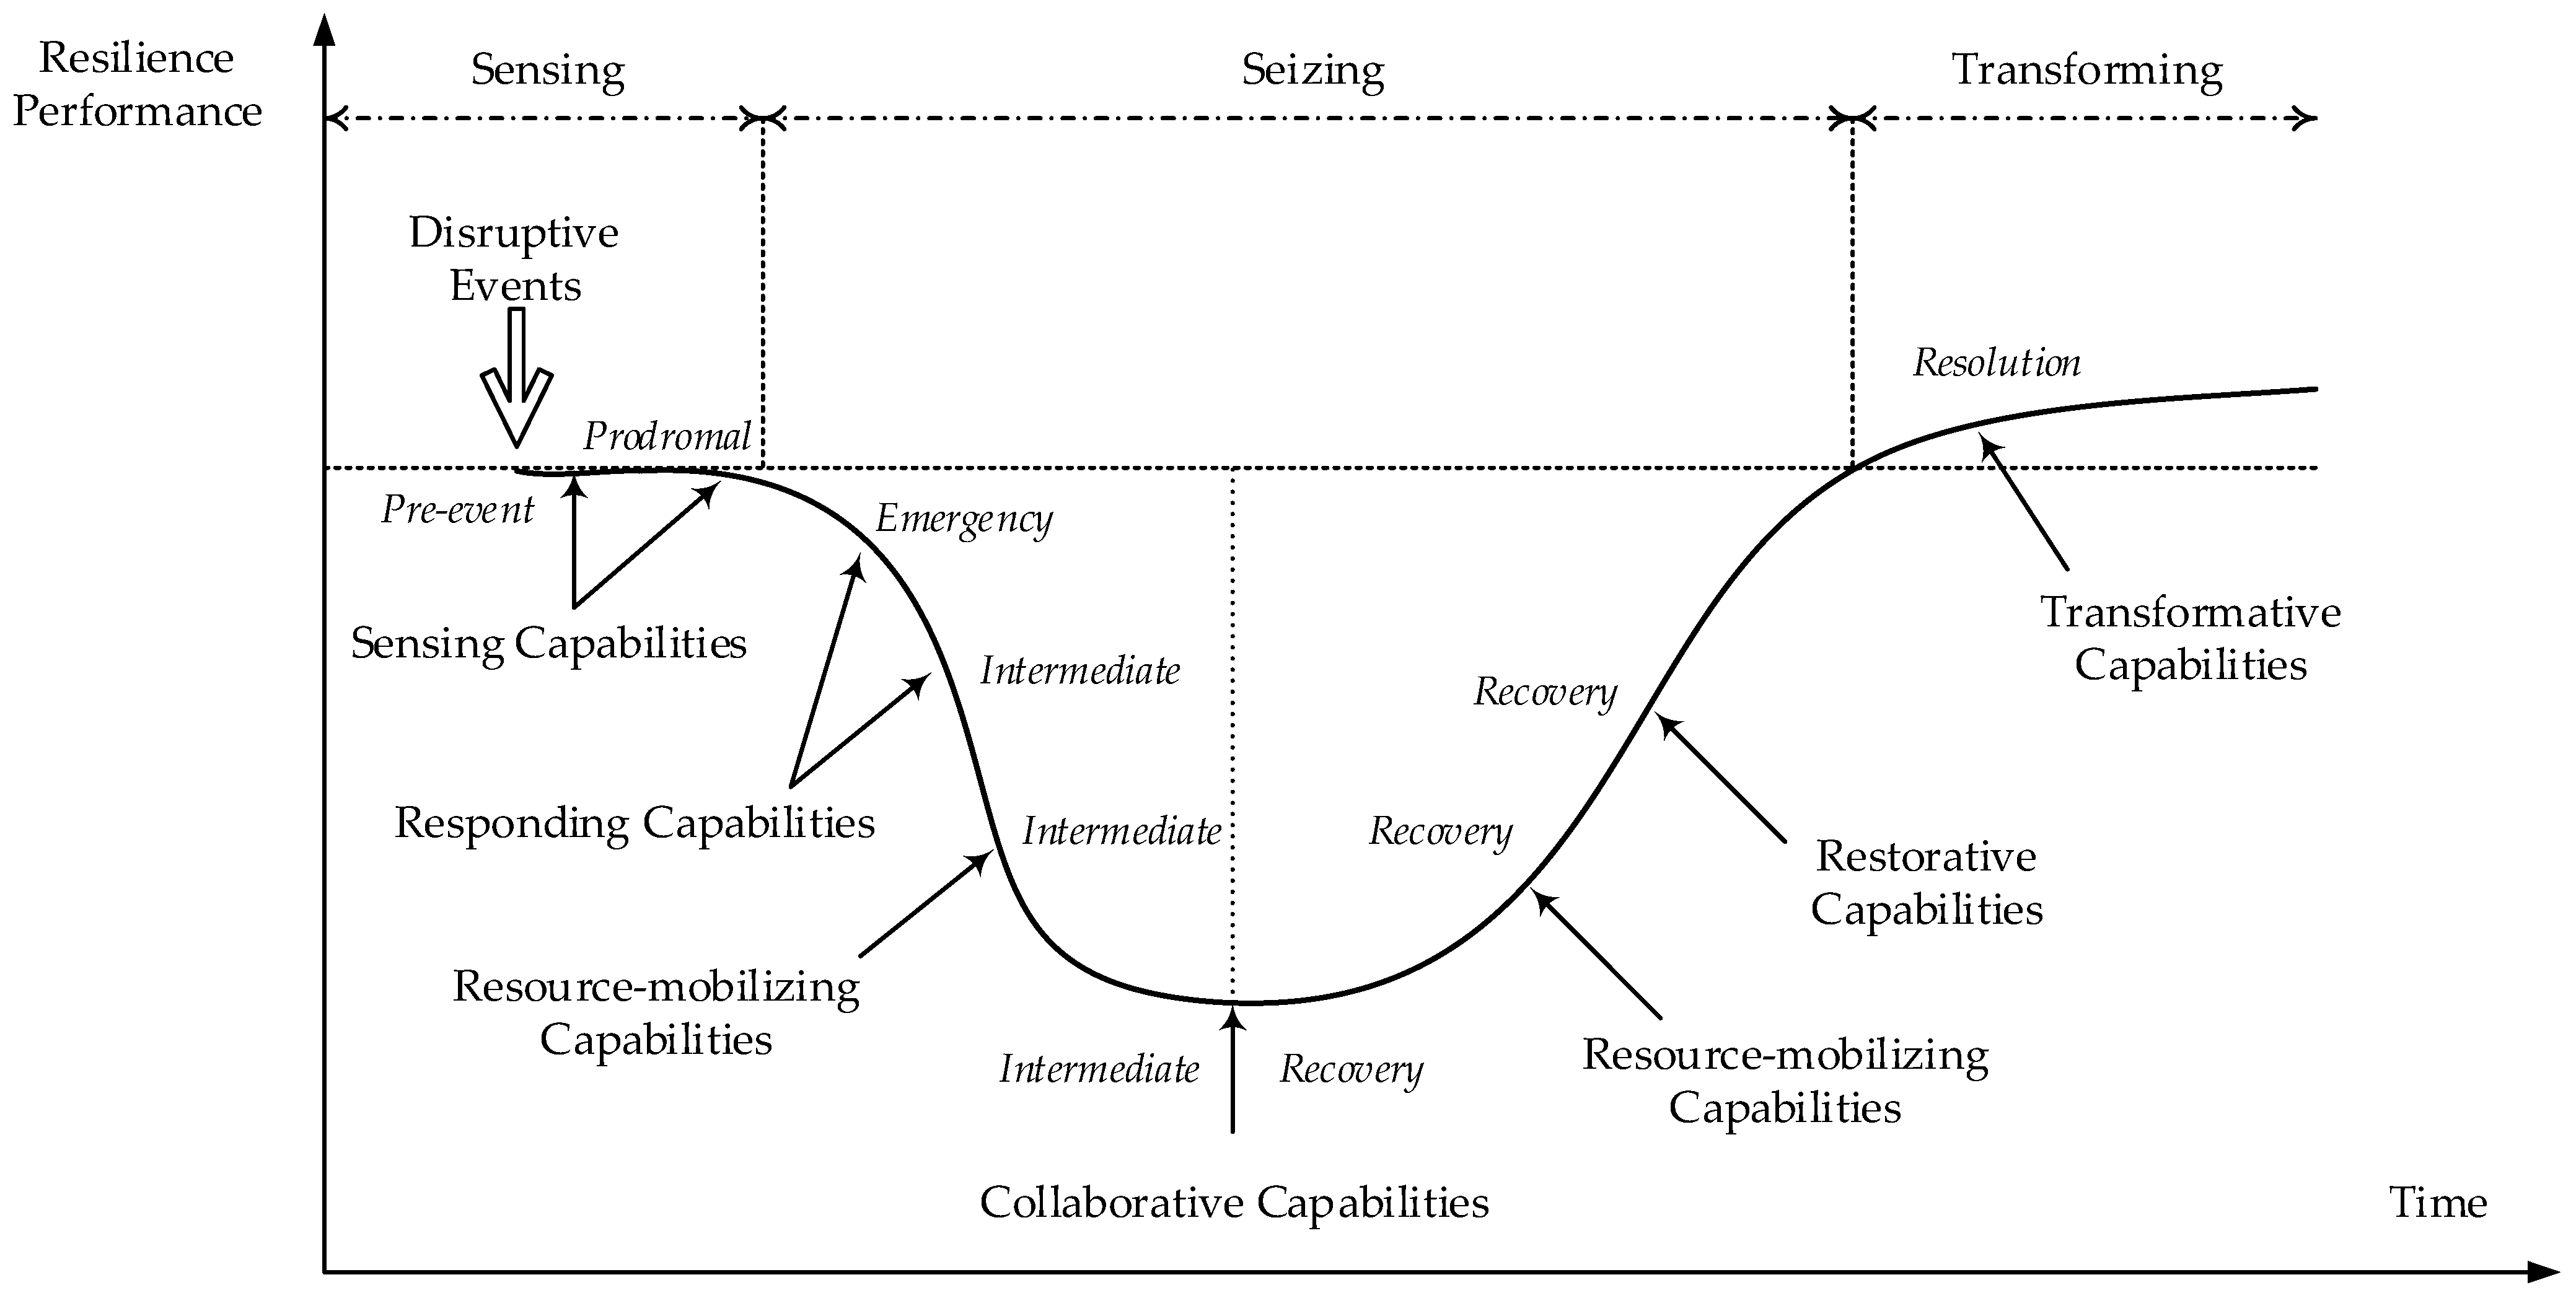
According to dynamic capability theories [92,93,94], the resilience process generally can be divided into three phases of sensing, seizing and transforming. By holding the same purpose of explaining organizational responding processes to disruptive events, disaster and crisis management theories [96,97,98] believed that organizational responding processes should be well orchestrated according to six phases of pre-event, prodromal, emergency, intermediate, long-term recovery and resolution. As can be observed, dynamic capability theories and disaster and crisis management theories both stress proactive and processual characteristics of organizational responses to disruptive events, and their derived frameworks are intrinsically consensus-based and complementary for developing phase-compatible capability attributes for supplier resilience. By comparative mapping in their definitions, we derive the relations between the above two phase-division models, as shown in Figure 1. Straightforwardly, pre-event and prodromal phases call for sensing capabilities. Emergency, intermediate and recovery phases require more details regarding the phase of seizing and present directions to deduce corresponding supportive capabilities. The resolution phase emphasizes the accumulation and transformation of knowledge obtained in former phases into updated practices so as to enhance resilience performance, thereby indicating desirable transformative capabilities.
Therefore, to identify pertinent capability attributes of suppliers that uphold their multi-phase performance in resilience process, five experts (three from academic, one from dairy industry, one with both academic and 3PL backgrounds) are organized to carry out literature analysis. After ‘supplier selection’, ‘resilient supply chain’ and ’resilient supplier selection’ were applied as keywords into the Web of Science, 124 papers since 2015 were crosschecked as topic-relevant ones, among which 70 papers were referred in this section based on their close relevance to building resilience criteria. According to the rationale in Figure 1, experts finally recognized six types of capabilities to evaluate supplier resilience, that is, sensing capabilities, resource-mobilizing capabilities, responding capabilities, collaborative capabilities, restorative capabilities and transforming capabilities, which serve as a criteria system to enhance MCGDM methodologies for resilient supplier selection. In the following, according to consensus opinions of all experts, we elaborate the conceptualization of the six criteria and their belonging basic indicators.

3.1. Sensing Capabilities

Resilience thinking takes proactive attitudes to environmental changes and disturbances rather than traditional reactive ones, sensing that capabilities of resilient suppliers are indispensably demanding because sensing dynamic changes in environments leads to strategic preparedness for quick and successful responses [99,100]. Sensing capabilities have the responsibilities of monitoring business environmental changes, investigating self-vulnerability, and formulating action plans. Under VUCA business environments, effective environmental monitoring needs suppliers to implement transparency and traceability of supply chain business in order to timely identify and reduce potential risks [101]. To this end, systematic applications of information and data technologies thus have been widely prompted in facilitating supply chain navigation. Data integration and information sharing bolsters competences of warning, communicating and forecasting to enhance dynamic sensing efficacy [102,103,104]. Specifically, to avoid overreactions, unnecessary interventions and ineffective decisions [105], business intelligence systems should be generally deployed to ensure the forecasting competences of suppliers [106,107,108].
Obviously, environmental monitoring enables suppliers to dynamically know the status quo of self-conditions and business environmental changes, thereby promoting development of self-vulnerability investigation competences [109]. Risk scanning and analysis thus were frequently nominated as a demanding functionality for self-vulnerability investigation so as to effectively target change influences with specific regard to various potential disruptive scenarios [11,110,111]. Meanwhile, the knowledge base derived from self-vulnerability investigation constitutes the foundation of supplier’s contingency planning capability. Contingency planning focuses on identifying undesirable events or situations and deciding how to respond based on self-vulnerability investigation [112]. With respect to key production systems and information infrastructures, proactive and preventative maintenance routines are required to secure suppliers’ business continuity under impacts [113,114]. To effectively resist shocks caused by potential events, contingency planning should also incorporate redundancy building by taking diversified and flexible supply chain design [109,115] and determining rational inventory levels as required in various risk scenarios [107]. For the purpose of implementing systematic coordination in contingency planning, hierarchical strategic contingency teams should be stitched together from all levels in a supplier’s organization through participation and empowerment [109,114,116].

3.2. Resource-Mobilizing Capabilities

From a generic point of view, van de Wetering et al. [117] referred an organization’s mobilizing capability to its power in evaluating, prioritizing and selecting appropriate solutions to a given organizational objective and power in locating desirable resources of the solutions. In times of external shocks, suppliers should make quick decisions on alternative contingency plans according to signals from sensing capability and mobilize resources in line with these plans [118,119]. Therefore, here we define suppliers’ resource-mobilizing capability as identifying and prioritizing potential contingency plans and locating firm resources to support implementation of these contingency plans in resilience processes. To guarantee fast decision making on pertinent contingency plans, Faulkner [96] pointed out that arrangement mechanisms for organizing teams of leadership, and ad hoc teams are required in the first place. Then, analytical and mapping capability [120,121] has been broadly suggested in fast decision-making process because this specific capability can translate dynamic signals from sensing capability into real-time simulations of business functions and pinpoint effect propagation of disturbances across supply chain networks. For reducing chaos in mobilizing resources of selected contingency plans, prioritization mechanisms which dynamically construct protocols to orchestrate desirable resources were recognized as key prerequisites to take action on resilient responses [122]. Vakilzadeh et al. [123] advocated that integrative information systems can substantially decrease uncertainty in communications about prioritization among the contingency plans, thus efficiently expediting consensus of prioritization protocols. From the organizational behavioral perspective, Menon et al. [124] indicated that the mobilization capacity of organizational members was determined not only by the members’ ability to locate resources but also by their cooperative intent to exchange within relationship networks. Analogously, suppliers’ resource-mobilizing capabilities required in resilience process concurrently rely on prioritization protocols to secure resources and on institutional designs to consolidate integrative resource repositories [107,125,126,127] such as institutional arrangements about accountability mechanisms [128], cross-functional database systems integration [129], collective knowledge resource sharing [130], among others.

3.3. Responding Capabilities

Christopher et al. [7] observed that supply chains were often at risk due to belated responses when confronting a disruptive event. Researchers of resilient supply chain management pointed out that responding capabilities of supply chains directly determine the depth and width of disruptive events’ influences on supply chain operations [107], and thus advocated that the focal company and suppliers should agilely respond to dynamically changed conditions therein [7,101,105]. Therefore, ’agility’ has been generally employed in the literature to indicate how the responding capabilities of supply chain members should be addressed in order to align with priorities and to accomplish required goals promptly [99,114,131,132,133].
According to Christopher et al. [7], responding capabilities can be recognized from the performance of two basic dimensions of agility, visibility and velocity, where visibility acts as the presumption and foundation, while velocity is the primary manifestation. Generally, visibility indicates suppliers’ ability to navigate inventories, demands, purchasing schedules and production systems, thereby contributing to suppliers’ resilience building [10,127]. Visibility empowers suppliers with the derived traceability to figure out details of materials of parts, processual descriptions of production, and trajectories of products under delivery [134]. Obviously, information management ability of systematically collecting and sharing business processual information is imperative in fostering suppliers’ visibility performance [16]. Tavana et al. [135] stressed that, in today’s digital landscape, digital capability draws on information management ability to realize digitally integrative control of fundamental resources rather than just transparency and access to data, and thus can significantly improve suppliers’ response efficacy in the case of disruptive events. As can be observed, visibility-related capabilities lay solid foundations and provide powerful platforms for suppliers’ to further consolidate velocity performance.
With respect to the velocity dimension, responding capabilities basically have to demonstrate efficacy in coping with identifiable and unknown events. As for identifiable potential events, velocity demands responses to disturbances within a minimal possible time [136], and therefore mechanisms to boost efficiency of contingency plan execution were normally prompted [106], such as learning [137], training [137], simulation and exercise [27,138], among others. With regard to unknown events, Smith et al. [139] emphasized that capability of flexible strategy design is of utmost importance to quick responses. Capability of flexible strategy design enables suppliers to quickly determine optimal alternative solutions or directions to establish collaborative mechanisms in sourcing [134,139], to ensure emergency production [15,140], to adjust product mix [11,16], etc. Mohaghegh et al. [100] further elaborated that the implementation of flexible strategies practically relies on suppliers’ reconfiguration capability which is normally characterized by production reengineering competences [101,132], business process adjustment competences [133], dynamic supply allocation competences [112,114,116], logistics network optimization competences [111,127,141], etc.

3.4. Collaborative Capabilities

Successful supply chain management definitely depends on cross-organizational collaboration between the focal company and its suppliers. Especially when confronting disturbances from business environments, supply chain resilience cannot be developed in a vacuum, and resilience processes cannot take shapes solely based on supply chain members’ own internal strengths [130]. In building supply chain resilience, collaborative capabilities pave ways to collectively manage risks and respond to disturbances effectively [101,142]. Through complementing key resources and decreasing information and knowledge asymmetry, collaborative capabilities can significantly alleviate impacts of disruptive events and bolster flexibility and agility in adaptation [101,126,143], and thus are intrinsically imperative to ensure holistic recovery in resilience processes [144,145]. With respect to enforcing coordination on the supply chain, inter-organizational characteristics of collaborative capabilities determine that suppliers’ strategic integration capability serves as the foremost precondition [146] because strategic consistency acts as a foundation to resilience building in supply chains [100,147]. Institutional theory suggests that suppliers should improve legitimacy of organizational strategical programs to minimize potential operational risks when deploying collaborative capabilities [99,148,149]. Contractual capacity indicates suppliers’ competences to plan and control the fulfilment of collaborative tasks, thereby catalyzing and consolidating mutual trust that endorses suppliers’ collaborative capabilities [99,114,116]. Zeng et al. [150] highlighted that competences in risk management-oriented system collaboration directly embody resilience building in supply chains, are especially capable of optimizing integrative efficacy of risk communication and knowledge learning through digital encapsulation [108], and thus act as technical infrastructure to support collaborative capabilities [129]. To consolidate the gains of collaboration as required in resilience processes, Raji et al. [151] emphasized the importance of problem solving-oriented competences to suppliers’ collaborative capabilities, because cross-boundary joint actions are frequently called upon to tackle various disruptive events [114].

3.5. Restorative Capabilities

When impacts of a disruptive event have been stabilized, suppliers must immediately take actions to bring production to normalcy [15,152]. Restorative capabilities thus were defined to indicate suppliers’ capacity for efficiently carrying out recovery protocols so as to bounce back to normal operating states [107,134,152,153]. The efficiency advocated in restorative capabilities refers to the speed of suppliers to recover to their normal operations after stabilization of an event, while the efficiency in responding capabilities stresses the speed of taking response actions at the beginning of an event [106]. Additionally, as can be observed from resilience processes, restorative capabilities have less time pressure and thus must cover the items that could not be quickly accommodated at the phase in which responding capabilities operate [96,97,154], such as repair of damaged infrastructure, correcting environmental problems, etc.
Considering the availability of time and the objective of achieving a systematic restoration, competences for comprehensive scanning, analysis and identification are critical in upholding restorative efficacy, such as business impact analysis [155,156], interdependency identification of key infrastructure components [157], resource reconfiguration scale analysis [158], among others. The above competences identify the protocols to meet in business continuity plans, while performance of restorative capabilities will be primarily determined by the execution efficiency of business continuity plans [98]. Given different impact degrees of disruptive events, Han et al. [106] outlined that effective implementation of business continuity plans is subject to enablers of suppliers’ restorative capabilities [14]. Hosseini et al. [159] noted that monetary capital is decisively required for suppliers to go through restoration. Adequate and timely resource investment will enable suppliers to accomplish restoration more quickly [160]. Amindoust [14] accentuated technical resource restoration as another major enabler of suppliers’ restorative capabilities. In the literature, technical resource restoration generally refers to the suppliers’ capability to restore damaged equipment, facilities and systems [159], and technical competence for total productive maintenance (TMP) was usually adopted to indicate suppliers’ adequacy in technical resource restoration [112,113,114]. Amindoust [14] underscored that success of technical resource restoration also depended on well-suited human resources. As elaborated from the perspective of risk management in related studies, a clear human resource reallocation mechanism guarantees optimized maximum team capacity at work and thus serves as a prerequisite for on-schedule progress of technical resource restoration [100,125]. Furthermore, in the case of disruptive events, the execution efficacy of technical resource restoration hinges on a sound routinized learning mechanism, which ensures continuously updated knowledge acquisition and cutting-edge skill enhancement [106,137,154,161].

3.6. Transformative Capabilities

Essentially, resilience theory recognizes that, after responses to a disturbing event, social-ecological systems will adapt to an equilibrium state of the original level or often to a better equilibrium state, which means resilience processes are typical adaptive-gain loops [57]. With respect to the VUCA characteristics of current business environments, competitiveness-induced business dynamics actually force supply chain members to transform to a better equilibrium state rather than the original one through resilience process [101]. Adobor et al. [162] explained that supply chain resilience processes need transformative capabilities to continuously decrease vulnerabilities by deriving improvements on current operations [101], thereby enabling supply chain members to take more effective actions in the case of analogical disruptive events [107]. Transformative capabilities refer to an organization’s capacity of introducing fundamental changes and corresponding strategies that inject new dynamics for achieving continuous competitiveness on a long-term basis [162]. As observed, in order to systematically update supply chain resilience to a new fitness level after a disruption, suppliers also should develop transformative capabilities during their resilience building.
Therefore, transformative capabilities behave as another key capability attribute to constitute the adaptive-gain loop of suppliers’ resilience process. To this end, processual information documentation and data analysis serve as the foremost fundamental preconditions. Ghobakhloo et al. [163] argued that digital capability took effect as the enabling foundation towards organizational transformation. Digital capability obviously depends on the suppliers’ information infrastructure that manages operational data collection and orchestration at all levels for decision making [103]. And smart digitalization capability contributes to digital capability by providing functional elements required in digitalized transformation of product design and process development [108,163], such as multiple perspectives of measurement, flexible visualization, transparency, digital encapsulation, etc.
Although digital capability cements the information foundation, effective and efficient organizational transformation intrinsically needs knowledge management capability that rises above and beyond digital capability [114]. Organizational knowledge about deep understanding of supply chain dynamics, especially derived from disruptive events, is essentially important to suppliers’ resilience [101]. Organizational knowledge intensively represents an organization’s memory about disruptive events and empowers the organization to exploit opportunities in a VUCA business environments [164]. Ghobakhloo et al. [163] has further elaborated that knowledge base construction is the key lever to knowledge management, and knowledge bases are capable of catalyzing suppliers’ innovativeness, which is imperatively required in boosting their transformative capabilities.
One of the most direct manifestations of knowledge absorption is enhancement of innovation and development capability [107,109], and the latter is recognized as the primary driving force behind organization transformation in resilience processes [110,138]. Innovation and development capability refers to suppliers’ capacity to learn from disruptive events and incorporate product and process innovations to keep up with new dynamics of business environments [114,125,163,165]. To this end, suppliers should have adequate R&D competences to implement innovations through new technology utilizations that create key avenues to shore up innovation and development capability [166]. Moreover, in answering to changes in business environments, innovation and development capability naturally needs advancements of business processes to more efficiently circulate values in upgraded products [163]. Therefore, business process development capability of suppliers has also been included as another pillar to support their innovation and development capability, such as digital transformation of business processes [108,158], integration of O2O business processes [15], etc.
In the interest of clarity, the following Table 2 organizes the above six fundamental capability attributes according to their main descriptors for comprehensive evaluation as required in resilient supplier selection.

4. MCGDM Approach for Resilient Supplier Selection Based on Correlation Coefficients of PDHF_UUBLS

4.1. Formative Description of Typical Resilient Supplier Selection Problems

Because of the intrinsic complexity in resilience conceptualization [167], research domains generally define resilient supplier selection (RSS) as a category of uncertain multi-criteria decision-making problems where evaluative preferences are often characterized with vague [9,15], hesitant [27] and probabilistic descriptions [17,31]. Nevertheless, to avoid more uncertainty due to a single decision maker’s experience and cognition, group decision-making methodologies were strongly suggested in resolving RSS problems [21,22,23,24]. Generally based on the above perceptions and Refs. [4,9,10,11,12], here in this paper, we can formalize the RSS problems as follows.
Suppose a focal company in the food industry wants to enhance supply chain resilience through resilient supplier selection. Let X = { x 1 , x 2 , , x n } represent a set of strategic suppliers under evaluation according to resilience criteria. C = { C 1 , C 2 , , C m } denotes the resilience criteria or attributes by considering which decision-making units will comprehensively evaluate corresponding resilience performance of each supplier. E = { E 1 , E 2 , , E t } is used to indicate a total of t experts or t decision-making units that will be organized to partake in the process of group decision making. By collecting adequate preference information given by E k ( k = 1 , , t ) to each alternative supplier x i ( i = 1 , , n ) under each criterion or attribute C j ( j = 1 , , m ) , a total of t decision matrices can be established. Then, based on the t decision matrices, appropriate multi-criteria group decision making (MCGDM) approach has to be constructed and applied to derive the ranking result to the suppliers of X = { x 1 , x 2 , , x n } , which will be further utilized for adjustment of supply networks or supplier development.
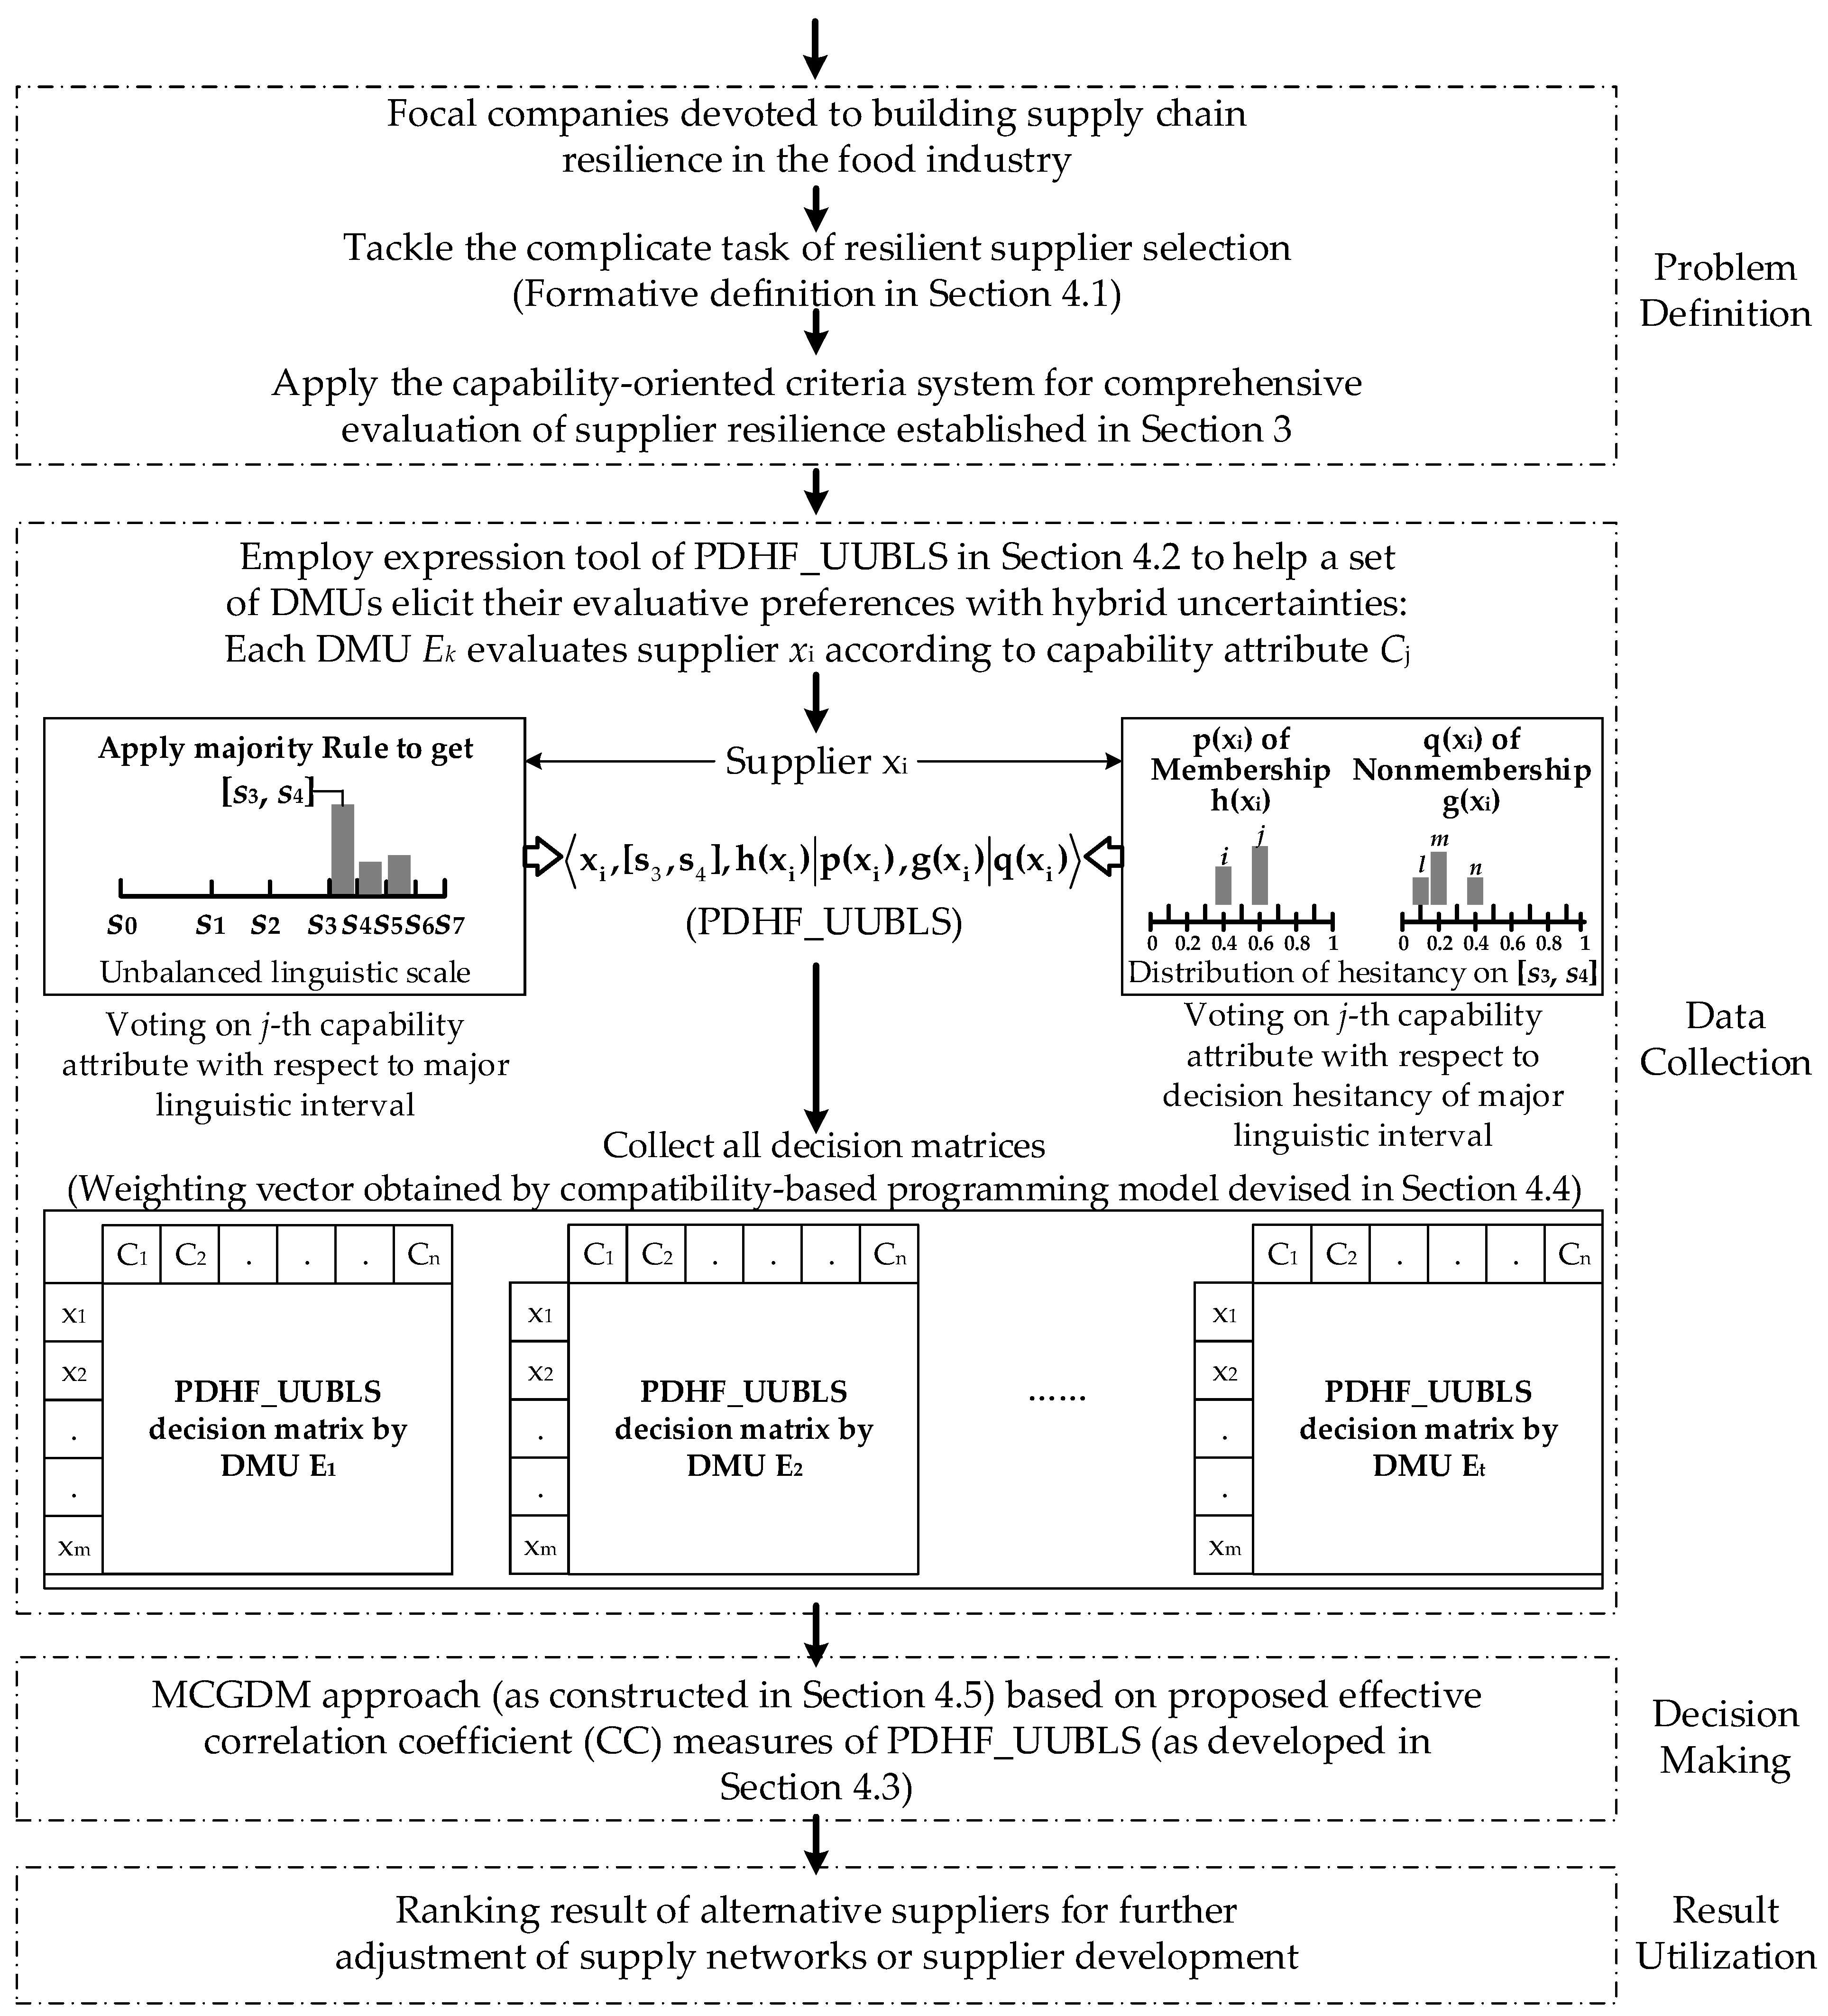
To tackle the above typical type of RSS problems, Section 2 has constructed a novel capability attributes-based criteria system for RSS from the processual perspective of resilience. As has already been verified in RSS studies [9,15,17,27,31], similar phenomena of semi- and low-structured problem definitions in our constructed criteria system will also give rise to hybrid uncertainties in evaluative preferences of decision-making units. To accommodate these hybrid uncertainties, the compound expression tool of a probabilistic dual hesitant fuzzy uncertain unbalanced linguistic set (PDHF_UUBLS), introduced by Zhang et al. [37], has unique adequacy in approximating the most pertinent consensus linguistic interval, depicting bipolar epistemic phenomena of decision makers and capturing group complementary probabilistic information to dual hesitancy. Therefore, in the following, this paper focuses on developing a MCGDM approach to resolve the above RSS problems under PDHF_UUBLS environments, where novel correlation coefficient (CC) measures of PDHF_UUBLS will be devised to support effective decision-making modelling. For clarity, the overall methodological flowchart of resolving the above typical RSS problems is demonstrated in Figure 2.

4.2. Basic Notions of PDHF_UUBLS

As shown in Figure 2, the probabilistic dual hesitant fuzzy uncertain unbalanced linguistic set (PDHF_UUBLS) is utilized to empower DMUs in expressing their collective opinions by comprehensively capturing hybrid uncertainties in linguistic scaling-based approximation, decision hesitancies and their supplementary probabilistic attitudes. In this subsection, we briefly look back original definition, score function and deviation degree for applications in following subsections.
Definition 1
([37]). Suppose  X  is a fixed set and  S  is a finite and continuous unbalanced linguistic label set. Let  L p  represent a probabilistic dual hesitant fuzzy uncertain unbalanced linguistic set (PDHF_UUBLS) on  X , which can be defined as
L p = x i , s ˜ ϑ ( x i ) , h ( x i ) p ( x i ) , g ( x i ) q ( x i ) x i X ,
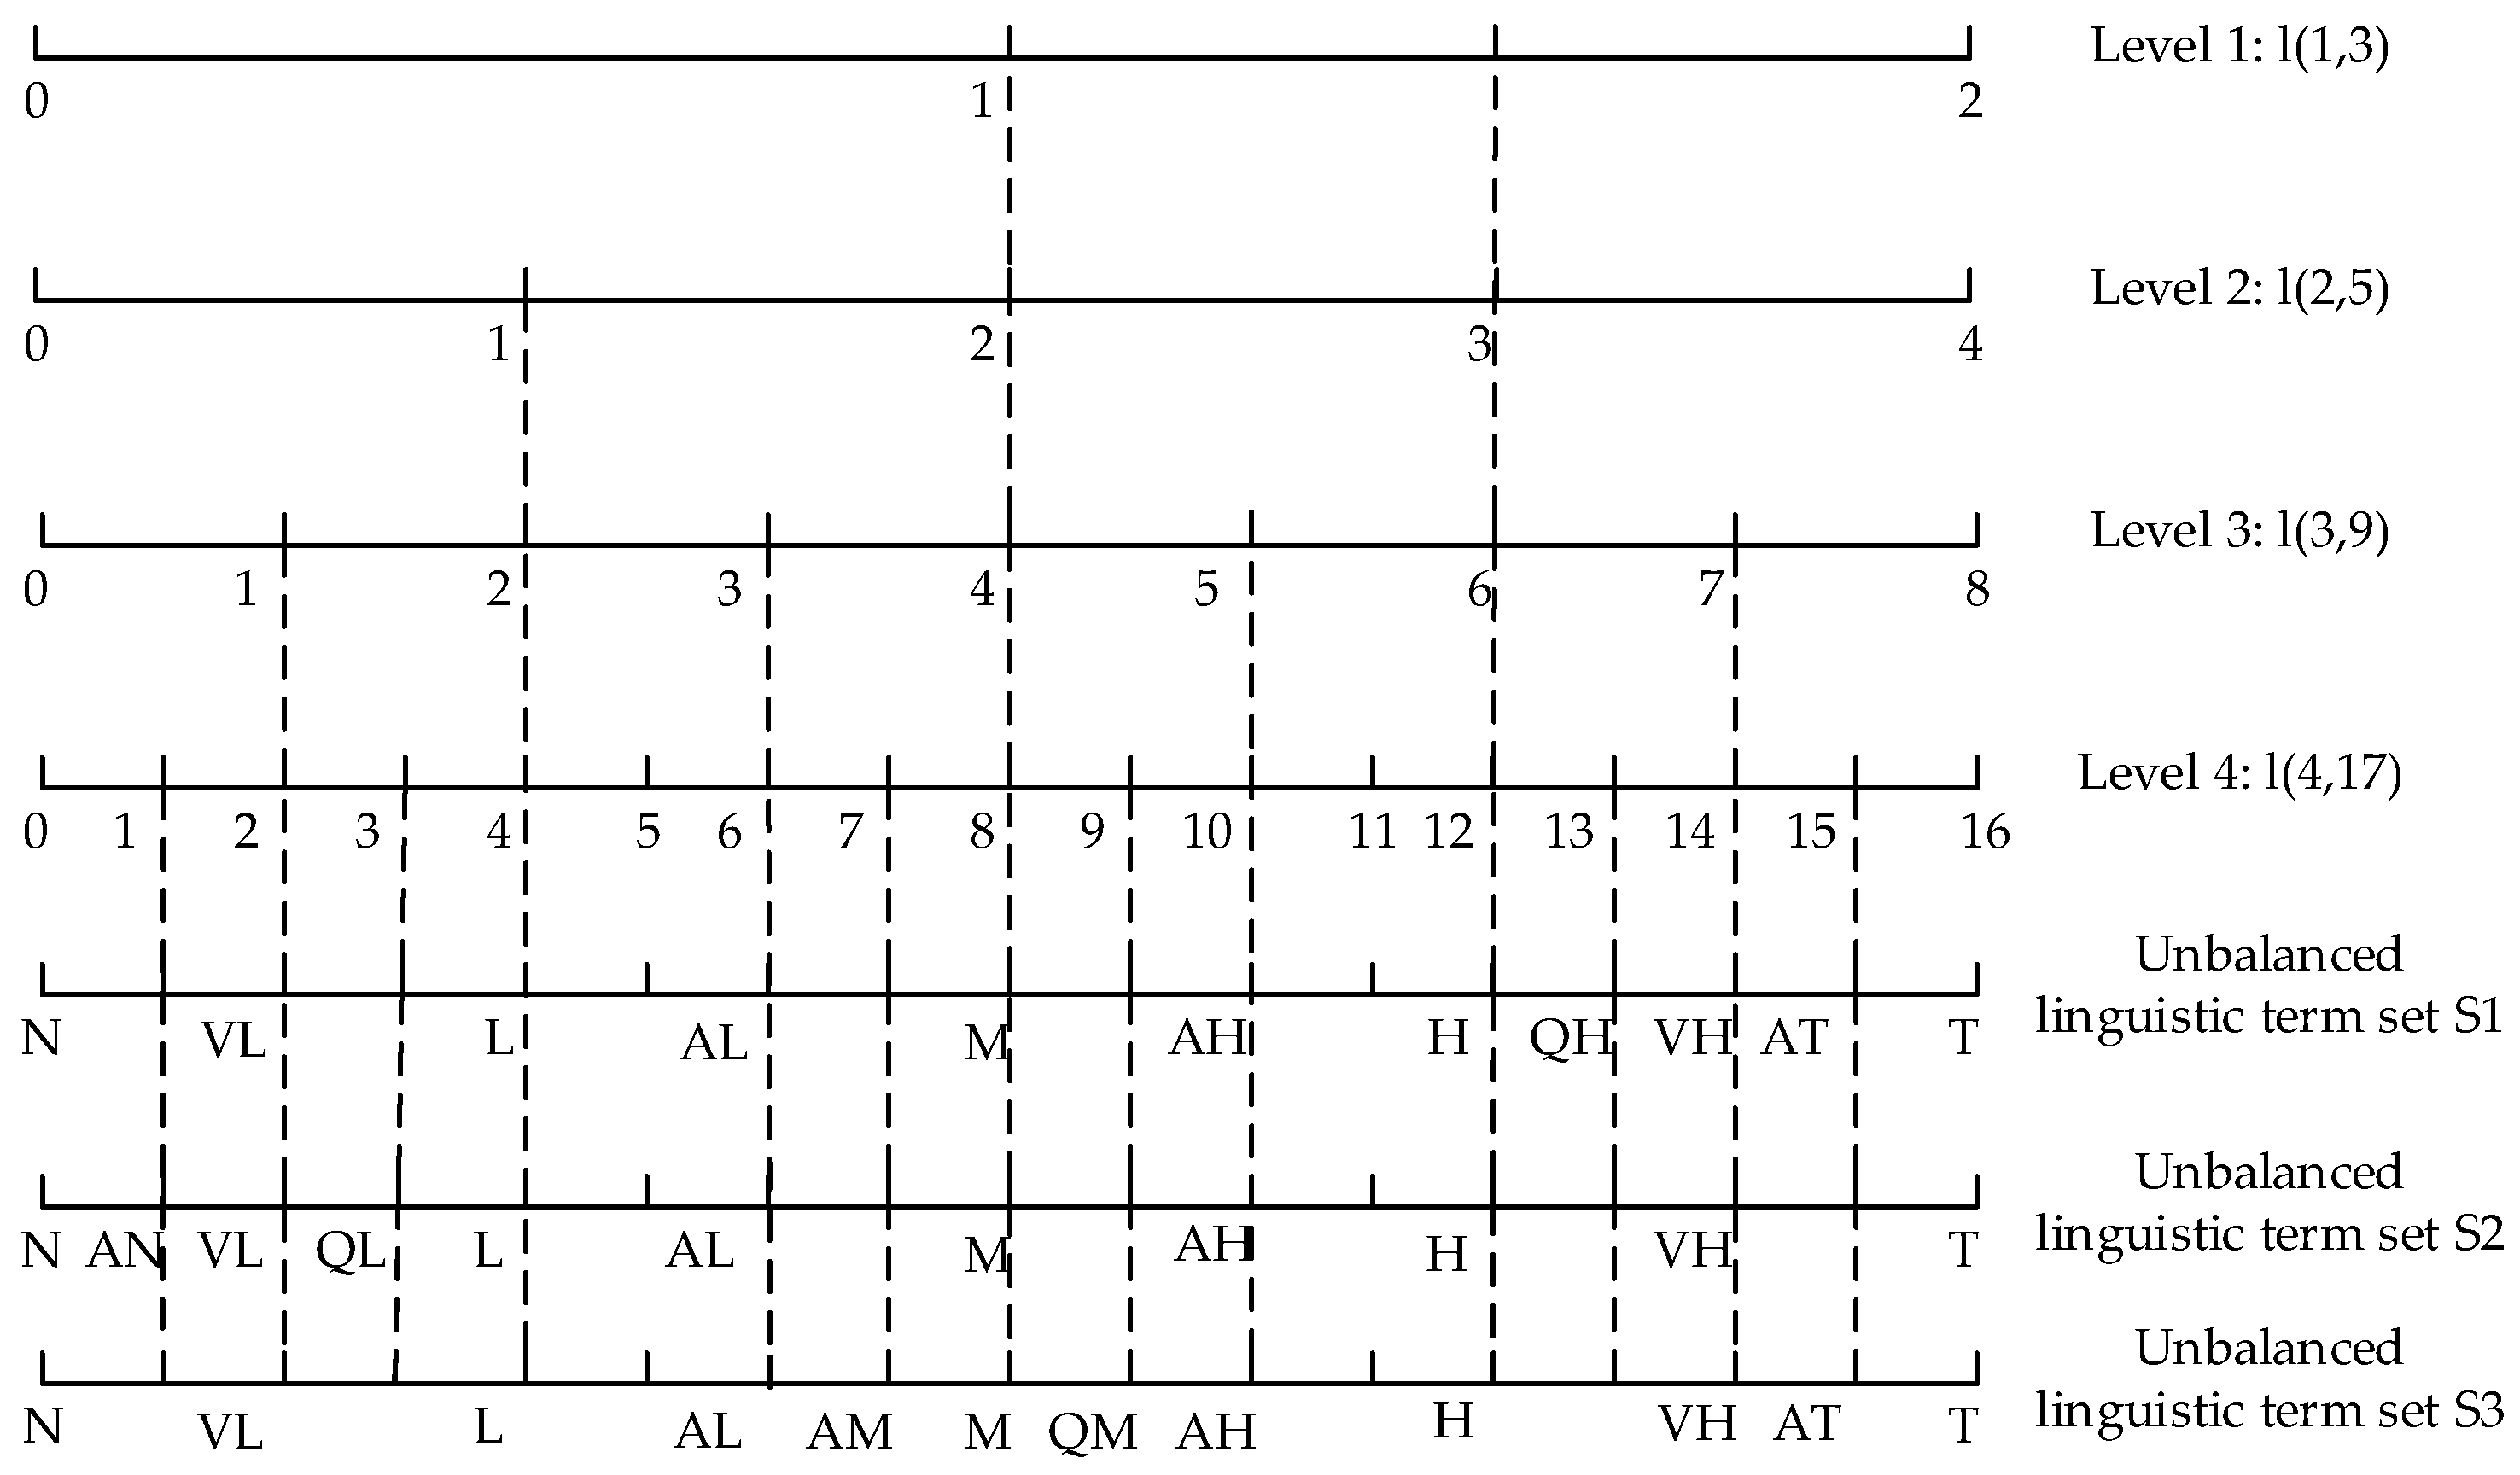
where  s ˜ ϑ ( x i ) = s α i , s β i  denotes judgment to  x i .  s α i  and  s β i  are two unbalanced linguistic variables that operate in an unbalanced linguistic label set  S  [38].  h ( x i ) = μ k i h ( x i ) { μ k i }  and  g ( x i ) = ν t i g ( x i ) { ν t i }  are two sets of values in [0, 1] and respectively indicate possible membership degrees and nonmembership degrees to which the  x i  belongs to  s ˜ ϑ ( x i ) .  p ( x i ) = p k i p ( x i ) { p k i }  and  q ( x i ) = q t i q ( x i ) { q t i }  are the probabilistic distributions of numbers in  h ( x i )  and  g ( x i ) .  h ( x i ) p ( x i )  and  g ( x i ) q ( x i )  hold the following conditions:  μ k i , ν t i [ 0 ,   1 ] ,  0 μ k i + + ν t i + 1 , where  μ k i + = μ k i h ( x i ) max { μ k i } ,  ν t i + = ν t i g ( x i ) max { ν t i } ;  p k i , q t i [ 0 ,   1 ] ,  k i = 1 # h i p k i 1 ,  t i = 1 # g i q t i 1 .  # h i  and  # g i  denote the total numbers of elements in  h ( x i ) p ( x i )  and  g ( x i ) q ( x i ) , respectively.
As is usual in the literature, when X has only one element, L p reduces to l p = s ˜ ϑ , h p , g q having s ˜ ϑ = s α , s β , h = μ k and g = ν t , which is called a probabilistic dual hesitant fuzzy uncertain unbalanced linguistic element (PDHF_UUBLE).
Example 1.
Suppose A and B are two PDHF_UUBLSs on  X = { x 1 , x 2 }  by employing the unbalanced linguistic term set  S = { s t t = 0 , 1 , , 8 } ; then, according to Definition 1, A and B can be expressed as follows:
A = { < x 1 , ( [ s 1 , s 3 ] , { 0.5 1 } , { 0.4 0.6 , 0.5 0.4 } ) > , < x 2 , ( [ s 6 , s 7 ] , { 0.6 0.2 , 0.7 0.8 } , { 0.1 1 } ) > } ,
B = { < x 1 , ( [ s 3 , s 6 ] , { 0.8 1 } , { 0.1 0.5 , 0.2 0.5 } ) > , < x 2 , ( [ s 4 , s 5 ] , { 0.8 1 } , { 0.1 0.5 , 0.2 0.5 } ) > } .
Zhang et al. [37] also devised a score function and deviation degree function for PDHF_UUBLS. Let I = 1 n ( t 1 ) 1 Δ t 0 1 T F t 0 t 1 ( ψ ( s α ) ) and I + = 1 n ( t 1 ) 1 Δ t 0 1 T F t 0 t 1 ( ψ ( s β ) ) , where t 1 are the corresponding levels of unbalanced linguistic terms s α and s β , the transformation functions defined by Herrera et al. [38]. Then, for a l p = s ˜ ϑ , h p , g q , the score function E ( l p ) and deviation degree function σ ( l p ) can be defined as
E ( l p ) = I + I + 2 × μ ¯ v ¯ = I + I + 2 × k = 1 l h μ k p k / k = 1 l h p k t = 1 l g v t q t / t = 1 l g q t ,
σ ( l p ) = I + I + 2 × k = 1 l h ( ( μ k μ ¯ ) p k ) 2 1 / 2 / k = 1 l h p k t = 1 l g ( ( ν k ν ¯ ) q t ) 2 1 / 2 / t = 1 l g q t ,
where l h and l g are the length of h and g , respectively. The larger the score E ( l p ) , the larger the deviation degree σ ( l p ) , the greater the PDHF_UUBLE l p . Then, the order relation between l p 1 = s ˜ ϑ 1 , h 1 p 1 , g 1 q 1 and l p 2 = s ˜ ϑ 2 , h 2 p 2 , g 2 q 2 can be determined according to the following rules:
  • If E ( l p 1 ) < E ( l p 2 ) , then l p 1 l p 2 ;
  • If E ( l p 1 ) = E ( l p 2 ) , then
    (i)
    If σ ( l p 1 ) < σ ( l p 2 ) , then l p 1 l p 2 ;
    (ii)
    If σ ( l p 1 ) = σ ( l p 2 ) , then l p 1 l p 2 .

4.3. Proposed Correlation Coefficient Measures of PDHF_UUBLS

By considering association degrees between evaluations, correlation coefficients provide effective pathways to construct MCGDM methodologies for many real-life complicated problems [44,47,48,49,50,51]. Correlation coefficients thus have been indispensable measures for decision-making modelling under various fuzzy environments [17,39,40,45,46,47]. Although they introduced basic distance and entropy measures, Zhang et al. [37] did not derive effective correlation coefficient measures for PDHF_UUBLS. To this end, here we focus on developing effective correlation coefficient measures for decision-making modelling under PDHF_UUBLS environments.
Given two PDHF_UUBLSs, L A = x i , s ˜ ϑ A ( x i ) , h A ( x i ) p A ( x i ) , g A ( x i ) q A ( x i ) x i X and L B = x i , s ˜ ϑ B ( x i ) , h B ( x i ) p B ( x i ) , g B ( x i ) q B ( x i ) x i X , therein we have s ˜ ϑ A ( x i ) = [ s α A i , s β A i ] , s ˜ ϑ B ( x i ) = [ s α B i , s β B i ] , h A ( x i ) p A ( x i ) = μ k A i p k A i , g A ( x i ) q A ( x i ) = ν o A i q o A i , h B ( x i ) p B ( x i ) = μ k B i p k B i and g B ( x i ) q B ( x i ) = ν o B i q o B i . In addition, μ k A i , ν o A i , μ k B i , ν o B i , p k A i , q o A i , p k B i , q o B i   [0, 1] and 0 μ k A i + + ν o A i + 1 , 0 μ k B i + + ν o B i + 1 where μ k A i + = max { μ k A i } , ν o A i + = max { ν o A i } , μ k B i + = max { μ k B i } , ν o B i + = max { ν o B i } for all x i X . Let l h A i , l h B i , l g A i and l g B i be the lengths of h A ( x i ) , h B ( x i ) , g A ( x i ) and g B ( x i ) respectively.
We have I A i L = 1 n ( t A i 1 ) 1 Δ t 0 1 T F t 0 t A i 1 ( ψ ( s α A i ) ) , I A i U = 1 n ( t A i 2 ) 1 Δ t 0 1 T F t 0 t A i 2 ( ψ ( s β A i ) ) , I B i L = 1 n ( t B i 1 ) 1 Δ t 0 1 T F t 0 t B i 1 ( ψ ( s α B i ) ) , I B i U = 1 n ( t B i 2 ) 1 Δ t 0 1 T F t 0 t B i 2 ( ψ ( s β B i ) ) as transformation functions, where t A i 1 , t A i 2 , t B i 1 and t B i 2 are the corresponding levels of the unbalanced linguistic terms s α A i , s β A i   s α B i , and s β B i in linguistic hierarchy (LH) [38].
Because of the common observations that lengths of membership or nonmembership degrees of two hesitant fuzzy variables often differ, statistics-based correlation coefficients are advocated [44]. Statistics-based correlation coefficients generally calculate association degrees between any two fuzzy variables according to aggregate features of uncertain information therein [48,49], such as mean values, standard deviations, etc. Therefore, in the following, we put forward a statistics-based correlation coefficient for PDHF_UUBLS decision-making environments, where mean values derived from upper bounds and lower bounds of linguistic intervals, probabilistic membership degrees and probabilistic nonmembership degrees are used to comprehensively calculate association between any two PDHF_UUBLS variables.

4.3.1. Statistics-Based Correlation Coefficient for PDHF_UUBLS

Definition 2.
Let A and B be any two PDHF_UUBLSs defined on the object of the universe  X = { x 1 , x 2 , , x n } ; then, the statistics-based correlation coefficient between them can be defined as
ρ ( 1 ) ( A , B ) = C ( 1 ) ( A , B ) E ( 1 ) ( A ) E ( 1 ) ( B ) .
Here, we have
C ( 1 ) ( A , B ) = i = 1 n ( I A i L I ¯ A L ) ( I B i L I ¯ B L ) + ( I A i U I ¯ A U ) ( I B i U I ¯ B U ) + ( μ ¯ A i P μ ¯ A P ) ( μ ¯ B i P μ ¯ B P ) + + ( ν ¯ A i Q ν ¯ A Q ) ( ν ¯ B i Q ν ¯ B Q ) ,
E ( 1 ) ( A ) = i = 1 n ( I A i L I ¯ A L ) 2 + ( I A i U I ¯ A U ) 2 + ( μ ¯ A i P μ ¯ A P ) 2 + ( ν ¯ A i Q ν ¯ A Q ) 2 ,
E ( 1 ) ( B ) = i = 1 n ( I B i L I ¯ B L ) 2 + ( I B i U I ¯ B U ) 2 + ( μ ¯ B i P μ ¯ B P ) 2 + ( ν ¯ B i Q ν ¯ B Q ) 2 ,
where  I ¯ A = I ¯ A L , I ¯ A U = 1 n i = 1 n I A i L , 1 n i = 1 n I A i U ,  I ¯ B = I ¯ B L , I ¯ B U = 1 n i = 1 n I B i L , 1 n i = 1 n I B i U ,  μ ¯ A i P = 1 l h A i k A i = 1 l h A i μ k A i p k A i ,  ν ¯ A i Q = 1 l g A i o A i = 1 l g A i ν o A i q o A i ,  μ ¯ B i P = 1 l h B i k B i = 1 l h B i μ k B i p k B i ,  ν ¯ B i Q = 1 l g B i o B i = 1 l g B i ν o B i q o B i ,  μ ¯ A P = 1 n i = 1 n 1 l h A i k A i = 1 l h A i μ k A i p k A i ,  ν ¯ A Q = 1 n i = 1 n 1 l g A i o A i = 1 l g A i ν o A i q o A i ,  μ ¯ B P = 1 n i = 1 n 1 l h B i k B i = 1 l h B i μ k B i p k B i ,  ν ¯ B Q = 1 n i = 1 n 1 l g B i o B i = 1 l g B i ν o B i q o B i .
The above statistics-based correlation coefficient of PDHF_UUBLS defined in Definition 2 holds the following properties.
Theorem 1.
For any two PDHF_UUBLSs A and B, the statistics-based correlation coefficient defined in Definition 2 satisfies the following properties:
(1)  1 ρ ( 1 ) ( A , B ) 1 ;
(2)  ρ ( 1 ) ( A , B ) = ρ ( 1 ) ( B , A ) ;
(3)  ρ ( 1 ) ( A , B ) = 1   , if A = B.
Proof. 
(1) According to the Cauchy–Schwarz Inequality:
( x 1 y 1 + x 2 y 2 + x n y n ) 2 ( x 1 2 + x 2 2 + x n 2 ) ( y 1 2 + y 2 2 + + y n 2 ) , where
( x 1 , x 2 , , x n ) R n and ( y 1 , y 2 , , y n ) R n , we obtain
C ( 1 ) ( A , B ) = i = 1 n ( I A i L I ¯ A L ) ( I B i L I ¯ B L ) + ( I A i U I ¯ A U ) ( I B i U I ¯ B U ) + ( μ ¯ A i P μ ¯ A P ) ( μ ¯ B i P μ ¯ B P ) +
+ ( ν ¯ A i Q ν ¯ A Q ) ( ν ¯ B i Q ν ¯ B Q ) i = 1 n ( I A i L I ¯ A L ) 2 + ( I A i U I ¯ A U ) 2 + ( μ ¯ A i P μ ¯ A P ) 2 + ( ν ¯ A i Q ν ¯ A Q ) 2 ×
i = 1 n ( I B i L I ¯ B L ) 2 + ( I B i U I ¯ B U ) 2 + ( μ ¯ B i P μ ¯ B P ) 2 + ( ν ¯ B i Q ν ¯ B Q ) 2 .
Therefore, C ( 1 ) ( A , B ) C ( 1 ) ( A , A ) C ( 1 ) ( B , B ) . Thus, we have
ρ ( 1 ) ( A , B ) = C ( 1 ) ( A , B ) E ( 1 ) ( A ) E ( 1 ) ( B ) = C ( 1 ) ( A , B ) C ( 1 ) ( A , A ) C ( 1 ) ( B , B ) 1 ,
Then we get 1 ρ ( 1 ) ( A , B ) 1 .
The proofs of (2) and (3) are obvious according to Definition 2 and are thus omitted. □
However, in certain special cases as shown in the following Example 2, the above statistics-based correlation coefficient defined in Definition 2 cannot apply.
Example 2.
Suppose A and B are two PDHF_UUBLSs on  X = { x 1 , x 2 }  by employing the unbalanced linguistic term set  S = { s t t = 0 , 1 , , 8 } ; then, A and B can be expressed as follows:
A = { < x 1 , ( [ s 4 , s 6 ] , { 0.6 0.8 , 0.8 0.2 } , { 0.2 1 } ) > , < x 2 , ( [ s 5 , s 7 ] , { 0.7 1 } , { 0.2 0.6 , 0.3 0.4 } ) > } ,
B = { < x 1 , ( [ s 3 , s 5 ] , { 0.4 0.7 , 0.5 0.3 } , { 0.5 1 } ) > , < x 2 , ( [ s 3 , s 5 ] , { 0.4 0.7 , 0.5 0.3 } , { 0.5 1 } ) > } .
For Example 2, we can obtain C ( 1 ) ( A , B ) = 0 and E ( 1 ) ( B ) = 0 by use of Equations (4) and (6) in Definition 2. Then, according to Equation (3), ρ ( 1 ) ( A , B ) cannot apply. As can be seen, this phenomenon of inapplicability occurs when hesitant elements share the same mean value or standard deviation [48,49]. To overcome this shortcoming, in the following we propose another effective correlation coefficient of PDHF_UUBLS from the perspective of information energy about hesitant elements [44,47].

4.3.2. Information Energy-Based Correlation Coefficient for PDHF_UUBLS

The information energy-based correlation was first introduced by Gerstenkorn et al. [39] for intuitionistic fuzzy sets, that is, C I F S ( A , B ) = i = 1 N μ A ( x i ) μ B ( x i ) + ν A ( x i ) ν B ( x i ) , and has been extended to various decision-making scenarios of high uncertainty continuously, such as interval-valued intuitionistic fuzzy sets [40], hesitant fuzzy sets [47], single-valued neutrosophic hesitant fuzzy sets [54], probabilistic hesitant fuzzy sets [55], intuitionistic hesitant fuzzy linguistic term sets [56], hesitant fuzzy linguistic term sets [44], dual hesitant fuzzy linguistic term sets [85], etc. Representatively, Zhang et al. [85] clearly used the term of information energy to denote correlation between any two dual hesitant fuzzy linguistic term sets, as shown in following Definition 3.
Definition 3
([85]). Let  S = { S t t = 0 , 1 , , τ }  be a linguistic term set and X be a fixed set, and let  A = x i , H A ( x i ) , h A ( x i ) , g A ( x i ) x i X  and  B = x i , H B ( x i ) , h B ( x i ) , g B ( x i ) x i X  with  H d ( x i ) = { s δ 1 d ( x i ) s δ 1 d ( x i ) S , m = 1 , 2 , , M }  (d = A or B) be two dual hesitant fuzzy linguistic term sets; then, the information energy of  A  and  B  is defined as
C ( A , B ) = i = 1 N 1 m i p = 1 m i 1 k i s = 1 k i h A σ ( s ) ( x i ) h B σ ( s ) ( x i ) δ i A ( x i ) 2 τ + 1 δ i B ( x i ) 2 τ + 1 + 1 l i t = 1 l t g A σ ( t ) ( x i ) g B σ ( t ) ( x i ) δ t A ( x i ) 2 τ + 1 δ t B ( x i ) 2 τ + 1 ,
where  M i  represents the maximum number of linguistic terms in  A  and  B . If numbers of linguistic terms in A  and  B  are not equal, the shorter one should be extended until they are of equal length by applying the preferred strategy [37].
As can be seen, information energy-based correlation coefficients prefer directly exploiting uncertainty information implied in complicate preference expressions so as to derive association degrees between fuzzy sets under investigation [44,47]. With special respect to hesitant fuzzy sets, Guan et al. [49] pointed out that length of membership degrees also indicate intrinsic uncertainty information, and thus suggest considering the correlation coefficient in development.
Inspired by the above pioneering research, considering the compound structure of PDHF_UUBLS, we here extend to propose an effective information energy-based correlation coefficient measure for PDHF_UUBLSs in the following Definition 4. The newly proposed information energy-based correlation coefficient measure includes mid-values of uncertain linguistic variables, lengths of original membership and nonmembership degrees, probabilistic hesitancies on membership and nonmembership degrees in its association calculation, and thus manages to simultaneously indicate hybrid uncertainties in the special compound structure of PDHF_UUBLS. Of particular note, the generally adopted subjective extension mechanisms as suggested in Definition 3, which fill in the hesitant fuzzy set with a shorter length of elements by use of maximum, minimum or average values with zero probability [31,168], bring about more information distortion into probabilistic decision-making methodologies [37,90,169]. To this end, in our following proposed information energy-based correlation coefficient measure, the least common multiple (LCM)-based extension mechanism [37] is incorporated to maintain sequential features of hesitant fuzzy elements in PDHF_UUBLSs. More details about the least common multiple (LCM)-based extension mechanism have been described in Appendix A.
Definition 4.
Consider that  A = x i , s ˜ ϑ A ( x i ) , h A ( x i ) p A ( x i ) , g A ( x i ) q A ( x i ) x i X  and  B = x i , s ˜ ϑ B ( x i ) , h B ( x i ) p B ( x i ) , g B ( x i ) q B ( x i ) x i X  are two PDHF_UUBLSs. Apply the least common multiple-based extension mechanism (Appendix A) to transform  A  and  B  into  A *  and  B *  so as to guarantee  A *  and  B *  have same lengths of membership sets and nonmembership sets and maintain same fundamental statistical feature values as before extension. We have  A * = x i , s ˜ ϑ A ( x i ) , h A * ( x i ) p A * ( x i ) , g A * ( x i ) q A * ( x i ) x i X  and  B * = x i , s ˜ ϑ B ( x i ) , h B * ( x i ) p B * ( x i ) , g B * ( x i ) q B * ( x i ) x i X , where  h A * ( x i ) p A * ( x i ) = μ k A i * p k A i * ,  g A * ( x i ) q A * ( x i ) = ν o A i * q o A i * ,  h B * ( x i ) p B * ( x i ) = μ k B i * p k B i *  and  g B * ( x i ) q B * ( x i ) = ν o B i * q o B i * . Then, the information energy-based correlation coefficient between  A  and  B  can be defined as
ρ ( c 2 ) ( A , B ) = C ( c 2 ) ( A , B ) E ( c 2 ) ( A ) E ( c 2 ) ( B ) .
Here,  C ( c 2 ) ( A , B )  represents correlation between  A  and  B  and is denoted as
C ( c 2 ) ( A , B ) = i = 1 n I A i L + I A i U 2 I B i L + I B i U 2 + 1 l h A i 1 l h B i + 1 l g A i 1 l g B i + 1 l h i k A i , k B i = 1 l h i ( μ k A i * p k A i * ) × ( μ k B i * p k B i * ) + 1 l g i o A i , o B i = 1 l g i ( ν o A i * q o A i * ) × ( ν o B i * q o B i * ) .
Correspondingly,  E ( c 2 ) ( A )  and  E ( c 2 ) ( B )  then can be constructed as
E ( c 2 ) ( A ) = i = 1 n I A i L + I A i U 2 2 + 1 l h A i 2 + 1 l g A i 2 + 1 l h i k A i = 1 l h i ( μ k A i * p k A i * ) 2 + 1 l g i o A i = 1 l g i ( ν o A i * q o A i * ) 2 ,
E ( c 2 ) ( B ) = i = 1 n I B i L + I B i U 2 2 + 1 l h A i 2 + 1 l g B i 2 + 1 l h i k B i = 1 l h i ( μ k B i * p k B i * ) 2 + 1 l g i o B i = 1 l g i ( ν o B i * q o B i * ) 2 .
In the above,  l h A i  and  l g A i  represent lengths of original membership degrees of  A , respectively.  l h B i  and  l g B i  represent lengths of original membership degrees and nonmembership degrees of  B , respectively. According to Ref. [37],   l h i  represents the corresponding least common multiple length of  l h A i  and  l h B i .  l g i  represents the corresponding least common multiple length of  l g A i  and  l g B i .
Obviously, the correlation C ( c 2 ) ( A , B ) satisfies the following properties: (1) C ( c 2 ) ( A , A ) = E ( c 2 ) ( A ) ; (2) C ( c 2 ) ( A , B ) = C ( c 2 ) ( B , A ) . With respect to the above information energy-based correlation coefficient ρ ( c 2 ) ( A , B ) , we have following theorem.
Theorem 2.
The information energy-based correlation coefficient  ρ ( c 2 ) ( A , B )  defined in Definition 4 holds the following properties:
(1)  0 ρ ( c 2 ) ( A , B ) 1 ;
(2)  ρ ( c 2 ) ( A , B ) = ρ ( c 2 ) ( B , A ) ;
(3)  ρ ( c 2 ) ( A , B ) = 1 , if  A = B .
Proof. 
(1) The inequality ρ ( c 2 ) ( A , B ) 0  is obvious. Then, let us prove ρ ( c 2 ) ( A , B ) 1 .
C ( c 2 ) ( A , B ) = i = 1 n I A i L + I A i U 2 I B i L + I B i U 2 + 1 l h A i 1 l h B i + 1 l g A i 1 l g B i + p A i , p B i = 1 l h i ( μ k A i * p k A i * ) l h i ( μ k B i * p k B i * ) l h i + q A i , q B i = 1 l g i ( ν o A i * q o A i * ) l g i ( ν o B i * q o B i * ) l g i .
Then by Cauchy–Schwarz Inequality, ( x 1 y 1 + x 2 y 2 + x n y n ) 2 ( x 1 2 + x 2 2 + x n 2 ) ( y 1 2 + y 2 2 + + y n 2 ) where ( x 1 , x 2 , , x n ) R n and ( y 1 , y 2 , , y n ) R n , we can get
i = 1 n I A i L + I A i U 2 I B i L + I B i U 2 + 1 l h A i 1 l h B i + 1 l g A i 1 l g B i + p A i , p B i = 1 l h i ( μ k A i * p k A i * ) l h i ( μ k B i * p k B i * ) l h i + q A i , q B i = 1 l g i ( ν o A i * q o A i * ) l g i ( ν o B i * q o B i * ) l g i 2
i = 1 n I A i L + I A i U 2 2 + 1 l h A i 2 + 1 l g A i 2 + 1 l h i k A i = 1 l h i ( μ k A i * p k A i * ) 2 + 1 l g i o A i = 1 l g i ( ν o A i * q o A i * ) 2 ×
i = 1 n I B i L + I B i U 2 2 + 1 l h B i 2 + 1 l g B i 2 + 1 l h i k B i = 1 l h i ( μ k B i * p k B i * ) 2 + 1 l g i o B i = 1 l g i ( ν o B i * q o B i * ) 2 ,
namely, C ( c 2 ) ( A , B ) E ( c 2 ) ( A ) E ( c 2 ) ( B ) . Therefore, we have
ρ ( c 2 ) ( A , B ) = C ( c 2 ) ( A , B ) E ( c 2 ) ( A ) E ( c 2 ) ( B ) = C ( c 2 ) ( A , B ) C ( c 2 ) ( A , A ) C ( c 2 ) ( B , B ) 1 .
Hence, we get 0 ρ ( c 2 ) ( A , B ) 1 .
The proofs of (2) and (3) are obvious according to Definition 4. □
Example 3.
For any two PDHF_UUBLSs A and B in  X = { x 1 , x 2 } , which on the unbalanced linguistic term set  S = { s ϑ ϑ = 0 , 1 , , 8 }  are expressed as follows:
A = { < x 1 , ( [ s 1 , s 3 ] , { 0.5 1 } , { 0.4 0.6 , 0.5 0.4 } ) > ,   < x 2 , ( [ s 6 , s 7 ] , { 0.6 0.2 , 0.7 0.8 } , { 0.1 0.7 , 0.3 0.3 } ) > } ,
B = { < x 1 , ( [ s 3 , s 6 ] , { 0.8 1 } , { 0.1 0.5 , 0.2 0.5 } ) > , < x 2 , ( [ s 4 , s 5 ] , { 0.8 1 } , { 0.1 0.5 , 0.2 0.5 } ) > } .
As for A and B, the statistics-based correlation coefficient defined in Definition 2 cannot be applied because we have C ( 1 ) ( A , B ) = 0 and E ( 1 ) ( B ) = 0 . Example 2 and Example 3 exhibit the same phenomenon in which hesitant elements in A and B share identical mean values or standard deviations. Comparatively, the information energy-based correlation coefficient defined in Definition 4 always applies because its calculation bypasses the statistical features of hesitant elements, and we have C ( c 2 ) ( A , B ) = 3.1559, E ( c 2 ) ( A ) = 2.817, E ( c 2 ) ( B ) = 3.6253 ρ ( c 2 ) ( A , B ) = 0.9876.

4.3.3. Weighted Correlation Coefficients for PDHF_UUBLS

To facilitate decision-making situations that depend on association degrees of any two PDHF_UUBLSs considering the relative importance of their defining objects in a universe, this section proposes a weighted statistics-based correlation coefficient based on ρ ( 1 ) ( A , B ) and a weighted information energy-based correlation coefficient based on ρ ( c 2 ) ( A , B ) .
Definition 5.
Suppose A and B be two PDHF_UUBLSs that are defined correspondingly on the objects in a universe  X = { x 1 , x 2 , , x n } . Let  w = { w 1 , w 2 , , w n }  be the weighting vector for  x i ( i = 1 , 2 , , n )  with  w i 0  and  i = 1 n w i = 1 . Then, the weighted statistics-based correlation coefficient between A and B can be defined as
ρ w ( 1 ) ( A , B ) = C w ( 1 ) ( A , B ) E w ( 1 ) ( A ) E w ( 1 ) ( B ) .
Here,  C w ( 1 ) ( A , B )  represents correlation between A and B and is denoted as
C w ( 1 ) ( A , B ) = i = 1 n ( I A i L I ¯ w A L ) ( I B i L I ¯ w B L ) + ( I A i U I ¯ w A U ) ( I B i U I ¯ w B U ) + ( μ ¯ A i P μ ¯ w A P ) ( μ ¯ B i P μ ¯ w B P ) + + ( ν ¯ A i Q ν ¯ w A Q ) ( ν ¯ B i Q ν ¯ w B Q ) .
Correspondingly,  E w ( 1 ) ( A )  and  E w ( 1 ) ( B )  then can be constructed as
E w ( 1 ) ( A ) = i = 1 n ( I A i L I ¯ w A L ) 2 + ( I A i U I ¯ w A U ) 2 + ( μ ¯ A i P μ ¯ w A P ) 2 + ( ν ¯ A i Q ν ¯ w A Q ) 2 ,
E w ( 1 ) ( B ) = i = 1 n ( I B i L I ¯ w B L ) 2 + ( I B i U I ¯ w B U ) 2 + ( μ ¯ B i P μ ¯ w B P ) 2 + ( ν ¯ B i Q ν ¯ w B Q ) 2 ,
where
I ¯ w A = I ¯ w A L , I ¯ w A U = i = 1 n w i I A i L , i = 1 n w i I A i U , I ¯ w B = I ¯ w B L , I ¯ w B U = i = 1 n w i I B i L , i = 1 n w i I B i U ,
μ ¯ A i P = 1 l h A i k A i = 1 l h A i μ k A i p k A i ,   ν ¯ A i Q = 1 l g A i o A i = 1 l g A i ν o A i q o A i ,   μ ¯ B i P = 1 l h B i k B i = 1 l h B i μ k B i p k B i ,
ν ¯ B i Q = 1 l g B i o B i = 1 l g B i ν o B i q o B i ,   μ ¯ w A P = i = 1 n w i l h A i k A i = 1 l h A i μ k A i p k A i ,   ν ¯ w A Q = i = 1 n w i l g A i o A i = 1 l g A i ν o A i q o A i ,
μ ¯ w B P = i = 1 n w i l h B i k B i = 1 l h B i μ k B i p k B i , ν ¯ w B Q = i = 1 n w i l g B i o B i = 1 l g B i ν o B i q o B i .
It is obvious that the weighted statistics-based correlation coefficient C w ( 1 ) ( A , B ) satisfies the properties: (1) C w ( 1 ) ( A , A ) = E w ( 1 ) ( A ) ; (2) C w ( 1 ) ( A , B ) = C w ( 1 ) ( B , A ) . With respect to the above weighted statistics-based correlation coefficient ρ w ( 1 ) ( A , B ) , we have the following theorem.
Theorem 3.
The weighted statistics-based correlation coefficient  ρ w ( 1 ) ( A , B )  defined in Definition 5 satisfies the following properties:
(1)  1 ρ w ( 1 ) ( A , B ) 1 ,
(2)  ρ w ( 1 ) ( A , B ) = ρ w ( 1 ) ( B , A ) ,
(3)  ρ w ( 1 ) ( A , B ) = 1 , if A = B.
Proof. 
Proofs are similar to Theorem 1 and are thus omitted. □
Definition 6.
Suppose A and B are two PDHF_UUBLSs that are defined correspondingly on the objects in a universe  X = { x 1 , x 2 , , x n } . Let  w = { w 1 , w 2 , , w n }  be the weighting vector for  x i ( i = 1 , 2 , , n )  with  w i 0  and  i = 1 n w i = 1 . Then, the weighted information energy-based correlation coefficient between A and B can be defined as
ρ w ( c 2 ) ( A , B ) = C w ( c 2 ) ( A , B ) E w ( c 2 ) ( A ) E w ( c 2 ) ( B ) .
Here,  C w ( c 2 ) ( A , B )  represents correlation between A and B and is denoted as
C w ( c 2 ) ( A , B ) = i = 1 n w i I A i L + I A i U 2 I B i L + I B i U 2 + 1 l h A i 1 l h B i + 1 l g A i 1 l g B i + 1 l h i k A i , k B i = 1 l h i ( μ k A i * p k A i * ) × ( μ k B i * p k B i * ) + 1 l g i o A i , o B i = 1 l g i ( ν o A i * q o A i * ) × ( ν o B i * q o B i * ) .
Correspondingly,  E w ( c 2 ) ( A )  and  E w ( c 2 ) ( B )  then can be constructed as
E w ( c 2 ) ( A ) = i = 1 n w i I A i L + I A i U 2 2 + 1 l h A i 2 + 1 l g A i 2 + 1 l h i k A i = 1 l h i ( μ k A i * p k A i * ) 2 + 1 l g i o A i = 1 l g i ( ν o A i * q o A i * ) 2 .
E w ( c 2 ) ( B ) = i = 1 n w i I B i L + I B i U 2 2 + 1 l h A i 2 + 1 l g B i 2 + 1 l h i k B i = 1 l h i ( μ k B i * p k B i * ) 2 + 1 l g i o B i = 1 l g i ( ν o B i * q o B i * ) 2 .
It is obvious that the weighted information energy-based correlation coefficient C w ( c 2 ) ( A , B ) satisfies the following properties: (1) C w ( c 2 ) ( A , A ) = E w ( c 2 ) ( A ) ; (2) C w ( c 2 ) ( A , B ) = C w ( c 2 ) ( B , A ) . With respect to the above weighted information energy-based correlation coefficient ρ w ( c 2 ) ( A , B ) , we have the following theorem.
Theorem 4.
The weighted information energy-based correlation coefficient  ρ w ( c 2 ) ( A , B )  defined in Definition 6 satisfies the following properties:
(1)  0 ρ w ( c 2 ) ( A , B ) 1 ;
(2)  ρ w ( c 2 ) ( A , B ) = ρ w ( c 2 ) ( B , A ) ;
(3)  ρ w ( c 2 ) ( A , B ) = 1 , if  A = B .
Proof. 
Proofs are similar to Theorem 2 and are thus omitted. □

4.4. Compatibility-Based Programming Model to Determine Weights of Decision Making Units

As pointed out before, to effectively resolve the resilient suppliers’ selection problems of high complexity, group decision-making processes that involve multiple experts or decision-making units (DMUs) are usually adopted to avoid more potential uncertainties caused by cognitive limitations of only a single expert or DMU. Generally speaking, the weighting vector for experts or DMUs cannot be determined in advance subjectively. On the other side, in the literature, methods based on capturing relations among decision matrices are often suggested to derive weighting vector for experts or DMUs objectively [72,170].
Compatibility degree [171,172,173] was introduced to indicate the overall correlation between decision matrix R k (given by the k th decision maker or DMU) and matrices R γ (given by the other decision makers or DMUs, i.e., γ = 1, 2, …, ο , γ k ). When the compatibility degree of k th decision maker or DMU is bigger, then k th decision maker or DMU should be recognized as behaving more in accordance with decision-making objectives and thus should be assigned with a larger weight. Therefore, here we utilize the above-defined correlation coefficient to calculate compatibility degree of decision matrices in the form of PDHF_UUBLS, namely, C I ( R k , R γ ) = 1 m n j = 1 m i = 1 n ρ ( r i j k , r i j γ ) . Then, we can construct compatibility-based programming model to determine weights of experts or DMUs as follows:
( M - 1 )   max F ( η k ) = k = 1 ο 1 ο 1 γ = 1 , γ k ο C I ( R k , R γ ) η k s . t . k = 1 ο ( η k ) 2 = 1 , η k 0 , k = 1 , 2 , , ο .
With regard to the above programming model (M-1), we have following theorem.
Theorem 5.
The optimal solution to programming model (M-1) is
η k = γ = 1 , γ k ο 1 m n j = 1 m i = 1 n ρ ( r i j k , r i j γ ) k = 1 ο γ = 1 , γ k ο 1 m n j = 1 m i = 1 n ρ ( r i j k , r i j γ ) .
Proof. 
To solve the model (M-1), we firstly have to construct the Lagrange function as follows:
L ( η k , ζ ) = k = 1 ο 1 ο 1 γ = 1 , γ k ο 1 m n j = 1 m i = 1 n ρ ( r i j k , r i j γ ) η k + ζ 2 k = 1 ο ( η k ) 2 1 .
By deriving differentiation on Equation (20) with respect to η k ( k = 1 , 2 , , ο ) and ζ , then setting these partial derivatives equal to zero, the following set of equations can be obtained:
F η k = 1 ο 1 γ = 1 , γ k ο 1 m n j = 1 m i = 1 n ρ ( r i j k , r i j γ ) + ζ k = 1 ο η k = 0 F ζ = k = 1 ο ( η k ) 2 1 = 0 .
By solving Equation (21), we can get a simple and exact formula for determining the weighting vector for decision makers, as follows:
η k = 1 ο 1 γ = 1 , γ k ο 1 m n j = 1 m i = 1 n ρ ( r i j k , r i j γ ) k = 1 ο 1 ο 1 γ = 1 , γ k ο 1 m n j = 1 m i = 1 n ρ ( r i j k , r i j γ ) 2 .
Through normalization of Equation (22), we have the optimal solution shown in Equation (19). □

4.5. Proposed MCGDM Approach for RSS Under PDHF_UUBLS Environment

To effectively address MCGDM problems of high uncertainty, Chen [174] successfully developed an extended TOPSIS to Pythagorean fuzzy environments by incorporating novel correlation-based closeness coefficients, which are capable of simultaneously measuring the relative closeness to positive-ideal solution and relative remoteness from the negative-ideal solution. In light of the Pythagorean fuzzy correlation-based closeness coefficients defined by Chen [174], in this subsection, we firstly define correlation-based closeness coefficients based on correlation coefficients that have been detailed in preceding sections, and then establish a generic MCGDM approach for resilient supplier selection under PDHF_UUBLS environment.
Definition 7.
With respect to  k  th decision matrix  R k , let  r i j k  denote the evaluative preferences of supplier  A j  in the form of PDHF_UUBLS. Given the positive-ideal and negative-ideal PDHF_UUBL solutions  r i j k ( + )  and  r i j k ( ) , respectively, the correlation-based closeness coefficient  C C ( r i j k )  for the supplier  A j  can be defined as
C C ( r i j k ) = 1 + ρ ( r i j k , r i j k ( + ) ) 2 + ρ ( r i j k , r i j k ( + ) ) + ρ ( r i j k , r i j k ( ) ) ,
where  ρ ( r i j k , r i j k ( + ) )  and  ρ ( r i j k , r i j k ( ) )  can be calculated by use of  ρ ( 1 )  or  ρ ( c 2 )  as requested, respectively.
Definition 8.
With respect to  k th decision matrix  R k , let  r i j k  be the evaluative preferences of supplier  A j  in the form of PDHF_UUBLS. Let  w = { w 1 , , w i , , w n }  denote the weighting vector for criteria,  w i [ 0 , 1 ]  and  i = 1 n w i = 1 . Given the positive-ideal and negative-ideal PDHF_UUBL solutions  r i j k ( + )  and  r i j k ( ) , respectively, the weighted correlation-based closeness coefficient  C C w ( r i j k )  for the alternative  A j  is defined as
C C w ( r i j k ) = 1 + ρ w ( r i j k , r i j k ( + ) ) ) 2 + ρ w ( r i j k , r i j k ( + ) ) + ρ w ( r i j k , r i j k ( ) ) ,
where  ρ w ( r i j k , r i j k ( + ) )  and  ρ w ( r i j k , r i j k ( ) )  can be calculated by use of  ρ w ( 1 )  or  ρ w ( c 2 )  as requested, respectively.
As for the above closeness coefficients defined in Definition 7 and Definition 8, we have following theorems.
Theorem 6.
The correlation-based closeness coefficient  C C ( r i j k )  satisfies the following properties:
(1)  0 C C ( r i j k ) 1 ;
(2)  C C ( r i j k ( ) ) C C ( r i j k ( + ) ) .
Proof. 
(1) We have 1 ρ ( 1 ) ( r i j k , r i j k ( + ) ) , ρ ( 1 ) ( r i j k , r i j k ( ) ) 1 and 0 ρ ( c 2 ) ( r i j k , r i j k ( + ) ) , ρ ( c 2 ) ( r i j k , r i j k ( ) ) 1 . Then, we have 0 1 + ρ ( 1 ) ( r i j k , r i j k ( + ) ) 2 , 1 1 + ρ ( c 2 ) ( r i j k , r i j k ( + ) ) 2 ,
0 2 + ρ ( 1 ) ( r i j k , r i j k ( + ) ) + ρ ( 1 ) ( r i j k , r i j k ( ) ) 4   and   2 2 + ρ ( c 2 ) ( r i j k , r i j k ( + ) ) + ρ ( c 2 ) ( r i j k , r i j k ( ) ) 4 .
Thus, we have 0 C C ( r i j k ) 1 .
(2) We have ρ ( r i j k ( + ) , r i j k ( + ) ) = 1 , ρ ( r i j k ( ) , r i j k ( ) ) = 1 and ρ ( r i j k ( ) , r i j k ( + ) ) = ρ ( r i j k ( + ) , r i j k ( ) ) ; then, the following results can be obtained:
C C ( r i j k ( + ) ) = 1 + ρ ( r i j k ( + ) , r i j k ( + ) ) 2 + ρ ( r i j k ( + ) , r i j k ( + ) ) + ρ ( r i j k ( + ) , r i j k ( ) ) = 2 3 + ρ ( r i j k ( + ) , r i j k ( ) ) ,
C C ( r i j k ( ) ) = 1 + ρ ( r i j k ( ) , r i j k ( + ) ) 2 + ρ ( r i j k ( ) , r i j k ( + ) ) + ρ ( r i j k ( ) , r i j k ( ) ) = 1 + ρ ( r i j k ( ) , r i j k ( + ) ) 3 + ρ ( r i j k ( + ) , r i j k ( ) ) .
Because ρ ( r i j k , r i j k ( + ) ) satisfies ρ ( r i j k , r i j k ( + ) ) 1 , then we have C C ( r i j k ( + ) ) C C ( r i j k ( ) ) . □
Theorem 7.
The weighted correlation-based closeness coefficient  C C w ( r i j k )  satisfies the following properties:
(1)  0 C C w ( r i j k ) 1 ;
(2)  C C w ( r i j k ( ) ) C C w ( r i j k ( + ) ) ;
(3)  C C w ( r i j k ) = C C ( r i j k )  if  w = ( 1 n , 1 n , , 1 n ) T .
Proof. 
(1) We have 1 ρ w ( 1 ) ( r i j k , r i j k ( + ) ) , ρ w ( 1 ) ( r i j k , r i j k ( ) ) 1 , 0 ρ w ( c 2 ) ( r i j k , r i j k ( + ) ) , ρ w ( c 2 ) ( r i j k , r i j k ( ) ) 1 . Then we have 0 1 + ρ w ( 1 ) ( r i j k , r i j k ( + ) ) 2 , 1 1 + ρ w ( c 2 ) ( r i j k , r i j k ( + ) ) 2 ,
0 2 + ρ w ( 1 ) ( r i j k , r i j k ( + ) ) + ρ w ( 1 ) ( r i j k , r i j k ( ) ) 4   and   2 2 + ρ w ( c 2 ) ( r i j k , r i j k ( + ) ) + ρ w ( c 2 ) ( r i j k , r i j k ( ) ) 4 .
Thus, we have 0 C C w ( r i j k ) 1 .
(2) We have ρ w ( r i j k ( + ) , r i j k ( + ) ) = 1 , ρ w ( r i j k ( ) , r i j k ( ) ) = 1 and ρ w ( r i j k ( ) , r i j k ( + ) ) = ρ w ( r i j k ( + ) , r i j k ( ) ) ; then, according to Equation (24), the following results can be obtained:
C C w ( r i j k ( + ) ) = 1 + ρ w ( r i j k ( + ) , r i j k ( + ) ) 2 + ρ w ( r i j k ( + ) , r i j k ( + ) ) + ρ w ( r i j k ( + ) , r i j k ( ) ) = 2 3 + ρ w ( r i j k ( + ) , r i j k ( ) ) ,
C C w ( r i j k ( ) ) = 1 + ρ w ( r i j k ( ) , r i j k ( + ) ) 2 + ρ w ( r i j k ( ) , r i j k ( + ) ) + ρ w ( r i j k ( ) , r i j k ( ) ) = 1 + ρ w ( r i j k ( ) , r i j k ( + ) ) 3 + ρ w ( r i j k ( + ) , r i j k ( ) ) .
Because ρ w ( r i j k , r i j k ( + ) ) satisfies ρ w ( r i j k , r i j k ( + ) ) 1 , then we get C C w ( r i j k ( + ) ) C C w ( r i j k ( ) ) .
(3) Given w = ( 1 n , 1 n , , 1 n ) T , we get ρ w ( r i j k , r i j k ( + ) ) = ρ ( r i j k , r i j k ( + ) ) , ρ w ( r i j k , r i j k ( ) ) = ρ ( r i j k , r i j k ( ) ) . Obviously, we can have C C w ( r i j k ) = C C ( r i j k ) , which completes the proof of Theorem 7. □
By use of the correlation-based closeness coefficient C C ( r i j k ) and the weighted correlation-based closeness coefficient C C w ( r i j k ) , we now can construct the generic MCGDM for resilient supplier selection under PDHF_UUBLS environment, which is shown as the following Algorithm 1.
Algorithm 1. Generic MCGDM approach for resilient supplier selection
Step 1. Obtain decision matrices of R k = ( r i j k ) ( k = 1 , 2 , , o ) in the form of PDHF_UUBLS from each DMU.
Step 2. Obtain the positive-ideal and negative-ideal solutions r i j k ( + ) and r i j k ( ) ( k = 1 , 2 , , o ) for each DMU.
Step 3. According to programming model (M-1), derive the weighting vector η = ( η 1 , , η k , , η o ) for DMUs.
Step 4. Apply the entropy measure E ( r i j k ) for PDHF_UUBLS defined in Ref. [37] to obtain entropy-based weighting vector w ( k ) = ( w 1 ( k ) , , w i ( k ) , , w n ( k ) ) for evaluative criteria by utilizing the following formula:
w i ( k ) = j = 1 m ( 1 E ( r i j ( k ) ) ) i = 1 n j = 1 m ( 1 E ( r i j ( k ) ) ) . (25)
Step 5. Apply w ( k ) and η to acquire the weighted correlation-based closeness coefficient C C w ( r i j k ) , then derive the individual C C w ( r j k ) and group C C w ( r j ) , where
C C w ( r j k ) = i = 1 n 1 + ρ w ( r i j k , r i j k ( + ) ) 2 + ρ w ( r i j k , r i j k ( + ) ) + ρ w ( r i j k , r i j k ( ) ) , (26)
C C w ( r j ) = k = 1 o η k C C w ( r j k ) = k = 1 o η k i = 1 n 1 + ρ w ( r i j k , r i j k ( + ) ) 2 + ρ w ( r i j k , r i j k ( + ) ) + ρ w ( r i j k , r i j k ( ) ) . (27)
Step 6. Obtain the ultimate ranking order of all alternative resilient suppliers according to the descending order of the C C w ( r j ) values. The alternative supplier with the largest C C w ( r j ) value is the best resilient supplier.
For more clarity, the above steps of Algorithm 1 have also been shown in Figure 3. Algorithm 1 implements the MCGDM approach required in the correlation coefficient-based methodological flowchart as shown in Figure 2. As seen from Figure 3, computation complexity of Algorithm 1 is mainly determined by computation of correlation coefficients between PDHF_UUBLS variables and the number of criteria used for constructing decision matrices. A larger number of criteria means higher computational complexity of all MCGDM methodologies and their extensions to various fuzzy contexts.
With specific regard to PDHF_UUBLS decision-making scenarios having the information structure of x i , [ s m , s n ] , h ( x i ) p ( x i ) , g ( x i ) q ( x i ) , the linguistic variable [ s m , s n ] is one linguistic interval, and the sets of probabilistic membership degrees h ( x i ) p ( x i ) and probabilistic nonmembership degrees g ( x i ) q ( x i ) both have short lengths even if extended by use of the LCM method as shown in Appendix A. To capture hybrid uncertainties in measuring association between two PDHF_UUBLS variables, we include five parts that indicate uncertainties in our proposed information energy-based correlation coefficients, that is, mid-values of uncertain linguistic variable, lengths of membership and nonmembership degrees, and probabilistic hesitancies on membership and nonmembership degrees. As a result, the computation complexity of the proposed correlation coefficients for PDHF_UUBLS exhibits approximately and constantly five times that of the classic Pearson correlation coefficient. Similarly, correlation coefficients for interval-valued intuitionistic fuzzy sets [175] hold four times more, and correlation coefficients for dual interval-valued hesitant fuzzy sets [176] also have four times more. Generally speaking, higher complexity in structures of compound expression tools will result in higher computational complexity in their correlation coefficients-based decision-making methodologies, but short input vectors to all the above-mentioned correlation coefficients determine that actual computation complexity will be rather low.
Of particular note, PDHF_UUBLS takes advantages of DMU’s judgment capacities in establishing collective evaluations on major criteria that have multiple indicators and thus enable the construction of decision matrices with smaller scales in practice. Therefore, the incorporation of PDHF_UUBLS intrinsically lowers overall computation complexity of our proposed correlation coefficient-based methodology. When confronted with up-scaled RSS scenarios where sustainability or other additional criteria are concerned, Algorithm 1 and PDHF_UUBLS-oriented analytical interfaces should be computerized to smooth the holistic computation and alleviate evaluative burdens on DMUs.

5. Illustrative Case

To successfully adapt to dynamic challenges from the current VUCA markets, focal companies in the dairy industry have to proactively carry resilience building in their supply chains. One of the often-adopted strategies for enhancing supply chain resilience is to carry out RSS based on comprehensive evaluation of suppliers’ resilience performance so as to prompt resilience in supplier development and adjust the quota for the most resilient strategic supplier(s).
Suppose that the foal company in a local diary industry has to increase their quota for the most resilient strategic 3PL (3rd party logistics) supplier. Let A = { A 1 , A 2 , A 3 , A 4 } represent the four alternative strategic 3PL suppliers. The company is determined to utilize the six capability attributes of resilient suppliers, C = { C 1 , C 2 , C 3 , C 4 , C 5 , C 6 } , developed in Section 3, to comprehensively evaluate the above four strategic suppliers. Due to the intrinsic complexity of the task of resilient supplier selection, the foal company prefers group decision-making methodologies. Thus, three DMUs from a set of academics, consultants and department managers have already been organized, denoted as E x κ ( κ = 1 , 2 , 3 ) . Herrera et al. [38] pointed out that decision makers preferred unbalanced linguistic scaling systems to describe their most approximate evaluations with references to complicated conceptions. In view of this observation, unbalanced linguistic scaling systems are adopted to facilitate approximate reasoning processes of the three DMUs. As suggested by Herrera et al. [38], various unbalanced linguistic scaling systems should be devised at the discretion of decision makers. As a result, the three DMUs, E x κ ( κ = 1 , 2 , 3 ) , have determined to use their unbalanced linguistic scales of S 1 = {N, VL, L, AL, M, AH, H, QH, VH, AH, T}, S 2 = {N, AN, VL, QL, L, AL, M, AH, H, VH, T}, S 3 = {N, VL, L, AL, AM, M, QM, AH, H, VH, AT, T}, according to their judgment capacities, respectively. And mapping relations between S 1 , S 2 and S 3 can be made by use of the linguistic hierarchy in [38], as shown in Figure 4. To avoid irrational dispersion in collective judgment of each DMU, majority rule is applied to designate the most approximate linguistic interval as the major collective opinion, and members of each DMU are still allowed to express their hesitant opinions to the major collective opinion. Therefore, for the purpose of simultaneously accommodating uncertainties in the linguistic interval, hesitant membership and nonmembership degrees with supplementary probabilistic information, the PDHF_UUBLS and the constructed correlation coefficient-based MCGDM methodology exhibit pertinent suitability in the above RSS scenarios.

5.1. Application of Proposed Algorithm 1

Now, we apply Algorithm 1 constructed in Section 4.5 to resolve the above RSS problem for the focal company.
Step 1. By adopting the compound expression tool of PDHF_UUBLS as demonstrated in Figure 1, each DMU is asked comprehensively evaluate alternative suppliers on each capability attribute. Then decision matrices of R κ ( κ = 1 , 2 , 3 ) by E x κ ( κ = 1 , 2 , 3 ) have been collected in the following Table 3, Table 4 and Table 5.
Step 2. DMUs are fully experienced and thus are invited to, also by use of the compound expression tool of PDHF_UUBLS, derive minimum acceptable values and maximum benchmarking values for each resilience capability according to their professional knowledge and observations. Then, we can obtain the positive-ideal and negative-ideal solutions r i j k ( + ) and r i j k ( ) ( k = 1 , 2 , 3 ) as follows.
r 1 1 ( + ) = ( [ H , T ] , { 0.8 | 0.2 , 0.9 | 0.8 } , { 0.1 | 1 } ) , r 2 1 ( + ) = ( [ A T , T ] , { 0.8 | 1 } , { 0.1 | 0.5 , 0.2 | 0.5 } ) ,
r 3 1 ( + ) = ( [ H , V H ] , { 0.8 | 1 } , { 0.1 | 0.9 , 0.2 | 0.1 } ) , r 4 1 ( + ) = ( [ A H , V H ] , { 0.9 | 1 } , { 0.1 | 1 } ) ,
r 5 1 ( + ) = ( [ H , T ] , { 0.8 | 1 } , { 0.2 | 1 } ) , r 6 1 ( + ) = ( [ V H , T ] , { 0.7 | 1 } , { 0.3 | 1 } ) ;
r 1 1 ( ) = ( [ A M , Q M ] , { 0.5 | 0.6 , 0.6 | 0.4 } , { 0.4 | 1 } ) , r 2 1 ( ) = ( [ Q M , A H ] , { 0.5 | 1 } , { 0.5 | 1 } ) ,
r 3 1 ( ) = ( [ L , M ] , { 0.6 | 0.5 , 0.7 | 0.5 } , { 0.3 | 1 } ) , r 4 1 ( ) = ( [ A L , A M ] , { 0.8 | 1 } , { 0.1 | 0.5 , 0.2 | 0.5 } ) ,
r 5 1 ( ) = ( [ V L , A L ] , { 0.9 | 1 } , { 0.1 | 1 } ) , r 6 1 ( ) = ( [ A M , M ] , { 0.8 | 1 } , { 0.1 | 0.5 , 0.2 | 0.5 } ) ;
r 1 2 ( + ) = ( [ V H , T ] , { 0.8 | 1 } , { 0.2 | 1 } ) , r 2 2 ( + ) = ( [ V H , T ] , { 0.7 | 0.4 , 0.8 | 0.6 } , { 0.1 | 0.5 , 0.2 | 0.5 } ) ,
r 3 2 ( + ) = ( [ H , T ] , { 0.9 | 1 } , { 0.1 | 1 } ) , r 4 2 ( + ) = ( [ A H , V H ] , { 0.8 | 0.5 , 0.9 | 0.5 } , { 0.1 | 1 } ) ,
r 5 2 ( + ) = ( [ H , V H ] , { 0.7 | 1 } , { 0.3 | 1 } ) , r 6 2 ( + ) = ( [ H , V H ] , { 0.7 | 0.3 , 0.8 | 0.7 } , { 0.2 | 1 } ) ;
r 1 2 ( ) = ( [ V L , Q L ] , { 0.5 | 0.8 , 0.6 | 0.2 } , { 0.4 | 1 } ) , r 2 1 ( ) = ( [ A N , V L ] , { 0.7 | 1 } , { 0.2 | 0.5,0.3 | 0.5 } ) ,
r 3 2 ( ) = ( [ A L , M ] , { 0.9 | 1 } , { 0.1 | 1 } ) , r 4 2 ( ) = ( [ L , A L ] , { 0.6 | 1 } , { 0.4 | 1 } ) ,
r 5 2 ( ) = ( [ L , M ] , { 0.6 | 0.3 , 0.7 | 0.7 } , { 0.3 | 1 } ) , r 6 2 ( ) = ( [ V L , Q L ] , { 0.6 | 1 } , { 0.3 | 0.5 , 0.4 | 0.5 } ) ;
r 1 3 ( + ) = ( [ V H , A T ] , { 0.9 | 1 } , { 0.1 | 1 } ) , r 2 3 ( + ) = ( [ A H , Q H ] , { 0.8 | 0.8 , 0.9 | 0.2 } , { 0.1 | 1 } ) ,
r 3 3 ( + ) = ( [ Q H , A T ] , { 0.7 | 1 } , { 0.2 | 0.5,0.3 | 0.5 } ) , r 4 3 ( + ) = ( [ A H , V H ] , { 0.8 | 0.5 , 0.9 | 0.5 } , { 0.1 | 1 } ) ,
r 5 3 ( + ) = ( [ H , V H ] , { 0.9 | 1 } , { 0.1 | 1 } ) , r 6 3 ( + ) = ( [ V H , T ] , { 0.7 | 0.3 , 0.8 | 0.7 } , { 0.1 | 0.2 , 0.2 | 0.8 } ) ;
r 1 3 ( ) = ( [ A L , M ] , { 0.7 | 0.5 , 0.8 | 0.5 } , { 0.2 | 1 } ) , r 2 3 ( ) = ( [ L , M ] , { 0.7 | 1 } , { 0.2 | 0.1 , 0.3 | 0.9 } ) ,
r 3 3 ( ) = ( [ A L , M ] , { 0.4 | 0.8 , 0.5 | 0.2 } , { 0.5 | 1 } ) , r 4 3 ( ) = ( [ V L , L ] , { 0.6 | 1 } , { 0.4 | 1 } ) ,
r 5 3 ( ) = ( [ A L , M ] , { 0.6 | 1 } , { 0.4 | 1 } ) , r 6 3 ( ) = ( [ V L , L ] , { 0.6 | 0.3 , 0.7 | 0.7 } , { 0.3 | 1 } ) .
Step 3. Based on the above decision matrices given by three DMUs, the programming model (M-1) is applied to objectively derive the weighting vector for the three DMUs, and we have η = {0.3349, 0.334, 0.3311}.
Step 4. Based on the above decision matrices given by three DMUs, Equation (25) is utilized to obtain entropy-based weighting vector for capability attributes objectively. Then we have
w ( 1 ) = ( 0.1651 , 0.2243 , 0.1674 , 0.0832 , 0.1515 , 0.2085 ) ,
w ( 2 ) = ( 0.1454 , 0.1086 , 0.2066 , 0.1765 , 0.2224 , 0.1404 ) ,
w ( 3 ) = ( 0.1432 , 0.1825 , 0.1898 , 0.1172 , 0.2085 , 0.1589 ) .
Step 5. By use of w ( k ) and η , we now apply the proposed weighted statistics-based correlation coefficient ρ w ( 1 ) ( A , B ) in Definition 5 and the weighted information energy-based correlation coefficient ρ w ( c 2 ) ( A , B ) in Definition 6 to calculate group value, C C w ( r j ) , of the weighted correlation-based closeness coefficient C C w ( r i j k ) .
(1) If ρ w ( 1 ) ( A , B ) is applied, we get C C w ( r i j k ) as follows:
C C w ( 1 ) ( r 1 1 ) = 0.4282 , C C w ( 1 ) ( r 2 1 ) = 0.4829 , C C w ( 1 ) ( r 3 1 ) = 0.5196 , C C w ( 1 ) ( r 4 1 ) = 0.5463 ;
C C w ( 1 ) ( r 1 2 ) = 0.4374 , C C w ( 1 ) ( r 2 2 ) = 0.2959 , C C w ( 1 ) ( r 3 2 ) = 0.4614 , C C w ( 1 ) ( r 4 2 ) = 0.453 ;
C C w ( 1 ) ( r 1 3 ) = 0.5333 , C C w ( 1 ) ( r 2 3 ) = 0.2525 , C C w ( 1 ) ( r 3 3 ) = 0.4291 , C C w ( 1 ) ( r 4 3 ) = 0.6788 .
Then we have group correlation-based closeness coefficient C C w ( r j ) as follows:
C C w ( 1 ) ( r 1 ) = 0.4661 , C C w ( 1 ) ( r 2 ) = 0.3442 , C C w ( 1 ) ( r 3 ) = 0.4702 , C C w ( 1 ) ( r 4 ) = 0.5590 .
(2) If ρ w ( c 2 ) ( A , B ) is applied, we get C C w ( r i j k ) as follows:
C C w ( c 2 ) ( r 1 1 ) = 0.5004 , C C w ( c 2 ) ( r 2 1 ) = 0.5033 , C C w ( c 2 ) ( r 3 1 ) = 0.5015 , C C w ( c 2 ) ( r 4 1 ) = 0.5138 ;
C C w ( c 2 ) ( r 1 2 ) = 0.5114 , C C w ( c 2 ) ( r 2 2 ) = 0.5109 , C C w ( c 2 ) ( r 3 2 ) = 0.5104 , C C w ( c 2 ) ( r 4 2 ) = 0.5105 ;
C C w ( c 2 ) ( r 1 3 ) = 0.5101 , C C w ( c 2 ) ( r 2 3 ) = 0.5038 , C C w ( c 2 ) ( r 3 3 ) = 0.5023 , C C w ( c 2 ) ( r 4 3 ) = 0.5145 ;
Then we have group correlation-based closeness coefficient C C w ( r j ) as follows:
C C w ( c 2 ) ( r 1 ) = 0.5073 , C C w ( c 2 ) ( r 2 ) = 0.5060 , C C w ( c 2 ) ( r 3 ) = 0.5048 , C C w ( c 2 ) ( r 4 ) = 0.5129 .
Step 6. According to the group correlation-based closeness coefficient C C w ( r j ) , we can obtain the final ranking order of all four alternative suppliers.
(1) If ρ w ( 1 ) ( A , B ) is applied,
{ C C w ( 1 ) ( r 1 ) = 0.4661 ,   C C w ( 1 ) ( r 2 ) = 0.3442 ,   C C w ( 1 ) ( r 3 ) = 0.4702 ,   C C w ( 1 ) ( r 4 )   A 2 A 1 A 3 A 4 .
(2) If ρ w ( c 2 ) ( A , B ) is applied,
{ C C w ( c 2 ) ( r 1 ) = 0.5073 ,   C C w ( c 2 ) ( r 2 ) = 0.5060 ,   C C w ( c 2 ) ( r 3 ) = 0.5048 ,   C C w ( c 2 ) ( r 4 )   A 3 A 2 A 1 A 4 .
As can be seen, the above decision-making processes that respectively adopt ρ w ( 1 ) ( A , B ) and ρ w ( c 2 ) ( A , B ) all determine that the supplier A 4 is the most desirable one. But in some special cases, as mentioned in Example 2, the statistics-based correlation coefficient ρ w ( 1 ) ( A , B ) cannot apply when hesitant elements share the same mean value or standard deviation [48,49]. With regard to the current illustrative case, if we accept the absolute positive and negative ideal solutions which are generally suggested [177,178,179] in the absence of adequate preceding experiences or knowledge, that is, r ( + ) = ([T, T], {1|1}, {0|1}) and r ( ) = ([N, N], {1|1}, {0|1}), ρ w ( 1 ) ( A , B ) then cannot be applied. Comparatively, ρ w ( c 2 ) ( A , B ) does not exhibit this limitation and thus holds general applicability in practice. In essence, ρ w ( c 2 ) ( A , B ) inherits information energy-based methodology for deriving association degrees between two PDHF_UUBLSs, which enables the consideration of uncertainty and hesitancy as embodied in the compound structure of PDHF_UUBLS more completely and comprehensively.

5.2. Further Investigations on Proposed Algorithm 1

As discussed in Section 2 (summarized in Table 1), the methodologies of TOPSIS and AHP/ANP were often applied in RSS studies. TOPSIS and its extensions apply to decision-making scenarios based on decision matrices, while AHP/ANP and their extensions generally apply to decision-making scenarios based on preference relations. As known, AHP/ANP was originally put forward to deduce criteria weights according to interrelations between criteria, and thus were also often included to derive the weighting vector of the criteria in decision matrices-based methodologies. With respect to the proposed criteria system in Section 3, application of AHP/ANP needs a meta-analysis based on extensive literature reviews and consultations, which is obviously out of present paper’s scope. In addition, the single weighting vector output by meta-analysis is still inadequate in helping show the effectiveness and sensitivity of Algorithm 1. Therefore, in order to verify the effectiveness and investigate sensitivity of Algorithm 1, we here apply traditional TOPSIS to compare ranking results and apply the widely adopted Basic Unit-interval Monotone (BUM) functions [180] to carry out sensitivity analysis along changing weighting vectors of criteria.
Firstly, in view that the proposed Algorithm 1 is an implementation of correlation coefficient-based methodology, we have to extend traditional TOPSIS by use of a certain correlation coefficient defined for the PDHF_UUBLS environment. Let ρ be a correlation coefficient for PDHF_UUBLS; then, we have the following closeness coefficient defined according to traditional TOPSIS as
C C T O P S I S ρ ( r j k ) = i = 1 n ρ ( r i j k , r i j k ( + ) ) ρ ( r i j k , r i j k ( + ) ) + ρ ( r i j k , r i j k ( ) ) .
As pointed out by Chen [174], the rationale underlying TOPSIS framework will be violated if negative correlation coefficients are applied to the above C C T O P S I S ρ ( r j k ) . Therefore, the statistics-based correlation coefficient ρ w ( 1 ) cannot apply to C C T O P S I S ρ ( r j k ) because it often generates negative values [48,49]. On the contrary, the information energy-based correlation coefficient ρ w ( c 2 ) can be directly used in C C T O P S I S ρ ( r j k ) because ρ w ( c 2 ) always produces positive values. Then we can have the ranking results of traditional TOPSIS by use of ρ w ( c 2 ) as follows:
c 1 =   0.5148 ,   c 2 =   0.5113 ,   c 3 =   0.5105 ,   c 4   A 3 A 2 A 1 A 4 .
By comparison, the closeness coefficients as shown in Equations (23) and (24) maintain the rationale of TOPSIS framework [174], thus guaranteeing that Algorithm 1 is capable of accommodating both ρ w ( 1 ) and ρ w ( c 2 ) . In all ranking results that were obtained by Algorithm 1 and the above extended version of traditional TOPSIS, A 4 is unanimously recognized as the best supplier. As can be seen, Algorithm 1 exhibits more applicability than traditional TOPSIS, and the information energy-based correlation coefficient ρ w ( c 2 ) also holds more applicability than the statistics-based correlation coefficient ρ w ( 1 ) .
Secondly, intensive investigations are here carried out to further verify the effectiveness and sensitivity of Algorithm 1 based on the information energy-based correlation coefficient ρ w ( c 2 ) . The widely adopted Basic Unit-interval Monotone (BUM) function, Q ( r ) = r α ( α = 1/5, 1/4, 1/3, …, 3, 4, 5) [180], is applied to generate monotonically increasing weights for criteria. The reason for setting upper limit of α to 5 is to prevent weights from being zeros. All closeness coefficient C C w ( r j ) and corresponding ranking results of all four alternative suppliers have been collected in Table 6 for comparison.
With monotonically changing weighting vectors as shown in Table 6, Algorithm 1 always identifies that A 4 is the best resilient supplier and A 1 is the better one. C C w ( r j ) shows that Algorithm 1 is weighting vector-sensitive and capable of differentiating all four alternative suppliers. The tiny differences between C C w ( r j ) of A 2 and A 3 are maintained all the way, and thus A 2 and A 3 can be stably recognized at the same lower level with regard to resilience performance. Taken together, our proposed Algorithm 1 can sensitively reflect influences of changing weighting vectors of criteria and effectively output stable ranking results for the above complicate the RSS decision-making task.

6. Managerial Insights

To focal companies, RSS is one of key tasks in building resilience in their supply chains. In order to tackle the complicated RSS problems with low-structured definitions, this paper presents an effective correlation coefficient-based MCGDM methodology which incorporates PDHF_UUBLS for handling hybrid decision uncertainties in practice. The newly established capabilities-oriented criteria system serves as a more systematic analytical framework for carrying out intensive evaluation of supplier resilience. The criteria system also provides a clearer conceptional framework that facilitates practical applications of causal analyses in deriving rational objective–subjective weighting vectors for the criteria, such as DEMATEL, AHP/ANP, BWM, etc. With special respect to industrial contexts where indicators belonging to certain capabilities may increase, our proposed correlation coefficient-based MCGDM methodology manages to keep computation complexity unchanged, because PDHF_UUBLS takes advantage of judgment capacity of DMUs to construct decision matrices of same scale. This advantage also holds and contributes to lower down overall computation complexity in large group decision-making scenarios. Furthermore, to prompt development of resilience-related capabilities in strategic suppliers, RSS have to be periodically routinized, and our proposed methodology answers this call pertinently. Therefore, it is strongly suggested in practice to computerize and integrate our proposed methodology into decision support systems so as to substantially enhance the processing capacity of RSS correspondingly.

7. Conclusions, Limitations and Future Research Directions

With the aim of tackling RSS problems of high uncertainty, an effective correlation coefficient-based MCGDM methodology under PDHF_UUBLS environments has been developed. In responding to the fact that extant criteria systems for evaluation of supplier resilience were obviously in lack of theoretical rationale, a capabilities-oriented criteria system for intensive evaluation of supplier resilience has been put forward by taking the dynamic view of resilience processes as indicated in both dynamic capabilities theory and risk management theory. Comparatively, the capabilities-oriented criteria system serves as a more conceptionally systematic framework for intensive evaluation of supplier resilience and substantially complements all extant criteria systems of the RSS studies in a generalized manner. In group decision-making settings where RSS often takes place to avoid limits of single expert, the compound expression tool of PDHF_UUBLS exhibits the adequate judgment capacity of DMUs to simultaneously capture hybrid uncertainties in linguistic interval, bipolar decision hesitancies and supplementary probabilistic decision attitudes. In this way, PDHF_UUBLS manages to derive decision matrices of the same scale for real scenarios where indicators belonging to certain capabilities may increase, thereby making the constructed correlation coefficient-based MCGDM methodology more applicable in up-scaled practices. Theoretical analyses have proved that the newly defined statistics-based and information energy-based correlation coefficients for PDHF_UUBLS are both effective, and the information energy-based correlation coefficients overcome shortcomings of statistics-based correlation coefficients in some special cases. Experiments have also indicated that information energy-based correlation coefficients enable our MCGDM methodology to produce ranking results effectively and stably. Therefore, our proposed methodology holds theoretically grounded criteria systems for RSS, is capable of handling hybrid uncertainties, maintains lower computational complexity in up-scaled practical scenarios, and thus exhibits as a pertinent and effective pathway in resolving practical RSS problems of high uncertainty.
Despite these advantages, the present study may still hold some potential limitations. Firstly, although our MCGDM methodology has been constructed to be theoretically compliant with the typical research paradigm for tackling complicated RSS problems, verifications that demonstrate effectiveness and stability of the proposed methodology depend on illustrative case studies and thus cannot provide more guidelines for detailed implementation in specific real scenarios. Secondly, although the criteria system derived in this paper is better theoretically grounded and pertinent for methodologies based on subjective evaluations to resolve RSS of high uncertainty, the present study may overlook data affordances in real situations where quantitative operationalization of certain indicators in the criteria system are allowed to some extent. In addition, due to lack of adequate knowledge that determines causal relations in the criteria system, the objective weighting method was adopted in our constructed methodology. However, there will be specific needs in practices to derive attitudinal criteria weights from causal relations; to this end, our methodology in the present study should incorporate appropriate causal analysis methods. Thirdly, although our MCGDM methodology is intrinsically suitable for group decision-making environments, necessary mechanisms that bolster processual efficiency in up-scaled decision-making scenarios should be further designed and incorporated. The present study does not provide an integrated graphical user interface to help DMUs with their judgment process and data collection procedures. Of special note, with regard to the up-scaled large group decision-making contexts, the present study has not considered the consensus issues among evaluations collected from DMUs. To this end, the proposed methodology should have mechanisms that are capable of measuring and flexibly reaching group consensus to a given threshold.
Based on the above discussion, some feasible directions can now be outlined for future research. Firstly, meta-analyses on the proposed criteria system for RSS will help understand potential overlapping relations among evaluative criteria more precisely and thus contribute to building theoretical guidelines for operating the criteria system in real RSS applications. Secondly, the introduction of causal analysis models, such as DEMATEL, AHP/ANP, BWM, will empower the proposed methodology in comprehensive determination of specific weighting vector for the criteria system through capturing overlapping interrelations among evaluative criteria, thereby further gaining more applicability in real RSS practices. Thirdly, consensus-reaching mechanisms, such as social network-based analytical models to discover interconnections among DMUs, are essential in large group decision-making settings, but the corresponding complicated consensus-reaching processes require development of smart interactive techniques and flexible models to guarantee their efficacy and efficiency. Finally, it is of particular importance to carry out extensive industrial case studies and comparative investigations, which contributes to consolidating useful insights for operating the proposed methodology and its extensions. To facilitate this end, especially considering data affordance in various industrial contexts, artificial intelligence-based large language models are capable of recognizing decision information about suppliers more thoroughly and comprehensively and thus will improve both the qualitative and quantitative operability level of the proposed methodology.

Author Contributions

Conceptualization, X.-W.Q., C.-Y.L. and J.-L.Z.; methodology, X.-W.Q. and J.-L.Z.; software, J.-L.Z. and J.-T.L.; validation, X.-W.Q. and J.-L.Z.; formal analysis, X.-W.Q.; investigation, X.-W.Q. and J.-L.Z.; resources, J.-L.Z. and J.-T.L.; data curation, X.-W.Q., C.-Y.L. and J.-L.Z.; writing—original draft preparation, X.-W.Q. and J.-L.Z.; writing—review and editing, J.-L.Z.; supervision, C.-Y.L.; project administration, X.-W.Q.; funding acquisition, X.-W.Q. All authors have read and agreed to the published version of the manuscript.

Funding

This research was funded by Zhejiang Provincial Natural Science Foundation of China under Grant No. LY21G010006.

Institutional Review Board Statement

Not applicable.

Informed Consent Statement

Not applicable.

Data Availability Statement

All desirable data have been described in text.

Acknowledgments

The authors would like to thank the reviewers and editors for all constructive comments and suggestions during the whole review process.

Conflicts of Interest

The authors declare no conflicts of interest.

Abbreviations

The following abbreviations are used in this manuscript:
3PL3rd Party Logistics
AHPAnalytic Hierarchy Process
ANPAnalytic Network Process
BUMBasic Unit-interval Monotone
BWMBest-Worst Method
CCCorrelation Coefficient
DEMATELDecision-Making Trial and Evaluation Laboratory
DHFLTSDual hesitant fuzzy linguistic term set
DHHFLTSDouble hierarchy hesitant fuzzy linguistic term set
DMUDecision Making Unit
EHFLTSExtended hesitant fuzzy linguistic term set
HFLSHesitant fuzzy linguistic set
HFLTSHesitant fuzzy linguistic term set
IDHLTSIntuitionistic double hierarchy linguistic term set
IHFLTSIntuitionistic hesitant fuzzy linguistic term set
IPHFLVInterval probability hesitant fuzzy linguistic variable
IULSIntuitionistic uncertain linguistic set
IVDHFLSInterval-valued dual hesitant fuzzy linguistic set
IVHFLSInterval-valued hesitant fuzzy linguistic set
IVIULSInterval-valued intuitionistic uncertain linguistic set
IZLSIntuitionistic Z-linguistic set
LHLinguistic Hierarchy
LHFSLinguistic hesitant fuzzy set
LIFPRLinguistic intuitionistic fuzzy preference relation
MCDMMulti-Criteria Decision Making
MCGDMMulticriteria Group Decision Making
PDHF_UUBLEProbabilistic Dual Hesitant Fuzzy Uncertain Unbalanced Linguistic Element
PDHF_UUBLSProbabilistic Dual Hesitant Fuzzy Uncertain Unbalanced Linguistic Set
PDHFUUBLSProbabilistic dual hesitant fuzzy uncertain unbalanced linguistic set
PHFLTSProbabilistic hesitant fuzzy linguistic term set
PLDHFPRProbabilistic linguistic dual hesitant fuzzy preference relation
PLDHFSProbabilistic linguistic dual hesitant fuzzy set
PLPRProbabilistic linguistic preference relation
PLTSProbabilistic linguistic term set
PULTSProbabilistic uncertain linguistic term set
RSSResilient Supplier Selection
SCMSupply Chain Management
UDHLTSUnbalanced double hierarchy linguistic term set
UHFLTSUnbalanced hesitant fuzzy linguistic term set
VUCAVolatility, Uncertainty, Complexity and Ambiguity

Appendix A

LCM-based Extension Mechanism for PDHF_UUBLS [37].
For Any two PDHF_UUBLSs L A = x i , s ˜ ϑ A ( x i ) , h A ( x i ) p A ( x i ) , g A ( x i ) q A ( x i ) x i X and L B = x i , s ˜ ϑ B ( x i ) , h B ( x i ) p B ( x i ) , g B ( x i ) q B ( x i ) x i X , we can extend A and B to A * and B * , we have L A * = x i , s ˜ ϑ A ( x i ) , h A * ( x i ) p A * ( x i ) , g A * ( x i ) q A * ( x i ) x i X and L B * = x i , s ˜ ϑ B ( x i ) , h B * ( x i ) p B * ( x i ) , g B * ( x i ) q B * ( x i ) x i X . Where h A * ( x i ) p A * ( x i ) = μ k A i * p k A i * , g A * ( x i ) q A * ( x i ) = ν o A i * q o A i * , h B * ( x i ) p B * ( x i ) = μ k B i * p k B i * , g B * ( x i ) q B * ( x i ) = ν o B i * q o B i * .
Then, taking h A * ( x i ) p A * ( x i ) as an example, we have
h A * ( x i ) p A * ( x i ) = μ k A i * p k A i * = μ 1 A i p 1 A i l h A i * , , μ 1 A i p 1 A i l h A i * l h A i * , , μ k A i p k A i l h A i * , , μ k A i p k A i l h A i * l h A i * , , μ l h A i p l h A i l h A i * , , μ l h A i p l h A i l h A i * l h A i * .
Similarly, we can obtain g A * ( x i ) q A * ( x i ) , h B * ( x i ) p B * ( x i ) and g B * ( x i ) q B * ( x i ) :
g A * ( x i ) q A * ( x i ) = ν o A i * q o A i * = ν 1 A i q 1 A i l g A i * , , ν 1 A i q 1 A i l g A i * l g A i * , , ν o A i q o A i l g A i * , , ν o A i q o A i l g A i * l g A i * , , ν l g A i q l g A i l g A i * , , ν l g A i q l g A i l g A i * l g A i * ,
h B * ( x i ) p B * ( x i ) = μ k B i * p k B i * = μ 1 B i p 1 B i l h B i * , , μ 1 B i p 1 B i l h B i * l h B i * , , μ k B i p k B i l h B i * , , μ k B i p k B i l h B i * l h B i * , , μ l h B i p l h B i l h B i * , , μ l h B i p l h B i l h B i * l h B i * ,   and
g B * ( x i ) q B * ( x i ) = ν o B i * q o B i * = ν 1 B i q 1 B i l g B i * , , ν 1 B i q 1 B i l g B i * l g B i * , , ν o B i q o B i l g B i * , , ν o B i q o B i l g B i * l g B i * , , ν l g B i q l g B i l g B i * , , ν l g B i q l g B i l g B i * l g B i * ,
where l h A i * = l h i l h A i , l h B i * = l h i l h B i , l g A i * = l g i l g A i , l g B i * = l g i l g B i .

References

  1. Gao, Y.; Feng, Z.; Zhang, S. Managing supply chain resilience in the era of VUCA. Front. Eng. Manag. 2021, 8, 465–470. [Google Scholar] [CrossRef]
  2. Pundziene, A.; Geryba, L. Managing Technological Innovation: Dynamic Capabilities, Collaborative Innovation, and Born-Digital SMEs’ Performance. IEEE Trans. Eng. Manag. 2024, 71, 6968–6981. [Google Scholar] [CrossRef]
  3. Mu, W.; van Asselt, E.D.; van der Fels-Klerx, H.J. Towards a resilient food supply chain in the context of food safety. Food Control 2021, 125, 107953. [Google Scholar] [CrossRef]
  4. Majumdar, A.; S, J.; Kaliyan, M.; Agrawal, R. Selection of resilient suppliers in manufacturing industries post-COVID-19: Implications for economic and social sustainability in emerging economies. Int. J. Emerg. Mark. 2023, 18, 3657–3675. [Google Scholar] [CrossRef]
  5. Chowdhury, M.M.H.; Quaddus, M. Supply chain resilience: Conceptualization and scale development using dynamic capability theory. Int. J. Prod. Econ. 2017, 188, 185–204. [Google Scholar] [CrossRef]
  6. Marusak, A.; Sadeghiamirshahidi, N.; Krejci, C.C.; Mittal, A.; Beckwith, S.; Cantu, J.; Morris, M.; Grimm, J. Resilient regional food supply chains and rethinking the way forward: Key takeaways from the COVID-19 pandemic. Agric. Syst. 2021, 190, 103101. [Google Scholar] [CrossRef]
  7. Christopher, M.; Peck, H. Building the Resilient Supply Chain. Int. J. Logist. Manag. 2004, 15, 1–14. [Google Scholar] [CrossRef]
  8. Jia, F.; Shahzadi, G.; Bourlakis, M.; John, A. Promoting resilient and sustainable food systems: A systematic literature review on short food supply chains. J. Clean. Prod. 2024, 435, 140364. [Google Scholar] [CrossRef]
  9. Ulutaş, A.; Topal, A.; Ecer, F. Green-resilient supplier selection via a new integrated rough multi-criteria framework. J. Ind. Inf. Integr. 2025, 47, 100913. [Google Scholar] [CrossRef]
  10. Rajesh, R.; Ravi, V. Supplier selection in resilient supply chains: A grey relational analysis approach. J. Clean. Prod. 2015, 86, 343–359. [Google Scholar] [CrossRef]
  11. Valipour Parkouhi, S.; Safaei Ghadikolaei, A. A resilience approach for supplier selection: Using Fuzzy Analytic Network Process and grey VIKOR techniques. J. Clean. Prod. 2017, 161, 431–451. [Google Scholar] [CrossRef]
  12. Zhang, J.; Qi, X.; Liang, C. Tackling Complexity in Green Contractor Selection for Mega Infrastructure Projects: A Hesitant Fuzzy Linguistic MADM Approach with considering Group Attitudinal Character and Attributes’ Interdependency. Complexity 2018, 2018, 4903572. [Google Scholar] [CrossRef]
  13. Chaoui, G.; Yaagoubi, R.; Mastere, M. Integrating Geospatial Technologies and Multi-Criteria Decision Analysis for Sustainable and Resilient Urban Planning. Chall. Sustain. 2025, 13, 122–134. [Google Scholar] [CrossRef]
  14. Amindoust, A. A resilient-sustainable based supplier selection model using a hybrid intelligent method. Comput. Ind. Eng. 2018, 126, 122–135. [Google Scholar] [CrossRef]
  15. Sahu, A.K.; Sharma, M.; Raut, R.D.; Sahu, A.K.; Sahu, N.K.; Antony, J.; Tortorella, G.L. Decision-making framework for supplier selection using an integrated MCDM approach in a lean-agile-resilient-green environment: Evidence from Indian automotive sector. TQM J. 2023, 35, 964–1006. [Google Scholar] [CrossRef]
  16. Varchandi, S.; Memari, A.; Jokar, M.R.A. An integrated best–worst method and fuzzy TOPSIS for resilient-sustainable supplier selection. Decis. Anal. J. 2024, 11, 100488. [Google Scholar] [CrossRef]
  17. Sun, J.; Liu, Y.; Xu, J.; Zhu, F.; Wang, N. A Probabilistic Uncertain Linguistic Decision-Making Model for Resilient Supplier Selection Based on Extended TOPSIS and BWM. Int. J. Fuzzy Syst. 2024, 26, 992–1015. [Google Scholar] [CrossRef]
  18. Zhang, X.; Goh, M.; Bai, S.; Wang, Q. Green, resilient, and inclusive supplier selection using enhanced BWM-TOPSIS with scenario-varying Z-numbers and reversed PageRank. Inf. Sci. 2024, 674, 120728. [Google Scholar] [CrossRef]
  19. Gökler, S.H.; Boran, S. A novel resilient and sustainable supplier selection model based on D-AHP and DEMATEL methods. J. Eng. Res. 2025, 13, 57–67. [Google Scholar] [CrossRef]
  20. Song, W.; Xue, H.; Rong, W. An integrated method for resilient-sustainable supplier selection based on action-oriented practices. Adv. Eng. Inform. 2025, 67, 103570. [Google Scholar] [CrossRef]
  21. Herrera, F.; Herrera-Viedma, E.; verdegay, J.L. A model of consensus in group decision making under linguistic assessments. Fuzzy Sets Syst. 1996, 78, 73–87. [Google Scholar] [CrossRef]
  22. Xu, Z. Uncertain linguistic aggregation operators based approach to multiple attribute group decision making under uncertain linguistic environment. Inf. Sci. 2004, 168, 171–184. [Google Scholar] [CrossRef]
  23. Ju, Y.; Wang, A.; Ma, J.; Gao, H.; Santibanez Gonzalez, E.D.R. Some q-rung orthopair fuzzy 2-tuple linguistic Muirhead mean aggregation operators and their applications to multiple-attribute group decision making. Int. J. Intell. Syst. 2020, 35, 184–213. [Google Scholar] [CrossRef]
  24. Jin, F.; Zhao, Y.; Zheng, X.; Zhou, L. Supplier selection through interval type-2 trapezoidal fuzzy multi-attribute group decision-making method with logarithmic information measures. Eng. Appl. Artif. Intell. 2023, 126, 107006. [Google Scholar] [CrossRef]
  25. Torra, V. Hesitant fuzzy sets. Int. J. Intell. Syst. 2010, 25, 529–539. [Google Scholar] [CrossRef]
  26. Turgay, S.; Başar, E.E.; Çalışan, M.; Geçkil, M.F.; Baydaş, M.; Stević, Ž. Enhancing Decision Quality in Smart Manufacturing: Uncertainty-Aware Evaluation of Edge–Cloud Architectures with T-Spherical Hesitant Fuzzy Rough Sets. Int. J. Comput. Methods Exp. Meas. 2025, 13, 211–225. [Google Scholar] [CrossRef]
  27. Alimohammadlou, M.; Khoshsepehr, Z. Green-resilient supplier selection: A hesitant fuzzy multi-criteria decision-making model. Environ. Dev. Sustain. 2022, 27, 22107–22143. [Google Scholar] [CrossRef]
  28. Peng, X.Y.; Luo, L.; Liao, H.C.; Zavadskas, E.K.; Al-Barakati, A. A Novel Decision-Making Method for Resilient Supplier Selection during COVID-19 Pandemic Outbreak Based on Hesitant Fuzzy Linguistic Preference Relations. Transform. Bus. Econ. 2021, 20, 238–258. [Google Scholar]
  29. Chang, K.H. A novel flexible supplier selection method in the environment of Fermatean fuzzy information and incomplete information. Ann. Oper. Res. 2024; in press. [Google Scholar] [CrossRef]
  30. Lei, W.; Li, X.; Gong, K.; Sun, B. Large-Scale Behavioral Three-Way Group Decision Based on Prospect Theory Under Dual Hesitant Fuzzy Environment. IEEE Trans. Syst. Man Cybern. Syst. 2025, 55, 4943–4956. [Google Scholar] [CrossRef]
  31. Pang, Q.; Wang, H.; Xu, Z.S. Probabilistic linguistic linguistic term sets in multi-attribute group decision making. Inf. Sci. 2016, 369, 128–143. [Google Scholar] [CrossRef]
  32. Zhu, B.; Xu, Z.S.; Xia, M.M. Dual Hesitant Fuzzy Sets. J. Appl. Math. 2012, 2012, 879629. [Google Scholar] [CrossRef]
  33. Xie, W.Y.; Xu, Z.S.; Ren, Z.L. Dual probabilistic linguistic term set and its application on multi-criteria group decision making problems. In Proceedings of the 2017 IEEE International Conference on Industrial Engineering and Engineering Management (IEEM), Singapore, 10–13 December 2017; pp. 1469–1474. [Google Scholar] [CrossRef]
  34. Wang, J.Q.; Wu, J.T.; Wang, J.; Zhang, H.Y.; Chen, X.H. Interval-valued hesitant fuzzy linguistic sets and their applications in multi-criteria decision-making problems. Inf. Sci. 2014, 288, 55–72. [Google Scholar] [CrossRef]
  35. Qi, X.W.; Zhang, J.L.; Liang, C.Y. Multiple Attributes Group Decision-Making Approaches Based on Interval-Valued Dual Hesitant Fuzzy Unbalanced Linguistic Set and Their Applications. Complexity 2018, 2018, 3172716. [Google Scholar] [CrossRef]
  36. Tian, Z.-P.; Wang, J.-Q.; Zhang, H.-Y.; Wang, T.-L. Signed distance-based consensus in multi-criteria group decision-making with multi-granular hesitant unbalanced linguistic information. Comput. Ind. Eng. 2018, 124, 125–138. [Google Scholar] [CrossRef]
  37. Zhang, J.; Shen, L.; Liu, L.; Qi, X.; Liang, C. Tackling Comprehensive Evaluation of Tourism Community Resilience: A Probabilistic Hesitant Linguistic Group Decision Making Approach. Land 2022, 11, 1652. [Google Scholar] [CrossRef]
  38. Herrera, F.; Herrera-Viedma, E.; Martinez, L. A fuzzy linguistic methodology to deal with unbalanced linguistic term sets. IEEE Trans. Fuzzy Syst. 2008, 16, 354–370. [Google Scholar] [CrossRef]
  39. Gerstenkorn, T.; Mańko, J. Correlation of intuitionistic fuzzy sets. Fuzzy Sets Syst. 1991, 44, 39–43. [Google Scholar] [CrossRef]
  40. Bustince, H.; Burillo, P. Correlation of interval-valued intuitionistic fuzzy sets. Fuzzy Sets Syst. 1995, 74, 237–244. [Google Scholar] [CrossRef]
  41. Ye, J. Fuzzy decision-making method based on the weighted correlation coefficient under intuitionistic fuzzy environment. Eur. J. Oper. Res. 2010, 205, 202–204. [Google Scholar] [CrossRef]
  42. Xu, Z.S.; Xia, M.M. On Distance and Correlation Measures of Hesitant Fuzzy Information. Int. J. Intell. Syst. 2011, 26, 410–425. [Google Scholar] [CrossRef]
  43. Ye, J. Correlation coefficient of dual hesitant fuzzy sets and its application to multiple attribute decision making. Appl. Math. Model. 2014, 38, 659–666. [Google Scholar] [CrossRef]
  44. Liao, H.C.; Xu, Z.S.; Zeng, X.J.; Merigó, J.M. Qualitative decision making with correlation coefficients of hesitant fuzzy linguistic term sets. Knowl.-Based Syst. 2015, 76, 127–138. [Google Scholar] [CrossRef]
  45. Ye, J. Improved correlation coefficients of single valued neutrosophic sets and interval neutrosophic sets for multiple attribute decision making. J. Intell. Fuzzy Syst. 2014, 27, 2453–2462. [Google Scholar] [CrossRef]
  46. Garg, H. A Novel Correlation Coefficients between Pythagorean Fuzzy Sets and Its Applications to Decision-Making Processes. Int. J. Intell. Syst. 2016, 31, 1234–1252. [Google Scholar] [CrossRef]
  47. Chen, N.; Xu, Z.; Xia, M. Correlation coefficients of hesitant fuzzy sets and their applications to clustering analysis. Appl. Math. Model. 2013, 37, 2197–2211. [Google Scholar] [CrossRef]
  48. Sun, G.; Guan, X.; Yi, X.; Zhou, Z. An innovative TOPSIS approach based on hesitant fuzzy correlation coefficient and its applications. Appl. Soft Comput. 2018, 68, 249–267. [Google Scholar] [CrossRef]
  49. Guan, X.; Sun, G.; Yi, X.; Zhou, Z. Synthetic Correlation Coefficient Between Hesitant Fuzzy Sets with Applications. Int. J. Fuzzy Syst. 2018, 20, 1968–1985. [Google Scholar] [CrossRef]
  50. Liu, X.; Wang, Z.; Zhang, S.; Garg, H. Novel correlation coefficient between hesitant fuzzy sets with application to medical diagnosis. Expert Syst. Appl. 2021, 183, 115393. [Google Scholar] [CrossRef]
  51. Garg, H.; Sun, Y.; Liu, X. Dual hesitant fuzzy Correlation coefficient-based decision-making algorithm and its applications to Engineering Cost Management problems. Eng. Appl. Artif. Intell. 2023, 126, 107170. [Google Scholar] [CrossRef]
  52. Song, C.; Xu, Z.; Zhao, H. New Correlation Coefficients Between Probabilistic Hesitant Fuzzy Sets and Their Applications in Cluster Analysis. Int. J. Fuzzy Syst. 2019, 21, 355–368. [Google Scholar] [CrossRef]
  53. Zhang, R.; Gou, X.; Xu, Z. A multi-attribute decision-making framework for Chinese medicine medical diagnosis with correlation measures under double hierarchy hesitant fuzzy linguistic environment. Comput. Ind. Eng. 2021, 156, 107243. [Google Scholar] [CrossRef]
  54. Şahin, R.; Liu, P. Correlation coefficient of single-valued neutrosophic hesitant fuzzy sets and its applications in decision making. Neural Comput. Appl. 2017, 28, 1387–1395. [Google Scholar] [CrossRef]
  55. Garg, H.; Kaur, G. A robust correlation coefficient for probabilistic dual hesitant fuzzy sets and its applications. Neural Comput. Appl. 2020, 32, 8847–8866. [Google Scholar] [CrossRef]
  56. Zhao, M.; Hu, Y.; Wu, S.; Xu, Z. A Telemedicine Decision-Making Model for Teleconsultation Decision Support System Based on Intuitionistic Hesitant Fuzzy Linguistic Term Sets. IEEE Trans. Fuzzy Syst. 2023, 31, 905–918. [Google Scholar] [CrossRef]
  57. Holling, C.S. Resilience and Stability of Ecological Systems. Annu. Rev. Ecol. Syst. 1973, 4, 1–23. [Google Scholar] [CrossRef]
  58. Fiksel, J. Sustainability and resilience: Toward a systems approach. Sustain. Sci. Pract. Policy 2006, 2, 14–21. [Google Scholar] [CrossRef]
  59. Jiang, Y.; Ritchie, B.W.; Verreynne, M.-L. Developing disaster resilience: A processual and reflective approach. Tour. Manag. 2021, 87, 104374. [Google Scholar] [CrossRef]
  60. Degani, R.; Bortolan, G. The problem of linguistic approximation in clinical decision making. Int. J. Approx. Reason. 1988, 2, 143–162. [Google Scholar] [CrossRef]
  61. Dong, Y.; Li, C.-C.; Herrera, F. Connecting the linguistic hierarchy and the numerical scale for the 2-tuple linguistic model and its use to deal with hesitant unbalanced linguistic information. Inf. Sci. 2016, 367–368, 259–278. [Google Scholar] [CrossRef]
  62. Morente-Molinera, J.A.; Pérez, I.J.; Ureña, M.R.; Herrera-Viedma, E. On multi-granular fuzzy linguistic modeling in group decision making problems: A systematic review and future trends. Knowl.-Based Syst. 2015, 74, 49–60. [Google Scholar] [CrossRef]
  63. Zhao, Y.; Jiang, N.; He, Y.; Deng, X. Entropy measures of multigranular unbalanced hesitant fuzzy linguistic term sets for multiple criteria decision making. Inf. Sci. 2025, 686, 121346. [Google Scholar] [CrossRef]
  64. Zadeh, L.A. The concept of a linguistic variable and its application to approximate reasoning-I. Inf. Sci. 1975, 8, 199–249. [Google Scholar] [CrossRef]
  65. Liu, P.; Wang, Y. Multiple attribute group decision making methods based on intuitionistic linguistic power generalized aggregation operators. Appl. Soft Comput. 2014, 17, 90–104. [Google Scholar] [CrossRef]
  66. Liu, P.; Jin, F. Methods for aggregating intuitionistic uncertain linguistic variables and their application to group decision making. Inf. Sci. 2012, 205, 58–71. [Google Scholar] [CrossRef]
  67. Meng, F.; Chen, X.; Zhang, Q. Some interval-valued intuitionistic uncertain linguistic Choquet operators and their application to multi-attribute group decision making. Appl. Math. Model. 2014, 38, 2543–2557. [Google Scholar] [CrossRef]
  68. Xian, S.; Yang, Z.; Guo, H. Double parameters TOPSIS for multi-attribute linguistic group decision making based on the intuitionistic Z-linguistic variables. Appl. Soft Comput. 2019, 85, 105835. [Google Scholar] [CrossRef]
  69. Rodríguez, R.M.; Martinez, L.; Herrera, F. Hesitant Fuzzy Linguistic Term Sets for Decision Making. IEEE Trans. Fuzzy Syst. 2012, 20, 109–119. [Google Scholar] [CrossRef]
  70. Wei, C.; Rodríguez, R.M.; Martínez, L. Uncertainty Measures of Extended Hesitant Fuzzy Linguistic Term Sets. IEEE Trans. Fuzzy Syst. 2018, 26, 1763–1768. [Google Scholar] [CrossRef]
  71. Tao, Y.; Peng, Y.; Wu, Y. Linguistic Dual Hesitant Fuzzy Preference Relations and Their Application in Group Decision-Making. Int. J. Fuzzy Syst. 2023, 25, 1105–1130. [Google Scholar] [CrossRef]
  72. Qi, X.; Liang, C.; Zhang, J. Multiple attribute group decision making based on generalized power aggregation operators under interval-valued dual hesitant fuzzy linguistic environment. Int. J. Mach. Learn. Cybern. 2016, 7, 1147–1193. [Google Scholar] [CrossRef]
  73. Feng, X.; Shang, X.; Xu, Y.; Wang, J. A method to multi-attribute decision-making based on interval-valued q-rung dual hesitant linguistic Maclaurin symmetric mean operators. Complex Intell. Syst. 2020, 6, 447–468. [Google Scholar] [CrossRef]
  74. Wang, Z.; Ran, Y.; Jin, C.; Chen, Y.; Zhang, G. An Additive Consistency and Consensus Approach for Group Decision Making With Probabilistic Hesitant Fuzzy Linguistic Preference Relations and Its Application in Failure Criticality Analysis. IEEE Trans. Cybern. 2022, 52, 12501–12513. [Google Scholar] [CrossRef] [PubMed]
  75. Gong, K.; Chen, C. Multiple-attribute decision making based on equivalence consistency under probabilistic linguistic dual hesitant fuzzy environment. Eng. Appl. Artif. Intell. 2019, 85, 393–401. [Google Scholar] [CrossRef]
  76. Fang, B. Probabilistic linguistic decision-making based on the hybrid entropy and cross-entropy measures. Fuzzy Optim. Decis. Mak. 2023, 22, 415–445. [Google Scholar] [CrossRef]
  77. Yue, Q.; Huang, S.; Tao, Y.; Li, X.; Gao, Y.; Ren, J. Probabilistic linguistic carpooling matching decision-making considering time satisfaction based on prospect theory. Appl. Soft Comput. 2025, 169, 112564. [Google Scholar] [CrossRef]
  78. Yang, H.; Xu, G. Tourism attraction selection driven by online tourist reviews: A novel multi-attribute decision making method based on the evidence theory and probabilistic linguistic term sets. Appl. Soft Comput. 2025, 177, 113243. [Google Scholar] [CrossRef]
  79. Guo, F.; Gao, J. An offshore photovoltaic risk assessment framework based on probabilistic linguistic multi-criteria decision-making method and consensus-maximizing group information aggregation model. Appl. Soft Comput. 2025, 182, 113567. [Google Scholar] [CrossRef]
  80. Liu, P. Some geometric aggregation operators based on interval intuitionistic uncertain linguistic variables and their application to group decision making. Appl. Math. Model. 2013, 37, 2430–2444. [Google Scholar] [CrossRef]
  81. Qadir, A.; Abdullah, S.; Lamoudan, T.; Khan, F.; Khan, S. A new three way decision making technique for supplier selection in logistics service value Cocreation under intuitionistic double hierarchy linguistic term set. Heliyon 2023, 9, e18323. [Google Scholar] [CrossRef]
  82. Gong, J.-W.; Liu, H.-C.; You, X.-Y.; Yin, L. An integrated multi-criteria decision making approach with linguistic hesitant fuzzy sets for E-learning website evaluation and selection. Appl. Soft Comput. 2021, 102, 107118. [Google Scholar] [CrossRef]
  83. Meng, F.; Tang, J.; Fujita, H. Linguistic intuitionistic fuzzy preference relations and their application to multi-criteria decision making. Inf. Fusion 2019, 46, 77–90. [Google Scholar] [CrossRef]
  84. Fu, Z.; Liao, H. Unbalanced double hierarchy linguistic term set: The TOPSIS method for multi-expert qualitative decision making involving green mine selection. Inf. Fusion 2019, 51, 271–286. [Google Scholar] [CrossRef]
  85. Zhang, R.; Li, Z.; Liao, H. Multiple-attribute decision-making method based on the correlation coefficient between dual hesitant fuzzy linguistic term sets. Knowl.-Based Syst. 2018, 159, 186–192. [Google Scholar] [CrossRef]
  86. Liu, L.; Tu, Y.; Zhang, W.; Shen, W. Supplier selection for emergency material based on group exponential TODIM method considering hesitant fuzzy linguistic set: A case study of China. Socio-Econ. Plan. Sci. 2024, 94, 101944. [Google Scholar] [CrossRef]
  87. Gou, X.; Xu, Z. Novel basic operational laws for linguistic terms, hesitant fuzzy linguistic term sets and probabilistic linguistic term sets. Inf. Sci. 2016, 372, 407–427. [Google Scholar] [CrossRef]
  88. Lin, M.W.; Xu, Z.S.; Zhai, Y.L.; Yao, Z.Q. Multi-attribute group decision-making under probabilistic uncertain linguistic environment. J. Oper. Res. Soc. 2018, 69, 157–170. [Google Scholar] [CrossRef]
  89. Xian, S.; Guo, H. Novel supplier grading approach based on interval probability hesitant fuzzy linguistic TOPSIS. Eng. Appl. Artif. Intell. 2020, 87, 103299. [Google Scholar] [CrossRef]
  90. Wang, Z.C.; Ran, Y.; Chen, Y.F.; Yang, X.; Zhang, G.B. Group risk assessment in failure mode and effects analysis using a hybrid probabilistic hesitant fuzzy linguistic MCDM method. Expert Syst. Appl. 2022, 188, 116013. [Google Scholar] [CrossRef]
  91. Hillmann, J. Disciplines of organizational resilience: Contributions, critiques, and future research avenues. Rev. Manag. Sci. 2021, 15, 879–936. [Google Scholar] [CrossRef]
  92. Duchek, S. Organizational resilience: A capability-based conceptualization. Bus. Res. 2020, 13, 215–246. [Google Scholar] [CrossRef]
  93. Mohammed, A.; Al Balushi, F.A.; Zubairu, N.; Govindan, K. Dynamics capabilities 5.0 toward inner business resiliency: A conceptual and evaluation panacea. Comput. Ind. Eng. 2025, 206, 111223. [Google Scholar] [CrossRef]
  94. Basit, A.; Javed, A.; Khan, K.A.; Aslam, M.A.; Nazir, H. The path to supply chain resilience and robustness: A dynamic capability view. J. Manuf. Technol. Manag. 2025, 36, 1493–1512. [Google Scholar] [CrossRef]
  95. Scholten, K.; Sharkey Scott, P.; Fynes, B. Mitigation processes—Antecedents for building supply chain resilience. Supply Chain. Manag. An. Int. J. 2014, 19, 211–228. [Google Scholar] [CrossRef]
  96. Faulkner, B. Towards a framework for tourism disaster management. Tour. Manag. 2001, 22, 135–147. [Google Scholar] [CrossRef]
  97. Ritchie, B.W. Chaos, crises and disasters: A strategic approach to crisis management in the tourism industry. Tour. Manag. 2004, 25, 669–683. [Google Scholar] [CrossRef]
  98. Becken, S.; Hughey, K.F.D. Linking tourism into emergency management structures to enhance disaster risk reduction. Tour. Manag. 2013, 36, 77–85. [Google Scholar] [CrossRef]
  99. Al Humdan, E.; Shi, Y.; Behnia, M.; Najmaei, A. Supply chain agility: A systematic review of definitions, enablers and performance implications. Int. J. Phys. Distrib. Logist. Manag. 2020, 50, 287–312. [Google Scholar] [CrossRef]
  100. Mohaghegh, M.; Åhlström, P.; Blasi, S. Agile manufacturing and transformational capabilities for sustainable business performance: A dynamic capabilities perspective. Prod. Plan. Control. 2023, 35, 2273–2285. [Google Scholar] [CrossRef]
  101. Ponomarov, S.Y.; Holcomb, M.C. Understanding the concept of supply chain resilience. Int. J. Logist. Manag. 2009, 20, 124–143. [Google Scholar] [CrossRef]
  102. Kusiak, A. Smart manufacturing must embrace big data. Nature 2017, 544, 23–25. [Google Scholar] [CrossRef]
  103. Kusiak, A. Smart manufacturing. Int. J. Prod. Res. 2018, 56, 508–517. [Google Scholar] [CrossRef]
  104. Cavalcante, I.M.; Frazzon, E.M.; Forcellini, F.A.; Ivanov, D. A supervised machine learning approach to data-driven simulation of resilient supplier selection in digital manufacturing. Int. J. Inf. Manag. 2019, 49, 86–97. [Google Scholar] [CrossRef]
  105. Christopher, M.; Lee, H. Mitigating supply chain risk through improved confidence. Int. J. Phys. Distrib. Logist. Manag. 2004, 34, 388–396. [Google Scholar] [CrossRef]
  106. Han, Y.; Chong, W.K.; Li, D. A systematic literature review of the capabilities and performance metrics of supply chain resilience. Int. J. Prod. Res. 2020, 58, 4541–4566. [Google Scholar] [CrossRef]
  107. Tukamuhabwa, B.; Stevenson, M.; Busby, J.; Zorzini Bell, M. Supply chain resilience: Definition, review and theoretical foundations for further study. Int. J. Prod. Res. 2015, 53, 1–32. [Google Scholar] [CrossRef]
  108. Holmström, J.; Holweg, M.; Lawson, B.; Pil, F.K.; Wagner, S.M. The digitalization of operations and supply chain management: Theoretical and methodological implications. J. Oper. Manag. 2019, 65, 728–734. [Google Scholar] [CrossRef]
  109. Zsidisin, G.A.; Melnyk, S.A.; Ragatz, G.L. An institutional theory perspective of business continuity planning for purchasing and supply management. Int. J. Prod. Res. 2005, 43, 3401–3420. [Google Scholar] [CrossRef]
  110. Valipour Parkouhi, S.; Safaei Ghadikolaei, A.; Fallah Lajimi, H. Resilient supplier selection and segmentation in grey environment. J. Clean. Prod. 2019, 207, 1123–1137. [Google Scholar] [CrossRef]
  111. Song, S.; Tappia, E.; Song, G.; Shi, X.; Cheng, T.C.E. Fostering supply chain resilience for omni-channel retailers: A two-phase approach for supplier selection and demand allocation under disruption risks. Expert Syst. Appl. 2024, 239, 122368. [Google Scholar] [CrossRef]
  112. Virmani, N.; Saha, R.; Sahai, R. Leagile manufacturing: A review paper. Int. J. Product. Qual. Manag. 2018, 23, 385–421. [Google Scholar] [CrossRef]
  113. Mohaghegh, M.; Blasi, S.; Größler, A. Dynamic capabilities linking lean practices and sustainable business performance. J. Clean. Prod. 2021, 322, 129073. [Google Scholar] [CrossRef]
  114. Mohaghegh, M.; Größler, A. Leagile supply chains and sustainable business performance: Application of total interpretive structural modelling. Prod. Plan. Control. 2024, 36, 1087–1109. [Google Scholar] [CrossRef]
  115. Tang, C.S. Robust strategies for mitigating supply chain disruptions. Int. J. Logist. Res. Appl. 2006, 9, 33–45. [Google Scholar] [CrossRef]
  116. Lotfi, M.; Sodhi, M.S. Resilient agility under the practice-based view. Prod. Plan. Control. 2024, 35, 670–682. [Google Scholar] [CrossRef]
  117. van de Wetering, R.; Kurnia, S.; Kotusev, S. The Effect of Enterprise Architecture Deployment Practices on Organizational Benefits: A Dynamic Capability Perspective. Sustainability 2020, 12, 8902. [Google Scholar] [CrossRef]
  118. Bruneau, M.; Chang, S.E.; Eguchi, R.T.; Lee, G.C.; O’Rourke, T.D.; Reinhorn, A.M.; Shinozuka, M.; Tierney, K.; Wallace, W.A.; von Winterfeldt, D. A Framework to Quantitatively Assess and Enhance the Seismic Resilience of Communities. Earthq. Spectra 2003, 19, 733–752. [Google Scholar] [CrossRef]
  119. Zhou, H.; Wang, J.; Wan, J.; Jia, H. Resilience to natural hazards: A geographic perspective. Nat. Hazards 2010, 53, 21–41. [Google Scholar] [CrossRef]
  120. Munir, M.A.; Hussain, A.; Farooq, M.; Rehman, A.U.; Masood, T. Building resilient supply chains: Empirical evidence on the contributions of ambidexterity, risk management, and analytics capability. Technol. Forecast. Soc. Change 2024, 200, 123146. [Google Scholar] [CrossRef]
  121. Kuei, S.-C.; Chen, M.-C. Blockchain technology for risk management in food supply chain: A systematic literature review on emerging themes and sustainability implications. Food Control 2026, 181, 111689. [Google Scholar] [CrossRef]
  122. Tyler, S.; Moench, M. A framework for urban climate resilience. Clim. Dev. 2012, 4, 311–326. [Google Scholar] [CrossRef]
  123. Vakilzadeh, K.; Haase, A. The building blocks of organizational resilience: A review of the empirical literature. Contin. Resil. Rev. 2021, 3, 1–21. [Google Scholar] [CrossRef]
  124. Menon, T.; Shea, C.T.; Smith, E.B. Mobilization capacity: Tracing the path from having networks to capturing resources. Res. Organ. Behav. 2024, 44, 100210. [Google Scholar] [CrossRef]
  125. Lengnick-Hall, C.A.; Beck, T.E.; Lengnick-Hall, M.L. Developing a capacity for organizational resilience through strategic human resource management. Hum. Resour. Manag. Rev. 2011, 21, 243–255. [Google Scholar] [CrossRef]
  126. Narayanan, S.; Narasimhan, R.; Schoenherr, T. Assessing the contingent effects of collaboration on agility performance in buyer–supplier relationships. J. Oper. Manag. 2015, 33–34, 140–154. [Google Scholar] [CrossRef]
  127. Sharma, N.; Sahay, B.S.; Shankar, R.; Sarma, P.R.S. Supply chain agility: Review, classification and synthesis. Int. J. Logist. Res. Appl. 2017, 20, 532–559. [Google Scholar] [CrossRef]
  128. Gualandris, J.; Klassen, R.D.; Vachon, S.; Kalchschmidt, M. Sustainable evaluation and verification in supply chains: Aligning and leveraging accountability to stakeholders. J. Oper. Manag. 2015, 38, 1–13. [Google Scholar] [CrossRef]
  129. Ju, Y.; Hou, H.; Yang, J. Integration quality, value co-creation and resilience in logistics service supply chains: Moderating role of digital technology. Ind. Manag. Data Syst. 2021, 121, 364–380. [Google Scholar] [CrossRef]
  130. Napier, E.; Liu, S.Y.H.; Liu, J. Adaptive strength: Unveiling a multilevel dynamic process model for organizational resilience. J. Bus. Res. 2024, 171, 114334. [Google Scholar] [CrossRef]
  131. Jüttner, U.; Maklan, S. Supply chain resilience in the global financial crisis: An empirical study. Supply Chain. Manag. Int. J. 2011, 16, 246–259. [Google Scholar] [CrossRef]
  132. Gunasekaran, A.; Yusuf, Y.Y.; Adeleye, E.O.; Papadopoulos, T.; Kovvuri, D.; Geyi, D.A.G. Agile manufacturing: An evolutionary review of practices. Int. J. Prod. Res. 2019, 57, 5154–5174. [Google Scholar] [CrossRef]
  133. de Oliveira-Dias, D.; Maqueira-Marin, J.M.; Moyano-Fuentes, J.; Carvalho, H. Implications of using Industry 4.0 base technologies for lean and agile supply chains and performance. Int. J. Prod. Econ. 2023, 262, 108916. [Google Scholar] [CrossRef]
  134. Hasan, M.M.; Jiang, D.; Ullah, A.M.M.S.; Noor-E-Alam, M. Resilient supplier selection in logistics 4.0 with heterogeneous information. Expert Syst. Appl. 2020, 139, 112799. [Google Scholar] [CrossRef]
  135. Tavana, M.; Sorooshian, S.; Mina, H. An integrated group fuzzy inference and best–worst method for supplier selection in intelligent circular supply chains. Ann. Oper. Res. 2024, 342, 803–844. [Google Scholar] [CrossRef]
  136. Davoudabadi, R.; Mousavi, S.M.; Sharifi, E. An integrated weighting and ranking model based on entropy, DEA and PCA considering two aggregation approaches for resilient supplier selection problem. J. Comput. Sci. 2020, 40, 101074. [Google Scholar] [CrossRef]
  137. Loh, H.S.; Thai, V.V. Managing port-related supply chain disruptions (PSCDs): A management model and empirical evidence. Marit. Policy Manag. 2016, 43, 436–455. [Google Scholar] [CrossRef]
  138. Koc, K.; Ekmekcioğlu, Ö.; Işık, Z. Developing a probabilistic decision-making model for reinforced sustainable supplier selection. Int. J. Prod. Econ. 2023, 259, 108820. [Google Scholar] [CrossRef]
  139. Smith, K.; Lawrence, G.; MacMahon, A.; Muller, J.; Brady, M. The resilience of long and short food chains: A case study of flooding in Queensland, Australia. Agric. Hum. Values 2016, 33, 45–60. [Google Scholar] [CrossRef]
  140. Lee, A.H.I. A fuzzy supplier selection model with the consideration of benefits, opportunities, costs and risks. Expert Syst. Appl. 2009, 36, 2879–2893. [Google Scholar] [CrossRef]
  141. Khan K, A.; Bakkappa, B.; Metri, B.A.; Sahay, B.S. Impact of agile supply chains’ delivery practices on firms’ performance: Cluster analysis and validation. Supply Chain. Manag. 2009, 14, 41–48. [Google Scholar] [CrossRef]
  142. Chang, W.-S.; Lin, Y.-T. The effect of lead-time on supply chain resilience performance. Asia Pac. Manag. Rev. 2019, 24, 298–309. [Google Scholar] [CrossRef]
  143. Das, K. Integrating resilience in a supply chain planning model. Int. J. Qual. Reliab. Manag. 2018, 35, 570–595. [Google Scholar] [CrossRef]
  144. Ghadge, A.; Dani, S.; Kalawsky, R. Supply chain risk management: Present and future scope. Int. J. Logist. Manag. 2012, 23, 313–339. [Google Scholar] [CrossRef]
  145. Geyi, D.A.G.; Yusuf, Y.; Menhat, M.S.; Abubakar, T.; Ogbuke, N.J. Agile capabilities as necessary conditions for maximising sustainable supply chain performance: An empirical investigation. Int. J. Prod. Econ. 2020, 222, 107501. [Google Scholar] [CrossRef]
  146. Ostadi, B.; Barrani, L.; Aghdasi, M. Developing a strategic roadmap towards integration in Industry 4.0: A dynamic capabilities theory perspective. Technol. Forecast. Soc. Change 2024, 208, 123679. [Google Scholar] [CrossRef]
  147. Handfield, R.; Sroufe, R.; Walton, S. Integrating environmental management and supply chain strategies. Bus. Strategy Environ. 2005, 14, 1–19. [Google Scholar] [CrossRef]
  148. Shibin, K.T.; Gunasekaran, A.; Dubey, R. Explaining sustainable supply chain performance using a total interpretive structural modeling approach. Sustain. Prod. Consum. 2017, 12, 104–118. [Google Scholar] [CrossRef]
  149. de Oliveira-Dias, D.; Maqueira Marín, J.M.; Moyano-Fuentes, J. Lean and agile supply chain strategies: The role of mature and emerging information technologies. Int. J. Logist. Manag. 2022, 33, 221–243. [Google Scholar] [CrossRef]
  150. Zeng, B.; Yen, B.P.C. Rethinking the role of partnerships in global supply chains: A risk-based perspective. Int. J. Prod. Econ. 2017, 185, 52–62. [Google Scholar] [CrossRef]
  151. Raji, I.O.; Shevtshenko, E.; Rossi, T.; Strozzi, F. Industry 4.0 technologies as enablers of lean and agile supply chain strategies: An exploratory investigation. Int. J. Logist. Manag. 2021, 32, 1150–1189. [Google Scholar] [CrossRef]
  152. Hosseini, S.; Khaled, A.A. A hybrid ensemble and AHP approach for resilient supplier selection. J. Intell. Manuf. 2019, 30, 207–228. [Google Scholar] [CrossRef]
  153. Kamalahmadi, M.; Parast, M.M. A review of the literature on the principles of enterprise and supply chain resilience: Major findings and directions for future research. Int. J. Prod. Econ. 2016, 171, 116–133. [Google Scholar] [CrossRef]
  154. Hosseini, S.; Ivanov, D. A new resilience measure for supply networks with the ripple effect considerations: A Bayesian network approach. Ann. Oper. Res. 2022, 319, 581–607. [Google Scholar] [CrossRef]
  155. Torabi, S.A.; Rezaei Soufi, H.; Sahebjamnia, N. A new framework for business impact analysis in business continuity management (with a case study). Saf. Sci. 2014, 68, 309–323. [Google Scholar] [CrossRef]
  156. Aghabegloo, M.; Rezaie, K.; Torabi, S.A.; Yazdani, M. Integrating business impact analysis and risk assessment for physical asset criticality analysis: A framework for sustainable operations in process industries. Expert Syst. Appl. 2024, 241, 122737. [Google Scholar] [CrossRef]
  157. Raj, R.; Wang, J.W.; Nayak, A.; Tiwari, M.K.; Han, B.; Liu, C.L.; Zhang, W.J. Measuring the Resilience of Supply Chain Systems Using a Survival Model. IEEE Syst. J. 2015, 9, 377–381. [Google Scholar] [CrossRef]
  158. Ambulkar, S.; Blackhurst, J.; Grawe, S. Firm’s resilience to supply chain disruptions: Scale development and empirical examination. J. Oper. Manag. 2015, 33–34, 111–122. [Google Scholar] [CrossRef]
  159. Hosseini, S.; Barker, K. A Bayesian network model for resilience-based supplier selection. Int. J. Prod. Econ. 2016, 180, 68–87. [Google Scholar] [CrossRef]
  160. Hosseini, S.; Morshedlou, N.; Ivanov, D.; Sarder, M.D.; Barker, K.; Khaled, A.A. Resilient supplier selection and optimal order allocation under disruption risks. Int. J. Prod. Econ. 2019, 213, 124–137. [Google Scholar] [CrossRef]
  161. Chowdhury, M.M.H.; Quaddus, M. Supply chain readiness, response and recovery for resilience. Supply Chain. Manag. Int. J. 2016, 21, 709–731. [Google Scholar] [CrossRef]
  162. Adobor, H.; McMullen, R.S. Supply chain resilience: A dynamic and multidimensional approach. Int. J. Logist. Manag. 2018, 29, 1451–1471. [Google Scholar] [CrossRef]
  163. Ghobakhloo, M.; Iranmanesh, M.; Foroughi, B.; Tseng, M.-L.; Nikbin, D.; Khanfar, A.A.A. Industry 4.0 digital transformation and opportunities for supply chain resilience: A comprehensive review and a strategic roadmap. Prod. Plan. Control. 2023, 36, 61–91. [Google Scholar] [CrossRef]
  164. Dubey, R.; Gunasekaran, A. Agile manufacturing: Framework and its empirical validation. Int. J. Adv. Manuf. Technol. 2015, 76, 2147–2157. [Google Scholar] [CrossRef]
  165. Mohammed, A.; Naghshineh, B.; Spiegler, V.; Carvalho, H. Conceptualising a supply and demand resilience methodology: A hybrid DEMATEL-TOPSIS-possibilistic multi-objective optimization approach. Comput. Ind. Eng. 2021, 160, 107589. [Google Scholar] [CrossRef]
  166. Wang, T.-K.; Zhang, Q.; Chong, H.-Y.; Wang, X. Integrated Supplier Selection Framework in a Resilient Construction Supply Chain: An Approach via Analytic Hierarchy Process (AHP) and Grey Relational Analysis (GRA). Sustainability 2017, 9, 289. [Google Scholar] [CrossRef]
  167. Wither, D.; Orchiston, C.; Cradock-Henry, N.A.; Nel, E. Advancing practical applications of resilience in Aotearoa-New Zealand. Ecol. Soc. 2021, 26, 1. [Google Scholar] [CrossRef]
  168. Mao, X.-B.; Wu, M.; Dong, J.-Y.; Wan, S.-P.; Jin, Z. A new method for probabilistic linguistic multi-attribute group decision making: Application to the selection of financial technologies. Appl. Soft Comput. 2019, 77, 155–175. [Google Scholar] [CrossRef]
  169. Xie, W.Y.; Xu, Z.S.; Ren, Z.L.; Herrera-Viedma, E. The probe for the weighted dual probabilistic linguistic correlation coefficient to invest an artificial intelligence project. Soft Comput. 2020, 24, 15389–15408. [Google Scholar] [CrossRef]
  170. Qi, X.; Liang, C.; Zhang, J. Generalized cross-entropy based group decision making with unknown expert and attribute weights under interval-valued intuitionistic fuzzy environment. Comput. Ind. Eng. 2015, 79, 52–64. [Google Scholar] [CrossRef]
  171. Chen, H.Y.; Zhou, L.G.; Han, B. On compatibility of uncertain additive linguistic preference relations and its application in the group decision making. Knowl.-Based Syst. 2011, 24, 816–823. [Google Scholar] [CrossRef]
  172. Zhou, L.; Chen, H. On compatibility of uncertain additive linguistic preference relations based on the linguistic COWA operator. Appl. Soft Comput. 2013, 13, 3668–3682. [Google Scholar] [CrossRef]
  173. Zhang, J.; Hegde, G.; Shang, J.; Qi, X. Evaluating Emergency Response Solutions for Sustainable Community Development by Using Fuzzy Multi-Criteria Group Decision Making Approaches: IVDHF-TOPSIS and IVDHF-VIKOR. Sustainability 2016, 8, 291. [Google Scholar] [CrossRef]
  174. Chen, T.-Y. Multiple criteria decision analysis under complex uncertainty: A Pearson-like correlation-based Pythagorean fuzzy compromise approach. Int. J. Intell. Syst. 2019, 34, 114–151. [Google Scholar] [CrossRef]
  175. Park, D.G.; Kwun, Y.C.; Park, J.H.; Park, I.Y. Correlation coefficient of interval-valued intuitionistic fuzzy sets and its application to multiple attribute group decision making problems. Math. Comput. Model. 2009, 50, 1279–1293. [Google Scholar] [CrossRef]
  176. Farhadinia, B. Correlation for Dual Hesitant Fuzzy Sets and Dual Interval-Valued Hesitant Fuzzy Sets. Int. J. Intell. Syst. 2014, 29, 184–205. [Google Scholar] [CrossRef]
  177. Liang, D.; Xu, Z. The new extension of TOPSIS method for multiple criteria decision making with hesitant Pythagorean fuzzy sets. Appl. Soft Comput. 2017, 60, 167–179. [Google Scholar] [CrossRef]
  178. Wang, L.; Wang, H.; Xu, Z.; Ren, Z. The interval-valued hesitant Pythagorean fuzzy set and its applications with extended TOPSIS and Choquet integral-based method. Int. J. Intell. Syst. 2019, 34, 1063–1085. [Google Scholar] [CrossRef]
  179. Görçün, Ö.F.; Aytekin, A.; Korucuk, S.; Tirkolaee, E.B. Assessing the renewable energy sources for sustainable energy generation systems: Interval-valued q-rung orthopair fuzzy SWARA-TOPSIS. Expert Syst. Appl. 2026, 298, 129735. [Google Scholar] [CrossRef]
  180. Chiclana, F.; Herrera-Viedma, E.; Herrera, F.; Alonso, S. Some induced ordered weighted averaging operators and their use for solving group decision-making problems based on fuzzy preference relations. Eur. J. Oper. Res. 2007, 182, 383–399. [Google Scholar] [CrossRef]
Figure 1. Capabilities that support supplier’s resilience performance from the processual view of adaptation to disruptive events.
Systems 14 00334 g001
Figure 2. The methodological flowchart of our proposed MCGDM for resilient supplier selection.
Systems 14 00334 g002
Figure 3. The decision-making steps in Algorithm 1.
Systems 14 00334 g003
Figure 4. Mapping relations in LH between different linguistic scales adopted by three DMUs.
Systems 14 00334 g004
Table 1. Expression tools adopted in RSS studies and comparative advantages of extant hesitant linguistic expression tools.
Refs.Expression ToolsUncertainty Features Covered in the Expression ToolsCorresponding
Methodologies
(Uncertain) LinguisticUnbalanced
Linguistic
IntuitionisticHesitancyDual
Hesitancy
Probabilistic
Representative RSS Literatures
Rajesh et al. [10]Grey numbers×××××GRA,
Decision matrix
Valipour Parkouhi et al. [11]Grey numbers×××××ANP,
GRA-VIKOR, Decision matrix
Amindoust [14]Linguistic variables×××××FIS, DEA,
Decision matrix
Majumdar et al. [4]Trapezoidal Intuitionistic fuzzy number××××Fuzzy TOPSIS,
Decision matrix
Sahu et al. [15]Trapezoidal fuzzy numbers×××××AHP-DEMATEL-ANP,
MOORA-SAW,
Decision matrix
Varchandi et al. [16]Linguistic variables×××××BWM, Fuzzy TOPSIS,
Decision matrix
Ulutaş et al. [9]Rough numbers××××××LOPCOW-R, MAXC-R, MACONT-R,
Decision matrix
Zhang et al. [18]Z-numbers×××××BWM, TOPSIS, PageRank, Decision matrix
Gökler et al. [19]D-numbers××××××AHP, DEMATEL,
Decision matrix
Song et al. [20]Rough numbers××××××Prospect theory, Decision matrix
Sun et al. [17]PULTS×××BWM, TOPSIS,
Correlation coefficient, Decision matrix
Representative Hesitant Linguistic Literatures
Liu [80]IVIULS××××Aggregation operators, Decision matrix
Xian et al. [68]IZLS××××Distance, TOPSIS,
Decision matrix
Qadir et al. [81]IDHLTS××××Entropy, TOPSIS,
Decision matrix
Rodríguez et al. [69]HFLTS××××MCDM based on preference relations
Wei et al. [70]EHFLTS××××Entropy,
Decision matrix
Gong et al. [82]LHFS××××BWM, TODIM, decision matrix
Zhang et al. [53]DHHFLTS××××Correlation measure, decision matrix
Meng et al. [83]LIFPR××××Preference relations
Zhao et al. [56]IHFLTS×××Correlation coefficient, Decision matrix
Zhao et al. [63]UHFLTS×××Entropy,
Decision matrix
Fu et al. [84]UDHLTS×××Distance, TOPSIS,
Decision matrix
Zhang et al. [85]DHFLTS×××Correlation Coefficient,
Decision matrix
Liu et al. [86]HFLS××××TODIM,
Decision matrix
Wang et al. [34]IVHFLS××××Aggregation operators, Decision matrix
Qi et al. [72]IVDHFLS×××Distance,
Aggregation operator,
Decision matrix
Gou et al. [87]PLTS×××Aggregation operator,
Decision matrix
Lin et al. [88]PULTS×××Distance, aggregation operator, TOPSIS,
Decision matrix
Xian et al. [89]IPHFLV×××Distance, aggregation operator, TOPSIS,
Decision matrix
Wang et al. [90]PHFLTS×××BWM, aggregation operator, TOPSIS,
Decision matrix
Gong et al. [75]PLDHFS××Preference relations
Zhang et al. [37]PDHFUUBLS×Distance, Entropy, Aggregation operator, decision matrix
Present
paper
PDHFUUBLS×Correlation coefficient, Entropy,
Decision matrix
Table 2. Capability-oriented framework for comprehensive evaluation of supplier resilience.
Capability Attributes of Supplier ResilienceDescriptors for Comprehensive Evaluation
C1:
Sensing Capabilities
  • Environmental monitoring to implement transparency and traceability of supply chain business [101]
  • Business intelligence systems to bolster competences of warning, communicating and forecasting based on data integration and information sharing [102,103,104,106,107,108]
  • Self-vulnerability investigation to effectively target change influences by various potential disruptive scenarios [11,109,110,111]
  • Contingency planning by strategic hierarchical contingency teams to identify undesirable events or situations and decide how to respond based on self-vulnerability investigation [112], such as proactive and preventative maintenance routines [113,114], diversified and flexible supply chain design [109,115], rational inventory levels in various risk scenarios [107], etc.
C2:
Resource-mobilizing Capabilities
  • Mechanisms for organizing decision making teams to take resource-mobilizing responsibilities [96,118,119]
  • Analytical and mapping capability to bolster fast decision making on alternative contingency plans according to signals from sensing capabilities [120,121]
  • Prioritization mechanisms to dynamically generate protocols for effectively orchestrating desirable resources [122]
  • Supplier’s institutional designs to consolidate integrative resource repositories [107,125,126,127], such as accountability mechanisms [128], cross-functional database systems integration [129], collective knowledge resource sharing [130], etc.
C3:
Responding
Capabilities
  • Visibility capability to navigate inventories, demands, purchasing schedules and production systems [10,127]
  • Information management capability to systematically collect and share business processual information [16]
  • Digital capability to realize digitally integrative control [135]
  • Mechanisms to boost efficiency of contingency plan execution [106], such as learning [137], training [137], simulation and exercise [27,138], among others
  • Capability of flexible strategy design to quickly determine optimal alternative solutions or directions to establish collaborative mechanisms in sourcing [134,139], ensure emergency production [15,140], adjust product mix [11,16], etc.
  • Reconfiguration capability [100] to implement flexible strategy design, such as production reengineering competences [101,132], business process adjustment competences [133], dynamic supply allocation competences [112,114,116], logistics network optimization competences [111,127,141], etc.
C4:
Collaborative
Capabilities
  • Strategic integration capability to ensure suppliers’ strategic consistency of collaboration required in building supply chain resilience [100,146,147]
  • Legitimacy arrangements of organizational strategical programs to facilitate deployment of supply chain collaboration [99,148,149]
  • Competences on risk management-oriented system collaboration to formalize technical infrastructure for collaboration [150]
  • Problem solving-oriented competences to achieve collaborative goals when confronting with various disruptive events [114,151]
C5:
Restorative
Capabilities
  • Competences for comprehensive scanning, analysis and identification to identify protocols to meet in business continuity plans, such as business impact analysis [155,156], interdependency identification of key infrastructure components [157], resource reconfiguration scale analysis [158], among others
  • Monetary capital that ensures adequate and timely resource investment for restoration [160]
  • Human resource reallocation mechanism that guarantees optimized maximum team capacity at work for restoration [100,125]
  • Technical competence for total productive maintenance that upholds technical resource restoration [14,112,113,114,159]
  • Routinized learning mechanism that ensures continuously updated knowledge acquisition and cutting-edge skill enhancement for restoration [106,137,154,161]
C6:
Transformative
Capabilities
  • Digital capability for processual information documentation and data analysis [103,163]
  • Smart digitalization capability to support digitalized transformation of product design and process development [108,163]
  • Knowledge management capability to exploit opportunities and catalyze innovativeness [101,114,163,164]
  • Innovation and development capability to learn from disruptive events and incorporate product and process innovations to keep up with new dynamics of business environments [114,125,163,165], mainly including R&D competences [166] and business process development capability [15,108,158].
Table 3. Decision matrix R 1 provided by decision-making unit E x 1 .
E x 1 A 1 A 2 A 3 A 4
C 1 ([QM, AH],
{0.5|1},
{0.4|0.6, 0.5|0.4})
([AH, VH],
{0.5|0.4, 0.6|0.6},
{0.4|1})
([QM, VH],
{0.7|0.8, 0.8|0.2},
{0.2|1})
([VH, T],
{0.6|0.2, 0.7|0.8},
{0.1|0.7, 0.3|0.3})
C 2 ([AH, VH],
{0.5|0.3, 0.6|0.7},
{0.3|1})
([H, VH],
{0.6|1},
{0.2|0.5, 0.4|0.5})
([AH, VH],
{0.8|0.4, 0.9|0.6},
{0.1|1})
([AH, VH],
{0.7|1},
{0.1|0.6, 0.2|0.4})
C 3 ([QM, H],
{0.3|0.5, 0.4|0.5},
{0.4|0.5, 0.6|0.5})
([VL, AM],
{0.5|0.8, 0.7|0.2},
{0.3|1})
([VH, T],
{0.7|0.9, 0.8|0.1},
{0.2|1})
([H, VH],
{0.5|0.3, 0.6|0.7},
{0.3|0.6, 0.4|0.4})
C 4 ([AM, QM],
{0.7|1},
{0.1|0.4, 0.3|0.6})
([AM, QM],
{0.3|0.7, 0.4|0.3},
{0.6|1})
([QM, H],
{0.4|0.5, 0.7|0.5},
{0.2|0.5, 0.3|0.5})
([QM, AH],
{0.6|0.1, 0.8|0.9},
{0.1|0.5, 0.2|0.5})
C 5 ([QM, T],
{0.5|0.5, 0.6|0.5},
{0.3|1})
([QM, H],
{0.4|0.6, 0.5|0.4},
{0.3|0.7, 0.4|0.3})
([AH, H],
{0.6|1},
{0.2|0.1, 0.3|0.7, 0.4|0.2})
([QM, VH],
{0.6|1},
{0.3|0.8, 0.4|0.2})
C 6 ([M, AH],
{0.9|1},
{0.1|1})
([QM, VH],
{0.6|1},
{0.3|0.5, 0.4|0.5})
([H, VH],
{0.5|0.7, 0.6|0.3},
{0.3|0.8, 0.4|0.2})
([VH, T],
{0.7|0.3, 0.8|0.7},
{0.2|1})
Table 4. Decision matrix R 2 provided by decision-making unit E x 2 .
E x 2 A 1 A 2 A 3 A 4
C 1 ([H, VH],
{0.4|0.7, 0.5|0.3},
{0.5|1})
([M, AH],
{0.2|0.6, 0.3|0.4},
{0.6|0.5, 0.7|0.5})
([L, M],
{0.4|0.8, 0.6|0.2},
{0.3|0.4, 0.4|0.6})
([AH, VH],
{0.6|0.3, 0.8|0.7},
{0.1|0.5, 0.2|0.5})
C 2 ([QL, M],
{0.1|0.2, 0.3|0.8},
{0.7|1})
([AL, AH],
{0.6|0.7, 0.7|0.3},
{0.3|1})
([AH, VH],
{0.5|0.5, 0.7|0.5},
{0.3|1})
([M, AH],
{0.7|1},
{0.1|0.8, 0.3|0.2})
C 3 ([AH, VH],
{0.6|0.9, 0.7|0.1},
{0.1|0.1, 0.2|0.8, 0.3|0.1})
([H, VH],
{0.4|0.6, 0.5|0.4},
{0.3|0.8, 0.4|0.2})
([M, VH],
{0.7|0.1, 0.8|0.9},
{0.1|0.5, 0.2|0.5})
([VH, T],
{0.6|0.4, 0.7|0.6},
{0.2|0.8, 0.3|0.2})
C 4 ([AN, AL],
{0.4|0.6, 0.5|0.4},
{0.4|0.4, 0.5|0.6})
([H, VH],
{0.5|0.2, 0.6|0.7},
{0.4|1})
([VH, T],
{0.5|0.6, 0.8|0.4},
{0.1|0.8, 0.2|0.2})
([VH, T],
{0.7|0.1, 0.8|0.9},
{0.2|1})
C 5 ([VH, T],
{0.4|0.3, 0.7|0.7},
{0.2|0.5, 0.3|0.5})
([AH, VH],
{0.2|0.2, 0.3|0.8},
{0.5|0.6, 0.7|0.4})
([M, H],
{0.9|1},
{0.1|1})
([H, VH],
{0.6|0.7, 0.7|0.3},
{0.2|0.6, 0.3|0.4})
C 6 ([M, AH],
{0.7|0.4, 0.8|0.6},
{0.1|0.3, 0.2|0.7})
([QL, AL],
{0.5|0.1, 0.7|0.9},
{0.3|1})
([H, VH],
{0.7|1},
{0.1|0.2, 0.3|0.8})
([AH, H],
{0.6|0.8, 0.7|0.2},
{0.3|1})
Table 5. Decision matrix R 3 provided by decision-making unit E x 3 .
E x 3 A 1 A 2 A 3 A 4
C 1 ([M, AH],
{0.3|0.7, 0.4|0.3},
{0.4|0.6, 0.6|0.4})
([AL, M],
{0.7|0.8, 0.8|0.2},
{0.2|1})
([AH, QH],
{0.5|0.3, 0.7|0.7},
{0.1|0.5, 0.2|0.5})
([QH, AT],
{0.4|1},
{0.5|0.6, 0.6|0.4})
C 2 ([AH, VH],
{0.4|0.5, 0.5|0.5},
{0.5|1})
([AH, H], {0.7|0.6, 0.8|0.4},
{0.2|1})
([QH, VH],
{0.3|1},
{0.5|0.8, 0.6|0.1, 0.7|0.1})
([VH, T],
{0.4|0.1, 0.6|0.9},
{0.2|0.5, 0.4|0.5})
C 3 ([H, QH],
{0.5|1},
{0.4|0.4, 0.5|0.6})
([AH, QH],
{0.3|0.2, 0.4|0.8},
{0.4|0.5, 0.6|0.5})
([VH, T],
{0.6|0.9, 0.7|0.1},
{0.2|0.2, 0.3|0.8})
([AH, H],
{0.8|1},
{0.1|0.3, 0.2|0.7})
C 4 ([VL, AL],
{0.5|0.8, 0.6|0.2},
{0.4|1})
([M, AH],
{0.7|1},
{0.3|1})
([QM, AH],
{0.4|0.3, 0.5|0.7},
{0.5|1})
([AH, QH],
{0.6|0.1, 0.7|0.9},
{0.2|0.4, 0.3|0.6})
C 5 ([M, H],
{0.5|1},
{0.2|0.7, 0.4|0.3})
([AH, H],
{0.7|0.8, 0.8|0.2},
{0.1|0.5, 0.2|0.5})
([VH, AT],
{0.6|0.2, 0.7|0.8},
{0.1|0.5, 0.3|0.5})
([H, QH],
{0.5|0.8, 0.6|0.2},
{0.2|0.1, 0.3|0.6, 0.5|0.3})
C 6 ([AH, QH],
{0.6|0.1, 0.8|0.9},
{0.1|0.6, 0.2|0.4})
([VL, AL],
{0.6|1},
{0.3|0.4, 0.4|0.6})
([M, H],
{0.4|0.5, 0.5|0.5},
{0.5|1})
([VH, AT],
{0.6|1},
{0.4|1})
Table 6. Ranking results from Algorithm 1 using ρ w ( c 2 ) along monotonically increasing weights.
α Weighting Vectors Generated by Q ( r ) = r α C C w ( r j ) Ranking Results
1/5(0.6988, 0.1039, 0.0678, 0.0516, 0.0421, 0.0358)0.5044, 0.5038, 0.5037, 0.5143 A 3 A 2 A 1 A 4
1/4(0.6389, 0.1209, 0.0811, 0.0627, 0.0518, 0.0446)0.5046, 0.5039, 0.5036, 0.514 A 3 A 2 A 1 A 4
1/3(0.5503, 0.143, 0.1003, 0.0799, 0.0675, 0.059)0.5049, 0.5042, 0.5036, 0.5135 A 3 A 2 A 1 A 4
1/2(0.4082, 0.1691, 0.1298, 0.1094, 0.0964, 0.0871)0.5056, 0.5046, 0.5038, 0.513 A 3 A 2 A 1 A 4
1(1/6, 1/6, 1/6, 1/6, 1/6, 1/6)0.5069, 0.5053, 0.5049, 0.5125 A 3 A 2 A 1 A 4
2(0.0278, 0.0833, 0.1389, 0.1944, 0.25, 0.30561)0.5084, 0.5052, 0.5061, 0.5131 A 3 A 2 A 1 A 4
3(0.0046, 0.0324, 0.08, 0.1713, 0.2824, 0.4213)0.5091, 0.5051, 0.5059, 0.5138 A 3 A 2 A 1 A 4
4(0.00077, 0.0116, 0.0502, 0.135, 0.2847, 0.5177)0.5098, 0.5049, 0.5052, 0.5144 A 2 A 3 A 1 A 4
5(0.00013, 0.004, 0.0271, 0.1004, 0.2702, 0.5981)0.5104, 0.5045, 0.5048,0.5149 A 2 A 3 A 1 A 4
Disclaimer/Publisher’s Note: The statements, opinions and data contained in all publications are solely those of the individual author(s) and contributor(s) and not of MDPI and/or the editor(s). MDPI and/or the editor(s) disclaim responsibility for any injury to people or property resulting from any ideas, methods, instructions or products referred to in the content.