Article

Global–Local Linkage Patterns of Guangdong’s Industries: Evidence from Multi-Scale Input–Output Network Analysis


1
Key Laboratory of Regional Sustainable Development Modeling, Institute of Geographic Science and Natural Resources Research, Chinese Academy of Sciences, Beijing 100101, China
2
College of Resources and Environment, University of Chinese Academy of Sciences, Beijing 100049, China
3
Faculty of Geography, Tianjin Normal University, Tianjin 300387, China
4
Meituan Select Department, Meituan, Beijing 100102, China
*
Author to whom correspondence should be addressed.
Systems 2026, 14(3), 272; https://doi.org/10.3390/systems14030272
Submission received: 22 December 2025 / Revised: 10 February 2026 / Accepted: 28 February 2026 / Published: 3 March 2026
(This article belongs to the Section Systems Practice in Social Science)

Abstract

Globalization has reorganized industrial spatial patterns, embedding regional economies into complex global production systems. However, the existing literature primarily focuses on the national level, leaving the “global-national-local” multi-scale linkages of sub-national regions underexplored. Focusing on Guangdong, which is China’s most open economic gateway, this study constructs a nested Multi-Regional input–output (MRIO) model to systematically reveal its industrial linkage paths across multiple scales. The results demonstrate that Guangdong features “strong local services and extensive global connections.” Specifically, the network is led by the high-R&D-intensity category and supported by energy and low-R&D categories, highlighted by two core supply paths, which are non-metallic mineral supply for construction and metal product support for optical–electrical manufacturing. Four heterogeneous modes are identified: resource security, innovation-driven dual circulation, cost-competitive regional division, and export-oriented service support. Crucially, the provincial “domestic intermediate chains plus international core chains” logic underscores Guangdong’s role as a bridge connecting Global and Domestic Value Chains. Theoretically, this work enriches the local dimension of Global Production Network theory. Methodologically, it provides an operational tool for nested analysis. Practically, it offers policy evidence for open economies to optimize industrial layouts and enhance supply chain resilience.

1. Introduction

In an era characterized by the deep integration of economic globalization and informatization, the geographical boundaries of human activity have been dismantled to an unprecedented extent, and the human–environment relationship is undergoing a fundamental transformation from a closed regional system to an open global system [1,2]. In this new stage, driven by the accelerated worldwide flow of capital, technology, information, and labor, regional development no longer relies solely on local resource endowments but is deeply embedded within Global Production Networks (GPNs) and Global Value Chains (GVCs) [3,4,5,6,7]. This process has led to a drastic spatial separation between production and consumption, creating a typical “telecoupling” effect, wherein a region’s resource utilization and environmental impact are often profoundly controlled by economic behaviors in distant regions [8,9].
To unravel these cross-scale interaction mechanisms, existing research primarily follows two distinct paths. First is the structural analysis based on Global Production Network (GPN) and Global Value Chain (GVC) perspectives. This research pathway emphasizes a “global sense of place “ [10] and characterizes the evolutionary logic of global industrial division of labor and value distribution [4,11,12] by examining interactions between multinational corporations and multi-scalar actors [13,14,15,16,17]. However, such studies tend to focus on qualitative descriptions of organizational power, leaving significant challenges in quantifying the spatial spillover effects of factor flows. Second is the quantitative characterization based on Multi-Regional input–output (MRIO) models. As a core tool for quantifying industrial linkages, input–output analysis has evolved from single-region models to MRIO frameworks [18,19,20,21,22], enabling the precise measurement of embodied flows, such as value-added, environmental emissions, and food supply, within global or national trade networks [23,24,25,26]. However, existing research still faces a significant “scalar gap” in terms of cross-scale integration. On the one hand, global-scale MRIOs often treat nations as homogeneous entities, overlooking the immense intra-national regional heterogeneity [27]. On the other hand, while domestic or regional MRIO studies can meticulously depict input–output linkages within provinces or urban agglomerations, they predominantly focus on inter-provincial connections. This makes it difficult to effectively track how global external shocks penetrate national borders and propagate to specific domestic hinterlands [23,28]. Consequently, existing MRIO analyses lack a unified framework to integrate the nested “Global-National-Local” linkages [11,29,30].
A deeper gap lies in the neglect of the pivotal intermediary role played by “Gateway Regions” [31] within multi-scalar socio-economic systems [32]. As the primary entry point for global factors into the domestic hinterland and the outpost for domestic industries embedding into GPNs, gateway regions are not merely physical hubs for logistics and trade but also critical nodes for cross-scale functional coupling [33,34]. These regions not only bear the pressure of global-scale value distribution but also regulate resource allocation and environmental cost sharing among domestic regions through complex industrial linkages [35,36,37,38]. However, traditional research paradigms either simplify these regions into mere statistical points within macro-narratives, erasing their heterogeneity as global-domestic intermediaries [39], or ignore their upstream and downstream extensions within global networks when viewed from a regional perspective [40,41]. This lack of understanding regarding the multi-scalar intermediation mechanisms of gateway regions hinders our ability to accurately assess the strategic depth and resilience boundaries of national economic development amidst global geopolitical fluctuations.
Against this backdrop, this study selects Guangdong Province as a representative case. As China’s most economically developed and open “foreign trade gateway,” Guangdong acts as a super-connector for the multi-scalar flow of factors, providing an ideal window to observe the globalization of human–environment systems [35,36]. Since the onset of U.S.–China trade tensions in 2018, technical blockades and tariff barriers have triggered a drastic reconfiguration of global trade networks [42,43,44], with Guangdong standing at the forefront of these shifts [45,46]. Consequently, clarifying how Guangdong allocates spatial resources between global production and the domestic hinterland through differentiated industrial paths will not only fill the gap in multi-scalar coupling research of gateway regions but also provide empirical micro-evidence for understanding global human–environment interactions within complex systems. Furthermore, it offers theoretical support for constructing the “Dual Circulation” strategy and enhancing supply chain security in the new era.
This study aims to transcend the limitations of single-scale analysis by constructing a nested-MRIO framework. It seeks to answer critical questions: In the context of globalized human–environment relations, how does Guangdong, as a typical gateway region, embed into and respond to the global system through multi-scalar industrial linkage patterns? What are the resulting global linkage paths and spatial configurations? By revealing these nested multi-scalar linkage mechanisms, this study expects to provide policy references for advanced regions to optimize industrial layouts amidst global dynamics.
The remainder of this paper is organized as follows. Section 2 introduces the data sources and details the construction of the nested Multi-Regional input–output (MRIO) model. Section 3 presents the empirical results regarding the global and domestic linkage paths of Guangdong’s industries across different spatial scales and summarizes the structure and spatial patterns of Guangdong Province’s participation in global linkage. Section 4 discusses the theoretical and practical implications of the findings. Finally, we conclude with a summary of the main findings and their policy implications.

2. Materials and Methods

2.1. Nested Multi-Regional Input–Output Model

This study innovatively constructs the 2018 China Provincial Nested Global Multi-Regional Input–Output (MRIO) Model by integrating the Asian Development Bank (ADB) World Input–Output Database with China’s provincial MRIO tables. Covering 54 regions, including 23 major global economies and 31 provinces of China, the model comprises 20 sectors per region. Its primary objective is to address the spatial limitations of conventional models, thereby enabling an integrated linkage between sub-national administrative divisions and national economic entities.
The technical core of the nested model lies in the multi-dimensional decomposition and reconstruction of the intermediate input matrix (Z) and final demand matrix (F) within the global input–output system. Based on Leontief’s input–output theory, all products generated by any economy (country or province) in the system can be categorized into intermediate use and final demand according to their ultimate purpose. The fundamental output balance identity of the system is expressed as follows:
X ^ = Z + F ^
where X represents the column vector matrix of total output of each sector in each region; Z is the intermediate input matrix, reflecting the flow of intermediate products between sectors in various regions; F is the final demand matrix, representing the column vector of final products produced by each sector in each region and used for final consumption and investment. For province i of China within the nested system, the total output balance equation is specified as follows:
x i = z ii + j i m z ij + r n z ir + f ii ^ + j i m f ij ^ + r n f ir ^
In Equation (2), i and j denote China’s sub-national administrative units; r represents individual countries; m signifies the number of China’s sub-national units; n refers to the number of other global economies. Specifically, x i is the total output matrix of China’s province i; z i i denotes the intermediate input matrix utilized locally by province i; z i j represents the intermediate input matrix of intermediate goods supplied by province i to province j; f i i is the column vector of final products consumed locally within province i; f i r denotes the column vector of final products exported from province i to country r. The terms in Equation (2) are defined as follows: j i m z i j represents the intermediate inputs from all sectors of province i to other provinces in China; r n z i r represents the intermediate inputs from all sectors of province i to other countries worldwide; j i m f i j represents the final inputs from various sectors of province i to other domestic provinces in China; r n f i r represents the final inputs from all sectors of province i to other countries or regions globally. Accordingly, the total output xi of province i is divided into two components: intermediate inputs supplied to all regions (the first three terms) and final demand by all regions (the last three terms). For other countries or regions r, the total output balance equation is formulated as follows:
x r = i m z ri + z rr + s r n z rs + i m f ri ^ + f rr ^ + s r n f rs ^
Here, r and s represent distinct countries or regions. Equation (3) reveals that the total output of country or region r is allocated to four components: intermediate use in China (first term), intermediate use in all regions excluding China (second and third terms), final consumption in China (fourth term), and final consumption in all regions outside China (fifth and sixth terms). Based on Equations (2) and (3), the input–output model is derived as follows:
X = ( I A ) 1 F
where I is the identity matrix, and matrices X, F and A are defined, respectively, as follows:
X = X 1 X m X r X n ,   F = F 1 F m F r F n ,   A = A ii A ij A ir A ji A jj A jr A ri A rj A rr = a 11 a 1 m a m 1 a mm a 1 r a 1 n a mr a mn a r 1 a rm a n 1 a nm a rr a rn a nr a nn
In practical implementation, a proportional allocation method is adopted to decompose national-level trade flows based on the share of each provincial sector in the corresponding national sector. For the initial input matrix, balance adjustments are performed to ensure that provincial data in China’s MRIO tables are consistent with national aggregate data in the ADB-MRIO tables. The detailed decomposition methods are as follows:
First, provincial spatial decomposition of total output: The share of the total output of sector a in province i ( θ a i ) relative to the national total output of sector a, derived from China’s inter-provincial MRIO tables, is used to decompose the total output of sector a in China x ~ a from the ADB-MRIO database into the total output of each province x a i :
x a i = θ a i x ~ a = x ¯ a i i x ¯ a i x ~ a
where x ¯ a i denotes the total output of sector a in province i, as recorded in China’s inter-provincial MRIO tables.
Second, reconstruction of inter-provincial intermediate inputs: the inter-provincial trade structure share δ a b i j , defined as the proportion of intermediate inputs from sector a of province i to sector b of province j in the national intermediate inputs from sector a to sector b (based on China’s inter-provincial MRIO tables), is employed to disaggregate the internal flows of sector a to sector b in China z ~ a b from the ADB-MRIO database into inter-provincial interaction blocks:
z a b i j = δ a b i j × z ~ a b = z ¯ a b i j i , j z ¯ a b i j × z ~ a b
where z a b i j represents the intermediate inputs from sector a of province i to sector b of province j.
Third, nested decomposition of the intermediate input matrix: For intermediate goods imports of each province, a uniform import source structure across all provinces is assumed. The share of intermediate goods imports of sector a in province i ( φ a i ) relative to the national total intermediate goods imports of sector a, obtained from China’s inter-provincial MRIO tables, is used to decompose the intermediate goods imports of China’s sector a from sector b of country r ( z ~ a b r C H N ) into imports of individual provinces:
z a b r i = φ a i × z ~ a b r C H N = z ¯ a I M i i z ¯ a I M i × z ~ a b r C H N
where z a b r i denotes the intermediate goods imports of sector a in province i of China from sector b of country r, and z ¯ a I M i represents the intermediate goods imports of sector a in province i. For intermediate goods exports of each province, a consistent export structure to other countries across all provinces is assumed. The share of intermediate goods exports of sector a in province i ( λ a i ) relative to the national total intermediate goods exports of sector a, derived from China’s inter-provincial MRIO tables, is applied to decompose the intermediate goods exports of China’s sector a to sector b of country r ( z ~ a b C H N r ) into exports of individual provinces:
z a b i r = λ a i × z ~ a b C H N r = z ¯ a E X i i z ¯ a E M i × z ~ a b C H N r
where z a b i r denotes the intermediate goods exports of sector a in province i of China to sector b of country r, and z ¯ a E X i represents the intermediate goods exports of sector a in province i.
Fourth, nested decomposition of the final demand matrix: To ensure model balance, the final demand matrix is decomposed at the provincial level. The decomposition formulas for final imports and final exports are specified, respectively, as follows:
f a r i = φ i × f ~ a r C H N = f ¯ I M i i f ¯ I M i × f ~ a r C H N
f a i r = λ i × f ~ a C H N r = f ¯ E X i i f ¯ E X i × f ~ a C H N r
In these formulas, f a r i denotes the final goods imports of sector a in province i of China from country r; φ i represents the proportion of final goods imports of province i in the total final goods imports of all provinces; f ~ a r C H N stands for the final goods imports of sector a in China from country r; f ¯ I M i indicates the final goods imports of province i; f a i r denotes the volume of final goods exported from sector a of province i of China to country r for final consumption; λ i represents the proportion of final goods exports of province i in the total final goods exports of all provinces; f ~ a C H N r stands for the volume of final goods exported from sector a of China to country r for final consumption; f ¯ E X i indicates the final goods exports of province i.
Finally, the RAS balancing algorithm is utilized to iteratively reconcile the nested matrix, ensuring that aggregated provincial data are strictly consistent with national totals. Provincial international trade data are further employed for auxiliary verification, following the formula:
M a i r = M ¯ a i r M ¯ a i r × M ~ a i
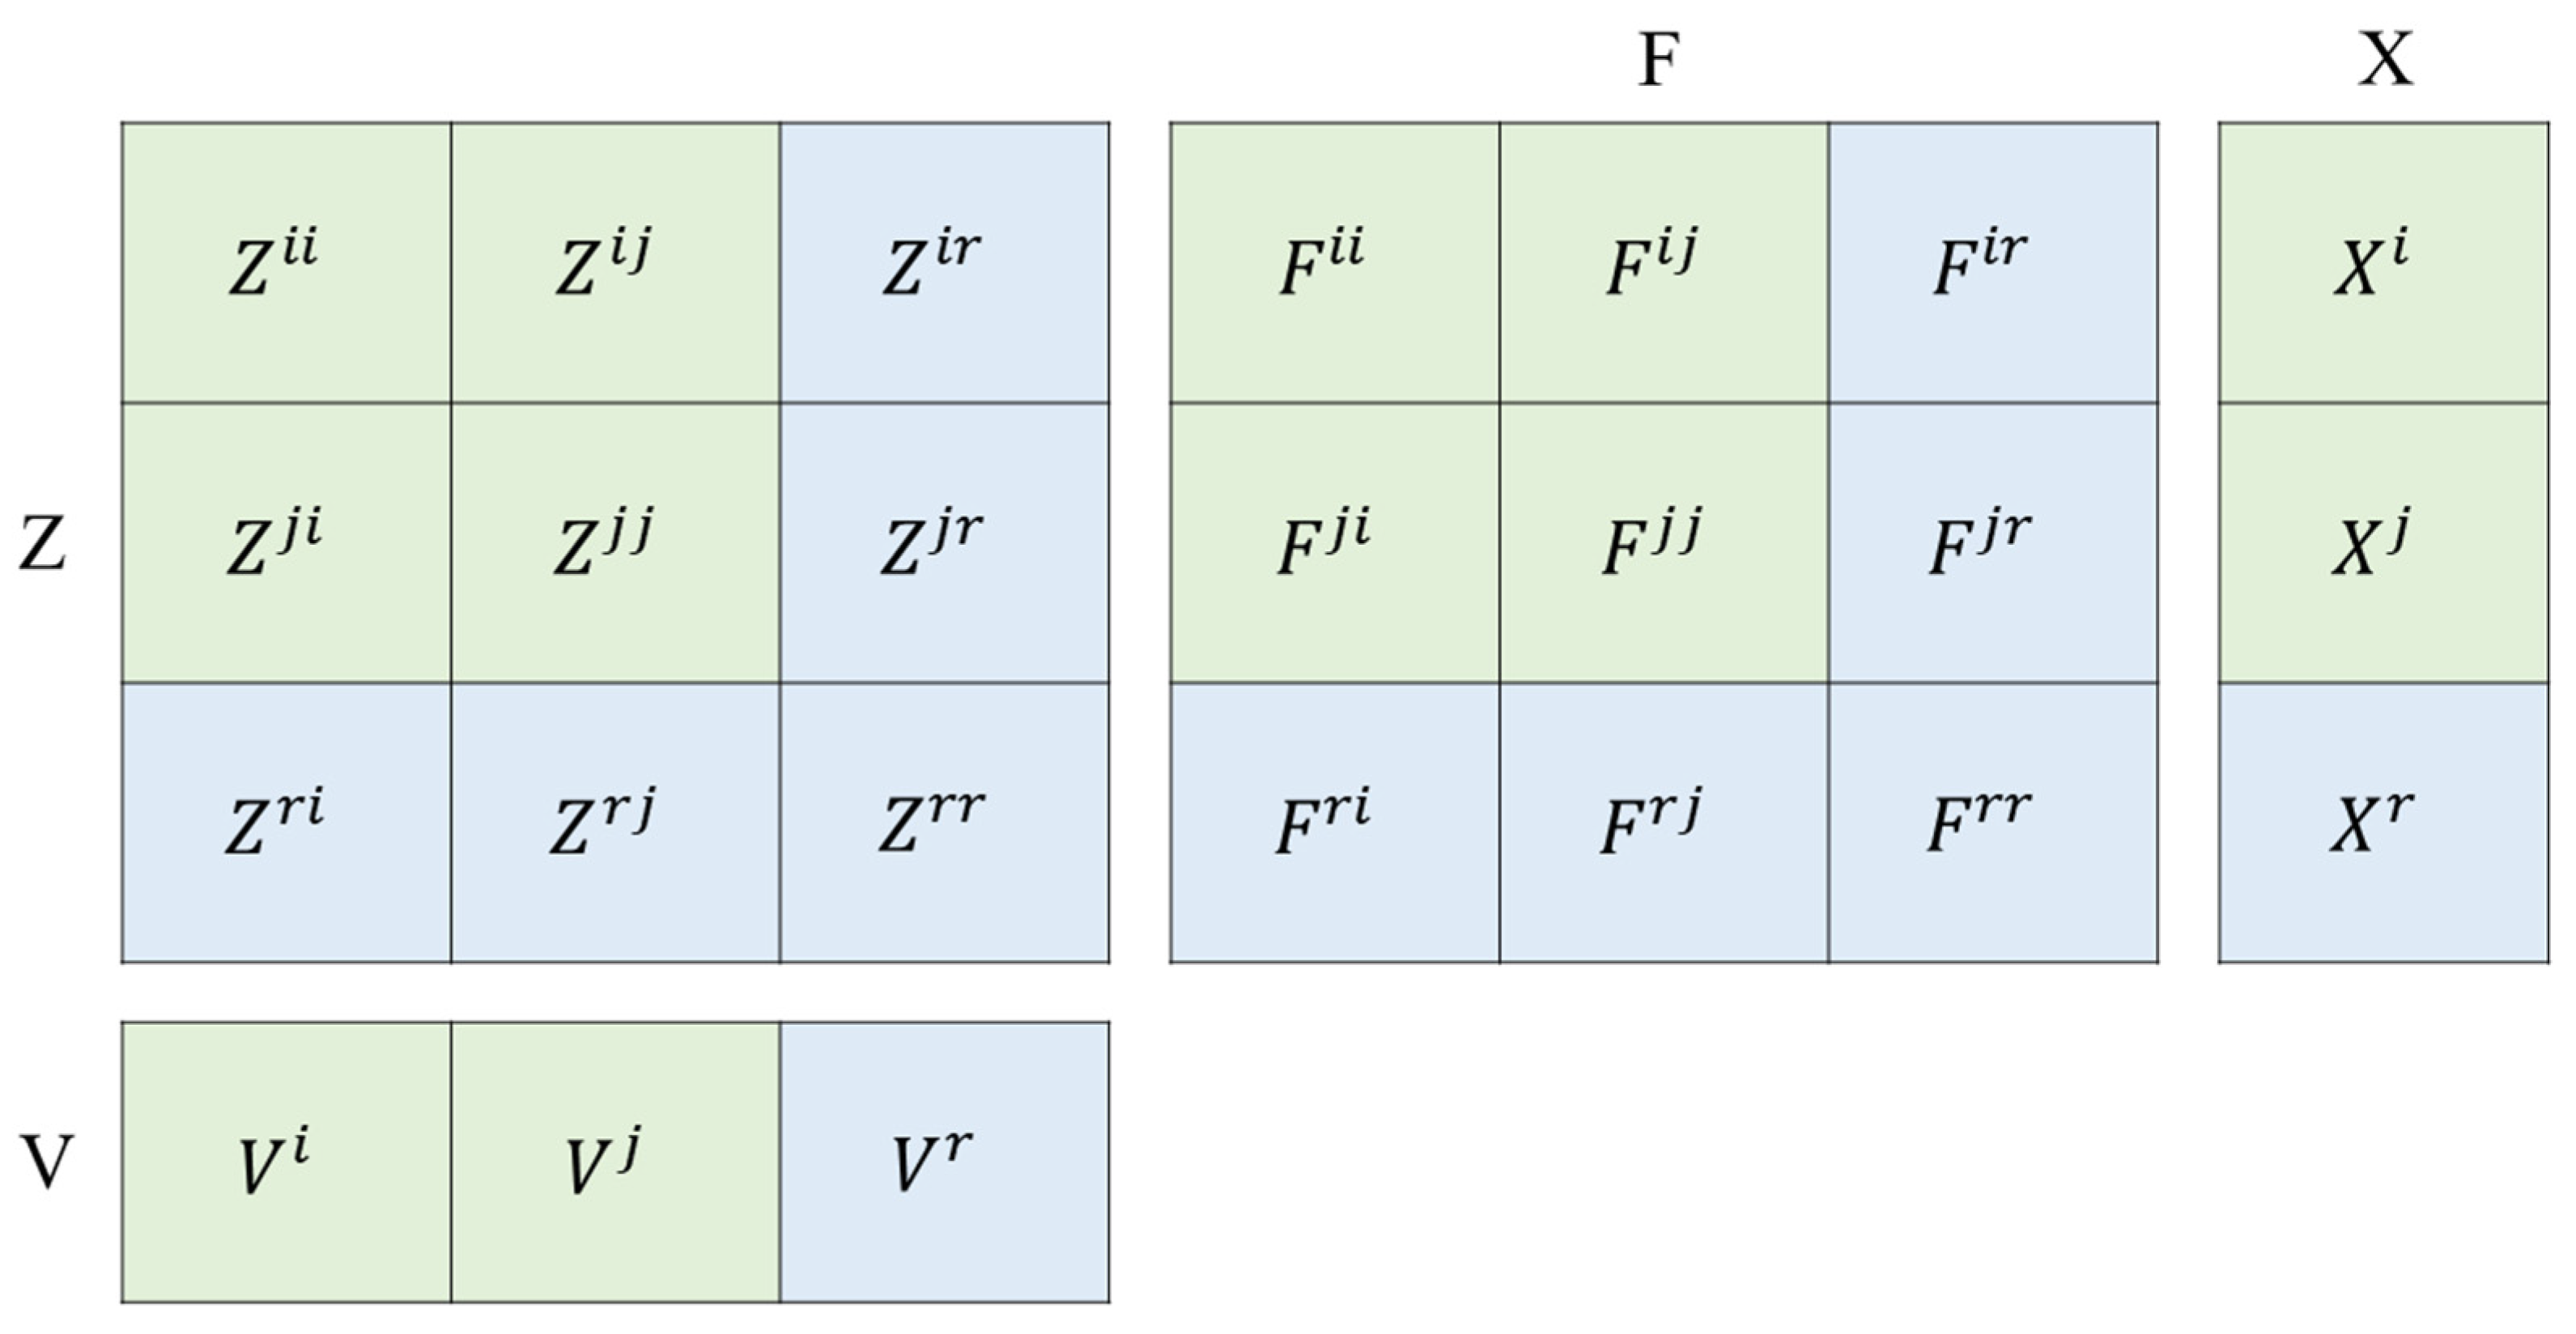
where M a i r denotes the output or services exported from sector a of province i of China to country r after nesting; M ¯ a i r represents the output and services exported from sector a of province i of China to country r, sourced from customs statistics; M ¯ a i r is the total trade volume exported from sector a of province i of China to the world; M ~ a i denotes the final total export volume of sector a of province i of China after aggregate adjustment. The nested MRIO model is illustrated in Figure 1, with core matrices including the intermediate demand matrix Z, final demand matrix F, value-added matrix V, and total output matrix X [47].

2.2. Data Sources and Processing

The empirical analysis in this study is based on three core datasets: the 2018 Multi-Regional Input–Output (MRIO) Database released by the Asian Development Bank (ADB), the 2018 Inter-Provincial Input–Output Tables of China, and provincial international trade data from the China Customs Database. The ADB-MRIO dataset covers 63 countries/regions and 35 industrial sectors, while China’s inter-provincial input–output tables encompass 31 provinces and 42 industrial sectors. To construct a non-competitive nested model with consistent statistical standards, this study first performs unified regional and industrial matching of multi-source data. The data are integrated into 54 spatial units, including 31 provincial-level administrative regions of China, 22 major global economies (e.g., the United States, Europe, ASEAN), and the Rest of the World (ROW). The industrial classification is standardized into 20 general industrial sectors. Furthermore, drawing on the OECD’s Classification of Economic Activities Based on R&D Intensity and combining factor endowment characteristics, the 20 sectors are categorized into five categories: food and agricultural products, energy and minerals, low-R&D-intensity sectors, high-R&D-intensity sectors, and services. Detailed classification is provided in the Supplementary Materials.

3. Results

3.1. Internal Linkage Process of Guangdong’s Industrial Categories

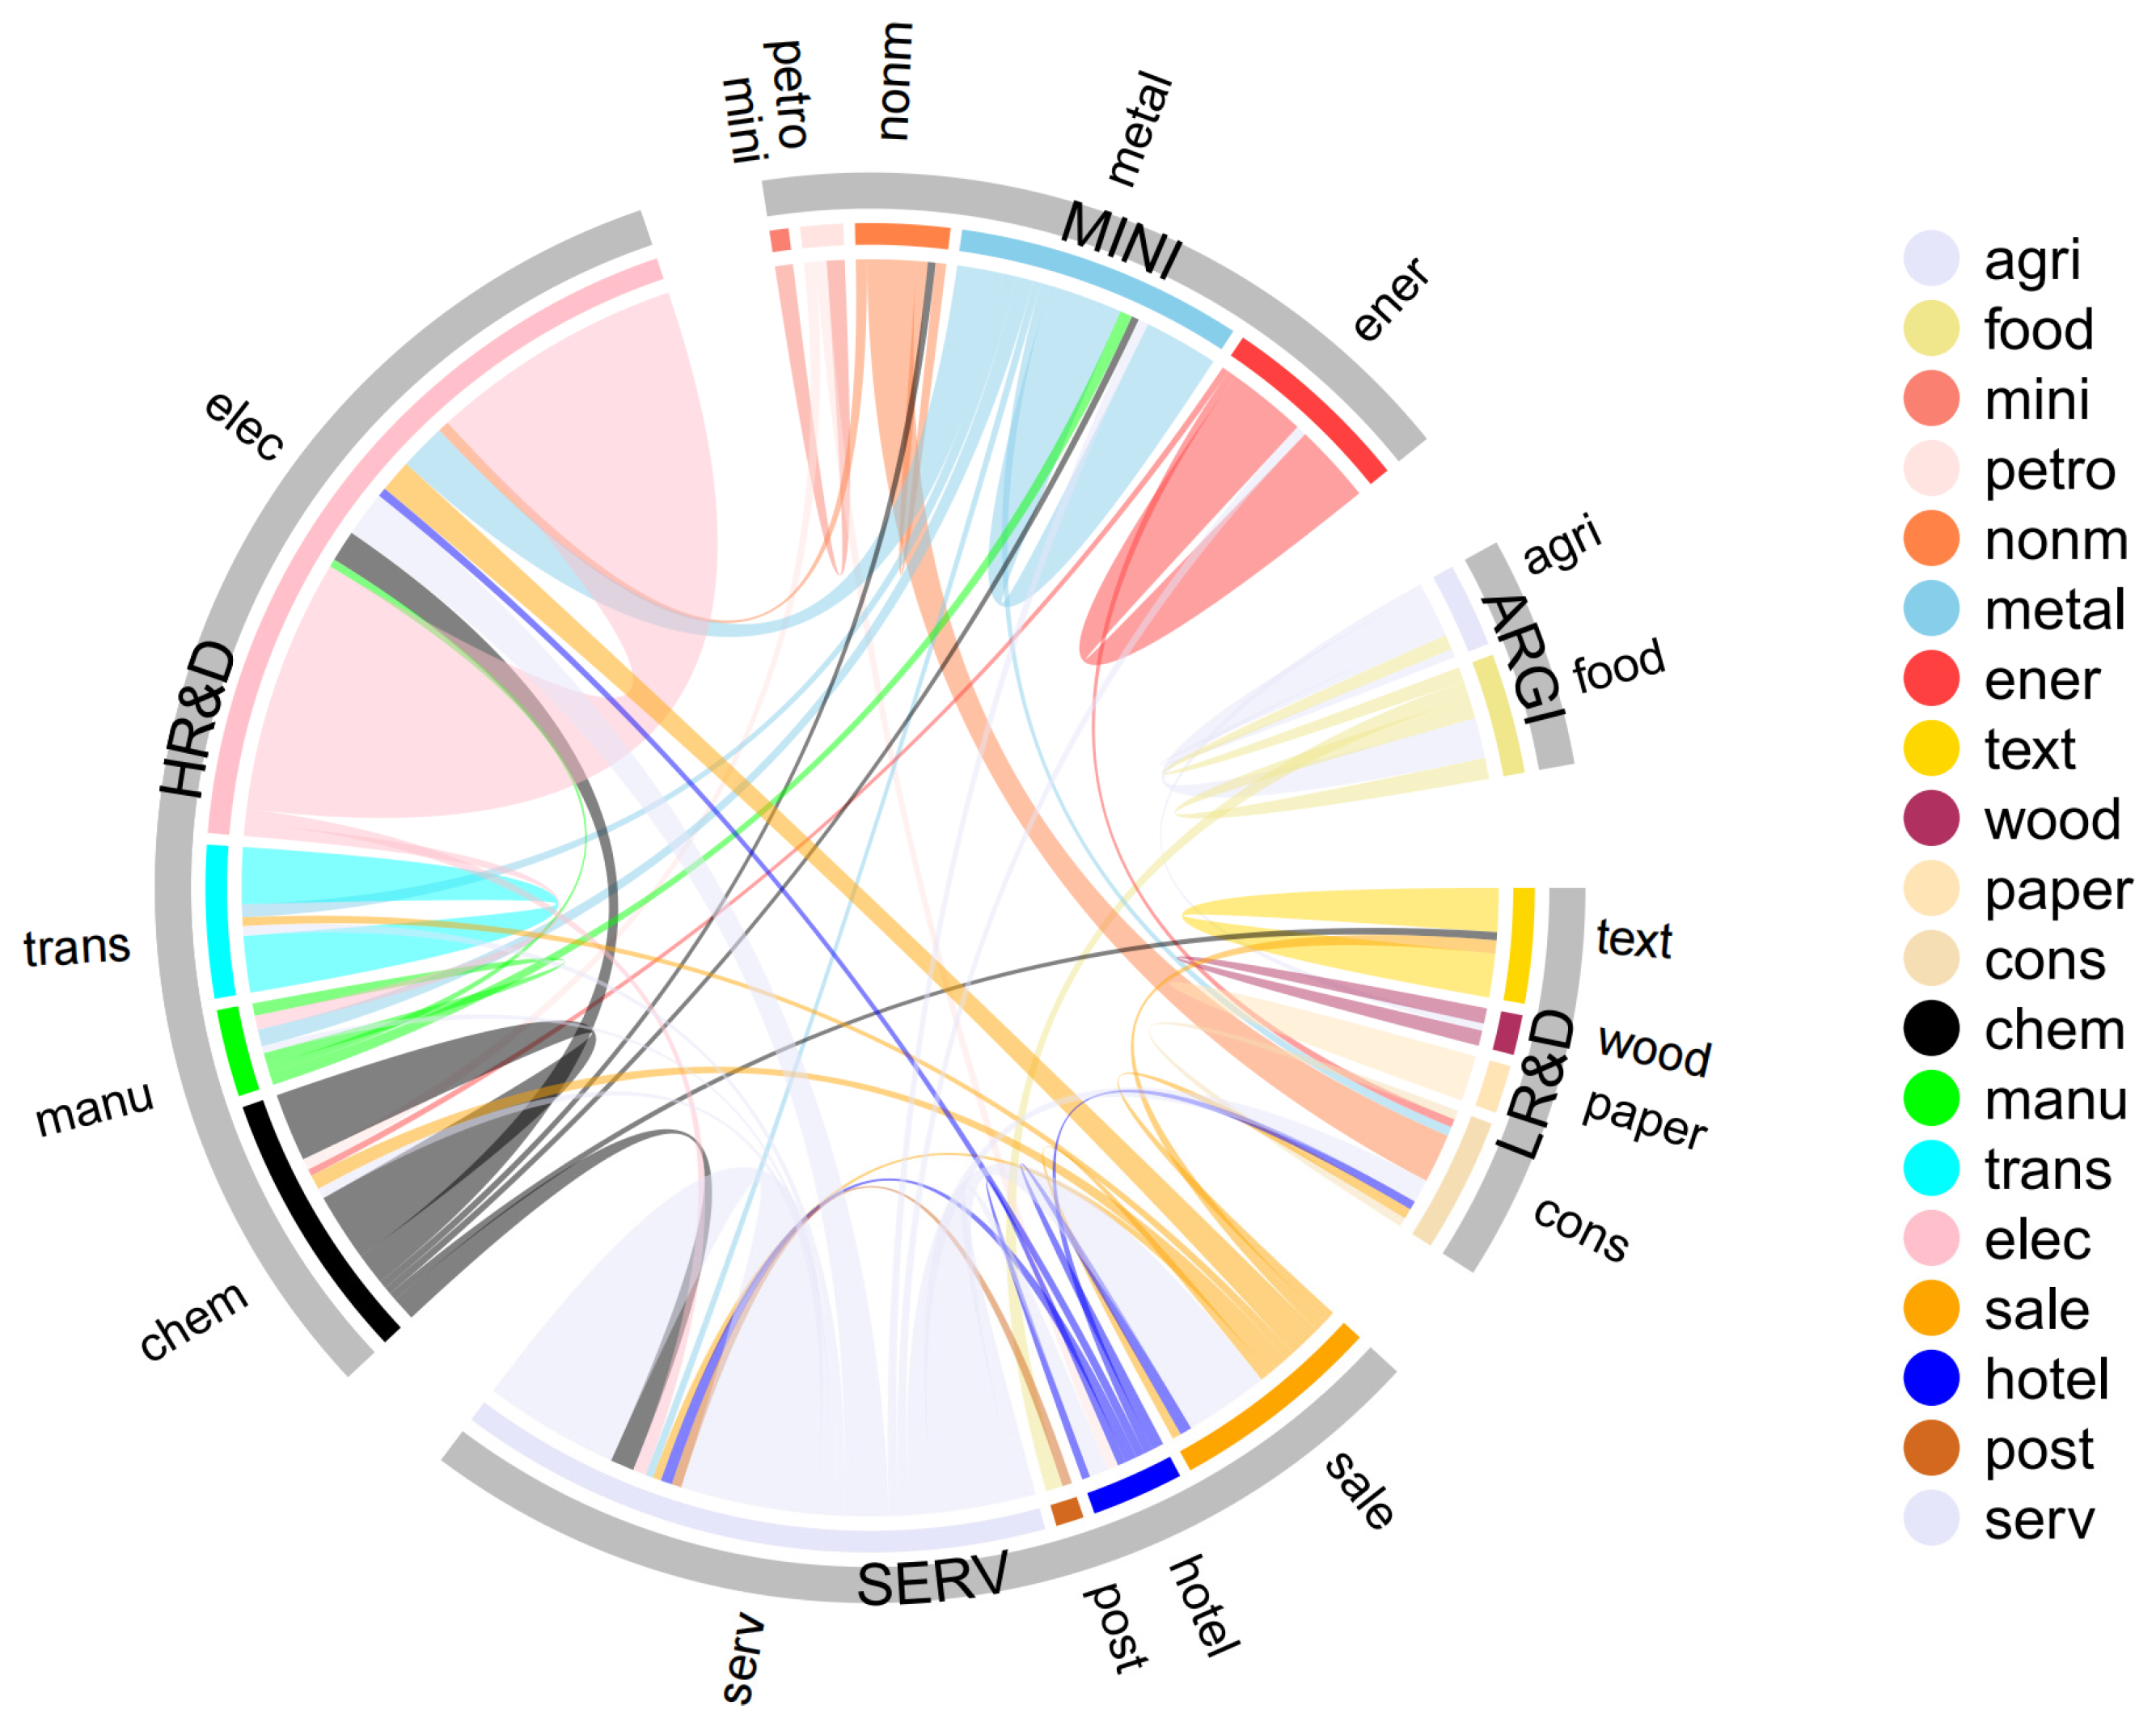
Industrial linkages within Guangdong exhibit a characteristic pattern of “dual-industry leadership and multi-sector synergy”, forming an agglomeration network anchored by high-R&D-intensity industries and the service sector, while being supported by energy, minerals, and low-R&D-intensity industries (Figure 2). Regarding core sectors, the internal and cross-sector flow scales of high-R&D-intensity industries and the service sector are dominant, reaching USD 394.733 billion and USD 389.173 billion, respectively, accounting for 32.3% and 31.9% of all industrial sectors. Specifically, the optoelectronic and electrical equipment industry (‘elec’) recorded a total intra-provincial flow of USD 214.785 billion, serving as the central node of provincial industrial linkages. The modern services sector (‘serv’) exhibits a robust industrial bonding function, with a total intra-provincial flow of USD 270.42 billion. Its cross-industry flow accounts for a significant 61.8% of its total, radiating outward to various sectors including wholesale and retail (USD 64.44 billion) and optoelectronic devices (USD 34.68 billion). Regarding other sectors, supporting industries such as metal products (‘metal’), energy (‘ener’), and transportation (‘trans’) form a tight collaborative circle around core industries. Notably, the supply of metal products from the energy sector to the optoelectronic industry reached USD 35.495 billion, providing foundational materials and energy security for core industries, while non-metallic mineral products (‘nonm’) supplied USD 37.579 billion to the construction industry (‘cons’), supporting large-scale provincial infrastructure development. The intra-provincial industrial linkages, thus, form two main axes accompanied by multi-sector cross linkages, constituting a complex network structure.
Under this structural framework, intra-provincial linkages have forged a longitudinal development axis connecting basic materials to high-end manufacturing. Leveraging long-established manufacturing clusters, high-R&D-intensity sectors have achieved close coordination with upstream supporting departments. Specifically, the flow of metal products from the energy and minerals sector to the optoelectronic and electrical equipment industry within the high-R&D-intensity sector reached USD 35.495 billion, accounting for 10.6% of the total input received by the optoelectronic industry, thereby supporting the component demand for optoelectronic manufacturing. Simultaneously, the chemical and rubber industry (‘chem’) supplied USD 24.004 billion to the optoelectronic industry, forming a high-end manufacturing linkage chain of “metal/chemical materials–optoelectronic equipment.” The primary reason is that the agglomeration effects of industries such as optoelectronics and electronic information attract supporting industries like metal products and chemical rubber, thereby reducing coordination costs and strengthening inter-sectoral synergy [48,49].
Parallel to the high-end manufacturing axis, intra-provincial linkages have also formed a supportive backbone connecting basic industries to infrastructure and public welfare. The flow of the non-metallic mineral products sector to the construction industry within the low-R&D-intensity sector reached USD 37.579 billion, accounting for 42.1% of the total output of non-metallic mineral products. This covers core infrastructure materials such as cement and stone, adapting to the development needs of Guangdong’s era of large-scale infrastructure construction. The energy sector (‘ener’) supplied USD 6.299 billion to the construction industry, forming a complete linkage chain of “energy–building materials–construction”. This tight integration, driven by massive domestic demand, not only secures a stable supply for infrastructure development but also expands the market space for energy and basic materials through the scaling of high-end manufacturing.
Furthermore, cross-sectoral service linkages further enhance the operational efficiency of the intra-provincial industrial network. Wholesale and retail trade (‘sale’) within the service sector supplied USD 24.722 billion to the optoelectronic industry, accounting for 4.5% of its total input, constructing a service support path of “commercial circulation–high-end manufacturing.” The food and tobacco industry (‘food’) supplied USD 12.848 billion to transportation and warehousing (‘post’), forming a livelihood-related linkage path of “daily consumption–logistics services,” which further refines the provincial industrial network.
This comprehensive, multi-level industrial interaction stems from the precise guidance of Guangdong’s industrial policies during the “14th Five-Year Plan” period, which emphasize a dual-wheel drive of high-end manufacturing and modern services. Through the synergy of policy empowerment and market-driven clustering, the province has not only achieved R&D upgrades in core industries but also reinforced the structural resilience of intra-provincial industrial linkages by refining supporting industrial systems.

3.2. Flow Characteristics of Guangdong’s Exchange with the External

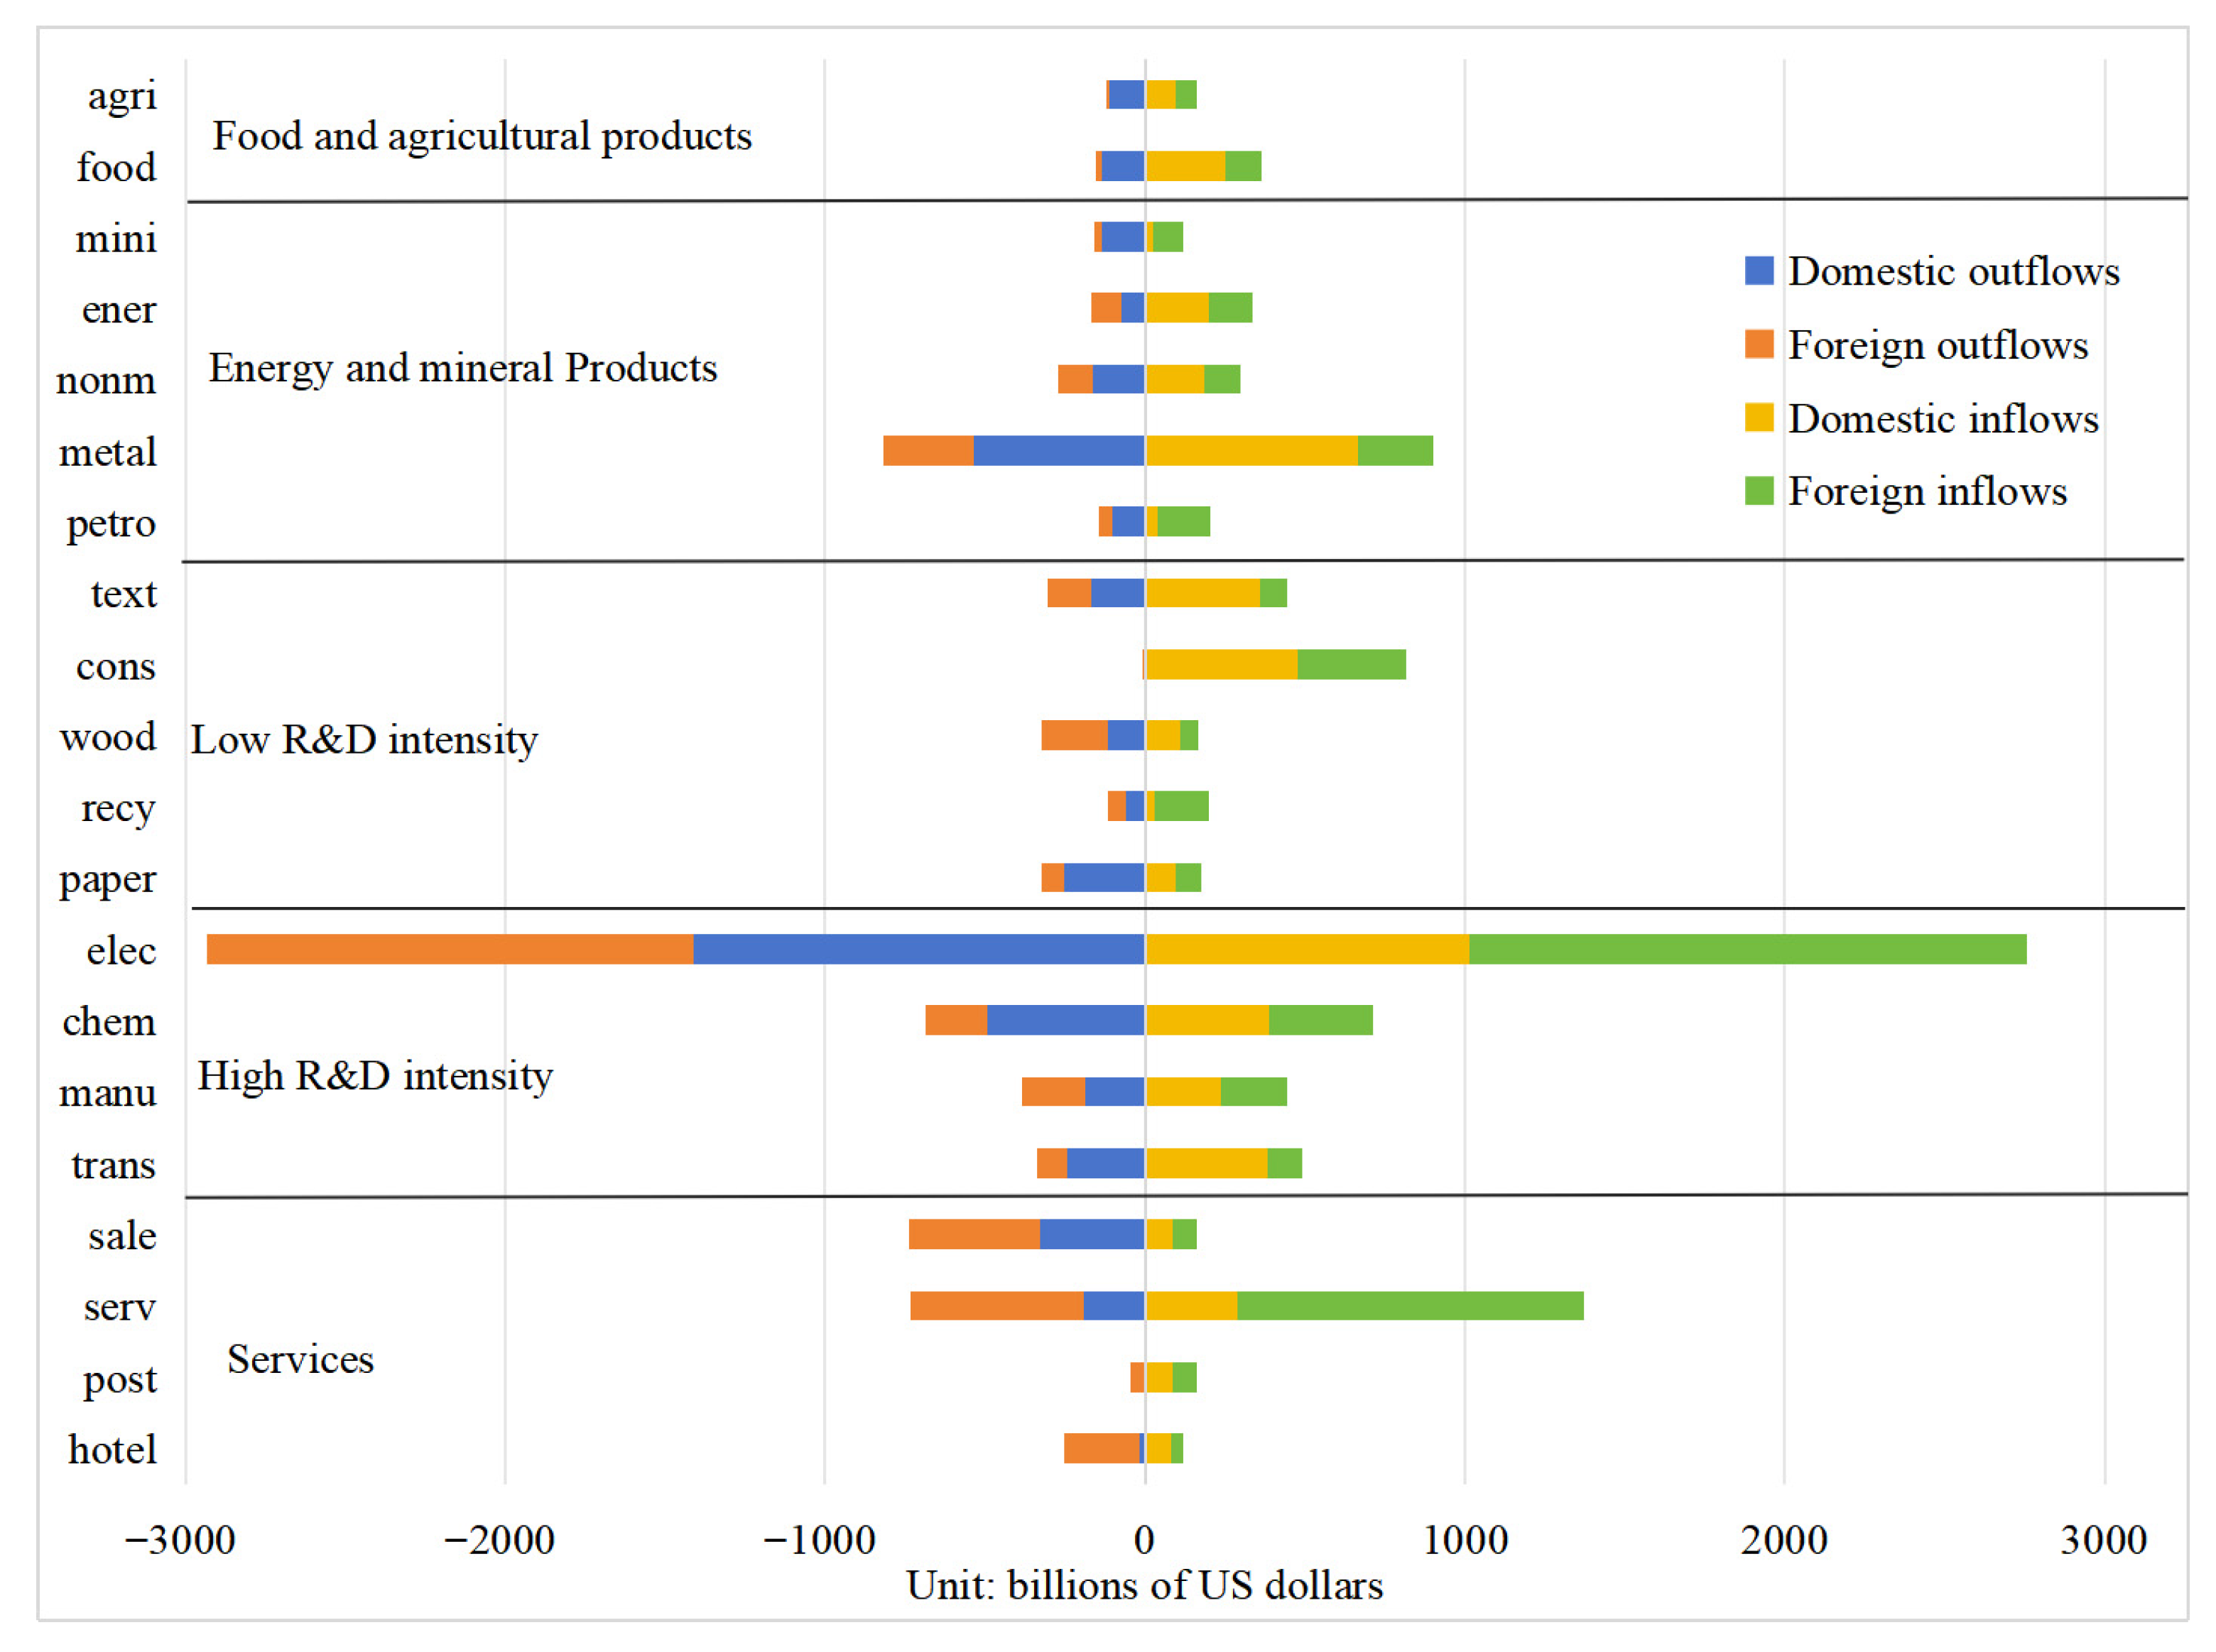
As China’s “foreign trade gateway,” Guangdong’s systemic vitality is deeply contingent upon cross-regional factor exchanges. These external linkages exhibit distinct spatial logics at the domestic and international scales (Figure 3). At the domestic level, Guangdong’s input pathways are concentrated in resource-rich provinces such as Guangxi, Guizhou, and Henan, primarily for acquiring agricultural products and basic mineral materials. In the agriculture, forestry, animal husbandry, and fishery sectors, substantial flows originate from Guangxi (USD 5.599 billion), Guizhou (USD 4.752 billion), and Hainan (USD 4.160 billion) into Guangdong’s food processing industry. In the energy and minerals sector, metal products from Henan (USD 7.319 billion), Hebei (USD 5.956 billion), and Guangxi (USD 3.729 billion) flow extensively into Guangdong’s metal processing and high-end manufacturing industries. Conversely, Guangdong’s output pathways focus on technology-intensive provinces such as Jiangsu, Zhejiang, and Anhui. In high-R&D fields, Guangdong’s optoelectronic products flow to the optoelectronic sectors in Henan (USD 9.643 billion) and Zhejiang (USD 8.361 billion). In low-R&D fields, textile products flow to the textile industries in Zhejiang (USD 2.900 billion) and Anhui (USD 0.566 billion). Overall, Guangdong’s domestic cross-regional factor flows exhibit a complementary pattern of “resource-rich hinterland support—Guangdong deep processing—radiation to technology-intensive regions.” This indicates that Guangdong acts as a pivotal bridge in domestic resource exchange, connecting the central and western regions with the southeast coastal areas.
On the international front, international linkages are most extensive within high-R&D-intensity industries. Specifically, sectors such as optoelectronic equipment (‘elec’) exhibit international inflow and outflow volumes that are significantly higher than those of other industries. Meanwhile, the services sector demonstrates a pronounced “export-oriented” mode, with the scale of international exchange far exceeding that of inter-provincial exchange, reflecting robust resilience in international competition. Regarding input pathways in the high-R&D sector, optoelectronic industries in South Korea (USD 25.079 billion) and Japan (USD 10.247 billion) flow into Guangdong’s optoelectronic sector. In the energy and minerals sector, mining products from Australia (USD 2.090 billion) and Russia (USD 0.719 billion) flow into Guangdong’s metal products industry, forming an importation trajectory of “global high-end resources supporting Guangdong manufacturing.” Regarding product output pathways in the high-R&D sector, Guangdong’s optoelectronic products flow to the optoelectronic and service industries in the US (USD 8.851 billion) and the EU (USD 8.837 billion). In the service sector, Guangdong’s “other services” flow to service industries in the EU (USD 4.852 billion) and Germany (USD 4.215 billion), forming an export trajectory of “Guangdong intelligent manufacturing serving the global market.” Thus, international linkages present a characteristic of “high-end input and mid-end output,” wherein core components are imported from developed economies, and intermediate and finished products are exported to the global market, establishing a cross-regional and cross-scale spatial flow pattern.
By analyzing the characteristics of Guangdong’s cross-regional factor flows and the disparities between inter-provincial and international trade, it is evident that Guangdong’s external linkages exhibit a spatial characteristic of “domestic resource input and product output, alongside international high-end collaboration and two-way convection.” This forms a spatial network that utilizes surrounding domestic provinces as a resource hinterland, the Yangtze River Delta as a collaborative partner, and the US, EU, Japan, and South Korea as core international collaboration zones.

3.3. Global Linkage Paths of Guangdong’s Core Industrial Categories

Having clarified the macro-characteristics of internal and external linkages, this section delves into the micro-industrial level. It reveals how diverse industrial sectors construct four typical operational modes across multiple scales through differentiated supply–demand relationships.

3.3.1. High-R&D-Intensity Category: An Innovation-Driven Mode Featuring Global Bidirectional Flows and Domestic–International Synergy

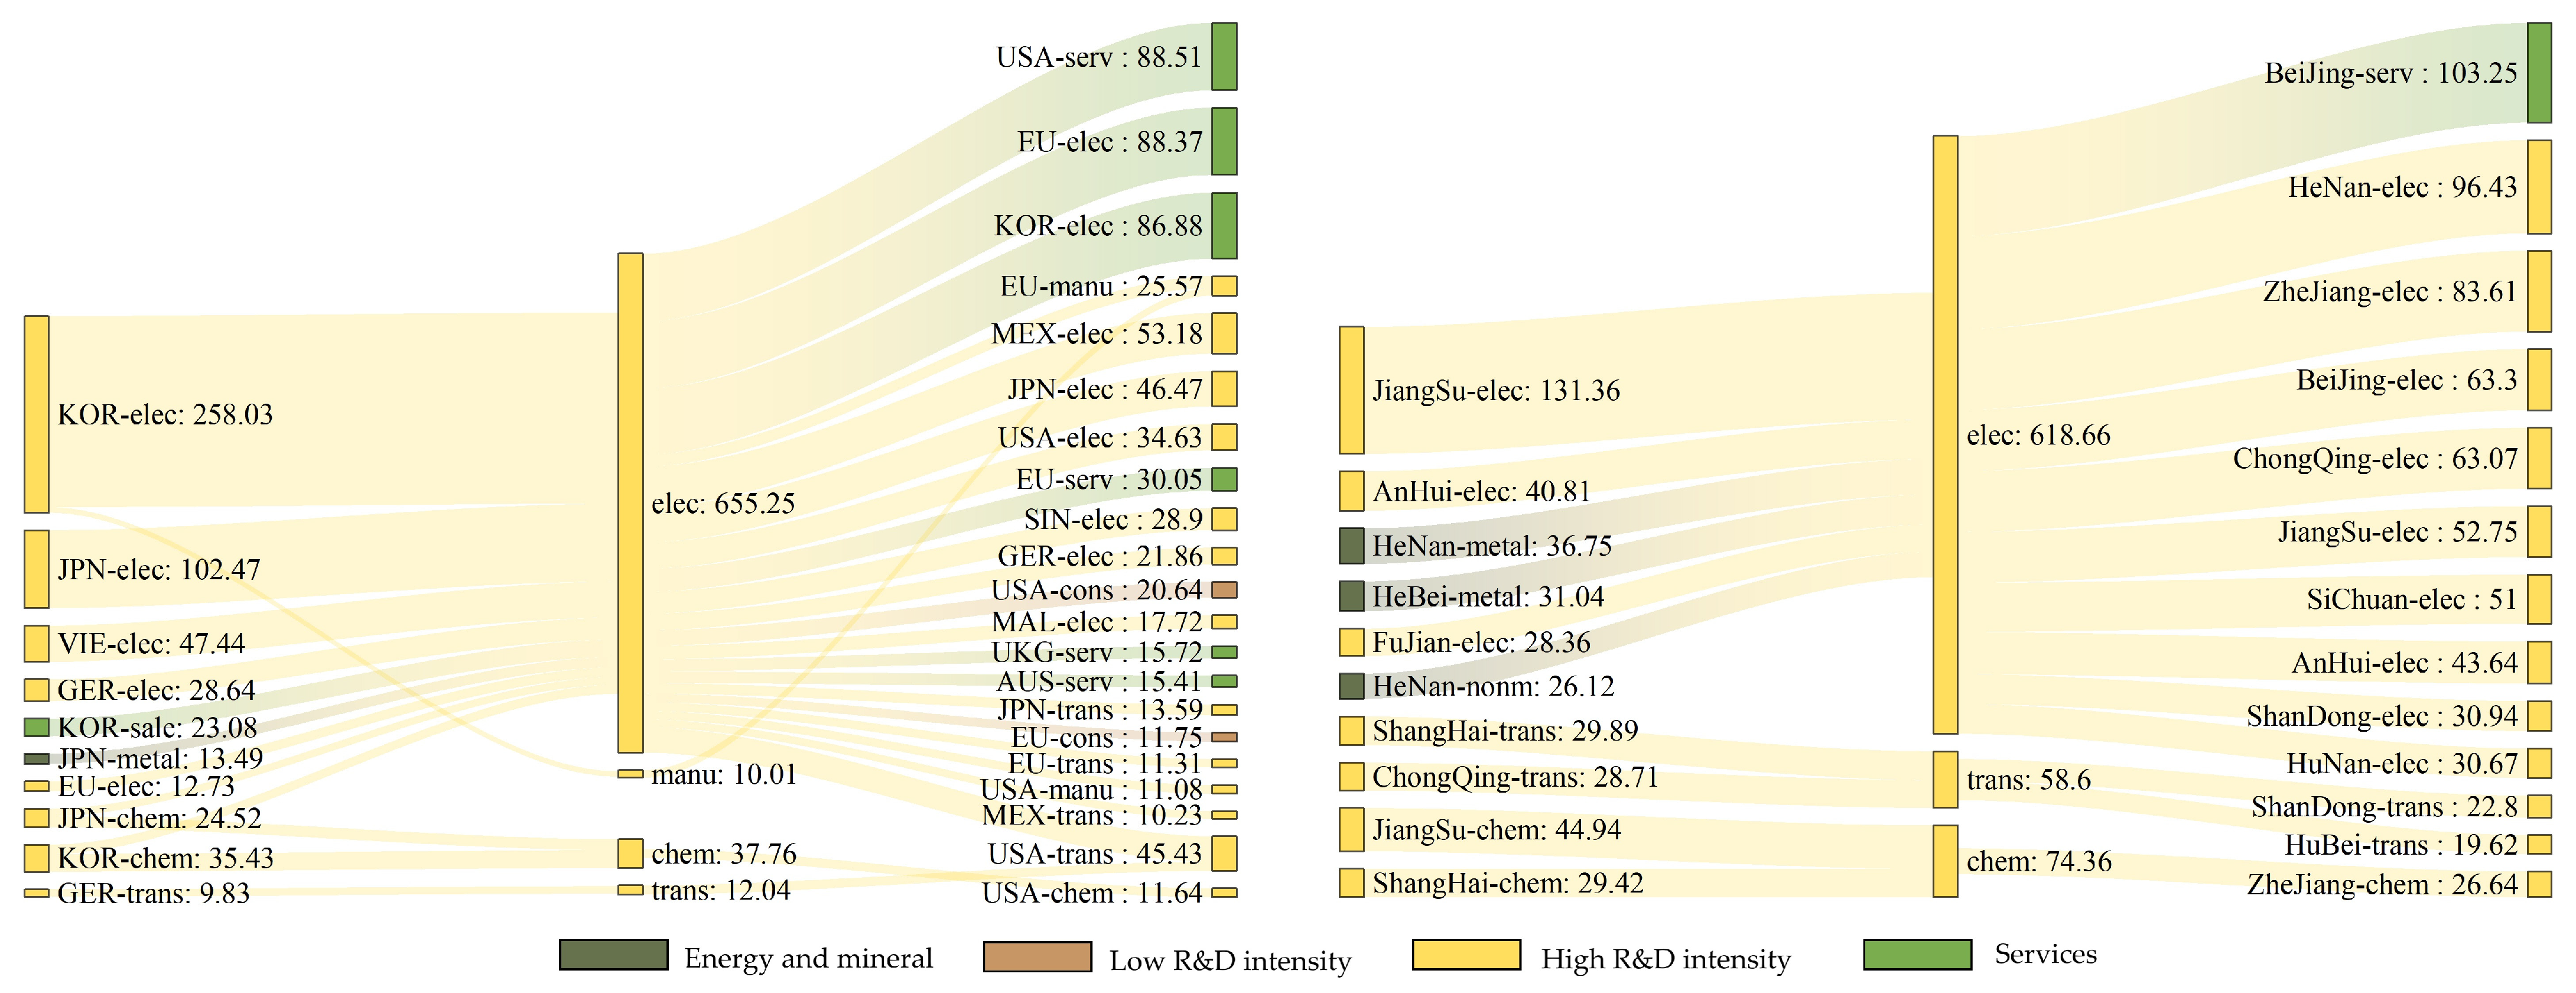
High-R&D-intensity sectors exhibit significant features of GVC embedding, forming a “two-way openness” pattern with Guangdong as the central hub (Figure 4). With a total factor exchange volume of USD 326.31 billion, this mode is characterized by “multi-point global linkage and core domestic collaboration.” This pattern follows a specific trajectory: “Import of core components/domestic technical matching—Guangdong system integration—Global/National terminal output.” From the international dimension, as a vital node in the global intermediate supply chain, Guangdong achieves high-end embedding by importing core components from technology source regions such as South Korea (USD 25.08 billion) and Japan (USD 10.25 billion), while exporting terminal equipment to the U.S. services sector (USD 8.85 billion) and the EU (USD 8.84 billion). From the domestic dimension, supported by R&D collaboration and material inputs from provinces like Jiangsu (USD 13.14 billion) and Anhui (USD 4.08 billion), Guangdong radiates technical influence to regions such as Henan (USD 9.64 billion) and Zhejiang (USD 8.36 billion).
By leveraging technological accumulation and industrial clustering, Guangdong’s high-R&D sectors have become key intermediate suppliers in GVCs. Domestic technical cooperation bolsters innovation capabilities, while international high-end inputs bridge core technology gaps; this bidirectional flow effectively drives industrial upgrading. This domestic–international synergy not only mitigates external dependency on core technologies but also consolidates Guangdong’s hub position within the global innovation network through its robust industrial cluster advantages.
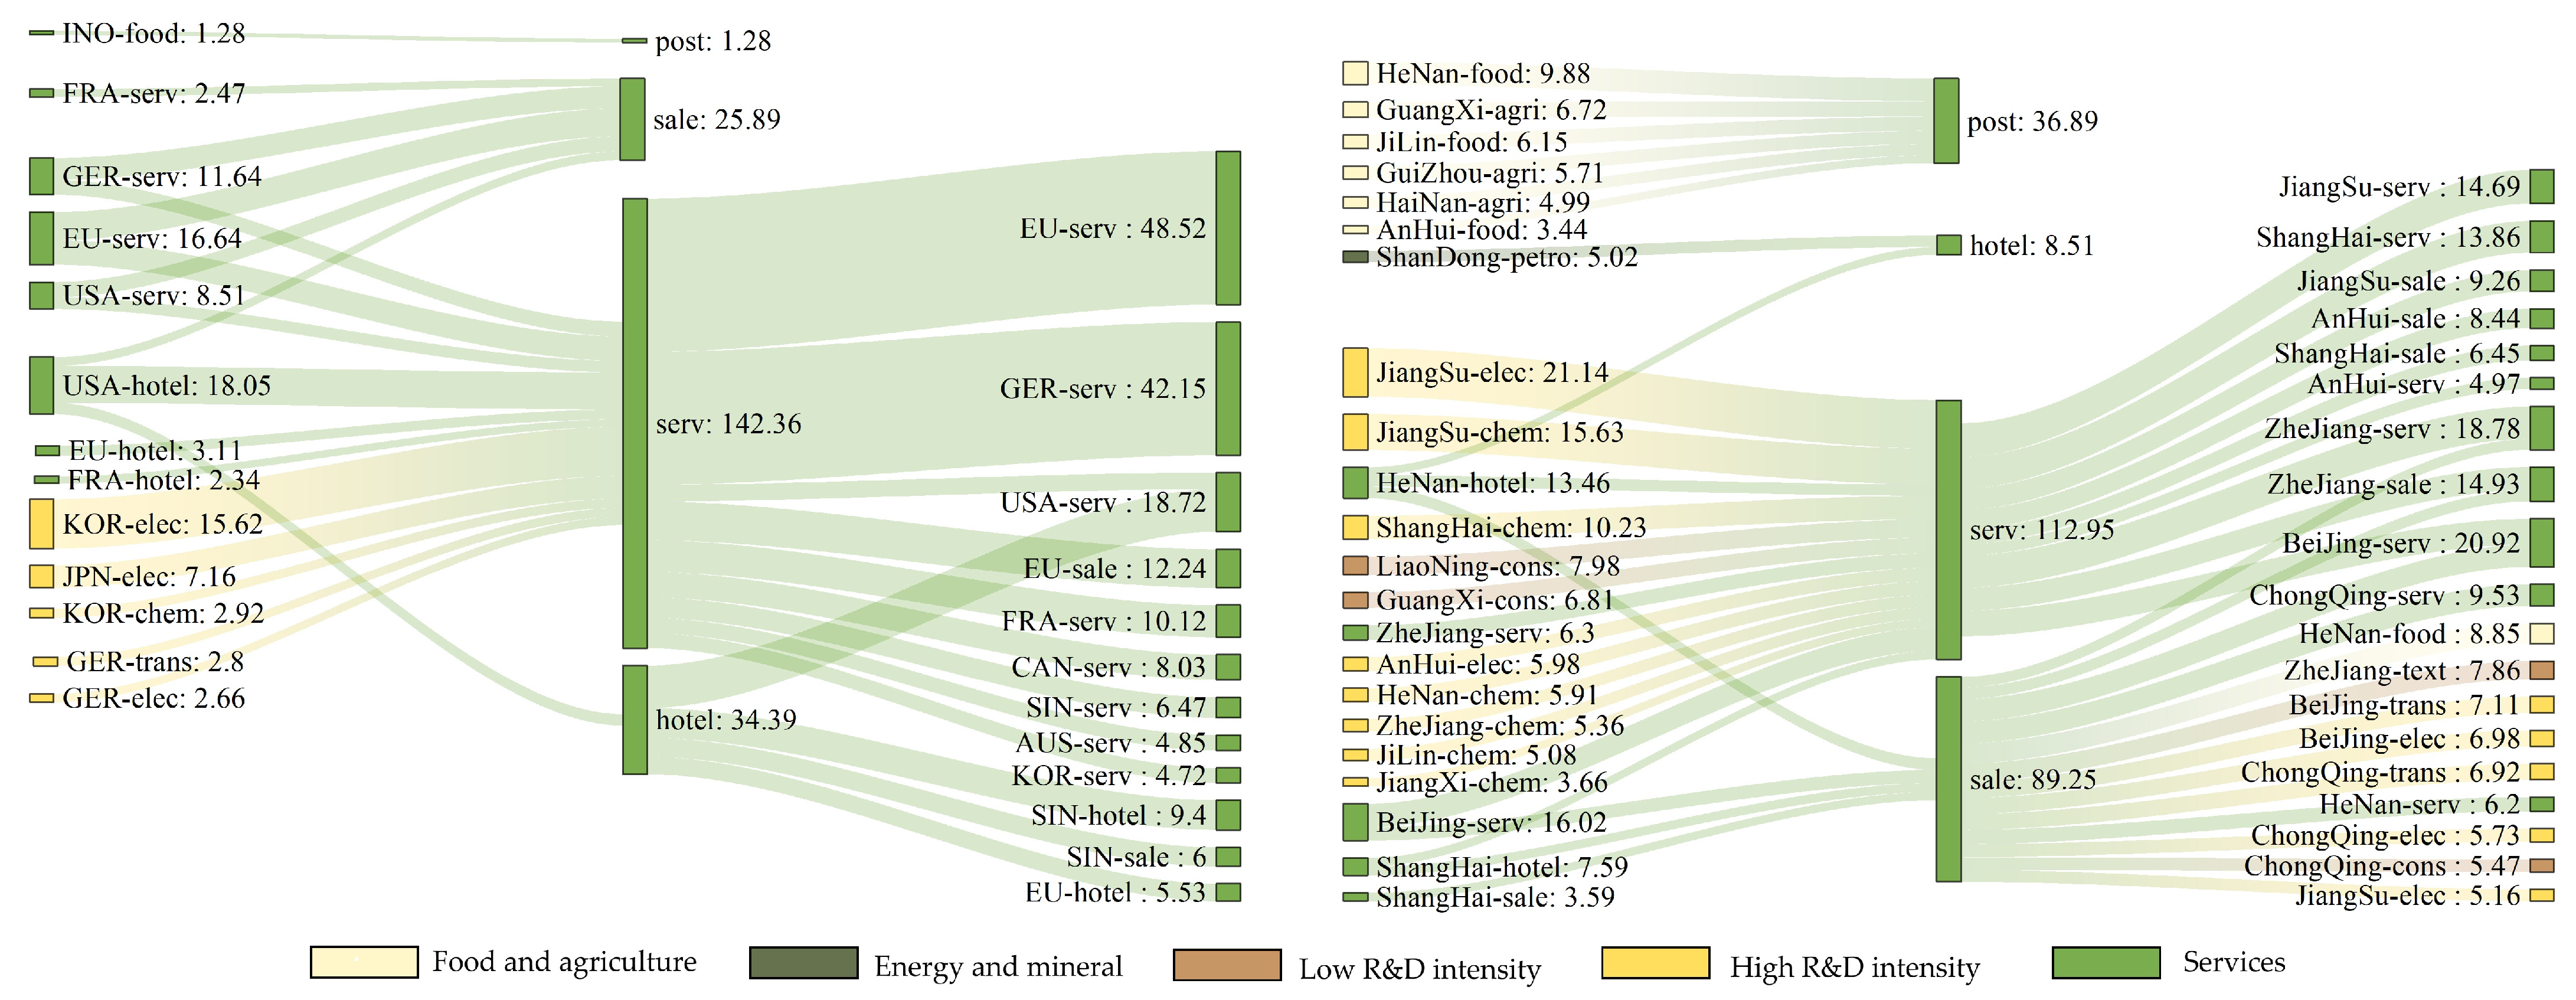
Figure 5. Global linkage paths for service category in Guangdong.
Systems 14 00272 g005
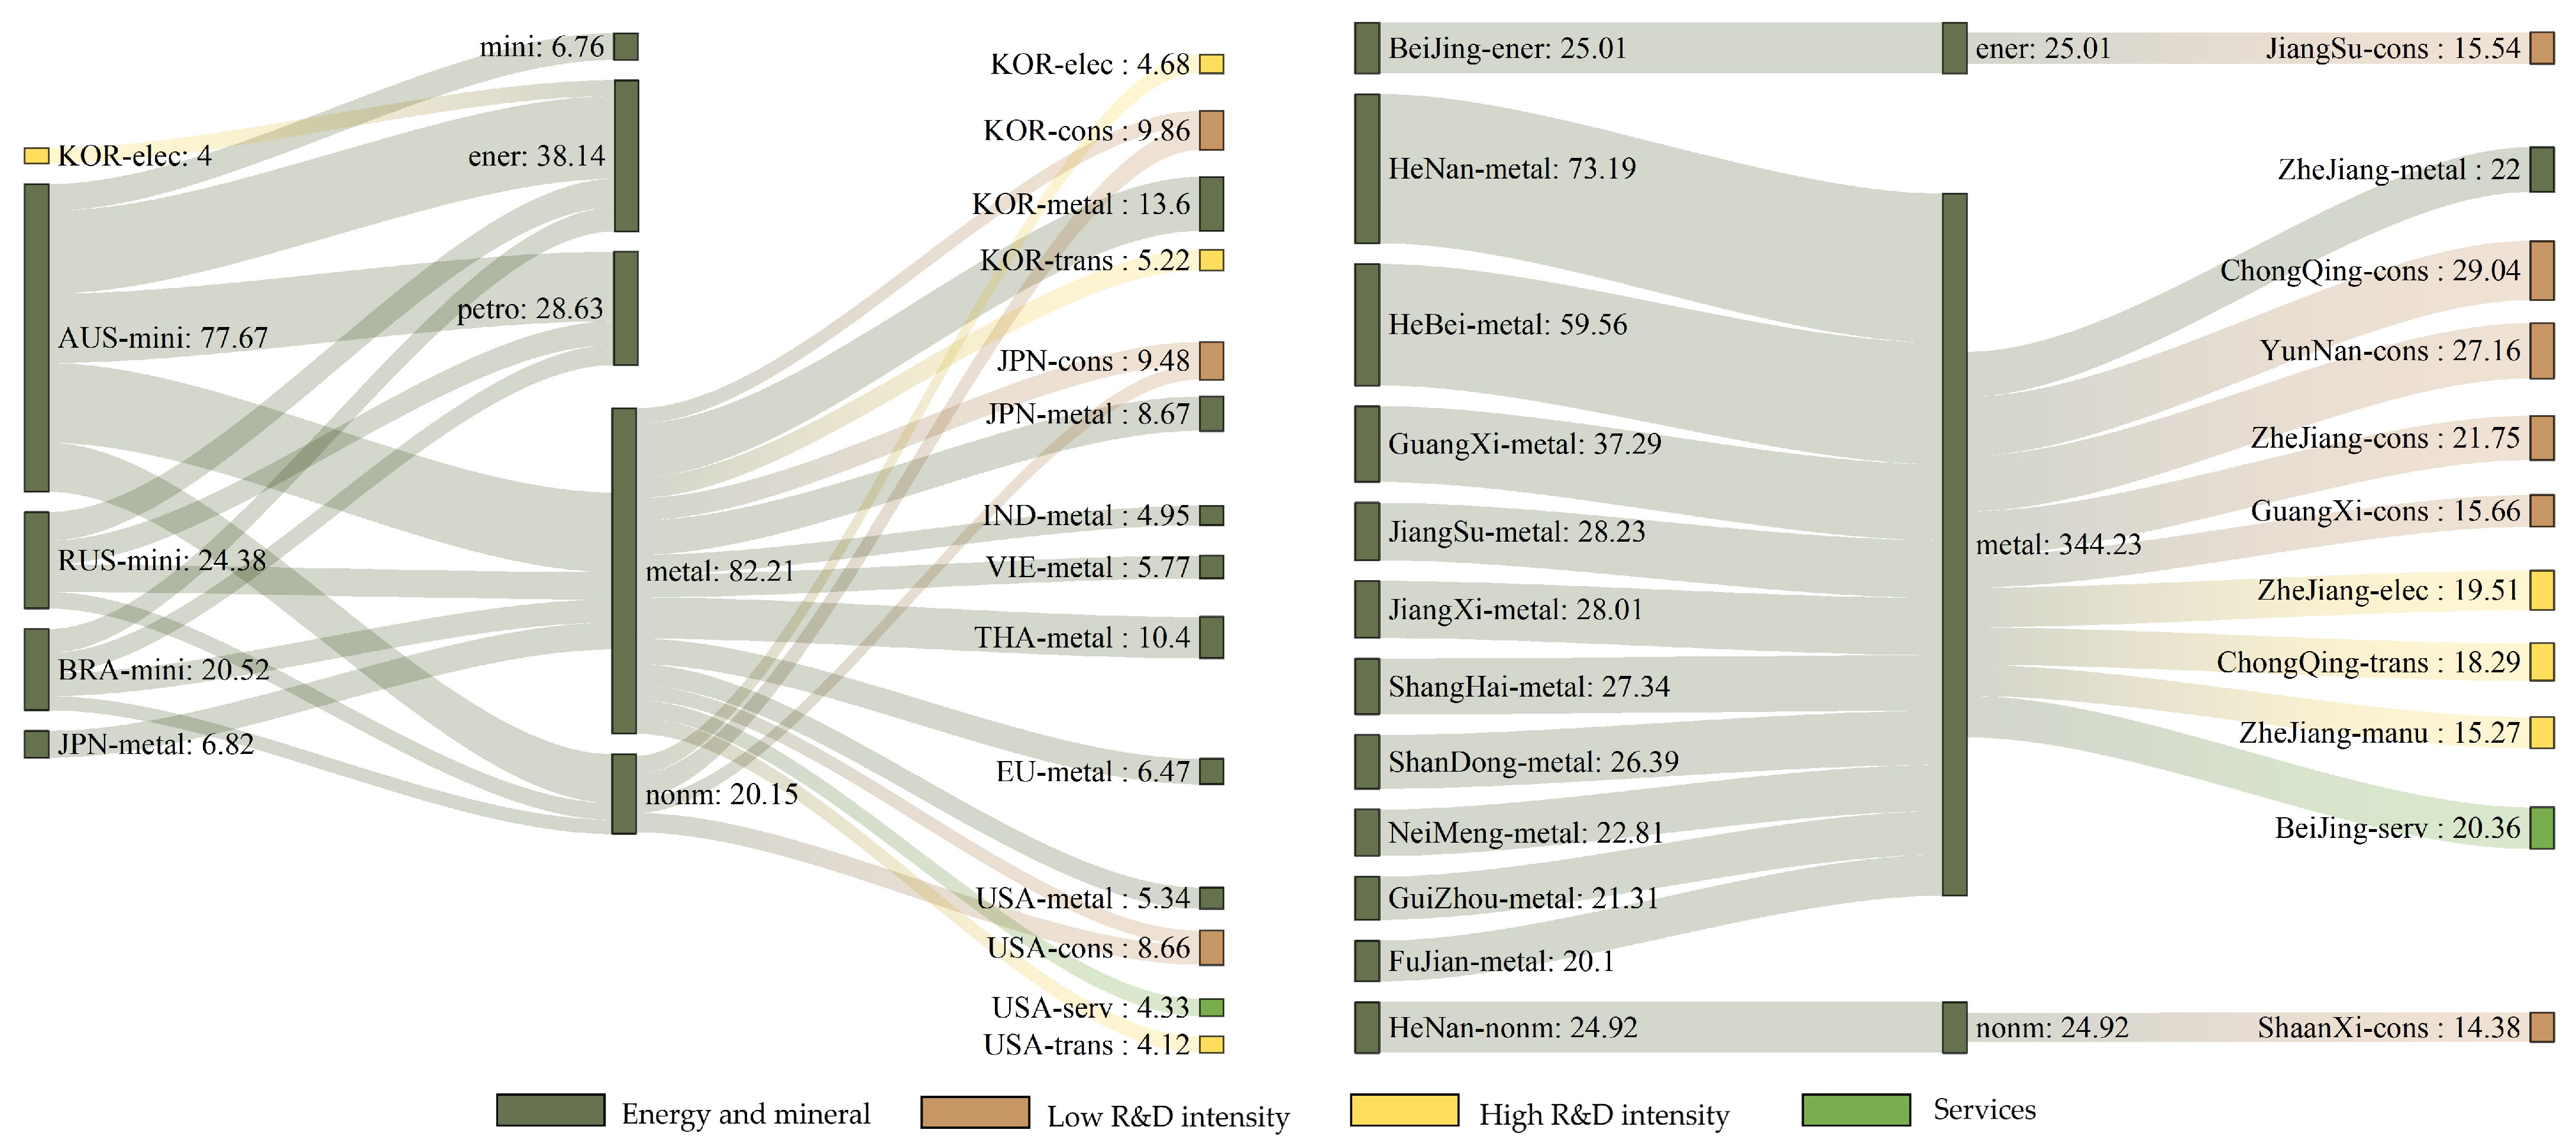
Figure 6. Global linkage paths for energy and minerals category in Guangdong.
Systems 14 00272 g006
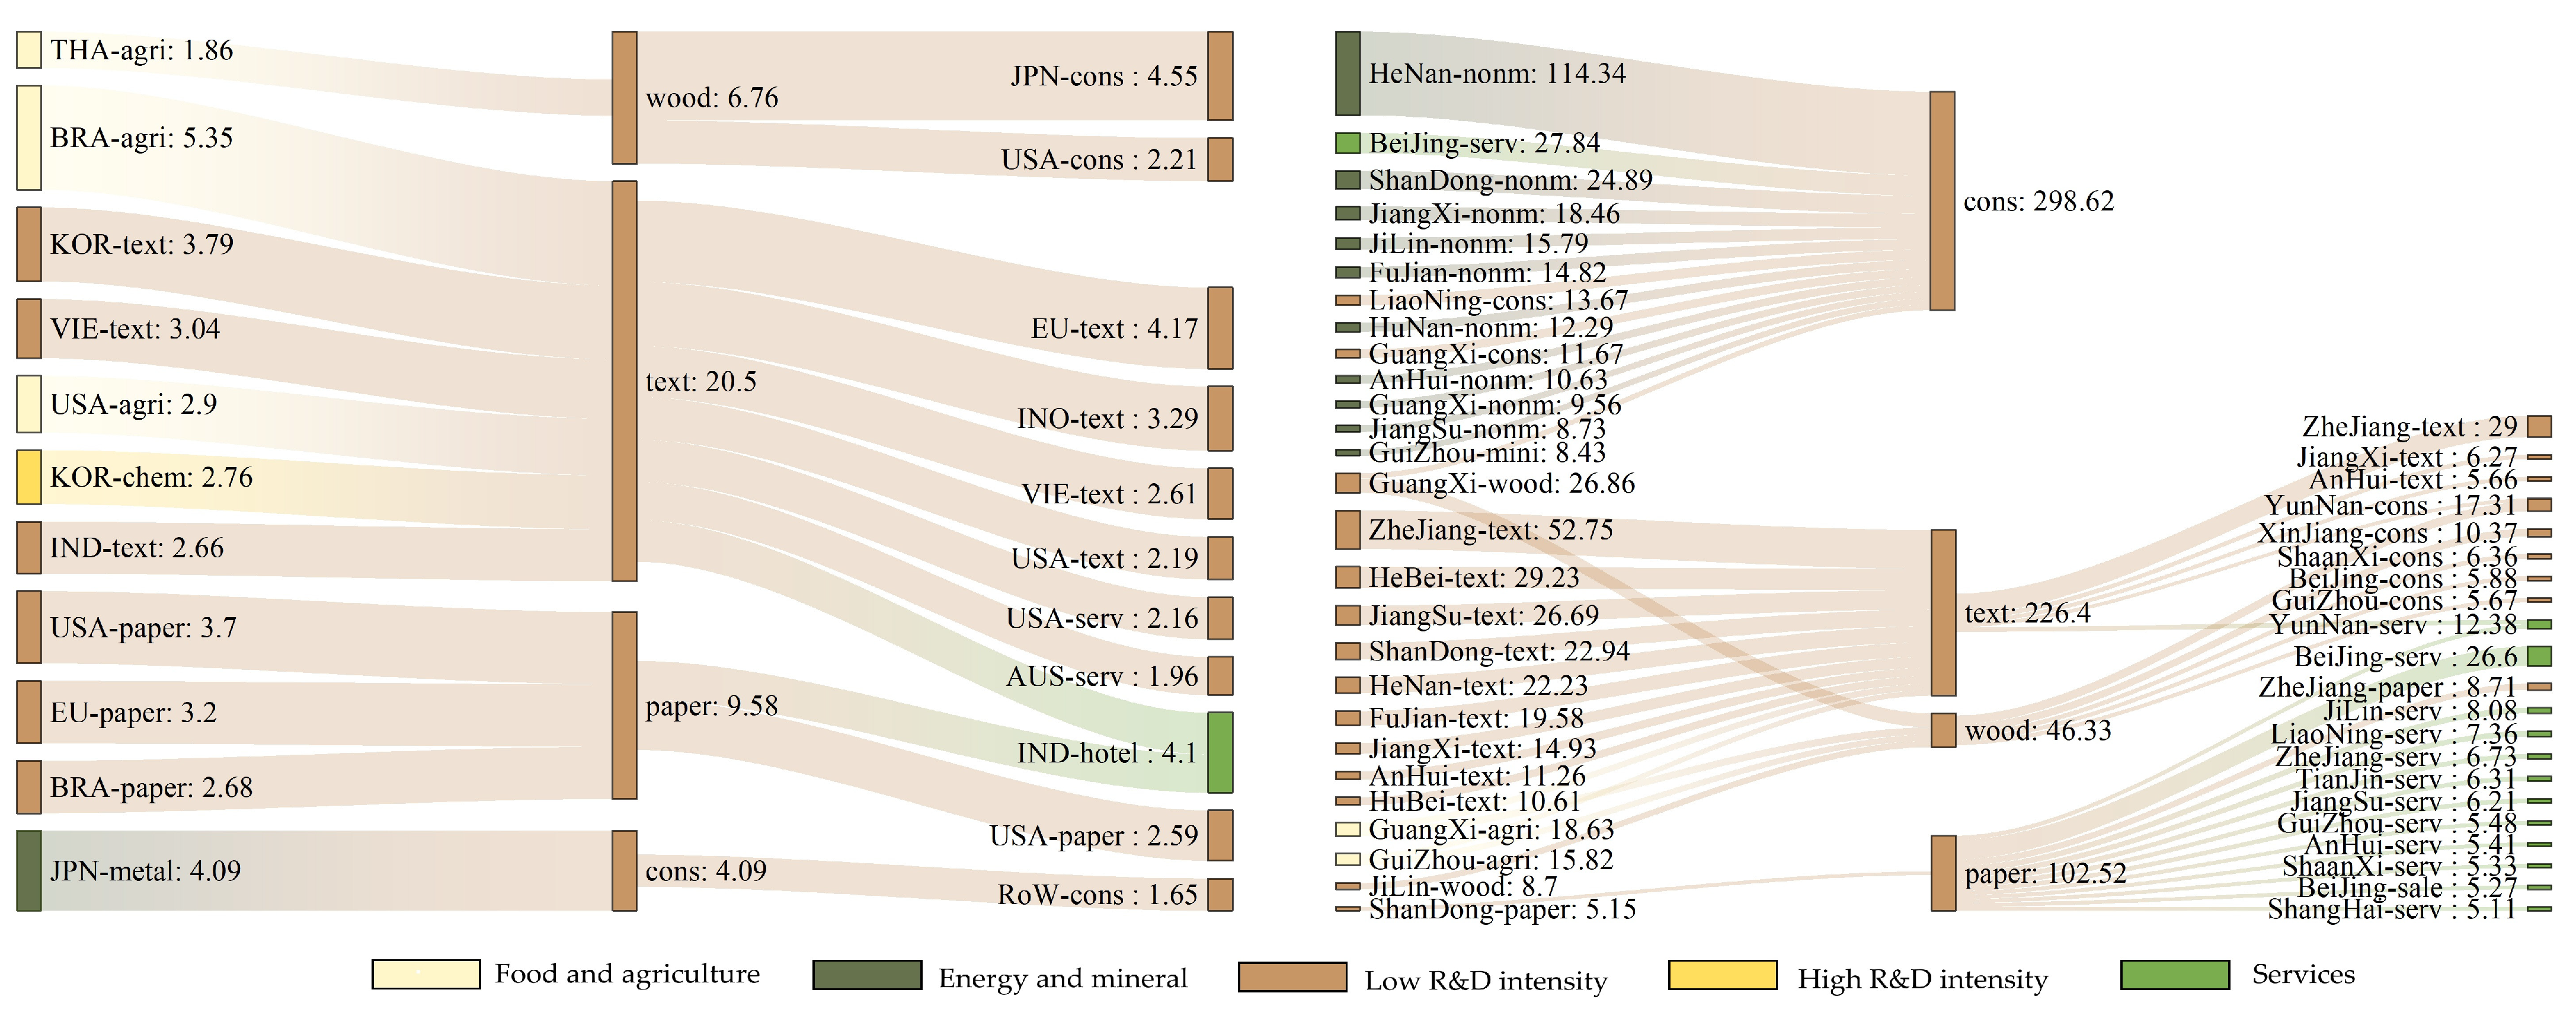
Figure 7. Global linkage paths for low-R&D-intensity category in Guangdong.
Systems 14 00272 g007

3.3.2. Service Category: An Export-Oriented Mode Featuring International Dominance and Domestic Support

Unlike the processing trade characteristics prevalent in manufacturing, Guangdong’s services sector exhibits an export-oriented linkage pattern defined by “international high-end demand leading and domestic supporting services.” The international linkages of Guangdong’s service sector are concentrated in developed economies, with the European Union, Germany, and the United States accounting for 45.2% of international outflows. Domestically, linkages focus on major economic provinces such as Jiangsu, Zhejiang, and Shanghai (Figure 5).
Specifically, the primary international pathway flows from Guangdong’s “other services” to the service sectors of the EU (USD 4.852 billion) and Germany (USD 4.215 billion). The primary domestic pathway flows from Guangdong’s wholesale and retail sector to Jiangsu’s electrical industry (USD 0.516 billion) and Zhejiang’s textile industry (USD 0.786 billion). Leveraging open policies and manufacturing cluster advantages, Guangdong’s service sector has developed export-oriented capabilities in wholesale, retail, and information technology services. Driven by robust international demand for high-end services and supported by basic services from the domestic market, the sector has already demonstrated a clear transition from domestic support to international spillover, emerging as a leading force in driving regional economic internationalization.

3.3.3. Energy and Minerals Category: A Processing-Oriented Mode Dominated by Domestic Ties and Synergized Internationally

As illustrated in Figure 6, the domestic linkages of Guangdong’s energy and minerals sector span resource-rich and processing-oriented provinces, while international linkages center on resource-rich and manufacturing-based nations. Domestic inflows are concentrated in major metal-producing provinces such as Henan, Hebei, and Guangxi, while outflows radiate to provinces with strong manufacturing and construction sectors like Zhejiang, Chongqing, and Yunnan. International inflows primarily originate from resource-rich countries including Australia, Russia, and Brazil, with outflows directed toward manufacturing nations such as South Korea, Thailand, and Japan. Spatial flows exhibit a cross-regional extension pattern featuring resource supply, processing, and consumption hubs, establishing a dual-processing pathway characterized by “domestic circulation dominance supplemented by international circulation.” This mode is driven by two primary factors: First, Guangdong faces a massive demand for metal products and energy despite a scarcity of local mineral resources; consequently, major domestic resource provinces provide a stable supply, while international resource nations bridge the supply gap. Second, Guangdong possesses significant advantages in metal processing industrial clusters, enabling the transformation of primary minerals into intermediate goods. This capability not only satisfies domestic infrastructure and manufacturing demands but also facilitates participation in the global division of labor for intermediate goods, thereby solidifying a processing-oriented mode.

3.3.4. Low-R&D-Intensity Category: A Traditional Mode Featuring Domestic Radiation and International Segmentation

The domestic linkages of Guangdong’s low-R&D-intensity sectors are concentrated in regions dense with textile and building material industries, while their international distribution spans traditional markets such as Southeast Asia, Europe, and the United States (see Figure 7). Domestic inflows are dominated by major textile provinces like Zhejiang, Hebei, and Jiangsu, with outflows radiating to provinces and cities nationwide. International inflows focus on countries with supporting textile industries, such as South Korea, Vietnam, and India, while outflows are concentrated in consumer markets like the European Union, the United States, and Southeast Asia. This presents a characteristic pattern of “comprehensive domestic radiation and international segmentation.” Specifically, the domestic pathway follows the trajectory: Zhejiang Textile → Guangdong Textile (USD 5.275 billion) → Yunnan Consumption (USD 0.510 billion), exhibiting a linkage mode of “textile-intensive provinces → Guangdong-based processing → nationwide consumption”. The international pathway follows: Brazil Agriculture/Forestry/Fishery → Guangdong Textile (USD 0.535 billion) and South Korea Textile → Guangdong Textile (USD 0.379 billion) → EU Textile (USD 0.417 billion), manifesting as a “raw material/supporting countries → Guangdong-based processing → overseas markets” linkage mode. Guangdong’s low-R&D-intensity industries leverage labor cost advantages and a solid industrial cluster foundation to undertake domestic raw material processing and international OEM (Original Equipment Manufacturer) orders. The massive demand from the domestic market supports stable industrial development, while the international market focus is placed on segmented fields to avoid high-end competition, thereby establishing a global embedding mode typical of traditional industries.

3.4. Global Linkage Model of Guangdong’s Industrial Categories

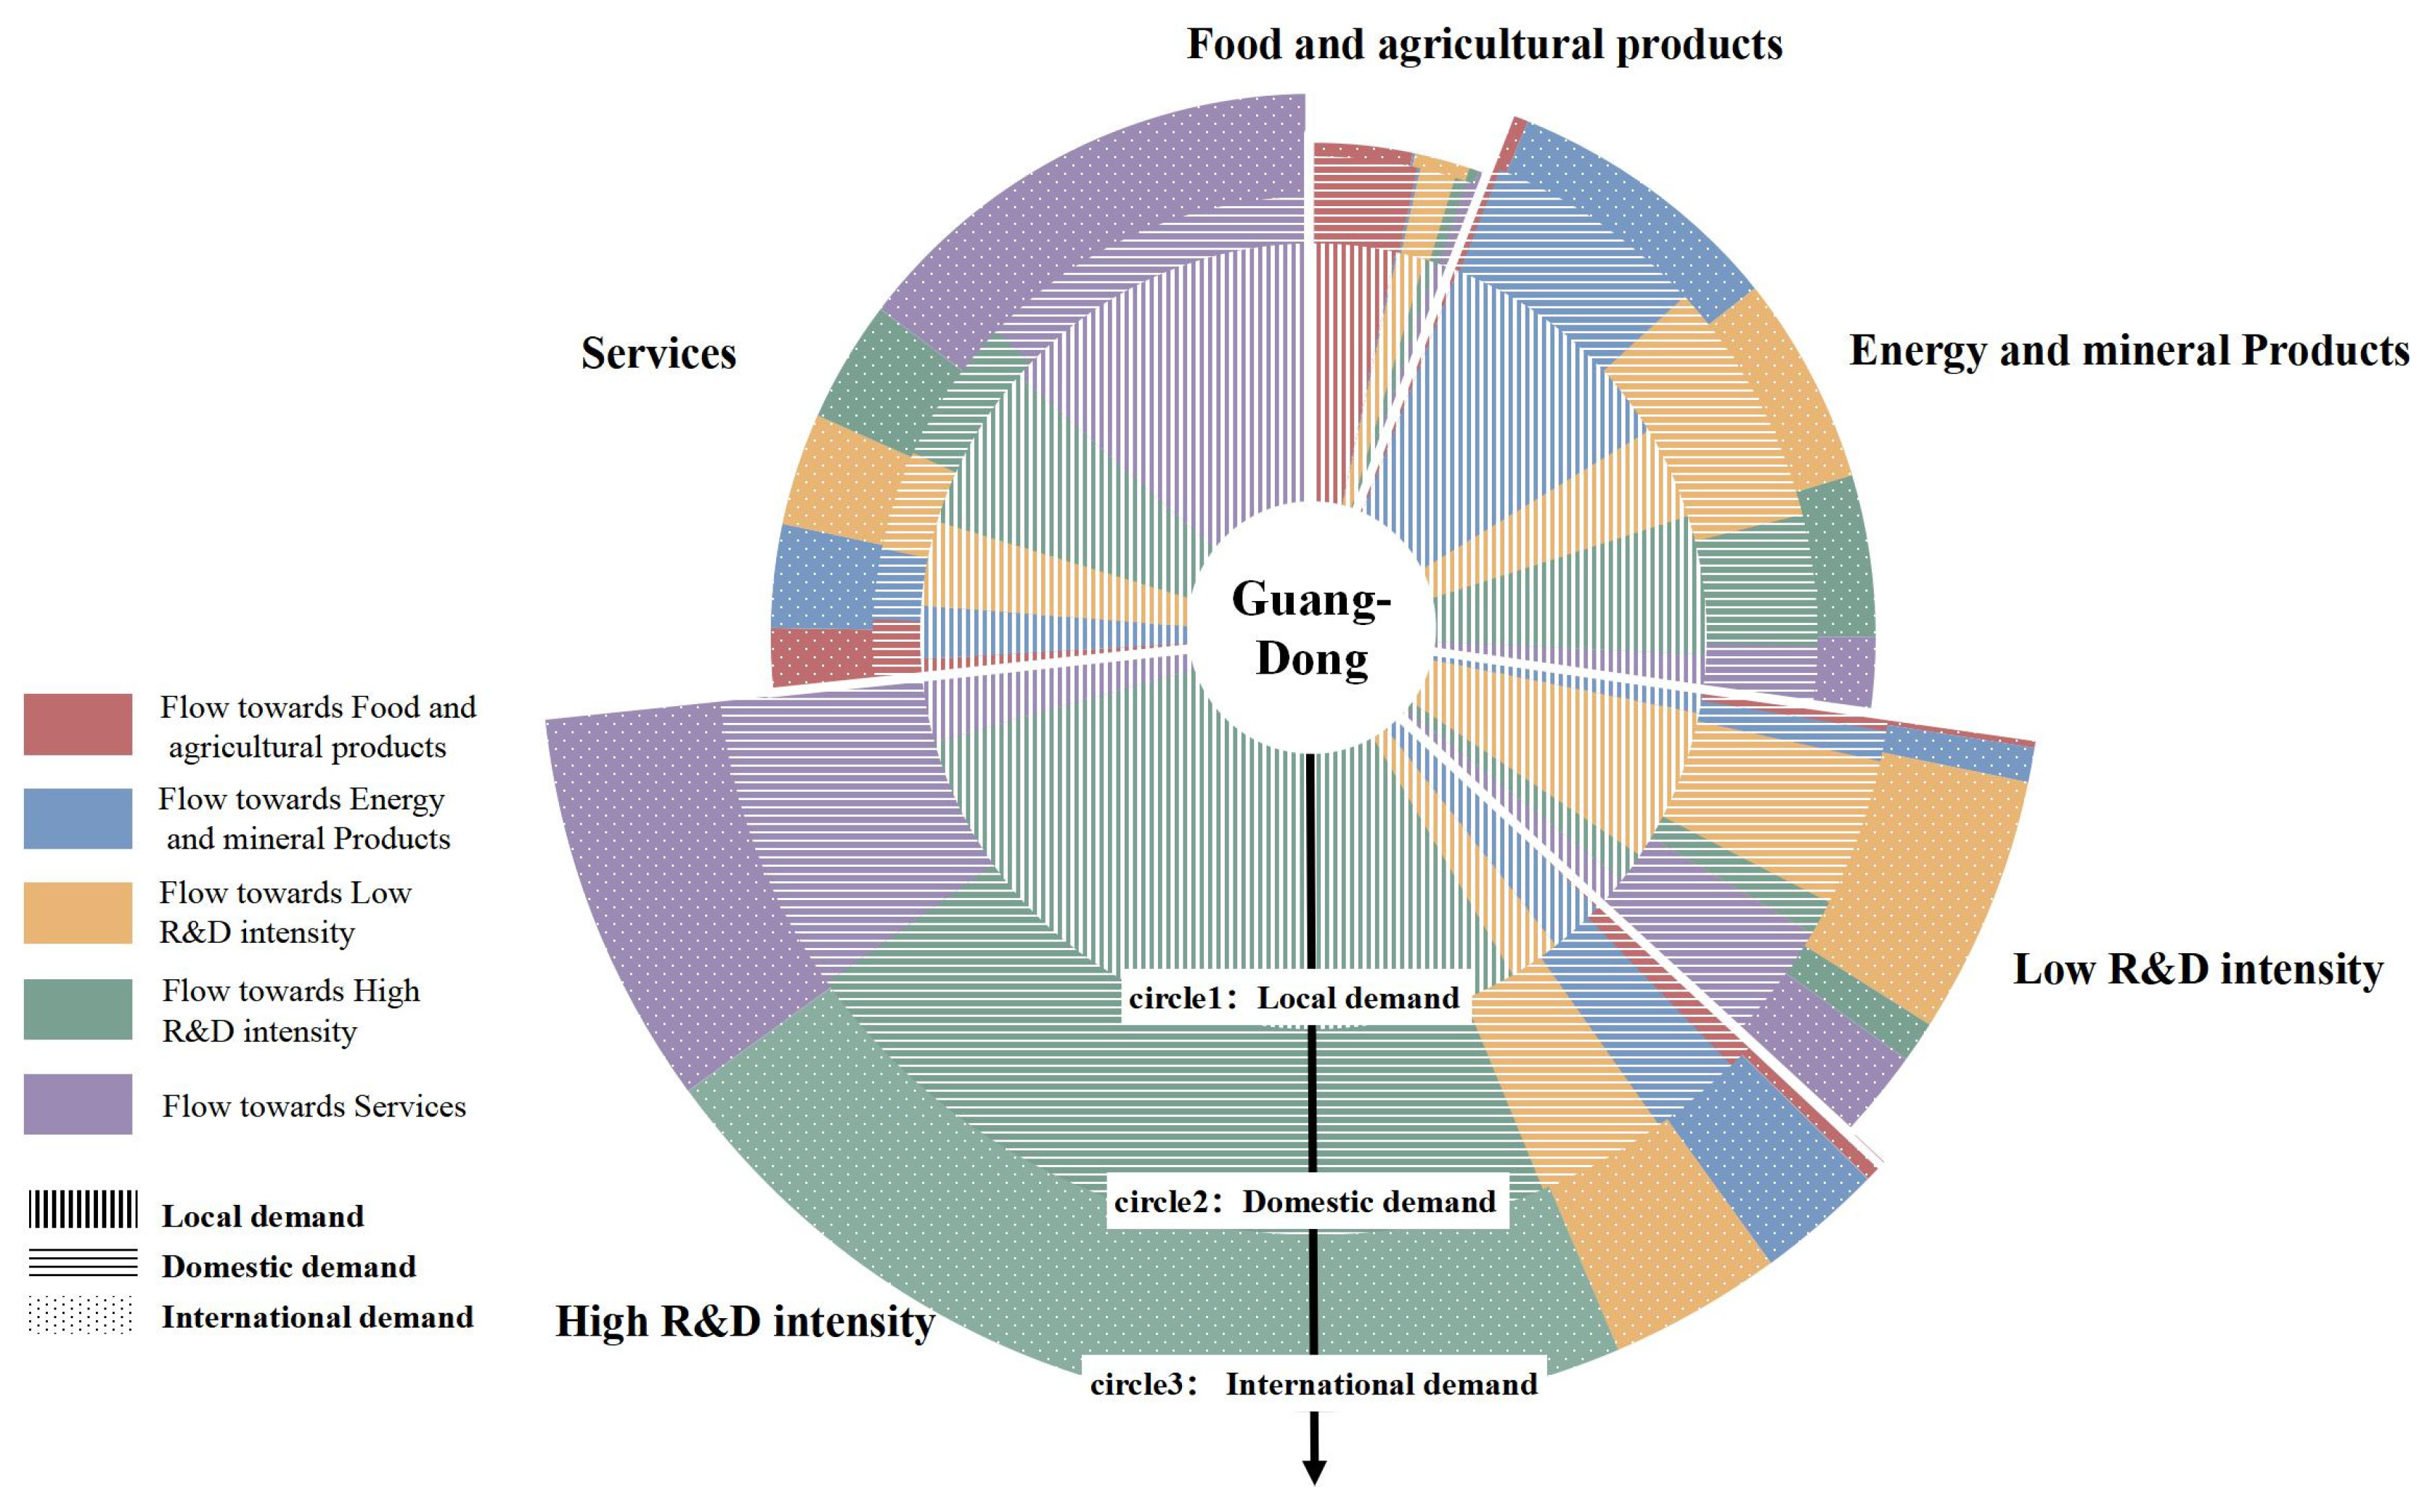
By further synthesizing the industrial flow directions and supply distribution ratios among five categories—agriculture and food, energy and minerals, low-R&D-intensity, high R&D-intensity, and services—across provincial, domestic, and international levels, this study highlights the supply–demand relationships and complex interaction patterns between localization and globalization (Figure 8). In the diagram, the three concentric layers from the interior to the exterior represent the following: (1) intra-provincial consumption and utilization; (2) Guangdong’s role within the national economy and its capacity to support other Chinese provinces; and (3) its export capabilities, position within global supply chains, and degree of dependence on international markets.
It is evident that high-R&D-intensity sectors serve as the core hub for Guangdong’s participation in global competition, manifesting significant “Dual Circulation” characteristics. As the largest category in terms of supply capacity (accounting for 36.5% of the total), it contributes the highest proportions of supply to both domestic (26.5%) and international (22.9%) markets, reflecting robust output capacity and global competitiveness and consistent with the characteristics of high-tech industries in global value chains. Locally, 79.8% of the high-R&D-intensity category’s output serves internal production processes, but this ratio drops to 58.7% across domestic and international scales, with significant demand growth from other categories, particularly the services category (22.4% domestically and 22.9% internationally). This reflects that the outward expansion of high-end manufacturing relies not only on technology exports but is also accompanied by a strong service-oriented transformation and a pronounced need for cross-sectoral synergy.
Simultaneously, Guangdong’s low-R&D-intensity sectors and services sectors exhibit distinct outward-oriented development trends. While the domestic–international mobility of low-R&D-intensity sectors is slightly lower than that of high-R&D-intensity sectors, they maintain particularly close linkages with domestic distribution industries and the construction sector. The services category ranks second in total supply capacity (26.6%), with 72.5% of output serving local demand. Uniquely, its international supply share (19.2%) exceeds domestic supply (8.3%), highlighting distinct outward-oriented characteristics and multi-layered supply capabilities, and maintaining tight connections with both high- and low-R&D-intensity categories across all three scales.
The food and agriculture category and energy and mineral category, as core resource support sectors, prioritize local service functions. Their international supply shares are the lowest among all categories (2.0% and 10.7%, respectively), with relatively limited supply to other provinces. This aligns with the logic that Guangdong, as a major economic province, must first ensure a stable local supply of food and energy. Locally, 47.8% of energy and mineral products are used for internal production, while 26.5% (e.g., metal products) are supplied to the high-R&D-intensity category. Domestically, the low-R&D-intensity category’s demand for energy and mineral products (36.9%) exceeds the category’s self-demand (33.2%), with the construction industry’s demand for metal and non-metallic minerals being the most prominent. This configuration reflects Guangdong’s tiered allocation logic as a major economic province: prioritizing the security of local and domestic resource supplies while leveraging these foundational sectors to support the export activities of midstream and downstream industries.
In summary, Guangdong has established a well-defined, multi-scalar industrial linkage pattern, with energy and food sectors serving as the foundational security base, high-R&D manufacturing acting as the spearhead for global competition, and highly outward-oriented services providing critical support. This model not only highlights the central position of Guangdong’s high-tech industries within global supply chains but also reflects the dynamic equilibrium of its industrial system between internal stability and external expansion.

4. Discussion

Findings from the nested-MRIO framework demonstrate that as a quintessential gateway region, Guangdong’s integration into the global system is not a binary choice between localization and globalization. Instead, it manifests as a multi-scalar nested structure across the “global-national-local” continuum. At the intra-provincial level, the system is driven by the “dual-core” of high-R&D-intensity industries and modern services, supported by a foundational base of energy, minerals, and low-R&D sectors. At the inter-provincial level, a domestic circulation chain has emerged, characterized by resource inflows and product outflows. At the international level, an open configuration exists, where high-end factor imports coexist with export-oriented outputs. These results suggest that the essence of a gateway region lies not merely in its trade volume but in its capacity to interface external shocks from global networks with the industrial organization of the domestic hinterland through specific linkages, thereby achieving functional coupling and spatial transmission across multiple scales.
Furthermore, the formation of this nested structure can be summarized by three interlocked “gateway intermediation mechanisms.” First, there is the endogenous dynamic mechanism of intra-provincial “service-manufacturing” synergy. With the emphasis on high-quality development in the “14th Five-Year Plan,” Guangdong is reducing transaction costs for manufacturing by strengthening the supply of local service factors (finance, logistics, and technology services), thereby constructing an “embedded” production network with self-repair capabilities within the province. Second, there is the spatial separation and value capture mechanism of “domestic resources–global markets.” Guangdong virtually outsources land- and energy-intensive links to resource hinterlands like Guangxi and Guizhou (evidenced by massive inputs of metals and agricultural products), thereby vacating local space to host high-value-added integration and R&D activities, forging a structured pathway of “domestic resource support—gateway processing and integration—national/global market radiation.” This cross-regional allocation of factors essentially represents Guangdong utilizing the depth of the domestic hinterland to support its competitive position in the global value chain. Third, there is the “asymmetric dependence” mechanism within the global value chain. Guangdong’s high-R&D industries exhibit a flow characteristic of “technology input from Japan/Korea—product output to Europe/US.” This indicates that while Guangdong performs critical conversion and assembly integration functions within GVCs, its control over the highest-value segments remains limited and its core technology chains still demonstrate a high degree of path dependence and potential lock-in risks on East Asian neighbors (Japan and South Korea).

5. Conclusions

Against the backdrop of globalization restructuring and intensifying de-globalization risks, understanding how regions embed into and respond to global systems through multi-scalar industrial linkages is a pivotal issue in explaining the high-quality development of open economies. By constructing a nested-MRIO model, this study systematically reveals the industrial linkage patterns of Guangdong—a quintessential “gateway region”—across the “global-national-local” scales. The results indicate the following: First, Guangdong overall exhibits a nested linkage pattern characterized by strong local services and extensive global connectivity. At the intra-provincial level, high-R&D-intensity sectors (such as ‘elec’) and the service sectors constitute the core hubs of internal flows, while energy and mineral sectors, and low-R&D sectors provide the foundational support, collectively forming a multi-sectoral synergistic industrial network. On this basis, this study further identifies two primary cross-category linkage paths: (1) an infrastructure-driven path supplied by non-metallic minerals for construction, supporting large-scale provincial infrastructure development, and (2) a high-end manufacturing support path supplied by metal products for optoelectronic manufacturing, empowering the upgrading of high-end manufacturing. These reflect the dual driving factors of infrastructure expansion and high-tech manufacturing dominance in the province. Second, significant sectoral heterogeneity exists within linkage patterns, which can be categorized into four types: resource-oriented industries (food/agriculture, energy/minerals) adopt a “local security + domestic supplementation” resource-security-oriented mode with minimal international flow; high-R&D-intensity industries implement an innovation-driven dual-circulation mode, deeply integrating into both domestic and global value chains with balanced inflows and outflows; low-R&D-intensity industries rely on a cost-competitive regional division mode, focusing on domestic market supply; and the service sector exhibits an export-oriented service support mode, where the scale of international trade is double that of domestic trade. Finally, the provincial nested linkage pattern of “domestic inter-provincial cooperation + international linkage” highlights Guangdong’s bridging role as a foreign trade gateway. This spatial division logic of “internal-external synergy and dual circulation” enhances industrial resilience and global competitiveness.
Theoretically, this study deepens the understanding of the core intermediary role played by “Gateway Regions” in the global evolution of human–economic relations, contributing new insights to the fields of global–local interaction and regional industrial networks. First, by employing the nested-MRIO framework to unpack the black box of the national scale, this study rediscovers regional heterogeneity. It demonstrates that sub-national gateway regions are not merely microcosms of the national economy [24,26,27] but rather possess distinct multi-scalar organizational capabilities and differentiated functional portfolios [27]. Consequently, understanding global–local interactions requires introducing an operational nested layer between the national and local scales to explain how external shocks penetrate boundaries along specific industrial chains and impact specific domestic hinterlands. Second, this study redefines the “World Factory” role, marking a shift from passive assembly to active radiation. While the prevailing literature often characterizes coastal open regions as “processing enclaves” reliant on low-cost factors and external markets [4,12], our data indicate that Guangdong is transitioning from a sole passive assembler into an active hub, capable of bidirectional radiation toward both domestic hinterlands and international markets, thereby demonstrating strong regional agency. Third, by advancing from abstract linkages to specific pathways, this study concretizes the telecoupling effects discussed in existing research. By identifying four specific industrial linkage modes, such as resource-security and innovation-driven modes, we translate abstract coupling concepts into comparable paths and structures. For instance, we clearly traced the specific chain of “Australian minerals—Guangdong processing—Domestic infrastructure.” This precise characterization of the structure and direction of flows enriches our understanding of regional resilience in open systems, providing quantitative evidence for decoding the micro-mechanisms of global–local response.
In terms of practice and policy, this study offers targeted insights for building resilience in open economies based on Guangdong’s industrial development characteristics. First, a multi-level, differentiated industrial policy system should be implemented according to the different gateway regional linkage modes. For instance, for resource-oriented industries, a three-tier security system of “local reserve + domestic supplementation + international emergency response” should be constructed to ensure supply stability amidst global risks. For innovation-driven industries, institutional convenience should be provided in free trade zones and cross-border R&D cooperation. For the export-oriented service mode, pilot programs for opening up the service sector should be further expanded to promote the gateway’s upgrade from a “cargo hub” to a “service hub.” Second, strategic inter-regional linkages based on complementary capabilities should be strengthened, guiding regions to identify partners with complementary capabilities, both domestically and internationally [50]. For example, Guangdong should establish targeted cooperation mechanisms with domestic central and western resource provinces, the Yangtze River Delta innovation highlands, and technological frontiers like Japan, South Korea, and the EU, enhancing the complexity and competitiveness of the overall industrial chain through complementary capabilities. Third, multi-level policy synergy mechanisms should be established to avoid policy conflict [51]. It is recommended to establish a “National-Provincial-Municipal” industrial policy coordination mechanism under national strategic platforms like the Guangdong–Hong Kong–Macao Greater Bay Area. This should clarify the responsibilities and resource allocation of governments at all levels, particularly in areas such as R&D cooperation, joint park construction, and supply chain security, to form a combined policy force. Finally, attention must be paid to capacity building and linkage opportunities for peripheral regions. Based on the identification of local high-potential industries, participation in the opening-up process should be enhanced through strategic network embedding rather than mere industrial relocation, thereby preventing marginalization within the multi-tiered division of labor.
Although this study has revealed the structural characteristics and operational mechanisms of industrial linkages in gateway regions within open economies from a multi-scalar perspective, certain limitations remain that require further deepening in future research. First, this study focuses primarily on the single case of Guangdong. Future research could extend to cross-regional comparisons with the Yangtze River Delta, the Beijing–Tianjin–Hebei region, or trade gateways in other emerging-market countries to verify the universality and heterogeneity of the “gateway-driven mode.” Second, constrained by the temporal span of data, this study mainly presents static structural characteristics. Future research could incorporate long-time-series data to conduct dynamic evolutionary analyses and capture the trajectory of industrial chain restructuring. Finally, while this study emphasizes the flow of economic factors, future research could further integrate environmental factors such as carbon emissions and water resources, as well as social equity indicators, into the nested-MRIO framework. This would construct a more comprehensive analytical system to explore the comprehensive effects of globalized industrial activities from the perspective of “coupled human-environment systems.”

Supplementary Materials

The following supporting information can be downloaded at: https://www.mdpi.com/article/10.3390/systems14030272/s1.

Author Contributions

Conceptualization, W.Z. and Y.L.; methodology, L.M. and C.Z.; validation, W.Z.; formal analysis, L.M. and C.Z.; investigation, X.Q.; resources, W.Z.; data curation, L.M.; writing—original draft preparation, L.M.; writing—review and editing, X.Q. and W.Z.; visualization, L.M. and C.Z.; supervision, Y.L. and W.Z.; funding acquisition, Y.L. All authors have read and agreed to the published version of the manuscript.

Funding

This research was funded by the National Natural Science Foundation of China, grant number 42130712; the National Natural Science Foundation of China, grant number 42301192; and the Natural Science Foundation of Tianjin, grant number 25JCYBJC00010.

Data Availability Statement

The original contributions presented in this study are included in the article/Supplementary Materials. Further inquiries can be directed to the corresponding author.

Conflicts of Interest

Chaoyu Zhang is from Meituan Inc., Beijing, China. The remaining authors declare there are no conflicts of interest.

References

  1. Liu, Y.; Yang, Y.; Kang, L.; Wang, Y. Human-environment system in the Guangdong-Hong Kong-Macao Greater Bay Area: Global model and local response. Geogr. Res. 2020, 39, 1949–1957. (In Chinese) [Google Scholar] [CrossRef]
  2. Henderson, J.; Dicken, P.; Hess, M.; Coe, N.; Yeung, H.W.C. Global production networks and the analysis of economic development. Rev. Int. Polit. Econ. 2002, 9, 436–464. [Google Scholar] [CrossRef]
  3. Dicken, P. Global Shift: Reshaping the Global Economic Map in the 21st Century; Sage Publications: London, UK, 2003. [Google Scholar]
  4. Coe, N.M.; Hess, M.; Yeung, H.W.C.; Dicken, P.; Henderson, J.; Martin, R. Globalizing Regional Development: A Global Production Networks Perspective; Ashgate Publishing: Aldershot, UK, 2008. [Google Scholar]
  5. Yeung, H.W.C.; Coe, N.M. Toward a dynamic theory of global production networks. Econ. Geogr. 2015, 91, 29–58. [Google Scholar] [CrossRef]
  6. Horner, R. Beyond facilitator? State roles in global value chains and global production networks. Geogr. Compass 2017, 11, e12307. [Google Scholar] [CrossRef]
  7. Wang, Z.; Wei, S.J.; Yu, X.; Zhu, K. Global value chains over business cycles. J. Int. Money Financ. 2022, 126, 102643. [Google Scholar] [CrossRef]
  8. Ma, E.; Cai, J.; Han, Y.; Liao, L.; Lin, J. Research progress and prospect of telecoupling of Human-Earth system. Prog. Geogr. 2020, 39, 310–326. (In Chinese) [Google Scholar] [CrossRef]
  9. Fang, C.; Zhou, C.; Gu, C.; Chen, L.; Li, S. Theoretical analysis of interactive coupled effects between urbanization and eco-environment in mega-urban agglomerations. Acta Geogr. Sin. 2016, 71, 531–550. (In Chinese) [Google Scholar] [CrossRef]
  10. Massey, D. Space, Place and Gender; University of Minnesota Press: Minneapolis, MN, USA, 1994. [Google Scholar]
  11. He, C.; Ma, X. Economic globalization research based on scale-construction in western human geography. Prog. Geogr. 2015, 34, 1073–1083. [Google Scholar] [CrossRef]
  12. Du, D. Research on Location Patterns of Multinational Corporations’ R&D Globalization; Fudan University Press: Shanghai, China, 2001. (In Chinese) [Google Scholar]
  13. Dicken, P. The Roepke Lecture in Economic Geography Global-Local Tensions: Firms and States in the Global Space-Economy. Econ. Geogr. 1994, 70, 101–128. [Google Scholar] [CrossRef]
  14. Yeung, H.W.C. Global production networks and foreign direct investment by small and medium enterprises in ASEAN. Transnatl. Corp. 2017, 24, 1–42. [Google Scholar] [CrossRef]
  15. Coe, N.M.; Yeung, H.W.C. Global production networks: Mapping recent conceptual developments. J. Econ. Geogr. 2019, 19, 775–801. [Google Scholar] [CrossRef]
  16. Yang, C. Interconnected worlds: Global electronics and production networks in East Asia, by Henry Wai-chung Yeung. Reg. Stud. 2023, 57, 397–398. [Google Scholar] [CrossRef]
  17. Coe, N.M.; Hess, M.; Yeung, H.W.C.; Dicken, P.; Henderson, J. ‘Globalizing’ regional development: A global production networks perspective. Trans. Inst. Br. Geogr. 2004, 29, 468–484. [Google Scholar] [CrossRef]
  18. Evans, W.; Chenery, H.; Clark, P.; Cao-Pinna, V. The Structure and Growth of the Italian Economy. Econometrica 1955, 23, 110. [Google Scholar] [CrossRef]
  19. Moses, L.N. The Stability of Interregional Trading Patterns and Input-Output Analysis. Am. Econ. Rev. 1955, 45, 803–832. [Google Scholar]
  20. Liu, Q.; Okamoto, N. Establishing inter-region input-output model of China and its problems. Stat. Res. 2002, 9, 58–64. (In Chinese) [Google Scholar]
  21. Roy, J.R. Regional input-output analysis, data and uncertainty. Ann. Reg. Sci. 2004, 38, 397–412. [Google Scholar] [CrossRef]
  22. Lenzen, M.; Pade, L.L.; Munksgaard, J. CO2 multipliers in multi-region input-output models. Econ. Syst. Res. 2004, 16, 391–412. [Google Scholar] [CrossRef]
  23. Pan, W.; Li, Z. Feedback and spillover effects between coastal and non-coastal regions of China. Stat. Res. 2007, 5, 68–77. (In Chinese) [Google Scholar]
  24. Mi, Z.; Meng, J.; Guan, D.; Shan, Y.; Song, M.; Wei, Y.-M.; Liu, Z.; Hubacek, K. Chinese CO2 emission flows have reversed since the global financial crisis. Nat. Commun. 2017, 8, 1712. [Google Scholar] [CrossRef]
  25. Yang, Y.; Qu, S.; Cai, B.; Liang, S.; Wang, Z.; Wang, J.; Xu, M. Mapping global carbon footprint in China. Nat. Commun. 2020, 11, 2237. [Google Scholar] [CrossRef]
  26. White, D.J.; Hubacek, K.; Feng, K.; Sun, L.; Meng, B. The Water-Energy-Food Nexus in East Asia: A tele-connected value chain analysis using inter-regional input-output analysis. Appl. Energy 2017, 210, 550–567. [Google Scholar] [CrossRef]
  27. Campos, R.G.; Pienknagura, S.; Timini, J. How Far has Globalization Gone? A Tale of Two Regions. Rev. Int. Econ. 2025, 33, 556–578. [Google Scholar] [CrossRef]
  28. Dietzenbacher, E. Interregional multipliers: Looking backward, looking forward. Reg. Stud. 2002, 36, 125–136. [Google Scholar] [CrossRef]
  29. Yeung, H.W.C. Governing the market in a globalizing era: Developmental states, global production networks and inter-firm dynamics in East Asia. Rev. Int. Polit. Econ. 2014, 21, 70–101. [Google Scholar] [CrossRef]
  30. Wang, W.; He, C. Relational economic geography and trade network research. Prog. Geogr. 2022, 41, 461–476. (In Chinese) [Google Scholar] [CrossRef]
  31. Burghardt, A.F. A Hypothesis about Gateway Cities. Ann. Assoc. Am. Geogr. 1971, 61, 269–285. [Google Scholar] [CrossRef]
  32. Breul, M.; Diez, J.R.; Sambodo, M.T. Filtering strategic coupling: Territorial intermediaries in oil and gas global production networks in Southeast Asia. J. Econ. Geogr. 2018, 19, 829–851. [Google Scholar] [CrossRef]
  33. Li, C.; Ng, M.K.; Tang, Y.; Fung, T. From a ‘World Factory’ to China’s Bay Area: A Review of the Outline of the Development Plan for the Guangdong-Hong Kong-Macao Greater Bay Area. Plan. Theory Pract. 2022, 23, 310–314. [Google Scholar] [CrossRef]
  34. Du, Z.; Zhang, H.; Huang, G.; Jin, L. Local State Responses to Crisis-Induced Shrinkage in the World’s Factory Dongguan, China: Regional Resilience Perspective. J. Urban Plan. Dev. 2021, 147, 04021033. [Google Scholar] [CrossRef]
  35. Wang, S.; Wang, Y.; Zhao, Y. Spatial spillover effects and multi-mechanism for regional development in Guangdong province since 1990s. J. Geogr. Sci. 2015, 70, 965–979. (In Chinese) [Google Scholar] [CrossRef]
  36. Xu, J.; Ye, J.; Lin, C.; Liu, X.; Yang, F.; Luo, Z. Relational characteristics between high-technology firms in the Pearl River Delta and the empowerment for technological innovation by Hong Kong and influencing factors. J. Geogr. Sci. 2024, 79, 1521–1539. (In Chinese) [Google Scholar] [CrossRef]
  37. Zhang, L.; Wang, Z. Guangdong-Hong Kong-Macao Greater Bay Area: Evolution, Reference and Strategic Suggestion. Reform. Strategy 2018, 34, 73–77. (In Chinese) [Google Scholar]
  38. Zhang, S. Discussion on the Developing Path and Construction Strategies of Guangdong-Hong Kong-Macao Greater Bay Area: Based on the Comparative Study Among Three Global Bay Areas. China Dev. 2018, 18, 53–59. (In Chinese) [Google Scholar]
  39. Hutzschenreuter, T.; Matt, T.; Kleindienst, I. Going subnational: A literature review and research agenda. J. World Bus. 2020, 55, 101076. [Google Scholar] [CrossRef]
  40. Hou, X.; Zheng, J.; He, M.; Feng, G.; He, K.; Ma, T.; Coffman, D.; Mi, Z.; Wang, S. A multi-regional input-output database linking Chinese subnational regions and global economies. Sci. Data 2025, 12, 1761. [Google Scholar] [CrossRef]
  41. Croft, S.A.; West, C.D.; Green, J.M.H. Capturing the heterogeneity of sub-national production in global trade flows. J. Clean. Prod. 2018, 203, 1106–1118. [Google Scholar] [CrossRef]
  42. Li, J.; Zhang, Z.; Liang, D.; Ouyang, Q.; Tian, P.; Guan, D.; Zheng, H. China’s Provincial Multi-Regional Input-Output Database for 2018 and 2020. Sci. Data 2026, 13, 222. [Google Scholar] [CrossRef] [PubMed]
  43. Huang, Y.; Lin, C.; Liu, S.; Tang, H. Trade networks and firm value: Evidence from the U.S.-China trade war. J. Int. Econ. 2023, 145, 103811. [Google Scholar] [CrossRef]
  44. James, H. Deglobalization: The rise of disembedded unilateralism. Annu. Rev. Financ. Econ. 2018, 10, 219–237. [Google Scholar] [CrossRef]
  45. Fedorenko, R.; Yakhneeva, I.; Zaychikova, N.; Lipinsky, D. Evaluating the Socio-Economic Factors Impacting Foreign Trade Development in Port Areas. Sustainability 2021, 13, 8447. [Google Scholar] [CrossRef]
  46. Jin, L.; Chen, J.; Sheu, J.-B.; Zhou, H.; Jian, Y.; Yu, B. Impacts of national strategies on gateway ports: An empirical study in the Bohai Rim. Transp. Policy 2022, 117, 1–11. [Google Scholar] [CrossRef]
  47. Chen, X.; Yang, C. Input-Output Technology; Science Press: Beijing, China, 2011. (In Chinese) [Google Scholar]
  48. Grimes, S.; Du, D. China’s emerging role in the global semiconductor value chain. Telecommun. Policy 2022, 46, 101959. [Google Scholar] [CrossRef]
  49. Ren, Y.; Yang, Y. Spatial distribution and location correlation of the semiconductor industry in the Pearl River Delta region. Prog. Geogr. 2022, 41, 1622–1634. (In Chinese) [Google Scholar] [CrossRef]
  50. Balland, P.-A.; Boschma, R. Complementary interregional linkages and Smart Specialisation: An empirical study on European regions. Reg. Stud. 2021, 55, 1059–1070. [Google Scholar] [CrossRef]
  51. Bellandi, M.; Caloffi, A. Industrial policies in a Marshallian-based multilevel perspective. Eur. Plan. Stud. 2016, 24, 687–703. [Google Scholar] [CrossRef]
Figure 1. Multi-scale MRIO model. In the figure, i and j denote different Chinese provinces and municipalities, while r represents various countries and regions worldwide. Green blocks signify intra-national input-output relationships within China, whereas blue blocks represent cross-border relationships between China and the rest of the world. Specifically, Z i j represents the intermediate input matrix from province i to province j of China; F i r denotes the final demand matrix from province i of China to country r; V i stands for the value-added matrix of province i of China; X i denotes the total output matrix of province i of China.
Systems 14 00272 g001
Figure 2. Internal linkage path of Guangdong’s industrial categories. AGRI, MINI, LR&D, HR&D, and SERV represent the five industry categories: food and agriculture, energy and mineral, low-R&D-intensity, high-R&D-intensity, and services, respectively. Full names of industry abbreviations are provided in the Supplementary Materials.
Systems 14 00272 g002
Figure 3. Flow characteristics of Guangdong’s interprovincial and international exchange.
Systems 14 00272 g003
Figure 4. Global linkage paths for high-R&D-intensity category in Guangdong. The middle layer represents the specific receiving industry within Guangdong that processes products from each industry. The left and right layers represent the source and destination regions and industries for the exchange of products between Guangdong and external regions. The flow from the first layer to the second layer indicates which regions and industries supply the products for producing that industry’s goods in Guangdong. In contrast, the flow from the second layer to the third layer shows which regions and industries utilize Guangdong’s corresponding category products. Different colors denote distinct industry categories. Figure 5, Figure 6 and Figure 7 follow the same legend.
Systems 14 00272 g004
Figure 8. Global link ring structure of Guangdong’s industrial categories. The concentric ring diagram comprises three layers: the innermost layer (Circle 1) represents sectors satisfying local demands; the intermediate layer (Circle 2) denotes Guangdong’s supply to other domestic regions; and the outermost layer (Circle 3) signifies the portion flowing into international markets. To highlight supply characteristics across different spatial scales, the radius of the layer serving local needs is standardized to one unit. Accordingly, the radii for the domestic supply and international flow layers are scaled in proportion to the volume of the local service component.
Systems 14 00272 g008
Disclaimer/Publisher’s Note: The statements, opinions and data contained in all publications are solely those of the individual author(s) and contributor(s) and not of MDPI and/or the editor(s). MDPI and/or the editor(s) disclaim responsibility for any injury to people or property resulting from any ideas, methods, instructions or products referred to in the content.