Article

Research on Simulation and Structural Optimization of Integrated Crop–Livestock Systems in Jilin Province

College of Biological and Agricultural Engineering, Jilin University, Changchun 130025, China
*
Authors to whom correspondence should be addressed.
Systems 2026, 14(3), 254; https://doi.org/10.3390/systems14030254
Submission received: 24 January 2026 / Revised: 23 February 2026 / Accepted: 25 February 2026 / Published: 28 February 2026
(This article belongs to the Special Issue Systems Thinking and Modelling in Socio-Economic Systems)

Abstract

The integrated crop–livestock farming model not only enhances resource utilization efficiency and reduces environmental pollution but also serves as a vital pathway for promoting sustainable agricultural development. System dynamics models enable in-depth analysis of dynamic system changes. Therefore, in this study, we constructed a comprehensive system dynamics model for the combination of farming and raising in Jilin Province, and used Vensim-PLE software(Version 6.3) to simulate and predict the dynamic changes of the agricultural structure and the future development trend based on the data of the planting and raising industry from 2006 to 2021. The results of the study show that: (1) It is expected that by 2035, the grain crop production, cash crop production, hog and beef cattle output, as well as the utilization of straw and livestock and poultry manure in Jilin Province will increase significantly. And the livestock and poultry manure load warning value reaches 0.35, which does not pose a threat to the environment. (2) By setting the simulation structure optimization analysis, it is found that the integrated crop-livestock systems performs the best in terms of economic, social, ecological and environmental benefits. (3) In 2035, Jilin Province should control the total crop planting area within 7250 thousand hectares, the number of hog output should not exceed 25 million, and the number of beef cattle slaughtered should not exceed 4.25 million, so as to ensure that the early warning value of livestock and poultry fecal matter loading is lower than 0.4, and to achieve the balance of farming and maximize economic benefits. Finally, this paper proposes policy recommendations to optimize crop structures, develop precision farming and aquaculture technologies, establish resource recycling projects, and strengthen policy support and technology promotion.

1. Introduction

Agriculture is a critical domain for achieving global sustainable development [1,2]. Sustainable agricultural development requires safeguarding food security while protecting the ecological environment [3]. Rapid economic and population growth have imposed higher demands on both the quantity and quality of food production, driving agriculture toward more intensive development [4,5]. However, this intensification often leads to the separation of crop and livestock systems [6]. This not only reduces natural resource utilization efficiency, but also results in issues such as frequent tillage in cropping systems, excessive chemical use, and waste accumulation in livestock farming [7]. These issues ultimately lead to increased production costs [6], declining soil nutrient levels [8], soil erosion [9], greenhouse gas emissions [10], climate change [11], biodiversity loss [12], and other negative impacts. To address these challenges, the integrated crop–livestock systems are recognized as a key strategy for advancing sustainable agriculture. In integrated crop–livestock systems, crops provide feed for livestock, while livestock supply manure fertilizer for crop production. This integration facilitates the recycling of resources within the system, enhancing nutrient cycling and energy efficiency while maintaining production profitability and improving stability [13,14]. The European Union has enacted policies to promote the use of straw as a biomass resource and to enhance manure recycling, thereby alleviating the separation of crop cultivation and animal husbandry, balancing nutrient cycles, and fostering efficient resource utilization [15,16].
Reconsidering the relationship between animal husbandry and crop cultivation is crucial for green, sustainable development. Despite global progress, China still faces severe challenges in addressing the separation of crop farming and animal husbandry [17,18,19]. From 1986 to 2017, the proportion of households practicing integrated crop–livestock farming significantly declined from 71% to 12% [7]. To meet grain demand, China’s grain production increased from 304.76 million tons in 1978 to 695.41 million tons in 2023, while the total arable land area did not expand significantly [20]. Fertilizer application has surged from 8.84 million tons to 50.792 million tons, with China’s fertilizer consumption accounting for 35% of global fertilizer use [21]. The significant increase in grain production is due to a substantial rise in fertilizer application, which leads to soil degradation and water pollution. Additionally, the comprehensive utilization rate of corn stalks and the recovery rate of livestock and poultry manure in rural China remain low, resulting in significant resource wastage and environmental pollution issues [22,23,24].
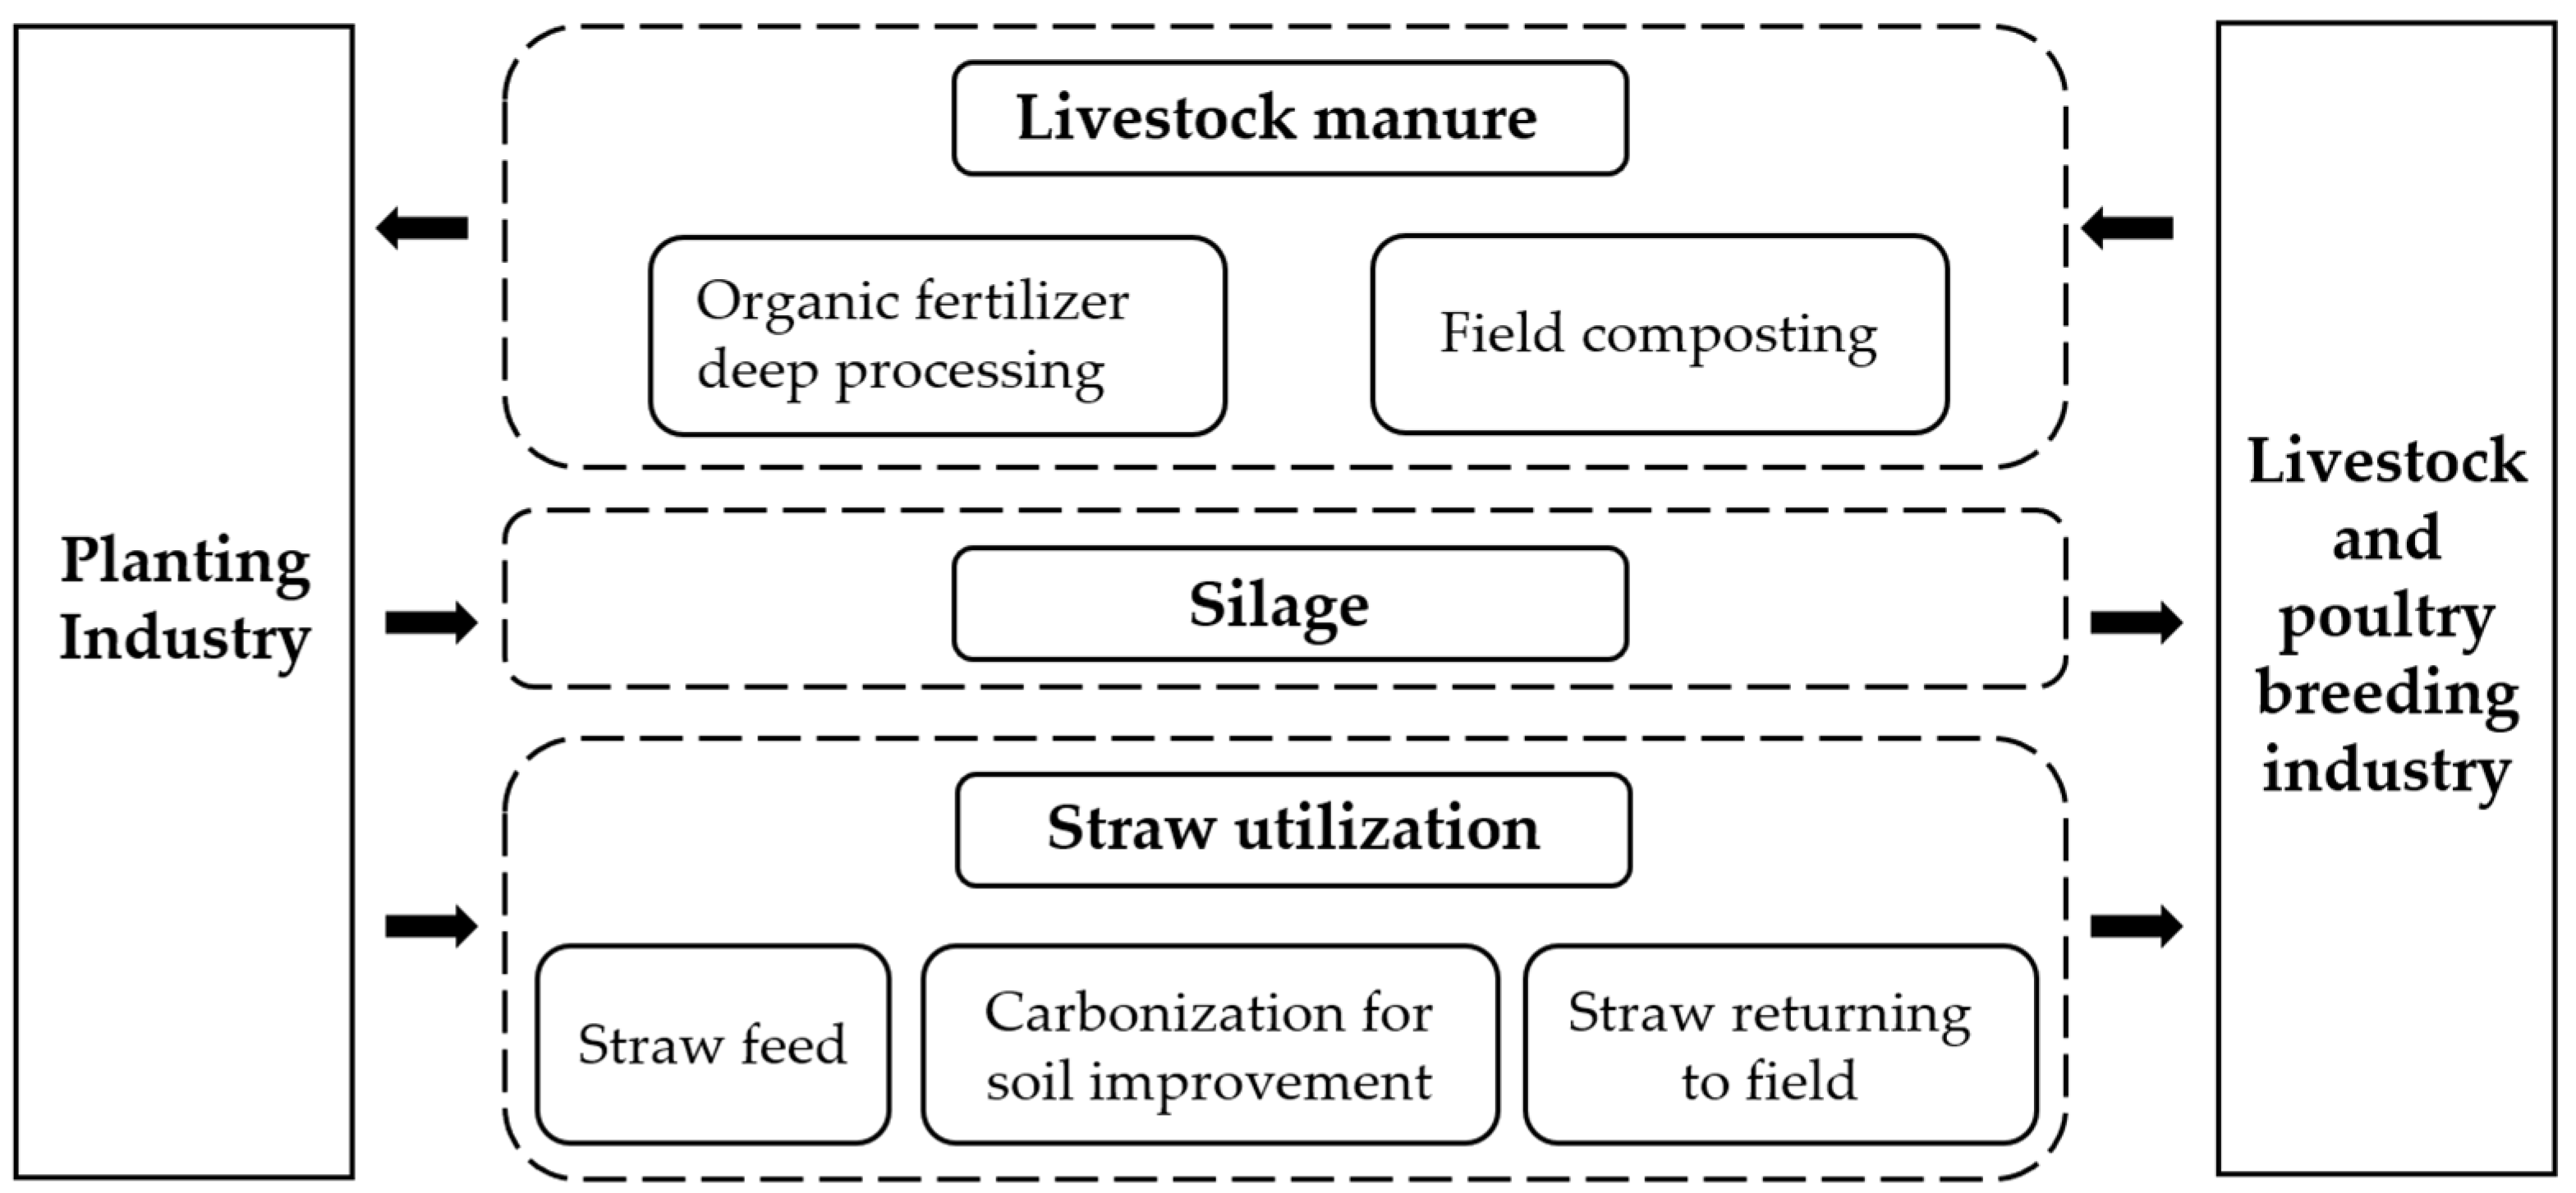
As the Chinese government increasingly prioritizes ecological and environmental protection, China is shifting its agricultural focus from merely boosting output to enhancing the sustainability of production [25]. Jilin Province, located in Northeast China, bears the crucial responsibility of ensuring food security as a leading producer of corn and livestock. It also faces constraints in safeguarding its resources and environment. Jilin’s primary integrated crop–livestock system involves comprehensive straw utilization and on-site manure recycling, as illustrated in Figure 1. Reconstructing the link between crop cultivation and animal husbandry at the regional scale can enhance agricultural productivity, achieve efficient resource recycling, and promote ecological sustainability in Jilin.
Current research on integrated crop–livestock systems remains predominantly focused on static calculations, with limited studies on model simulation and forecasting. At the same time, meso-level research that integrates local data for specific regions like Jilin Province remains scarce. Based on this, this paper constructs a comprehensive system dynamics model for integrated crop–livestock systems in Jilin Province. Using Vensim-PLE software, it simulates dynamic changes in agricultural structures and forecasts future development trends. Four simulation scenarios are established for structural optimization analysis: rapid economic development, stable production with increased income, expanded livestock scale, and comprehensive integrated crop–livestock systems. Through multi-scenario analysis and policy recommendations, this study aims to support the green and sustainable development of agriculture in Jilin Province.

2. Literature Review

Different regions worldwide face distinct challenges in implementing the separation of animal husbandry and crop cultivation. Developed countries in Europe and America grapple with soil degradation, agricultural nonpoint source pollution, biodiversity loss, and ecosystem degradation [26]. Sub-Saharan Africa and Asia focus on challenges such as growing food demand, water scarcity, and climate change [27]. China places particular emphasis on mitigating nonpoint source pollution [4]. Addressing these agricultural challenges is urgent, requiring not only technical solutions but also the promotion of scientific farming models. So, integrated crop–livestock systems have emerged as a promising approach. Integrated crop–livestock systems primarily utilize animal manure as organic fertilizer or crop products as animal feed, leveraging synergies between planting and livestock systems to enhance the self-sufficiency and sustainability of agricultural systems. Scholars explore specific integrated crop–livestock cycling models, influencing factors, evaluation methods, and their impacts on socio-economic benefits and ecological environments from ecological economics and circular economy perspectives [28].
Regarding integrated crop–livestock recycling models, research has primarily focused on the comprehensive utilization of crop residues [29,30,31], resource utilization of organic fertilizers [21,32], integrated crop–livestock farms [33], and rice-field integrated farming systems [34,35]. Stakeholders involved in integrated crop–livestock systems include farmers and third-party institutions. Individual characteristics, household conditions, and external environments are considered key drivers of adoption. External environmental factors encompass spatial proximity, technical support, credit availability, and neighbors’ opinions [36]. Existing research evaluating specific patterns often treats these practices in isolation rather than as interconnected components within broader regional agroecological systems.
Energy value analysis [28,37], data envelopment analysis [38,39], and life cycle assessment [40,41,42,43] are the most commonly used methods for quantitatively evaluating agroforestry. Additionally, scholars have employed system modeling and system dynamics to analyze the comprehensive benefits of agroforestry [44,45]. Although static tools such as LCA and DEA are highly effective in assessing past or current operational efficiency and environmental impacts, they cannot capture these dynamic interactions over time nor predict how systems will evolve under different future conditions. In contrast, System Dynamics models are particularly well-suited for long-term planning.
The socio-economic benefits of integrated crop–livestock systems are primarily reflected in increased yield [46], higher net income and improved production efficiency [47,48], reduced production costs, diversification of production and market risks [49], and the creation of more attractive employment opportunities [41]. Their environmental benefits are evident in the ability of integrated systems to reduce inorganic nitrogen concentrations and losses [12,50,51], thereby effectively mitigating nutrient runoff. Straw return to the field increases soil organic carbon, improves soil structure and nutrient availability, and promotes long-term soil health [31,52]. Recycling and reusing livestock and poultry manure can substantially reduce agricultural non-point source pollution [53]. Moreover, these systems contribute to ammonia emission reduction, carbon sequestration, and climate change mitigation, with cumulative N2O emissions reduced by 59% and overall greenhouse gas emissions decreased by 28.09–41.32% [54,55].
In summary, a review of relevant literature indicates that research on integrated crop–livestock systems primarily focuses on two aspects: comprehensive utilization of crop residues and resourceful utilization of manure. While specific models vary across regions, they all emphasize the economic and ecological benefits generated. Most studies employ the life cycle assessment method to measure environmental impacts throughout the entire cycle, but research on modeling and predicting integrated crop–livestock systems remains limited. Therefore, by shifting from fragmented, static assessments to a comprehensive System Dynamics (SD) approach, this study fills these critical gaps. This study summarizes domestic theoretical analyses and model types of integrated crop–livestock farming. Based on the current development status of integrated farming in Jilin Province, it employs a system dynamics model to simulate the integrated system. The model simulates numerical conditions in Jilin Province from 2006 to 2035, sets multiple scenario objectives, optimizes policies, and proposes corresponding countermeasures. This provides a basis for the green and sustainable development of agriculture in Jilin Province.

3. Materials and Methods

3.1. Study Area and Data Sources

Jilin Province is located in the central part of Northeast China, covering a total area of 187,400 square kilometers, making it the second-largest province in Northeast China by area. In 2022, the province’s cropland area reached 6226.4 thousand hectares, primarily cultivated with corn, wheat, and soybeans. The region falls within the mid-temperate zone, featuring an annual average temperature of 6.3 °C and annual precipitation of 818.9 mm, predominantly concentrated between June and September. The total area of forest land, grassland, and wetlands is 144.9609 million mu, with a forest coverage rate of 45.27% [56]. The province possesses relatively abundant forest and water resources and is a major national grain production area.
According to data from the Third National Land Survey, Jilin Province has a total cultivated land area of 112.4775 million mu, accounting for 5.86% of China’s total cultivated land. The black soil area covers approximately 1.1 million hectares, with black soil cultivated land spanning about 832,000 hectares—representing 15.6% of the province’s total cultivated land. Grain production in the black soil region constitutes over half of the province’s total output. Per capita arable land stands at 3.05 mu, more than double the national average and roughly equivalent to the global average. In 2022, Jilin’s corn, rice, and soybean yields reached 32.5786 million tons, 6.8091 million tons, and 0.7994 million tons, respectively. The straw-to-grain ratios for rice, corn, and soybeans were 1.0, 1.2, and 1.6, with a harvestability coefficient of 0.89 for all crops. The calculated straw yield for these three crops totaled 42.1331 million tons. Alongside its abundant grain production, Jilin Province possesses substantial straw resources.
Jilin Province is not only a key national commercial grain production base but also a major livestock-raising province. By the end of 2022, the province had 4.0195 million heads of large livestock, including 3.903 million heads of cattle. The year-end livestock inventory comprised 11.9024 million pigs, 6.8748 million sheep, and 155.7781 million poultry. Livestock and poultry farming in Jilin Province maintains a relatively stable scale with consistent annual growth trends, inevitably generating substantial livestock and poultry manure resources during production. In summary, as a major grain-producing province, Jilin possesses abundant straw resources that can provide ample forage for ruminant livestock under integrated crop–livestock systems. With vast agricultural land, high overall land carrying capacity, and well-developed livestock farming, the province holds significant advantages for advancing integrated crop–livestock agriculture.
The primary study period for simulating and modeling historical trend changes in Jilin Province’s integrated crop–livestock systems spans from 2006 to 2021, with the projection period covering 2022 to 2035. Data for some indicators in 2022 is missing, and the statistical methodology differs from previous years. To ensure data completeness and accuracy, the historical trend analysis period was selected as 2006–2021. The historical data from 2006 to 2021 primarily originates from three sources: First, official statistical yearbooks such as the China Statistical Yearbook, China Rural Statistical Yearbook, and Jilin Statistical Yearbook. Second, official statistical results from the National Bureau of Statistics website, the Jilin Provincial Statistical Bulletin on National Economic and Social Development, and the Jilin Provincial Land Survey Key Data Bulleti. Third, calculations derived from existing academic papers. Total livestock and poultry manure production was calculated based on livestock numbers and methodologies from Wang (2023) [57]. Straw resource volume and collection volume were calculated based on crop yields and methodologies from Wang (2022) [58]. The livestock and poultry manure load warning values were calculated using the formula from Huang (2020) [53]. The livestock and poultry manure load warning value indicates the environmental carrying capacity for livestock farming, calculated using the formula developed by Huang (2020) [53].

3.2. Methods

System dynamics (SD) is a discipline that studies information feedback systems [59]. It employs both qualitative and quantitative approaches to analyze complex systemic issues and conduct simulation-based forecasting, capable of handling high-order, nonlinear, and multi-feedback complex dynamics at both micro and macro levels. Widely applied to complex systems in economics, society, technology, and ecology, it is suitable for optimizing system design and addressing management challenges involving long development cycles, dynamic changes, and multi-system feedback interactions [60]. The integrated crop–livestock system is a complex ecological agricultural system involving multiple variables and interactions, such as crop planting area and yield, livestock numbers, and resource recycling. The advantages of system dynamics align with the modeling requirements of this study. Applying the SD model to study Jilin Province’s integrated crop–livestock systems enables in-depth analysis of system dynamics, providing scientific foundations for achieving efficient, sustainable, and environmentally friendly agricultural production. This advances Jilin’s agricultural modernization and ecological civilization development. By constructing diverse simulation scenarios to forecast future trends, it delivers evidence-based decision support for policymakers and agricultural producers.
System dynamics modeling involves the following steps: (1) Define the purpose of establishing the system model and determine the system boundaries. (2) Analyze the system structure, identify variables, and construct a causal diagram. (3) Develop a system stock–flow diagram and define parameters and equations. (4) Conduct model validation and refinement by adjusting parameters and structure based on empirical data to enhance accuracy. (5) Perform simulation and optimization analysis, evaluate simulation trends, and propose corresponding policy optimization recommendations.

3.2.1. Modeling Framework

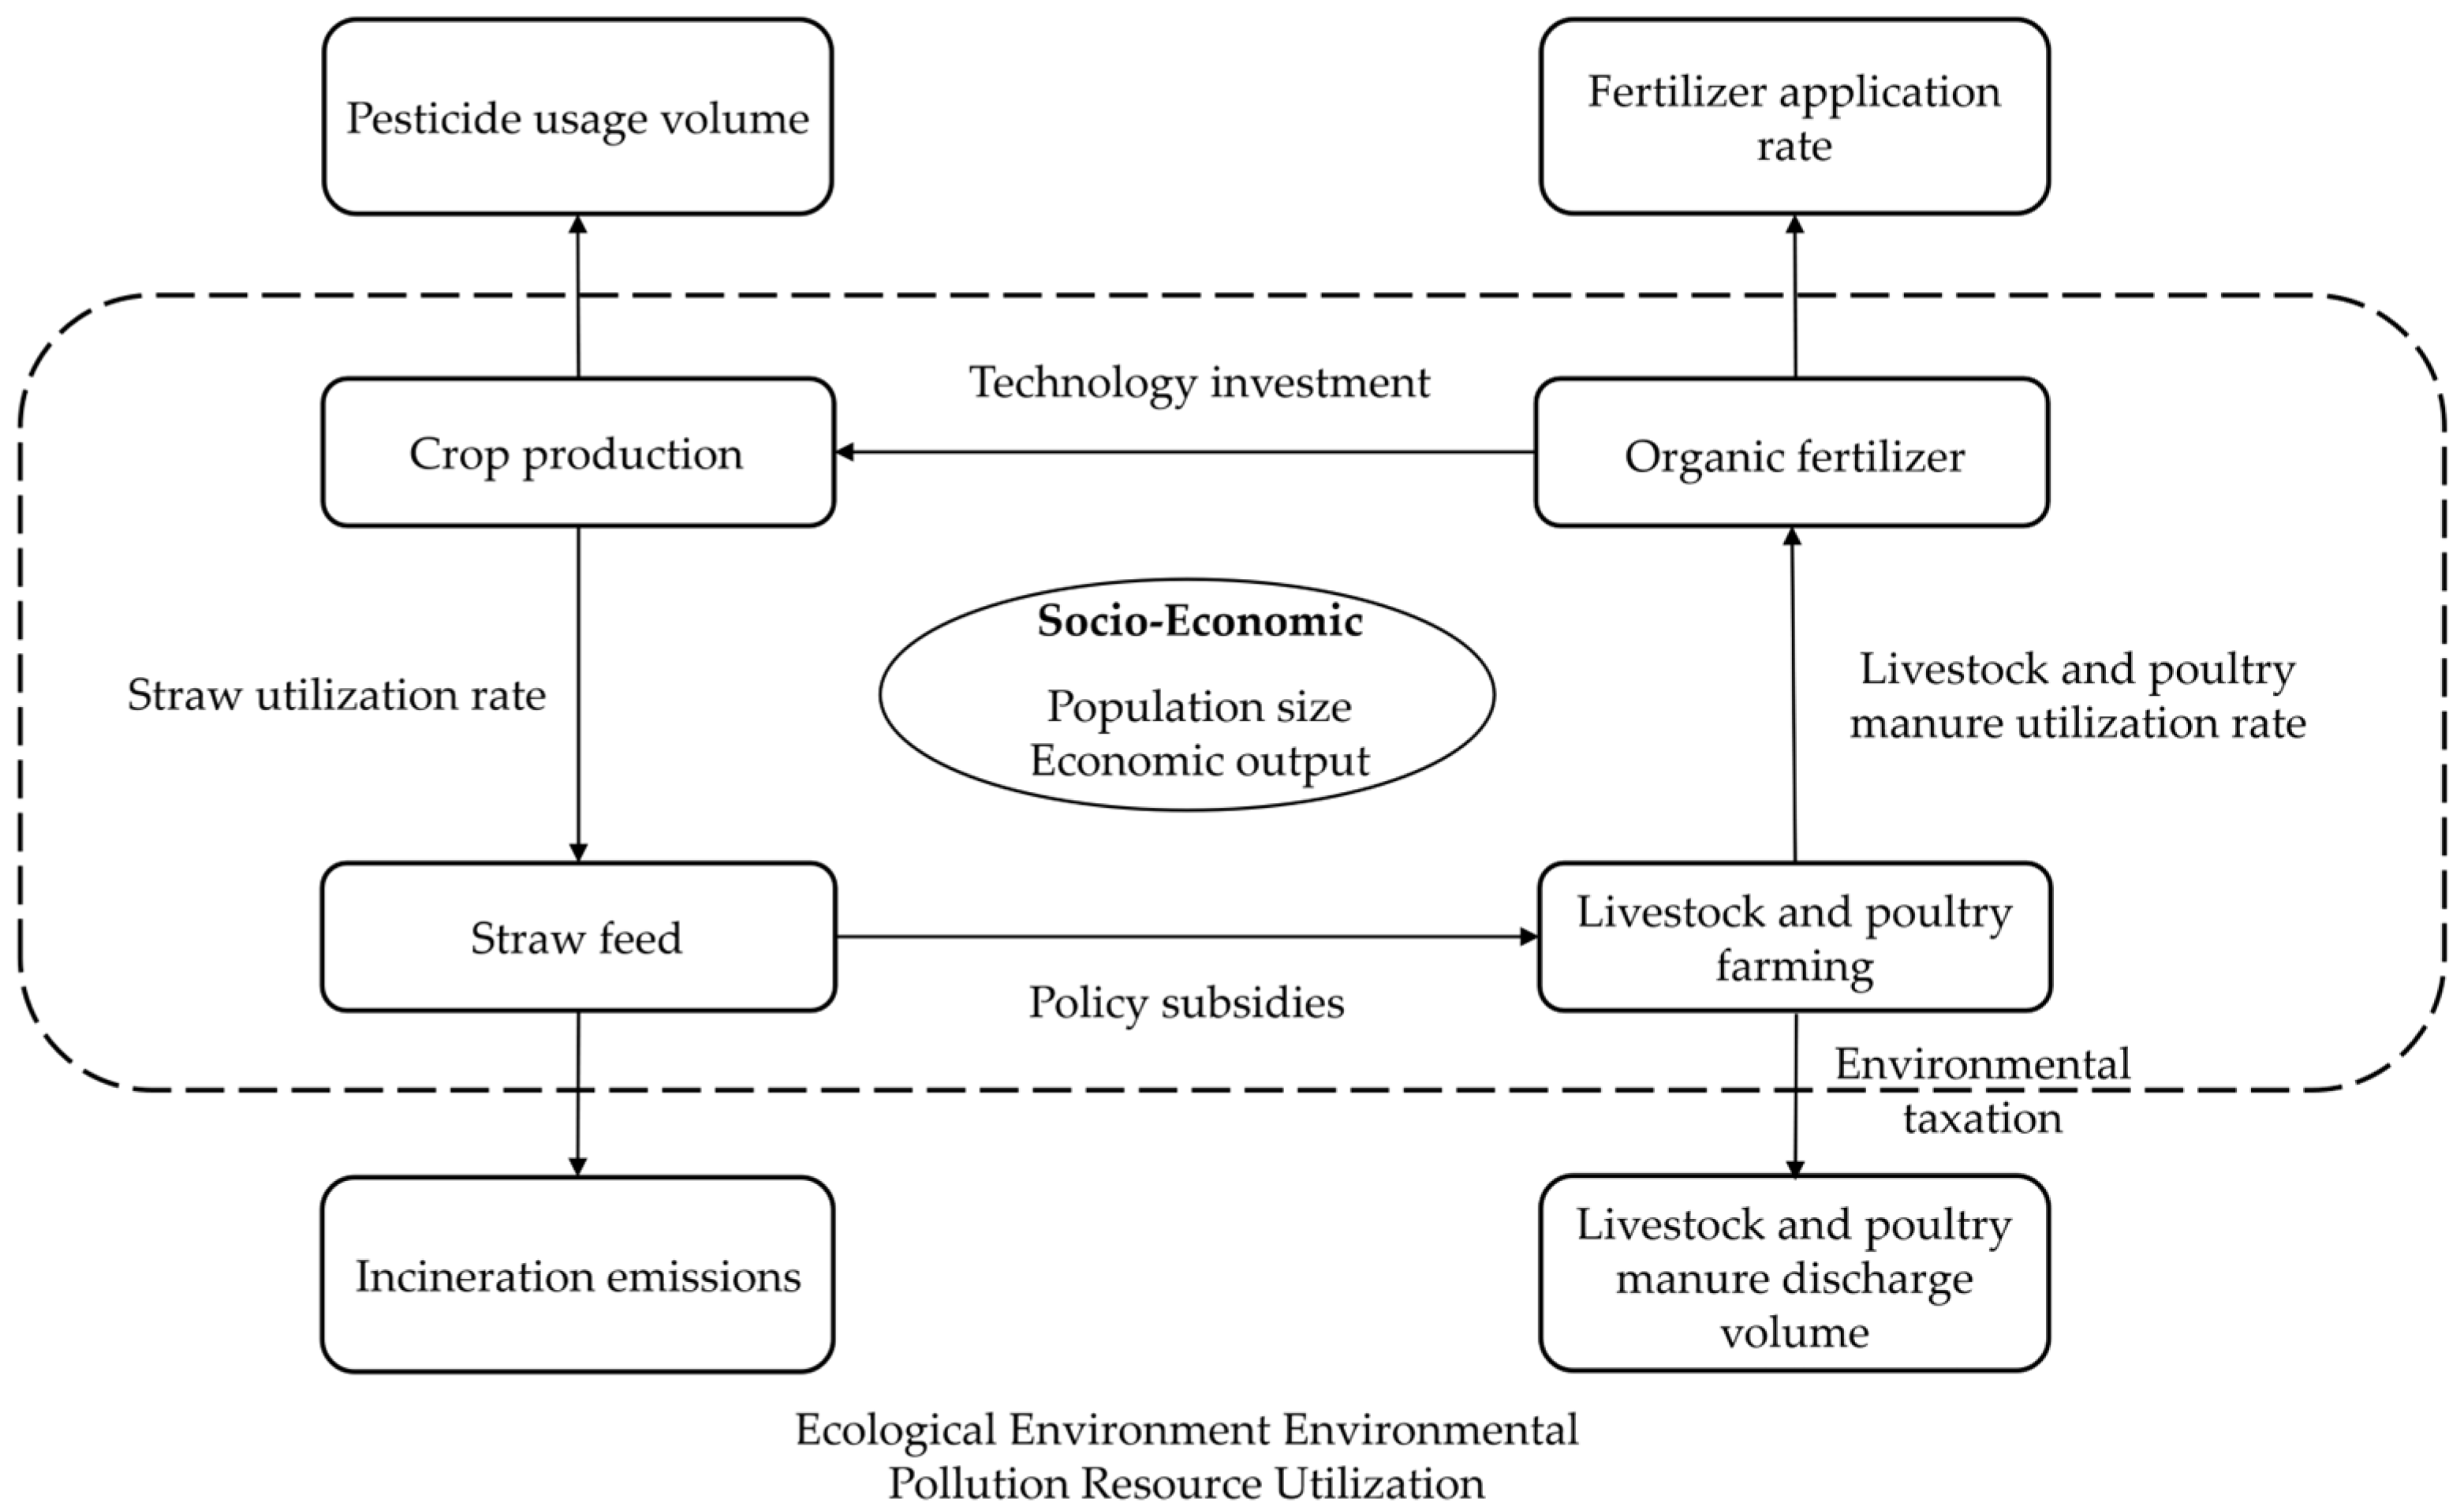
Integrated crop–livestock systems represent a vital approach to green agricultural development and a key means of achieving a circular economy [61]. This model fully leverages the respective strengths of crop cultivation and livestock farming to achieve the circular utilization of materials such as manure and crop residues, thereby reducing resource waste and environmental pollution. The conceptual framework for modeling Jilin’s integrated crop–livestock system (Figure 2) serves as the foundation for defining indicator systems.
Based on research into Jilin Province’s development conditions from 2006 to 2021—including crop cultivation, animal husbandry, and macroeconomic contexts—this study systematically analyzes the interrelationships and feedback mechanisms among elements within Jilin’s crop–livestock structure. The integrated system is divided into three subsystems: the crop–livestock integration subsystem, the socio-economic subsystem, and the ecological environment subsystem. This division enables an in-depth examination of causal feedback relationships both within and outside the system. Research on the integrated crop–livestock system reveals both positive and negative socio-economic and ecological impacts, including economic growth, population dynamics, pollution emissions, and resource utilization. These effects exert long-term influences on the system’s development while simultaneously exerting reciprocal effects on the system itself.
This research framework facilitates a deeper understanding of the operational mechanisms within Jilin Province’s integrated crop–livestock system, providing a crucial reference for formulating sustainable development strategies. By optimizing the integrated crop–livestock model, we can achieve synergistic growth in socioeconomic benefits and ecological benefits, propelling Jilin Province’s agriculture toward a more sustainable development trajectory.

3.2.2. System Objectives and Boundaries

The model boundaries are defined according to the principles of purposefulness, simplicity, and effectiveness, as shown in Table 1.

3.2.3. System Composition and Variables

Considering data availability and accuracy, existing research indicators from other scholars are integrated. This study systematically analyzes the interrelationships among various elements of Jilin Province’s integrated crop–livestock system. Guided by principles of practicality, a problem-oriented approach, and operability, it examines causal feedback relationships both between and within systems [45]. The integrated system is thus divided into three subsystems: the integrated crop–livestock subsystem, the socio-economic subsystem, and the ecological environment subsystem.
① Crop–Livestock Integration Subsystem
Yield-Related Variables: Yield directly reflects the output achievements of crop production. The grain crop yield encompasses the combined output of major staples such as corn, soybeans, and rice, serving as a key indicator for ensuring food security. The cash crop yield, meanwhile, represents the output of crops that generate added economic value, with their production levels directly impacting farmers’ economic income.
Variables related to cropland planting area: The crop planting area serves as a key indicator of agricultural scale. The area planted with grain crops determines the potential yield base for food production. The cash crop planting area is closely linked to farmers’ economic returns. The total crop planting area functions as a comprehensive metric for overall cultivation scale, measuring the aggregate input and output potential of the agricultural sector.
Variables related to livestock and poultry farming: The marketed output serves as a key indicator for measuring the scale and production of the farming industry. The current year’s hog output and the current year’s beef cattle output reflect the supply capacity of pork and beef. The current year’s changes in hog and beef output reveal trends in the livestock industry and aid in forecasting shifts in market supply. The livestock and poultry manure utilization reflects the actual scale of waste utilization, while the utilization rate measures the degree of waste recycling. This rate indicates the effectiveness of integrated crop–livestock systems in resource recycling, with high utilization rates signifying reduced environmental pollution and resource waste.
Other relevant variables: The straw constitutes the primary waste product of crop cultivation. Straw stockpile refers to the total amount of straw remaining in fields at a given moment. The collectable straw denotes the quantity of straw that can be collected for alternative uses under technical and operational conditions. Annual straw utilization reflects the quantity of straw actually utilized each year. These variables are crucial for assessing the comprehensive utilization efficiency and ecological benefits of straw. The straw-to-grain ratio denotes the ratio of crop straw yield to grain yield. These three variables, specific to major grain crops, are used to estimate straw yield, thereby providing data support for straw resource utilization planning (e.g., for feed or energy). The cropping index indicates the average number of times crops are cultivated on the same plot of arable land within a year, reflecting the degree of land use intensification. A higher value signifies greater land utilization efficiency, enabling increased output from limited land resources.
② Socio-Economic Subsystem
Variables related to economic aggregates: GDP serves as the core indicator for measuring the overall scale and development level of a regional economy. GDP growth reflects the pace of economic expansion. The primary industry output value pertains to agriculture, and its share within GDP demonstrates agriculture’s contribution to the economy.
Population-related variables: The total population reflects the size of a region’s population. The population growth indicates natural population increase, which significantly impacts resource demands and socio-economic development. The distinction between urban and rural populations facilitates analysis of structural changes, such as the progress of urbanization.
Meat consumption and demand-related variables: These variables—consumption volume and demand volume—analyze differences in urban and rural residents’ meat consumption capacity and demand. The per capita consumption reflects actual consumption patterns, while per capita demand accounts for potential demand. The meat demand volume represents the overall scale of demand, holding significant importance for meat production planning and market supply balance. The meat production volume reflects the actual output of the livestock industry, encompassing major meat products such as pork and beef. The other meat production may include poultry, mutton, and other meat products. These variables form the foundation for meeting market demand for meat.
Variables related to economic structure and development indicators: The primary industry share reflects agriculture’s position in the national economy. The urbanization rate reflects changes in the urban–rural structure and serves as a key indicator of socioeconomic development stages. The supply–demand ratio measures the balance between supply and demand for agricultural products (such as meat). The GDP growth rate and population growth rate, respectively, reflect growth trends from economic and demographic perspectives, which are crucial for long-term development planning and policy formulation. The per capita GDP is an indicator that allocates the total economic output to each individual. It measures the average economic welfare level of residents in a region and serves as an important basis for comparing the quality of economic development across different areas.
③ Ecological Environment Subsystem
Land Resource-Related Variables: The arable land area represents the fundamental scale of land resources for agricultural production. The per capita arable land area reflects per capita land resource holdings and indicates the relative abundance of land resources. The effectively irrigated area denotes the portion of arable land capable of supplying sufficient water for crop growth, which is crucial for assessing agricultural production stability and water resource utilization efficiency.
Pollution and waste-related variables: The annual straw-burning volume is a significant contributor to air pollution and serves as an indicator of straw resource wastage. The fertilizer application volume and pesticide usage volume directly correlate with the extent of agricultural nonpoint source pollution, with excessive use leading to ecological issues such as soil and water contamination. The fertilizer and pesticide application intensity reflects the pollution pressure these inputs exert on the land, serving to evaluate the negative ecological impact of agricultural production. The livestock and poultry manure production volume represents the total waste generated during animal husbandry and serves as foundational data for assessing livestock pollution risks. The maximum pollutant carrying capacity of cultivated land is an ecological safety indicator measuring the maximum contaminant level the land can tolerate. Exceeding this threshold degrades soil quality, impeding crop growth and compromising ecosystem health.
Resource Utilization and Ecological Early Warning Variables: The effective irrigation rate reflects the efficiency of water resource utilization. The pollution coefficients for cattle and pig farming are used to assess the pollution risk levels of different livestock types. The straw feed utilization rate reflects the rational use of straw resources, with higher utilization rates reducing pollution from burning. The livestock and poultry manure load warning values serve as ecological warning indicators to identify potential risks of environmental overload pollution from livestock and poultry manure.
A total of 59 specific indicators were established, as shown in Table 2.

3.2.4. Parameter and Equation Determination

The stock–flow diagram represents the structural characteristics of the actual system. The construction equation is a mathematical expression of the quantitative relationship between variables, determined directly by the flow diagram or provided by relevant functions, which can be linear or nonlinear.
The general form of system dynamics equations in a stock–flow diagram involves three types of variables: primarily “state variables” (Level), “rate variables” (Flow), and “auxiliary variables” (Auxiliary). State variables form the core and are typically represented by integral functions during changes, as shown in Equation (1):
d L d t = f L i , A i , F i , P i
where L represents the state variable, A denotes the auxiliary variable, F signifies the rate variable, P indicates the parameter, t represents the simulation time, and Δ t denotes the simulation step size.
Its differential form can be expressed as in Equation (2):
X t + Δ t = L t + f L i , A i , F i , P i · Δ t
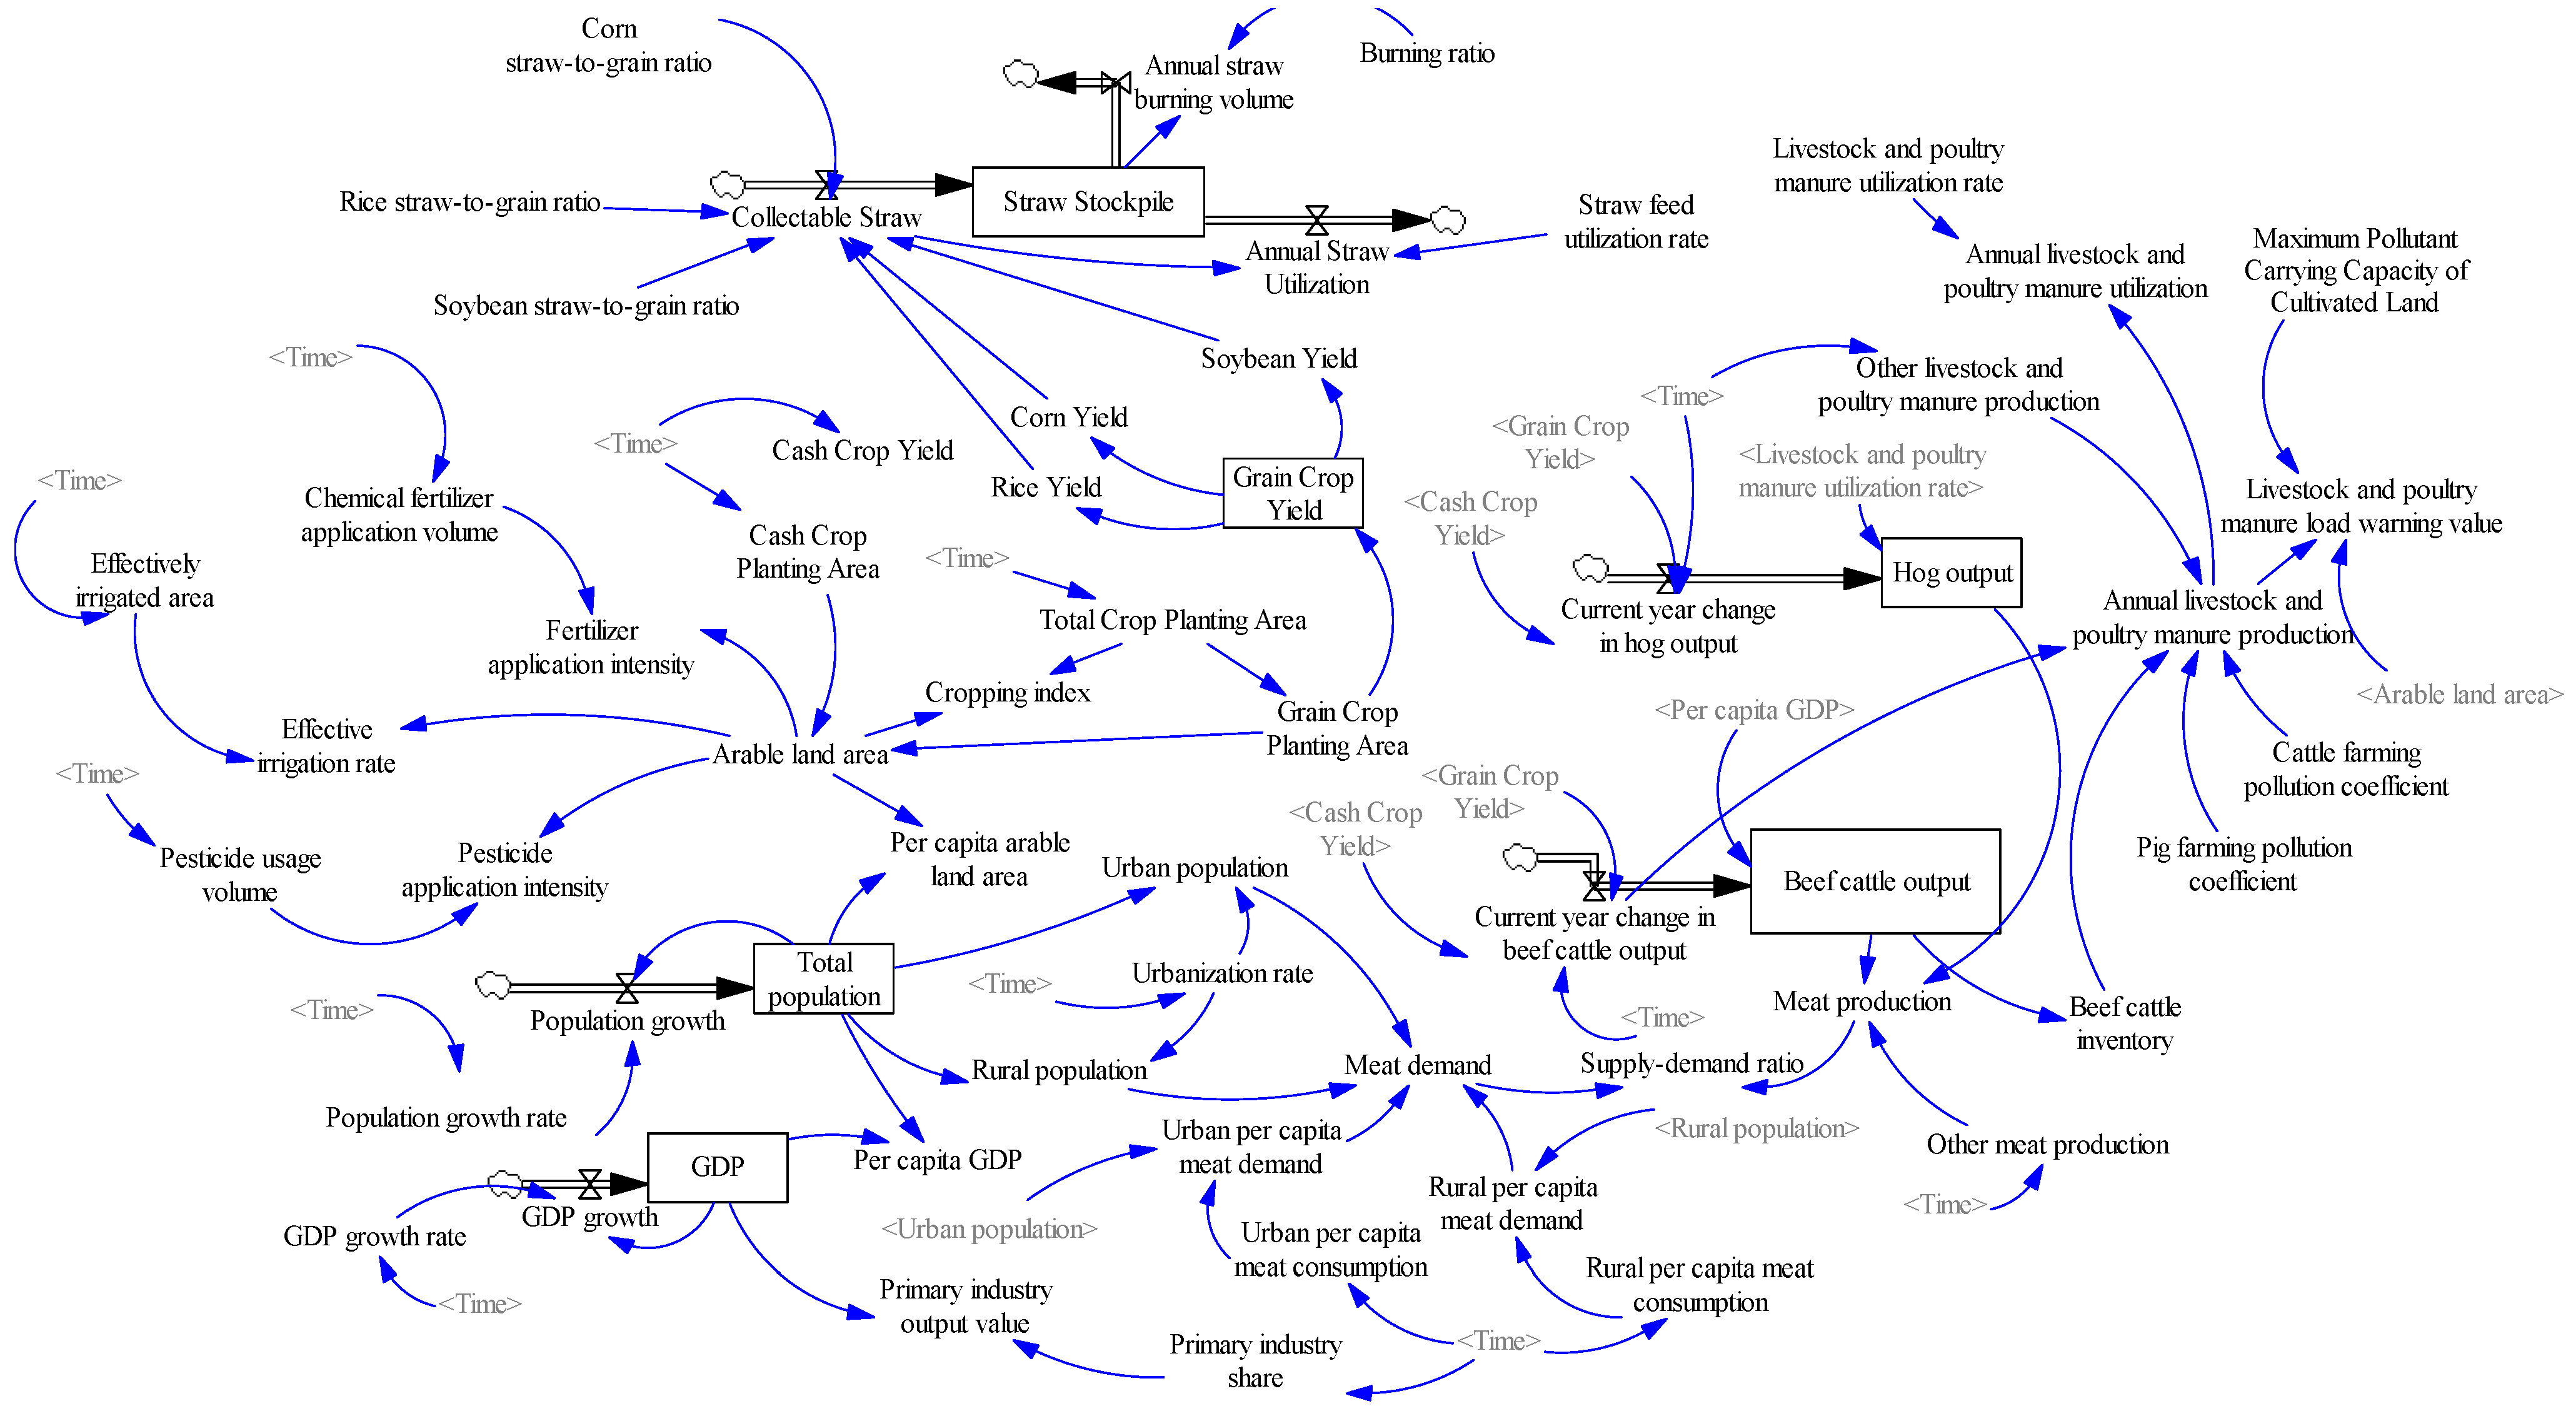
Category 1: Fixed parameters, also known as constants. These parameters do not change over time and are primarily estimated based on measured data, statistical information, or relevant literature. They are typically determined using approximate values, such as birth rates and incineration ratios. Category 2: Time-varying parameters, further classified into linear and nonlinear time-varying parameters based on their variation patterns. The variation of nonlinear time-varying parameters is highly complex. Regression functions can capture the inherent trends and causal relationships within a system. Therefore, regression analysis is employed to estimate the parametric equations within the model. Common methods include least squares and maximum likelihood estimation [45]. For parameters where equations cannot be derived, tabular functions are used to represent irregular temporal variations. Tabular functions offer significant flexibility, and a substantial portion of parameters estimated in the model are expressed through this form. Category 3 comprises initial values. All state variables require initial assignments, with this model’s parameter initial values derived from 2006 statistical data. Based on analyzing interrelationships among subsystems, various variables for the integrated crop–livestock system were established. Logical and causal relationships within subsystem variables were examined to construct the system’s stock-flow diagram, shown in Figure 3.
For detailed parameter specifications, please refer to the Appendix A.

4. Empirical Findings and Analysis

4.1. Model Validity Testing

The historical validation method was employed to assess model validity by comparing the relative error between actual historical data and simulated model outputs.

4.1.1. Visual and Operational Verification

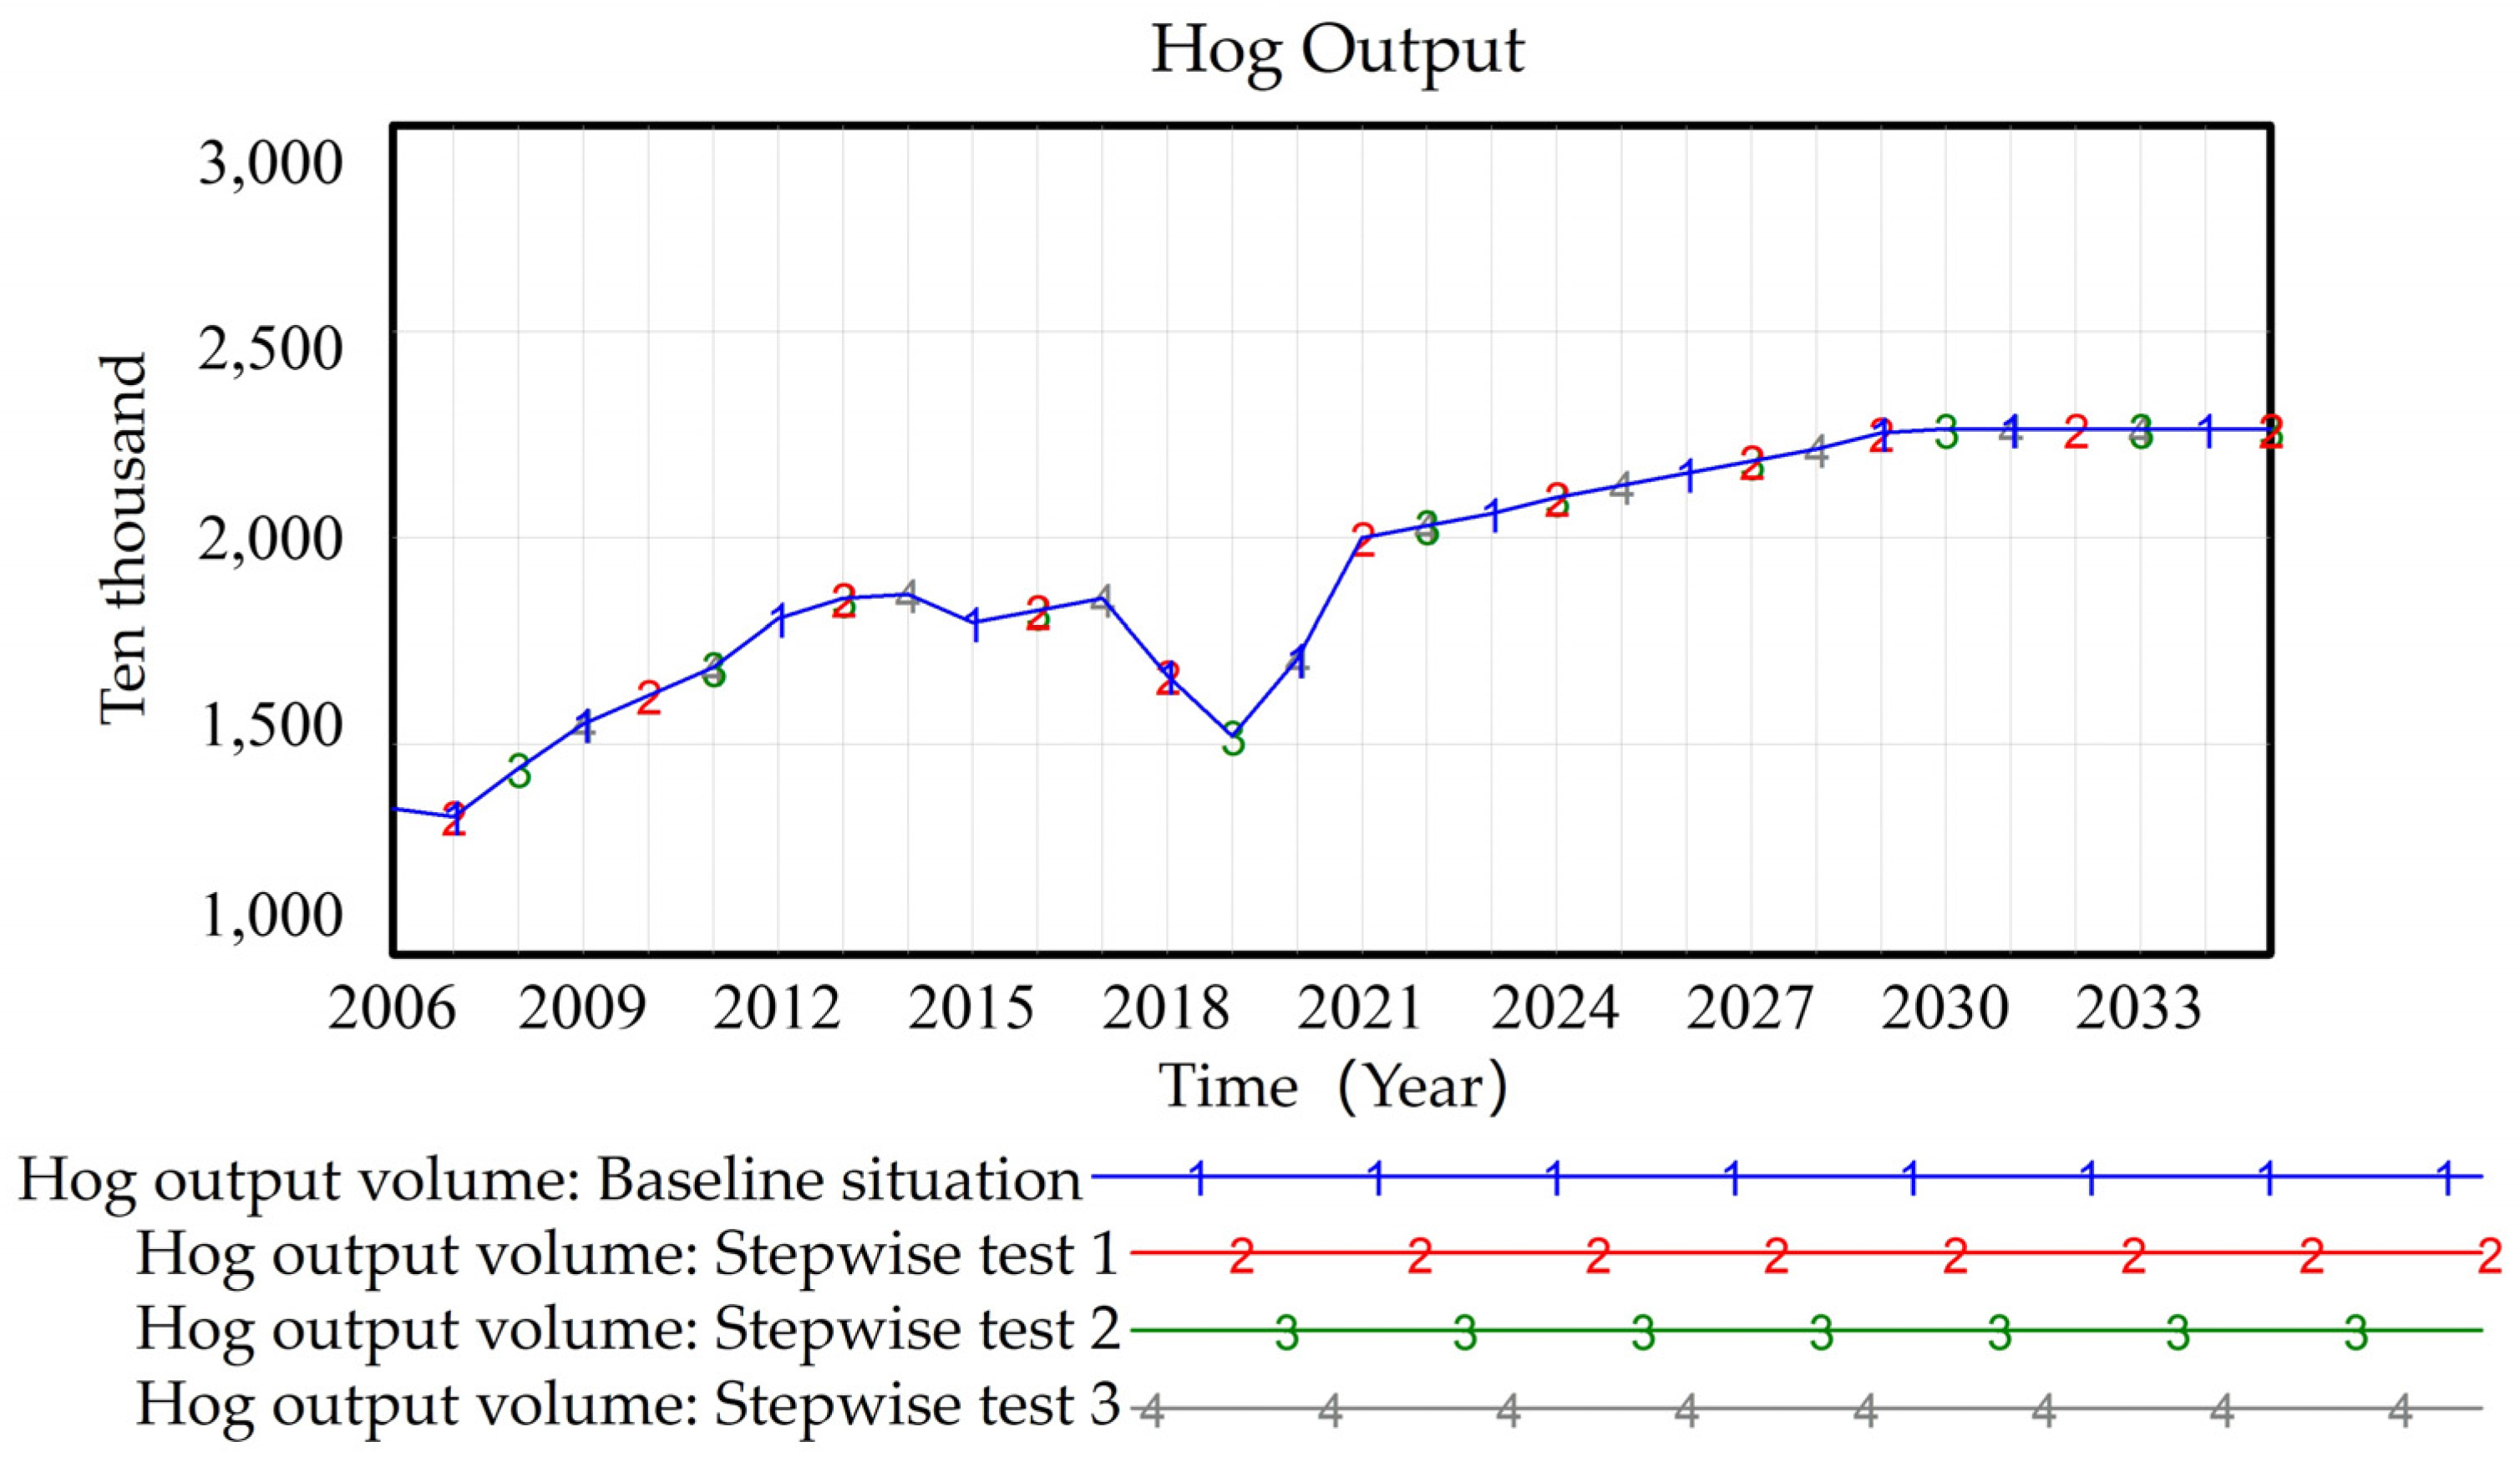
During the dimensionality check phase, the built-in equation verification function in Vensim-PLE (Ventana Systems Inc., Harvard, MA, USA; https://www.ventanasystems.com/, accessed on 27 December 2024) software was used to conduct an intuitive assessment of the model’s validity. Results indicated no errors and confirmed operational feasibility. System stability was primarily validated through operational testing by observing outcomes at different time steps. Closer alignment of results across varying time steps indicates greater system stability. The hog output volume, serving as a state variable, was utilized to describe system state evolution for verification, as illustrated in Figure 4. The model is stable and can proceed with subsequent research.

4.1.2. Historical Validation

Prior to simulation, a historical test was conducted to verify whether the model accurately reflects past system behavior and possesses the capability to address practical problems. Historical test data spans from 2006 to 2021. Using the relative error method, key variables within the system were selected as examples. The error formula is: Relative Error = (Simulated Value − Historical Value)/Historical Value, as shown in Table 3.
By examining the model’s fit, the absolute relative errors between simulated and historical values for the selected variables were all less than 10%. This falls within an acceptable range, indicating that the model’s fit aligns with actual conditions and can proceed to the next step of scenario simulation [62,63].

4.2. Simulation Analysis

After model validation, assuming existing indicators maintain their current trends, VENSIM-PLE software(Version 6.3) was used to simulate specific indicator values for the integrated farming and breeding subsystem, socio-economic subsystem, and ecological environment subsystem. Future trend analysis was conducted for the simulation period spanning 2006 to 2035.

4.2.1. Integrated Crop–Livestock Subsystem

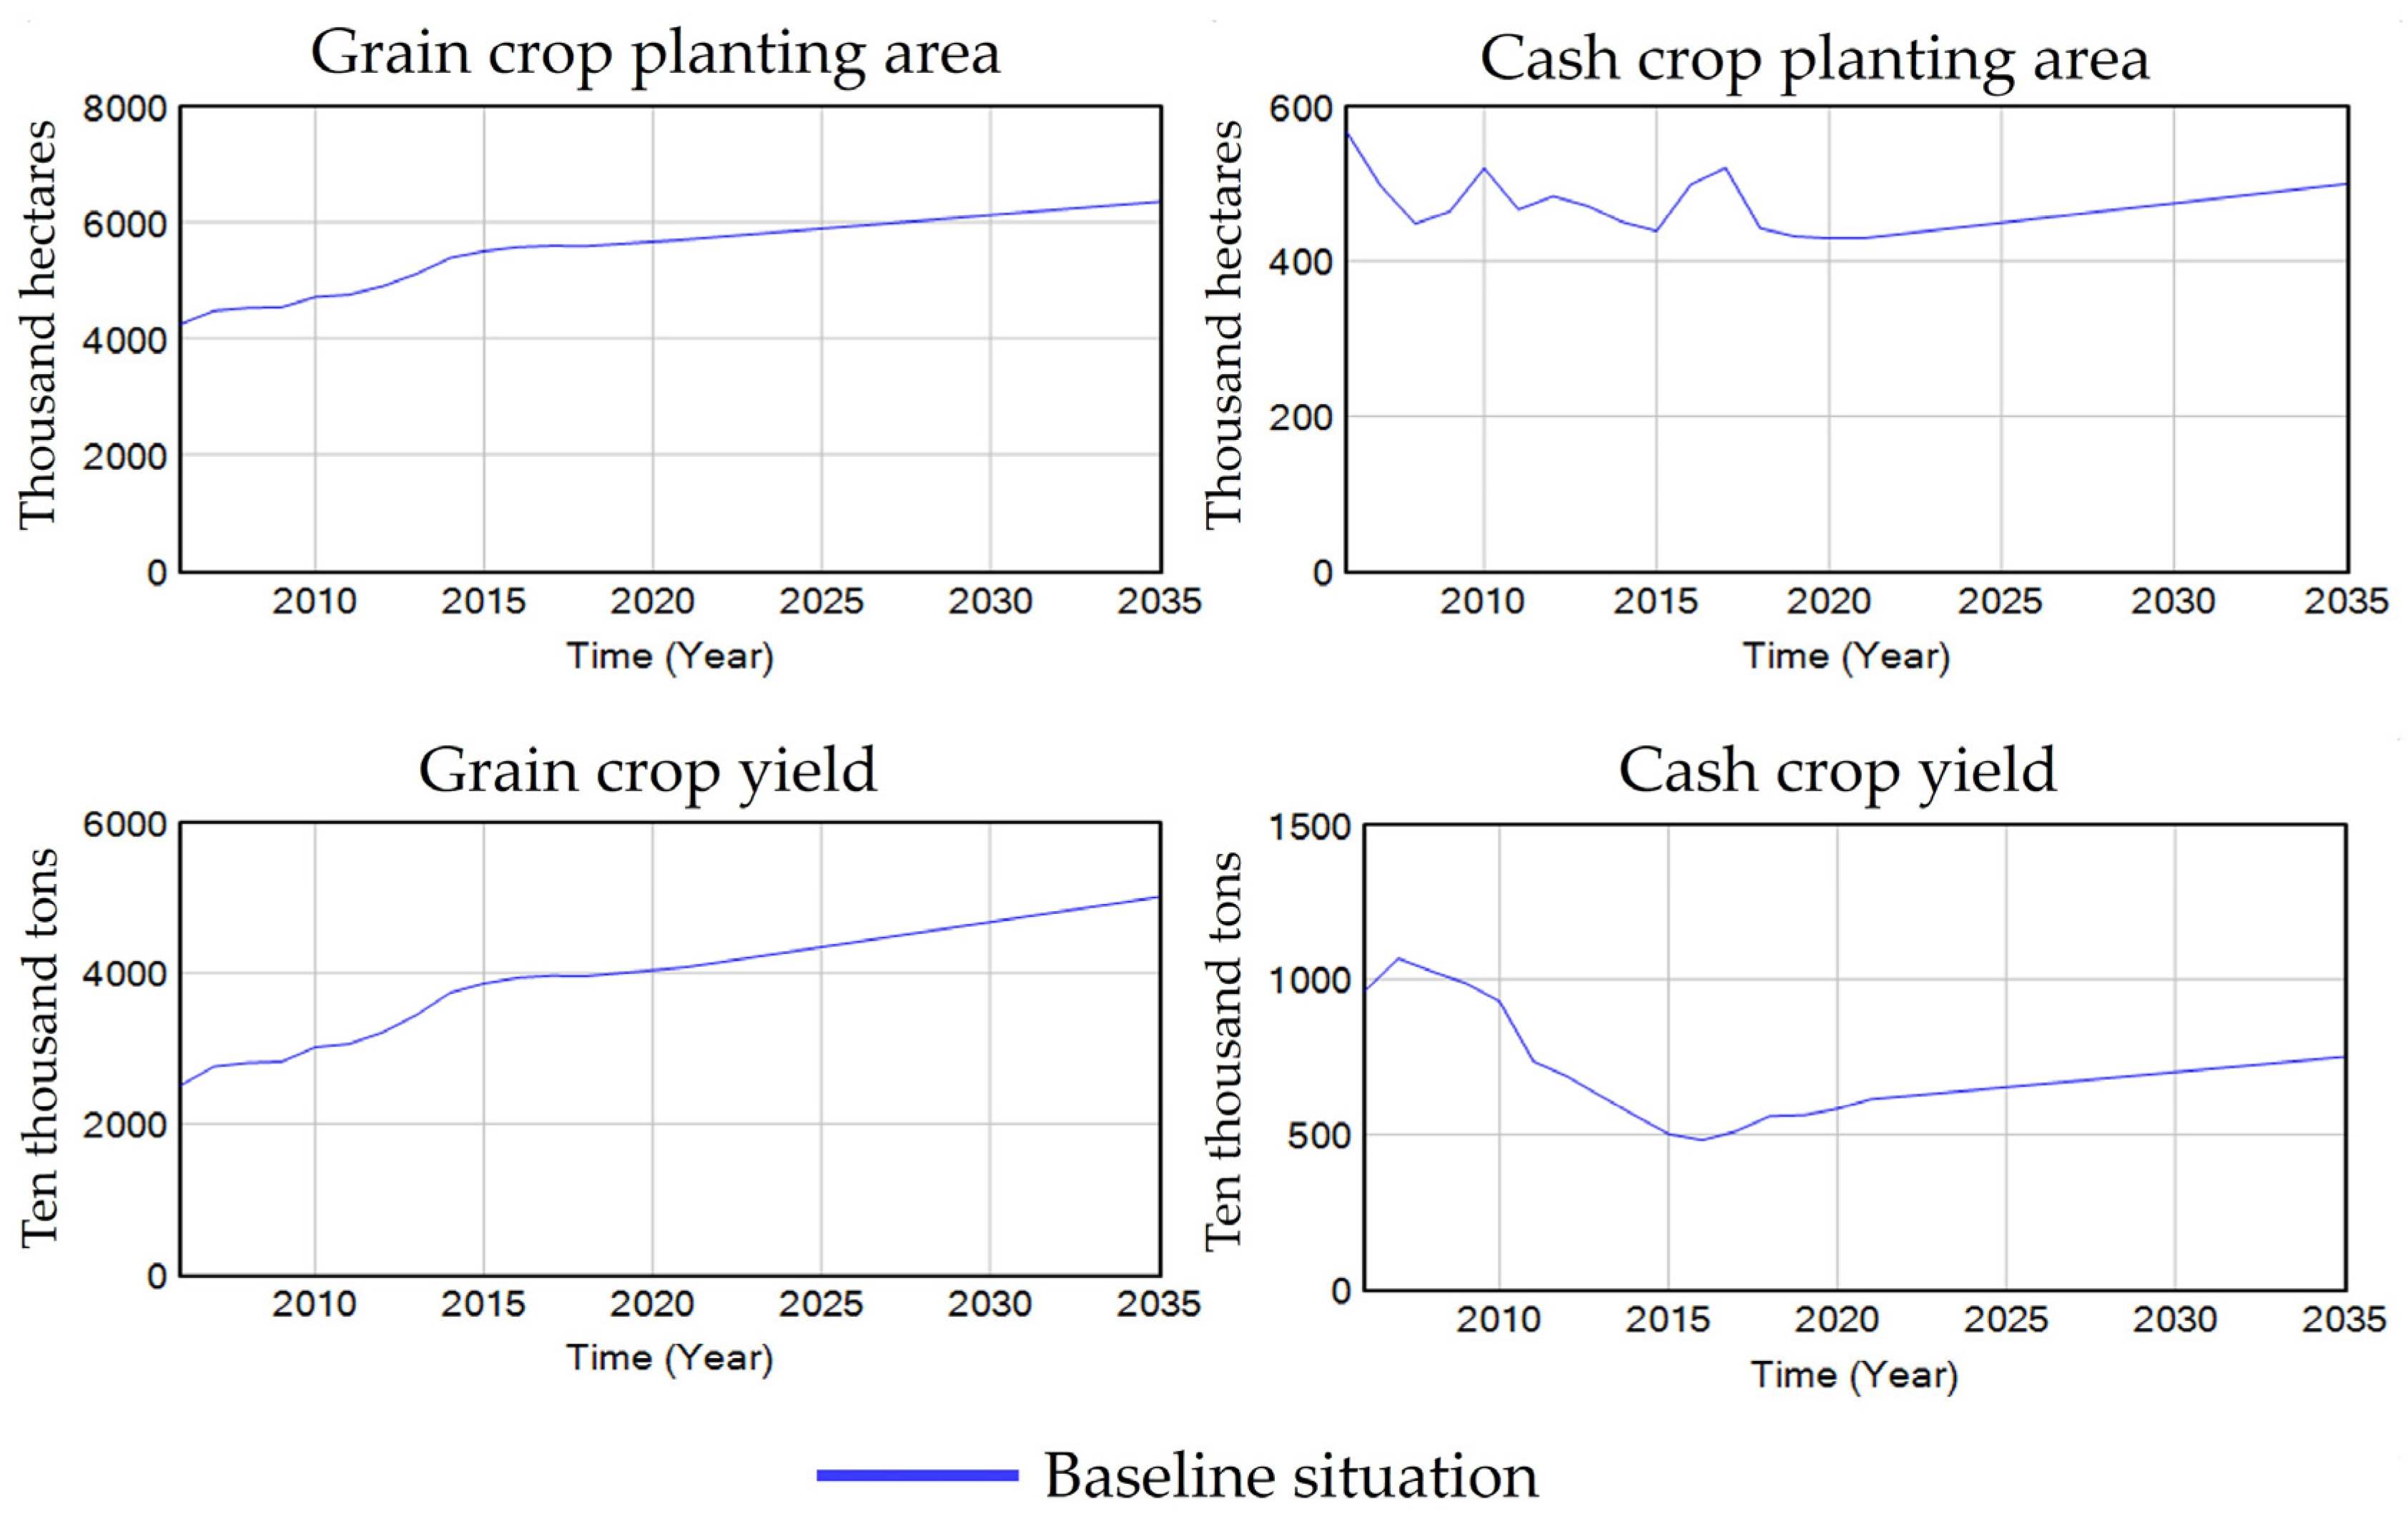
Figure 5 illustrates the trend changes in grain crop planting area, cash crop planting area, grain crop yield, and cash crop yield. The figure shows that the grain crop planting area exhibits an upward trend, gradually slowing down. From 2006 to 2035, Jilin Province’s grain planting area increased annually at an average growth rate of 1.57%. The area under cash crops exhibits fluctuating trends, showing a decline after 2017 before rebounding in 2025, fluctuating around 450,000 hectares. Grain crop yield and planting area are positively correlated, following identical trends with steady increases. Grain crop yield is projected to reach approximately 50 million tons by 2035. The output of cash crops showed a fluctuating downward trend from 2006 to 2018, with a gradual increase only after 2018.
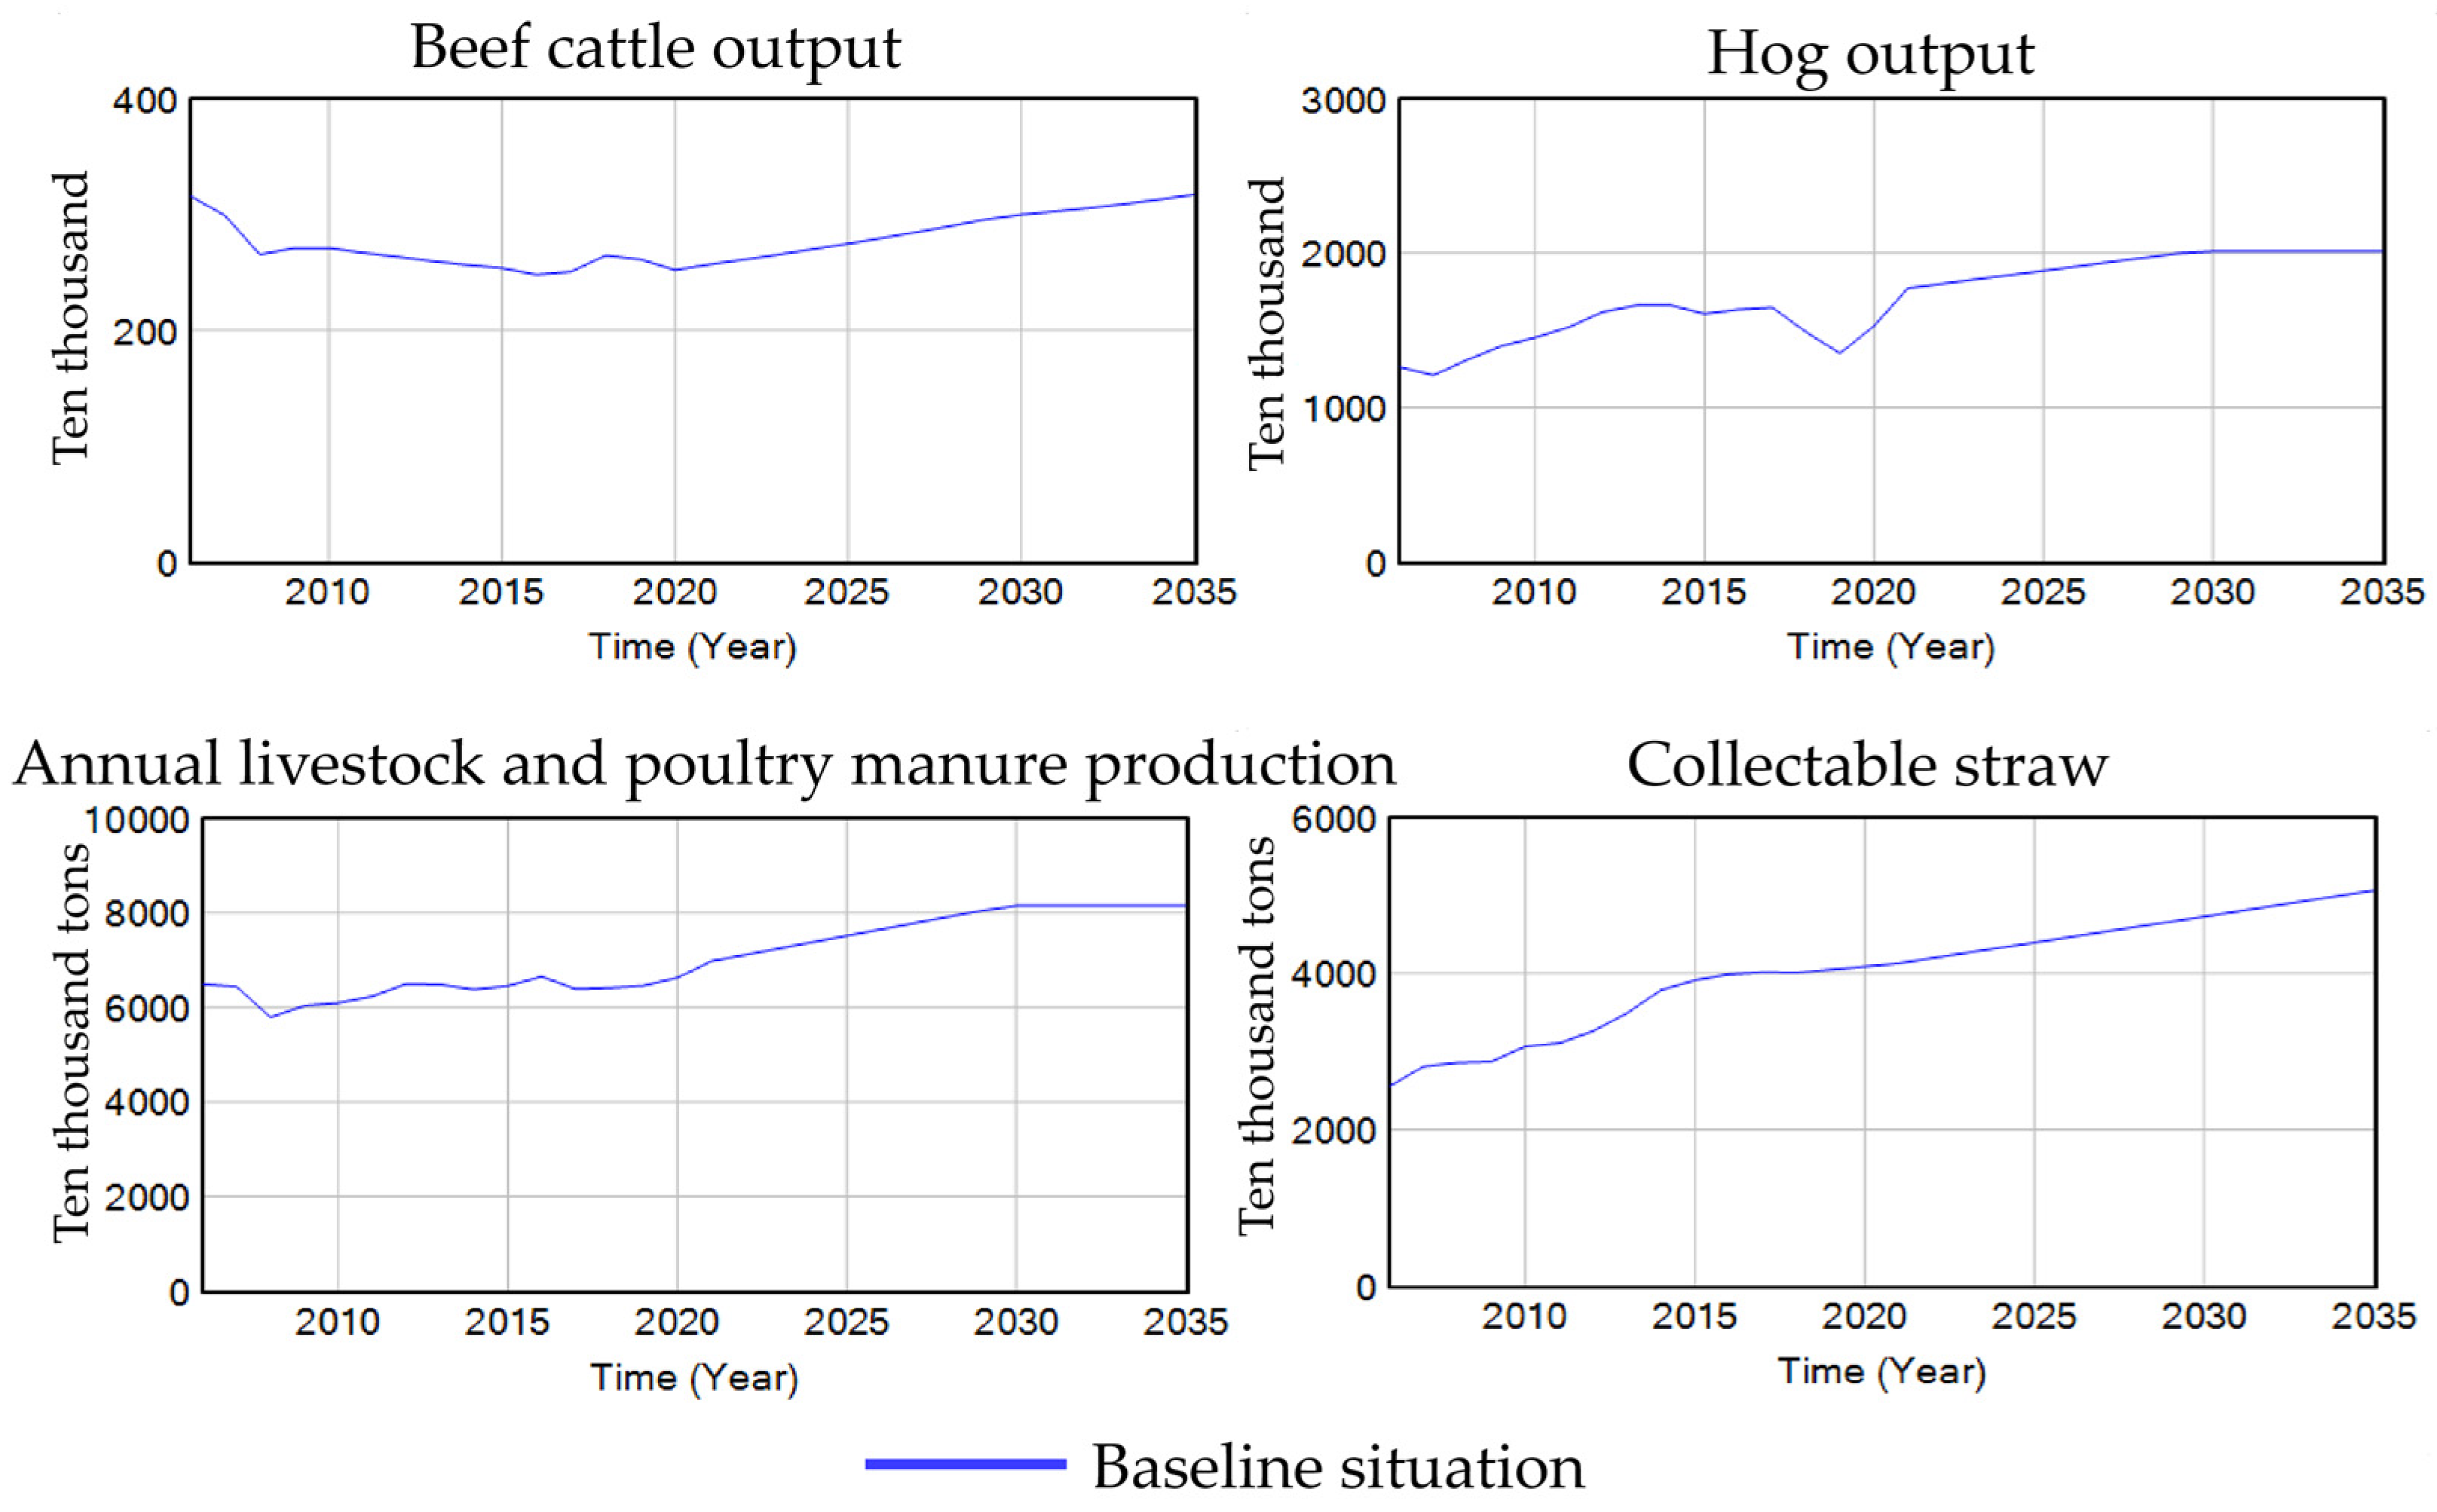
Figure 6 illustrates the trends in hog output, beef cattle output, annual livestock and poultry manure production, and collectable straw. It shows that the number of hogs slaughtered increased gradually from 2007 to 2016, and then declined significantly from 2016 to 2019. It is projected to maintain a steady upward trend from 2019 to 2035. Beef cattle output remained largely stable overall. After a pronounced decline in 2007, it shifted to a gradual decrease until rebounding in 2018. However, it experienced a slight decline due to the pandemic and has shown a steady upward trend since 2020. Annual livestock and poultry manure production has been gradually increasing, hovering around 64 million tons from 2006 to 2020. It is projected to rise after 2020, reaching 80 million tons by 2035. The amount of collectable straw shows a clear upward trend. This indicates abundant straw resources and increased availability, with ample resources flowing from crop production to animal husbandry. Livestock and poultry manure production is stabilizing, ensuring a consistent resource supply from animal husbandry and promoting stable development of integrated crop–livestock systems.

4.2.2. Socio-Economic Subsystem

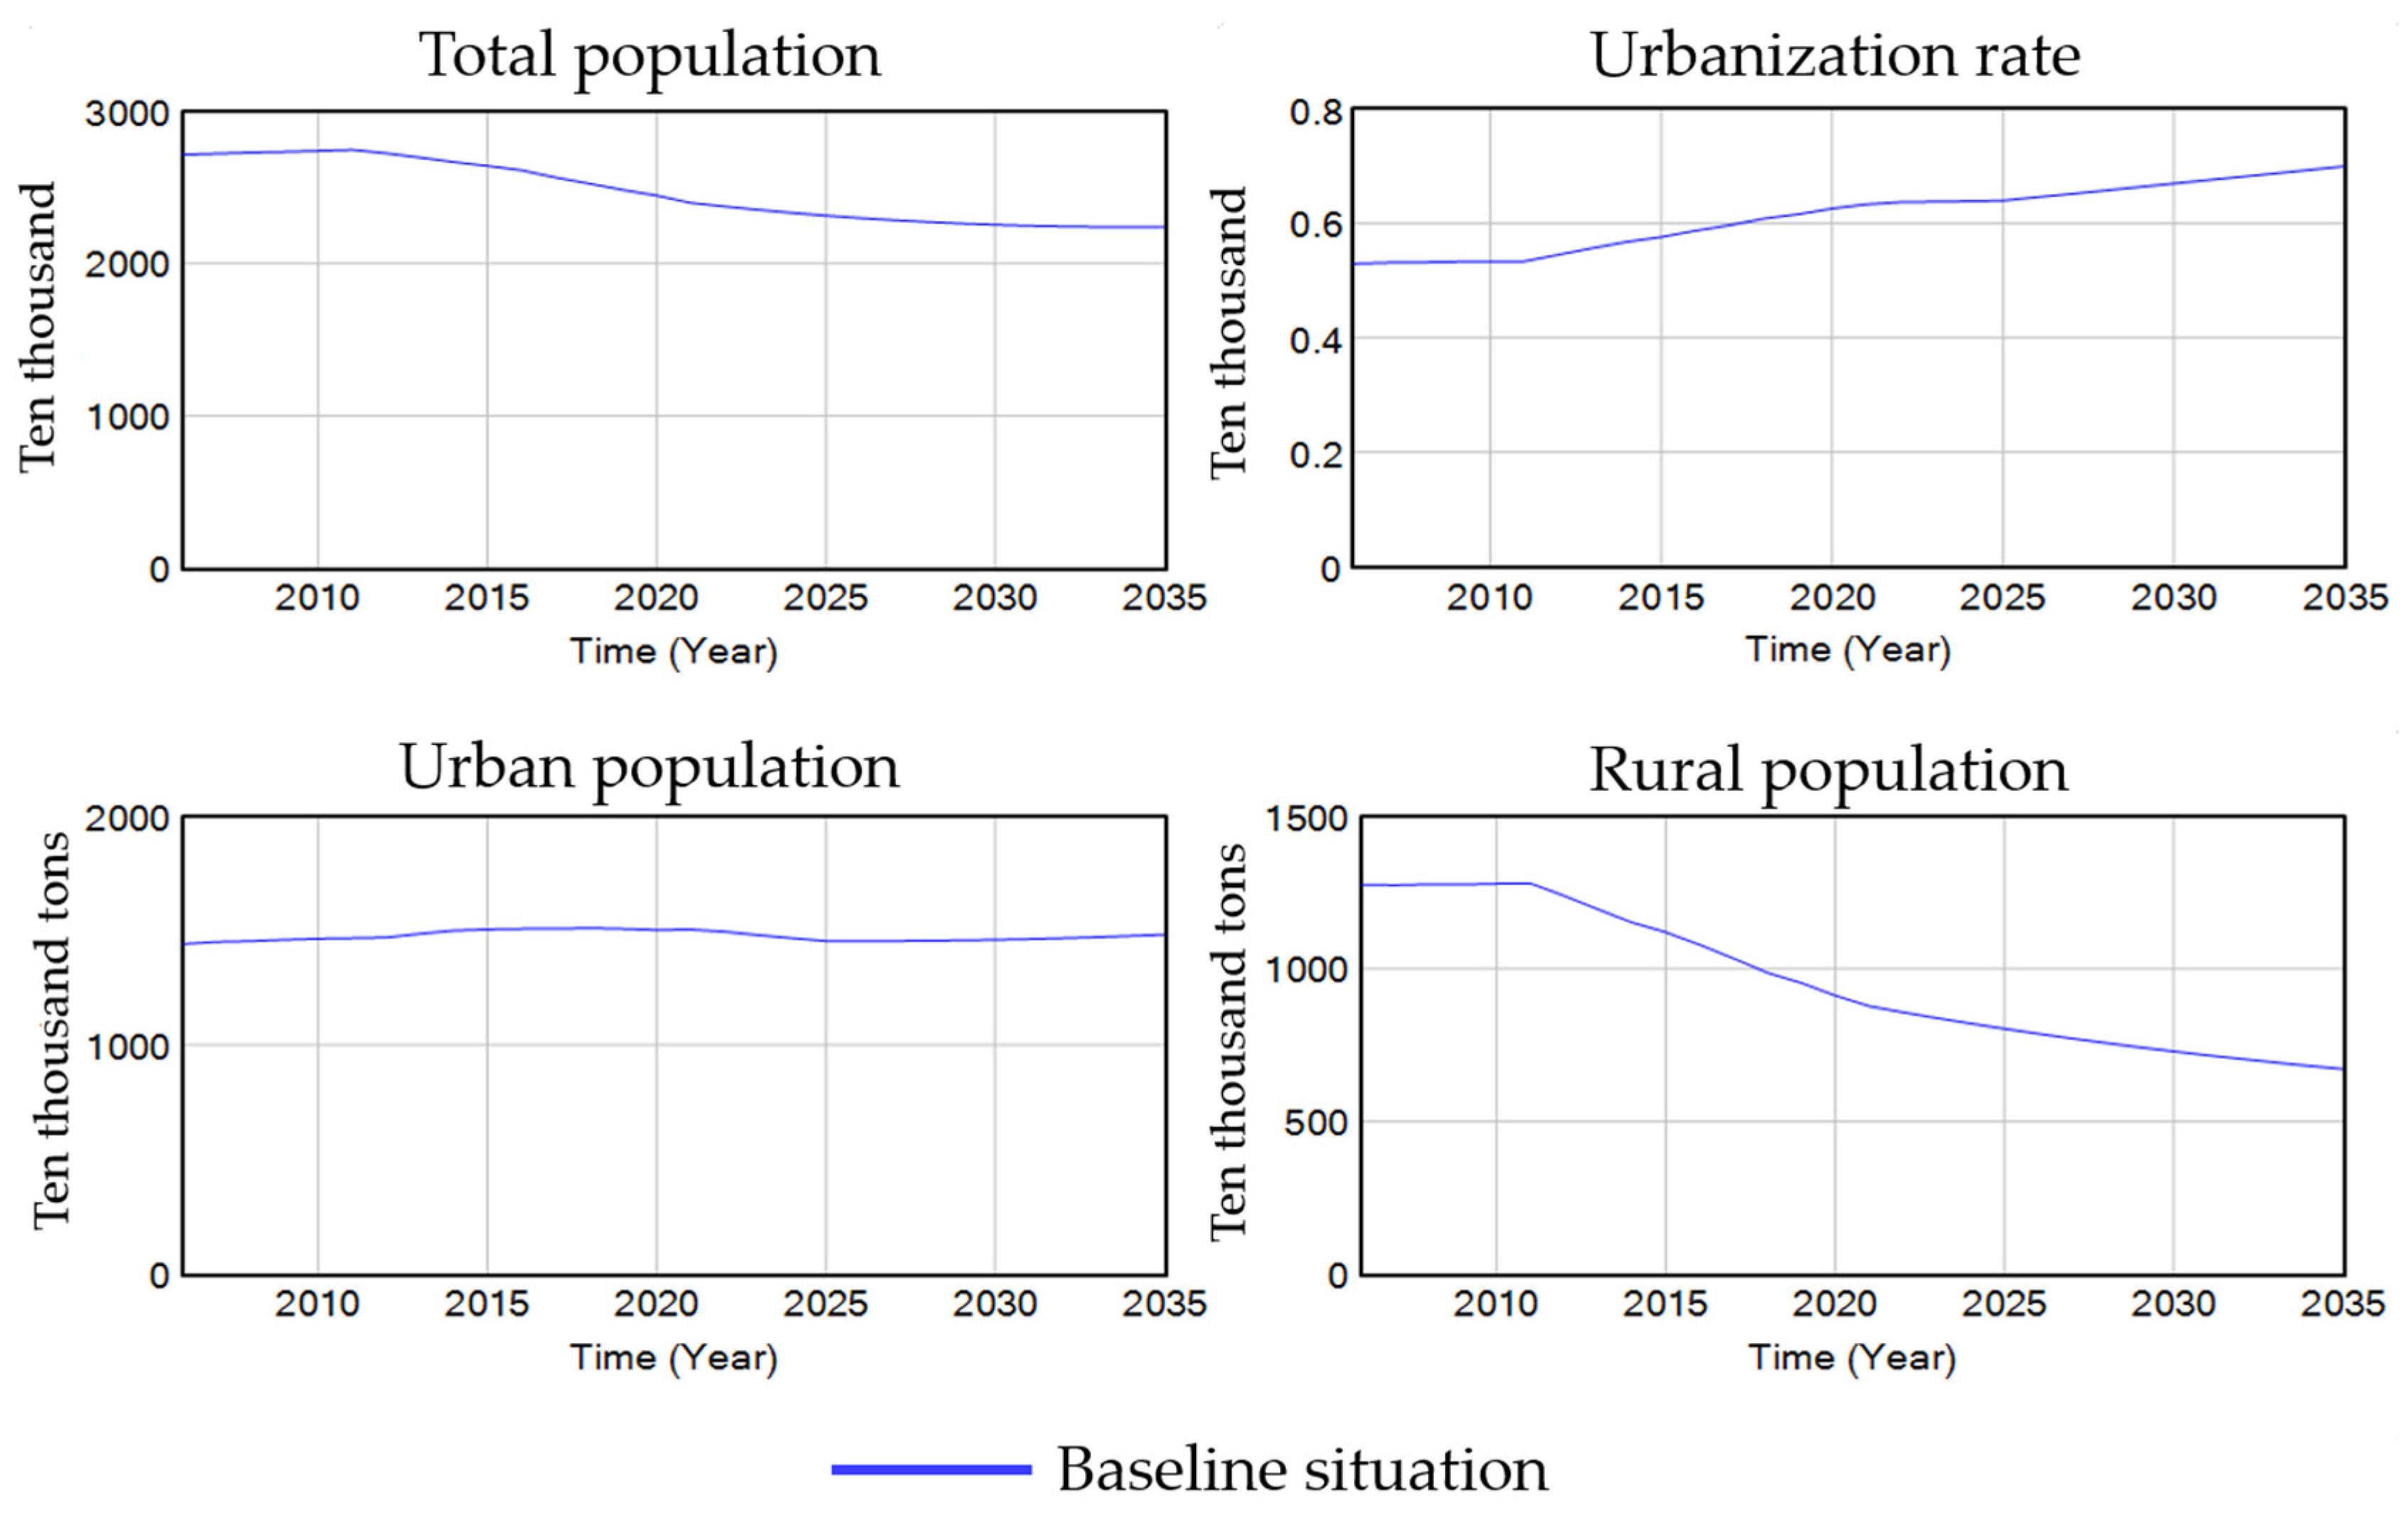
Figure 7 shows the trends in total population, urbanization rate, urban population, and rural population. The total population exhibits a declining trend. The urbanization rate shows a negative correlation with the total population, indicating an upward trend. The increase in urban population is not pronounced, remaining relatively stable. The rural population shows a sharp decline from 2011 to 2035, with the projected rural population reaching 6, 897, 420 by 2035.
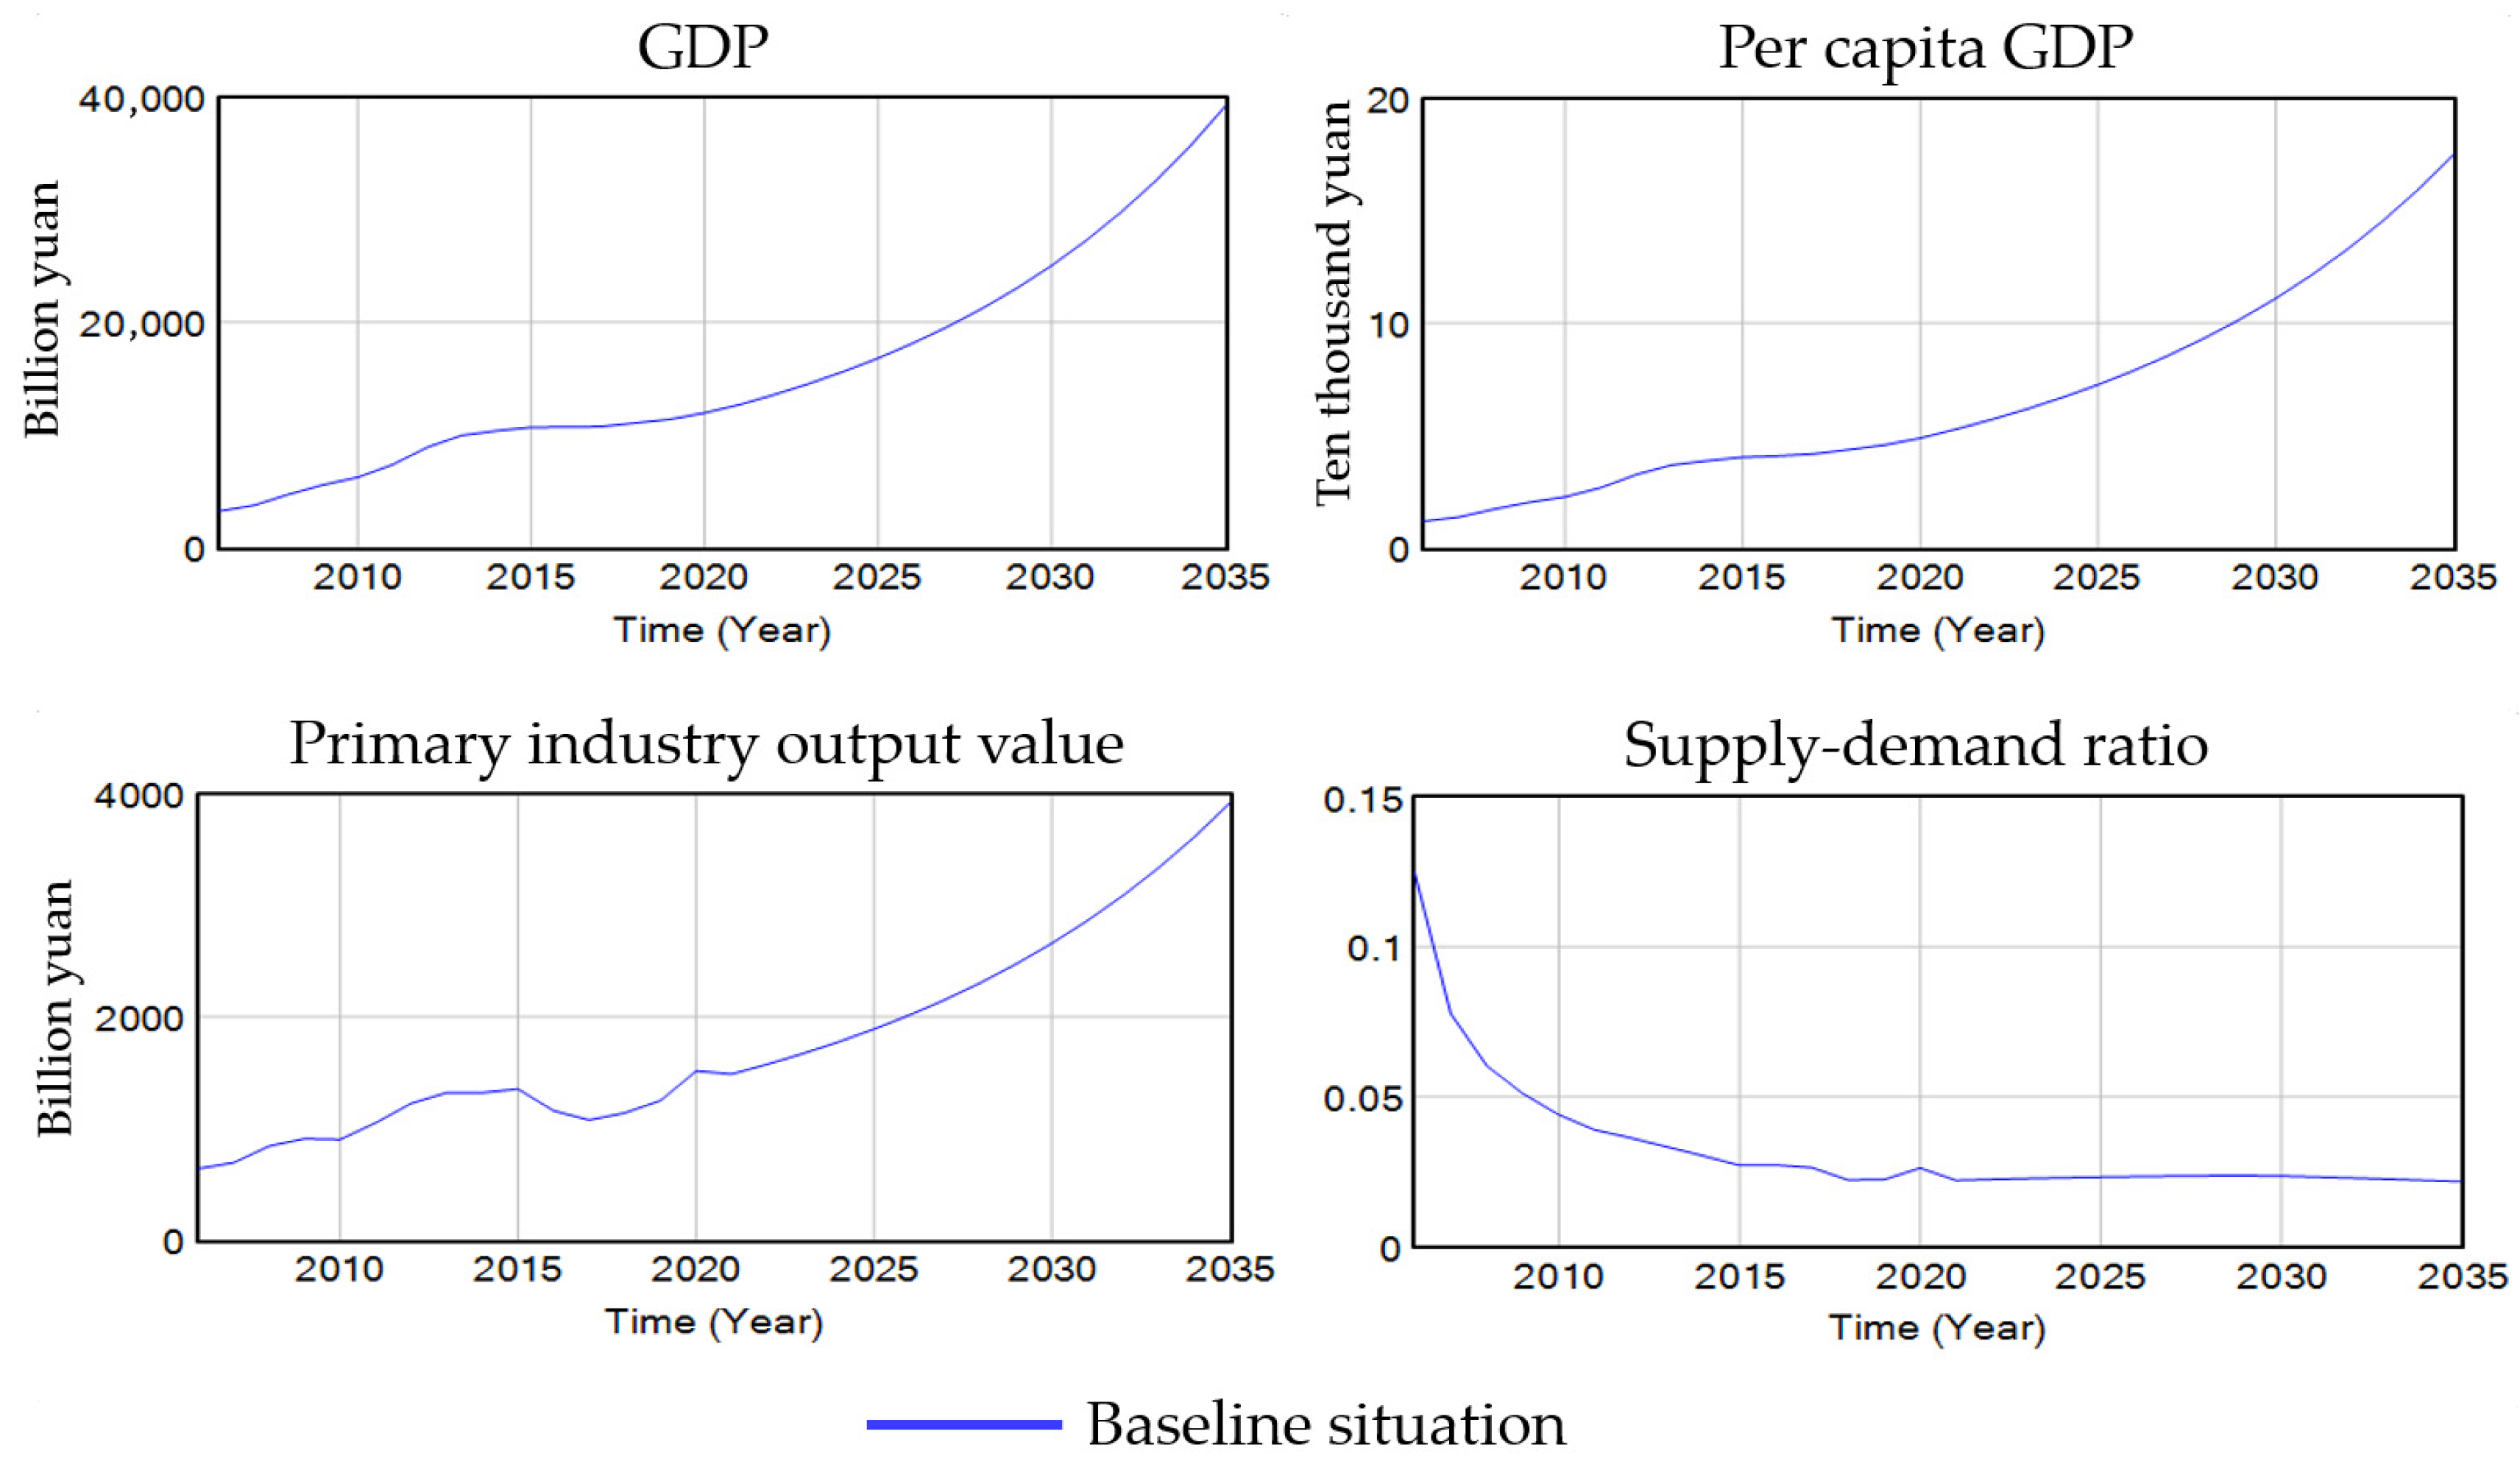
Figure 8 illustrates the trends in GDP, per capita GDP, primary industry output value, and supply–demand ratio. It shows that GDP rose steadily from 2006 to 2015, with the growth rate accelerating after 2015. Per capita GDP followed the same trajectory as GDP, exhibiting a slight upward trend from 2006 to 2014 before surging sharply after 2015. The primary industry output value fluctuated upward from 2006 to 2015, experienced a slight decline from 2015 to 2020, and surged sharply after 2021. Following the introduction of a series of supportive policies by Jilin Province after 2019 to promote primary industry development, the output value grew rapidly. The supply–demand ratio showed a downward trend, indicating that the future development trend of meat supply will exceed demand.

4.2.3. Ecological Environment Subsystem

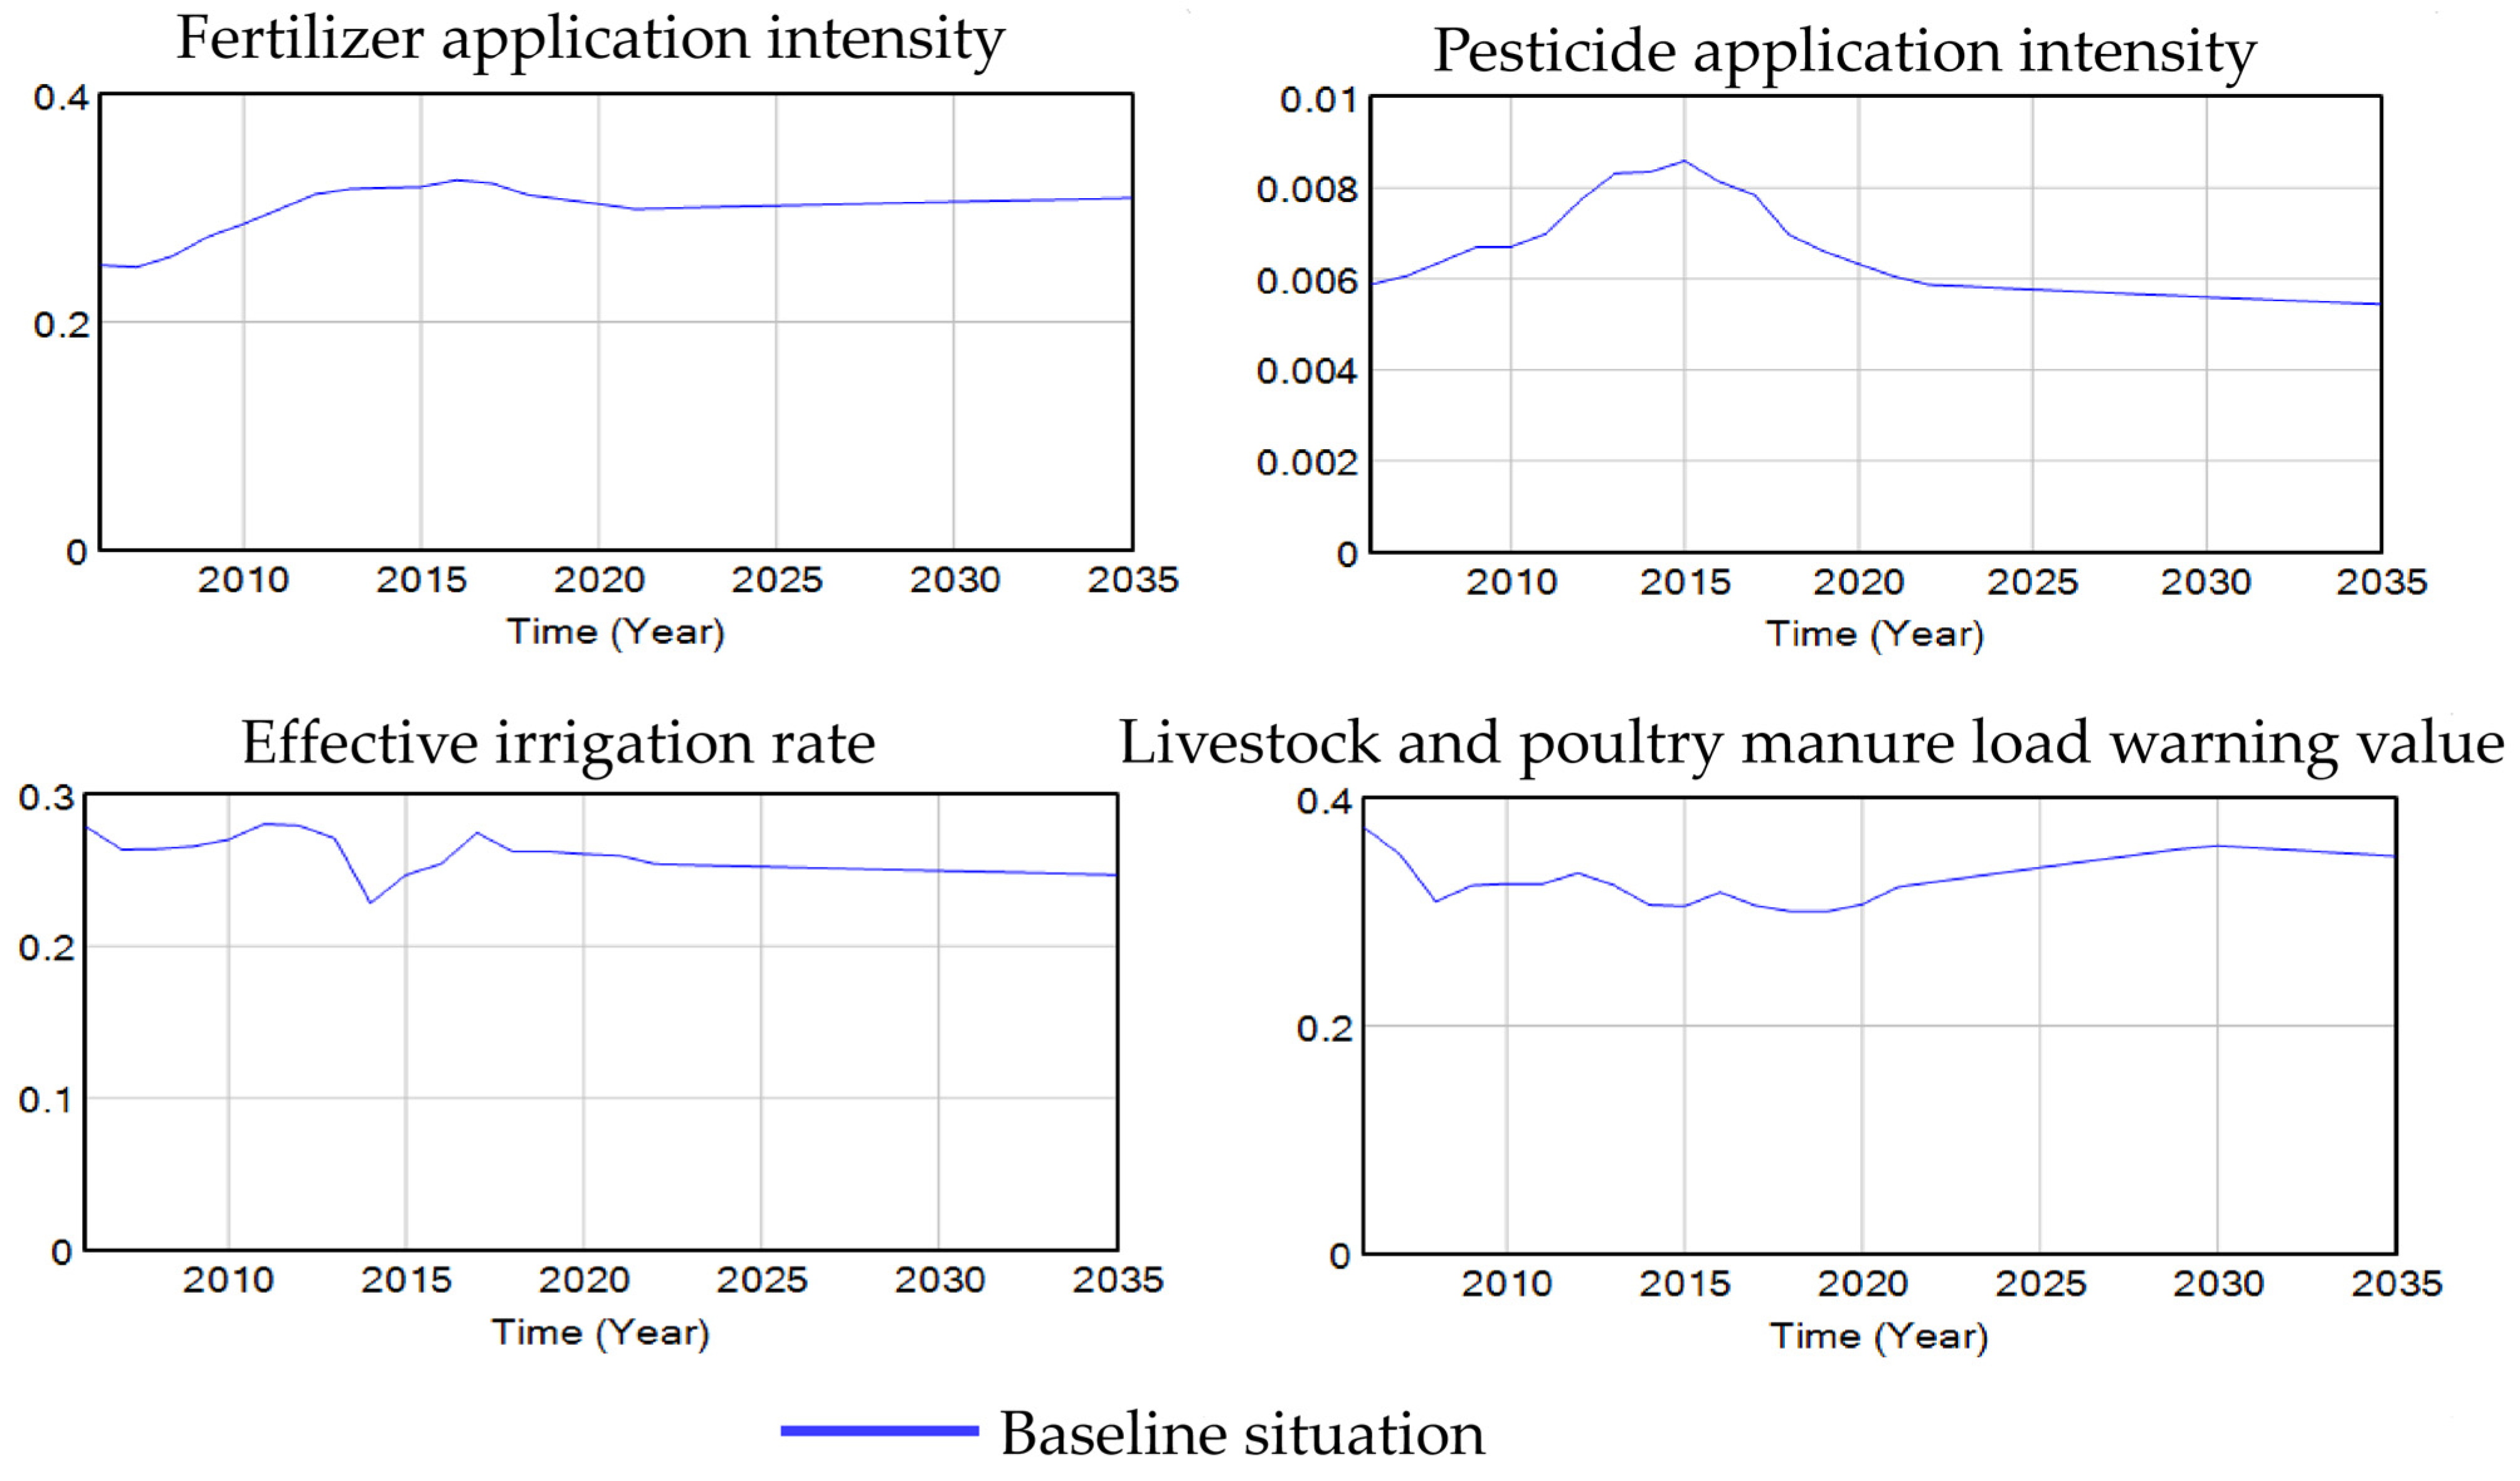
Figure 9 shows the trends in fertilizer application intensity, pesticide application intensity, effective irrigation rate, and livestock and poultry manure load warning values.
It can be observed that fertilizer application intensity initially increased, and then remained stable after 2020. Pesticide application intensity fluctuated upward from 2006 to 2015, then declined, gradually stabilizing after 2020. Effective irrigated rate showed a slight increase from 2006 to 2012, followed by a sharp decline in 2013 before rising steadily. It is projected to stabilize in the future, while the effective irrigation rate exhibits a fluctuating downward trend. The livestock and poultry manure load warning value shows a slight upward trend, projected to reach 0.35 by 2035—a level posing no environmental pollution threat.

4.3. Simulation-Based Optimization Analysis of Integrated Crop–Livestock Systems Under Multiple Scenarios

The system dynamics model for integrated crop–livestock farming in Jilin Province developed in this paper effectively simulates the actual conditions of such farming practices in the province. Beyond predicting future trends, it also reveals the impact of parameters under different policy scenarios. Therefore, parameter adjustments were made for the integrated farming system, the socio-economic system, and the ecological environment system, respectively, to conduct simulation optimization analysis for integrated farming in Jilin Province from 2022 to 2035. According to key directives from Jilin Provincial Government documents: (1) The 14th Five-Year Plan for National Economic and Social Development of Jilin Province and the Outline of Long-Term Objectives Through 2035 sets a target of 65% for the urbanization rate of the permanent resident population by 2025. (2) The 2023 Jilin Provincial Party Committee Document No. 1: Implementation Opinions of the CPC Jilin Provincial Committee and Jilin Provincial People’s Government on Building an Agricultural Powerhouse, Enhancing Grain Production Capacity, and Comprehensively Advancing Rural Revitalization, stipulates that the province’s grain sowing area should reach 91 million mu (6.07 million hectares), with grain output stabilizing at over 40 million tons under normal conditions. (3) The General Office of the People’s Government of Jilin Province issued the Jilin Province Beef Cattle Industry Development Plan, which states that by 2025, the total beef cattle breeding scale in the province will reach 10 million heads. This includes 6 million heads in inventory and 4 million heads for slaughter. Straw utilization for feed will reach 24 million tons, accounting for 60% of the total straw volume. The Implementation Opinions on Promoting High-Quality Development of Animal Husbandry indicate that, by 2025, the province aims to reach 30 million heads of pigs and 7 million heads of beef cattle. The resource utilization rate of livestock and poultry manure will exceed 85%. According to the Implementation Plan for Coordinated Promotion of Livestock and Poultry Manure Resource Utilization Across Jilin Province, the comprehensive utilization rate of livestock and poultry manure will stabilize at over 85% by 2025, effectively curbing its environmental impact.
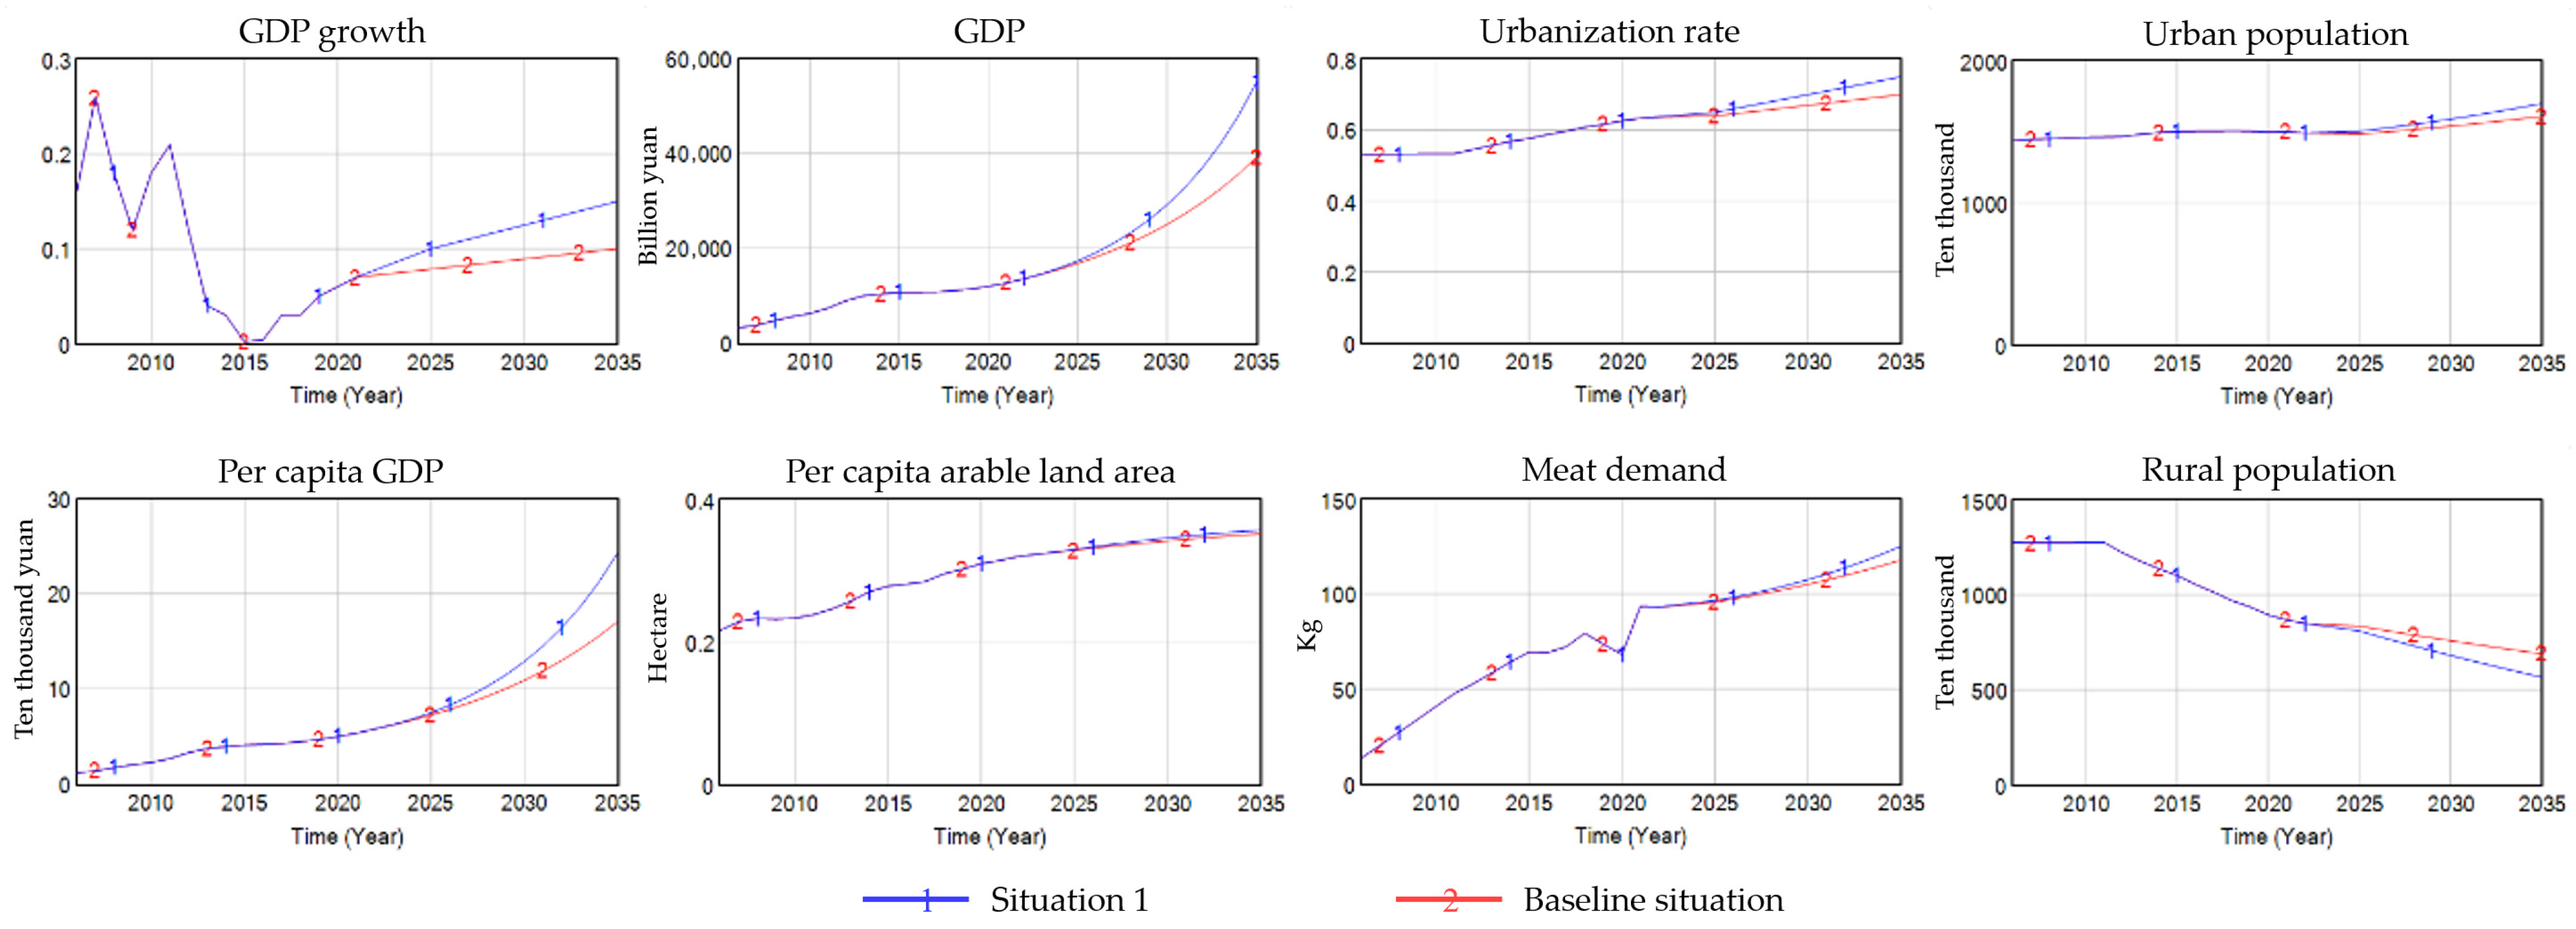
Scenario 1: Enhanced Economic Growth Model. Assuming an urbanization rate of 65% by 2025, representing a 5% increase over the baseline period by 2035. GDP growth rate increases by 5% compared to the baseline period. Adjusted results are shown in Figure 10.
By 2035, the urbanization rate reaches 75%, with an urban population of 16.9989 million—an increase of 904, 900 people compared to the pre-optimization scenario. This rise in urbanization rate will drive transformations in agricultural production methods, promote agricultural modernization, enhance the quality and yield of agricultural products, and create more favorable conditions for integrated crop–livestock development. The rural population in 2035 stands at 5.6663 million, a decrease of 1.23112 million compared to the pre-optimization scenario. The migration of labor to urban areas and the resulting reduction in agricultural labor will drive agricultural production toward greater mechanization and intelligentization, thereby improving production efficiency and positively impacting the development of integrated crop–livestock farming. As the urbanization rate increases, the income levels and consumption capacity of urban residents will also rise accordingly. This will boost demand for agricultural products and promote the development of integrated crop–livestock farming in Jilin Province. The supply–demand ratio will decrease, with meat demand reaching 1.2527 million tons by 2035—an increase of 73,380 tons compared to the optimized scenario. GDP will rise by 1.58235 trillion yuan, and per capita GDP will grow by 60,000 yuan. Although the total population shows a slight decline compared to the optimized scenario, the trend of population reduction is countered by an increase in meat demand.
As economic development and living standards improve, dietary patterns may shift toward higher consumption of high-protein meat products. Urbanization, in particular, may lead to more Westernized lifestyles and eating habits, further boosting meat demand. This presents both challenges and opportunities for the integrated farming and animal husbandry industry chain and agricultural sustainability. Emphasis on product quality and safety will guide crop cultivation and animal husbandry toward more eco-friendly practices.
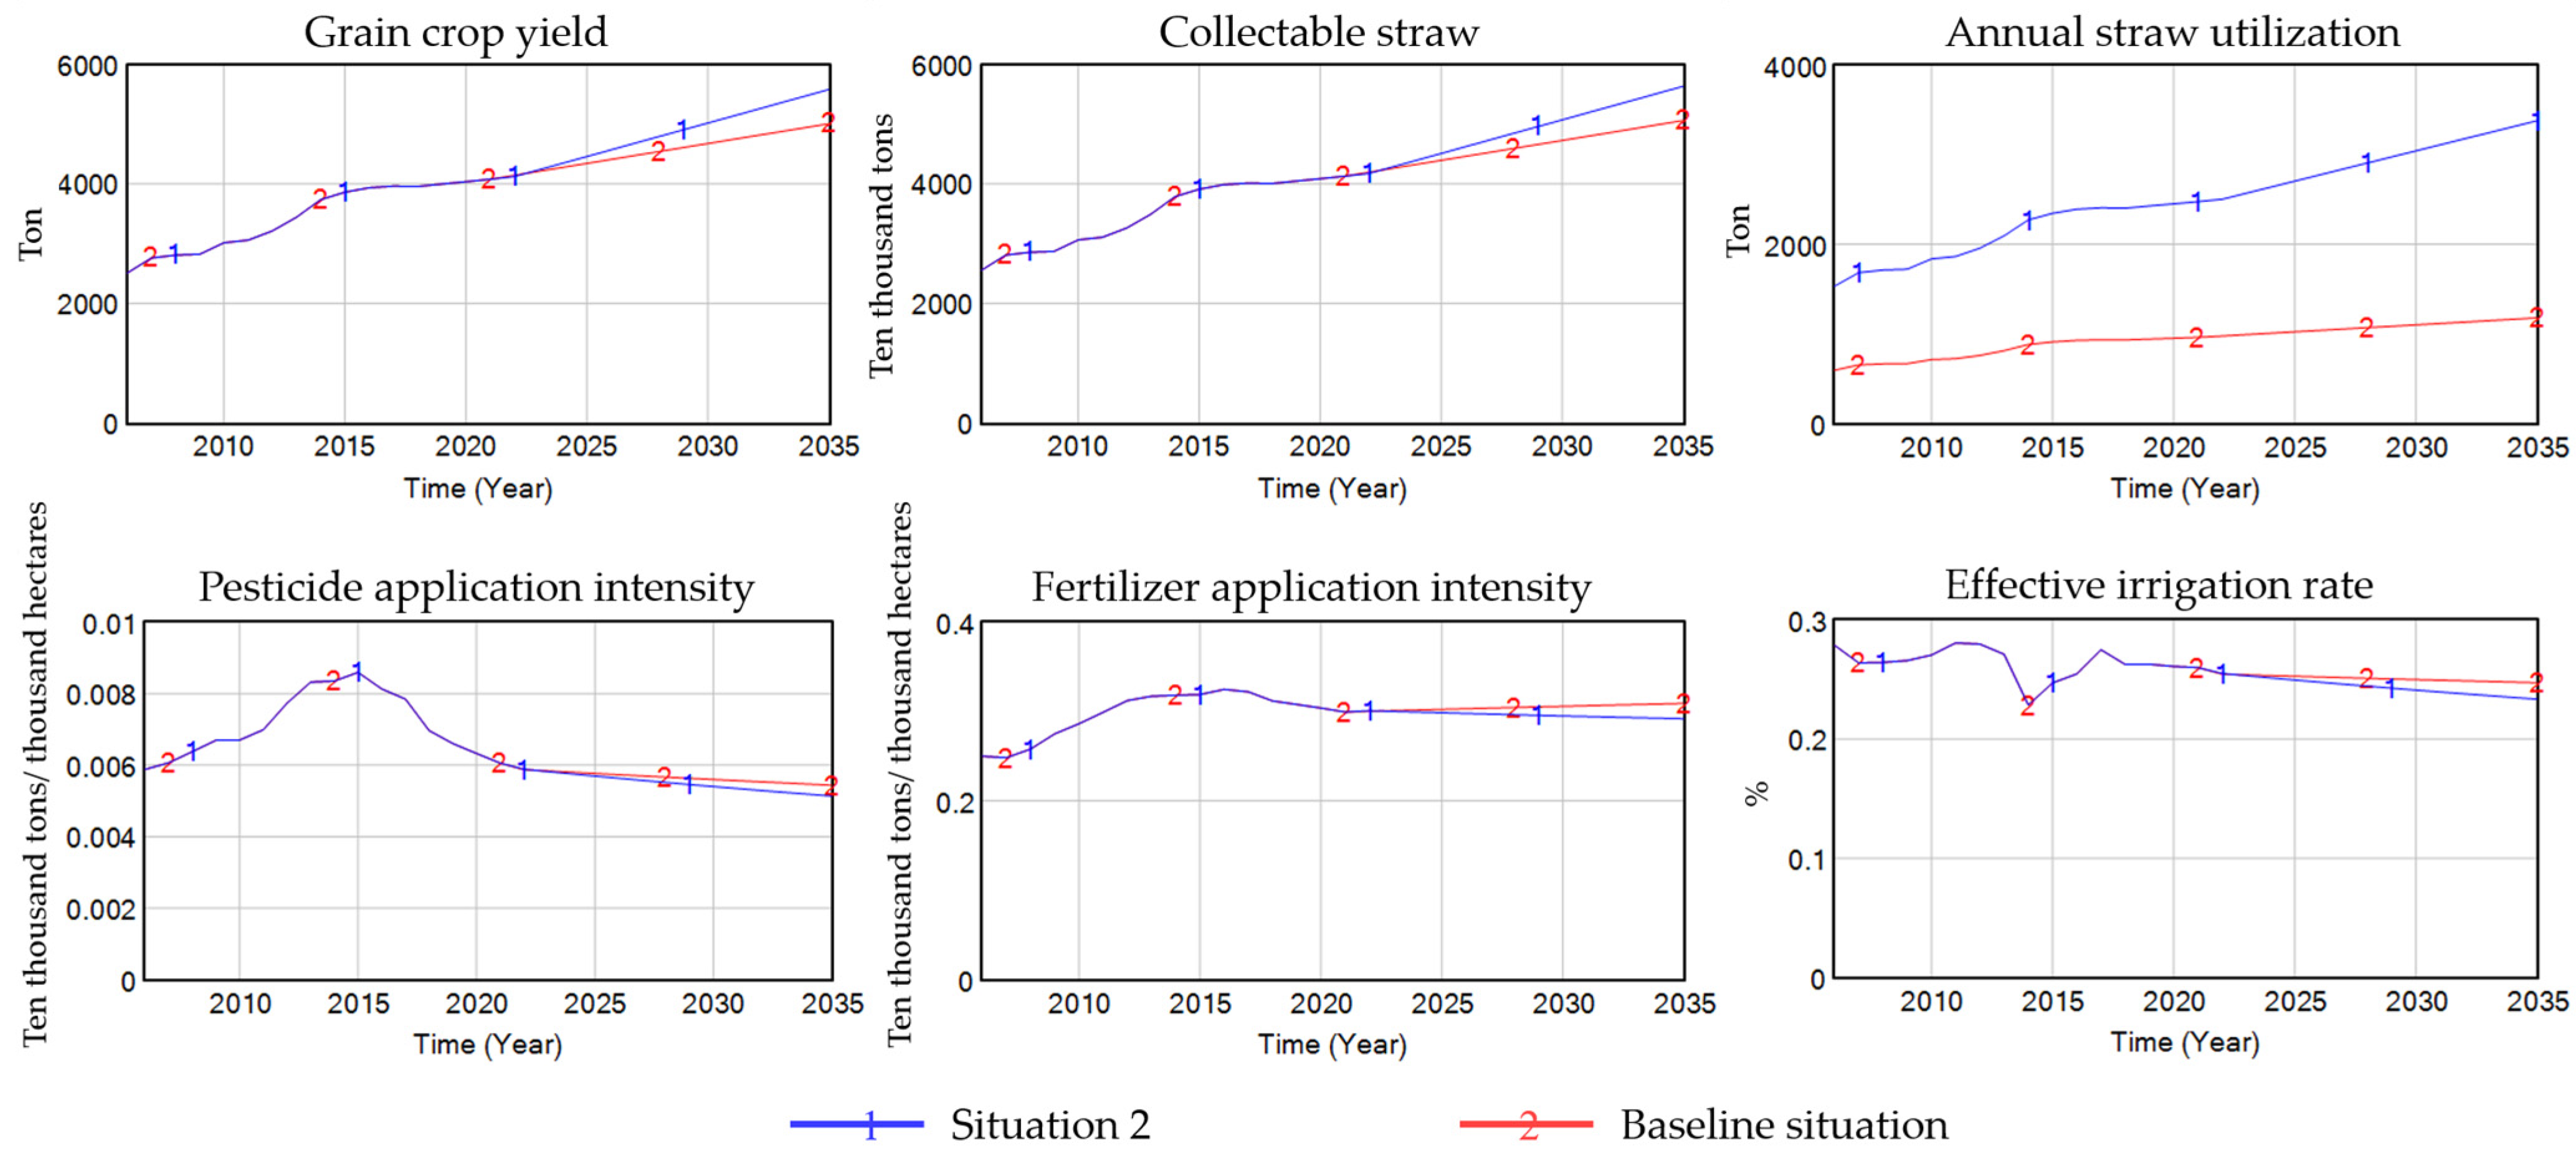
Scenario 2: Enhancing Agricultural Technology for Stable Production and Increased Income. Assuming grain crop yields exceed 40 million tons by 2025 and straw feed utilization reaches 60%. The optimized results after adjustment are shown in Figure 11.
Grain crop production has stabilized above 40 million tons. The steady increase in grain output indicates expanded planting areas, enabling greater availability of forage crops and providing more abundant feed sources for livestock and poultry farming. This supports the development of integrated crop–livestock systems. The amount of straw collectable straw is projected to reach 56.3645 million tons by 2035, an increase of 5.7387 million tons compared to pre-optimization levels. The increased annual utilization rate of straw promotes its return to fields, facilitating nutrient recycling in farmland and boosting crop yields. Higher grain output ensures ample feed raw material supply, enabling the livestock industry to more readily access high-quality feed. This accelerates animal growth rates and improves meat quality. With increased feed availability, livestock feed costs may decrease. Lower production costs provide greater incentive to expand farming scale, increase output, and enhance profit margins. Both pesticide and fertilizer application intensities show slight decreases, indicating that while increased grain production requires more fertilizers, the rational use of organic fertilizers reduces fertilizer consumption. Higher grain yields will lead to greater water demand, yet the effective irrigation rate has decreased by 0.02% compared to the pre-optimization level. Improving the effective irrigation rate is essential to prevent future water waste. Rational water utilization and management must accompany increased production.
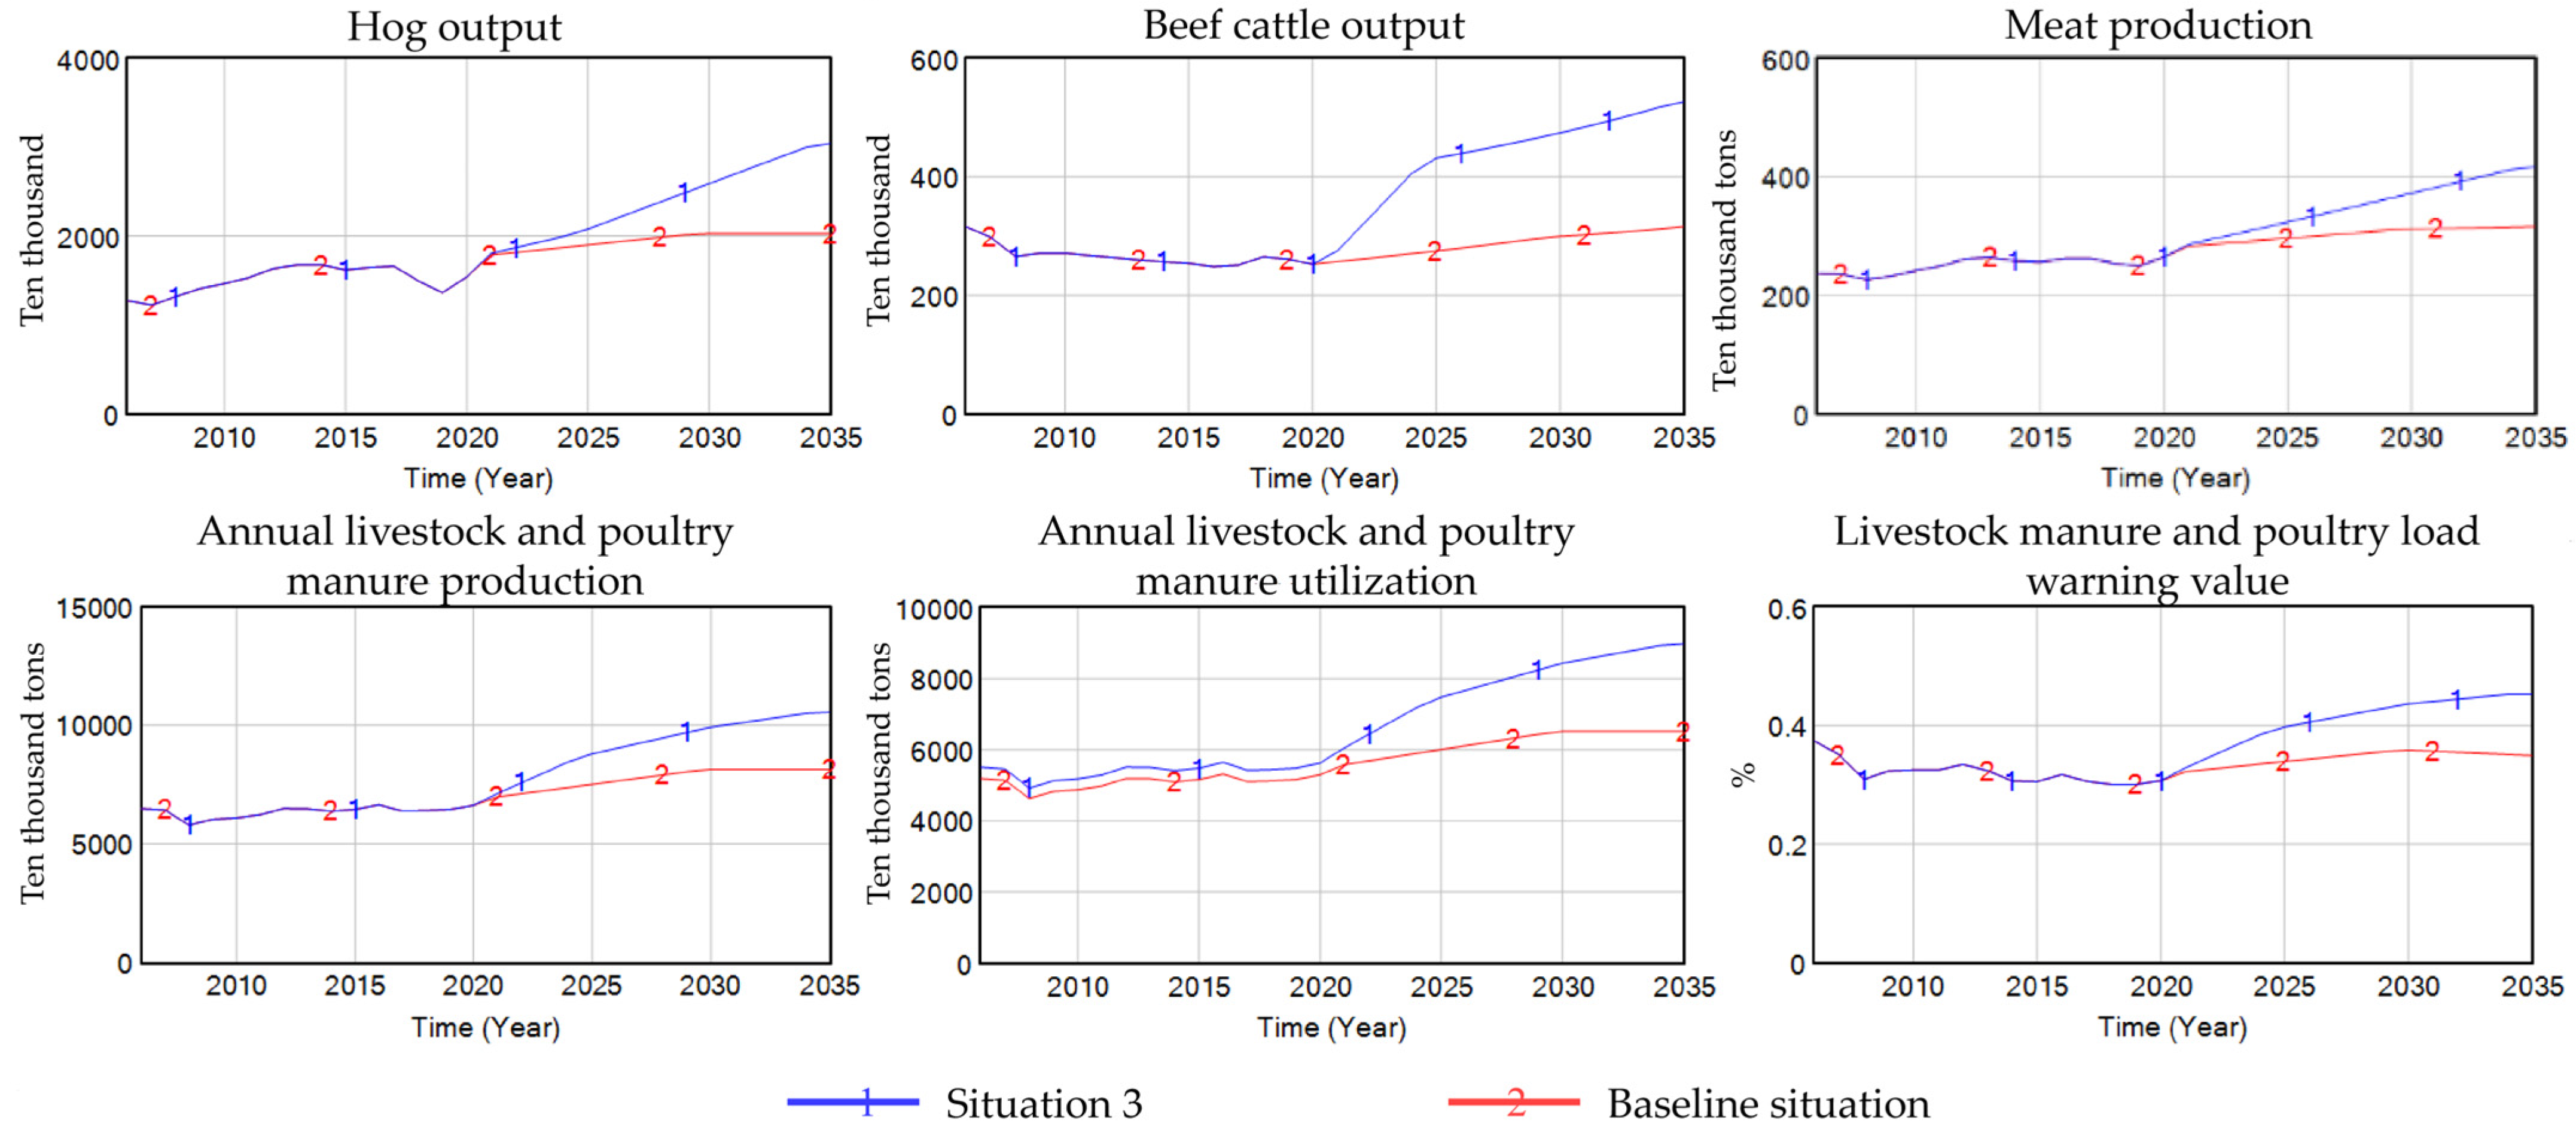
Scenario 3: Expanded Livestock Scale Model. Assuming 4 million beef cattle and 20 million pigs are marketed by 2025, with an 85% livestock and poultry manure utilization rate. The optimized results after adjustments are shown in Figure 12.
By 2035, hog output will reach 30.425 million head, an increase of 10.1583 million head compared to pre-optimization levels. Beef cattle output reaches 5.26674 million head, an increase of 2.1027 million head. Under the influence of the Ten-Million-Head Cattle Project, more cattle are raised, and meat production also increases by 1.00957 million tons. As beef cattle and hog output increase, manure production will correspondingly rise. Manure contains substantial nutrients like nitrogen and phosphorus. Without proper treatment and utilization, it poses environmental pollution risks. With livestock and poultry manure utilization rates reaching 85%, annual livestock and poultry manure production in 2035 will hit 105.641 million tons. The livestock and poultry manure load reaches a warning threshold of 0.45, indicating a slight environmental threat. Massive manure discharge will pollute soil and water bodies. Nutrients like nitrogen and phosphorus will enter soil and groundwater through runoff and seepage, causing soil fertility imbalance and water eutrophication, thereby impacting the ecological environment.
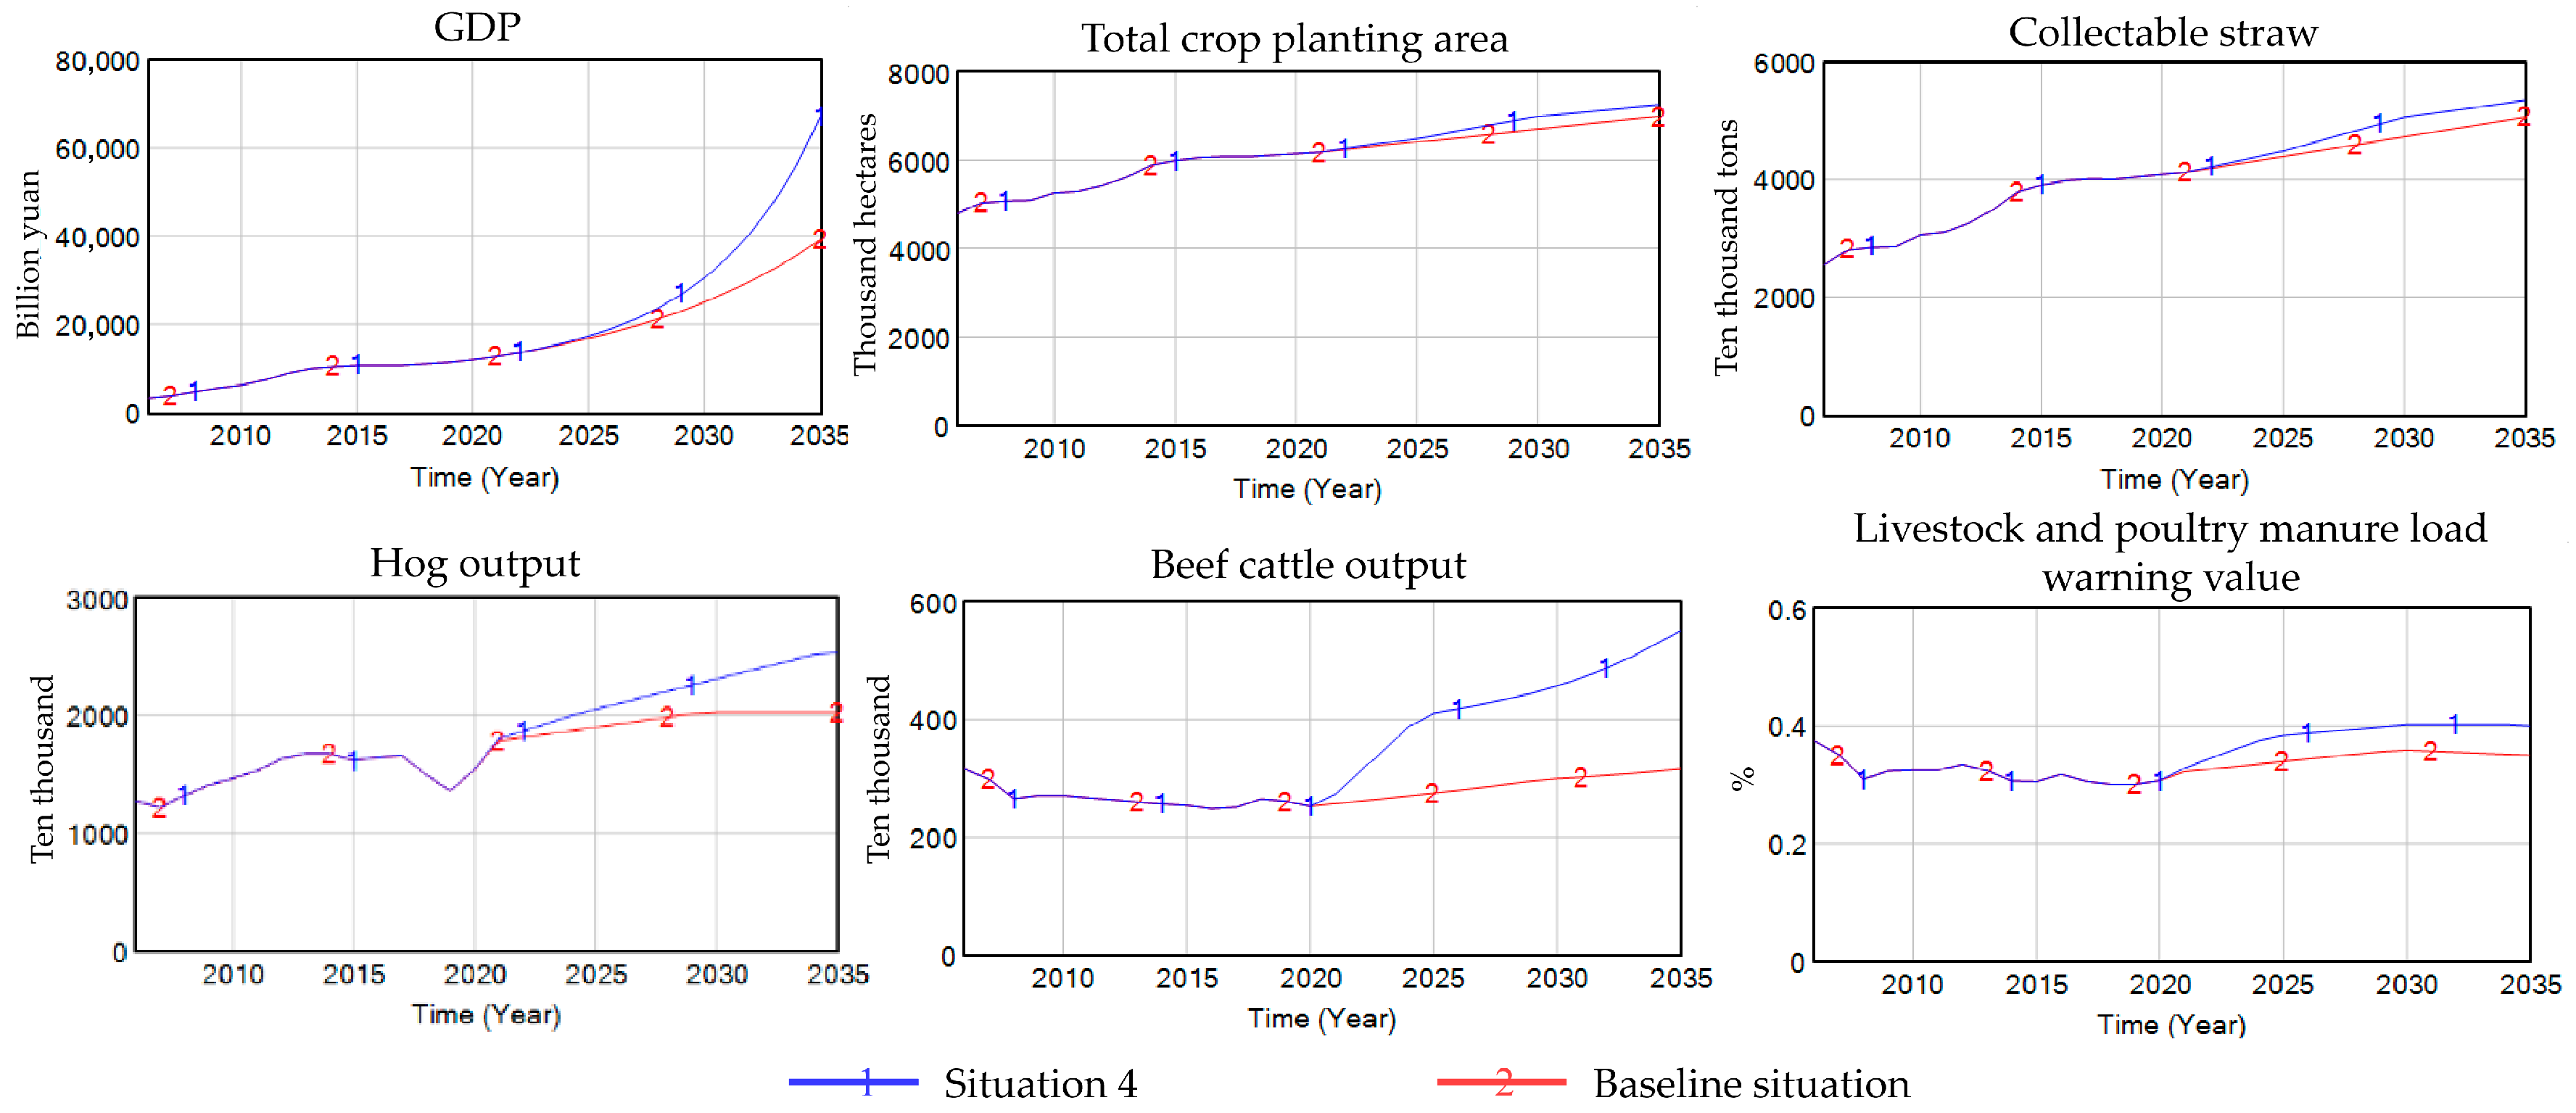
Scenario 4: Integrated crop–livestock development model. The optimized results combining the first three scenarios are shown in Figure 13.
By 2035, this integrated model demonstrates absolute superiority in balancing socioeconomic growth with ecological constraints. Economically, GDP is projected to reach 669.149 billion yuan, significantly outperforming both the baseline scenario (an increase of 277.408 billion yuan) and the purely economy-focused Scenario 1 (an increase of 119.173 billion yuan). Concurrently, grain crop yield peaks at 52.5958 million tons, robustly securing regional food supply targets. Scenario 4’s most critical advantage lies in its strategic balancing of livestock scale against environmental carrying capacity. While projected hog output (25.3542 million head) and beef cattle output (5.50643 million head) are slightly lower than the aggressive expansion scale in Scenario 3, this moderate deceleration represents a deliberate and highly rational planning choice. By maintaining livestock production at this optimal scale, Scenario 4 successfully keeps the livestock and poultry manure load warning threshold at 0.39, indicating no environmental pollution. This SD framework is universally applicable to other agricultural regions by recalibrating local parameters to address system decoupling.

5. Discussion

This paper constructs a system dynamics model for integrated crop–livestock farming. By defining scenarios to meet practical planning needs, it simulates and analyzes the trends of integrated farming patterns in Jilin Province from 2006 to 2021. We analyzed resource and environmental impacts under different scenarios to provide a scientific basis for maximizing resource utilization and minimizing environmental burden. Based on system simulation, the amount of straw collected and utilized in this study only includes maize, rice, and soybean. The estimated collectible straw resource in 2006 was 25.5499 million tons, which differs by only 3.7% from the 26.545 million tons estimated by Liu (2010) for the same year [64]. From 2016 to 2020, the trend aligns with Zhang’s 2023 study, peaking in 2017. The discrepancy likely arises from the lack of a standardized harvest index and slight variations in the collection coefficients used [65].
In 2020, the total livestock and poultry manure emissions were 66.229 million tons, compared with 63.9156 million tons reported by Wang (2023), yielding a difference of 2.3134 million tons, or a 3.6% discrepancy [57]. The discrepancy may stem from our use of marketed livestock numbers for calculation. From 2013 to 2018, the developmental trend of the livestock and poultry manure load warning value exhibits an inverted U-shaped pattern, consistent with Che (2023) [66]. Some data were missing during model construction and were replaced with average values for computational convenience. The selected maximum suitable organic fertilizer application rate reflects the commonly used theoretical value. Additionally, due to regional differences in climate, cropping systems, soil types, and soil environments, the capacity to assimilate livestock and poultry manure varies across locations.
Therefore, subsequent studies can determine the optimal application rates of organic fertilizers for farmland based on regional characteristics. According to multi-scenario optimization results, simply expanding planting and livestock scales may lead to wasteful use of straw resources and excessive livestock and poultry manure emissions. To prevent environmental pollution, it is necessary to control both livestock farming scale and cropland area. By 2035, the total crop planting area should be limited to 7250 thousand hectares, with annual hog output capped at 25 million heads and beef cattle output at 4.25 million heads. Only then can Jilin Province ensure its overall livestock and poultry manure load remains below the 0.4 warning threshold, achieving balanced crop–livestock integration while maximizing economic benefits.

6. Recommendations

Based on the current status of integrated crop–livestock systems in Jilin Province and the outcomes of system dynamics simulations, the following recommendations are put forward to support the region’s green and sustainable development:
Optimize crop structure: Promote diversified cropping and establish standardized forage bases aligned with livestock feed requirements to reduce dependence on corn. Increase the share of legumes, minor cereals, and other crops to ensure food self-sufficiency while harnessing the nitrogen-fixing benefits of green manure crops. This will improve land use efficiency, stabilize ecosystem function, expand specialty crop cultivation without compromising grain production goals, safeguard arable land, restore high-quality black soil to support stable yield growth, encourage crop rotation and intercropping to enhance soil structure and nutrient cycling, lower pest pressures, and reduce fertilizer inputs.
Advance precision agriculture and animal husbandry technologies: Leverage modern information and biotechnology to boost production efficiency while minimizing resource waste and environmental pollution. Optimize irrigation infrastructure for scientific water use and higher effective irrigation rates. Deploy intelligent monitoring systems to track crop and livestock environments in real time, enabling timely management adjustments.
Develop resource recycling initiatives. Given substantial straw production, high levels of agricultural and livestock intensification, and underutilization of manure resources, a disjunction persists between land nutrient demand and supply. Livestock and poultry manure is not efficiently applied locally, and insufficient organic fertilization has led to significant declines in soil organic matter. Promote integrated farming–breeding–processing systems, standardize recycling of slaughterhouse byproducts, and prioritize deep processing of organic fertilizers. In comprehensive straw utilization projects, emphasize silage production, carbonization for soil amendment, and straw as a renewable fuel.
Strengthen policy support and technology dissemination: Offer fiscal subsidies and tax incentives to encourage adoption of integrated crop–livestock models. Provide targeted financial assistance to farmers and enterprises that implement environmentally sustainable practices. Organize extension services and technical training to improve farmers’ understanding and operational proficiency in integrated systems. Champion advanced agricultural technologies, such as bio-organic fertilizers and circular utilization of crop and livestock byproducts. Regularly host training and exchange events to build farmers’ scientific and technological capacity, facilitating their transition to modern agricultural practices. Support mastery of contemporary crop cultivation and livestock management techniques to enhance productivity and product quality.

7. Limitations and Outlook

The model data constructed in this study are derived solely from statistical yearbook data without field surveys, potentially introducing slight biases. The straw collection and utilization indicator only selected three major crops, which may cause calculation errors. Furthermore, due to the complexity of crop–livestock integration in Jilin Province and numerous influencing factors, most causal loops in the model are positive with few negative loops, which may affect the output results. Regarding model construction, not all variables influencing crop–livestock integration were comprehensively listed. To enhance variable accuracy, future studies could incorporate objective weighting methods, such as entropy weighting, for in-depth variable analysis. Additional indicators like technological investment and policy subsidies could be added to examine their systemic impacts and conduct multi-scenario governance analyses. Furthermore, simulation results are highly sensitive to assumptions regarding pollutant carrying capacity. The actual pollutant carrying capacity of soil is influenced by local factors such as soil organic matter, microbial activity, and climatic conditions. If the actual absorption capacity falls below the assumed value due to soil degradation or cold climatic conditions, the livestock and poultry manure load warning may exceed the 0.4 safety threshold. The accuracy of these assumptions is critical, and future field investigations are needed to refine these parameters for the specific agricultural environment of Jilin Province. Although the simulation effectively captures the province’s development trends, the model still carries a degree of uncertainty due to its reliance on statistical yearbooks and the selection of fixed biological coefficients. Additionally, regional heterogeneity represents another critical factor affecting the accuracy of local predictions. For instance, within Jilin Province, agricultural intensity in the black soil region significantly exceeds the provincial average. Using aggregated provincial data may obscure the environmental pressures faced locally in these high-yield areas. Future research should integrate field surveys with spatially explicit data to better reflect these internal variations within regions.

8. Conclusions

By organizing data from 2006 to 2021 and focusing on integrated crop–livestock systems in Jilin Province, a comprehensive system model was developed using system dynamics. Simulation results showed an error margin of less than 10%, indicating the model aligns with actual conditions and is suitable for further research. Simulation analysis indicates that under current trends, future agricultural output and resource utilization rates will continue to increase. Meanwhile, although environmental pollutant loads will rise before 2035, they will remain within safe thresholds.
Multi-scenario simulation optimization analysis of integrated crop–livestock farming in Jilin Province was conducted, establishing four scenarios: accelerated economic growth model, agricultural technology enhancement for stable production and income growth model, livestock scale expansion model, and comprehensive integrated crop–livestock development model. The comprehensive integrated model demonstrated superior socio-economic and ecological benefits compared to other scenarios.
The system dynamics framework established in this study exhibits strong versatility. This analytical approach can be effectively extended to other agricultural regions facing similar challenges, providing scientific reference for sustainable agricultural planning and policy formulation worldwide.

Author Contributions

Conceptualization, Y.X. and X.L.; methodology, X.L.; software, X.L.; validation, Y.X. and H.G.; formal analysis, X.L.; investigation, X.L.; resources, Y.X.; data curation, Y.X.; writing—original draft preparation, X.L.; writing—review and editing, Y.X.; visualization, Y.X.; supervision, S.X.; project administration, H.G.; funding acquisition, Y.X., S.X. and H.G. All authors have read and agreed to the published version of the manuscript.

Funding

This research was funded by China Scholarship Council [grant numbers 202306170513], Humanities and Social Science Fund of Ministry of Education [grant numbers 24YJA790009] and Social Science Research Project of the Education Department of Jilin Province [grant numbers JJKH20241360SK].

Data Availability Statement

The original data presented in the study are openly available in the China Statistical Yearbook at https://www.stats.gov.cn/sj/ndsj/ accessed on 23 January 2026, China Rural Statistical Yearbook at https://www.stats.gov.cn/sj/ndsj/ accessed on 23 January 2026, Jilin Statistical Yearbook at https://tjj.jl.gov.cn/tjsj/tjnj/ accessed on 23 January 2026, the National Bureau of Statistics website at https://www.stats.gov.cn/ accessed on 23 January 2026, the Jilin Provincial Statistical Bulletin on National Economic and Social Development at https://tjj.jl.gov.cn/tjsj/tjgb/ndgb/index.html accessed on 23 January 2026, and the Jilin Provincial Land Survey Key Data Bulletin at https://zrzy.jl.gov.cn/zwgk/tjxx/td/202311/t20231123_8841498.html accessed on 23 January 2026.

Conflicts of Interest

The authors declare no conflicts of interest.

Appendix A

Table A1. Parameters and Key Equations of Jilin Province’s Integrated Crop–Livestock Subsystem.
SystemVariableEquationDescription
Integrated Crop–Livestock SubsystemGrain Crop Yield1.0749 × Grain crop planting area − 2056.3Regression Analysis
Cash Crop YieldTable function for time/
Collectable straw(Soybean yield × soybean straw-to-grain ratio + Rice yield × rice straw-to-grain ratio + Corn yield × corn straw-to-grain ratio) × 0.89/
Total crop planting areaTime table function/
Grain crop planting area1.06502 × Total crop planting area − 881.8Regression Analysis
Cash crop planting areaTime table function/
Hog outputChange in hog output × (1 + Livestock and poultry manure utilization rate/20)Regression analysis
Beef cattle outputChange in beef cattle output × (1 + per capita GDP/100)Regression analysis
Beef cattle inventory2.39906 × Beef cattle output − 224.267Regression analysis
Corn straw-to-grain ratio, Soybean straw-to-grain ratio, Rice straw-to-grain ratio1.2, 1.0, 1.6Refer to existing literature [58]
Change in livestock and poultry manure utilizationAnnual increase in organic fertilizer applied to fields × 3.7 + Livestock and poultry manure utilization rate × Other livestock and poultry manure productionRegression Analysis
Livestock and poultry manure utilization rateAnnual livestock and poultry manure utilization/Annual livestock and poultry manure production/
Table A2. Parameters and Key Equations of Jilin Province’s Socio-Economic Subsystem.
SystemVariableEquationDescription
Socio-Economic SubsystemGDPINTEG (GDP growth, initial GDP)Integral
GDP growthGDP × GDP growth rate/
GDP growth ratetime table function/
Per capita GDPGDP per capita/
Primary industry shareTime table function/
Primary industry output valueGDP × Primary industry share/
Total PopulationINTEG (Population growth, Initial population)Integral
Population growth rateTime table function/
Population growthTotal Population × Population growth rate/
Urban populationUrbanization rate × Total population/
Urbanization rateTime table function/
Rural populationTotal population × (1 − Urbanization rate)/
Rural per capita meat consumptionTime table function/
Urban per capita meat consumptionTime table function/
Rural per capita meat demandRural per capita meat consumption × Rural population/1000/
Urban per capita meat demandUrban per capita meat consumption × Urban population/1000/
Meat productionHog output + Beef cattle output + Other meat production/
Other meat productionTime table function/
Supply–demand ratioMeat Production/Meat Demand/
Table A3. Parameters and Key Equations of Jilin Province’s Ecological Environment Subsystem.
SystemVariableEquationDescription
Ecological Environment SubsystemArable land area3514 + 0.8 × Grain crop planting area − 2 × Cash Crop Planting AreaRegression Analysis
Per capita arable land areaArable land area/Total population/
Effectively irrigated areaTime table function/
Effective irrigation rateEffective irrigated area/Arable land area/
Fertilizer application volumeTime table function/
Fertilizer application intensityFertilizer application volume/Arable land area × 10/
Pesticide application rateTime table function/
Pesticide application intensityPesticide usage volume/Arable land area × 10/
Annual livestock and poultry manure productionOther livestock and poultry manure emissions + (Change in hog output × Pig farming pollution coefficient × 199 + Change in beef cattle output ×Cattle farming pollution coefficient × 365 × 0.69)/1000Regression Analysis
Livestock manure emissionsINTEG (Current manure discharge volume, Initial manure discharge volume)Integral
Other livestock and poultry manure generationTable function for time/
Livestock and poultry manure load warning valueAnnual livestock and poultry manure production/(Arable land area × 0.1 ×Maximum pollutant carrying capacity of cultivated land)Refer to existing literature [57]
Maximum pollutant carrying capacity of cultivated land30Refer to existing literature [53]
Annual straw burning volumeBurning Ratio × Straw Stockpile/

References

  1. Rampa, A.; Gadanakis, Y.; Rose, G. Land Reform in the Era of Global Warming—Can Land Reforms Help Agriculture Be Climate-Smart? Land 2020, 9, 471. [Google Scholar] [CrossRef]
  2. Li, X.; Liu, G. Dynamics and Determinants of China’s Inter-Provincial Staple Food Flow Resilience: A Network Perspective. Systems 2026, 14, 17. [Google Scholar] [CrossRef]
  3. Rankoana, S. Perceptions of Climate Change and the Potential for Adaptation in a Rural Community in Limpopo Province, South Africa. Sustainability 2016, 8, 672. [Google Scholar] [CrossRef]
  4. Feng, D.; Mao, K.; Yang, Y.; Hu, Y. Crop-Livestock Integration for Sustainable Agriculture in China: The History of State Policy Goals, Reform Opportunities and Institutional Constraints. Front. Agric. Sci. Eng. 2023, 10, 518–529. [Google Scholar] [CrossRef]
  5. Xia, Y.; Xu, S.; Guo, H. How temperature changes affect risk attitudes: Evidence from 1,708 farming households in China. Sci. Total Environ. 2025, 994, 180033. [Google Scholar] [CrossRef]
  6. Garrett, R.D.; Ryschawy, J.; Bell, L.W.; Cortner, O.; Ferreira, J.; Garik, A.V.N.; Gil, J.D.B.; Klerkx, L.; Moraine, M.; Peterson, C.A.; et al. Drivers of decoupling and recoupling of crop and livestock systems at farm and territorial scales. Ecol. Soc. 2020, 25, 24. [Google Scholar] [CrossRef]
  7. Jin, S.; Zhang, B.; Wu, B.; Han, D.; Hu, Y.; Ren, C.; Zhang, C.; Wei, X.; Wu, Y.; Mol, A.P.J.; et al. Decoupling livestock and crop production at the household level in China. Nat. Sustain. 2021, 4, 48–55. [Google Scholar] [CrossRef]
  8. Fanchone, A.; Alexandre, G.; Hostiou, N. Work organization as a barrier to crop-livestock integration practices: A case study in Guadeloupe. Agron. Sustain. Dev. 2022, 42, 54. [Google Scholar] [CrossRef]
  9. Ryschawy, J.; Martin, G.; Moraine, M.; Duru, M.; Therond, O. Designing crop–livestock integration at different levels: Toward new agroecological models? Nutr. Cycl. Agroecosyst. 2017, 108, 5–20. [Google Scholar] [CrossRef]
  10. Chadwick, D.; Sommer, S.; Thorman, R.; Fangueiro, D.; Cardenas, L.; Amon, B.; Misselbrook, T. Manure management: Implications for greenhouse gas emissions. Anim. Feed Sci. Technol. 2011, 166–167, 514–531. [Google Scholar] [CrossRef]
  11. Xia, L.; Lam, S.K.; Yan, X.; Chen, D. How Does Recycling of Livestock Manure in Agroecosystems Affect Crop Productivity, Reactive Nitrogen Losses, and Soil Carbon Balance? Environ. Sci. Technol. 2017, 51, 7450–7457. [Google Scholar] [CrossRef]
  12. Bouwman, L.; Goldewijk, K.K.; Van Der Hoek, K.W.; Beusen, A.H.W.; Van Vuuren, D.P.; Willems, J.; Rufino, M.C.; Stehfest, E. Exploring global changes in nitrogen and phosphorus cycles in agriculture induced by livestock production over the 1900-2050 period. Proc. Natl. Acad. Sci. USA 2011, 110, 20882–20887. [Google Scholar] [CrossRef] [PubMed]
  13. Sulc, R.M.; Franzluebbers, A.J. Exploring integrated crop-livestock systems in different ecoregions of the United States. Eur. J. Agron. 2014, 57, 21–30. [Google Scholar] [CrossRef]
  14. dos Reis, J.C.; Kamoi, M.Y.T.; Latorraca, D.; Chen, R.F.F.; Michetti, M.; Wruck, F.J.; Garrett, R.D.; Valentim, J.F.; Rodrigues, R.d.A.R.; Rodrigues-Filho, S. Assessing the economic viability of integrated crop−livestock systems in Mato Grosso, Brazil. Renew. Agric. Food Syst. 2020, 35, 631–642. [Google Scholar] [CrossRef]
  15. Cansino, J.M.; Pablo-Romero, M.d.P.; Roman, R.; Yniguez, R. Promotion of biofuel consumption in the transport sector: An EU-27 perspective. Renew. Sustain. Energy Rev. 2012, 16, 6013–6021. [Google Scholar] [CrossRef]
  16. Bai, Z.; Ma, L.; Jin, S.; Ma, W.; Velthof, G.L.; Oenema, O.; Liu, L.; Chadwick, D.; Zhang, F. Nitrogen, Phosphorus, and Potassium Flows through the Manure Management Chain in China. Environ. Sci. Technol. 2016, 50, 13409–13418. [Google Scholar] [CrossRef]
  17. Gu, B. Recoupling livestock and crops. Nat. Food 2022, 3, 102–103. [Google Scholar] [CrossRef]
  18. Guo, H.; Xia, Y.; Jin, J.; Pan, C. The impact of climate change on the efficiency of agricultural production in the world’s main agricultural regions. Environ. Impact Assess. Rev. 2022, 97, 106891. [Google Scholar] [CrossRef]
  19. Xia, Y.; Guo, H.; Xu, S.; Pan, C. Environmental regulations and agricultural carbon emissions efficiency: Evidence from rural China. Heliyon 2024, 10, e25677. [Google Scholar] [CrossRef]
  20. Yu, C.; Huang, X.; Chen, H.; Godfray, H.C.J.; Wright, J.S.; Hall, J.W.; Gong, P.; Ni, S.; Qiao, S.; Huang, G.; et al. Managing nitrogen to restore water quality in China. Nature 2019, 567, 516–520. [Google Scholar] [CrossRef]
  21. Chen, L.; Wang, Y.; Yang, N.; Zhu, K.; Yan, X.; Bai, Z.; Zhai, L.; Shen, Z. Improving crop-livestock integration in China using numerical experiments at catchment and regional scales. Agric. Ecosyst. Environ. 2023, 341, 108192. [Google Scholar] [CrossRef]
  22. Gu, B.; Ju, X.; Chang, S.X.; Ge, Y.; Chang, J. Nitrogen use efficiencies in Chinese agricultural systems and implications for food security and environmental protection. Reg. Environ. Change 2017, 17, 1217–1227. [Google Scholar] [CrossRef]
  23. Xu, X.B.; Ye, Y.H.; Li, J.; Xu, Z.Y.; Sun, M.X.; Li, C.; Zhang, L.X.; Xue, Y.H. GHG emissions of straw treatments in rural China and scenario simulation based on life cycle perspective. J. Clean. Prod. 2022, 377, 134377. [Google Scholar] [CrossRef]
  24. Zhang, T.; Hou, Y.; Meng, T.; Ma, Y.; Tan, M.; Zhang, F.; Oenema, O. Replacing synthetic fertilizer by manure requires adjusted technology and incentives: A farm survey across China. Resour. Conserv. Recycl. 2021, 168, 105301. [Google Scholar] [CrossRef]
  25. Guo, H.; Xia, Y.; Pan, C.; Lei, Q.; Pan, H. Analysis in the Influencing Factors of Climate-Responsive Behaviors of Maize Growers: Evidence from China. Int. J. Environ. Res. Public Health 2022, 19, 4274. [Google Scholar] [CrossRef]
  26. Khangura, R.; Ferris, D.; Wagg, C.; Bowyer, J. Regenerative Agriculture-A Literature Review on the Practices and Mechanisms Used to Improve Soil Health. Sustainability 2023, 15, 2338. [Google Scholar] [CrossRef]
  27. Mabhaudhi, T.; Chibarabada, T.P.; Sikka, A. Status of integrated crop-livestock research in the mixed farming systems of the Global South: A scoping study. Front. Sustain. Food Syst. 2023, 7, 1241675. [Google Scholar] [CrossRef]
  28. Tan, K.; Cai, G.; Du, Z.; Chen, X.; Wang, X. Emergy synthesis of decoupling and recoupling crop-livestock systems under unified system boundary and modified indices. Sci. Total Environ. 2023, 877, 162880. [Google Scholar] [CrossRef]
  29. Jindo, K.; Audette, Y.; Higashikawa, F.S.; Silva, C.A.; Akashi, K.; Mastrolonardo, G.; Sánchez-Monedero, M.A.; Mondini, C. Role of biochar in promoting circular economy in the agriculture sector. Part 1: A review of the biochar roles in soil N, P and K cycles. Chem. Biol. Technol. Agric. 2020, 7, 15. [Google Scholar] [CrossRef]
  30. Abbas, F.; Hammad, H.M.; Anwar, F.; Farooque, A.A.; Jawad, R.; Bakhat, H.F.; Naeem, M.A.; Ahmad, S.; Qaisrani, S.A. Transforming a Valuable Bioresource to Biochar, Its Environmental Importance, and Potential Applications in Boosting Circular Bioeconomy While Promoting Sustainable Agriculture. Sustainability 2021, 13, 2599. [Google Scholar] [CrossRef]
  31. Islam, M.U.; Guo, Z.; Jiang, F.; Peng, X. Does straw return increase crop yield in the wheat-maize cropping system in China? A meta-analysis. Field Crops Res. 2022, 279, 108447. [Google Scholar] [CrossRef]
  32. Rufino, M.C.; Rowe, E.C.; Delve, R.J.; Giller, K.E. Nitrogen cycling efficiencies through resource-poor African crop–livestock systems. Agric. Ecosyst. Environ. 2006, 112, 261–282. [Google Scholar] [CrossRef]
  33. Rufino, M.C.; Gachene, C.K.K.; Diogo, R.V.C.; Hawkins, J.; Onyango, A.A.; Sanogo, O.M.; Wanyama, I.; Yesuf, G.; Pelster, D.E. Sustainable development of crop-livestock farms in Africa. Front. Agric. Sci. Eng. 2021, 8, 175–181. [Google Scholar] [CrossRef]
  34. Ibrahim, L.A.; Abu-Hashim, M.; Shaghaleh, H.; Elsadek, E.; Hamad, A.A.A.; Alhaj Hamoud, Y. A Comprehensive Review of the Multiple Uses of Water in Aquaculture-Integrated Agriculture Based on International and National Experiences. Water 2023, 15, 367. [Google Scholar] [CrossRef]
  35. Yifan, L.; Tiaoyan, W.; Shaodong, W.; Xucan, K.; Zhaoman, Z.; Hongyan, L.; Jiaolong, L. Developing integrated rice-animal farming based on climate and farmers choices. Agric. Syst. 2023, 204, 103554. [Google Scholar] [CrossRef]
  36. Yang, G.T.; Li, J.; Liu, Z.; Zhang, Y.T.; Xu, X.B.; Zhang, H.; Xu, Y. Research Trends in Crop-Livestock Systems: A Bibliometric Review. Int. J. Environ. Res. Public Health 2022, 19, 8563. [Google Scholar] [CrossRef]
  37. Golshani, F.; Asgharipour, M.R.; Ghanbari, A.; Seyedabadi, E. Environmental accounting for croplands, livestock husbandry, and integrated systems based on emergetic indicators. Energy Ecol. Environ. 2023, 8, 28–49. [Google Scholar] [CrossRef]
  38. Peng, Y.; Yan, G.; Ma, X.; Leng, Y. Assessment of Production Efficiency in the “Silage Corn + Livestock Farming” Integrated Model Using the Energy Value and Improved DEA-EBM Approach: A Case Study of Sichuan Province’s “Grain-to-Feed” Silage Corn Demonstration Zone. Resour. Environ. Arid Reg. 2019, 33, 68–76. [Google Scholar]
  39. Yang, H.; Wang, X.; Bin, P. Agriculture carbon-emission reduction and changing factors behind agricultural eco-efficiency growth in China. J. Clean. Prod. 2022, 334, 130193. [Google Scholar] [CrossRef]
  40. Molina-Moreno, V.; Carlos Leyva-Diaz, J.; Javier Llorens-Montes, F.; Joaquin Cortes-Garcia, F. Design of Indicators of Circular Economy as Instruments for the Evaluation of Sustainability and Efficiency in Wastewater from Pig Farming Industry. Water 2017, 9, 653. [Google Scholar] [CrossRef]
  41. Andrade, E.P.; Bonmati, A.; Esteller, L.J.; Vallejo, A.A. Assessment of social aspects across Europe resulting from the insertion of technologies for nutrient recovery and recycling in agriculture. Sustain. Prod. Consum. 2022, 31, 52–66. [Google Scholar] [CrossRef]
  42. Ogino, A.; Van Thu, N.; Hosen, Y.; Izumi, T.; Suzuki, T.; Sakai, T.; Ando, S.; Osada, T.; Kawashima, T. Environmental impacts of a rice-beef-biogas integrated system in the Mekong Delta, Vietnam evaluated by life cycle assessment. J. Environ. Manag. 2021, 294, 112900. [Google Scholar] [CrossRef] [PubMed]
  43. Mano Esteves, E.M.; Pecanha Esteves, V.P.; Bungenstab, D.J.; Fernandes Araujo, F.d.Q.; Vaz Morgado, C.d.R. Greenhouse gas emissions related to biodiesel from traditional soybean farming compared to integrated crop-livestock systems. J. Clean. Prod. 2018, 179, 81–92. [Google Scholar] [CrossRef]
  44. Jones, J.W.; Antle, J.M.; Basso, B.; Boote, K.J.; Conant, R.T.; Foster, I.; Godfray, H.C.J.; Herrero, M.; Howitt, R.E.; Janssen, S.; et al. Brief history of agricultural systems modeling. Agric. Syst. 2017, 155, 240–254. [Google Scholar] [CrossRef] [PubMed]
  45. Mo, J.; Wang, Y.; Bi, Y.; Zhou, K.; Qin, C.; Gao, C. Simulation and Optimization of Agricultural Structure in Zhucheng City Based on the SD Model. Agric. Resour. Reg. Plan. China 2019, 40, 146–157. [Google Scholar]
  46. Nada, R.S.; Ashmawi, A.E.; Mady, E.; Randhir, T.; Elateeq, A.A. Effect of Organic Manure and Plant Growth Promoting Microbes on Yield, Quality and Essential Oil Constituents of Fennel Bulb (Foeniculum vulgare Mill.). J. Ecol. Eng. 2022, 23, 149–164. [Google Scholar] [CrossRef]
  47. Zabaniotou, A.; Rovas, D.; Libutti, A.; Monteleone, M. Boosting circular economy and closing the loop in agriculture: Case study of a small-scale pyrolysis–biochar based system integrated in an olive farm in symbiosis with an olive mill. Environ. Dev. 2015, 14, 22–36. [Google Scholar] [CrossRef]
  48. Lu, X.; Song, Y. Study on the Income Effects of Family Farms Under the Integrated Crop-Livestock Model: A Case Study in Anhui Province. J. Inn. Mong. Agric. Univ. 2021, 23, 48–55. [Google Scholar]
  49. Villano, R.; Asante, B.O.; Bravo-Ureta, B. Farming systems and productivity gaps: Opportunities for improving smallholder performance in the Forest-Savannah transition zone of Ghana. Land Use Policy 2019, 82, 220–227. [Google Scholar] [CrossRef]
  50. Granlund, K.; Rankinen, K.; Etheridge, R.; Seuri, P.; Lehtoranta, J. Ecological recycling agriculture can reduce inorganic nitrogen losses—Model results from three Finnish catchments. Agric. Syst. 2014, 133, 167–176. [Google Scholar] [CrossRef]
  51. Stein-Bachinger, K.; Reckling, M.; Bachinger, J.; Hufnagel, J.; Koker, W.; Granstedt, A. Ecological Recycling Agriculture to Enhance Agro-Ecosystem Services in the Baltic Sea Region: Guidelines for Implementation. Land 2015, 4, 737–753. [Google Scholar] [CrossRef]
  52. Turmel, M.-S.; Speratti, A.; Baudron, F.; Verhulst, N.; Govaerts, B. Crop residue management and soil health: A systems analysis. Agric. Syst. 2015, 134, 6–16. [Google Scholar] [CrossRef]
  53. Huang, X.; Zhao, J.; Fang, L.; Zhang, Y.; Yin, C. Research on the Environmental Carrying Capacity of Livestock and Poultry Farming Based on Integrated Crop-Livestock Systems: A Case Study of Shulan City. Agric. Resour. Reg. Plan. China 2020, 41, 34–42. [Google Scholar]
  54. de Carvalho, A.M.; Resende dos Santos, D.C.; Gerosa Ramos, M.L.; Marchao, R.L.; Vilela, L.; de Sousa, T.R.; Malaquias, J.V.; Martins de Araujo Goncalves, A.D.; Coser, T.R.; de Oliveira, A.D. Nitrous Oxide Emissions from a Long-Term Integrated Crop-Livestock System with Two Levels of P and K Fertilization. Land 2022, 11, 1535. [Google Scholar] [CrossRef]
  55. Xu, X.; Xu, Y.; Li, J.; Lu, Y.; Jenkins, A.; Ferrier, R.C.; Li, H.; Stenseth, N.C.; Hessen, D.O.; Zhang, L.; et al. Coupling of crop and livestock production can reduce the agricultural GHG emission from smallholder farms. Iscience 2023, 26, 106798. [Google Scholar] [CrossRef]
  56. The Editorial Board and the Editorial Department of “Jilin Statistical Yearbook 2023”. Jilin Statistical Yearbook 2023; Changchun Audio-Video Electronic Press: Changchun, China, 2024; p. 5. ISBN 978-7-5230-0364-0. [Google Scholar]
  57. Wang, J.; Wang, S.; Li, H.; Li, X.; Feng, Y.; Gao, M.; Wang, Z.; Shu, K.; Liu, H.; Li, Z. Distribution Characteristics of Livestock Manure in Jilin Province and Environmental Carrying Capacity Early Warning Analysis. Northeast Agric. Sci. 2023, 48, 128–135. [Google Scholar]
  58. Wang, Y.; Zhou, Y.; Liang, X.; Zhang, Y.; Jin, M. Research on the Environmental Carrying Capacity of Livestock and Poultry Breeding in Jilin Province Based on the Balance of Crop and Livestock Breeding. China Feed 2022, 7, 140–145. [Google Scholar]
  59. Forrester, J.W. Industrial Dynamics: A Major Breakthrough for Decision Makers. Harv. Bus. Rev. 1958, 36, 37–66. [Google Scholar]
  60. Tao, Z. Scenarios of China’s oil consumption per capita (OCPC) using a hybrid Factor Decomposition-System Dynamics (SD) simulation. Energy 2010, 35, 168–180. [Google Scholar] [CrossRef]
  61. Wang, R.; Xiao, H. The impact of integrated breeding and farming on reducing emissions and increasing efficiency in meat sheep farming. J. China Agric. Univ. 2024, 29, 192–204. [Google Scholar]
  62. Bao, C.; Wang, H.; Sun, S. Comprehensive simulation of resources and environment carrying capacity for urban agglomeration: A system dynamics approach. Ecol. Indic. 2022, 138, 108874. [Google Scholar] [CrossRef]
  63. Ling, M.; Qi, T.; Li, W.; Yu, L.; Xia, Q. Simulating and predicting the development trends of the water–energy–food–ecology system in Henan Province, China. Ecol. Indic. 2024, 158, 111513. [Google Scholar] [CrossRef]
  64. Liu, P.; Na, W.; Wang, X.L.; Wang, X.M.; Zhang, W.D.; Wang, X.F. Evaluation of Straw Resources from Major Crops in Jilin Province and Analysis of Their Energy Utilization. Jilin Agric. Sci. 2010, 35, 58–64. [Google Scholar]
  65. Zhang, C.; Li, Z.; Wang, C.; Zhao, X.; Wu, K.; Yin, F.; Liang, C.; Yang, B.; Zhang, W. Analysis of Spatial Distribution Characteristics and Biogas Potential of Major Crop Straws in Jilin Province. Mod. Agric. Sci. Technol. 2023, 24, 122–127. [Google Scholar]
  66. Che, X.; Guo, D.; Zhang, C.; Li, H.; Zhao, L. Estimation and Early Warning Analysis of Livestock Manure Application Rates on Cultivated Landin Jilin Province. J. Jilin Agric. Univ. 2023, 45, 204–212. [Google Scholar]
Figure 1. The main models of integrated crop–livestock in Jilin Province.
Systems 14 00254 g001
Figure 2. Conceptual Framework for Integrated Crop–Livestock System Modeling.
Systems 14 00254 g002
Figure 3. Stock-Flow Diagram of Jilin Province’s Integrated Crop–Livestock System.
Systems 14 00254 g003
Figure 4. Step-Size Test Chart.
Systems 14 00254 g004
Figure 5. Trend Chart of Grain Crop and Cash Crop Area and Yield Changes.
Systems 14 00254 g005
Figure 6. Trends in beef cattle output, hog output, livestock and poultry manure production, and collectable straw.
Systems 14 00254 g006
Figure 7. Trend Chart of Total Population, Urbanization Rate, and Urban/Rural Population.
Systems 14 00254 g007
Figure 8. Trend Chart of GDP, Per Capita GDP, Primary Industry Output Value, and Supply–Demand Ratio.
Systems 14 00254 g008
Figure 9. Trends in Fertilizer and Pesticide Application Intensity, Effective Irrigation Rate, and Livestock and Poultry Manure Load Warning Values.
Systems 14 00254 g009
Figure 10. Simulation Optimization Diagram for Scenario One.
Systems 14 00254 g010
Figure 11. Simulation Optimization Diagram for Scenario Two.
Systems 14 00254 g011
Figure 12. Simulation Optimization Diagram for Scenario Three.
Systems 14 00254 g012
Figure 13. Simulation Optimization Diagram for Scenario Four.
Systems 14 00254 g013
Table 1. Boundary Scope of Jilin Province’s Integrated Crop–Livestock SD Model.
BoundaryScope
Spatial BoundaryAdministrative boundaries of Jilin Province
Temporal BoundaryHistorical time period: 2006–2021 serves as the simulation base period, during which parameters are set and validated using historical data. 2022–2035 constitutes the projection period, where key parameters are adjusted, and various scenario plans are formulated by analyzing historical data and identifying development trends. To minimize temporal errors, the simulation step size is set to 1 year.
Content BoundariesAgriculture, animal husbandry, socioeconomic factors, and ecological environment-related content
Table 2. Variables of the SD Model for Jilin Province’s Integrated Crop–Livestock System.
System CategoryVariable NameUnit
Integrated Crop–Livestock SubsystemGrain crop yield, Cash crop yield, Straw stockpile, Collectable straw, Annual straw utilization, Corn yield, Soybean yield, Rice yield, Annual livestock and poultry manure utilizationTons
Grain crop planting area, Cash crop planting area, Total crop planting areaThousand hectares
Hog output, Change in hog output, Beef cattle output, Change in beef cattle output, Beef cattle inventory10,000 head
Corn straw-to-grain ratio, Soybean straw-to-grain ratio, Rice straw-to-grain ratio, Livestock and poultry manure utilization rate, Cropping index%
Socioeconomic SubsystemGDP, GDP growth, Primary industry output value100 million yuan
Total population, Population growth, Urban population, Rural population10,000 people
Rural per capita meat consumption, Urban per capita meat consumption, Rural per capita meat demand, Urban per capita meat demand, Meat demandKilograms
Meat production, Other meat production10,000 tons
Primary industry share, Urbanization rate, Supply–demand ratio, GDP growth rate, Population growth rate%
Per capita GDP10,000 yuan
Ecological Environment SubsystemPer capita arable land areaHectares
Arable land area, Effectively irrigated area.Thousand hectares
Annual straw burning volume, Fertilizer application volume, Pesticide usage volume10,000 tons
Fertilizer application intensity, Pesticide application intensity10,000 tons/1000 hectares
Annual livestock and poultry manure production, Other livestock and poultry manure production10,000 tons
Maximum pollutant carrying capacity of cultivated landtons/hectare
Effective irrigation rate, Cattle farming pollution coefficient, Pig farming pollution coefficient, Straw feed utilization rate, Burning ratio, Livestock and poultry manure load warning value%
Table 3. Historical Validation of Key Variables in the Model.
VariableGrain Crop Planting Area (1000 Hectares)Total Population (10,000 Persons)GDP (Billion Yuan)Beef Cattle Output (10,000 Head)Hog Output (10,000 Head)Fertilizer Application Volume(10,000 Tons)
TimeSimulated ValueHistorical ValueErrorSimulated ValueHistorical ValueErrorSimulated ValueHistorical ValueErrorSimulated ValueHistorical ValueErrorSimulated ValueHistorical ValueErrorSimulated ValueHistorical ValueError
20064246.494236.60.2%271627230.3%3226.473226.470.0%315.951310.531.7%1273.591302.28−2.2%152.497146.704.0%
20074481.634472.840.2%2722.792729.820.3%3942.714080.34−3.4%299.124315.57−5.2%1219.011168.484.3%165.523154.397.2%
20084526.184555.28−0.6%2727.152734.21−0.3%4715.814834.68−2.5%265.483258.812.6%1319.211263.974.4%167.991163.842.5%
20094540.314560.86−0.5%2732.332739.55−0.3%5564.655434.842.4%270.911264.422.5%1408.821362.133.4%168.774174.18−3.1%
20104719.074676.760.9%2739.162746.6−0.3%6232.416410.48−2.8%271.065267.31.4%1464.241436.691.9%178.677182.80−2.3%
20114759.864766.41−0.1%2741.92749.41−0.3%7354.257734.64−4.9%266.867261.612.0%1532.131457.525.1%180.937195.20−7.3%
20124903.374891.250.2%2690.352697.55−0.3%8898.648678.022.5%263.477257.32.4%1631.821595.422.3%188.887206.73−8.6%
20135117.45132.05−0.3%2661.032668.07−0.3%9966.489427.895.7%259.54251.813.1%1674.111633.442.5%200.744216.79−7.4%
20145391.75411.75−0.4%2634.952641.89−0.3%10,365.19966.544.0%256.447248.13.4%1674.931679.06−0.2%215.939226.66−4.7%
20155506.095534.09−0.5%2605.72612.53−0.3%10,676.110,0186.6%253.773245.233.5%1618.671618.640.0%222.277231.24−3.9%
20165575.685542.390.6%2560.362566.96−0.3%10,697.410,4272.6%248.168242.032.5%1645.611570.084.8%226.13233.61−3.2%
20175600.125543.971.0%2519.652526.09−0.3%10,740.210,922−1.7%240.763233.63.1%1659.641691.71−1.9%227.486231.02−1.5%
20185594.475599.72−0.1%2478.082484.35−0.3%11,062.411,253.8−1.7%254.653249.562.0%1498.871570.42−4.6%227.173228.30−0.5%
20195632.985644.93−0.2%2441.42447.52−0.3%11,394.311,726.82−2.8%261.119258.70.9%1361.111361.10.0%229.306227.061.0%
20205669.135681.78−0.2%2393.552399.44−0.2%11,96412,255.98−2.4%242.175238.71.5%1337.721321.61.2%231.308225.292.7%
20215707.545721.25−0.2%2369.612375.37−0.2%12,681.913,235.52−4.2%250.76242.43.4%1786.541750.22.1%233.437223.004.7%
Disclaimer/Publisher’s Note: The statements, opinions and data contained in all publications are solely those of the individual author(s) and contributor(s) and not of MDPI and/or the editor(s). MDPI and/or the editor(s) disclaim responsibility for any injury to people or property resulting from any ideas, methods, instructions or products referred to in the content.