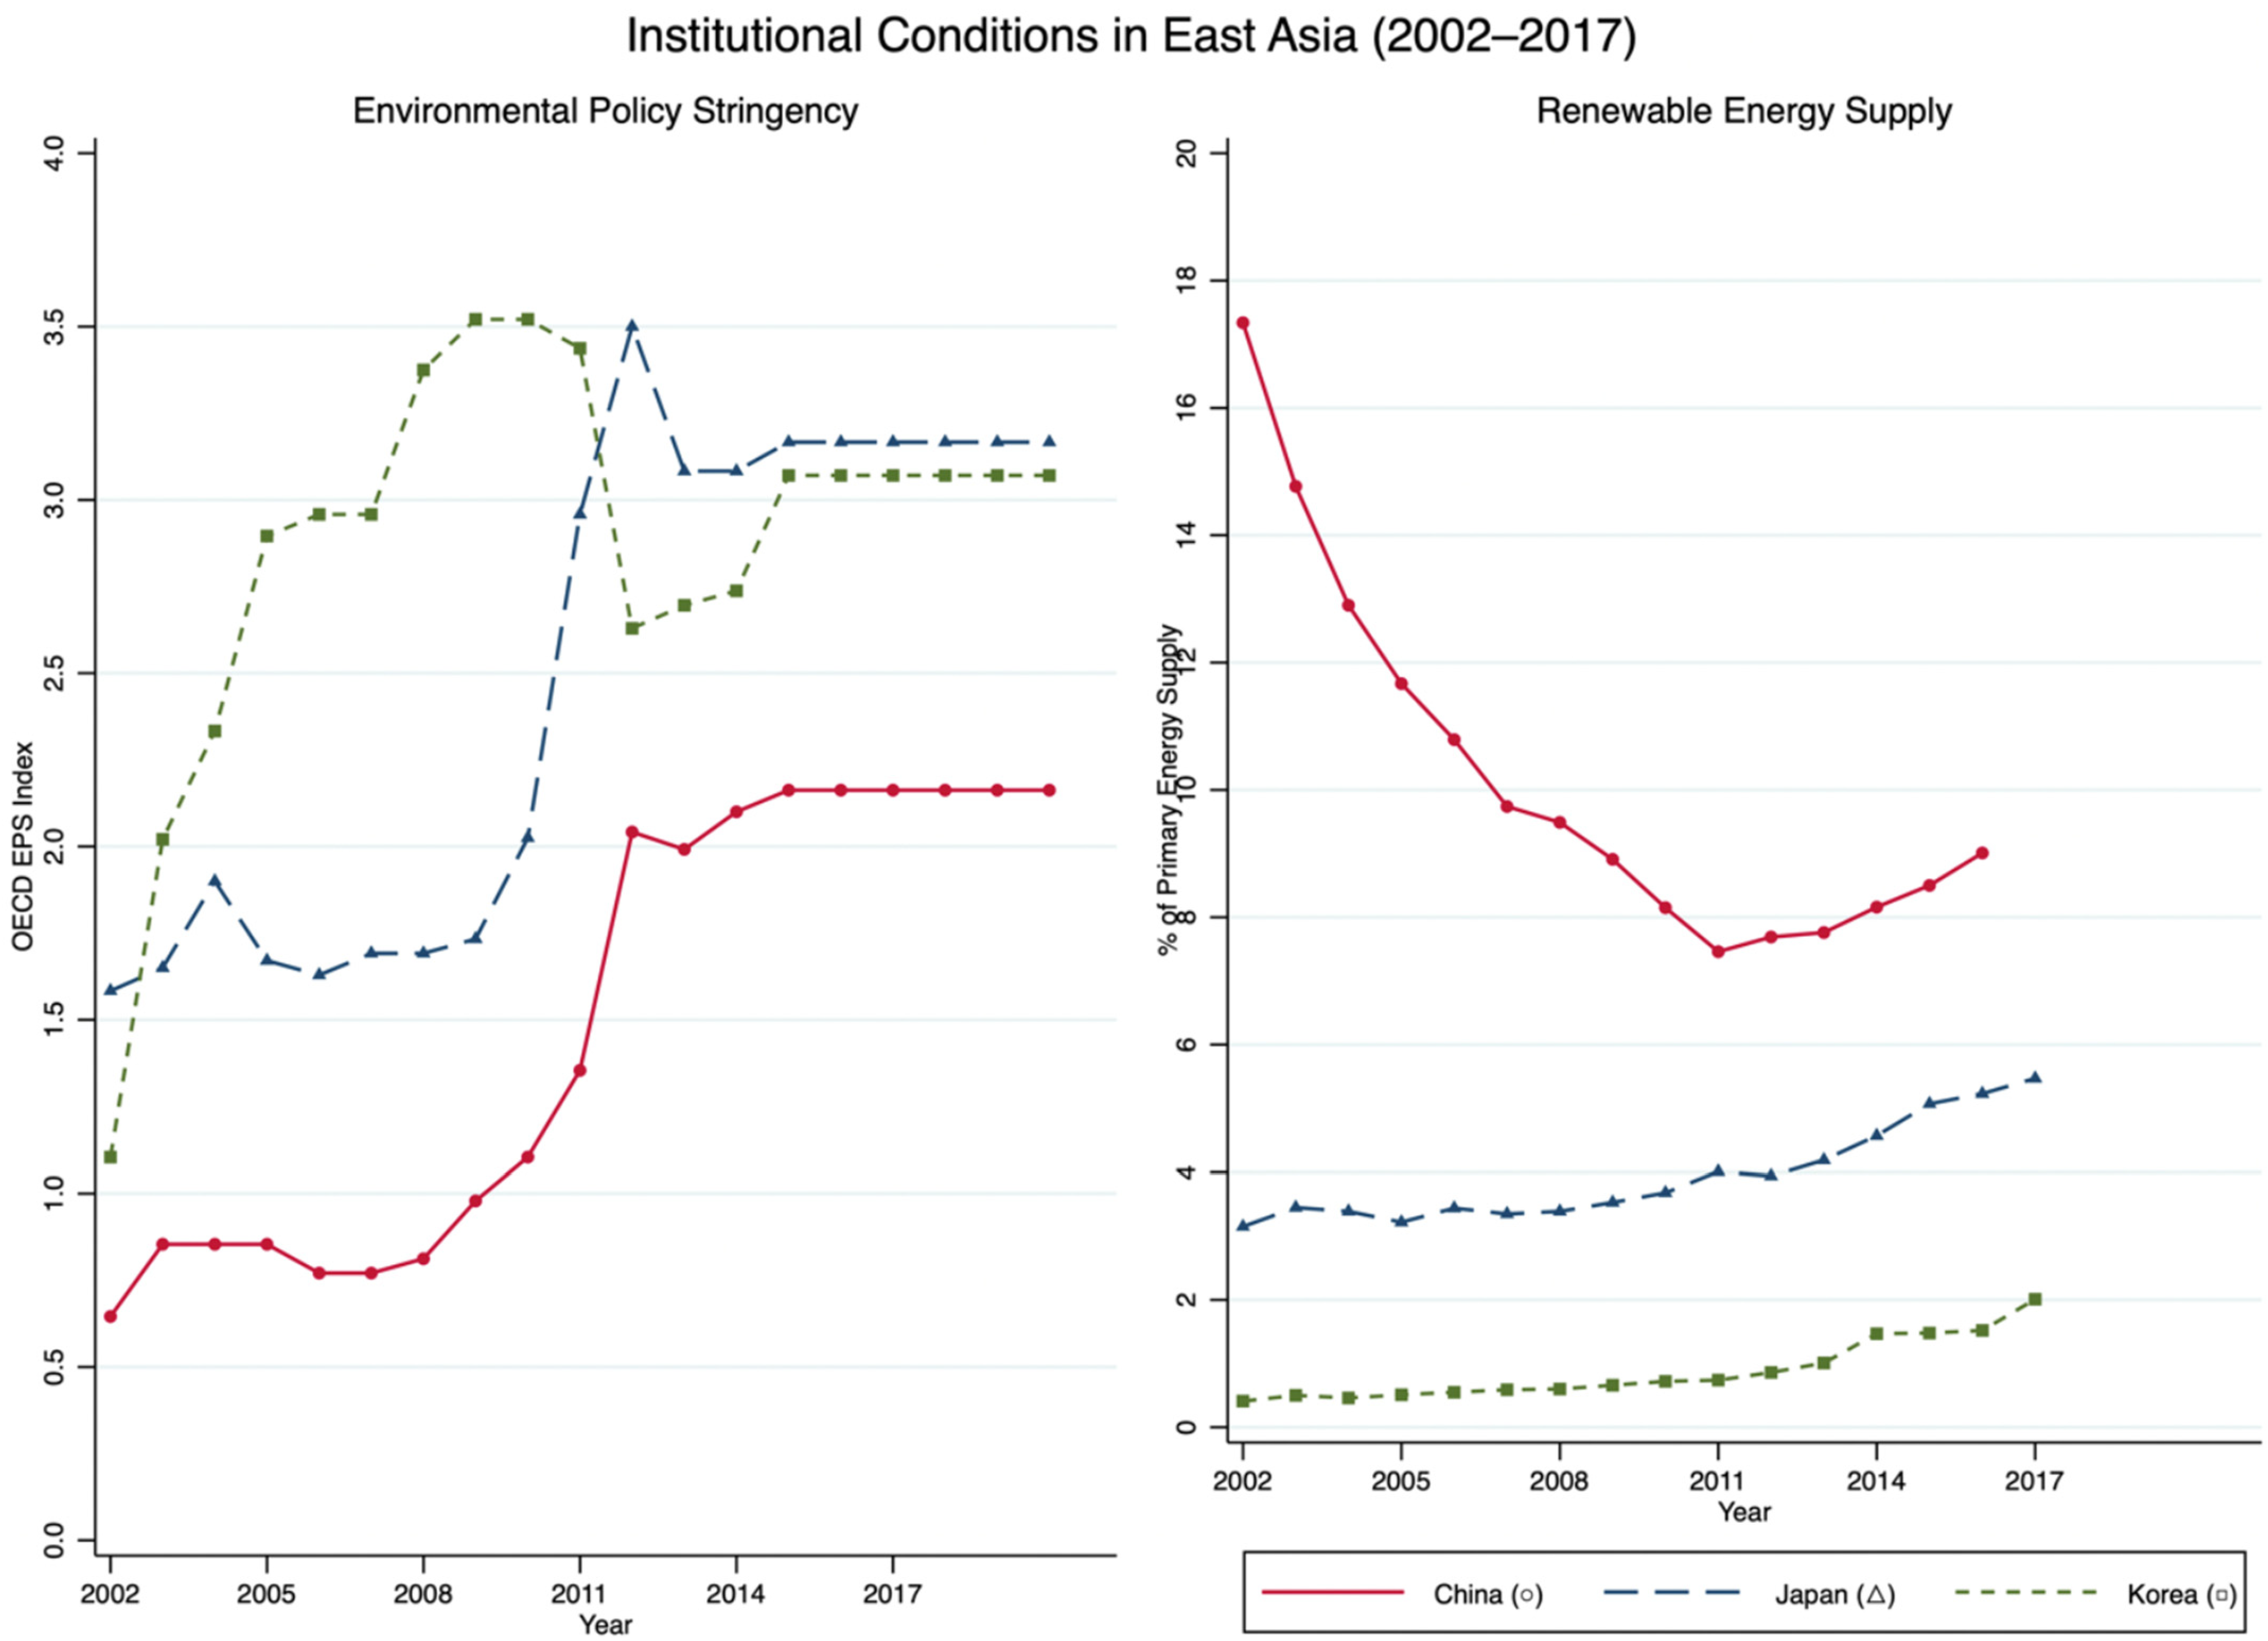
4.2. Hypothesis Testing: Random Effects Logistic Regression Results
Table 3 presents random-effects logistic regression estimates for the prediction of renewable energy adoption in year (t + 1). Across model specifications, the results are consistent with the idea that carbon pledges are more likely to translate into observable changes in the energy sourcing of firms when national institutional conditions increase both accountability and feasibility.
Main effect of carbon-reduction pledges (H1). Hypothesis 1 predicted a positive relationship between carbon reduction pledges and later renewable energy adoption. In the full specification with mean-centered moderators (Model 5), the coefficient of carbon reduction pledge is positive and statistically significant (b = 0.791, p < 0.001). Because the moderators are mean-centered, this estimate is the pledge effect at average levels of environmental policy stringency and renewable energy supply; substantively, Model 5 is a re-parameterization of the full interaction model (Model 4) that moves the reference point to average institutional conditions without changing fitted values. To put it another way, Models 4 and 5 are exactly the same in terms of model fit; the only difference is the zero point of the moderators. In Model 4 (uncentered), the pledge coefficient is the effect when both EPS and renewable energy supply are equal to zero, which is outside the range of observed data and is not substantively interpretable.
The pledge coefficient in Model 5 (mean-centered) is the effect at sample-mean values of both moderators—a meaningful baseline. The interaction terms and the moderator main effects are the same for both parameterizations. The odds ratio (exp (0.791) = 2.21) suggests that, on average across all institutional conditions, pledge-making firms have a roughly 2.2 times higher probability of adopting renewable energy in the following year than non-pledging firms. Consistent with our conceptualization of the dependent variable, we interpret this pattern as evidence that public pledges are associated with entry into renewable-energy sourcing/procurement, rather than a uniform indicator of deep operational transformation. This finding is in line with recent evidence that corporate climate commitments are linked to subsequent environmental action [
3,
8], but our study differs in scope (broader pledge definition) and outcome (renewable procurement rather than emissions).
Conditional role of environmental policy stringency (H2). Hypothesis 2 predicted that environmental policy stringency would increase the pledge-adoption relationship. The interaction between pledge and policy stringency is positive and statistically significant in Model 5 (b = 0.617,
p < 0.01). This result indicates that the relationship between pledging and later renewable adoption increases with the strictness of regulatory environments. In more stringent policy situations, pledges seem to have more follow-through implications, consistent with the argument that regulatory pressure increases the costs of symbolic compliance and increases the relative payoff to implementation. This finding is consistent with macro-level evidence that environmental policy stringency facilitates renewable energy diffusion [
16] while identifying the micro-level mechanism: policy stringency conditions the firm-level relationship between stated commitments and observable behavior.
Conditional role of renewable energy supply (H3). Hypothesis 3 predicted that renewable energy supply would enhance the pledge-adoption relationship by reducing constraints of feasibility. Supporting this expectation, the interaction between pledge and renewable energy supply is positive and statistically significant in Model 5 (b = 19.649,
p < 0.05). Given the scaling of the supply measure (a country-level share of total primary energy supply), the interaction coefficient is best interpreted in terms of marginal effects and predicted probabilities and not in terms of raw log-odds units. In line with this,
Table 4 shows that the marginal effect of pledging (i.e., the change in predicted probability of renewable adoption associated with having a pledge) increases in a systematic way as renewable supply increases.
This pattern indicates that pledge-making firms are more capable of converting commitments into renewable sourcing when national supply conditions offer more accessible pathways to procurement. This result links to the burgeoning literature on corporate renewable energy procurement [
13], identifying institutional boundary conditions under which firms enter renewable sourcing.
Magnitude of interaction effect (
Table 4;
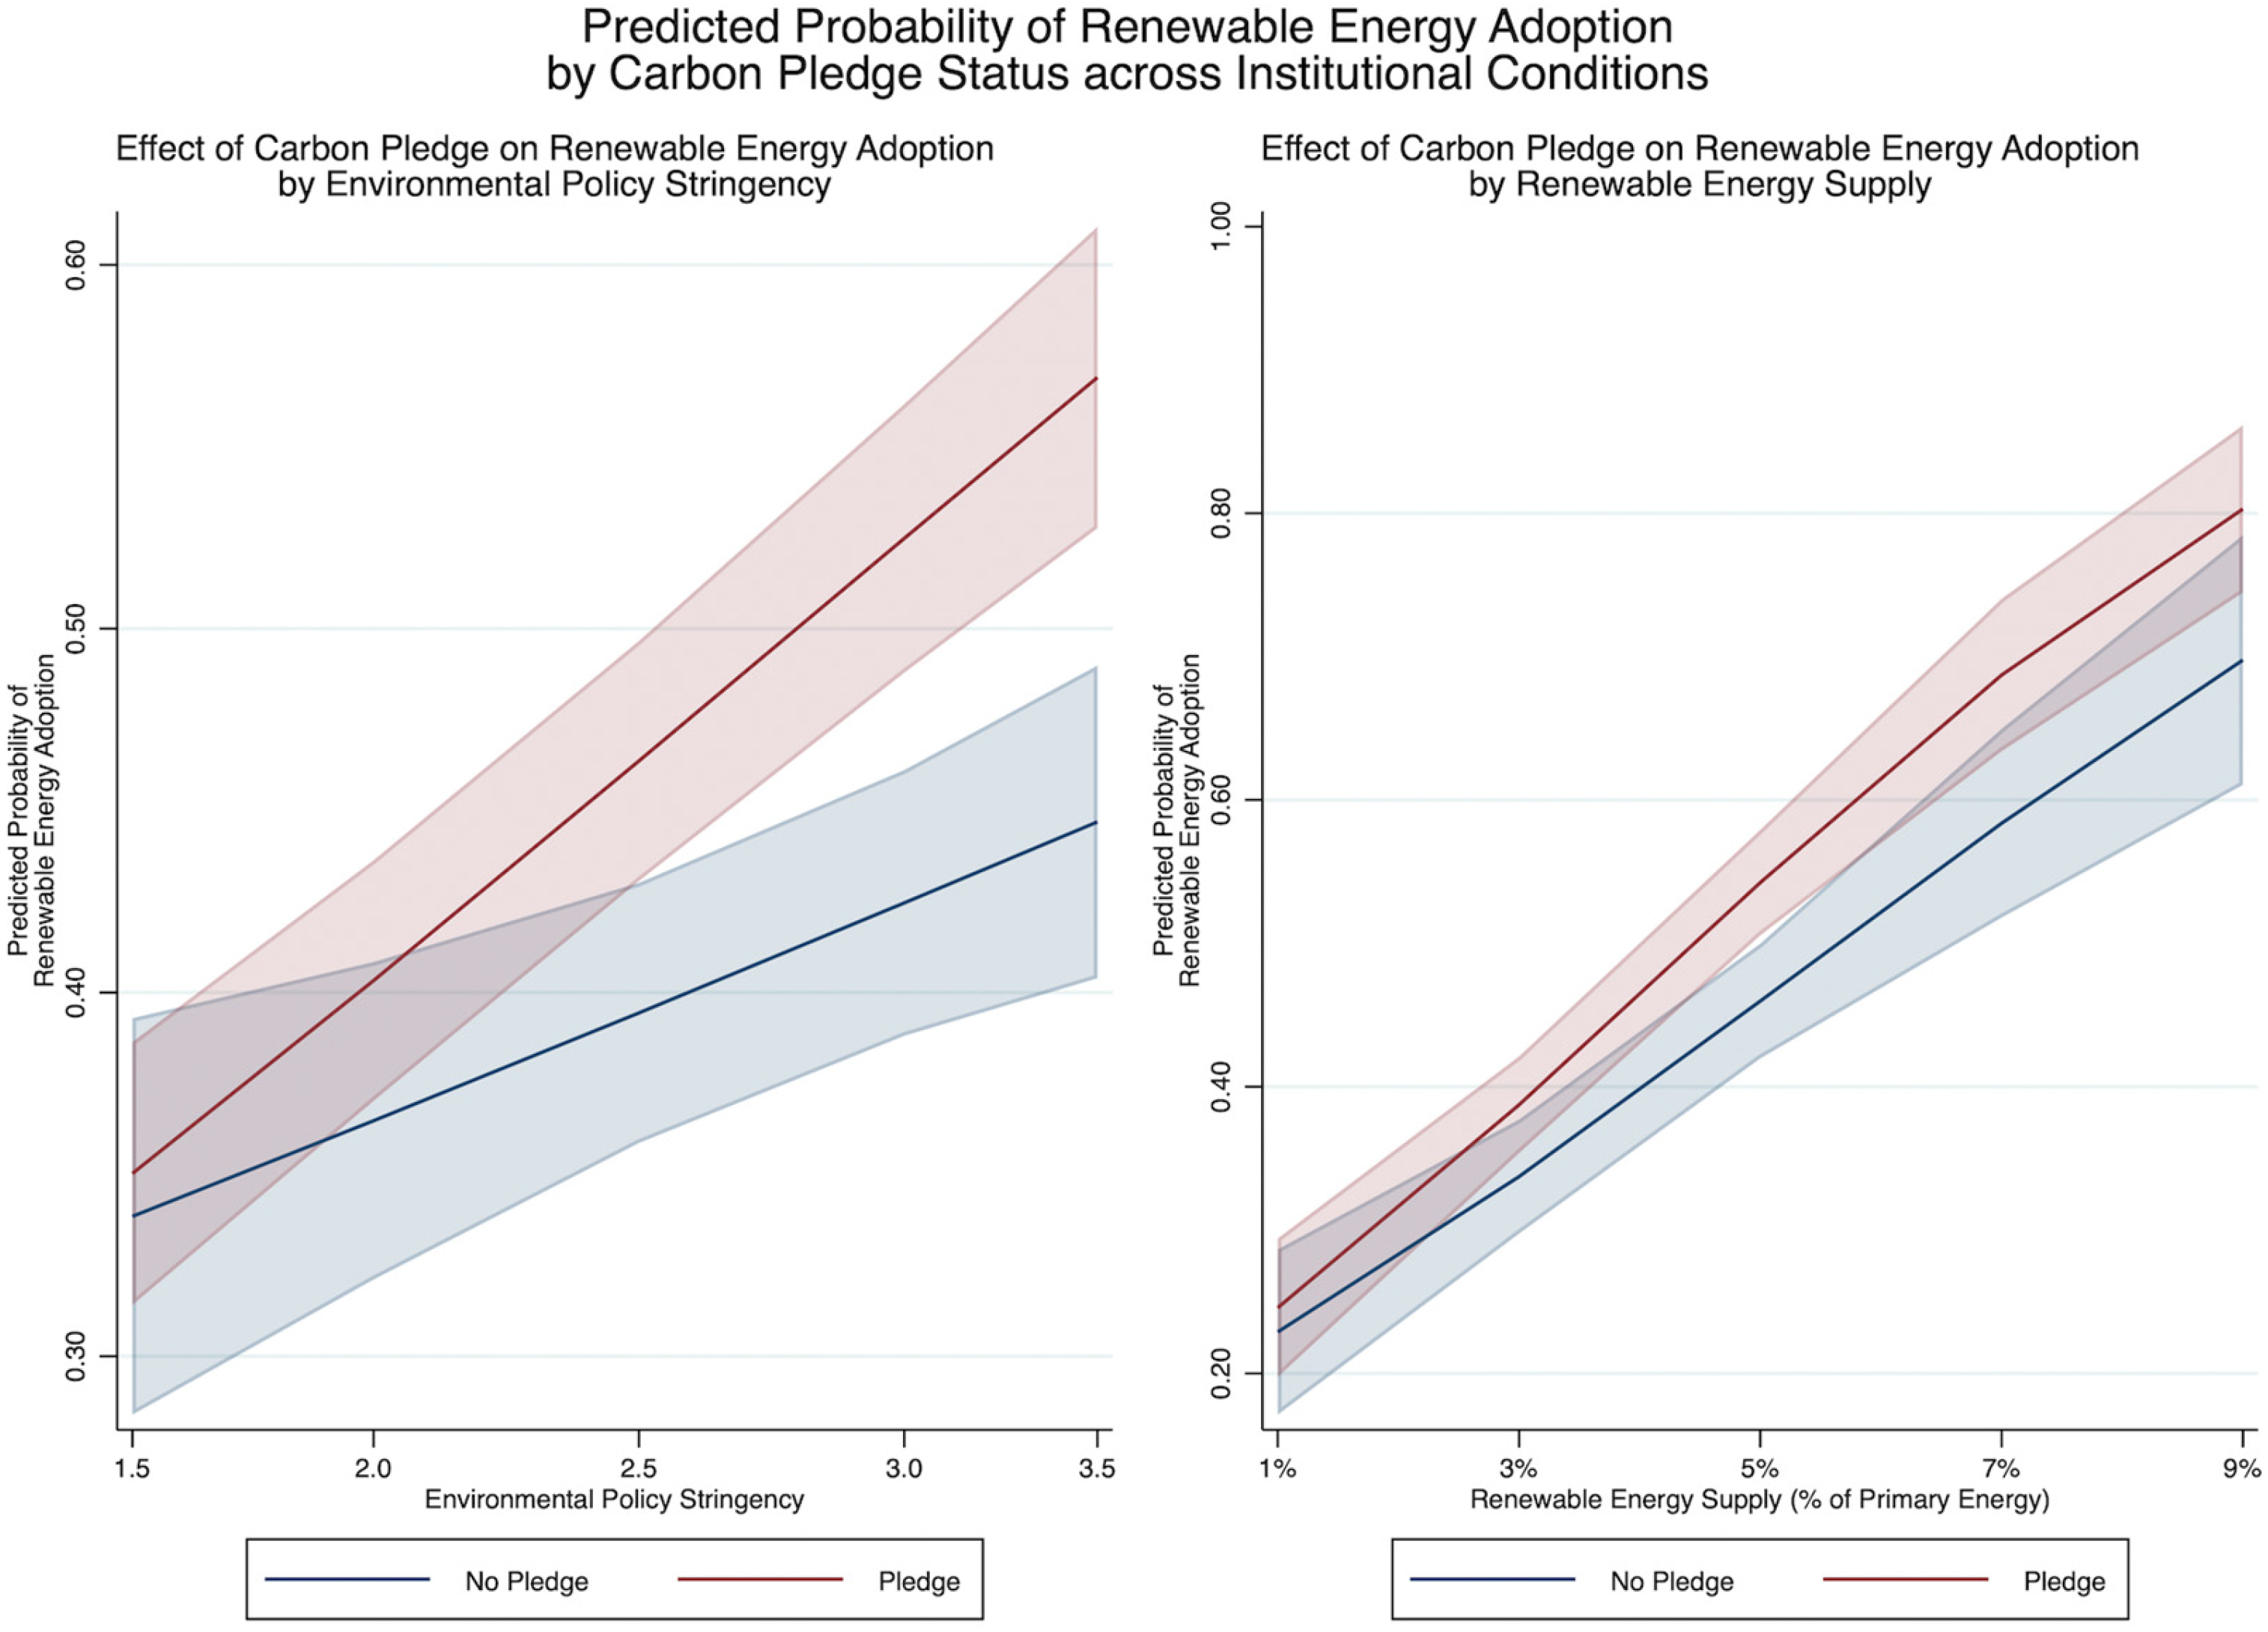
Figure 2). To make the patterns of interaction more transparent,
Table 4 reports marginal effects from Model 5. The marginal effect of pledging on the predicted probability of renewable adoption is close to zero and statistically indistinguishable from zero under low institutional support but grows rapidly as institutional conditions increase. For example, as the environmental policy stringency increases from low (EPS = 1.5) to high (EPS = 3.5), the estimated marginal effect increases from 0.014 to 0.131. A similar pattern is seen for renewable energy supply: the pledge-related increase in predicted probability is small at low supply (e.g., 1%) but becomes substantially larger at higher supply levels.
Figure 2 visualizes these patterns by showing that the pledge-adoption relationship is strongest when institutional pressure and institutional capacity are both present—conditions making follow-through both more consequential and more feasible.
Several firm-level controls behave in expected ways. R&D intensity is positively associated with renewable adoption (β = 0.169, p < 0.001), consistent with the view that innovative capacity facilitates entry into new energy sourcing practices. Firm size is positive and significant (β = 0.395, p < 0.01), suggesting that larger firms are more likely to adopt renewable energy. ROA is negative and significant (β = −3.786, p < 0.01), indicating that more profitable firms in this period were less likely to shift toward renewable sourcing, potentially reflecting lower urgency to alter established energy practices. Industry carbon intensity is weakly negative (β = −0.103, p > 0.10), though not statistically significant in the full specification.
4.3. Robustness Checks
To assess the robustness of our primary results, we performed a series of robustness tests and present the findings in
Table 5 (Models 6–12) and in Appendices A–E. In these specifications, we are interested in the consistency of the key patterns of interaction, i.e., the strengthening of the pledge-adoption relationship in the presence of stronger institutional conditions, in terms of sign and statistical significance.
Model 7 re-estimates the entire specification with a conditional fixed-effects logistic regression, which is based on within-firm variation and thus eliminates firms whose change in the dependent variable is zero (as in FE logit). The carbon-reduction pledge and environmental policy stringency interaction is positive and statistically significant (b = 0.481,
p < 0.05) in this more demanding specification, which is consistent with H2 and the overall findings of the random-effects model (
Table 3, Model 5). The relationship between pledge and renewable energy supply is positive but not statistically significant (b = 13.259, n.s.), indicating that the capacity-related interaction effect in H3 is directionally consistent but not robust under within-firm identification, probably because the sample size is smaller and the country-level variation among switcher firms is less. In this FE specification, the main effect of pledging is positive but not statistically significant compared to zero (b = 0.289, n.s.), which is consistent with the fact that FE logit identifies effects of firms that switch pledge status and adoption status over time and, therefore, gives a conservative test compared to the baseline RE specification.
Model 8 moves the dependent variable by one more year (f2. renewable adoption) to determine whether the pattern of the baseline is time-sensitive in terms of the timing of outcomes. The main effect of the pledge is positive and significant (b = 0.556, p < 0.01), and the interaction terms are positive and significant—policy stringency (b = 0.636, p < 0.01) and renewable supply (b = 23.119, p < 0.05). This trend suggests that the pledge-adoption association and its institutional contingencies do not have a one-year horizon and can be adjusted with a somewhat longer adjustment window.
Model 9 employs a lagged measure of pledging (L1. pledge) to predict adoption next year to make sure that the primary findings are not due to contemporaneous measurement or short-run simultaneity. The lagged pledge effect is positive and significant (b = 0.656, p < 0.001). The renewable energy supply interaction is positive and significant (b = 31.013, p < 0.01), whereas the interaction between the pledge × policy stringency is positive and significant (b = 0.498, p < 0.05). These findings, combined with the previous ones, support the conclusion that pledges are more predictive of future adoption in the case of greater institutional capacity, as measured by renewable supply, and that regulatory stringency still enhances the pledge-adoption relationship in this lag structure.
Model 10 includes year fixed-effects in the baseline random-effects logit to capture common temporal shocks that might jointly affect pledge-making and renewable adoption (e.g., diffusion of renewable procurement practices in the region). The pledge main effect is still positive and significant (b = 1.242, p < 0.001) in this specification, whereas the two interaction terms are no longer significant and become imprecisely estimated (pledge × policy: b = 0.210, n.s.; pledge × supply: b = 12.781, n.s.). Having 48 country-year values (3 countries × 16 years), 16 year dummies capture a large portion of the time variation that the country-level moderators take advantage of. We describe the interaction effect results as indicative of institutional contingency, and not the estimated effects that are invariant to the time trends modeling.
Inference checks are also offered in Models 11 and 12. Model 11 re-estimates the entire specification with melogit with cluster-robust firm-level standard. The pledge main effect (b = 0.788, p < 0.01) and the EPS interaction (b = 0.618, p < 0.05) are significant, whereas the renewable energy supply interaction is attenuated to non-significance (b = 19.686, p > 0.10), which is due to the broader standard errors under clustering. Model 12 is a GEE population-averaged model with exchangeable correlation and robust standard errors. The main effect of the pledge (b = 0.377, p < 0.01) and the interaction between the pledge and the EPS (b = 0.382, p < 0.001) are significant, but the interaction between the pledge and the renewable supply is not significant (b = 9.568, n.s.). Such differences are not surprising since the GEE estimator is designed to estimate population-averaged and not subject-specific effects and can act differently when the key predictors change mainly at the country-year level.
To address certain methodological issues, we performed several other analyses in the following manner. Capital intensity was not included in the primary specification because it was highly multicollinear with firm size (r = 0.94). We evaluated variance inflation factors (VIF) to confirm this decision. Capital intensity and firm size have high VIF values (11.74 and 11.22, respectively), as is anticipated since both of them reflect scale-related factors of the asset base. In comparison, the VIFs of the focal predictors, which include carbon reduction pledge, environmental policy stringency, and renewable energy supply, are less than 2.0. Since high collinearity makes the estimates of both variables inaccurate and may influence the stability of other estimates in the model, we kept firm size as the theoretically more basic and commonly used control of organizational scale. To make sure that this omission does not influence our substantive findings, we re-estimated the entire model with capital intensity (
Appendix A). The interaction between pledge and policy stringency is positive and statistically significant (b = 0.587,
p = 0.003), and the interaction between pledge and renewable energy supply is also significant (b = 21.11,
p = 0.026), indicating that the focal coefficients are virtually the same.
Second, we included the number of country-year ESG funds (natural log) as an indicator of investor pressure (
Appendix B). Under this control, the main effect of the pledge (b = 0.809,
p < 0.001) and the interaction effect of the pledge and EPS (b = 0.524,
p = 0.014) are robust. The interaction effect of renewable energy supply is reduced to
p = 0.112, which can be explained by the common country-year variation between the prevalence of ESG funds and renewable energy infrastructure.
Third, we used propensity score matching [
39] to deal with selection into pledging (
Appendix C). We nearest-neighbor matched pledging and non-pledging firms on lagged firm characteristics and country-year peer pledging rates (k = 3, caliper = 0.05). The post-matching balance improved from 52.7% to 4.2% mean bias. The pledge main effect strengthens (b = 0.969,
p < 0.001), and the renewable energy supply interaction effect is preserved (b = 28.302,
p = 0.021) on the matched sample (N = 4087; 492 firms). The interaction between pledge × EPS is reduced to non-significance, which is probably because the country-level variation in the matched sample is smaller.
Fourth, we estimated a Mundlak correlated random-effects model to account for the possibility that the RE assumption may not hold (
Appendix D). The between-firm and within-firm effects are decomposed by adding firm-level means of all time-varying predictors. The firm-level mean pledge status is significant and large (b = 4.197,
p < 0.001), indicating that between-firm variation in sustainability orientation plays a significant role in the observed association. The within-firm pledge effect is reduced to marginal significance (b = 0.362,
p = 0.055). Importantly, both interaction terms are significant in this specification—pledge × EPS (b = 0.509,
p = 0.016) and pledge × renewable energy supply (b = 20.671,
p = 0.029), which means that the institutional interaction effect patterns are not driven by between-firm confounding.
Overall, the robustness tests show that (i) the pledge–adoption association is always positive in alternative timing specifications (Models 8 and 9), with the propensity score matching (
Appendix C), and the Mundlak decomposition (
Appendix D); (ii) the policy–stringency interaction effect is supported in within-firm identification and longer-horizon timing (Models 7 and 8) and significant in the Mundlak CRE model, but it becomes statistically insignificant when year fixed effects are added (Model 10); and (iii) the renewable-supply interaction effect is stable across timing checks (Models 8 and 9) and the Mundlak CRE model, though it weakens under the FE estimator (Model 7), the cluster-robust and GEE specifications (
Appendix E), and becomes statistically indistinguishable from zero once year fixed effects are introduced (Model 10). These findings combined indicate that our overall inferences are usually robust, and that the robustness of the interaction effects is sensitive to the absorption of common time shocks and to other inference procedures—a weakness of the small number of country-year values that can be determined.