1. Introduction
In the context of China’s dual-carbon targets and its high-quality development strategy, a key task of economic transformation is to reduce resource use and environmental burdens without undermining economic growth. Ecological efficiency (EE), defined as achieving higher output with fewer inputs and lower pollution, is a comprehensive indicator that captures both resource-use efficiency and the stringency of environmental constraints, and it is widely used to evaluate green development performance [
1,
2,
3,
4]. Meanwhile, the digital economy (DE), with data as its core element and underpinned by digital infrastructure, continues to reshape production organization, factor allocation, and governance arrangements through its virtualization, intelligence, and interconnectedness [
5,
6,
7,
8,
9,
10]. These developments raise several questions: Does DE enhance EE and, in turn, support the green transition? If so, through which channels do they operate, and in what institutional and regional contexts are the effects strongest?
The growing literature has extensively examined the relationship between the DE and green development [
9,
11]. Digital technologies may enhance ecological performance via two competing forces. On the beneficial side, they can raise allocative efficiency and stimulate green innovation by lowering information costs, improving matching, and accelerating cross-industry coordination [
12,
13,
14]. On the adverse side, digitalization can increase electricity use as computing capacity and digital infrastructure expand, and it may trigger scale and rebound effects that partially offset environmental gains [
15,
16,
17]. Accordingly, the net effect of the DE on EE is a priori uncertain and needs to be evaluated in a unified framework that simultaneously accounts for output, resource inputs, and environmental externalities.
A closer reading of the literature suggests several gaps in both the proposed mechanisms and the empirical identification strategies. First, with respect to outcome measurement, existing studies rely on a single environmental metric, for instance, carbon-related emissions [
18]. Such measures do not jointly capture economic output and multidimensional environmental constraints and may therefore understate or mischaracterize the DE’s comprehensive efficiency effects. Second, prior work typically tests only one channel at a time (e.g., green innovation, industrial upgrading, or energy efficiency) [
19]. It remains unclear whether digitalization primarily promotes industrial upgrading through structural advancement or through structural rationalization. Third, the environmental payoffs from digitalization likely vary with the strength of environmental regulation [
20], but potential nonlinear and threshold relationships remain underexplored. Fourth, whether digital dividends materialize as ecological improvements depends on local absorptive capacity, reflected in economic fundamentals and human capital, suggesting meaningful heterogeneity that warrants more granular empirical investigation.
Building on these gaps, we assemble a panel of 30 provinces over 2011–2023 to systematically evaluate how DE development influences EE, and to examine the underlying mechanisms, threshold conditions, and regional heterogeneity. The empirical strategy proceeds as follows. First, we consider the SBM model to measure EE, which more accurately captures the differences in green performance across provinces. Second, the DE is constructed from an indicator system covering digital infrastructure, industrialization, and digitalization. We then apply the entropy-weighting approach to combine these dimensions into a single composite index, thereby enhancing measurement objectivity and cross-region comparability. Third, the baseline effect is estimated in a two-way fixed-effects (TWFE) framework, with robustness checks based on alternative variable definitions, sample adjustments, lagged core variables, and minimized data; potential endogeneity is further addressed using instrumental-variable estimation. Fourth, mechanism analysis adds mediating variables to the baseline model to test potential channels and evaluates their relevance by examining coefficient attenuation. Finally, we utilize a threshold model to investigate the non-linear effects of environmental regulatory intensity, while conducting heterogeneity tests for regions with differing levels of economic development and human capital.
Drawing on our empirical results, we summarize several main findings. First, DE development significantly increases EE, and the conclusion is robust to a variety of checks. Second, mechanism tests suggest that the DE raises EE by increasing green innovation output, promoting industrial structure optimization. Third, threshold regressions indicate a pronounced nonlinearity in the role of environmental regulation (ER): the effect of the DE is not statistically significant at low levels of regulatory stringency but becomes substantially stronger and remains positive once regulation exceeds the estimated threshold, implying complementarity between regulation and digitalization. Finally, heterogeneity analysis indicates that digitally driven green gains are constrained by fundamental conditions such as levels of economic development and human capital.
This study offers three incremental contributions. First, we construct a more comprehensive measure of EE by integrating economic output, resource inputs, and multiple pollution constraints within a unified super-efficiency SBM framework, which better matches the goals of green and high-quality development. Second, building on a “technology, structure, efficiency” lens, we propose a testable mechanism framework that pinpoints the main channels through which the DE influences EE, while separating distinct facets of structural upgrading. Third, we reveal that the green effects generated by digital transformation exhibit threshold-type non-linearity and regional heterogeneity under varying degrees of environmental regulation, providing policy-relevant evidence on how digital transformation can work in tandem with environmental governance.
2. Theoretical Analysis and Hypotheses
2.1. Direct Impact of Digital Economy on Ecological Efficiency
In theory, allocative efficiency, organizational efficiency and governance efficiency are key factors in enhancing economic efficiency through development. From an allocative-efficiency perspective, digital technologies lower information frictions and transaction costs, which support more market-oriented and better-targeted factor allocation [
21,
22,
23]. Because traditional factor markets are often characterized by information asymmetry, high search costs, and low matching efficiency, capital, labor, and technology may fail to flow toward firms and regions with higher marginal returns, leading to resource misallocation and the persistence of energy-intensive, low-efficiency capacity. Digital platforms and data-driven matching can lower search and bargaining costs, improve the transmission of price signals [
24], and reduce frictions in cross-regional and cross-sector mobility, facilitating factor reallocation toward higher-productivity and cleaner sectors. Second, regarding organizational efficiency, digitalization reshapes firms’ internal production processes and enables process-based management of resource inputs and emissions [
25,
26]. By making production activities observable and optimizable in real time, digital technologies, such as intelligent scheduling, equipment connectivity, and predictive maintenance, reduce downtime and energy waste and improve operational continuity. In addition, supply-chain digitalization and collaborative platforms can reduce inventory and logistics redundancy, thereby lowering consumption and emissions [
27,
28]. Third, from a governance-efficiency standpoint, the DE can make environmental regulation more auditable and traceable, thereby enhancing monitoring precision and strengthening enforcement capability [
29,
30]. Traditional environmental governance often faces high monitoring costs, information delays, and enforcement uncertainty, which can result in selective enforcement or regulatory gaps. Digital government and monitoring systems reduce information collection costs, raise the likelihood of detecting violations, and strengthen penalty enforceability, thereby reinforcing firms’ compliance incentives. Data-enabled governance also supports public oversight and interdepartmental coordination, reducing coordination frictions and stabilizing institutional expectations [
31]. Accordingly, we propose:
Hypothesis 1. Digital economic development is associated with regional EE.
2.2. Indirect Effect of Digital Economy on Ecological Efficiency
Sustained improvements in EE depend on progress in green technologies. The DE can increase green innovation output and accelerate its diffusion and adoption by reducing information frictions and coordination costs in innovation activities and by strengthening knowledge diffusion and technology spillovers [
10,
32]. Specifically, treating data as a key production input and leveraging digital platforms can help uncover green technological opportunities and allocate R&D resources more efficiently, thereby accelerating innovation cycles. At the same time, digitalization enhances cross-regional and cross-organizational collaboration, facilitating the translation of green innovations into production and governance practices. As green innovation expands and diffuses, it can reduce undesirable outputs and raise resource-use efficiency through process upgrading, cleaner input substitution, and more effective pollution abatement, ultimately improving EE. Accordingly, we propose:
Hypothesis 2. The DE improves EE by promoting green innovation output.
Industrial structure fundamentally shapes a region’s resource consumption and pollution intensity. By facilitating factor mobility, value-chain coordination, and cross-sector resource reallocation, the DE can improve the coherence and matching efficiency of the industrial system, thereby promoting structural optimization and raising EE [
33]. Importantly, industrial restructuring has two distinct dimensions: structural advancement, which reflects a transition away from activities at the lower end of the production chain toward more advanced and environmentally friendly industries; and structural rationalization, which captures more coordinated intersectoral factor allocation, reduced misallocation, and stronger system-wide efficiency. Digitalization often yields near-term gains by lowering coordination costs, improving supply effects that primarily manifest as structural rationalization. Over the medium to long run, it can also facilitate structural advancement by supporting the expansion of modern services and high-technology industries [
34]. Through either channel, structural optimization reduces the relative weight of high-pollution activities and enhances interindustry coordination and allocative efficiency, ultimately improving EE. Accordingly, we propose:
Hypothesis 3. The DE improves EE by optimizing the industrial structure.
3. Methodology and Data
3.1. Empirical Strategy
First, to examine the impact of DE on EE, we estimate the following baseline TWFE specification:
where
denotes the EE of province
in year
,
measures the level of DE, and
is a set of controls.
represents province fixed effects.
denotes year fixed effects.
is the error term. The coefficient of interest
, captures the marginal effect of digital economic development on EE after controlling for fixed effects and observable covariates. We cluster standard errors at the provincial level.
Second, to investigate the channels through which DE influences EE, we conduct regression-based channel tests by extending the baseline specification to include candidate mediating variables. Specifications for empirical models are as follows:
where the mechanism variable is denoted by
and
captures the estimated effect of the DE on
. A statistically significant
indicates that digital economic development is associated with changes in the proposed mechanism, providing empirical support for the channel and motivating the subsequent mediation tests.
Finally, to assess whether the effect of DE on EE exhibits structural nonlinear characteristics, we employ Hansen’s (1999) threshold approach [
35], and estimate the following specification:
Here, the threshold variable is , and (which equals 1 if its argument is true and 0 otherwise) is the indicator function. and are the estimated threshold values that partition the sample into three regimes. The coefficients , , and represent the marginal effects of the DE on EE in the corresponding threshold ranges. All remaining variables are defined as above.
3.2. Variable Selection
3.2.1. Ecological Efficiency
EE captures a region’s ability to produce economic output given resource-input constraints while accounting for the associated environmental pressures. It reflects green development performance in terms of achieving higher desired output with fewer factor inputs and lower pollutant emissions. Considering the multi-input–multi-output nature of EE and the presence of pollutant emissions as undesirable outputs, conventional radial efficiency measures are insufficient to reflect key structural aspects, including input redundancy, deficiencies in desirable outputs, and excessive undesirable outputs. Therefore, this study applies the slack-based, non-radial, non-angular SBM model developed by Tone (2020), which explicitly incorporates industrial pollutant emissions into the efficiency assessment [
36]. Moreover, to further discriminate against and rank provinces that lie on the efficient frontier, we employ a super-efficiency SBM model that explicitly incorporates undesirable outputs. Following the standard ecological-efficiency evaluation paradigm [
15,
33], we construct an “inputs-desirable outputs-undesirable outputs” indicator system (
Table A1).
We treat each province–year observation as a decision-making unit (DMU), resulting in DMUs in total. Let
,
, and
denote, respectively, the inputs (
), desirable output (
), and undesirable outputs (
). Under variable returns to scale, the corresponding SBM model with undesirable outputs is specified as follows:
Among these, the subscript denotes the province–year observation under evaluation; is the intensity (weight) vector; represents input slacks (input redundancy), denotes desirable-output slacks (output shortfalls), and denotes undesirable-output slacks (excess emissions). Because desirable outputs are to be expanded, whereas undesirable outputs are to be contracted, the undesirable-output constraint is formulated with a “” term, which implies that pollutant emissions can be reduced within the given technology set.
The model yields an EE score, denoted . In general, higher values of indicate that, given the same inputs, a region produces more desirable output and/or emits fewer pollutants, implying stronger ecological performance. When , the region operates below the efficiency frontier, suggesting potential improvements such as input redundancy, shortfalls in desirable output, or excessive undesirable output. When , the region lies on the frontier; moreover, indicates super-efficiency relative to the reference frontier constructed by excluding the evaluated unit, which allows efficient regions to be further ranked. Overall, this measure identifies adjustment directions for inefficient regions and differentiates performance among frontier regions, providing an interpretable indicator for the subsequent empirical analysis.
3.2.2. Digital Economy
This paper uses DE as the core explanatory variable and constructs a province-level composite DE index based on a three-dimensional framework: digital infrastructure, digital industrialization, and industrial digitalization. These dimensions capture (
a) the foundational conditions that support data flows and factor mobility, (
b) the supply capacity and agglomeration of digital industries, (
c) the diffusion and use of digital technologies in the real economy. Detailed indicator descriptions and definitions are provided in
Table A2.
In this DE indicator system, digital infrastructure refers to network connectivity and information-transmission capability, which underpin data circulation, platform operations, and digital service delivery. It typically encompasses broadband access, network coverage and communication capabilities, which collectively determine the accessibility and cost of technologies and activities. Moreover, digital industrialization captures the scale and productive capacity of digital industries (e.g., information and communications, software, and IT services) and constitutes the supply-side base of the DE, supported by industrial vitality and human capital. Industrial digitalization, in parallel, describes the degree to which digital technologies are integrated into production and transaction processes in the real economy, including the transformation of business models. It is commonly proxied by indicators related to digital finance, e-commerce, and enterprise informatization, and it primarily reflects improvements in transaction efficiency, reductions in information asymmetry, and optimization of supply-chain coordination and production organization.
To address differences in measurement scales across indicators and to reduce subjectivity in weighting, this study applies the entropy method to aggregate the above indicators into a composite index. The resulting measure provides an objective proxy for provincial digital-economy development and is used as the primary explanatory variable in our empirical analysis.
3.2.3. Channel Variables
Green Technology Innovation. Green technology innovation constitutes a key technological channel through which the DE can improve EE. We proxy green innovation using two per capita measures (per 10,000 people): green patent application intensity (GI_App), defined as the number of applications, and green patent grant intensity (GI_Grant), defined as the number of grants.
Industrial Structure Upgrading. Industrial restructuring embodies the intensive and efficient utilization of resources, providing an important structural channel linking the DE to EE. We capture industrial upgrading along two dimensions: structural advancement and structural rationalization. First, we construct an Industrial Structure Advancement Index (ISAI) as a weighted average of the output shares of the three industrial sectors. Second, we measure structural rationalization using an Industrial Structure Rationalization Index (ISRI), which captures the consistency between factor allocation and the output structure across industries. Specifically, ISRI is computed using the Theil index as follows:
where
denotes the share of industrial output, and
denotes the share of employment in the corresponding industry.
3.2.4. Control Variables
We control for a set of time-varying provincial characteristics. Economic development (ED) captures the overall development stage and investment capacity of a province and may influence both digital development and EE; it is measured as the natural logarithm of real per capita GDP. Industrial structure (IS) reflects the degree of tertiarization and upgrading; a higher service-sector share is typically associated with lower energy use and pollution intensity, which we measure as the share of tertiary industry value added in GDP. Environmental regulation intensity (ERI) captures the strength of pollution-control efforts and supervision. This indicator represents the proportion of GDP accounted for by investment in industrial pollution control that has been completed. Foreign direct investment (FDI) proxies regional openness and foreign-capital inflows that may affect EE via technology spillovers and industrial relocation; it is measured as the natural logarithm of total investment by foreign-funded enterprises. Government intervention (GI) reflects the scale of public spending and the government’s role in resource allocation, which may shape digital infrastructure provision, environmental governance, and industrial policy; it is measured as the share of local general budget expenditure in GDP. Finally, human capital (HC) captures the talent base and knowledge stock that support digital technology absorption and green innovation; it is proxied by the share of the resident population enrolled in regular higher education institutions.
3.3. Sample and Data
This study constructs an unbalanced provincial panel covering China’s mainland provinces with annual observations. The sample period is determined by data availability and the consistency of statistical definitions, ensuring that the indicators required to construct the DE index, measure EE, and compile control variables are continuously available over the study window. Data are primarily drawn from official sources, including the China Statistical Yearbook, the China Environmental Statistical Yearbook, and provincial statistical yearbooks. Green-innovation measures are obtained from patent databases and standardized by population (e.g., per 10,000 people).
Table 1 presents the descriptive statistics.
4. Empirical Results and Analysis
4.1. Basic Correlation and Preliminary Tests
We first provide a descriptive assessment of the relationship between DE and EE.
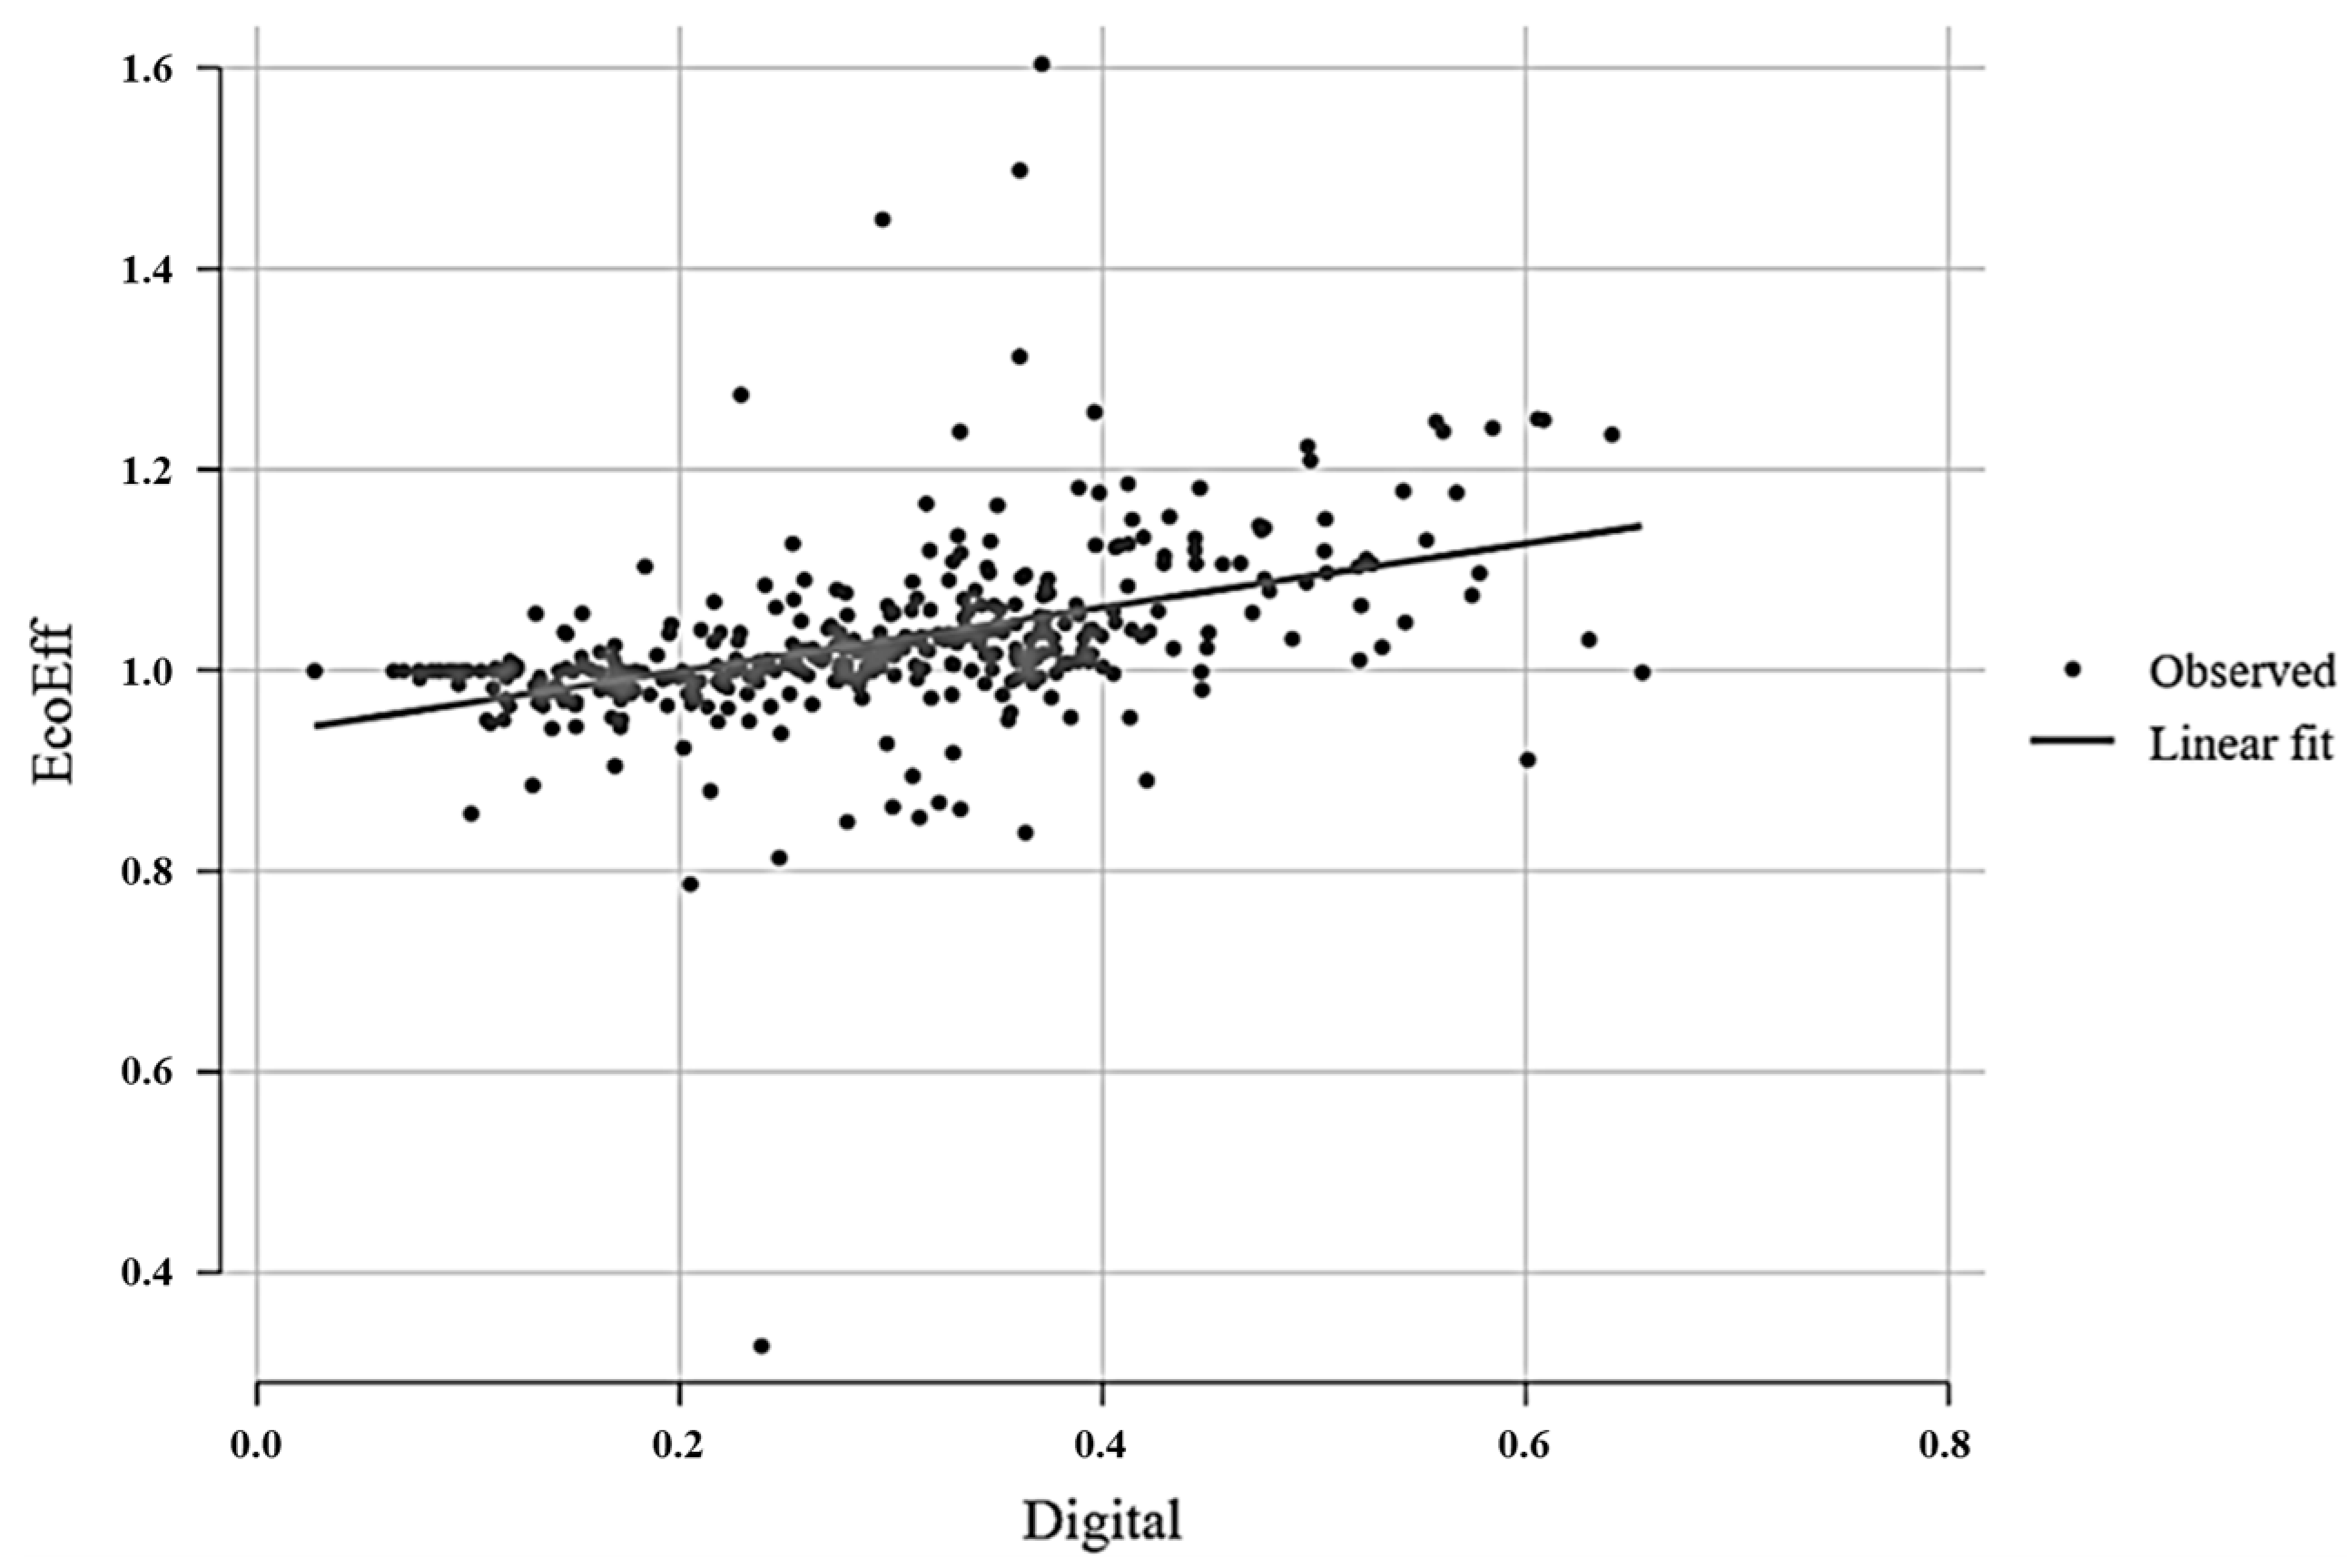
Figure 1 presents a scatter plot of province–year observations over the sample period, together with a linear fitted line. The fitted line is upward sloping, suggesting that provinces with higher levels of DE tend to exhibit higher EE. At the same time, the dispersion of observations around the fitted line indicates substantial cross-provincial heterogeneity in the strength of this association. Overall,
Figure 1 provides suggestive evidence of a positive association between the DE and EE.
Given that this study employs a long panel dataset, we conduct a series of preliminary tests in
Table A3,
Table A4 and
Table A5 to ensure the reliability of our panel estimations.
Table A3 reports the results of cross-sectional dependence tests, all of which significantly reject the null hypothesis of no cross-sectional dependence.
Table A4 presents the Pesaran-CADF panel unit-root test results, indicating that both DE and EE are stationary series. In addition, the cointegration tests reported in
Table A5 suggest a statistically significant cointegrating relationship between DE and EE.
4.2. Baseline Regression
Table 2 presents the coefficient estimates for DE with respect to EE. Column (1) reports the unconditional relationship between the DE and EE, without controls or fixed effects. Column (2) adds province-level controls. Column (3) includes province and year fixed effects but omits the control set. Column (4) incorporates both the full control vector and two-way fixed effects and serves as our preferred specification. In Column (1), the coefficient on DE is positive and significant at the 1% level, indicating that provinces with more developed DE tend to have higher EE, consistent with Hypothesis 1. Moreover, these findings are consistent with the conclusions of Wang et al. (2024) and Hu and Li (2024) [
9,
14]. Notably, the DE coefficient remains positive and statistically significant in Columns (3)–(4), implying that the finding is robust to absorbing time-invariant provincial differences and common year shocks. From a broader regional development perspective, the positive effect of DE on EE may further interact with the evolution of local economic systems. Improvements in EE can enhance overall production efficiency and resource utilization, which may, over time, create favorable conditions for the expansion and deepening of digital applications, such as higher demand for data-driven services, stronger incentives for firms to adopt digital technologies, and a more supportive environment for digital infrastructure upgrading. Such interactions point to a reinforcing and co-evolutionary process between DE and EE at the system level. In the next subsection, we further address potential identification concerns and present additional evidence to strengthen the causal interpretation of the baseline regression results.
Turning to the controls, ED is significantly positive in Column (2) but becomes statistically insignificant once two-way fixed effects are introduced, implying that its explanatory power mainly reflects persistent cross-province differences and/or common trends rather than within-province variation over time. Openness (FDI) is significantly negative in Column (4), suggesting that, conditional on fixed effects, foreign capital inflows may reduce EE, potentially through pollution-intensive industrial relocation or compositional changes in industrial structure. Finally, multicollinearity does not appear to be a concern: the mean VIF is 3.08, which is well below conventional thresholds, indicating that correlations among regressors are unlikely to materially inflate standard errors or bias the estimated effect of digital.
4.3. Endogeneity Tests
Table 3 reports instrumental-variable (IV) estimates of the effect of the DE on EE. Since the relationship between DE and EE may be biased by omitted variables and reverse causality, we construct exogenous instruments to mitigate potential endogeneity concerns. Following the shift-share approach of Nunn and Qian (2014) [
37], our instruments leverage two plausibly exogenous sources of variation: historical communication infrastructure and natural endowments. These factors generate differential exposure to the digital wave across provinces and provide external variation for identifying the causal effect. Specifically, IV1 and IV2 are interaction terms between early communication infrastructure (e.g., landline telephone penetration and postal-network foundations in 1984) and contemporaneous broadband expansion, capturing path dependence in communication capacity and thus predicting provincial digital development. These historical foundations predate the emergence of the DE and are time-invariant; their direct effects are absorbed by province fixed effects, which makes it less likely that they affect EE through other contemporaneous channels, thereby supporting the exclusion restriction. IV3 interacts terrain conditions with the density of digital-economy enterprises, leveraging the idea that topography affects the cost and accessibility of network construction and thus generates supply-side variation in digital development, while not directly affecting EE.
Table 3 shows that the second-stage coefficient on DE remains positive and statistically significant across alternative instrument sets, indicating that the baseline finding is robust after addressing potential endogeneity. The first-stage results further confirm that the instruments are strongly correlated with DE: weak-instrument test statistics exceed conventional thresholds. In addition, the Kleibergen–Paap rk LM test rejects under-identification in all specifications, supporting the relevance of the instruments and the validity of the IV identification strategy. Overall, the IV results mitigate endogeneity concerns and reinforce the conclusion that digital economic development improves EE.
4.4. Robustness Checks
To evaluate robustness, we carry out additional checks, reported in
Table 4. First, we recompute EE using the Malmquist–Luenberger (ML) index. Column (1) indicates that DE remains positive (
p-value < 5%), which indicates that our main conclusion is insensitive to the efficiency metric. Second, we rebuild the DE using principal component analysis (PCA) instead of entropy weighting. As reported in Column (2), As shown in (2), although the estimated value of DE has decreased, it still reveals a significant positive effect of DE. Third, given that centrally administered municipalities differ in economic scale, policy resources, and governance capacity, we exclude them and re-estimate the model. Column (3) again yields a positive and significant DE coefficient, implying that the baseline finding is not dominated by a few megacity observations. Fourth, we replace DE with its one-period lag to mitigate contemporaneous reverse causality. Column (4) continues to yield a positive and significant estimate, supporting a more credible temporal ordering between digital development and EE. Finally, we winsorize key variables to reduce the influence of outliers. Column (5) shows that the coefficient remains stable.
4.5. Mechanism Analysis
To investigate the mechanisms through which DE affects EE, we first estimate the impact of DE on potential channels. In
Table 5, Columns (1)–(2) report that DE is associated with greater green-innovation output, regardless of whether innovation is proxied by green patent applications or grants. This finding is consistent with the view that digital technologies mitigate information asymmetries and coordination frictions in the innovation process, facilitate faster diffusion and recombination of knowledge, and improve the efficiency of R&D input allocation by strengthening search, matching, and collaboration across inventors, firms, and research networks. Moreover, Columns (3)–(4) show heterogeneous effects on industrial restructuring: DE significantly improves structural rationalization, but its effect on structural advancement is statistically insignificant. A plausible theoretical explanation is that digitalization first operates through micro-level efficiency channels that are readily capitalized into better coordination and reallocation outcomes, such as lowering search and monitoring costs, improving information transparency, and facilitating inter-firm matching and supply-chain integration, which directly strengthens rationalization without necessarily inducing immediate changes in broad sectoral output shares. By contrast, advancement as captured by sectoral-weighted output composition is jointly determined by demand patterns, market access, and the relative profitability of high value-added service activities, all of which depend on complementary conditions including human capital, innovation capacity, regulatory environment, and the development of producer services; absent these complements, digitalization may raise productivity within existing sectors and foster the digital transformation of manufacturing and traditional services rather than expand the tertiary sector’s aggregate share in a way that is detectable in the data.
To test potential channel effects, we compare changes in the estimated coefficients for DE before and after including the channel variables as dependent variables in Equation (1) in the spirit of Persico et al. (2004) and Alesina and Zhuravskaya (2011) [
38,
39]. These changes express the extent to which the relationship between DE and EE is explained by these channels. In
Table 6, Column 1 shows the estimated results before the inclusion of potential channels; Columns 2–5 show the outcomes with each potential channel included separately. By comparing the estimation results of Column 1 with those of Columns 3–5, we find that once GI_App, GI_Grant and ISRI are incorporated into the model, the coefficients for DE significantly decrease. This indicates that GI_App, GI_Grant and ISRI are key channels through which DE is linked to EE. These results, compared with existing studies, such as Huang et al. (2023), deepen our understanding of the channel role played by industrial structure [
19].
4.6. Threshold Effect Tests
To assess whether environmental regulation generates nonlinearities in the DE-EE nexus, we follow Hansen’s (1999) panel threshold approach and use 300 bootstrap replications to evaluate the significance of threshold effects [
35], given that the threshold parameters are not identified under the null. For each bootstrap draw, we re-estimate the threshold model and compute the LR statistic, which yields an empirical reference distribution for
p-values; we also report the estimated threshold values with confidence intervals.
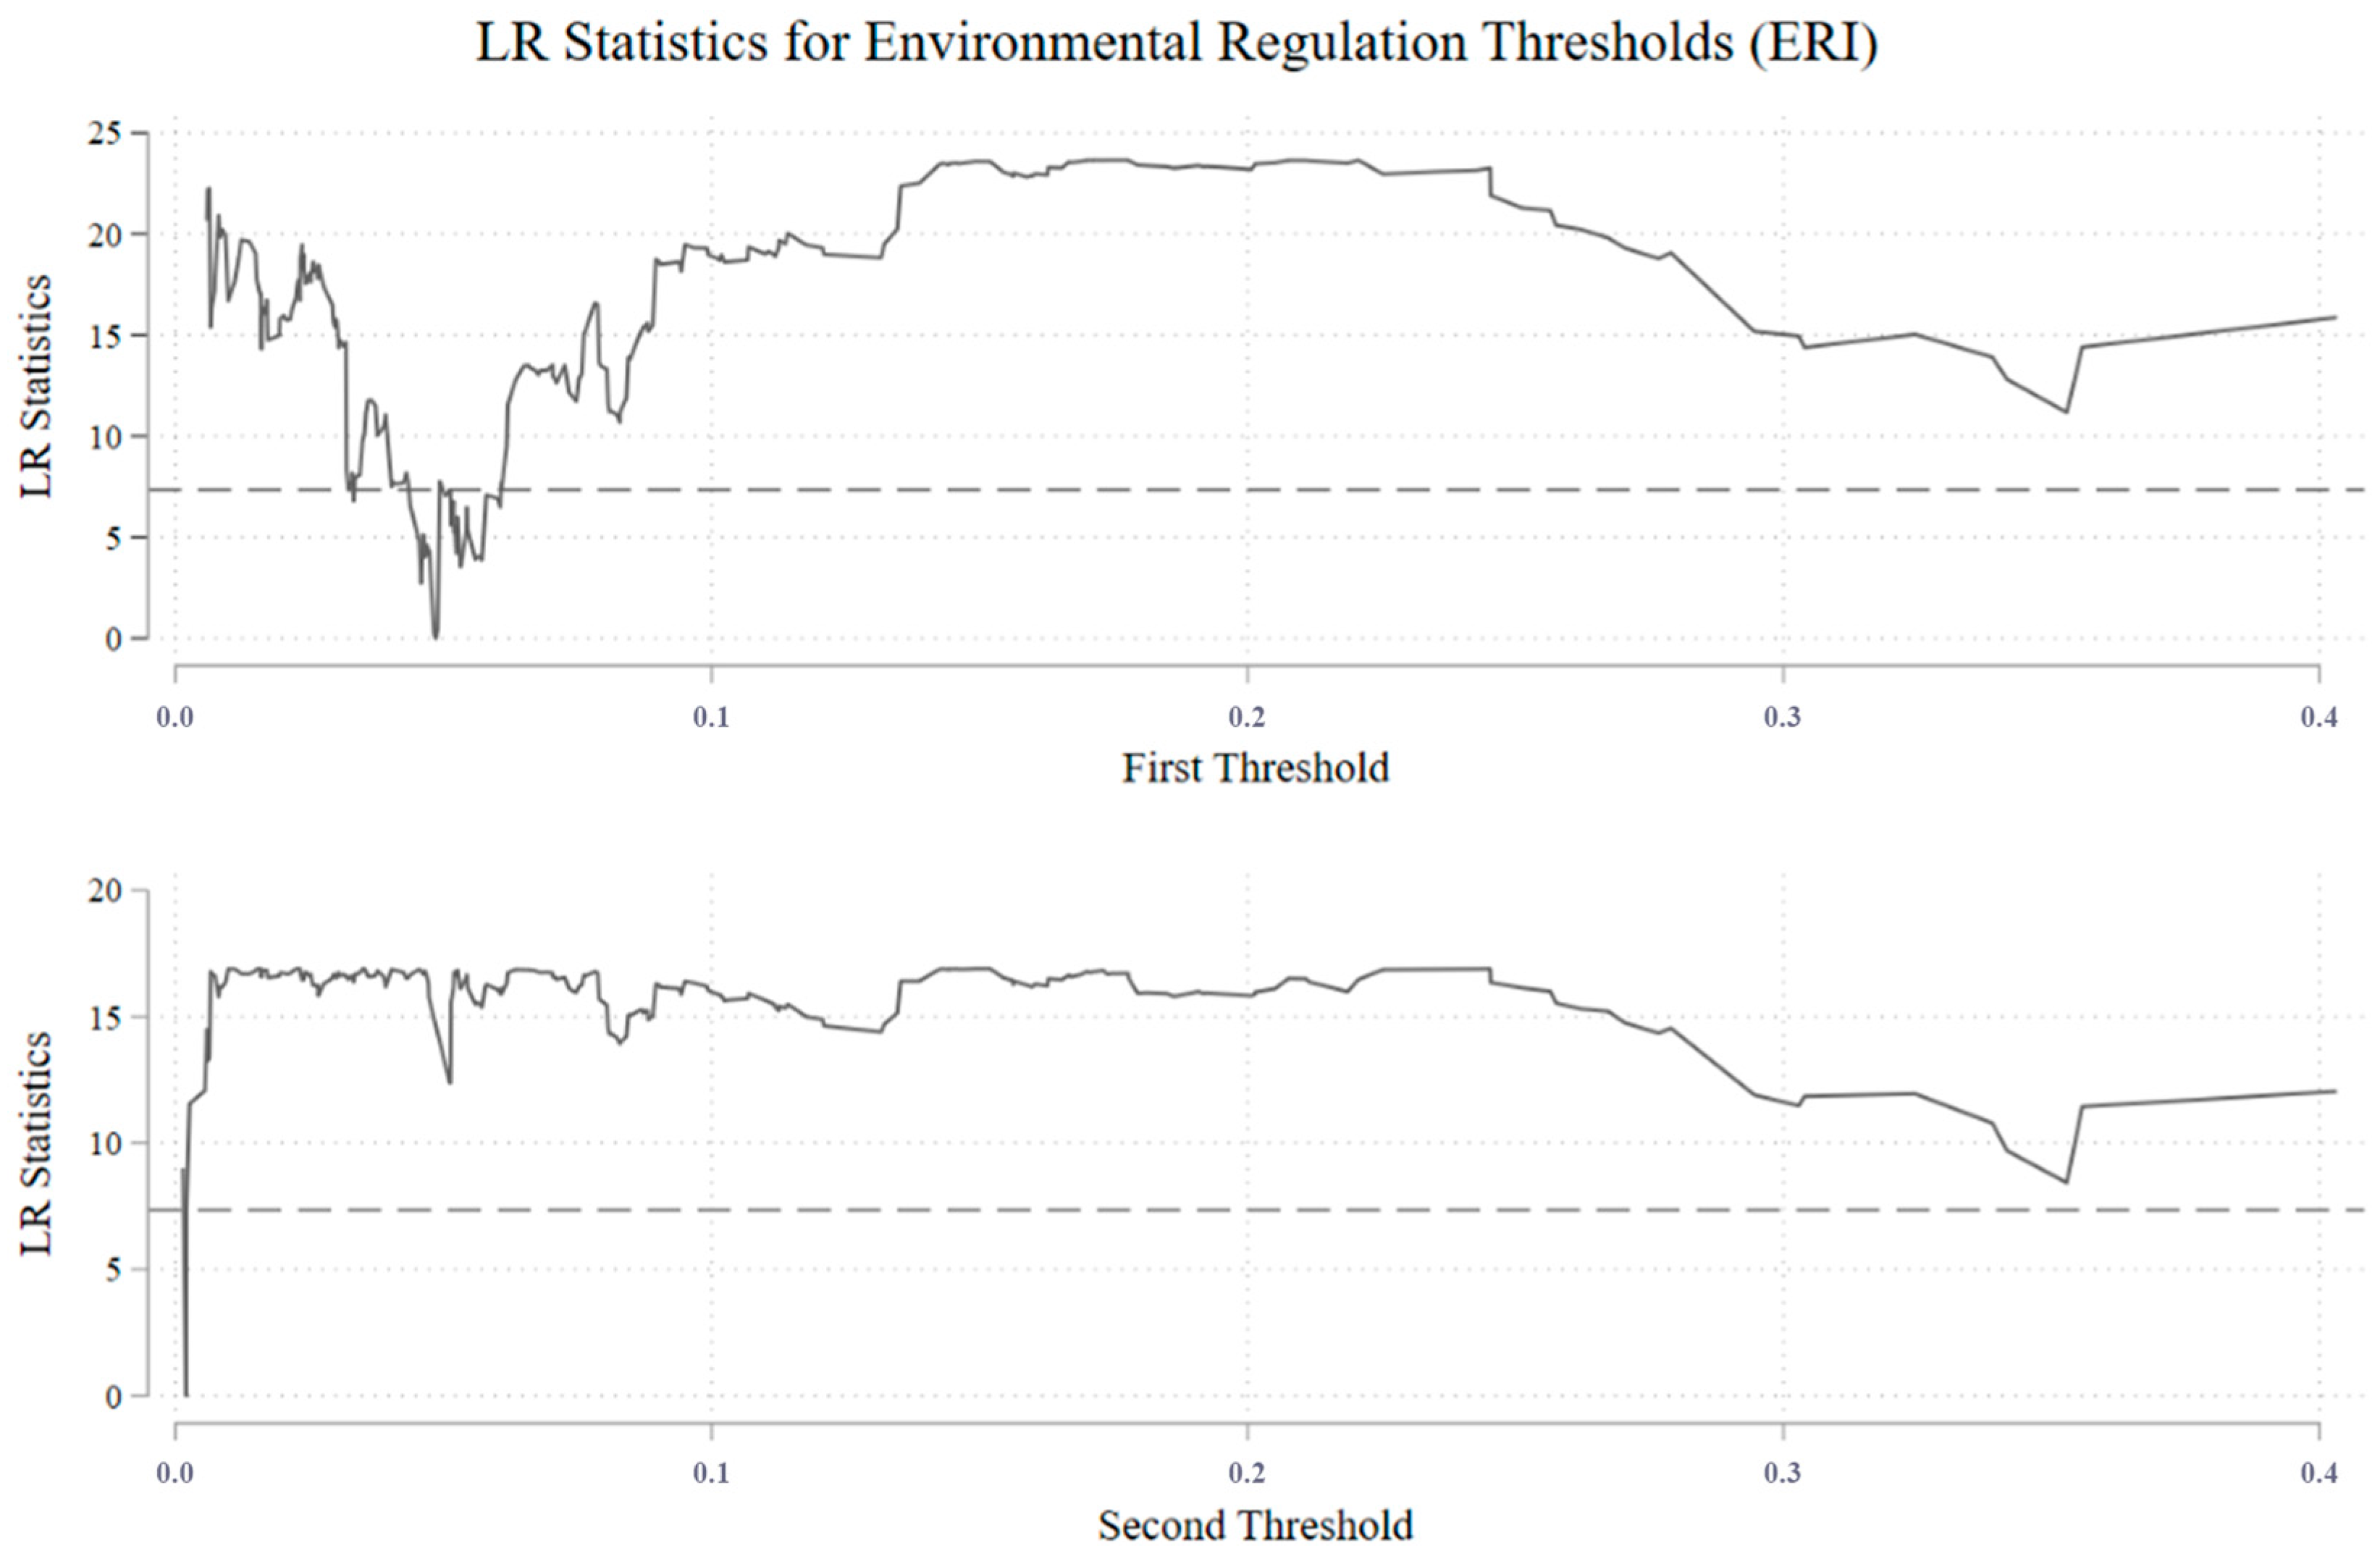
Table 7, together with the LR profiles in
Figure 2, points to statistically significant threshold nonlinearity in the impact of the DE on EE. Both the single- and double-threshold specifications are supported, whereas the triple-threshold specification is not. These results imply that regulatory stringency changes the marginal effect of the DE, with the nonlinearity largely reflected in two regime switches. In line with this reading, the LR profiles for the first two thresholds reach distinct minima near the estimated cutoffs and stay below the critical value within a tight neighborhood, indicating well-identified and stable threshold estimates. We therefore adopt the double-threshold model as our preferred specification and divide the sample into three regimes based on increasing ERI.
Table 8 further reveals that the effect of the DE on EE varies across environmental-regulation regimes, displaying an “insignificant under low regulation, strengthened and significantly positive beyond the threshold” pattern. When ERI is low, the estimated coefficient on DE is 0.279 but statistically insignificant, suggesting that in the absence of sufficient regulatory stringency and green-governance pressure, digitalization may primarily support market expansion and scale economies, and its potential green-efficiency gains may not reliably translate into higher EE. Once ERI exceeds the first threshold and enters the medium-regulation regime, the coefficient on DE increases and becomes statistically significant, indicating complementarity between stronger environmental regulation and digital capabilities. In this regime, greater regulatory pressure can induce firms and governments to deploy digital technologies for monitoring, compliance, and the diffusion of green innovations, thereby improving EE. In the high-regulation regime, the coefficient on DE remains positive and significant but is smaller than in the medium-regulation regime, which may reflect diminishing marginal returns to digitalization under tighter constraints or partial offsetting by compliance and structural-adjustment costs. Overall, the results indicate that the DE can sustain improvements in EE, but its effectiveness depends critically on the stringency of environmental regulation. This finding is theoretically consistent with the main conclusions of Liang and Hu (2025), suggesting that the environmental benefits brought about by digitalization may vary with the intensity of environmental regulation [
20].
Notably, based on the raw data from our sample, by the end of the sample period, all provinces except Hainan had already crossed the first threshold and entered the “dividend-releasing” range in which DE begins to exert a significantly stronger effect on EE. This pattern implies that, for most regions, the enabling conditions for translating digital transformation into green productivity gains are increasingly in place, and that further improvements in EE may be achieved through deepening digital adoption and accelerating the integration of digital technologies into energy saving, emissions monitoring, and cleaner production processes. At the same time, the exceptional case of Hainan indicates that lagging digital infrastructure, limited industrial digitalization, or an insufficiently developed digital ecosystem may delay the realization of these environmental dividends. From a policy perspective, this finding underscores the need for a differentiated strategy: provinces that have entered the dividend-releasing range should prioritize strengthening regulatory enforcement and guiding digital technologies toward greener applications, whereas provinces still below the threshold should focus on narrowing the digital divide through targeted investments in infrastructure, human capital, and data governance.
4.7. Heterogeneity Analysis
Table 9 reports grouped regressions that examine heterogeneity in the effect of the DE on EE along two dimensions. First, by economic development, the coefficient on DE is positive and statistically significant in more developed regions (Column (1)), whereas it is negative and statistically insignificant in less developed regions (Column (2)). This pattern suggests that where marketization and economic fundamentals are stronger, digital technologies are more likely to translate into green innovation diffusion, process optimization, and more efficient factor allocation, thereby improving EE. Second, concerning HC, the estimated effect of DE is larger and significant in regions with higher human capital levels (Column (3)), but remains positive yet insignificant in those with lower capital levels (Column (4)). These results point to an “absorptive capacity” constraint: regions with a deeper pool of skilled labor and a stronger capability to adopt and adapt new technologies can embed digital tools more effectively into production and governance, enabling energy saving, lower energy intensity, and pollution abatement, and thus achieving greater gains in EE.
Table 10 further examines the moderating role of internet broadband access rate (IBAR) in shaping the relationship between the DE and EE, thereby speaking directly to the notion of a synergistic evolution between digital transformation and ecological performance within the regional economic system. The interaction term (DE × IBAR) is significantly positive both with and without controls, indicating that better broadband infrastructure amplifies the marginal ecological efficiency gains associated with digital development. This result suggests that synergistic evolution is more likely to emerge when digital technologies are supported by adequate connectivity and platform foundations. With higher broadband penetration, regions can facilitate faster diffusion of digital applications, broader data sharing, and smoother interfirm and government coordination, which strengthens the embedding of digital tools into green production, process upgrading, and environmental governance. As a consequence, digital progress is more effectively translated into sustained regional green upgrading, and the co-evolution between the digital economy and ecological efficiency becomes more pronounced, which highlights the importance of complementary infrastructure in enabling digital and green transitions to advance in tandem.
5. Conclusions
From a Regional Economic System Perspective with EE as the key dependent variable, this research expands the discourse on the DE beyond traditional growth and productivity to encompass green development. The study empirically demonstrates how digitalization contributes to improved ecological performance. Using a fixed-effects specification and panel data, we examine the effect of DE on EE. Baseline regressions show that DE is associated with a significant increase in EE, and the result remains robust across a variety of specifications—for example, alternative variable constructions, excluding specific subsamples, using lagged measures of digitalization, and reducing sensitivity to outliers. Mechanism tests further suggest three channels. First, the DE increases green innovation output, consistent with the idea that digital technologies reduce information frictions, facilitate knowledge diffusion, and improve the matching and allocation efficiency of innovation inputs. Second, digital development promotes industrial structure optimization, with effects concentrated in structural rationalization rather than immediate structural advancement, implying that digitalization may first enhance coordination and reduce misallocation before supporting longer-run upgrading. Third, the DE is associated with lower energy consumption and intensity, consistent with improvements in energy-use efficiency driven by data-enabled management, smart manufacturing, and process optimization. Threshold regressions indicate that environmental regulation exhibits a nonlinear moderating role. When regulation is weak, the effect of the DE on EE is statistically insignificant; once regulation surpasses the threshold, the effect becomes significantly stronger and remains positive, suggesting complementarity between regulatory stringency and digital capabilities. Finally, heterogeneity analyses show that the positive effect is concentrated in economically more developed and human-capital-abundant regions, implying that the realization of digital-green dividends depends on local economic foundations and absorptive capacity.
These findings carry several implications. Firstly, governments can position digital transformation as a key instrument for raising EE and advancing green development through “digital empowerment.” Alongside investments in digital infrastructure and progress in industrial digitalization, policy should facilitate the application of digital tools in energy management, cleaner production, supply-chain coordination, and pollution control. In particular, both public and private digital spending should move beyond scale-oriented expansion and prioritize measurable gains in energy conservation, emissions abatement, and efficiency enhancement, thereby strengthening the conversion of digital inputs into ecological-efficiency gains. Secondly, policy design should strengthen complementarity between environmental regulation and digital governance. Our results indicate that sufficiently stringent and effectively enforced regulation can amplify the green effects of the DE. Accordingly, policymakers should enhance regulatory predictability and enforcement consistency, expand the use of digital oversight tools (e.g., online monitoring, interagency data sharing, smart enforcement, and information disclosure), and build a closed-loop governance system covering “pressure transmission–process monitoring–outcome accountability,” so that digital technologies are more effectively directed toward energy conservation and emissions mitigation. Thirdly, to prevent a digital divide from becoming a “green divide,” targeted digital-green policies are needed for less developed regions where the estimated effects are weaker. Interventions should address key bottlenecks, such as inadequate digital infrastructure, limited industrial support capacity, and financing constraints, by supporting traditional industries and SMEs in undertaking energy-saving digital upgrades through dedicated funds, green digital-transformation subsidies, and public technical-service platforms. Fourthly, human capital should be prioritized as a key enabling condition for realizing digital-green dividends. The heterogeneity results highlight the importance of absorptive capacity. Policies should therefore strengthen the training of hybrid talent with both digital skills and green-management expertise, promote industry–university-research collaboration and vocational training, and enhance organizational capabilities in data governance, smart manufacturing, and energy management, thereby improving the alignment between technology adoption, talent, and managerial practices. Fifthly, digitalization should be leveraged to facilitate structural optimization and improve factor allocation efficiency, thereby consolidating the structural basis for ecological-efficiency gains. Given that the mechanism results point primarily to structural rationalization, policies should support digital tools that improve value-chain coordination, reduce resource misallocation, and raise cross-sector allocation efficiency. Over the medium-to-long run, digital resources should be guided toward modern services and green high-end manufacturing to promote cleaner, higher value-added industrial upgrading.
Despite these contributions, this paper still has certain limitations, which provide new directions for further research. Firstly, it is worth investigating the longer-term dynamic effects of DE on EE, which would enable policymakers to more accurately assess the long-run policy impacts and the sustainability of the effects. Secondly, in addition to the channels we proposed, there are other potential pathways through which DE could influence EE that deserve exploration. Finally, to better understand the role of DE across different national contexts, the heterogeneous effects of DE on EE in a broader set of countries warrant further investigation.