1. Introduction
The continuous increase in global energy demand has transformed the supply of energy resources into a multifaceted decision problem with strategic, economic, and environmental dimensions. Goals such as energy supply security, cost minimization, environmental reduction, and ensuring supply continuity often conflict with each other, complicating energy supply processes. This complexity makes approaches based on only a single criterion in energy resource supply insufficient, thus increasing the importance of multi-criteria decision making (MCDM) methods.
Traditional energy supply planning approaches are generally based on deterministic models and limited datasets [
1]. However, the increasingly dynamic nature of energy markets, uncertainties in renewable energy production, and geopolitical risks necessitate the use of more flexible and data-driven methods [
2]. In this context, big data analytics and machine learning (ML) techniques offer effective solutions in areas such as energy demand forecasting, price prediction, production planning, and risk analysis.
ML methods can model nonlinear relationships between numerous variables in energy systems and generate highly accurate predictions under conditions of uncertainty [
3]. However, these methods often focus only on prediction and classification problems; the resulting outputs are not systematically evaluated to encompass the entire decision-making process. At this point, integrating predictions obtained through ML with MCDM methods enables more consistent, transparent, and rational decision-makings in energy resource supply [
4].
MCDM approaches allow for the simultaneous evaluation of quantitative and qualitative criteria such as cost, environmental impact, security of supply, technological maturity, and social acceptance [
5,
6]. MCDM models, supported by ML, enable both more realistic determination of criterion weights and data-driven comparisons of the performance of alternative energy sources.
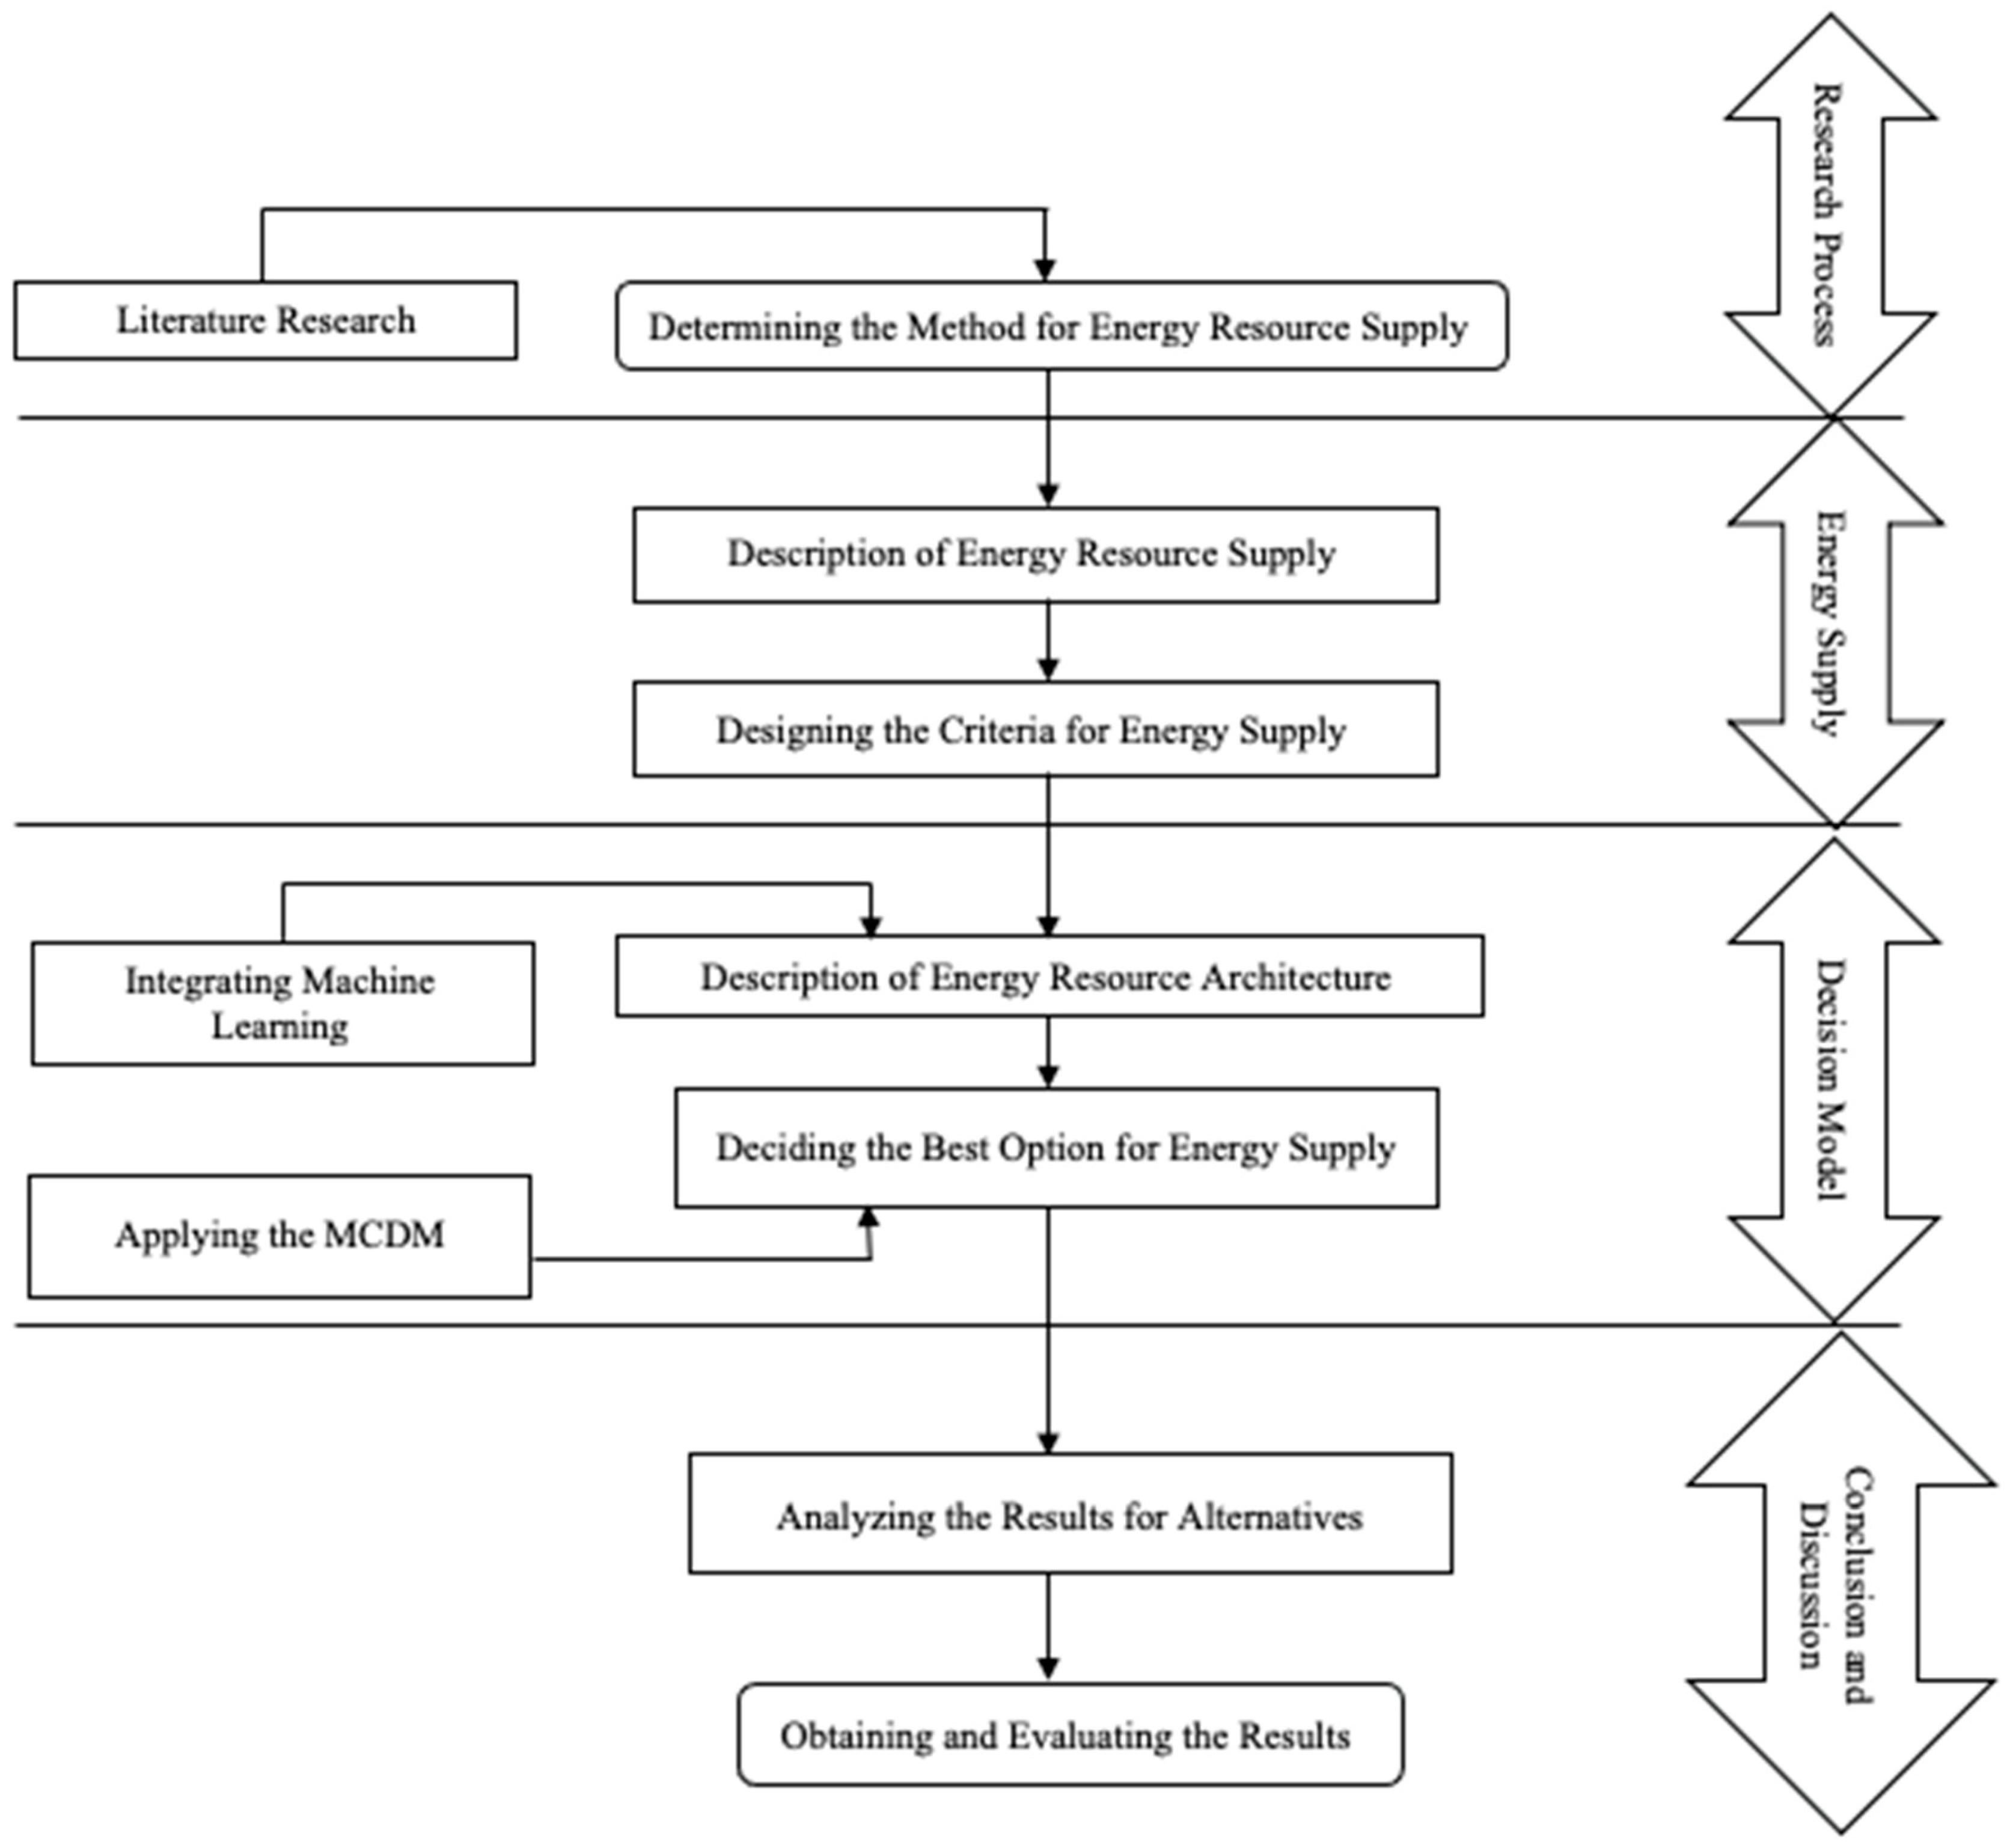
The aims of this study are to examine the combined use of ML and MCDM methods in energy resource procurement; to systematically review existing approaches in the literature; and to highlight the advantages of integrating these two methods. Furthermore, by evaluating application areas, challenges encountered, and future research trends, it aims to contribute to the development of data-driven and multi-dimensional decision support systems in the energy sector. The flowchart of this study is shown in
Figure 1.
In this study, a large company in Ankara wants to utilize solar power plants (SPPs) to meet the energy needs of a new factory it plans to build. For this purpose, it wants to use an energy storage system (ESS). In this study, the K-means method was used to determine the locations of alternative ESSs. Based on criteria developed through a literature review and expert opinions, the fuzzy TOPSIS method was chosen to rank the alternatives. This study will enable a more effective approach to the decision-making process for energy supply. The combination of these methods and their application within this sector highlights the originality of this study. The results obtained will also serve as a reference for future energy supply studies.
The main innovation of this study lies in the two-stage decision-making framework that integrates unsupervised machine learning and fuzzy multi-criteria decision-making. Unlike conventional site-selection studies that directly apply MCDM to predefined alternatives, this study first employs K-means clustering as a spatial pre-processing step to generate representative candidate locations based on the geographical distribution of existing solar power plants. The K-means algorithm is applied only once in this study. The elbow method is utilized to determine the optimal number of clusters by identifying the point at which the rate of decrease in the within-cluster sum of squares significantly slows down.
The
Section 1 of this study provides an introduction and general information about the research.
Section 2 presents the literature review conducted according to the methods to be studied.
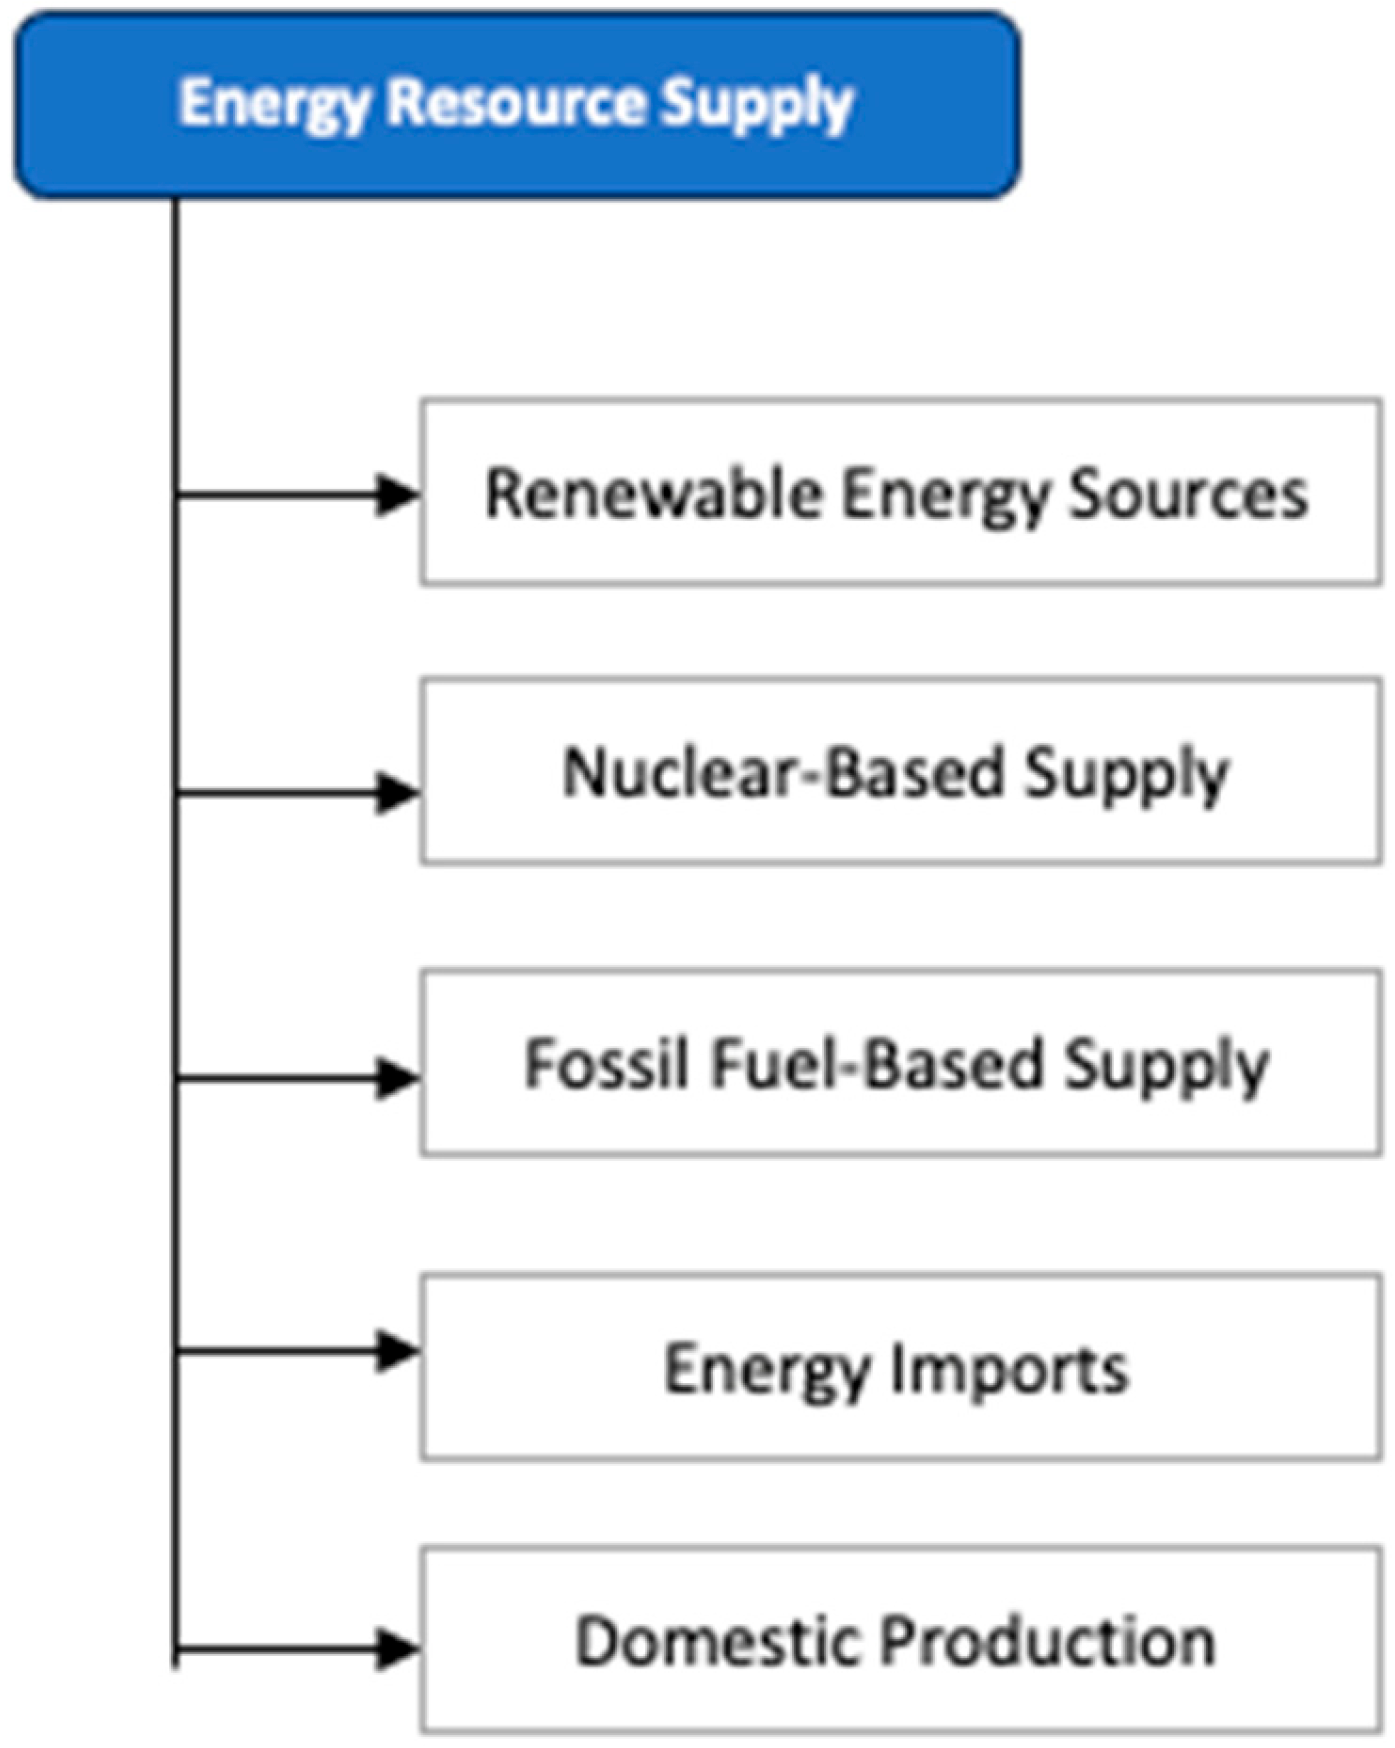
Section 3 examines the methods of supplying energy resources. The concept of supplying energy resources is explained in general.
Section 4 describes the methods used in this study. The steps for implementing the methods are explained step by step.
Section 5 shows the architectural structure created for the study. It explains how ML and fuzzy TOPSIS methods will be used in selecting and evaluating criteria. The ranking of alternative solar energy supply options is also presented.
2. Literature Research
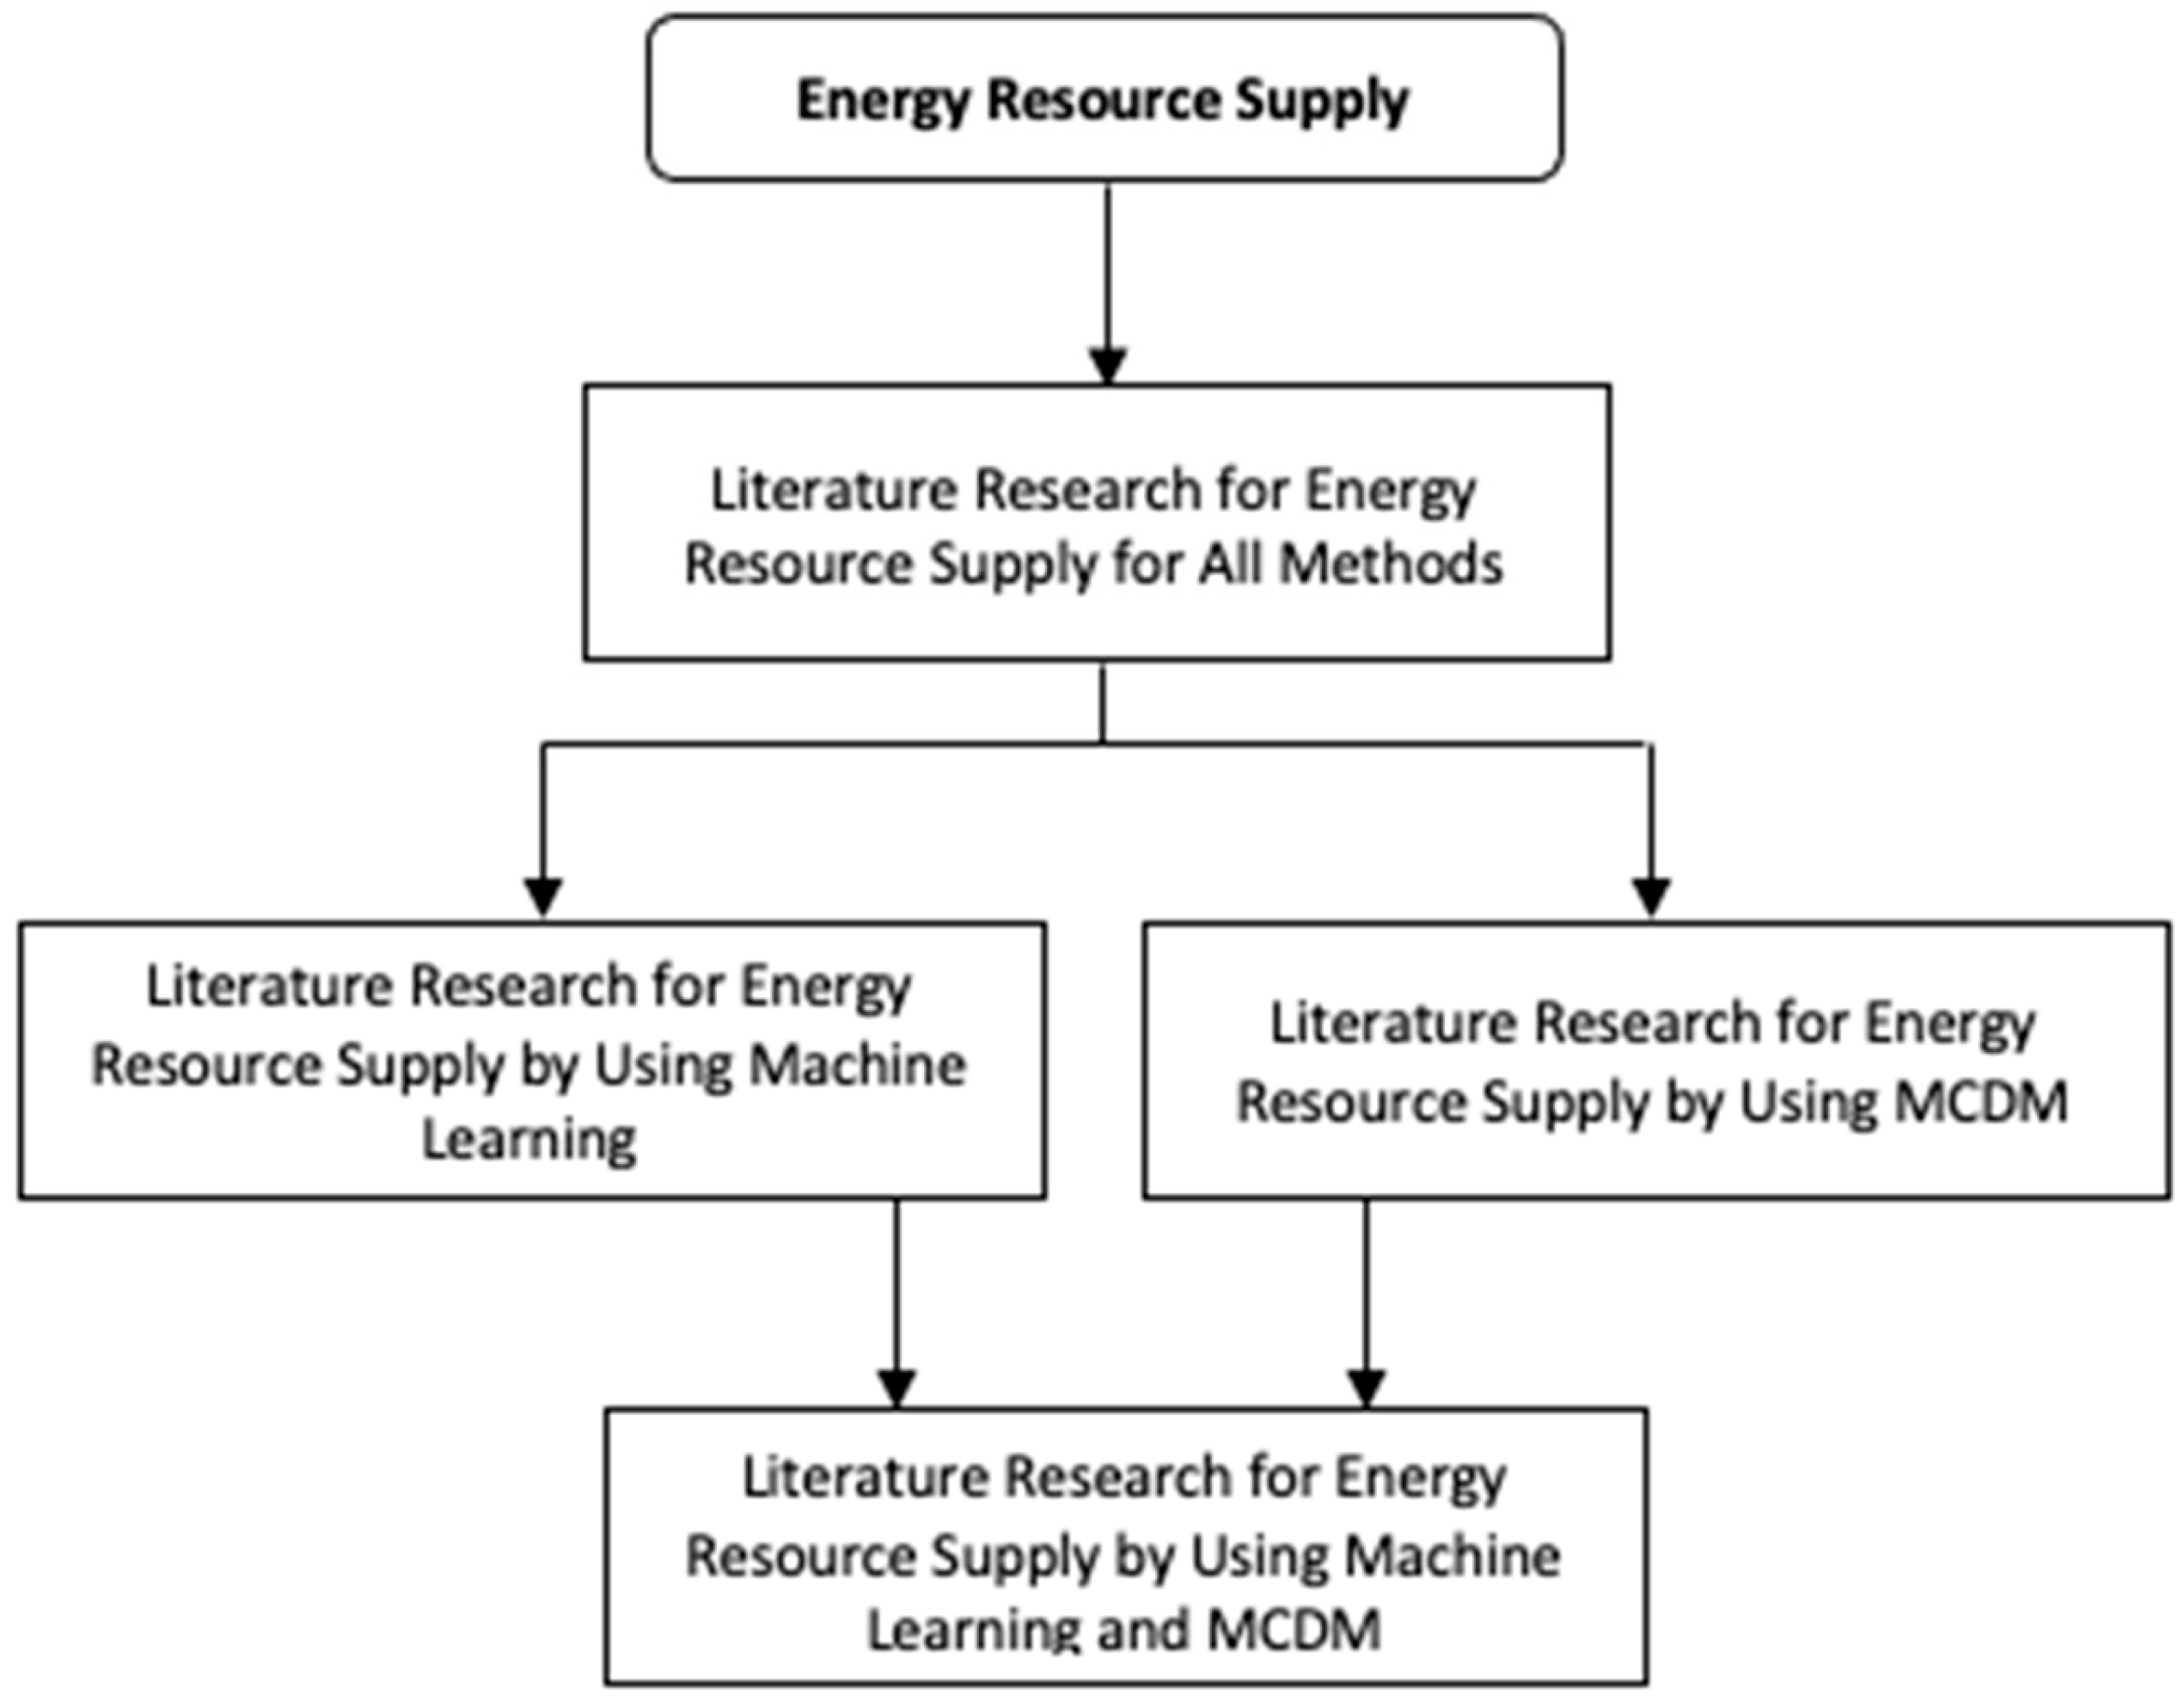
This section systematically reviews the existing literature on the use of ML and MCDM methods in the field of energy resource supply. A framework for how the literature review was conducted is given in
Figure 2.
First, studies related to energy resource supply were generally searched. Wang and Lei (2023) conducted a study on energy supply from oil and natural gas in the United States [
7]. Nunes et al. (2023) conducted a supply chain analysis regarding the conversion of woody waste biomass used in agroforestry into energy [
8]. Their study used the PEST method and SWOT analyses. Bigerna et al. (2023) conducted an application in Italy on energy resource supply [
9]. Other research on energy supply policies in Italy is available in the literature. Alhajri et al. (2023) [
10] conducted a comprehensive study on the optimal planning of renewable energy sources to power water treatment units in Kuwait. They developed an ML-based method for modeling uncertainties. Aboagye et al. (2021) conducted a study examining the status of renewable energy sources in electricity supply in Ghana [
11]. Pinto et al. (2020) evaluated the potential of combining wave and solar energy sources to power offshore oil and gas platforms worldwide [
12].
Many studies using ML in the energy field are included in the literature. Alhasnawi et al. (2025) [
13] studied cyberattacks, cybersecurity, and energy management in smart grids using ML. The Internet of Things (IoT) was also used for the analyses. Alharbi et al. (2025) used ML for energy estimation of a building [
14]. Allahyari et al. (2025) optimized energy use in underserved schools in hot and dry climates using ML [
15]. Zhu et al. (2025) conducted a study on predicting carbon emissions in the energy sector based on noise reduction and hybrid ML [
16]. Fasogbon et al. (2025) investigated optimizing the efficiency of an energy grid using the ML method [
17]. Studies combining ML and deep learning (DL) algorithms can also be found in the literature. Tezcan and Efeoglu (2025) studied wind energy using ML and DL algorithms together [
18]. Moon et al. (2025) used ML to evaluate the performance of interatomic potentials for energy estimation [
19]. Mounika et al. (2025) used the ML method to predict power sharing in a fuel cell-based energy system [
20]. Yan et al. (2025) used the ML method to minimize energy use [
21]. Malakouti et al. (2025) conducted a study comparing the efficiency and accuracy of ML algorithms used to predict energy consumption across all sectors in the USA [
22]. Tong et al. (2025) investigated the use of high-entropy materials with ML for advanced energy storage systems [
23]. Rasouli and Rastegar (2025) conducted a study on combining DL, ML, and statistical methods with meta-learning to estimate net energy consumption in multiple carrier energy systems [
24]. Abidin et al. (2025) conducted a systematic literature review on the combined use of IoT and ML for smart energy control in office buildings [
25]. Aliqab et al. (2025) conducted an improvement study using the ML method for a graphene-based solar energy system [
26]. Yadav et al. (2025) used the ML method to improve wind energy forecasts in India [
27]. Lu and Wan (2025) used ML algorithms to estimate risk while investigating the causes of energy poverty among the Chinese population [
28].
Studies using MCDM methods in the energy sector are also available in the literature. Pei et al. (2025) conducted an optimization study on energy saving using the fuzzy MCDM methods, preferring the fuzzy VIKOR and TOPSIS methods among them [
29]. Shekari et al. (2025) used the MCDM approach in waste energy conversion, which involved AHP, ANP, and simple additive weighting methods [
30]. Zournatzidou et al. (2025) used the TOPSIS method, a multi-criteria decision-making method, in their study on the analysis of energy efficiency [
31]. Theiling et al. (2025) used AHP, ANP, and TOPSIS methods in energy-efficient building renovation [
32]. Alhammadi et al. (2025) conducted a study to select an ESS; among the MCDM methods, AHP was preferred [
33]. Roy et al. (2025) conducted a study using the TOPSIS method for selecting renewable energy systems [
34]. Godoy et al. (2025) investigated energy planning in Ecuador using PROMETHEE, one of the MCDM methods [
35]. Torres et al. (2025) conducted a study including AHP and TOPSIS methods for the selection of energy production technology in sustainable energy systems [
36]. Amiri et al. (2024) similarly conducted a study on the selection of renewable energy sources in Saudi Arabia using the AHP and TOPSIS methods [
37]. Liao and Li (2025) used the DEMATEL method, an MCDM method, for the selection of renewable energy storage technology [
38]. Lotfipour and Mohtavipour (2024) used the AHP and TOPSIS methods together to determine the optimal share of renewable energy sources in the wholesale electricity market [
39]. Liu et al. (2024) used the ARAS method, an MCDM method, for the problem of selecting a hybrid energy system focused on Industry 4.0 [
40]. Uzair and Kazmi (2023) used the TOPSIS method for the analysis of the energy management system of smart buildings [
41]. Gharibi et al. (2024) [
42] conducted a study on the gasification of polyethylene air considering energy and environmental aspects. They used ML and TOPSIS methods together in their study. Sadeghi et al. (2025) [
43] conducted a comparison of renewable energy investments using MCDM methods. They used the TOPSIS, ELECTRE, and VIKOR methods for this comparison. Iglesias et al. (2025) used the AHP and VIKOR methods for the selection of energy production technologies [
44]. Chung and Chang (2022) used data envelopment analysis, an MCDM method, for the analysis of hydrogen energy utilization in a fuzzy environment [
45].
As a result of the literature review, many studies conducted in the field of energy were examined. A list of these studies, categorized by methodology, is shown in
Table 1.
As seen in the literature review, most studies use only MCDM methods or only ML methods. Some publications use both ML and MCDM methods together. However, these publications do not focus on energy resource procurement.
In this study, the K-means clustering algorithm is employed as a spatial pre-screening tool to identify representative candidate locations for energy storage systems. Unlike previous studies that apply fuzzy TOPSIS directly to predefined alternatives, this study integrates an unsupervised clustering stage prior to the MCDM analysis.
This study involved the combined use of MCDM and ML methods in the field of energy resource supply. An application of this study was conducted at a leading company in its sector in Turkey. This research is unique in terms of the methods used and the sector in which it is applied. There is no similar study in the literature on solar energy supply. The combined use of ML and MCDM methods is crucial for managing processes and ensuring the correct energy supply according to needs.
Despite the extensive literature on machine learning-based clustering and fuzzy MCDM methods, few studies have explicitly combined these approaches for energy storage system siting in the context of solar energy supply systems. Moreover, region-specific applications for Turkey remain limited. This study addresses these gaps by proposing an integrated ML–fuzzy TOPSIS framework grounded in a real-world industrial case.
4. Materials and Methods
In this study, ML and MCDM methods were used together. The fuzzy TOPSIS method was used to weight the criteria and determine their importance levels. The K-means clustering method, one of the ML methods, was used to select the location of the ESS where energy supply is planned. All computational analyses were conducted using Python 3.10.11. K-means clustering was implemented using the scikit-learn library, while fuzzy TOPSIS calculations were performed using custom-coded scripts based on standard fuzzy arithmetic operations.
4.1. K-Means Clustering Method
K-means is a commonly used algorithm in unsupervised learning. It is an algorithm for dividing a dataset into K predetermined clusters [
61]. The goal of this method is to minimize the sum of the distances of the data points within each cluster to their respective cluster centers [
62]. In other words, it aims to maximize the similarity between observations within the same cluster while maximizing the difference between different clusters.
To mitigate the sensitivity of K-means clustering to initial centroid placement, the algorithm was executed multiple times with different random initializations, and the solution with the lowest within-cluster sum of squares was selected.
The steps to follow in applying the K-means method are as follows:
Step 1: Problem Definition and Notation
The dataset is defined as follows:
Here, n represents the number of data points, and d represents the size of each data point.
Step 2: Objective (Goal) Function
The objective function that the K-means algorithm attempts to minimize is:
Here, Ck represents the k-th set and μk represents the centroid of the k-th set.
Step 3: Determining the Number of Clusters (K)
The value of K is given independently of the problem.
Here, WCSS (Within-Cluster Sum of Squares) represents the value of the objective function.
Step 4: Selecting Starting Centers
Initially, K centers are randomly selected:
Step 5: Assignment Step
Each data point is assigned to the nearest center:
Here, ci(t) specifies the cluster label of xi in the t-th iteration. This step ensures that the objective function is minimized while the centers are fixed.
Step 6: Update Step
For each cluster, the new center is calculated as the arithmetic mean of the points assigned to that cluster.
Here, |Ck| represents the number of data points in the k-th cluster.
Step 7: Convergence Criterion
The algorithm stops when one of the following conditions is met:
or
The algorithm stops when it reaches the maximum number of iterations.
4.2. Fuzzy TOPSIS Method
The fuzzy TOPSIS method was chosen to enable the selection process by weighting and determining the importance levels of the criteria. Fuzzy TOPSIS can be defined as an adaptation of the classical TOPSIS method to decision problems involving uncertainty [
63]. The aim of the method is to determine the alternative that is closest to the positive ideal solution and furthest from the negative ideal solution [
64]. This method was chosen for the current study because it offers a more effective and faster solution in evaluating criteria and ranking alternatives. The application steps for the fuzzy TOPSIS method can be listed as follows:
Step 1: Problem Definition and Notation
Next, the fuzzy criterion value xij and the fuzzy criterion weights wj are calculated.
Step 2: Creating the Fuzzy Decision Matrix
A fuzzy decision matrix is created using the fuzzy criterion values Xij.
Step 3: Normalizing the Fuzzy Decision Matrix
When creating a fuzzy decision matrix, separate calculations are performed for the Benefit Criterion and the Cost Criterion.
For the Benefit Criterion:
Step 4: Weighted Normalized Fuzzy Decision Matrix
Each criterion is expressed with a fuzzy weight.
Multiplication for triangular fuzzy numbers:
Step 5: Determining Fuzzy Positive Ideal Solutions (FPIS) and Negative Ideal Solutions
Fuzzy Positive Ideal Solution (FPIS):
Fuzzy Negative Ideal Solution (FNIS):
Step 6: Distances of Alternatives from FPIS and FNIS
The distance between the peaks of two TFNs is calculated as follows:
Distance from the positive ideal:
Distance from the negative ideal:
Step 7: Calculating the Proximity Coefficient
The dataset is defined as follows:
The alternative with a higher CCi is generally considered better.
Step 8: Ranking the Alternatives
The alternatives are listed in descending order according to their CCi values.
5. The Development of the Energy Resource Supply Decision Model
This study focuses on a project conducted within the scope of Ankara Province in Turkey, at one of the country’s leading companies in its sector. This company wishes to use an ESS in Ankara to meet its energy needs.
In this study, 16 SPP alternative candidates located in Ankara were identified. After determining the locations of these alternatives, the K-means method and the elbow method were used to reduce the number of alternatives and perform clustering. Subsequently, the fuzzy TOPSIS method from the MCDM methods was used for six identified alternative options to determine the best alternative for ESSs.
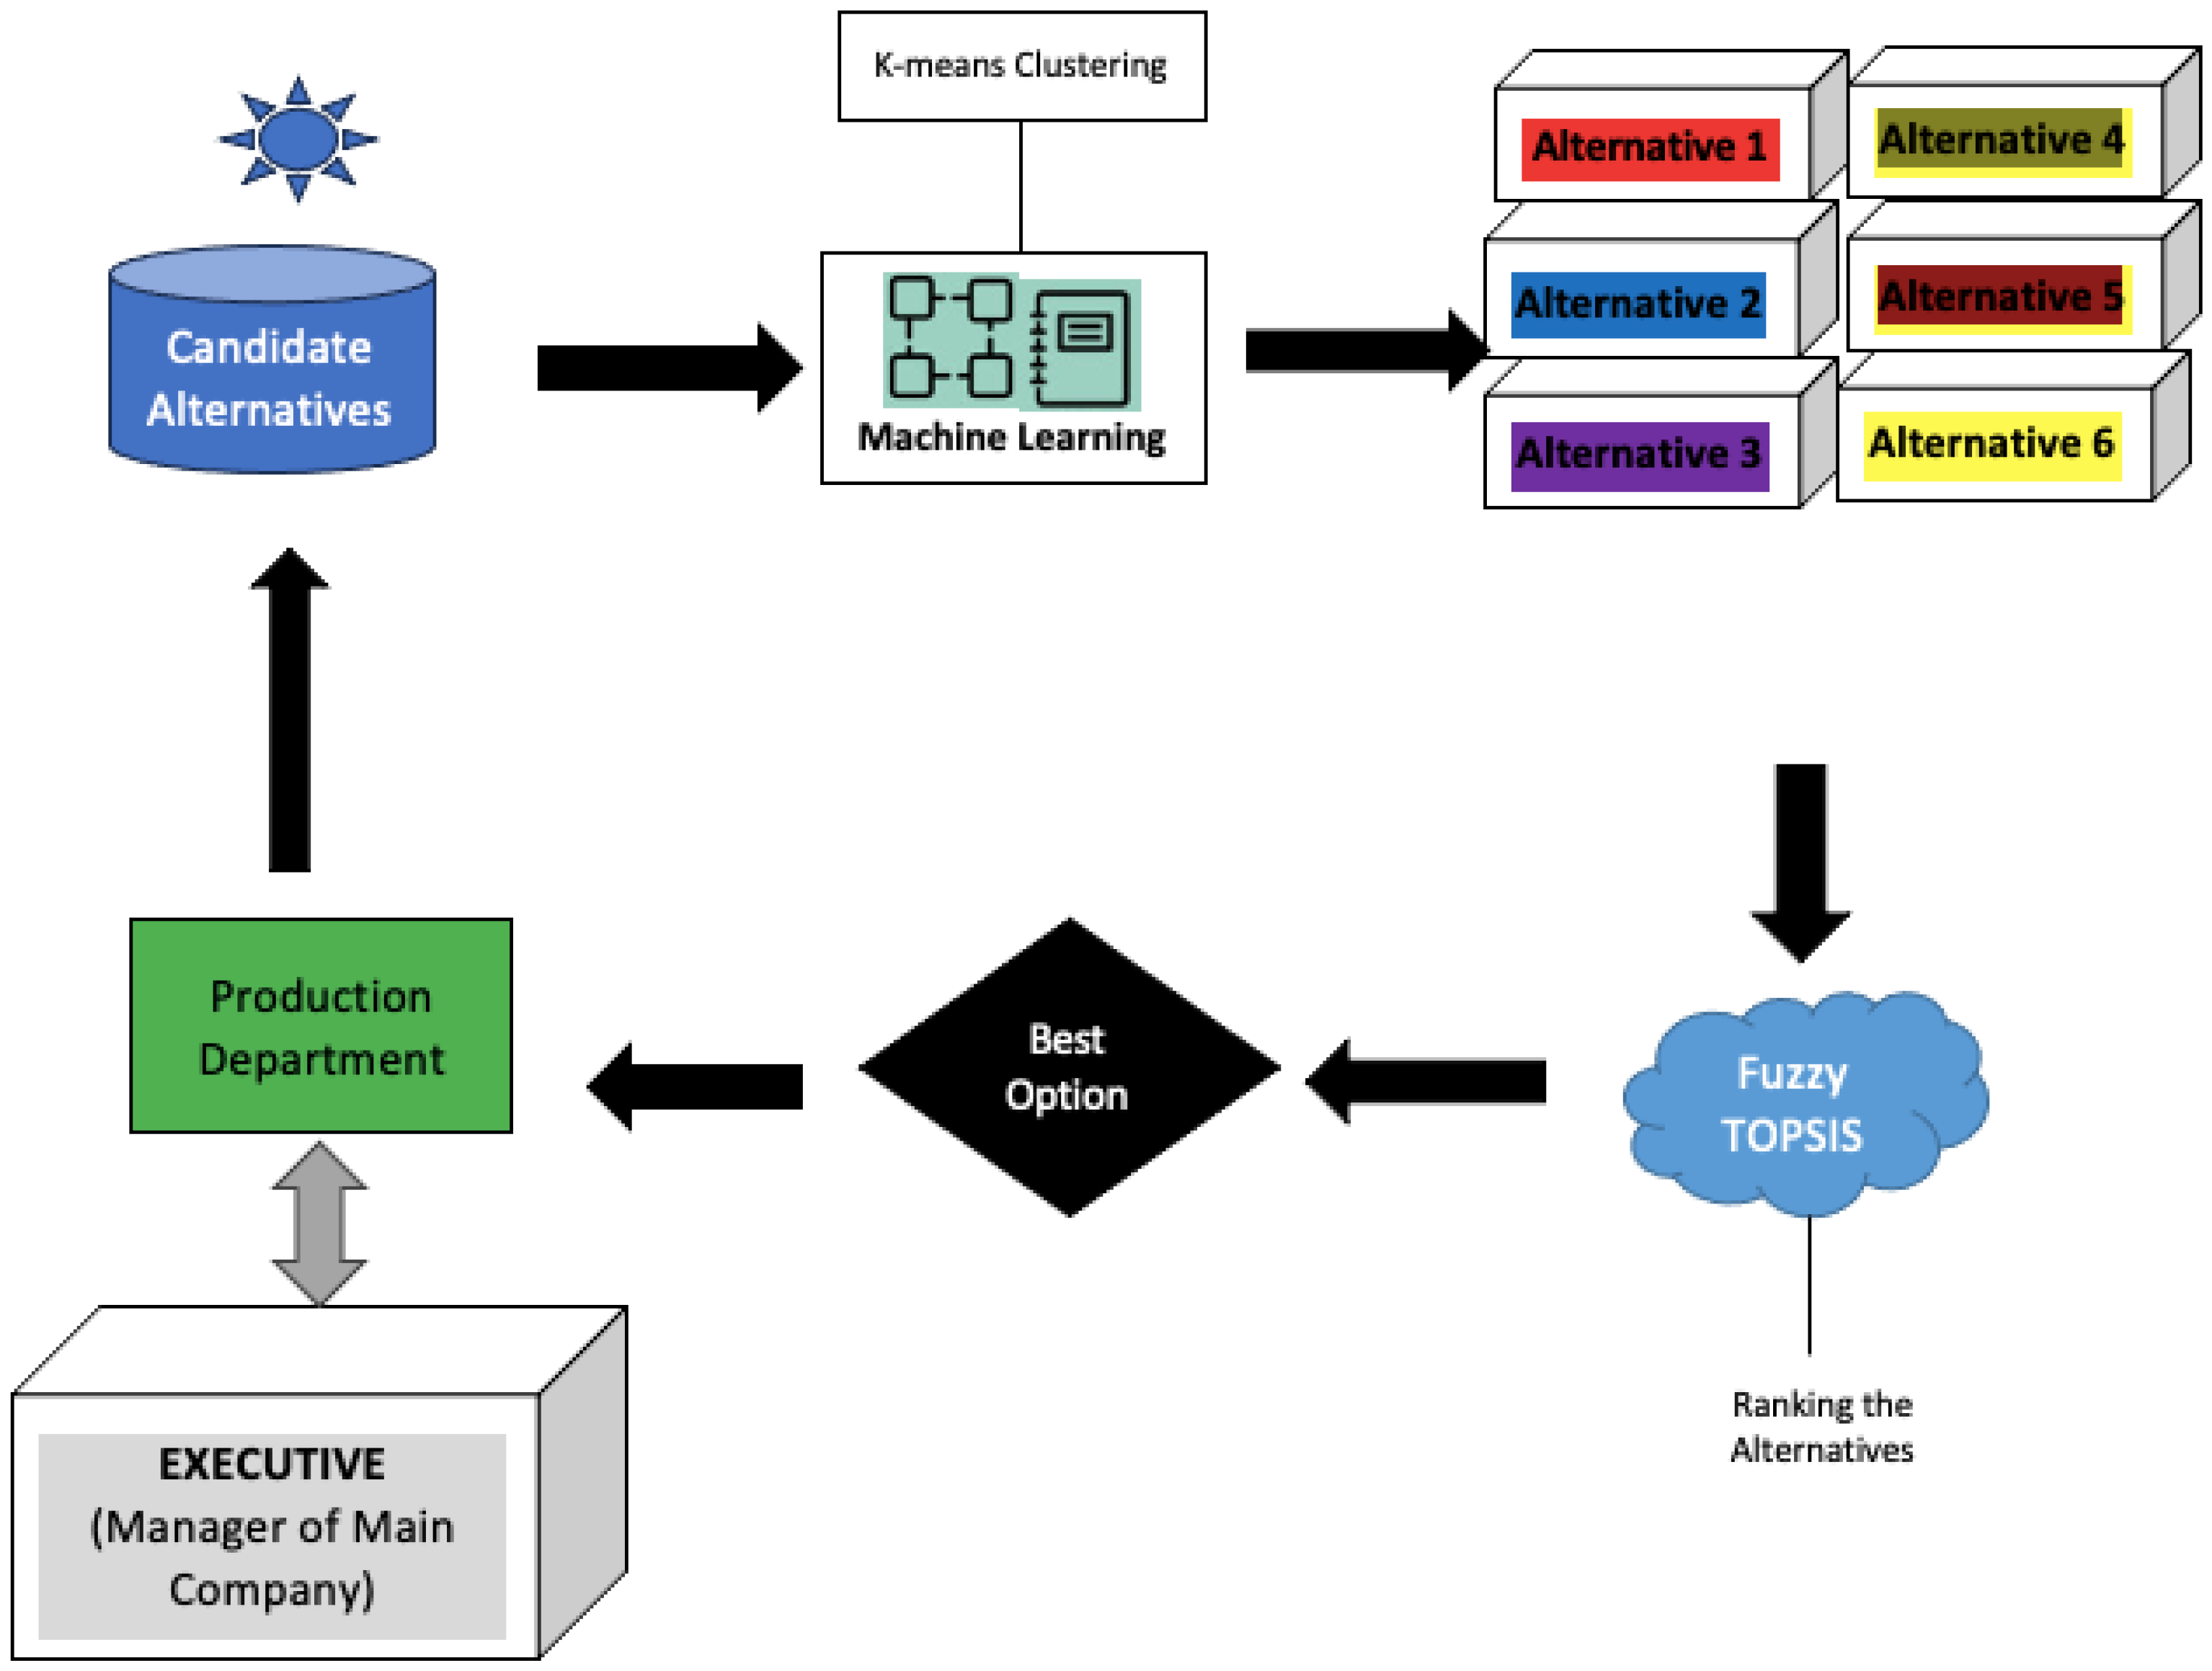
To evaluate the criteria and alternatives in this study and achieve the most suitable energy supply, an architectural structure was created. The structure created is shown in
Figure 4 as an energy source supply model.
5.1. Solar Power Plants (SPPs)
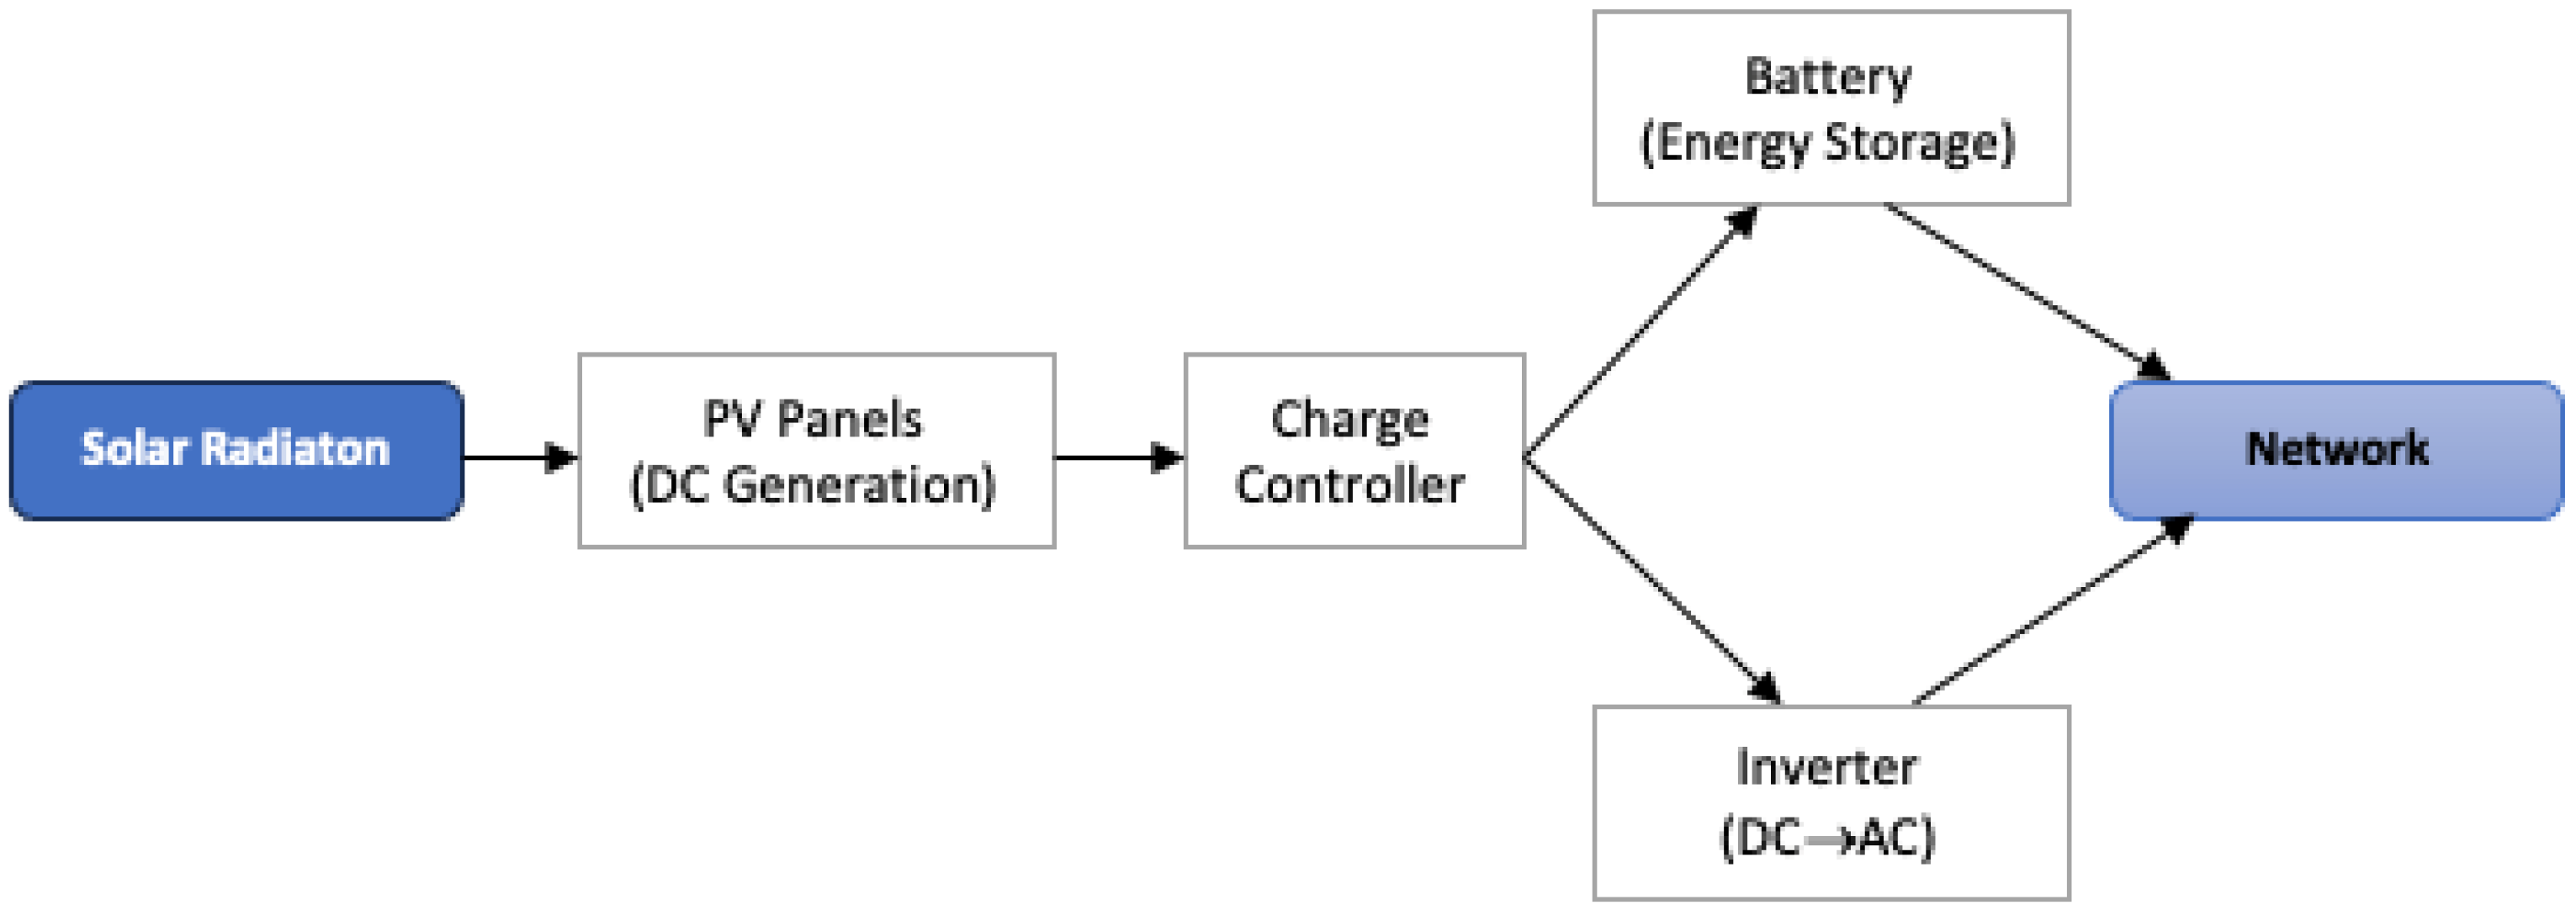
The operating system of an SPP is shown in
Figure 5.
In this system, solar radiation is the primary energy source. Solar radiation is converted into direct current (DC) via photovoltaic panels. The DC produced here regulates the energy, thus preventing the battery from overcharging or discharging. Energy flow is routed between the battery and the inverter via a charge controller. Excess energy produced in the batteries is stored and released back into the system during periods of low production or peak demand. The DC energy from the battery is converted into alternating current (AC) compatible with the grid and loads via the inverter. The energy that enters the grid can be consumed directly. If there is excess energy, it can also be supplied to grid-connected systems.
5.2. Defining the Criteria
In this study, criteria were established for selecting an SPP and ensuring its energy supply, taking into account expert opinions and industry requirements. These criteria are shown in
Table 3.
Criterion C1 represents the average annual global radiation level (kWh/m2-year). A higher value for this is preferred. The C2 criterion refers to the distance to transformer substations. This distance is expected to be short. A shorter distance reduces connection costs. The C3 criterion refers to land cost, expropriation, or rental costs. The C4 criterion refers to the temperature, humidity, and environmental suitability of batteries. In this study, lithium-ion battery technology is assumed as the reference energy storage system due to its high energy density, technological maturity, and widespread adoption in industrial ESS applications. The C5 criterion refers to the regional load profile and peak demand level. The C6 criterion refers to the impact on ecosystems and agricultural areas. The C7 criterion indicates risks such as extreme temperatures, floods, dust, and storms. The C8 criterion refers to zoning status, permit processes, and compliance with regulations. The C9 criterion refers to equipment mobility, road and infrastructure conditions. Finally, the C10 criterion refers to the frequency of regional outages and the balancing capacity of storage.
5.3. Determining the Alternatives Using the K-Means Method
In this study, 16 alternative power plants were identified for the company. The geographical location coordinate data of the selected power plants were determined using Google Maps. These power plants were selected in close proximity to each other to overcome the problems arising from their existing capacities. The coordinates of these alternative SPPs are shown in
Table 4.
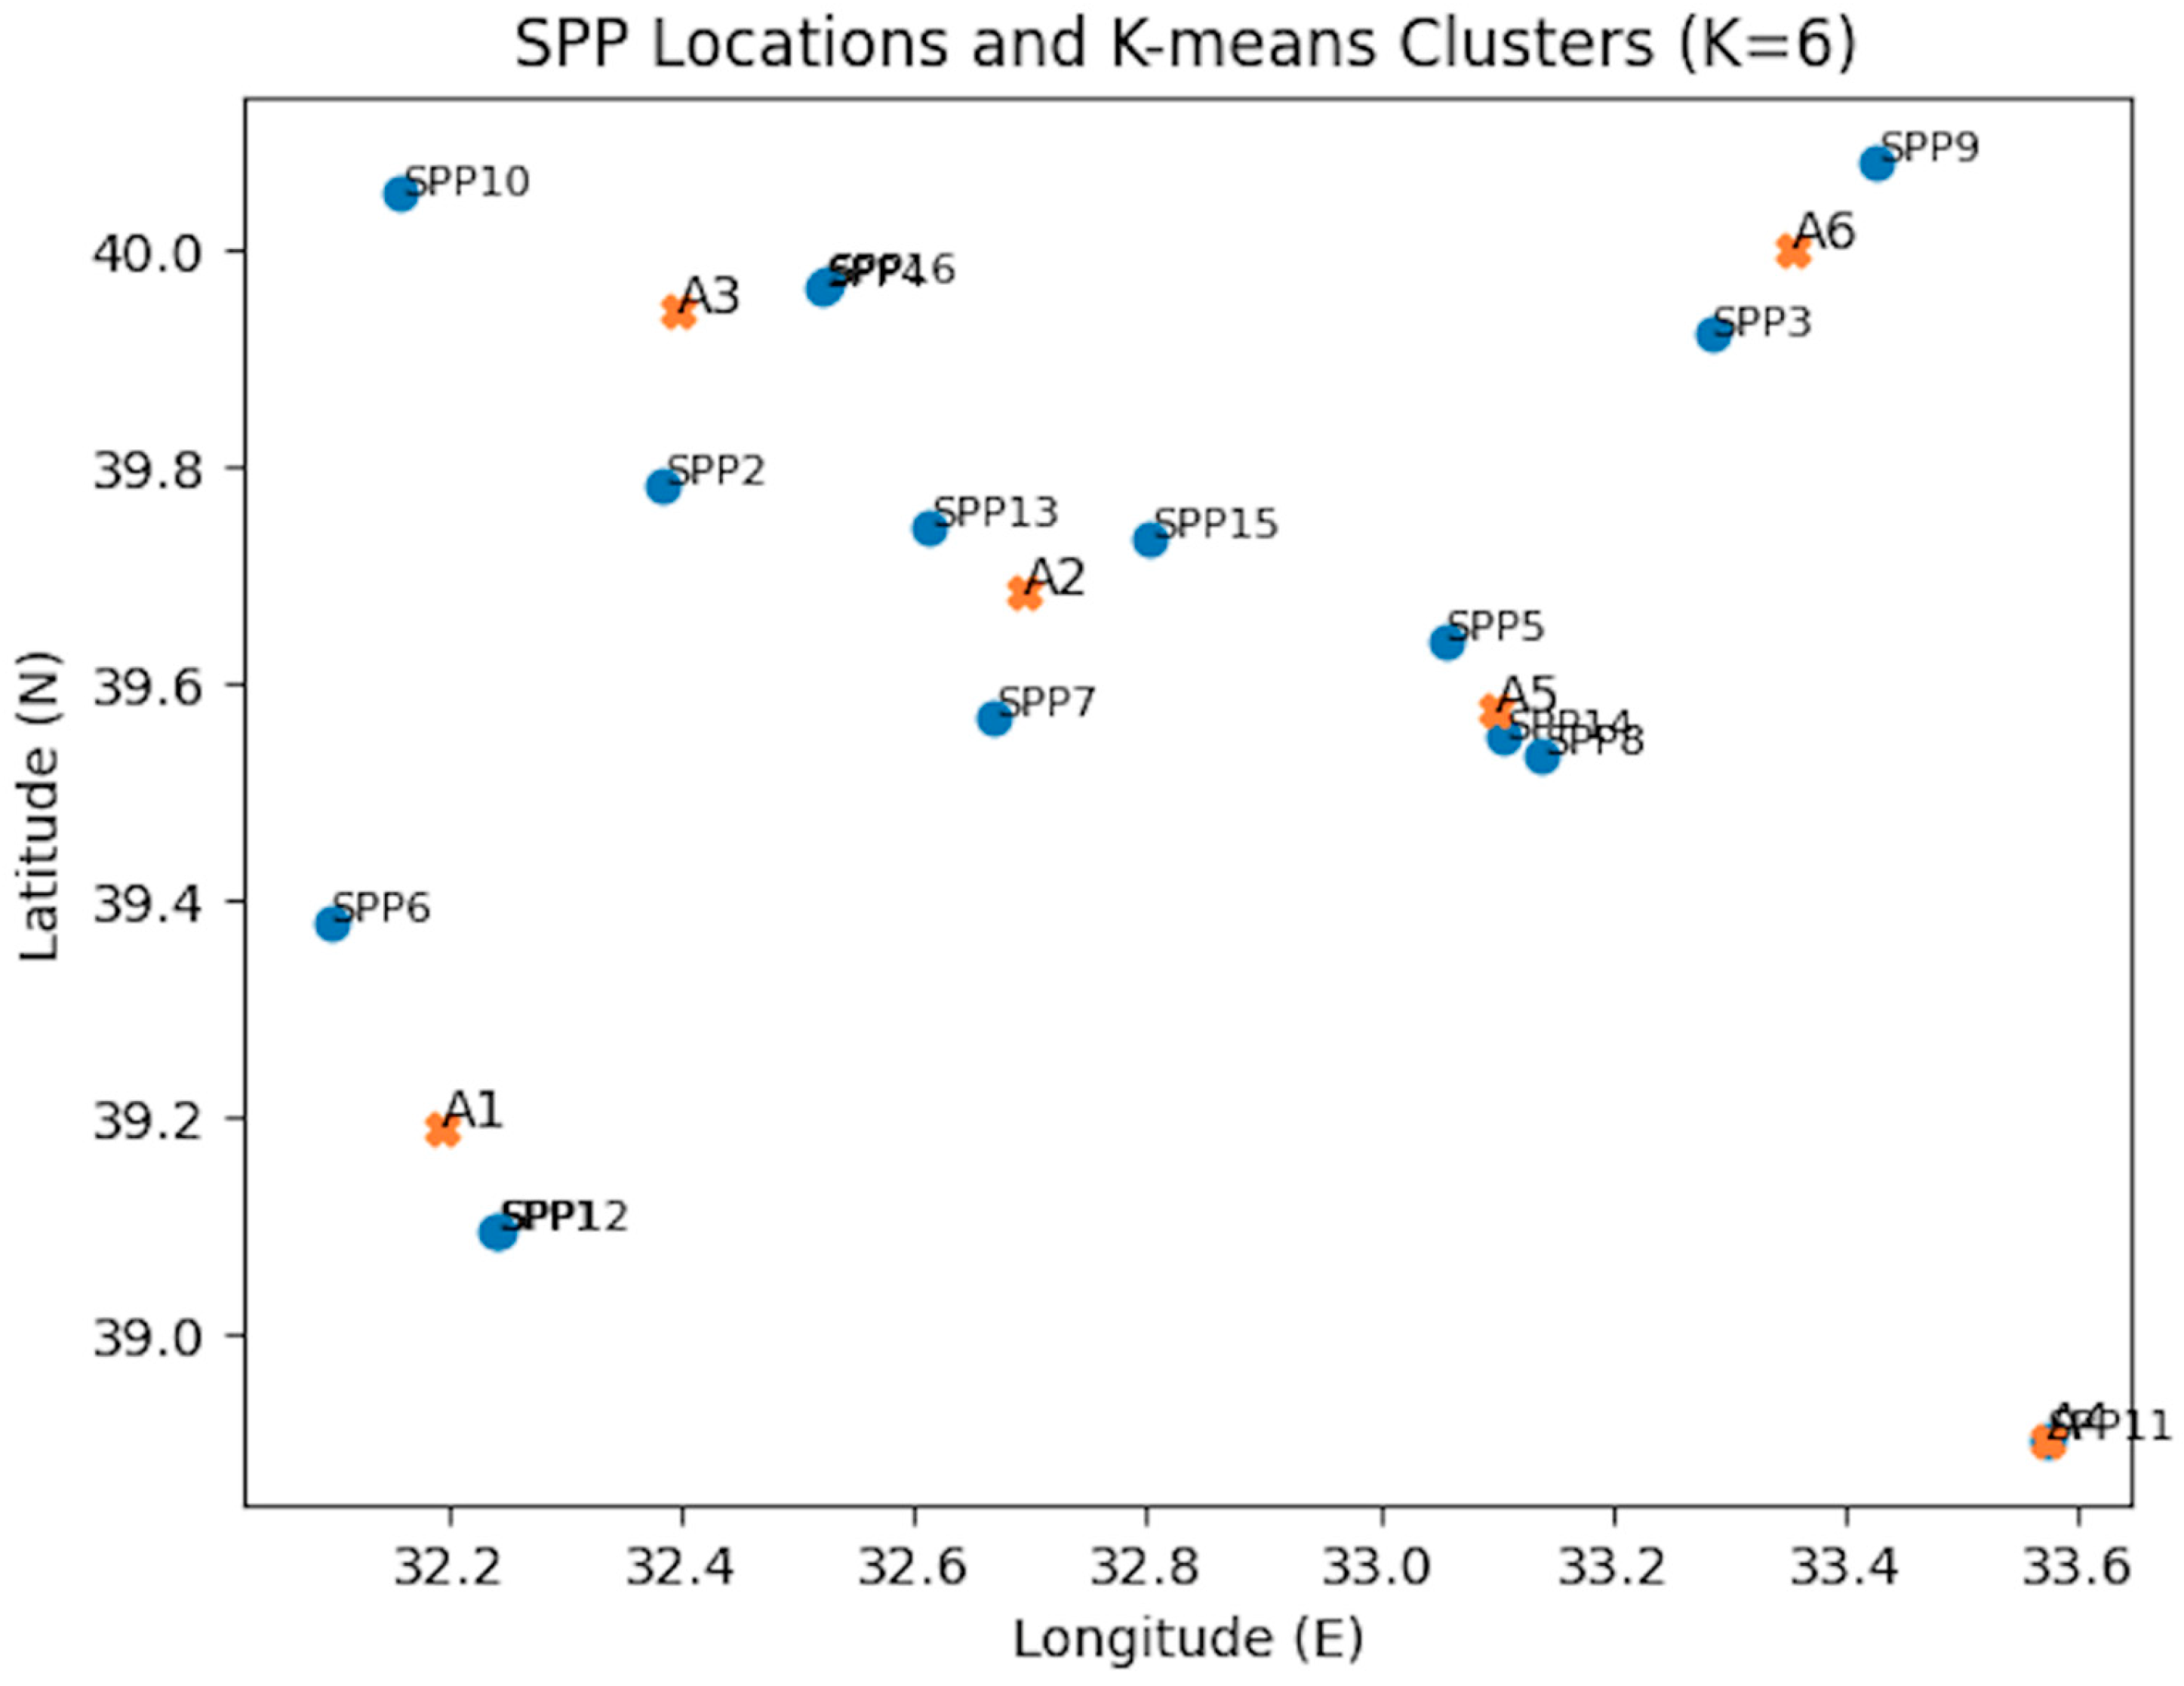
The geographical coordinates of 16 existing solar power plants were analyzed using the K-means clustering algorithm. Based on the elbow method, the optimal number of clusters was determined as K = 6.
Figure 6 illustrates the spatial distribution of the solar power plants along with the resulting clusters and their centroids.
Each cluster centroid represents a location with high spatial concentration of solar power generation and is therefore considered a candidate site for the installation of an energy storage system. This clustering-based pre-screening step effectively reduces the decision space and ensures that the subsequent evaluation focuses on spatially representative alternatives.
The six cluster centroids obtained from the K-means analysis are denoted as alternatives A1 through A6. These alternatives capture the aggregated characteristics of nearby solar power plants and are assumed to be suitable candidates for ESS deployment, particularly in terms of minimizing transmission losses and enhancing local energy balancing.
The transformation of clustering outcomes into decision alternatives forms a critical link between machine learning and multi-criteria decision-making in the proposed framework, as summarized in
Figure 6.
In the elbow method, the sum of the squares of the distances from the cluster center is calculated for the available k values. The inflection point where the difference between these squared sums begins to decrease is determined as the optimal k value based on the graph created from these sums.
The K-means clustering method can determine alternative locations for ESSs if it can cluster among an ideal number of options. To determine the number of alternative locations, the elbow method was used in this stage of the current study.
As a result of applying this method, the point closest to 0 as the inflection point is seen at the point where there are six alternative options.
After determining the number of alternative locations in this study, it is necessary to define the coordinate information for the ESS.
Each cluster centroid obtained from the K-means algorithm represents a spatially representative location that aggregates the characteristics of nearby solar power plants. These centroids are regarded as candidate alternative sites for energy storage systems, particularly in environmentally sensitive areas where installing storage facilities close to generation clusters may minimize transmission losses and land-use conflicts. Thus, the clustering results are transformed into decision alternatives for the subsequent fuzzy TOPSIS-based site selection stage.
The K-means clustering algorithm was used to make this identification. The coordinates of the identified ESS locations are shown in
Table 5.
Based on the clustering results, the next step is to evaluate the suitability of the identified candidate locations. Therefore, fuzzy TOPSIS is employed to rank these alternatives under multiple conflicting criteria.
5.4. Application of Fuzzy TOPSIS Method
In this study, after determining the alternatives using the K-means method, the fuzzy TOPSIS method was used to evaluate these alternatives by weighting them based on the 10 defined criteria. The ranking of the alternatives was also performed using fuzzy TOPSIS.
The expert evaluations were obtained from a panel of five experts, each having more than 10 years of professional experience in energy systems planning, renewable energy integration, and grid operations. To ensure consistency and consensus, the individual assessments were aggregated using a consensus-based approach commonly adopted in fuzzy MCDM studies.
In the fuzzy TOPSIS method, the first step is to define the linguistic variables and triangular fuzzy numbers. These values are shown in
Table 6.
The fuzzy decision matrix, created by evaluating alternatives based on criteria and expert assessment, is shown in
Table 7.
After the fuzzy decision matrix is created, the benefit criteria are divided by the maximum value. The cost criteria are divided by the minimum value. After normalization, all values are in the (0–1) range.
It is necessary to determine the fuzzy values of the criteria and continue with the steps. The fuzzy weights of the criteria are shown in
Table 8.
A weighted normalized fuzzy decision matrix was created using the fuzzy values of the criteria and is shown in
Table 9.
Weighted values were obtained by multiplying the normalized fuzzy decision matrix by the fuzzy weights of the criteria. For cost-related criteria (C
3, C
6, C
7), the normalization process may produce a zero lower bound when an alternative exhibits the minimum cost among all alternatives. This outcome is a direct result of the employed normalization technique and does not indicate data loss or numerical error. In the continuation of this study, the distances to the FPIS (1, 1, 1) and FNIS (0, 0, 0) values were found using these values. The total distances calculated are shown in
Table 10.
The calculated distance values were used to determine the proximity coefficient (CC
i) values, and the alternatives were ranked according to the calculated proximity coefficient values. The proximity values and final ranking are shown in
Table 11.
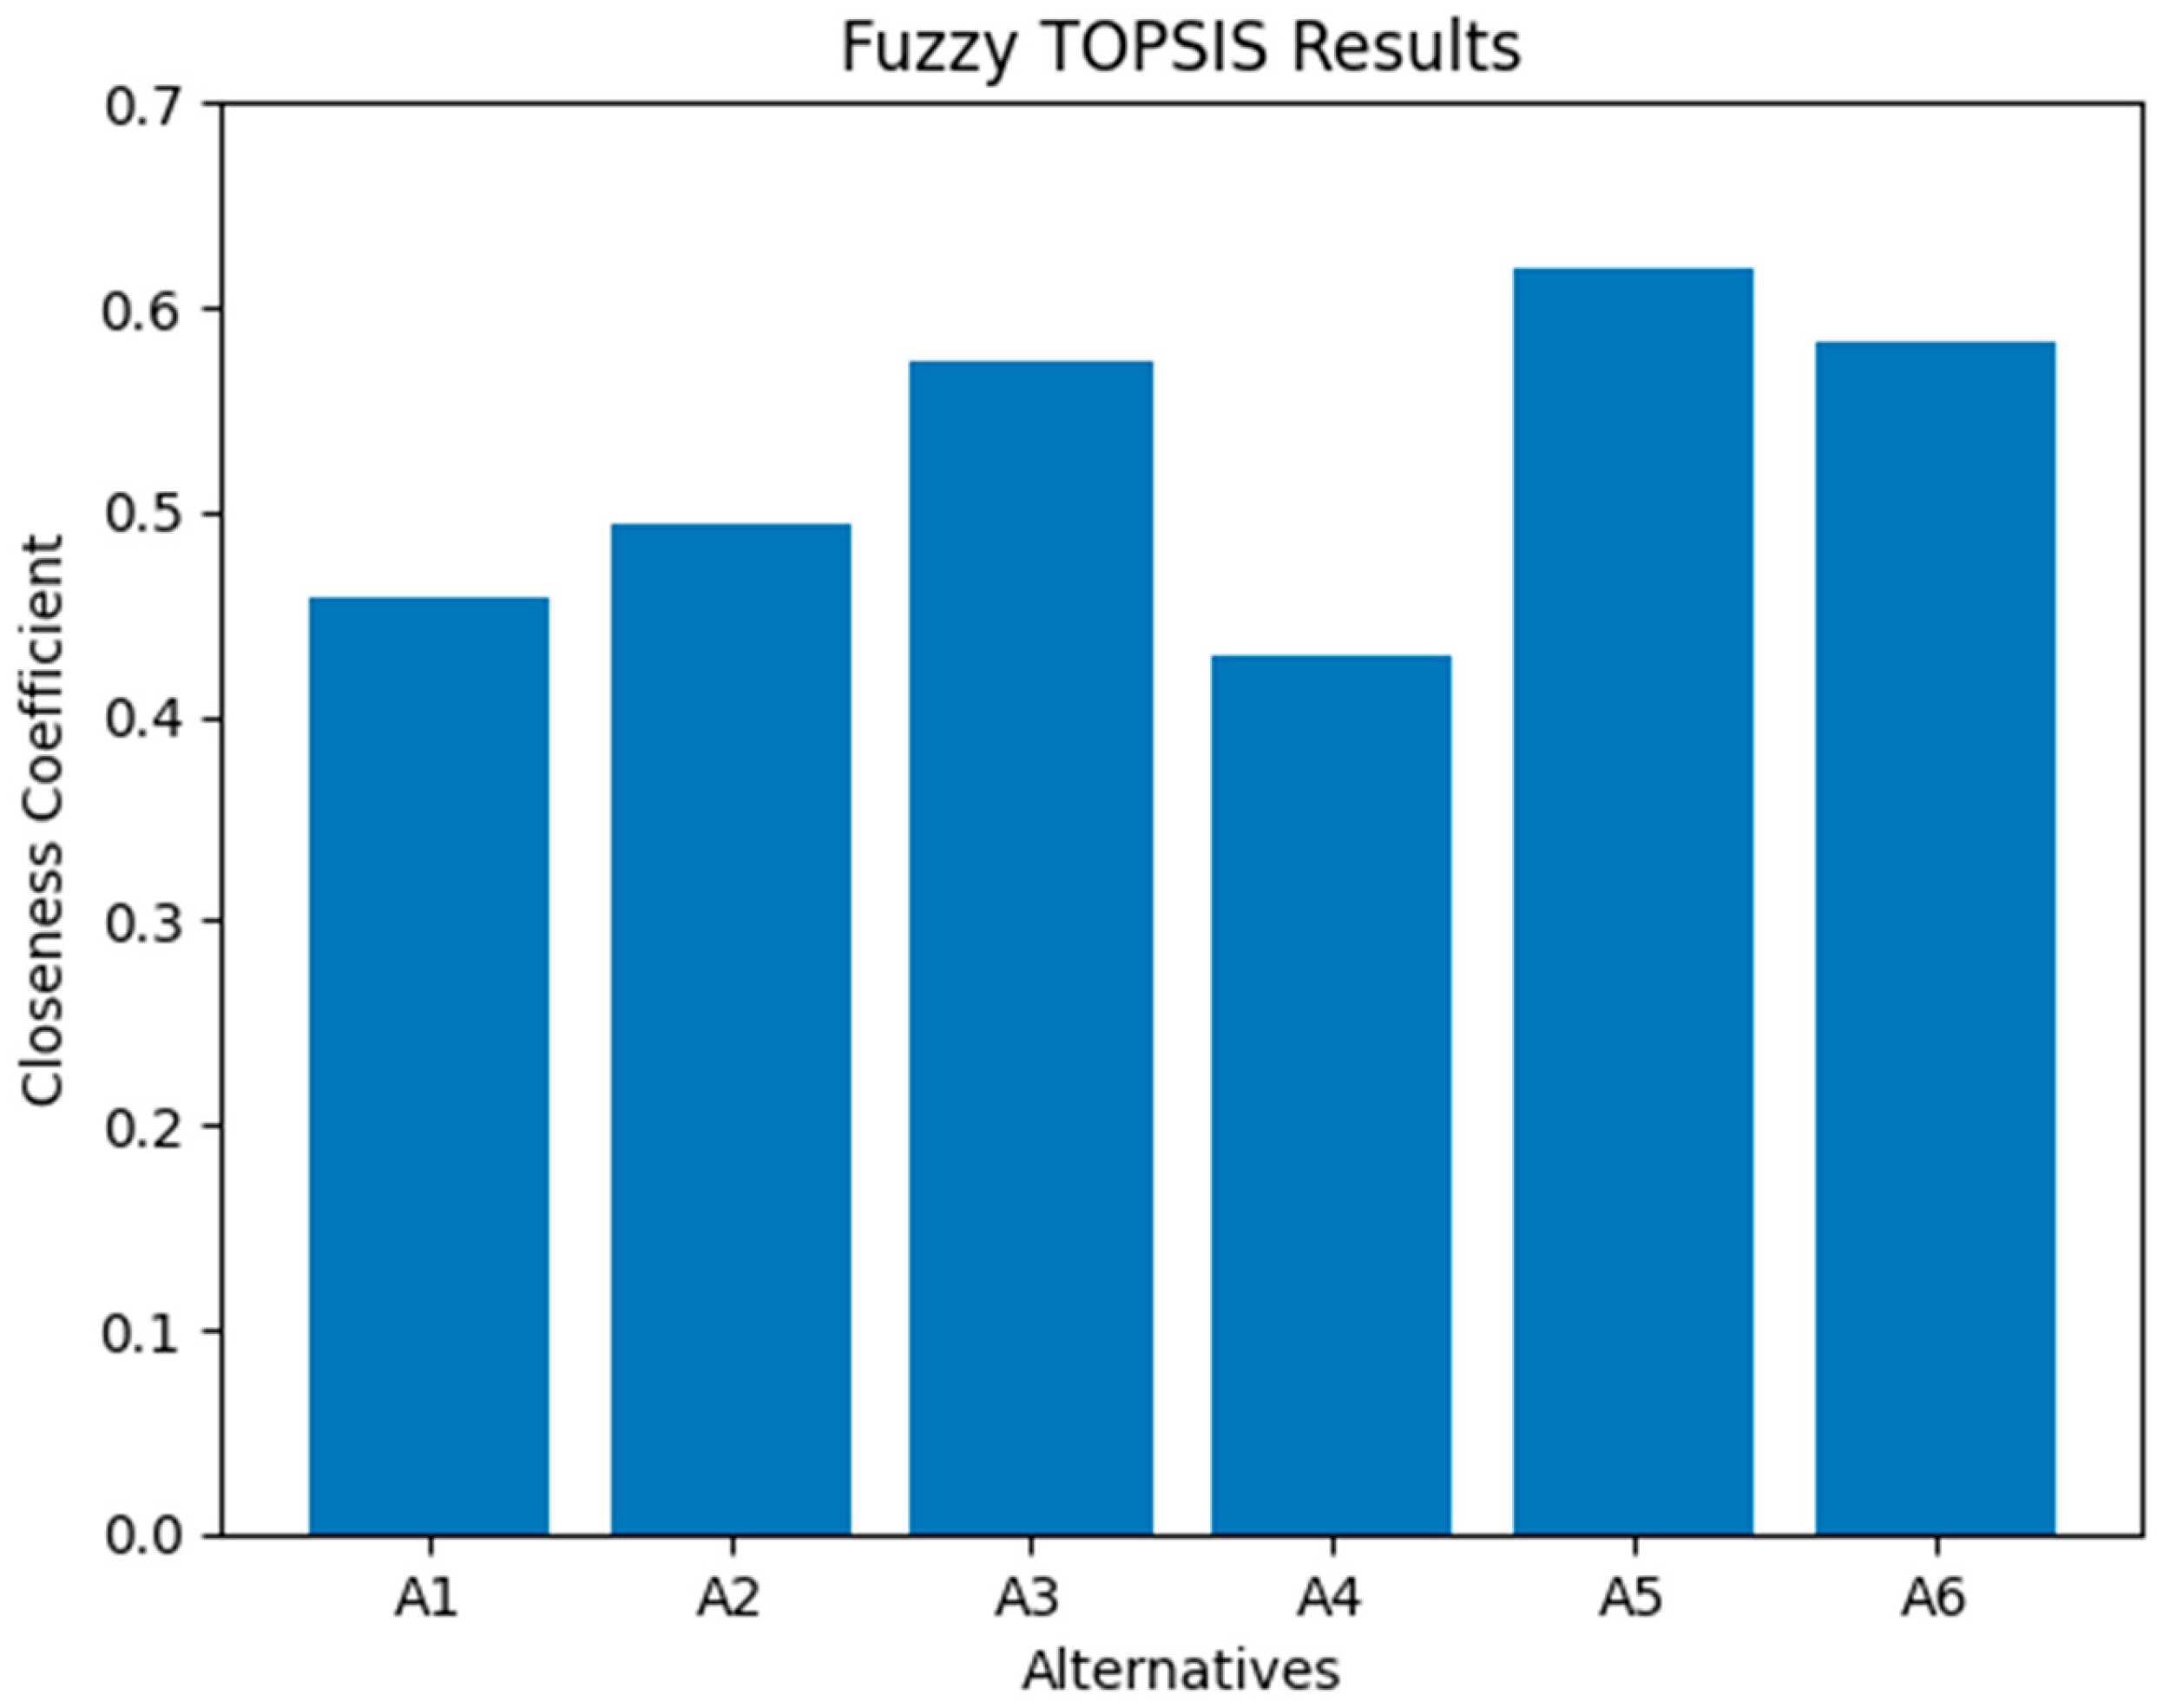
The ranking results demonstrate that superior performance in a single criterion is insufficient to guarantee optimality. Instead, alternatives achieving a balanced performance across multiple conflicting criteria tend to rank higher. In particular, the superior ranking of A
5 can be attributed to its strong performance in solar potential, grid proximity, suitability for storage technology, and contribution to supply security, combined with relatively low environmental and climatic risks.
Figure 7 shows the results of the Fuzzy TOPSIS.
Overall, the results confirm the effectiveness of the proposed ML–fuzzy TOPSIS framework in supporting complex ESS site selection decisions and highlight the importance of integrating spatial analysis with uncertainty-aware multi-criteria evaluation.
6. Discussion
The integrated decision-making framework proposed in this study differs from many approaches in the literature because it simultaneously addresses both spatial and multidimensional evaluation requirements in the site selection process of solar energy storage systems. Specifically, identifying alternatives using the K-means clustering method ensured that the decision-making process was based on a data-driven pre-selection phase rather than subjective constraints. This situation, along with reducing the number of alternatives to a reasonable level, has increased the computational efficiency of the fuzzy TOPSIS application.
An analysis of the fuzzy TOPSIS results reveals that while some alternatives perform well in specific criteria, they lag behind in the overall ranking. This situation reveals that not a single dominant criterion, but rather the balance and weighting of criteria, is decisive in site selection decisions. In particular, the combined assessment of criteria such as supply security, grid integration, and environmental impacts demonstrates that purely economic approaches may be limiting.
Unlike crisp TOPSIS, fuzzy TOPSIS allows for the incorporation of vagueness and uncertainty inherent in expert judgments, especially when evaluating qualitative criteria such as environmental impact, regulatory feasibility, and supply security. This is particularly important for energy storage system siting, where precise numerical data are often unavailable or highly uncertain. Thus, fuzzy TOPSIS provides a more realistic and flexible decision-making environment compared to its crisp counterpart.
The findings support the idea that considering uncertainty in energy storage investments improves decision quality. Evaluations using fuzzy numbers instead of precise values allowed for a more realistic reflection of differences in expert opinions in the model. However, the fact that criterion weightings are based on expert judgments can lead to a certain degree of subjectivity in the results. This highlights the importance of using data-driven or ML-based weighting approaches in future studies.
Overall, the methodological framework developed within the scope of this study offers a powerful analytical tool for strategic decision-making processes regarding energy planning, storage systems, and renewable energy investments. The discussion results demonstrate that the proposed approach is adaptable to different regions, different energy technologies, and alternative sets of criteria.