Article

Enterprise Digitalization and ESG Performance: Evidence from Interpretable AI Large Language Models

1
School of Public Administration and Policy, Renmin University of China, Beijing 100872, China
2
School of Government, Sun Yat-sen University, Guangzhou 510275, China
3
Center for Chinese Public Administration Research, School of Government, Sun Yat-Sen University, Guangzhou 510275, China
*
Author to whom correspondence should be addressed.
Systems 2025, 13(9), 832; https://doi.org/10.3390/systems13090832
Submission received: 23 August 2025 / Revised: 14 September 2025 / Accepted: 17 September 2025 / Published: 22 September 2025

Abstract

In recent years, enterprise digitalization has garnered significant attention in business practices, yet its impact on environmental, social, and governance (ESG) performance remains underexplored. This study focuses on two core questions: (1) How can enterprise digitalization be measured more effectively? (2) How does digitalization affect the three dimensions of ESG, and through what mechanisms? Based on annual reports of A-share-listed companies in Shanghai and Shenzhen from 2013 to 2022, we construct an innovative measurement of digitalization using an interpretable AI large language model. Panel regression and mechanism analysis reveal that digitalization significantly enhances ESG performance, primarily through three mechanisms: improving energy efficiency, increasing social concern, and strengthening internal controls. Heterogeneity analysis shows that this effect is more pronounced among large and state-owned enterprises. This study proposes a replicable and transferable approach to measuring digitalization, offering empirical evidence and practical insights for firms and policymakers.

1. Introduction

The global shift toward sustainable growth has underscored the critical role of environmental, social, and governance (ESG) performance, making it an essential measure for firms aligning corporate strategy with long-term economic, social, and environmental well-being [1]. In this context, ESG captures a multi-dimensional assessment of enterprise performance across environmental stewardship, social responsibility, and internal governance [2]. In China, sustainable development has emerged as a central policy priority, demonstrated by evolving regulatory frameworks such as the Shanghai Stock Exchange’s ESG disclosure requirements and the State-owned Assets Supervision and Administration Commission’s (SASAC) call for State-Owned Enterprises (SOEs) to adopt higher ESG standards.
Scholarly investigations into the determinants of enterprise ESG performance have been diverse, examining influences from national contexts [3,4,5] to policy and regulatory frameworks [6], industry attributes [7,8,9], organizational characteristics [10,11], and governance structures [12,13]. Concurrently, the digital economy’s expansion has established digitalization as a pivotal catalyst for enterprise development, furnishing new resources and capabilities that not only transform but also disrupt traditional business models [14], significantly bolstering operational efficiency, innovation, competitiveness, and profitability [15,16], with profound implications for ESG dimensions.
Although prior research has increasingly examined the relationship between digital transformation and ESG performance—such as those by Martínez et al., 2023 [17]; Zhong et al. (2023) [18]; Wu and Li (2023) [19]; and Liu and Jung (2024) [20]—most studies focus on digitalization’s role in improving resource efficiency, enhancing R&D investment, or increasing transparency to achieve sustainability goals. While these studies offer valuable insights into the overall digitalization–ESG link, they remain fragmented and theoretically limited. Notably, Fang et al. (2023) [21] and Yang et al. (2024) [22] attempt to examine the heterogeneous impacts of digital transformation across the three ESG dimensions. However, these studies still lack sufficient explanatory depth.
Taken together, two major limitations persist in the current literature. First, existing research provides insufficient analysis of the internal mechanisms through which digitalization affects ESG, especially across its three dimensions. Second, most studies measure digital transformation using keyword frequency or basic machine learning models, which fall short in capturing semantic depth and contextual logic in corporate disclosures. As a result, the accuracy and validity of the digitalization indices—and the empirical findings based upon them—are subject to skepticism.
To address these gaps, this study proposes two key innovations. First, we employ a large language model (LLM)-based interpretable AI framework to construct a semantically enriched digitalization indicator, thereby improving measurement validity. Second, we conduct a mechanism-based analysis across the three ESG dimensions and identify more direct and interpretable mediating pathways. This enables us to reveal how digital transformation interacts with multi-level governance structures and evolving stakeholder expectations, thereby offering enhanced theoretical depth and practical implications.
This study contributes the following:
First, in terms of theoretical analysis, this study integrates stakeholder theory, institutional theory, information asymmetry theory, and principal-agent theory to explain how enterprise digitalization influences ESG performance via energy efficiency, social concerns, and internal control. Unlike prior research that focuses on macro contexts or lacks mechanism analysis, this study adopts a micro-level lens to build a coherent, cross-theoretical framework that reveals the pathways through which digitalization drives sustainable development. This approach also offers new possibilities for extending the application of these classical theories within the emerging field of ESG research.
Second, in terms of research perspective, this study refines the internal mechanisms through which digitalization affects ESG performance by analyzing its impact across the environmental (E), social (S), and governance (G) dimensions, thereby enhancing the specificity and explanatory power of the analysis.
Third, at the methodological level, this study employs an interpretable large language model (LLM)–based text analysis approach to improve the measurement of the key variable “enterprise digitalization.” Compared to traditional word frequency statistics or opaque black-box models, this method enhances semantic precision and interpretability while maintaining academic rigor and transparency. It offers a replicable analytical paradigm for large-scale semantic data and lays a solid methodological foundation for future research on digital governance.
The article is organized as follows: Section 2 reviews the literature and develops the research hypotheses. Section 3 outlines the innovative identification of enterprise digitalization using an interpretable AI large language model. Section 4 details the research design, including data, variables, and empirical models. Section 5 presents the empirical findings, including baseline results, robustness checks, heterogeneity analysis, and mechanism analysis. Section 6 concludes with the main research findings, theoretical implications, and policy recommendations.

2. Literature Review and Hypothesis Development

2.1. ESG: Dimensions, Significance, and the Impact of Enterprise Digitalization

ESG has become a core measure of a firm’s long-term economic, social, and environmental performance [1]. It includes three interrelated dimensions: environmental performance, focusing on reducing ecological impacts and optimizing resources; social performance, addressing responsibilities toward employees, customers, and communities; and governance performance, reflecting internal controls, accountability, and transparency [2,23]. As a comprehensive framework, ESG guides firms to balance economic growth, environmental stewardship, and social equity, making it a priority for stakeholders and policymakers [24]. Studies show that strong ESG performance improves risk management, strengthens corporate reputation, and facilitates access to financing, supporting more resilient and sustainable growth in a competitive and uncertain environment [23].
Grounded in stakeholder theory, enterprise digital transformation enhances interactions with key stakeholders—such as employees, consumers, communities, and regulatory authorities—thereby promoting the internalization and institutionalization of corporate social responsibility (CSR) practices [22]. Specifically, digital technologies improve transparency and responsiveness, strengthening information flows between firms and their external environments. This facilitates the fulfillment of stakeholders’ expectations regarding environmental protection and social equity, thus enhancing corporate legitimacy, trust, and reputation in dynamic institutional settings [25]. For instance, real-time data platforms and intelligent sensing systems enable firms to more accurately identify and respond to stakeholder concerns, thereby advancing the implementation of ESG practices [26].
From the perspective of the resource-based view (RBV), a firm’s digital capabilities constitute a valuable and hard-to-replicate strategic resource. First, digitalization improves resource allocation efficiency and enhances R&D productivity, fostering green innovation and the development of environmentally friendly products and technologies [27]. Second, digital transformation facilitates structural and governance innovation within organizations, strengthening internal controls and regulatory responsiveness. This enhances organizational resilience and governance performance amid institutional transitions [22]. Third, the expansion of digital infrastructure at the regional level reduces institutional transaction costs and promotes ESG performance across firms embedded in digital ecosystems [28].
However, some studies also highlight the limitations of digitalization. The marginal effect of digital input may diminish beyond a certain threshold, creating a U-shaped relationship between digitalization and environmental performance [29]. Excessive digitalization may also result in increased energy consumption, greenwashing, or inefficiencies if not guided by robust institutional frameworks [21].
While several studies highlight the potential drawbacks of digitalization, these negative outcomes tend to occur in the absence of appropriate institutional safeguards or when digitalization is misaligned with strategic sustainability goals. Nevertheless, in well-governed enterprises and mature digital ecosystems, digitalization is more likely to reinforce ESG performance through better resource management, stronger internal control, and enhanced stakeholder engagement. Building on this reasoning, we propose the following hypothesis:
H1. 
Enterprise digitalization effectively improves enterprise ESG performance.
However, most existing studies have examined digitalization and ESG at an aggregate level, with limited focus on how digitalization affects the individual ESG dimensions. As a result, the specific mechanisms and pathways through which digitalization influences environmental, social, and governance performance remain largely unclear. To address this gap, this study develops a more fine-grained research design and measurement framework to unpack this “black box” and reveal how digitalization affects each ESG dimension and its underlying dynamics. The following sections analyze the impacts and pathways of digitalization across the three ESG dimensions, thereby clarifying the mediating mechanisms and identifying potential mediating variables behind the observed relationships.

2.2. Mediating Mechanisms Between Enterprise Digitalization and ESG Dimensions

2.2.1. ESG Dimension 1: Environmental Performance

Environmental performance focuses on a firm’s ability to reduce its ecological footprint, optimize resource utilization, and mitigate waste generation, making it a critical dimension of ESG and a core measure of corporate sustainability [23]. In an era where climate action and resource constraints have become pressing global priorities, environmental performance has emerged as a central area for understanding the role of digitalization in advancing sustainable practices [1].
Research has increasingly examined the ways digitalization reshapes corporate environmental outcomes. Under the resource-based view (RBV), digital transformation enables firms to develop unique internal capabilities—such as intelligent equipment and advanced data analytics—that drive sustainability and enhance environmental performance [15,30]. At the operational level, firms deploy smart, energy-efficient machines and connected products that upgrade production equipment and optimize resource allocation, thereby reducing energy consumption [31]. At the process level, digital technologies, including artificial intelligence, big data, and the Internet of Things (IoT)—allow real-time tracking of energy usage, enabling firms to identify hotspots and implement targeted improvements [32,33]. These tools support predictive analytics and data mining that further streamline production and minimize waste, thus aligning operations with sustainable goals [34,35].
Collectively, these technologies enhance energy utilization efficiency (EUE), which refers to a firm’s ability to achieve higher output or service quality with lower energy input, particularly through intelligent systems and real-time monitoring [36]. As a core mediating mechanism, EUE reflects whether firms can effectively convert digital investments into tangible environmental improvements. High EUE not only contributes directly to emission reduction but also demonstrates a firm’s digital maturity in aligning technology with sustainability objectives.
From the lens of institutional theory, digitalization also reflects how firms respond to escalating external environmental pressures and normative expectations. Digital investments serve as strategic tools to signal regulatory compliance and build stakeholder trust, positioning energy efficiency as a vehicle for organizational legitimacy [37].
However, digitalization is not without environmental drawbacks. Digital infrastructure, including data centers, cloud computing, and IoT systems—entails substantial electricity usage and cooling demands, potentially resulting in increased carbon emissions. This “rebound effect” underscores the dual nature of digitalization: while it can promote green development, it may also exacerbate environmental burdens in the absence of institutional safeguards [38,39].
To reconcile these opposing effects, this study highlights energy utilization efficiency as the key explanatory mechanism. The extent to which firms can enhance EUE determines whether digitalization delivers net environmental gains or unintended consequences. This leads to the following hypothesis:
H2. 
Enterprise digitalization enhances enterprise ESG performance by increasing energy utilization efficiency, thereby improving environmental performance.

2.2.2. ESG Dimension 2: Social Responsibility Performance

Social responsibility performance reflects a firm’s capacity to fulfill its obligations toward employees, customers, communities, and other stakeholders, making it a pivotal measure of its ESG outcomes [23]. Against a backdrop of increasing stakeholder pressure and rising demands for transparency, digital transformation has emerged as a critical lever for enhancing corporate social responsibility and aligning firm behavior with societal expectations [15,37].
From the perspective of information asymmetry theory, digitalization improves the accuracy and timeliness of corporate disclosures, thereby enhancing transparency in operations, production, and governance, and narrowing the information gap between firms and stakeholders [40]. As a result, companies become more exposed to institutional oversight from both formal mechanisms (e.g., legal and regulatory systems) and informal mechanisms (e.g., media scrutiny, public discourse, and social networks) [41]. When firm behavior deviates from normative expectations, digital platforms rapidly amplify public visibility and accountability through viral media reports, NGO activism, and online criticism—triggering a mechanism we refer to as “social concern”, which may escalate into reputational damage, consumer boycotts, investor divestment, or regulatory investigations [42,43].
While digital technologies thus provide new tools for corporate accountability, they may also produce unintended social consequences. Scholars have raised concerns about the erosion of labor rights [44], job displacement due to automation [45], privacy threats [46], algorithmic bias in recruitment and evaluation [47], increased inequality and digital divides [48], persistent skill gaps [49], and mental health deterioration due to digital stressors [50].
In response to rising social concern, however, firms tend to adjust their strategies to maintain legitimacy and preserve long-term value, often by improving their social responsibility practices—such as ensuring labor rights, protecting consumer interests, enhancing product safety, and promoting social equity [51]. This process aligns with the core logic of stakeholder theory, which posits that firms must address the demands of multiple stakeholders to sustain legitimacy and ensure survival [52,53]. At the same time, information asymmetry theory suggests that as disclosure mechanisms improve, it becomes increasingly difficult for firms to conceal non-compliant behavior, thereby incentivizing more socially responsible strategies under public concern [40].
Therefore, we propose that “social concern” acts as a key mediating mechanism through which digitalization improves social responsibility, thereby contributing to overall ESG outcomes. Hence, we propose the following hypothesis:
H3. 
Enterprise digitalization boosts enterprise ESG performance by increasing social concern, thereby enhancing their social responsibility performance.

2.2.3. ESG Dimension 3: Enterprise Governance Performance

Governance performance reflects a firm’s ability to establish robust internal controls, ensure accountability, and enhance transparency within its operational and managerial systems, making it a core dimension of ESG performance. As global institutional contexts and market structures evolve, governance quality has attracted growing attention from stakeholders as a key indicator of ethical, resilient, and sustainable corporate behavior [54]. Against this backdrop, digital transformation is increasingly viewed as a critical force for reshaping corporate governance by enabling more data-driven, structured, and responsive managerial approaches that align internal controls with external oversight [55,56].
Drawing on information asymmetry theory, digital tools help narrow the information gaps across organizational hierarchies and departments. Technologies such as AI, big data analytics, and predictive modeling enable firms to identify weaknesses in internal controls, detect non-compliance, and flag risks in real time [57,58]. Digitalization enhances inter-departmental coordination and knowledge integration, helping organizations build more resilient, adaptive governance structures to respond to risks and external shocks [55,59].
From a principal-agent theory perspective, digitalization enhances monitoring mechanisms by making the actions of agents (e.g., managers) more observable and verifiable by principals (e.g., shareholders, regulators), thus reducing conflicts of interest and improving internal control effectiveness [54]. Hence, digital transformation promotes governance performance through dual pathways: by enhancing internal control quality and by intensifying external social scrutiny.
At the same time, digitalization enhances external governance by improving information transparency. With better disclosure technologies, stakeholders—including the media, NGOs, regulators, and the public—can access real-time and verifiable data about corporate practices [60,61], thereby reducing information asymmetries and intensifying external scrutiny [62]. Under such visibility, firms are incentivized to adjust their governance behavior to align with institutional and societal expectations, not only to comply but also to preserve reputation and legitimacy [63]. This highlights the role of social concern as a complementary pathway through which digitalization reinforces governance performance.
However, the rise of algorithmic decision-making in corporate governance also raises new governance risks. Automated systems, while improving efficiency and scalability, may suffer from a lack of stakeholder participation, unclear accountability structures, and insufficient ethical oversight—particularly when decisions are made based on opaque machine learning models. These challenges have led to growing concerns about governance opacity, responsibility fragmentation, and ethical blind spots in algorithmic systems [64,65,66]. These concerns underline the dual nature of digitalization: it can strengthen governance structures but also introduce new vulnerabilities if not properly managed.
In summary, enterprise digitalization improves governance performance by enhancing both internal controls and social concern, thereby promoting overall ESG performance. Based on this reasoning, we propose the following hypothesis:
H4. 
Enterprise digitalization enhances governance performance by improving internal control quality and increasing social concern, thereby promoting overall ESG performance.
After systematically analyzing how enterprise digitalization influences corporate performance in the three ESG dimensions—environmental (E), social (S), and governance (G)—through the mediating mechanisms of energy utilization efficiency, social concerns, and internal controls, this study further constructs a logically coherent mediation framework (Figure 1).

2.3. Research on Identifying Enterprise Digitalization

Most of the previous research on enterprise digitalization has developed indices by examining the frequency of words regarding digitalization in listed companies’ annual reports [61,62,63]. While some scholars have recognized the limitations of word frequency analysis, their enhancements have merely extended the lexicon used to describe enterprise digitization. Fundamental flaws in word frequency analysis remain unaddressed. This method overlooks semantic connections within the text and contextual links between texts. Consequently, it fails to accurately capture the deeper semantic information within the texts, casting doubt on the scientific validity of conclusions about enterprise digitalization. Moreover, Jin et al. (2024) [67] used the open-source language model ERNIE for classification but did not incorporate domain-specific knowledge for fine-tuning. Considering the specialized nature of digitalization texts, this oversight makes the model’s representation of the samples inappropriate for the research context, leading to classification results with low accuracy and questionable credibility.

3. Innovative Identification of Enterprise Digitalization

3.1. Definition of Digitalization of an Enterprise and Rules for Its Identification

To overcome these limitations identified in prior studies (see Section 2.3), this study employs a new method by using an interpretable AI large language model to establish indicators for enterprise digitalization. This method aims to minimize training costs, maximize accuracy, ensure generalizability, and enhance interpretability, and serve as the core independent variable measurement used in the subsequent regression and mechanism analysis models.
However, accurately identifying digitalization in enterprises remains challenging. Table 1 highlights four key features in existing descriptions of ‘enterprise digitalization’ in annual reports:
(1) Lack of an appropriate subject: e.g., “First, create a new mode of intelligent procurement.”
(2) Focus on the broader digitalization landscape, not the enterprise: e.g., “Facing fierce market competition, peer companies have used digital technology to improve production processes and enhance internal production efficiency.”
(3) Industry-wide digitization descriptions: e.g., “In the future, rehabilitation medical equipment will integrate with intelligent sensors, IoT, big data, and other technologies, moving toward intelligence.”
(4) National policy outlines: e.g., “In July 2017, the State Council released the New Generation Artificial Intelligence Development Plan, aiming for global leadership in AI by 2030.”
Based on these characteristics, this study proposes guidelines for identifying statements related to enterprise digitalization:
A statement is considered to describe an enterprise’s digitalization behavior if it specifically targets the enterprise and involves the use of digital technology in any of the following ways:
(1) Developing relevant products.
(2) Improving production processes and techniques.
(3) Marketing its own IT products (for IT companies).
(4) Obtaining recognition and certification for digital behaviors.
(5) Declaring related projects.
In essence, enterprise digitalization is depicted when a company engages in activities such as product development, process enhancement, IT product marketing, digital certification, or project announcements. The presence of any one of these activities qualifies the company as undergoing digitalization.
Conversely, if the statement focuses on national policies, industry trends, non-IT products, or competitors’ digital behaviors, it does not describe enterprise digitalization.

3.2. Construction of an Enterprise Digitalization Database

The construction of the enterprise digitalization database encompasses five primary stages: cleaning the annual reports, creating the dataset for labeling, constructing the dataset for training, building the deep learning discriminative model for ‘enterprise digitalization’, and acquiring the dataset specifically related to ‘enterprise digitalization’. Figure 2 illustrates this methodology.
(1) Cleaning annual reports.
Download reports: Collect annual reports for A-share listed companies in Shanghai and Shenzhen from 2013 to 2022 via the China Research Data Service Platform (CNRDS). ② Text extraction: Remove non-textual elements such as tables and extract plain text from the ‘Management Discussion and Analysis’ sections. ③ Text processing: Split the text into sentences, check for and remove repetitive statements, and compile the cleaned text.
(2) Constructing the dataset to be labeled.
Sample selection: Combine all cleaned text from the ‘Management Discussion and Analysis’ and randomly select 10,000 sentence units for labeling to ensure representativeness.
(3) Constructing a trainable dataset.
Training annotators: Recruit and train two research assistants on definitions and rules related to ‘enterprise digitalization.’ ② Annotation process: Assistants independently annotate the 10,000 sentences, which are then reviewed by experts to resolve discrepancies and finalize the guidelines. ③ Export dataset: Save the annotated data in JSON format.
(4) Constructing the ‘enterprise digitalization’ discriminative model.
To enhance the model’s classification capabilities, it is constructed in two stages:
Stage 1: Use a pre-trained BERT language model and add perturbations to training samples to enhance generalization.
Stage 2: Apply keyword matching to identify relevant terms and integrate these into the model using cross-attention mechanisms. This helps construct an end-to-end binary learning network to handle diverse sample descriptions and improve interpretability.
The process involves constructing a deep learning network for binary classification using the cross-attention mechanism to handle the variety of sample descriptions and improve the interpretability of the discriminative model. The specifications of the model are detailed below.
① Stage 1: BERT representation learning based on contrastive learning.
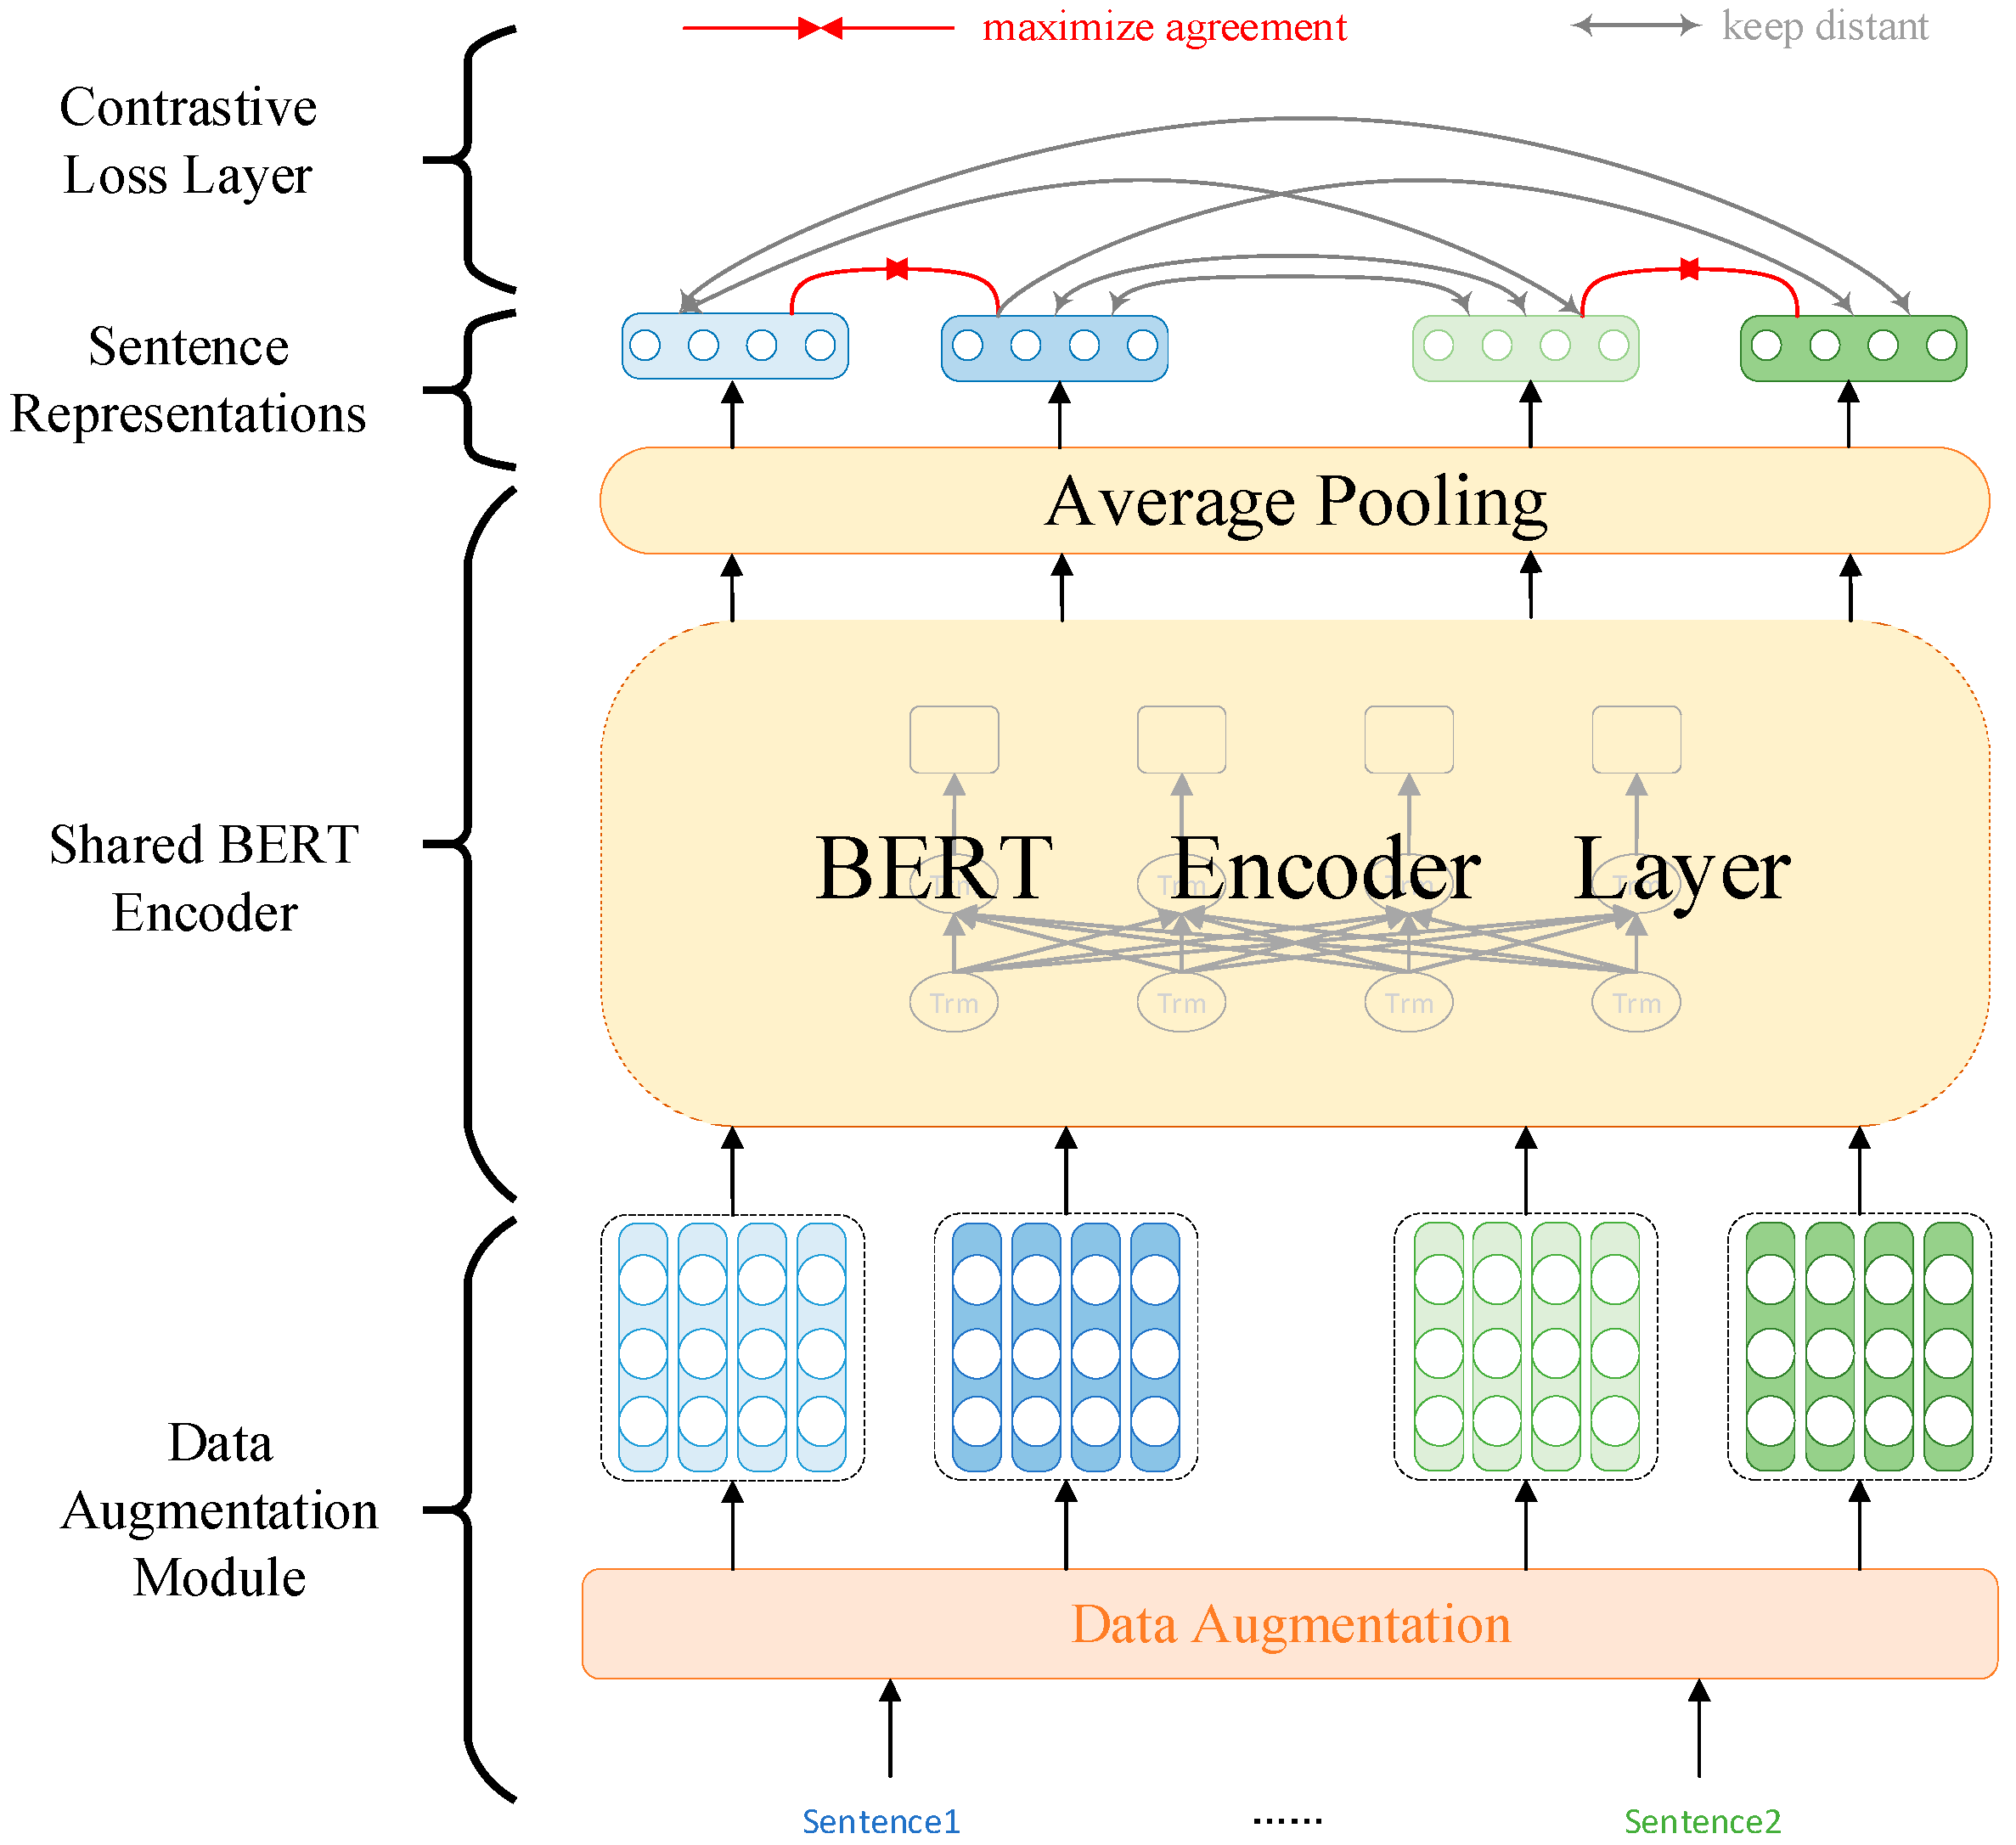
Considering the large amount of text content in corporate annual reports and the relatively weak adaptability of existing universal LLMs to domain data, the inference speed is slow, and the fine-tuning effect is uncontrollable. For the pre-trained language model BERT, firstly, it is pre-trained through a large amount of text and has strong text representation ability; Secondly, its parameter count is relatively small compared to general LLMs, resulting in higher computational efficiency; Thirdly, the fine-tuning effect of the BERT model is controllable when the sample size is moderate. Therefore, this stage is based on the pretrained language model BERT, fine-tuned on an unlabeled task-oriented corpus D. As shown in Figure 3, its structure consists of three main parts:
Data augmentation layer: As shown in Figure 4, each input sample X = { x 1 , x 2 , , x L } first enters the data augmentation layer, which applies token cutoff (randomly selecting tokens and setting their entire embedding vectors to zero) for augmentation. This process generates two different token embeddings ( E i , E j ) : E i = T X , E j = T X , where E i , E j R L × d , L is the sequence length, d is the hidden dimension, and T , T denotes the different cutoff methods.
Shared BERT encoding layer: Based on the processing of ( E i , E j ) , the representation vector ( R i , R j ) of ( E i , E j ) is encoded by the multilayer transformer block inside the BERT and obtained after average pooling.
Contrastive loss layer: Following Chen et al. (2020a) [68], this study employs normalized temperature-scaled cross-entropy loss (NTSCL) as the loss function. Each training session involves augmenting the dataset D by randomly sampling and expanding it with a batch of 2N sample representations. During training, each sample is made to be close to its own augmented version while remaining distant from the other 2N − 2 samples in the vector space. The classification loss is computed for sample pairs i and j.
l ( i , j ) = l o g e x p ( s i m ( R i , R j ) / τ ) k = 1 2 N 1 [ k i ] e x p ( s i m ( R i , R k ) / τ )
where s i m R i , R j = R i R j / ( R i R j ) is the cosine similarity function; R denotes the corresponding sample representation vector; τ is the hyperparameter (taking the value 0.1).
Training: In the training phase, the goal of this study is to minimize the final loss function   L c o n :
L c o n = 1 2 N k = 1 N [ l 2 k 1,2 k + l ( 2 k , 2 k 1 ) ]
② Stage 2: End-to-end binary classification deep learning networks based on the cross-attention mechanism.
The model in the second stage mainly includes the keyword query layer, token representation layer, cross-attention layer, and fully-connected classification layer, and the specific model structure is shown in Figure 5.
Keyword query layer: For the training samples X = { x 1 , x 2 , , x L } , we first perform a matching process using the compiled keyword library Q. This involves identifying the keywords present in the training samples X, resulting in the keyword set   W = { w 1 , w 2 , , w M } .
Token representation layer: The training samples are X = { x 1 , x 2 , , x L } and are added into the fine-tuned BERT model for encoding to obtain a sequence of hidden vectors of the training samples H = h 1 , h 2 , , h L R L × d .
h 1 , h 2 , , h L = f i n e t u n e d _ B E R T ( x 1 , x 2 , , x L )
Moreover, the keyword set   W = { w 1 , w 2 , , w M } is also input into the fine-tuned BERT model for encoding, resulting in a sequence of hidden vectors for the keyword set   C = c 1 , c 2 , , c M R M × d .
c 1 , c 2 , , c M = f i n e t u n e d _ B E R T ( w 1 , w 2 , , w M )
Cross-attention layer: To enhance the interpretability of model predictions and improve the recognition of non-primary objects, information is integrated from the keyword set   W relevant to the training samples X based on a cross-attention mechanism. For any hidden vector h i in the sequence of hidden vectors of the training samples and any hidden vector   c j   in the sequence of hidden vectors of the training samples, any hidden vector α i j can be expressed as α i j = e x p ( e i j ) k = 1 M e x p ( e i k ) , where   e i j = c o s ( h i , c j ) . Therefore, the attention vector a h i   is given by a h i = j = 1 M α i j c j . Thus, the attention matrix A is defined as A = ( a h 1 , a h 2 , , a h L ) ; then, we can obtain H = L a y e r N o r m ( H + A ) .
Fully connected classification layer: In this study, the attention matrix a is concatenated with the hidden vector sequence H of the training samples. This concatenated matrix is then fed into a fully connected layer to obtain the final classification prediction   y ^ = s o f t m a x ( W 2 L a y e r N o r m H + R e l u W 1 H + b 1 + b 2 ) .
Loss function: To train the aforementioned neural network, this study utilizes cross-entropy as the final loss function. Let   ( X i , y i ) denote the i-th training sample, where   X i represents the content of the i-th sample and yi is the true classification label of the i-th sample. The training objective is to minimize the final loss function:
L o s s = i = 1 D y ( i ) l o g y ^ ( i ) + ( 1 y i ) l o g ( 1 y ^ i )
Dataset description and preprocessing: This study employs the manually annotated Digital Transformation Dataset (N = 10,000 instances) introduced in Section 3.2. Following standard machine learning practice, the dataset was randomly partitioned into training (80%), validation (10%), and test sets (10%). The training subset was used for parameter estimation, the validation subset for hyperparameter tuning, and the test subset for final performance assessment.
Evaluation metrics: Given that this study addresses a text binary classification problem, the accuracy and bias of classification predictions can be measured by four metrics: accuracy, precision, recall, and F1-score. Their calculations are given by the following:
A c c u r a c y = T P + T N T P + F N + F P + T N
P r e c i s i o n = T P T P + F P
R e c a l l = T P T P + F N
F 1 = 2 × P r e c i s i o n × R e c a l l P r e c i s i o n + R e c a l l
Specifically, TP (true positive) denotes the count of actual positive instances correctly predicted; TN (true negative) represents the number of actual negative cases correctly identified; FP (false positive) indicates misclassified negative cases predicted as positive; and FN (false negative) refers to misclassified positive cases predicted as negative.
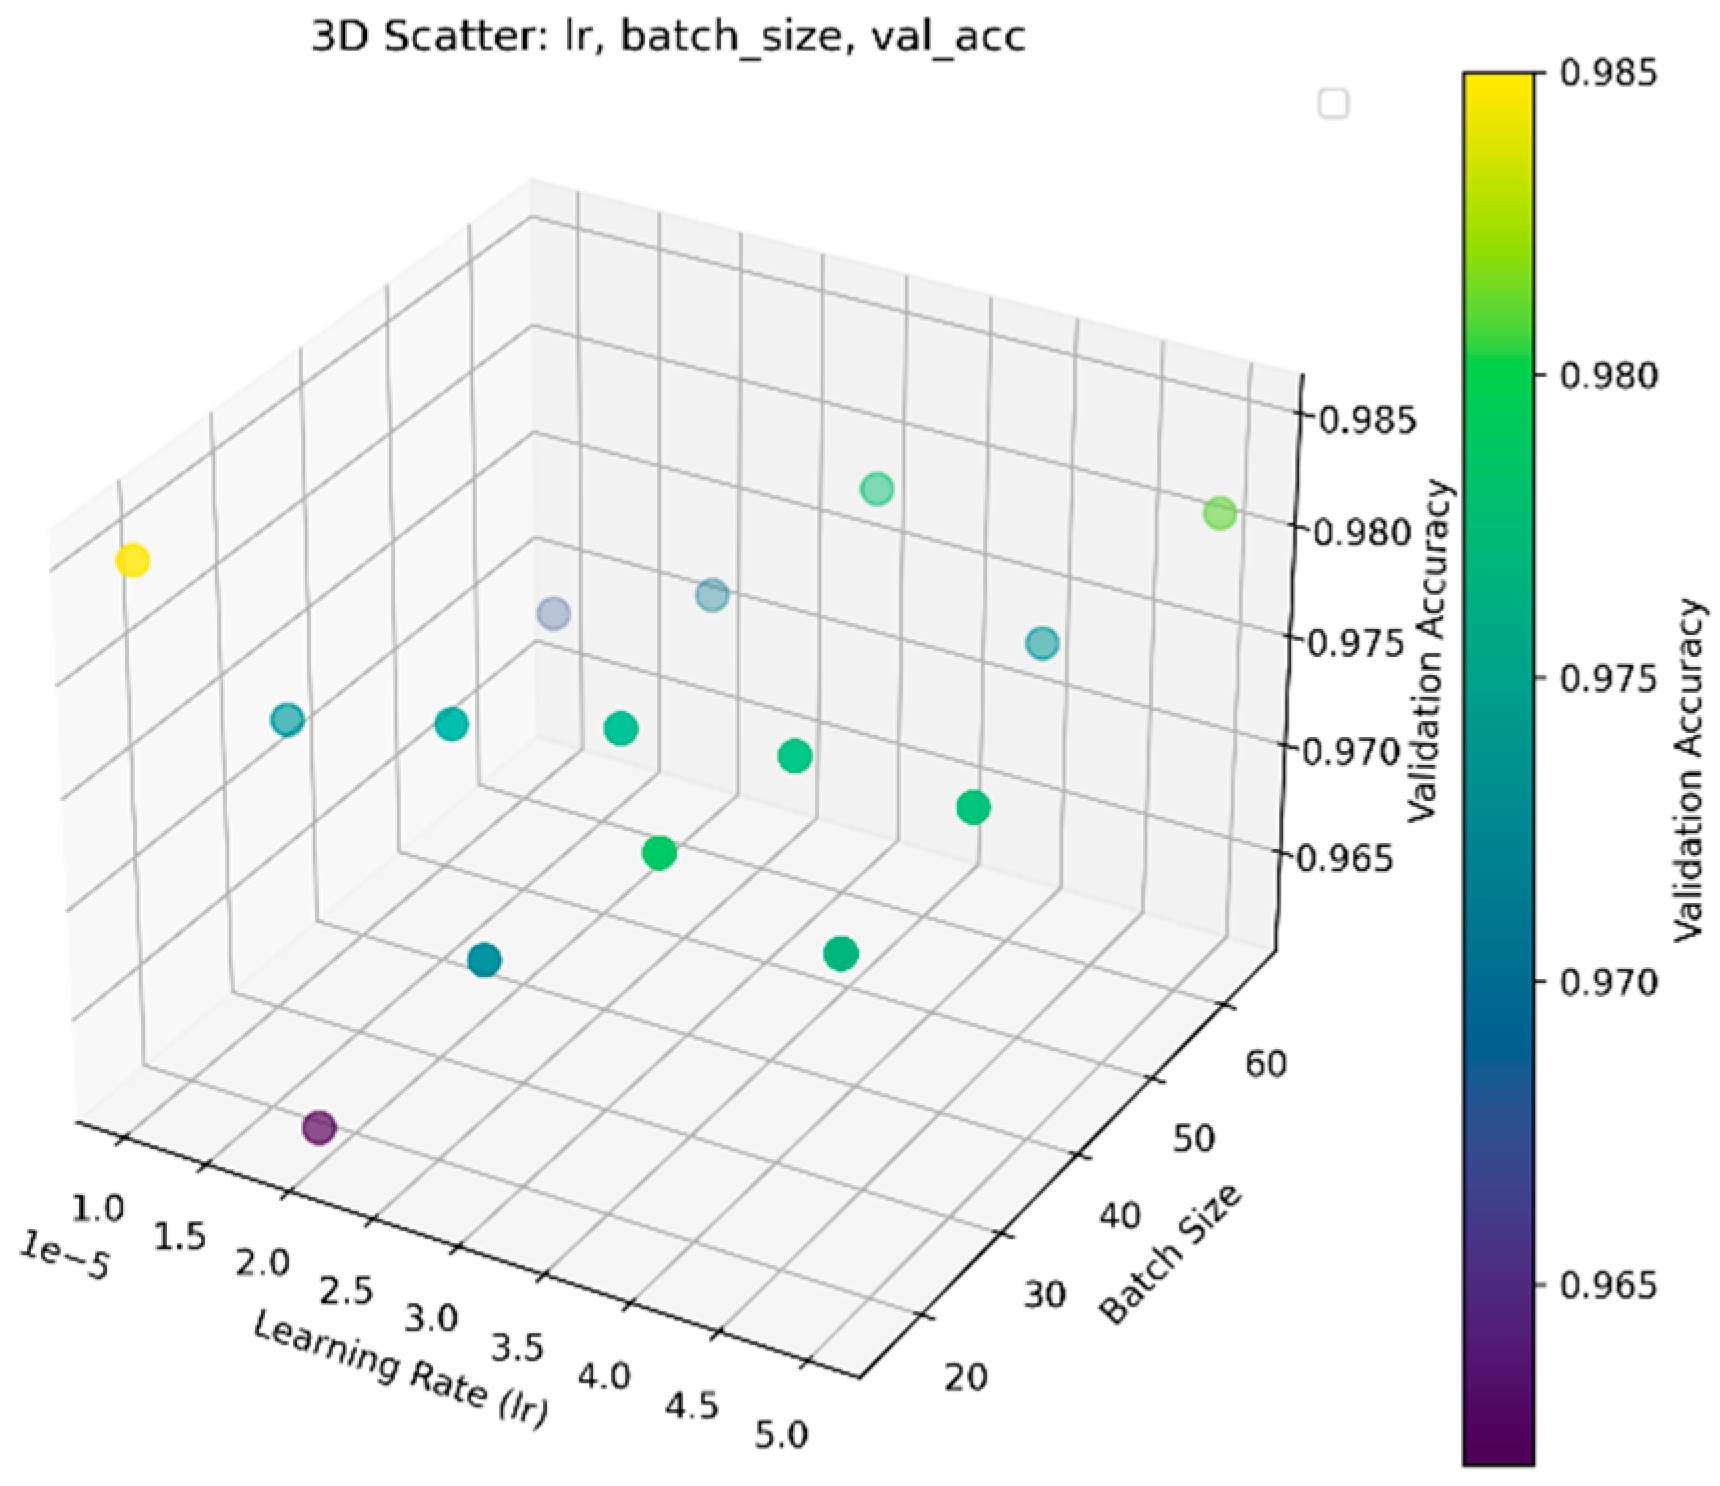
Model training details: The model was implemented in PyTorch 2.7 and trained on an NVIDIA Tesla V100 GPU. Throughout the training process, we configured the model to run for 50 epochs and selected the checkpoint exhibiting peak validation accuracy as the final model weights. For hyperparameter optimization, we adhered to standard BERT fine-tuning protocols, performing Bayesian optimization via Optuna across learning rates {1 × 10⁻⁵, 2 × 10⁻⁵, 3 × 10⁻⁵, 4 × 10⁻⁵, 5 × 10⁻⁵} and batch sizes {16, 32, 64}. As illustrated in Figure 6, the optimal configuration achieved maximum performance at a learning rate of 1 × 10⁻⁵ with a batch size of 16.
Under the optimal hyperparameter settings, the model’s training process is depicted in Figure 7, where the performance gradually stabilizes around the 10th epoch. Specifically, the trained model achieves nearly 100% accuracy on the training set, with validation accuracy fluctuating between 97.2% and 98.5%. Additionally, the loss gap between the training and validation sets remains small, indicating strong generalization performance without overfitting. Ultimately, we designate the training weights achieving the highest accuracy on the validation set as the final model parameters.
Experimental results: On the test set, the model achieves a classification accuracy of 98.5%. The detailed confusion matrix for the test set is presented in Table 2. These results clearly demonstrate that the model exhibits strong robustness and generalization capability.
Meanwhile, to better demonstrate the model’s classification performance, we have also trained models including ChatGLM (6B), BERT_base_Chinese, SVM, and the word frequency method on the same datasets. Their performance was evaluated using precision, recall, accuracy and F1-score with detailed results shown in Table 3. As can be seen, our proposed model significantly outperforms all other models.
(5) Obtain the ‘enterprise digitalization’ dataset.
Based on the discriminative model developed in step 4, the study identifies digitalization statements in the cleaned ‘Management Discussion and Analysis’ text from all A-share-listed companies in Shanghai and Shenzhen between 2013 and 2022. From this analysis, digitalization indicators for all enterprises are constructed annually.

4. Research Design

4.1. Data

This study focuses on A-share listed companies in Shanghai and Shenzhen from 2013 to 2022. The operational data for these companies are sourced from the China Stock Market & Accounting Research Database (CSMAR), while the annual report data are obtained from the Chinese Research Data Services Platform (CNRDS). Additionally, enterprise ESG performance data are derived from the ESG Ratings provided by Sino-Securities. To refine the research dataset, the following adjustments are made: ① financial enterprises are excluded; ② companies labeled with PT, *ST, or ST are excluded; ③ samples missing key data in core and control variables are excluded; and ④ to mitigate the impact of outliers, a 1% winsorization is applied to all continuous variables at both the upper and lower bounds.

4.2. Variables

4.2.1. Dependent Variable

Enterprise ESG performance (Esg).
Currently, academic studies often utilize either proprietary indices or third-party scores to assess enterprise ESG performance. Considering the subjective nature of self-constructed indices and the limited applicability of available indices to China’s specific context, this study uses the raw scores from ESG ratings provided by Sino-Securities Index Information Service (Shanghai, China) Co., Ltd. These ratings are broken down into three categories: environment (Env), social responsibility (Soc), and corporate governance (Gov). This approach allows for a more quantitative comparison of ESG performance across different companies.

4.2.2. Independent Variable

Enterprise digitalization (Digital).
This study uses the interpretable AI large language model to analyze and identify relevant information in the annual reports of A-share-listed firms from 2013 to 2022, to truly identify and count the number of sentences in annual reports that really represent the digitalization of each individual firm. Considering that some firms may not have engaged in substantive digital transformation and that the data exhibit right-skewed characteristics, this study adds one to the count of these identified sentences and then applies a logarithmic transformation. This approach allows for a more accurate measure of the degree of enterprise digitalization, where a higher value of “Digital” reflects a more advanced level of digital transformation for the firm.

4.2.3. Control Variables

To mitigate biases from omitted variables, this research adopts methodologies from Yuan et al. (2021) [69], selecting the following control variables: firm size (Size), firm age (FirmAge), current ratio (Liquid), fixed asset ratio (Fixed), return on assets (ROA), cash flow ratio (Cashflow), the duality of COB and CEO roles (Dual), and ownership centralization (Top10). Definitions of these variables are provided in Table 4.

4.3. Model Settings

4.3.1. Benchmark Regression Model

To investigate whether digital transformation enhances enterprise ESG performance, the following fixed-effects panel regression model is constructed:
E s g i t = β 0 + β 1 D i g i t a l i t + θ 1 X i t + λ i + μ t + ϵ i t
where i denotes the firm and t the year. The explanatory variable D i g i t a l i t represents enterprise digitalization; E s g i t is the dependent variable measuring enterprise ESG performance; X i t includes firm-level control variables; λ i and μ t are firm and year fixed effects, respectively; and ϵ i t is the idiosyncratic error term. A positive value of β 1 suggests that digitalization enhances ESG performance, whereas a negative value indicates detrimental effects.

4.3.2. Mediation Model

To uncover the “black box” through which digital transformation affects corporate ESG performance, this study introduces a model to identify and test potential transmission mechanisms. In recent years, mechanism identification methods have received growing attention in the field of economics. While the stepwise regression approach is commonly adopted, it suffers from considerable limitations due to endogeneity concerns, potentially leading to biased estimates. A more robust strategy focuses on examining whether the key explanatory variable significantly influences the mediating variables, while the role of mediators in affecting the dependent variable is typically supported by theoretical and logical reasoning. Therefore, to more effectively identify the pathways through which digital transformation impacts ESG performance, this study follows the approach of Chen et al. (2020) [70] and specifies the following empirical model:
M e d i t = α 0 + α 1 D i g i t a l i t + α 2 X i t + λ i + μ t + ϵ i t
where M e d i t refers to the mediating variables, including energy utilization efficiency, social concern, and internal control quality. A significantly positive coefficient α 1 provides evidence that digital transformation positively contributes to these mediating factors, thereby offering empirical support for the proposed transmission mechanisms.

4.4. Descriptive Statistics

Table 5 presents the descriptive statistics for the key variables used in this study. The mean ESG performance score (Esg) is 73.000, with values ranging from 56.650 to 84.150 and a standard deviation of 5.302, indicating significant variability among firms. For enterprise digitalization (Digital), the mean is 1.891, with values ranging from 0 to 4.454, reflecting diverse levels of digital engagement. These statistics depict a robust dataset for analysis. The descriptive statistics for the control variables are consistent with those reported in existing literature.

5. Empirical Analysis

5.1. Benchmark Regression

As enterprises progress in their digitalization, cutting-edge information technologies including the AI, 5G, big data, cloud computing, and IoT are increasingly implemented on a large scale. These technologies have the potential to enhance environmental performance, responsibility in society, and corporate governance, thus impacting the overall ESG performance of enterprises. This study empirically analyzes the statistical relationship between digitalization and ESG performance to examine this effect.
Table 6 presents the results of the benchmark regressions using a fixed-effects model for estimation. In column (1), after controlling for firm-specific and time-specific effects, the estimated coefficient for enterprise digitalization (labeled as “Digital”), which is the primary focus of this study, is 0.342. This coefficient is positive and shows statistical significance at 1%. In column (2), after the inclusion of additional control variables, the estimated coefficient for “Digital” is 0.223, which remains positive and shows statistical significance at 1%. Columns (3) to (5) explore the impact of enterprise digitalization on environmental scores, social responsibility scores, and corporate governance scores, separately. Upon adjusting for control variables, as well as firm-specific and time-specific factors, the coefficient for “Digital” in column (3) registers at 0.154, achieving statistical significance at 5%. In column (4), the coefficient increases to 0.379, which takes on statistical significance at 1%, and in column (5), it is 0.248, statistically significant at 1%. These findings confirm the proposed hypothesis H1, indicating that enterprise digitalization positively influences ESG performance across environmental scores, scores for responsibility in society, and corporate governance scores.

5.2. Endogenous Test

The previous analysis suggests that enterprise digitalization can improve their ESG performance; however, this finding may be confounded by endogeneity issues including reverse causation and may not be robust. For example, enterprises with better ESG performance may be more sustainable and innovative, which could mean they have a stronger motivation and ability to drive digitalization within their firms. To mitigate the impact of endogeneity on the estimation results, this study uses the instrumental variable method.
Following Xiao et al. (2022) [71], this study constructs an instrumental variable by interacting two components: the number of fixed telephone lines per 10,000 people in each city in 1984 and the lagged national total number of internet users. This design is grounded in the theories of technological diffusion and the path dependence of information infrastructure. The fixed-line telephone density in 1984 reflects the historical accumulation of local Information and Communication Technology (ICT) infrastructure, which serves as the initial condition for the subsequent development of enterprise digital capabilities. Meanwhile, the nationwide internet user count captures the overall evolution of the technological environment over time. By using its lagged value, we ensure that this variable is not subject to reverse causality from current firm behavior. Therefore, this interaction term is theoretically well-founded in terms of relevance.
Regarding exogeneity, both components of the instrumental variable—the fixed telephone density in 1984 and the lagged national internet user count—are macro-level variables with no direct relationship to current corporate ESG strategies or behaviors. First, ESG performance reflects recent enterprise practices in environmental responsibility, social responsiveness, and governance mechanisms, none of which were integral to corporate strategies in the 1980s. Second, the fixed-line telephone infrastructure in 1984 constitutes a long-term, structural feature of city-level communication systems and bears no direct causal link to firms’ ESG decision-making processes. Third, changes in the national number of internet users merely represent trends in digitalization at the national level, independent of any single firm’s choices or performance. Taken together, these elements support the exogeneity of the instrumental variable and strengthen its theoretical and logical validity. The regression results using the instrumental variable are presented in Table 7.
In Table 7, the first-stage regression results using the instrumental variable (IV) method are presented in column (1). The results indicate that the instrumental variable has an estimated coefficient of 12.939, exhibiting statistical significance at 10%. This demonstrates that as the interaction term between the lagged number of internet users nationwide and the 1984 fixed telephone data per 10,000 people in each city increases, the ESG performance of enterprises in that region also significantly improves, confirming that the selected instrumental variable meets the relevance requirement. In Table 7, the second-stage regression results employing the instrumental variable approach are illustrated in column (2). The findings reveal that when the instrumental variable method is used for estimation, the estimated coefficient for enterprise digitalization (labeled as “City_attention_IV”) is 2.091, exhibiting statistical significance at 1%. This indicates that the baseline regression results are quite robust. The finding further supports the central hypothesis of this paper, providing strong evidence that enterprise digitalization promotes ESG performance.

5.3. Robustness Tests

The robustness of the benchmark regression results concerning the impact of enterprise digitalization on ESG performance is verified through several methods, including the substitution of explanatory variables, adjustments in the clustering approach, the incorporation of higher-order fixed effects, and sample exclusions.

5.3.1. Replacement of Core Independent and Explained Variables

To address the limitations of a single ESG index, this study uses the CNRDS ESG index, designed for Chinese companies and modeled after the MSCI ESG Stats Database. It evaluates ESG performance across six dimensions with 58 sub-indicators, enhancing study validity. Re-estimations with the CNRDS ESG index (CRNDS_Esg) yield a coefficient of 0.419, significant at the 1% level (Table 8, column (1)).
For a comprehensive assessment of potential measurement errors in digitalization, three alternative indicators are employed for robustness checks:
Digital1: Based on Wu et al. (2021) [72], this measure evaluates digital-related keywords in the ‘Management Discussion and Analysis’ section of annual reports, applying a logarithmic transformation. The coefficient for Digital1 is 0.469, significant at the 1% level (Table 8, column (2)).
Digital2: Following Yuan et al. (2021) [69], this measure calculates the ratio of digitization-related word frequency to text length. The coefficient for Digital2 is 0.346, achieving significance at 1% (Table 8, column (3)).
Digital3: Addressing potential biases in text mining measures, this study, inspired by Qi et al. (2020) [73], compiles a measure based on the details of intangible assets listed in annual reports, including ‘software,’ ‘artificial intelligence,’ and ‘information systems.’ These are termed “digital intangible assets.” The proportion of these assets relative to total intangible assets for the year is computed and used as another alternative measure for enterprise digitalization (Digital3). The findings reported in column (3) of Table 8 yield an estimated coefficient of 1.187, statistically significant at 1%.
Overall, these robust results further validate the central hypothesis, confirming that enterprise digitalization exerts a significant and consistent positive influence on ESG performance across diverse measures and specifications.

5.3.2. Additional Robustness Tests

(1) Adjusting the clustering method: To mitigate potential correlations within the same industry and between city and industry, this study clusters standard errors at both levels. The coefficients for the core explanatory variable, as shown in columns (1) and (2) of Table 9, are 0.466, achieving statistical significance at the 1% level.
(2) Incorporating high-dimensional fixed effects: To control for unobservable factors and reduce endogeneity, the analysis introduces high-dimensional fixed effects, specifically “time–industry” and “city–industry” interactions, into the baseline regression. The results, displayed in columns (3) and (4) of Table 9, indicate that the core explanatory variable remains notably positive and achieves statistical significance at 1%.
(3) Excluding specific samples: In response to the potential overrepresentation of highly digitalized sectors, such as telecommunications and internet services, these industries are excluded from the sample. The analysis of the remaining data, presented in column (5) of Table 9, reveals a significantly positive coefficient, thus reinforcing the robustness of the primary findings.
Taken together, these additional robustness checks confirm that the central conclusions of this paper remain valid across different model specifications and sample treatments, offering strong empirical support for the hypothesized link between enterprise digitalization and ESG performance.

5.4. Heterogeneity Analysis

While existing research has examined how digitalization affects ESG performance, it often overlooks the variability introduced by factors such as firm size and ownership type. This study delves into these aspects to deepen the understanding of digitalization’s effects.

5.4.1. Heterogeneity in Firm Size

To verify the heterogeneous impact of digitalization on the ESG performance of firms of different sizes, this study uses the variable ‘Size’ to classify the samples. Samples larger than the average are large-scale firms, and those smaller than or equal to the average are small-scale firms. Columns (1) and (2) of Table 10 show the empirical regression results for different firm sizes. The estimated coefficients are significant at 5% and 1% for small-scale and large-scale firms, respectively. The coefficients are larger for large-scale firms, suggesting that digitalization is more conducive for large-scale firms to improve their ESG performance. This is likely because large-scale enterprises usually face more intense public scrutiny and regulatory oversight. Under this external pressure, they are more motivated to enhance their ESG credentials, allowing them to more effectively utilize digital platforms and tools to improve and report their ESG performance.

5.4.2. Heterogeneity of Ownership Type

To explore the heterogeneous impact of enterprise digitalization on ESG performance under different types of ownership, this study classifies firms into sub-samples of state-owned enterprises (SOEs) and non-state-owned enterprises (NSOEs). Columns (3) and (4) of Table 10 present the empirical regression results under these different ownership categories. The coefficients for non-state-owned and state-owned enterprises show significance at 5% and 1%, separately. Notably, the coefficients are significantly larger for SOEs, suggesting that the facilitating effect of digitalization is more pronounced in those owned by the state. A possible explanation is that SOEs are under greater expectations and pressure to fulfill their social and environmental responsibilities. Additionally, SOEs often receive direct support from national policies promoting digitalization, which are typically prioritized in these enterprises. This governmental support provides the necessary financial resources and backing for digitalization, helping SOEs achieve more substantial ESG outcomes.

5.5. Mechanism Analysis

The preceding analysis has systematically demonstrated and validated the positive impact of enterprise digitalization on ESG performance, along with the robustness of its conclusions. However, current research remains limited in uncovering how digitalization specifically influences the individual dimensions of ESG, and empirical evidence on the underlying mechanisms is still lacking. Given the theoretical and practical importance of understanding these internal mechanisms, this study, building on the previous mechanism framework shown in Figure 1, further examines whether digitalization improves ESG performance through three primary pathways: enhancing energy efficiency, increasing public visibility, and strengthening internal control. Mechanism analysis not only serves to empirically verify the theoretical links but also helps to open the “black box” of ESG drivers, offering a conceptual framework for future research and providing policymakers with more targeted strategic recommendations.

5.5.1. Energy Utilization Efficiency

Section 2 shows that the digitalization process may improve an enterprise’s energy utilization efficiency (EUE), thereby boosting its performance in environments and ultimately elevating its ESG results. This improvement primarily arises from digitalization notably enhancing managerial effectiveness and market responsiveness through the use of advanced information technologies including cloud computing, blockchain, AI, and the IoT [31,74]. Additionally, the implementation of data-driven decision support systems allows enterprises to achieve greater accuracy and efficiency in resource utilization and supply chain management [50]. This leads to reduced resource waste and lower energy consumption in the production process, directly impacting corporate performance in environments [75,76].
To quantify energy consumption efficiency, this study calculates the ratio of operational revenue to energy input. Following the empirical methodologies employed by Lyubich et al. (2018) [77] and Chen & Chen (2019) [78], the analysis predominantly focuses on coal consumption, which represents approximately 70% of China’s energy consumption, as the energy consumption structure remains relatively stable [79]. Energy sources utilized by listed companies, such as electricity, natural gas, or gasoline, are converted into a standardized unit of ‘tons of standard coal’ using conversion coefficients provided by China’s National Bureau of Statistics. Energy utilization efficiency is subsequently calculated as operating revenue divided by energy input, expressed in RMB 10,000 per ton of standard coal.
Table 11 reports the regression results on corporate digitalization’s impact on energy use efficiency. Column (1) shows that digitalization has a coefficient of 15.615, significant at 5%, indicating a substantial improvement in energy efficiency and ESG performance. This finding provides empirical support for Hypothesis H2, which proposes that enterprise digitalization improves environmental performance by enhancing energy efficiency. This is supported by real-world cases like Alibaba’s green data center, which uses AI-driven scheduling to achieve a power usage effectiveness (PUE) of 1.3, reducing energy consumption by 30% compared to conventional data centers.

5.5.2. Social Concerns

Digitalization enhances social concern by optimizing the transparency and dissemination of information. Social concern encompasses both public concern and media supervision. According to Song et al. (2011) [80], the internet search index can serve as an indicator of the level of public concern and interest in a specific firm. We employ the method used by Li et al. (2022) [81] for measuring public attention by calculating the natural logarithm of the total search values for stock codes, company abbreviations, and full company names, increased by one. Similarly, media attention is measured by taking the natural logarithm of the total number of media reports for each company over the year, increased by one, as per the approach outlined by Shen and Wang (2021) [11].
In Table 11, a statistically significant correlation is presented in column (2) between public attention and enterprise digitalization. The estimated coefficient of 0.046 suggests that enterprise digitalization positively affects increasing public attention to firms. Additionally, it is found that enterprise digitalization is conducive to reducing the discrepancy between the internal and external information of enterprises. As enterprise digitalization progresses, enterprises have garnered significant public attention by sharing information online and engaging in social media activities. This has helped establish a trust relationship among consumers, investors, and enterprises, aligning with the empirical findings. Column (3) shows the regression findings of the impact of enterprise digitalization on media monitoring. The estimated coefficient is 0.023, which passes the statistical test at a significance level of 1%. This suggests that enterprise digitalization positively affects improving the quality of enterprise information disclosure and enables comprehensive and in-depth monitoring by the media, thereby facilitating the fulfillment of social responsibilities and the effective implementation of internal control commitments. These results also confirm Hypothesis H3, suggesting that enterprise digitalization increases social engagement and transparency.

5.5.3. Internal Controls

In the context of corporate governance, digital transformation equips firms with more efficient monitoring and compliance tools, enabling managers to better oversee internal operations and enhance the quality of internal controls. Strengthened internal control mechanisms contribute to improved governance performance, thereby exerting a positive influence on firms’ ESG outcomes.
To empirically measure the quality of internal controls, this study follows the approach of Li and Zheng (2022) [82] and Yang et al. (2021) [83], employing the DIB Internal Control Index (DIB Index) as a proxy variable for internal control quality. The DIB Index is one of the most widely used and authoritative internal control evaluation systems in China. It comprehensively assesses the rationality and effectiveness of firms’ internal control systems across five key dimensions: strategic planning, operational management, financial reporting, legal compliance, and asset security.
Column (4) of Table 11 shows a significant statistical relationship between internal control quality and enterprise digitalization, with an estimated coefficient of 5.188. This, combined with the earlier finding that enterprise digitalization is positively associated with social concern, supports Hypothesis H4, indicating that digitalization strengthens internal controls and improves governance outcomes by enhancing the quality and effectiveness of firms’ internal control systems.

6. Conclusions and Policy Implications

6.1. Conclusions and Comparison

In a global market characterized by rapid technological advancements, digitalization has become essential for businesses to adapt to dynamic market and industry landscapes. However, research on the relationship between digitalization and ESG performance remains limited and fragmented, with many studies relying on coarse proxies such as word frequency analysis, which often lack semantic precision and validity, thus generating significant debate [17].
This study investigates the impact of digitalization on ESG performance using panel data from A-share-listed companies in Shanghai and Shenzhen from 2013 to 2022. We develop a novel and interpretable measure of enterprise digitalization using a large language model (LLM)-based interpretable AI approach. Our findings suggest that digitalization significantly improves ESG performance by strengthening corporate governance, enhancing social responsibility, and advancing environmental stewardship. These effects operate through mechanisms such as improved energy efficiency, elevated social visibility, and optimized internal controls.
Compared with prior literature, this study contributes several advances. Firstly, unlike Martínez et al. (2023) [17] and Zhong et al. (2023) [18], who used simplified keyword metrics to proxy digitalization, our approach captures deeper semantic and contextual meanings from textual disclosures, thereby addressing concerns of measurement bias and enhancing interpretability. Secondly, while existing studies have tended to focus on singular ESG dimensions or abstract mechanisms [19,20], our empirical design systematically unpacks the heterogeneous pathways—governance, society, and environment—through which digitalization exerts its influence, responding directly to calls for more comprehensive mechanism analysis.
Moreover, we validate the robustness of our results through multiple strategies, including instrumental variables, fixed-effects estimation, and alternative measurements. These efforts go beyond the scope of prior research, ensuring greater reliability. Finally, our analysis also reveals that the positive effect of digitalization on ESG performance is more pronounced in state-owned and large-scale enterprises.
Taken together, this study not only reinforces but also advances the literature by offering a precise, interpretable, and empirically validated framework to assess the role of digitalization in sustainable corporate development. It highlights the value of interpretable AI models in ESG research and offers new directions for policymakers and managers to leverage digital tools for enhancing sustainable governance. Theoretically, this study offers a refined cross-disciplinary framework by integrating stakeholder theory, institutional theory, information asymmetry theory, and principal-agent theory. These classical theories are applied to explain how digital transformation shapes ESG outcomes via three key mediating mechanisms: energy efficiency, social visibility, and internal control. Unlike previous studies that either lacked mechanism analysis or focused solely on macro-level institutional factors, this study adopts a micro-level perspective to reveal how digital tools reconfigure firm-level behaviors and governance structures. Finally, by unpacking the differentiated effects of digitalization across the E, S, and G dimensions, this study pushes the frontier of ESG research in the digital age.

6.2. Policy Implications

Drawing upon the findings of this study, we propose the following policy implications to facilitate the integration of digital transformation with ESG performance, particularly from the perspective of government actors:
First, central and local governments should take coordinated and multi-pronged measures to foster a favorable external environment that supports the convergence of the digital economy and the real economy. Specifically, governments can encourage enterprises to embed new-generation digital technologies—including AI, big data, and the Internet of Things—into traditional functions such as production, R&D, management, and marketing, while also aligning these applications with ESG objectives. This dual integration helps enterprises enhance their ESG capabilities and engage more actively in sustainable practices.
Second, to maximize the positive effects of digital transformation on ESG performance, it is essential to strengthen the mechanism through which this transformation influences corporate sustainability outcomes. Concretely, (1) local governments should prioritize improvements in firms’ energy efficiency by offering fiscal subsidies and tax incentives, establishing green credit programs, and launching targeted funding initiatives for energy-saving projects. In parallel, regulatory standards for environmental protection and energy use should be upgraded, mandating the use of advanced energy-efficient technologies in production to curb waste. (2) Local governments should also improve corporate visibility by introducing mandatory ESG disclosure regulations, requiring companies to regularly publish detailed reports on environmental, social, and governance practices. This can enhance public scrutiny and social accountability. (3) Governments are further encouraged to support firms in adopting advanced information systems such as ERP and CRM platforms to increase operational transparency and governance efficiency. Third-party auditing mechanisms should also be institutionalized to evaluate and monitor ESG performance, ensuring the credibility and independence of the assessment process.
Finally, recognizing the heterogeneity across firms, local governments should design differentiated ESG incentive policies based on enterprise characteristics. Our empirical findings indicate that the impact of digital transformation on ESG performance is more pronounced among large-scale and state-owned enterprises. Accordingly, policymakers should tailor digital transformation support schemes to address the specific constraints of vulnerable or underperforming firms. Priority could be given to scaling up support for large and state-owned enterprises, while gradually reducing ESG performance disparities across firm types through more inclusive and targeted policy interventions.

6.3. Managerial Implications

Drawing upon the empirical evidence and mechanism analyses in this study, we propose the following managerial implications to help enterprises harness digital transformation as a driver of sustainable value creation across ESG dimensions:
First, enterprises should fully recognize the strategic value of digitalization in advancing environmental sustainability, particularly through improving energy utilization efficiency. Firms are encouraged to invest in intelligent energy management systems, green production technologies, and digital monitoring platforms to identify inefficiencies and optimize resource allocation. Integrating digital tools with environmental management not only reduces operational costs but also enhances environmental legitimacy.
Second, to mitigate reputational and regulatory risks arising from growing social concerns, firms should proactively build a responsive stakeholder management system. This includes conducting social impact assessments, disclosing ESG performance through digital channels, and actively engaging with media, NGOs, and the public. Attention should be paid to key risk areas such as labor conditions, algorithmic fairness, data privacy, and workplace inclusion. Proactive communication and corrective actions can help firms maintain stakeholder trust and social legitimacy in the digital age.
Third, firms should prioritize strengthening internal controls and governance structures through digital technologies. By adopting enterprise-level information systems (e.g., ERP and CRM) and AI-driven risk analytics, companies can improve internal transparency, reduce information asymmetry, and enhance decision accountability. This helps reduce agency costs and improve organizational resilience. Encouraging the participation of diverse internal stakeholders in the design and oversight of digital systems is also essential for avoiding governance blind spots.
Fourth, recognizing the potential negative externalities of digitalization—such as workforce displacement, psychological stress, or widening digital inequality—companies should adopt an inclusive and responsible digital innovation strategy. This involves investing in employee upskills, ensuring algorithmic transparency, and aligning technology use with ethical and social standards. By doing so, firms can reduce adverse effects while reinforcing their long-term sustainability commitments.
Finally, enterprises are advised to build an integrated ESG digital strategy that aligns technological deployment with sustainability goals. This entails embedding ESG objectives into digitalization planning, setting performance benchmarks for environmental efficiency, stakeholder engagement, and governance improvement, and establishing cross-functional ESG digital task forces to coordinate implementation.

6.4. Research Limitations and Future Directions

While this study offers novel insights into how digital transformation shapes ESG performance, several limitations remain.
First, the digitalization indicator, derived from an LLM-based interpretable AI model, reflects semantic richness in disclosure but may still be affected by firms’ reporting preferences. Future research could complement this with objective indicators such as patent counts, investment in digital infrastructure, or employee digital literacy.
Second, while this paper addresses endogeneity concerns using firm and year fixed effects, instrumental variables, and lagged explanatory variables, the influence of unobserved confounders cannot be entirely ruled out. Additionally, the pandemic period may introduce external, policy-driven shocks that “forced” digitalization across firms. Future studies could improve causal inference through quasi-experimental designs or natural experiments and consider excluding pandemic years or conducting robustness checks accordingly.
Third, due to data availability constraints, this study focuses only on A-share-listed companies in China, which may limit the external validity of the findings. Existing ESG performance indicators are largely based on firms’ self-reported disclosures, particularly in the environmental and social dimensions, where objectivity and verifiability are often weak. As a result, ESG performance may be subject to manipulation, leading to a “greenwashing” effect, where firms exaggerate their sustainability efforts. This can introduce measurement error and affect the accuracy of regression estimates. Future research could incorporate external indicators such as third-party audits, satellite imagery, and media sentiment analysis to mitigate information distortion. Expanding the sample to include small and unlisted firms would also enhance representativeness and generalizability. Moreover, given China’s unique institutional context, cross-national comparisons would help test the universality of the proposed mechanisms and theoretical framework.
Fourth, although this paper draws on stakeholder theory, institutional theory, information asymmetry, and agency theory to explain observed relationships, the integration across these theoretical lenses remains preliminary. Future studies could build more unified or dynamic theoretical models to explain how digitalization interacts with multi-level governance and evolving stakeholder expectations.

Author Contributions

Conceptualization, H.K. and R.T.; methodology, R.T.; software, H.K.; validation, H.K., R.T. and N.C.; formal analysis, R.T.; investigation, H.K.; resources, H.K.; data curation, R.T.; writing—original draft preparation, R.T.; writing—review and editing, H.K.; visualization, R.T.; supervision, N.C.; project administration, N.C.; funding acquisition, H.K. and R.T. All authors have read and agreed to the published version of the manuscript.

Funding

This research was funded by Special Funds for the Cultivation of Guangdong College Students’ Scientific and Technological Innovation “Online Diffusion and Mutation Mechanisms of Traditional Social Security Incidents in the Digital Age: A Multimodal Big Data Analysis”.

Institutional Review Board Statement

Not applicable.

Informed Consent Statement

Not applicable.

Data Availability Statement

Data are contained within the article. The data presented in this study can be requested from the authors.

Conflicts of Interest

The authors declare no conflicts of interest.

References

  1. Eccles, R.G.; Ioannis, I.; George, S. The Impact of a Corporate Culture of Sustainability on Corporate Behavior and Performance. SSRN Electron. J. 2011, 2835–2857. [Google Scholar] [CrossRef]
  2. Kotsantonis, S.; Pinney, C.; Serafeim, G. ESG Integration in Investment Management: Myths and Realities. J. Appl. Corp. Financ. 2016, 28, 10–16. [Google Scholar] [CrossRef]
  3. Vashchenko, M. An external perspective on CSR: What matters and what does not? Bus. Ethics A Eur. Rev. 2017, 26, 396–412. [Google Scholar] [CrossRef]
  4. Ali, W.; Frynas, J.G. The Role of Normative CSR-Promoting Institutions in Stimulating CSR Disclosures in Developing Countries. Corp. Soc. Responsib. Environ. Manag. 2018, 25, 373–390. [Google Scholar] [CrossRef]
  5. Baldini, M.A.; Bronzetti, G.; Sicoli, G. The influence of corporate governance’s decision on corporate social responsibility. Int. J. Bus. Perform. Manag. 2018, 19, 16–35. [Google Scholar] [CrossRef]
  6. Davis, S. Re-conceptualizing Corporate Social Responsibility in Japan. In Corporate Social Responsibility in Asia; Springer: Cham, Switzerland, 2014; pp. 35–64. [Google Scholar]
  7. Berrone, P.; Fosfuri, A.; Gelabert, L.; Gomez-Mejia, L. Necessity as the mother of “green” inventions: Institutional pressures and environmental innovations. Strateg. Manag. J. 2013, 34, 891–909. [Google Scholar] [CrossRef]
  8. Chang, D.-S.; Kuo, L.-C.R.; Chen, Y.-T. Industrial changes in corporate sustainability performance—An empirical overview using data envelopment analysis. J. Clean. Prod. 2013, 56, 147–155. [Google Scholar] [CrossRef]
  9. Luu, T.T. Integrating green strategy and green human resource practices to trigger individual and organizational green performance: The role of environmentally-specific servant leadership. J. Sustain. Tour. 2020, 28, 1193–1222. [Google Scholar] [CrossRef]
  10. Yu, E.P.-Y.; Luu, B.V. International variations in ESG disclosure—Do cross-listed companies care more? Int. Rev. Financ. Anal. 2021, 75, 101731. [Google Scholar] [CrossRef]
  11. Shen, Y.; Wang, J. Media Report and Information Transparency in Immature Financial Markets: The Perspective of Peer-to-Peer Lending in China. J. Manag. World 2021, 37, 35-50+4+17-19–50. (In Chinese) [Google Scholar] [CrossRef]
  12. Manita, R.; Bruna, M.G.; Dang, R.; Houanti, L. Board gender diversity and ESG disclosure: Evidence from the US. J. Appl. Account. Res. 2018, 19, 206–224. [Google Scholar] [CrossRef]
  13. Arayssi, M.; Jizi, M.; Tabaja, H. The impact of board composition on the level of ESG disclosures in GCC countries. Sustain. Account. Manag. Policy J. 2020, 11, 137–161. [Google Scholar] [CrossRef]
  14. Matarazzo, M.; Penco, L.; Profumo, G.; Quaglia, R. Digital transformation and customer value creation in Made in Italy SMEs: A dynamic capabilities perspective. J. Bus. Res. 2021, 123, 642–656. [Google Scholar] [CrossRef]
  15. Ma, J.; Li, Q.; Zhao, Q.; Jennhae, L.; Chen, L. From Bytes to Green: The Impact of Supply Chain Digitization on Corporate Green Innovation. Energy Econ. 2024, 123, 107942. [Google Scholar] [CrossRef]
  16. Gu, J. Did Supply Chain Digitization Contribute to Corporate Green Energy Innovation? The Mediating Role of Asset Receivable Management and Policy Spillovers. Energy Econ. 2025, 143, 108274. [Google Scholar] [CrossRef]
  17. Martínez-Peláez, R.; Ochoa-Brust, A.; Rivera, S.; Félix, V.G.; Ostos, R.; Brito, H.; Félix, R.A.; Mena, L.J. Role of Digital Transformation for Achieving Sustainability: Mediated Role of Stakeholders, Key Capabilities, and Technology. Sustainability 2023, 15, 11221. [Google Scholar] [CrossRef]
  18. Zhong, Y.; Zhao, H.; Yin, T. Resource Bundling: How Does Enterprise Digital Transformation Affect Enterprise ESG Development? Sustainability 2023, 15, 1319. [Google Scholar] [CrossRef]
  19. Wu, S.; Li, Y. A Study on the Impact of Digital Transformation on Corporate ESG Performance: The Mediating Role of Green Innovation. Sustainability 2023, 15, 6568. [Google Scholar] [CrossRef]
  20. Liu, H.; Jung, J.-S. Impact of Digital Transformation on ESG Management and Corporate Performance: Focusing on the Empirical Comparison between Korea and China. Sustainability 2024, 16, 2817. [Google Scholar] [CrossRef]
  21. Fang, M.; Nie, H.; Shen, X. Can enterprise digitization improve ESG performance? Econ. Model. 2023, 118, 106101. [Google Scholar] [CrossRef]
  22. Yang, P.; Hao, X.; Wang, L.; Zhang, S.; Yang, L. Moving toward sustainable development: The influence of digital transformation on corporate ESG performance. Kybernetes 2023, 53, 669–687. [Google Scholar] [CrossRef]
  23. Friede, G.; Timo, B.; Bassen, A. ESG and financial performance: Aggregated evidence from more than 2000 empirical studies. J. Sustain. Financ. Investig. 2015, 5, 210–233. [Google Scholar] [CrossRef]
  24. Clark, G.L.; Feiner, A.; Viehs, M. From the Stockholder to the Stakeholder: How Sustainability Can Drive Financial Outperformance. J. Appl. Corp. Financ. 2015, 27, 34–51. [Google Scholar] [CrossRef]
  25. Zhou, Z.; Yuan, Z.; He, C. Can digital transformation promote firms’ sustainable development? Evidence based on ESG performance. Int. Rev. Financ. Anal. 2025, 105, 104434. [Google Scholar] [CrossRef]
  26. Lu, Y.; Xu, C.; Zhu, B.; Sun, Y.; Welford, R. Digitalization transformation and ESG performance: Evidence from China. Bus. Strategy Environ. 2024, 33, 352. [Google Scholar] [CrossRef]
  27. Liu, Q.; Wang, H. Digital transformation, innovation capability, and ESG performance. Financ. Res. Lett. 2025, 78, 107166. [Google Scholar] [CrossRef]
  28. Li, Y.; Zhu, C. Regional digitalization and corporate ESG performance. J. Clean. Prod. 2024, 473, 143503. [Google Scholar] [CrossRef]
  29. Ahmadova, G.; Delgado-Márquez, B.L.; Pedauga, L.E.; Leyva-de la Hiz, D.I. Too good to be true: The inverted U-shaped relationship between home-country digitalization and environmental performance. Ecol. Econ. 2022, 196, 107393. [Google Scholar] [CrossRef]
  30. Barney, J.B. Firm Resources and Sustained Competitive Advantage. Adv. Strateg. Manag. 1991, 17, 3–10. [Google Scholar] [CrossRef]
  31. Porter, M.E.; Heppelmann, J.E. How Smart, Connected Products Are Transforming Companies. Harv. Bus. Rev. 2014, 92, 24. [Google Scholar]
  32. Atzori, L.; Iera, A.; Morabito, G. The Internet of Things: A survey. Comput. Netw. 2010, 54, 2787–2805. [Google Scholar] [CrossRef]
  33. Lee, J.; Kao, H.-A.; Yang, S. Service Innovation and Smart Analytics for Industry 4.0 and Big Data Environment. Procedia CIRP 2014, 16, 3–8. [Google Scholar] [CrossRef]
  34. Davenport, T.H.; Ronanki, R. Artificial Intelligence for the Real World. Harv. Bus. Rev. 2018, 96, 108–116. [Google Scholar]
  35. Philip Chen, C.L.; Zhang, C.-Y. Data-intensive applications, challenges, techniques and technologies: A survey on Big Data. Inf. Sci. 2014, 275, 314–347. [Google Scholar] [CrossRef]
  36. IEA. Capturing the Multiple Benefits of Energy Efficiency: A Guide to Quantifying the Value Added; IEA: Paris, France, 2014.
  37. Xu, J.; She, S.; Liu, W. Role of digitalization in environment, social and governance, and sustainability: Review-based study for implications. Front. Psychol. 2022, 13, 961057. [Google Scholar] [CrossRef]
  38. Belkhir, L.; Elmeligi, A. Assessing ICT global emissions footprint: Trends to 2040 & recommendations. J. Clean. Prod. 2018, 177, 448–463. [Google Scholar] [CrossRef]
  39. Zhou, Z.; Chen, X.; Li, E.; Zeng, L.; Luo, K.; Zhang, J. Edge Intelligence: Paving the Last Mile of Artificial Intelligence with Edge Computing. Proc. IEEE 2019, 107, 1738–1762. [Google Scholar] [CrossRef]
  40. Healy, P.M.; Palepu, K.G. Information asymmetry, corporate disclosure, and the capital markets: A review of the empirical disclosure literature. J. Account. Econ. 2001, 31, 405–440. [Google Scholar] [CrossRef]
  41. Pfeffer, J.; Salancik, G.R. The external control of organizations: A resource dependency perspective. Econ. J. 1979, 23. [Google Scholar]
  42. Eccles, R.G.; Newquist, S.C.; Schatz, R. Reputation and Its Risks. Harv. Bus. Rev. 2007, 85, 104–114. [Google Scholar] [PubMed]
  43. Fombrun, C.; Shanley, M. What’s in a Name? Reputation Building and Corporate Strategy. Acad. Manag. J. 1990, 33, 233–258. [Google Scholar] [CrossRef]
  44. Stefano, V.D. The Rise of the “Just-in-Time Workforce”: On-Demand Work, Crowdwork, and Labor Protection in the “Gig Economy”. Comp. Labor Law Policy J. 2016, 37, 461–471. [Google Scholar] [CrossRef]
  45. Bessen, J. AI and Jobs: The Role of Demand. SSRN Electron. J. 2017. [Google Scholar] [CrossRef]
  46. Zuboff, S. The Age of Surveillance Capitalism: The Fight for a Human Future at the New Frontier of Power; Public Affairs: New York, NY, USA, 2019; 704p. [Google Scholar]
  47. Cowgill, B.; Dell’Acqua, F.; Deng, S.; Hsu, D.; Verma, N.; Chaintreau, A. Biased Programmers? Or Biased Data? A Field Experiment in Operationalizing AI Ethics. In Proceedings of the 21st ACM Conference on Economics and Computation, Virtual, 13—17 July 2020; pp. 679–681. [Google Scholar]
  48. Eubanks, V. Automating Inequality: How High-Tech Tools Profile, Police, and Punish the Poor; Picador, St Martin’s Press: New York, NY, USA, 2018. [Google Scholar]
  49. Brynjolfsson, E.; McAfee, A. The Second Machine Age: Work, Progress, and Prosperity in a Time of Brilliant Technologies; W.W. Norton & Company: New York, NY, USA, 2014. [Google Scholar]
  50. Montag, C.; Duke, É.; Markowetz, A. Toward Psychoinformatics: Computer Science Meets Psychology. Comput. Math. Methods Med. 2016, 2016, 2983685. [Google Scholar] [CrossRef] [PubMed]
  51. Porter, M.E.; Kramer, M.R. Strategy and society: The link between competitive advantage and corporate social responsibility. Harv. Bus. Rev. 2006, 84, 78–92. [Google Scholar] [PubMed]
  52. Freeman, R.E. Strategic Management: A Stakeholder Approach; Cambridge University Press: Cambridge, UK, 2010. [Google Scholar]
  53. Greenwood, M. Stakeholder Engagement: Beyond the Myth of Corporate Responsibility. J. Bus. Ethics 2007, 74, 315–327. [Google Scholar] [CrossRef]
  54. Jensen, M.C.; Meckling, W.H. Theory of the firm: Managerial behavior, agency costs and ownership structure. J. Financ. Econ. 1976, 3, 305–360. [Google Scholar] [CrossRef]
  55. Yoo, Y.; Boland, R.; Lyytinen, K.; Majchrzak, A. Organizing for Innovation in the Digitized World. Organ. Sci. 2012, 23, 1398–1408. [Google Scholar] [CrossRef]
  56. Tapscott, D.; Tapscott, A. Blockchain Revolution: How the Technology Behind Bitcoin Is Changing Money, Business, and the World; Portfolio: New York, NY, USA, 2016. [Google Scholar]
  57. Bertsimas, D.; Kallus, N. From Predictive to Prescriptive Analytics. Manag. Sci. 2019, 66, 1005–1507. [Google Scholar] [CrossRef]
  58. Alles, M. Drivers of the Use and Facilitators and Obstacles of the Evolution of Big Data by the Audit Profession. Account. Horiz. 2015, 29, 150227132233004. [Google Scholar] [CrossRef]
  59. Gratton, L. The Shift: The Future of Work Is Already Here; HarperCollins: London, UK, 2013. [Google Scholar]
  60. Grover, V.; Chiang, R.H.L.; Ting-Peng, L.; Zhang, D. Creating Strategic Business Value from Big Data Analytics: A Research Framework. J. Manag. Inf. Syst. 2018, 35, 388–423. [Google Scholar] [CrossRef]
  61. Wamba, S.F.; Gunasekaran, A.; Akter, S.; Ren, S.J.-f.; Dubey, R.; Childe, S.J. Big data analytics and firm performance: Effects of dynamic capabilities. J. Bus. Res. 2017, 70, 356–365. [Google Scholar] [CrossRef]
  62. O’Rourke, D. Market Movements: Nongovernmental Organization Strategies to Influence Global Production and Consumption. J. Ind. Ecol. 2005, 9, 115–128. [Google Scholar] [CrossRef]
  63. Kim, S.-Y.; Reber, B.H. Public relations’ place in corporate social responsibility: Practitioners define their role. Public Relat. Rev. 2008, 34, 337–342. [Google Scholar] [CrossRef]
  64. Ananny, M.; Crawford, K. Seeing without knowing: Limitations of the transparency ideal and its application to algorithmic accountability. New Media Soc. 2018, 20, 973–989. [Google Scholar] [CrossRef]
  65. Citron, D.; Pasquale, F. The scored society: Due process for automated predictions. Wash. Law Rev. 2014, 89, 1–33. [Google Scholar]
  66. Gasser, U.; Almeida, V.A.F. A Layered Model for AI Governance. IEEE Internet Comput. 2017, 21, 58–62. [Google Scholar] [CrossRef]
  67. Jin, X.; Zuo, C.; Fang, M.; Li, T.; Nie, H. Measurement Problem of Enterprise Digital Transformation: New Methods and Findings Based on Large Language Model. Econ. Res. J. 2024, 59, 34–53. (In Chinese) [Google Scholar]
  68. Chen, L.; Zhu, C.; Zhong, Z.; Wang, C.; Li, Z. Radial position control for magnetically suspended high-speed flywheel energy storage system with inverse system method and extended 2-DOF PID controller. IET Electr. Power Appl. 2020, 14, 71–81. [Google Scholar] [CrossRef]
  69. Yuan, C.; Xiao, T.; Geng, C.; Sheng, Y. Digital Transformation and Division of Labor between Enterprises: Vertical Specialization or Vertical Integration. China Ind. Econ. 2021, 137–155. (In Chinese) [Google Scholar] [CrossRef]
  70. Chen, Y.; Fan, Z.; Gu, X.; Zhou, L.-A. Arrival of Young Talent: The Send-Down Movement and Rural Education in China. Am. Econ. Rev. 2020, 110, 3393–3430. [Google Scholar] [CrossRef]
  71. Xiao, T.; Sun, R.; Yuan, C.; Sun, J. Digital Transformation, Human Capital Structure Adjustment and Labor Income Share. J. Manag. World 2022, 38, 220–237. (In Chinese) [Google Scholar] [CrossRef]
  72. Wu, F.; Hu, H.; Lin, H.; Ren, X. Enterprise Digital Transformation and Capital Market Performance: Empirical Evidence from Stock Liquidity. J. Manag. World 2021, 37, 130–144. (In Chinese) [Google Scholar] [CrossRef]
  73. Qi, H.; Cao, X.; Liu, Y. The Influence of Digital Economy on Corporate Governance: Analyzed from Information Asymmetry and Irrational Behavior Perspective. Reform 2020, 04, 50–64. (In Chinese) [Google Scholar]
  74. Marjani, M.; Nasaruddin, F.; Gani, A.; Karim, A.; Hashem, I.A.T.; Siddiqa, A.; Yaqoob, I. Big IoT Data Analytics: Architecture, Opportunities, and Open Research Challenges. IEEE Access 2017, 5, 5247–5261. [Google Scholar] [CrossRef]
  75. Choi, T.-M.; Wallace, S.W.; Wang, Y. Big Data Analytics in Operations Management. Prod. Oper. Manag. 2018, 27, 1868–1883. [Google Scholar] [CrossRef]
  76. Wang, Y.; Kung, L.; Byrd, T.A. Big data analytics: Understanding its capabilities and potential benefits for healthcare organizations. Technol. Forecast. Soc. Change 2018, 126, 3–13. [Google Scholar] [CrossRef]
  77. Lyubich, E.; Shapiro, J.; Walker, R. Regulating Mismeasured Pollution: Implications of Firm Heterogeneity for Environmental Policy. Am. Econ. Assoc. Pap. Proc. 2018, 108, 136–142. [Google Scholar] [CrossRef]
  78. Chen, Z.; Chen, Q. Energy Efficiency of Chinese Firms: Heterogeneity, Influencing Factors and Policy Implications. China Ind. Econ. 2019, 78–95. [Google Scholar] [CrossRef]
  79. Lin, B.; Du, K. Understanding Changes in China’s Energy Intensity: An Integrated Decomposition Framework. J. World Econ. 2014, 37, 69–87. [Google Scholar] [CrossRef]
  80. Song, S.; Cao, S.; Yang, K. Investor Attention and IPO Anomalies—Evidence from Google Trend Volume. Econ. Res. J. 2011, 46, 145–155. (In Chinese) [Google Scholar]
  81. Li, X.; Gu, Z.; Xu, Y. The Impact of Public Environmental Appeals on Enterprise Pollution Emissions: Micro Evidence from Baidu Environmental Search. J. Financ. Econ. 2022, 48, 34–48. (In Chinese) [Google Scholar] [CrossRef]
  82. Li, Y.; Zheng, M. Internal control and corporate risk-taking: Evidence from Chinese manufacturing firms. Econ. Res. J. 2022, 57, 102–119. [Google Scholar]
  83. Yang, R.; Liu, B.; Sun, T. Internal governance and green investment: A study based on the DIB Internal Control Index. Ecol. Econ. 2021, 37, 112–120. [Google Scholar]
Figure 1. Mechanism pathways for enterprise digitalization’s impact on ESG dimensions.
Systems 13 00832 g001
Figure 2. Flow chart of data processing.
Systems 13 00832 g002
Figure 3. Structure of BERT representation learning model based on contrastive learning.
Systems 13 00832 g003
Figure 4. Schematic diagram of token cutoff.
Systems 13 00832 g004
Figure 5. Structure of end-to-end binary classification deep learning network based on the cross-attention mechanism.
Systems 13 00832 g005
Figure 6. Results of hyperparameter optimization.
Systems 13 00832 g006
Figure 7. Model fine-tuning process.
Systems 13 00832 g007
Table 1. Examples from annual reports: Comparison between keyword frequency and LLM-based identification.
No.Concrete ExampleRelated NotesWord Frequency AnalysisLarge Language Model
1One is to create a new model of smart procurement.Although this statement does not directly state that the subject object is a ‘company’, it can be inferred that it is about a company.YesYes
2In the future, rehabilitation medical equipment will be integrated with intelligent sensors, IoT, big data and other technologies, and develop in the direction of intelligence.This statement is about the industry product, not the ‘company’, and while it does mention digital technology, it is not talking about the company’s digitalization.YesNo
3Peer companies, facing fierce market competition, have been utilizing digital technology to improve production processes and enhance internal productivity.This statement describes ‘competitors,’ not the company’s digitalization.YesNo
4In July 2017, the State Council released the New Generation AI Development Plan, setting goals and strategies to make China a global AI leader by 2030. The plan outlines a three-step strategy to advance AI theory, technology, and application, aiming to establish China as a major innovation hub and drive a smart economy and society.This statement describes state policy, and is not talking about corporations.YesNo
Table 2. Confusion matrix of the test set.
Predicted
PositiveNegative
ActualPositive1528
Negative7833
Table 3. Performance analysis of models.
ModelsPrecision (%)Recall (%)Accuracy (%)F1-Score (%)
Ours95.694.598.595.1
ChatGLM(6B)90.891.293.490.9
BERT_base_Chinese85.684.388.584.9
SVM81.378.783.380.0
Word Frequency 65.468.275.866.8
Table 4. Variable definitions.
CategorySymbolVariableDescription or Estimation Method
Dependent VariableEsgESG performanceScore from Sino-Securities measuring overall ESG performance
EnvEnvironmental responsibilityEnvironmental component of the ESG performance score
SocSocial responsibilitySocial Responsibility component of the ESG performance score
GovCorporate governanceGovernance component of the ESG performance score
Independent VariableDigitalEnterprise digitalizationThe natural logarithm of the count of sentences related to digitalization in annual reports, incremented by one
Control VariablesSizeEnterprise sizeThe natural logarithm of total annual enterprise assets
FirmAgeFirm ageThe natural logarithm of the difference between the current year and the firm’s founding year, incremented by one
LiquidCurrent ratioTotal current assets as a percentage of total current liabilities
FixedFixed asset ratioNet fixed assets as a percentage of total assets
ROAReturn on assetsNet profit as a percentage of average balance of assets
CashflowCash flow ratioNet cash flows from operating activities as a percentage of total assets
DualDuality of COB and CEO1 if the roles of Chairman and General Manager are combined, 0 otherwise
Top10Ownership centralizationPercentage of shares held by the top 10 shareholders relative to total shares
Table 5. Descriptive statistics of study variables.
VariablesNMeanSDMinMax
Esg20,64073.0005.30256.65084.150
Env20,64060.5807.54745.61080.540
Soc20,64074.8609.58547.080100.000
Gov20,64078.5107.06552.47090.890
Digital20,6401.8911.1280.0004.454
Size20,64022.3501.32919.71027.070
FirmAge20,6402.9560.3042.0793.555
Liquid20,6402.3462.2680.30316.410
Fixed20,6400.2070.1580.001460.682
ROA20,6400.0390.067−0.2730.228
Cashflow20,6400.04810.0671−0.1780.250
Dual20,6400.2740.4460.0001.000
Top1020,64057.71014.93023.24090.840
Table 6. Benchmark regression results.
Variables(1)(2)(3)(4)(5)
EsgEsgEnvSocGov
Digital0.342 ***0.223 ***0.154 **0.379 ***0.248 ***
(0.054)(0.054)(0.070)(0.095)(0.079)
Size 1.004 ***0.900 ***1.689 ***0.734 ***
(0.086)(0.115)(0.146)(0.126)
FirmAge −1.467 *−1.0382.080−4.472 ***
(0.776)(1.067)(1.345)(1.105)
Liquid 0.115 ***−0.005−0.142 ***0.332 ***
(0.022)(0.028)(0.037)(0.036)
Fixed −0.4601.109 *−1.486 *−0.415
(0.480)(0.603)(0.861)(0.718)
ROA 4.056 ***−2.559 ***3.904 ***8.312 ***
(0.673)(0.752)(1.039)(1.061)
Cashflow −0.4391.577 **−0.685−1.505 *
(0.543)(0.675)(0.982)(0.816)
Dual 0.0560.025−0.0570.188
(0.105)(0.137)(0.179)(0.161)
Top10 −0.002−0.005−0.0080.013 *
(0.005)(0.006)(0.008)(0.007)
Constant72.343 ***54.268 ***43.294 ***31.205 ***73.106 ***
(0.106)(2.889)(3.952)(4.942)(4.115)
Firm FEYesYesYesYesYes
Year FEYesYesYesYesYes
N20,40420,40420,40420,40420,404
Adjusted R20.5240.5310.5860.5450.445
Note: Robust standard errors in parentheses, *** p < 0.01, ** p < 0.05, and * p < 0.1.
Table 7. Endogeneity test using the instrumental variable approach.
Variables(1) IV-1(2) IV-2
DigitalEsg
Digital_IV 2.091 ***
(0.707)
IV12.939 *
(6.850)
Control variablesYesYes
Firm FEYesYes
Year FEYesYs
N20,64020,640
Adjusted R20.7800.115
Note: Robust standard errors in parentheses, *** p < 0.01, * p < 0.1.
Table 8. Robustness test for replacing the core independent and explained variables.
Variables(1)(2)(3)(4)
CRNDS_EsgEsgEsgEsg
Digital0.419 ***
(0.089)
Digital1 0.469 ***
(0.060)
Digital2 0.346 ***
(0.062)
Digital3 1.817 ***
(0.210)
Control variablesYesYesYesYes
Firm FEYesYesYesYes
Year FEYesYesYesYes
N20,40420,32820,32820,404
Adjusted R20.6660.5340.5330.533
Note: Robust standard errors in parentheses, *** p < 0.01.
Table 9. Robustness tests involving adjustments to clustering approaches, addition of high-dimensional fixed effects, and sample exclusions.
Variables(1)(2)(3)(4)(5)
Industry LevelCity–Industry LevelTime–
Industry
City–
Industry
Excluding Some Samples
Digital0.466 ***0.466 ***0.459 ***0.365 ***0.240 ***
(0.077)(0.067)(0.042)(0.046)(0. 057)
Control variablesYesYesYesYesYes
Firm fixed effectYesYesNoNoYes
Year fixed effectsYesYesNoYesYes
Industry–time fixed effectsNoNobeNoNo
City–industry fixed effectsNoNoNoYesNo
N20,64020,64020,62920,53216,922
Adjusted R20.1770.1770.1930.3490.5423
Note: Robust standard errors in parentheses, *** p < 0.01.
Table 10. Heterogeneity analysis focusing on firm size and ownership type.
Variables(1) Small Scale(2) Large Scale(3) NSOEs(4) SOEs
EsgEsgEsgEsg
Digital0.198 **0.318 ***0.146 **0.264 ***
(0.090)(0.073)(0.073)(0.083)
Control variablesYesYesYesYes
Firm fixed effectYesYesYesYes
Year fixed effectsYesYesYesYes
N900411,07112,2987565
Adjusted R20.5250.5430.5140.583
Note: Robust standard errors in parentheses, *** p < 0.01, ** p < 0.05.
Table 11. Mechanism test results.
Variables(1)(2)(3)(4)
EUEPCMSIC
Digital15.615 **0.046 ***0.023 ***5.188 ***
(7.152)(0.010)(0.007)(1.858)
Control variablesYesYesYesYes
Firm fixed effectYesYesYesYes
Year fixed effectsYesYesYesYes
N20,40420,40419,91020,404
Adjusted R20.9030.8340.76860.3967
Note: Robust standard errors in parentheses, *** p < 0.01, ** p < 0.05.
Disclaimer/Publisher’s Note: The statements, opinions and data contained in all publications are solely those of the individual author(s) and contributor(s) and not of MDPI and/or the editor(s). MDPI and/or the editor(s) disclaim responsibility for any injury to people or property resulting from any ideas, methods, instructions or products referred to in the content.