Article

A PDCA-Based Decision-Making Framework for Sustainable Marketing Communication Strategies: A Case Study of a Slovak Telecommunications Company

by
Miroslava Řepová
,
Lucie Lendelová
* and
Viliam Lendel
Faculty of Management Science and Informatics, University of Žilina, 010 26 Žilina, Slovakia
*
Author to whom correspondence should be addressed.
Systems 2025, 13(8), 721; https://doi.org/10.3390/systems13080721
Submission received: 1 July 2025 / Revised: 12 August 2025 / Accepted: 19 August 2025 / Published: 21 August 2025

Abstract

With the rapid development of technology, an increasingly competitive environment, and evolving consumer behaviour, the use of modern marketing tools has become a key challenge for companies of various types (manufacturing, providing services, sports organizations, universities, etc.). Although sustainable digital communication methods are gaining prominence, existing research often focuses merely on describing communication trends without providing decision-making frameworks for strategy optimisation. This paper addresses this gap by mapping the current state of marketing communication strategies among large telecommunication companies in Slovakia and assessing their impact on customer behaviour and market position. Data were analysed through a combination of qualitative and quantitative research methods, including document analysis, annual reports, surveys, and personal observations. One enterprise was selected for detailed data analysis. The results confirm a significant relationship between the use of communication channels and the company’s market position, brand popularity, and the strong influence of employee recommendations. Unlike previous studies, which predominantly describe marketing communication trends and tools, this research integrates the evaluation of communication strategy effectiveness with a systematic management decision-making model based on the PDCA (Plan-Do-Check-Act) continuous improvement cycle. This approach enables continuous optimisation of sustainable communication strategies and provides actionable managerial guidance for improving resource allocation, market position, and organisational adaptability in dynamic market environments.

1. Introduction

The current marketing environment is changing rapidly due to digitalisation, the growing need for sustainability, and shifting customer behaviour, putting pressure on companies to effectively adapt their communication strategies. Today, the marketing strategy primarily focuses on meeting customers’ evolving expectations and needs, which have been shaped by exposure to numerous daily stimuli and the vast range of available options. With globalisation, customer competition has also intensified, forcing companies to adjust to the shifting business environment [1].
Despite this, many organisations continue to rely on traditional communication channels to promote their products and services. Modern marketing communication not only promotes products or services and explains their features but also involves actively seeking customer feedback, assessing satisfaction levels, and responding to customer needs and requirements [2]. The Internet has become an integral part of everyday life, and digital and social media marketing is increasingly popular. Customers increasingly spend time in the online space through their mobile devices, tablets, and laptops. This way of communication has become a relatively inexpensive and effective way to reach their target customers, and most businesses have moved to the online space. Through social networks and social media, organisations reach out to and build relationships with both new and existing customers, creating common virtual communities that serve to recognise problems and bring solutions by joining forces [3,4]. Companies that interact with their customers on social networks increase customer satisfaction and loyalty. These customers become brand advocates, recommending the brand and sharing their positive experiences, which has the effect of building a strong brand in the market [5]. The major challenge for businesses in marketing communications is to connect with potential and existing customers across all these electronic devices in real time and create campaigns that work effectively across social media, digital advertising, and e-commerce [6]. The continuing development in information and communication technology generates a large amount of data that influences decision-making processes in various areas of organisational management, highlighting the necessity of using big data [7]. These changes have contributed to the need to implement new trends in marketing communication strategy. A key indicator of modern marketing communication trends is how companies respond to negative feedback. A study comparing negative comments on social networks found that large companies often censor or ignore negative feedback rather than leveraging it as an opportunity for improvement [8]. While modern marketing trends are emerging, traditional marketing tools still have their place in the strategies of individual companies. Companies need to identify and decide which elements to integrate into their strategy and which investments appear to be more effective. This marketing communication investment efficiency can have an impact on the company’s financial stability and economic sustainability. These data can be reflected in financial health and indicators such as profitability and indebtedness, which, however, may be contradictory [9]. Various models can be used to assess financial health, such as creditworthiness models [10], and to provide this information, along with an evaluation of wealth performance through financial reporting [11]. This can influence managers’ decision-making regarding marketing costs. Responsible financial management has an impact not only on a company’s economic sustainability but also reduces the risk of negative effects on local government budgets or the country’s overall financial stability [12]. Large telecommunications companies invest significant resources in marketing communications, but it is unclear whether these investments meet customer needs and lead to a strengthening of their market position. The research problem of this study, therefore, is the question of the effectiveness of using modern communication tools in sustainable marketing within the telecommunications sector. The telecommunications market is one of the most dynamic sectors, with a wide range of customers that cover almost the entire Slovak market. It also exhibits a relatively significant and rapid implementation of technologies and trends, which is why the telecommunications market seems to be the most ideal choice for research in the field of marketing communication strategy.
Previous studies have examined communication trends in large companies across various countries. Some have focused on communication strategy [13], utilising a new trend in marketing and communication in the service sector [14] in Slovakia [15,16], a lot of articles are currently dealing with communication of sustainability and social responsibility [17,18,19,20] or the impact of communication on image, reputation and brand loyalty [21]. Although professional literature predominantly covers marketing trends and individual tools, there remains a lack of studies focusing on decision-making processes in large companies within this specific sector and using a systematic approach to evaluate and optimise these processes. Furthermore, many of these studies are older and were often published before the COVID–19 pandemic, and do not reflect the changes that this period brought to the customer’s purchasing behaviour and the way of communication. During the pandemic, most communication shifted to online platforms, and this trend continues to dominate today. New marketing trends have emerged, rendering some previously established approaches less effective.
The contribution of this study is the proposal of a practical decision-making model based on the PDCA (Plan-Do-Check-Act) continuous improvement cycle, which enables companies to effectively evaluate and adjust their marketing communication based on real data and customer feedback. These outputs are based on mapping the current state of marketing communication strategies among large telecommunication companies in Slovakia and an analysis of the relationship between marketing communication approaches and market position, as well as customers’ expectations. The results of this study offer specific recommendations for enhancing communication strategies, bolstering competitiveness, and achieving sustainable growth in a dynamic market environment. Despite numerous studies describing current trends in marketing communication, a clear and practically applicable model that would systematically connect empirical customer data with companies’ decision-making processes and enable their continuous improvement is still lacking. This article attempts to fill this gap by using a measurable framework based on the PDCA cycle, which connects theoretical insights with concrete managerial recommendations.

2. Literature Review

2.1. Marketing Communication in Large Telecommunication Companies

Marketing and marketing communications are essential for all firms, regardless of size, particularly for the sake of competitiveness. However, in large companies, these processes are often more formalised compared to those of smaller businesses. According to recent research, marketing is more effective and efficient when a firm possesses high expertise, strong overall quality, a lower degree of specialisation, and a high degree of flexibility and adaptability [22]. Marketing departments in large companies typically have a larger budget and better access to electronic communications mix tools. These include electronic media (radio or TV), print media (magazines and newspapers), direct mail, telemarketing, public relations, web or in-person sales, and other methods. An essential part of marketing communication is choosing the right tool and crafting a relevant message that the organisation wants to convey to the selected segment or target audience. This problem is typical when marketing communication is not integrated [23,24]. Integrated marketing communication refers to how individual organisations communicate with their customers and potential customers, delivering the desired experience and conveying a unified message through a variety of tools that work together. As a result, the various marketing communication tools function as a cohesive system to maximise cost-effectiveness rather than operating in isolation [25]. Traditional marketing remains relevant and is most often used in the form of television commercials and print advertisements [26]. According to some authors, it is essential to replace traditional transactional marketing with a focus on building relationships and fostering interactions [27]. Frey [28] predicts that the use of traditional media such as television and radio will gradually decline. According to him, web, email, and mobile marketing will continue to rise and will be more effective than television advertising. However, he emphasises that traditional media still play a key role in increasing brand awareness and enhancing brand image. Compared to traditional media channels, online advertising offers numerous advantages [29]. According to Kotler and Armstrong [30], more than half of a company’s advertising budget should be allocated to non-traditional communication tools, particularly social media. Additionally, mobile communication became the most rapidly developing segment [31].
Telecommunication providers hold a specific position in the market. This sector is relatively closed and can be characterised as a dynamic and complex system. Management decision-making in a communication strategy is influenced by several factors that interact with one another. These factors include technological developments, market competition, and changes in customer expectations. Companies operating in European Union countries face many challenges in terms of regulatory measures aimed at making their business more customer-oriented [32]. At the same time, there is increasing pressure on companies in this sector to behave in a socially responsible manner, a need to incorporate CSR activities into marketing capabilities, and a demonstrable impact of CSR on customer behaviour [33]. Customers in the telecommunication sector prefer large providers to small operators because of the higher level and continuity of services [34]. Different companies in this industry employ various business models in response to the rapidly evolving telecommunications industry, which necessitates regular evaluation and refinement of business focus to maintain market share [35]. The management decision-making system operates based on recurring decision-making cycles, resulting in the activity and setting of the marketing communication mix, as well as the subsequent generation and evaluation of the set strategy. Maintaining competitiveness and market position in such an environment is highly challenging, and the key is an approach to decision-making that views it as a complex, cyclical system. Market analysis and the use of appropriate marketing communication tools are essential for selecting the right strategy to achieve an effective and sustainable systematic approach.

2.2. Marketing Communication Mix

Communication mix tools are most commonly categorised as personal (e.g., direct marketing, personal communication) and non-personal (e.g., advertising), or via traditional media (e.g., TV, radio, outdoor, or print) and online media (e.g., social media, mobile, or online advertising). Each type of communication has its strengths and weaknesses. In the services sector, different communication approaches are used depending on the target audience. Non-personal communication is more effective for positioning a service and increasing brand awareness. It has also been shown that the content of advertising matters, for example, impressive, memorable, and creative advertising has an impact on purchasing behaviour, whereas understandable, appealing, and honest advertising does not [36]. In contrast, personal communication is more effective for persuading customers to make a purchase and for conveying complex service-related information. Direct marketing plays an important role in the post-encounter phase, as it is a highly cost-effective method of encouraging customer loyalty, prompting customers to recommend the service to others (e.g., family and friends), and motivating them to return. In contrast, the influence of social media on customer purchasing behaviour and its importance in brand management were also demonstrated [37]. Online communication currently appears to be a fast and effective way to communicate with customers and stakeholders [38]. The classification of communication mix tools for a specific service sector, as outlined by Wirtz [39], along with the particular tools in each category, is presented in Table 1.
To evaluate the success of marketing communication and the effectiveness of its message, it is necessary to compare the volume of purchases made with the intensity and cost associated with disseminating that message. Feedback can be addressed through market research, sales volume analysis, or other relevant indicators. However, during the evaluation process, external factors such as competitors’ campaigns or other distractions—collectively referred to as noise—may interfere and distort the perceived effectiveness of communication [40]. One of the key indicators of successful communication and innovation implementation is customer satisfaction [41,42]. Customer satisfaction and loyalty, in turn, have a positive impact on the organisation’s profitability and competitiveness [43,44]. However, employee satisfaction and internal marketing have a significant impact on customer satisfaction in the telecommunications services sector. It has been demonstrated that remuneration, internal communication, and vision have the most significant impact on employee satisfaction, while training and development opportunities have the least significant effect [45]. A combination of traditional and digital communication channels appears to be the most effective form. The necessity of understanding the target market and thoroughly analysing it has also been proven. Communication mix preference is closely related to age, which managers must consider in their decision-making process [46].

2.3. Decision-Making in Sustainable Communication Marketing

The rapid development of society, along with advances in information technology, has also led to a shift in the business environment. The transition from traditional to modern marketing communication has been one of the significant developments in marketing theory over the past decade. The increased use of the Internet and mobile phones has also contributed to reducing the costs associated with marketing communications [47]. Traditional tools (TV, radio, print) are largely one-way and focused on disseminating brand messages, whereas modern digital tools enable two-way engagement, personalisation, and customer co-creation. Contemporary marketing strategies increasingly rely on online advertising, including search engine promotions, banner ads, or PPC advertising, as well as social media platforms such as Instagram, Facebook, or TikTok. Businesses also have the option of establishing a corporate YouTube channel or leveraging influencer marketing to capitalise on influencers’ reach and audience engagement. According to research, up to 88% of customers place more trust in this form of promotion than in corporate communication [48]. According to Dwivedi [49], digital communication channels—especially social media and mobile platforms—enable brands to build trust and interaction to an extent that traditional tools cannot match. The theory of integrated marketing communication (IMC) remains a relevant strategic framework; however, its application has evolved to incorporate data-driven personalisation, content marketing, and real-time feedback through digital platforms [50]. Lagrosen [27] argues that service-based companies benefit most from combining traditional trust-building tools (TV, PR) with interactive channels that support customer relationship management, a hybrid model supported by customer-centric digital transformation frameworks. For telecommunications companies, where customer retention and brand value are key performance indicators, an effective combination of integrated marketing communications (IMC) and digital engagement is essential. Recent studies confirm that customers respond more positively to integrated campaigns that align content, tone, and value propositions across multiple platforms [51,52]. Despite higher costs, traditional media still play a key role in mass awareness, especially among older demographics. However, growing evidence suggests that social media engagement, influencer marketing, and interactive customer experiences yield higher returns on investment and more substantial brand value among younger, digitally native consumers [5,53].
Another critical aspect of decision-making in sustainable marketing management is addressing society-wide issues. According to Bačuvčík [54], corporate social responsibility activities can also be considered a new tested tool or tactic in the communication mix. At the same time, the communication of CSR activities enables the involvement of interested stakeholders and facilitates a dialogue with them [55,56]. Information is often presented on company websites or social networks, but its inclusion on mobile applications is also effective. Engaging companies in such CSR activities has a positive impact not only on customers, who change their purchasing behaviour, but also on future employees, and it improves the company’s image.
While many studies focus on describing trends, comparing traditional and modern communication tools, or discussing their advantages and disadvantages, a systematic, decision-making-oriented approach to the development and optimisation of communication strategies remains unexplored. One of the methodologies used in decision-making in sustainable marketing management is Lean management, based on the PDCA cycle. While widely used in quality management, its application in marketing decision-making remains underexplored. PDCA represents a strategic approach to improving the effectiveness of customer acquisition and retention processes. It means a continuous cycle of improvement that allows adjustments and optimisations to be made based on the acquisition and analysis of results [57]. The PDCA cycle, also known as the Deming cycle, is proposed as a four-step quality improvement sequence—plan, do, check, act—presented in Figure 1 [58].
As shown in Figure 1, PDCA is a continuous process; the first step is based on analysing and evaluating the current existing situation and identifying opportunities for improvement and plan (Plan), and the second step is based on implementing and testing the idea (Do), the third step is based on analysing the results and learning (Check), and next step evaluate the effectiveness of changes and effect on improvement, and its application on a large scale or revise [58]. The PDCA cycle is effective in various areas, including manufacturing [59,60,61], the non-profit sector, sports organisations, universities, and services [62]. On the other hand, Kaplan and Norton introduced a measurement system based on four perspectives: financial, customer, internal, innovation and learning. In all approaches to strategies, it is essential to make decisions based on the right choice of relevant data [63]. Data-driven decision-making is a key approach in creating strategic marketing communication. The combination of the PDCA cycle and inbound marketing has proven to be an effective strategy for attracting and retaining customers [57]. The effectiveness of the PDCA cycle has also been demonstrated in the context of strategic decision-making by managers transitioning their enterprises to a service-providing model, thereby simplifying the complex process of such a transformation [64]. In the service sector, the PDCA cycle is used precisely for collecting and evaluating feedback [65]. This application of the PDCA cycle in a marketing environment, therefore, appears to be an effective decision-making tool for managers and for building customer relationships.

2.4. Research Objectives and Hypothesis

Based on the literature reviewed, it is evident that while numerous studies have addressed the role and effectiveness of various communication tools, relatively few have examined the decision-making processes behind optimising communication strategies, particularly in the telecommunications sector. Furthermore, the integration of structured decision-making frameworks, such as the PDCA cycle, in marketing communication management remains underexplored in both academic and applied research. This study addresses this research gap by analysing the decision-making processes in large telecommunication enterprises and proposing a PDCA-based decision-making model to support sustainable and flexible communication strategy management in rapidly changing market conditions.
As literature and previous research have shown, the development of technology and innovation has significantly increased the scope for using digital tools in marketing communication. The effect of social media use on brand management and purchasing behaviour is well documented [37], and it is closely linked to effective communication with stakeholders, as shown in earlier studies [38].
RQ1: What is the impact of social media use and online marketing activities on brand perception and position?
Based on the previous findings, the following hypothesis is formulated for the Slovak telecommunication market.
H1. 
A higher average monthly engagement rate on social media increases a company’s market share.
The upward trend in digital communication tools is undeniable. However, research also confirms the ongoing influence of traditional communication tools [46], particularly advertising [36]. Given this context, it is essential to examine the relationship between advertising investment and market performance.
RQ2: Is the level of investment in advertising linked to a higher market share for telecommunications companies in Slovakia?
H2. 
The higher the annual advertising investment the higher the company’s annual percentage market share.
Previous studies have explored how various communication channels affect purchasing decision-making, including advertising [36], digital communication channels [37], and employee recommendations [45].
RQ3: Which marketing communication channels have the most significant influence on customers’ purchasing decisions?
H3. 
Employee recommendations have a greater influence on purchasing decisions than television advertising.
Although the literature suggests that age influences preferences for communication channels, other factors also play a role, which remain underexplored.
RQ4: Which marketing communication channels do customers prefer most?
H4. 
More than 50% of customers prefer direct personal communication channels over impersonal when making purchasing decisions.
For better clarity, the research questions and hypotheses, including null hypotheses, are summarised in Table 2.
The formulation of these research questions and hypotheses is grounded in a theoretical background and previous studies. The findings resulting from their empirical verification will serve as a basis for providing managerial recommendations and for developing a decision-making model tailored to marketing strategy in the Slovak telecommunications market.

3. Materials and Methods

3.1. Research Procedure, Problem, Research Questions and Hypothesis

This article examines the current marketing communication strategies employed by major telecommunication service providers in Slovakia. The Slovak telecommunication market is relatively closed, consisting of only four major players with substantial investments in marketing communications. However, the question arises as to whether these resources and activities are efficient and how companies can proceed with implementing modern methods of communication to strengthen their market position.
The research problem in this study is the effective use of modern marketing communication trends to improve market position, as illustrated through a case study of the four largest telecommunication providers in Slovakia. This study aims to provide practical guidance, processes and recommendations for optimising the communication mix tools used by telecommunication providers based on the collected data.
The research focuses on the four largest providers and consists of two phases. The first phase involves collecting qualitative data, while the second phase involves collecting quantitative data. All phases include phases of management decision-making—strategic, analytical and implementation. Each phase was assigned research questions, hypotheses, and methods of data collection and statistical evaluation. JASP software version 0.95.0 [66] was used to verify and calculate the statistics. A brief overview of the research methodology is presented in Table 3.
Descriptive statistics were used as a supporting method of statistical data collection in both phases. This method is used to summarise data by describing the relationship between variables in a sample or population. Calculating descriptive statistics is the first step in research [67].
Each hypothesis is operationalized through specific measurable indicators: H1 examines the correlation between the level of engagement on social networks and market share; H2 works with the amount of advertising investment (in EUR) and market share; H3 and H4 are verified through a questionnaire survey and tested using the chi-square test and the binomial test.
The decision to apply the PDCA cycle as a key research framework is based on its proven effectiveness in the field of continuous improvement and systematic decision-making. In this study, the PDCA model provides a repeatable process that allows companies to evaluate and adjust their marketing communication strategies in response to real data.

3.2. First Phase of Research

The first part consists of an analysis of the communication mix tools used, their costs, and a comparison of the activities within the organisations mentioned above, particularly in online communication, to assess their effectiveness. A mixed-methods approach was applied to analyse this aspect. This approach combines qualitative and quantitative data, which are collected and processed within a single research study. It enables the integration of elements from various factors, including data collection, analysis, and evaluation methods. The primary goal of this method is to provide a comprehensive understanding of the issue, encompassing both depth and breadth [68].
The information obtained through qualitative research was used to define the market position. Qualitative research was chosen as it is the most suitable method for creating or testing a research theory that contributes to the body of knowledge. The research results can describe how and why the world operates in a particular way [69,70]. Qualitative data were gathered from existing surveys, annual reports, and company websites. The data was analysed through content analysis. The content analysis aimed to provide further explanation and explore the content of the annual reports, focusing on how each organisation directs its communication towards customers, the activities it undertakes, and the modern trends it employs in its communication. The goal was also to use existing surveys to determine the organisation’s position in the customer’s mind and, based on the interviews, to define areas that customers consider necessary. These areas have the most significant impact on customer satisfaction, highlighting areas where dissatisfaction is most prevalent. Based on the collected data, it was possible to identify potential critical points in communication and customer satisfaction, as well as to assess the market position and the possible reasons behind it. The quantitative data also supported this part of the research. The information consisted of document collection, analysis, and evaluation, along with personal observation. The numerical data was obtained from previously conducted surveys, companies’ annual reports, and monitoring social media activities via Zoomsphere [71], assessing the potential impact of these activities on the company’s market position. Based on quantitative data, it is possible to verify the claim that the use of modern marketing communication trends has an impact on the market position of large telecommunications companies and their customer perception.
The output of this part of the research is a comparison of the largest telecommunication service providers and their marketing communication based on combined data from qualitative and quantitative research. The collected data included the marketing communication costs of individual companies operating in the industry, as well as their effective expenditure, and a comparison of their social media activities. It also covered the content of their marketing communication and data characterising their market position and customer perception. Using the collected data and deductive reasoning, it was possible to identify the relationship between specific activities and the company’s market position and its image. Based on the results of the first phase of the research, which compared the marketing communications of the four leading telecommunications operators in Slovakia, Slovak Telekom was selected for a more detailed analysis in the second phase. The selection of this company was based on a combination of quantitative and qualitative indicators—specifically, lower communication effectiveness about costs incurred, relatively low customer ratings on social networks, and low user engagement compared to competitors. The selection of this company was, therefore, purposeful and deliberately aimed at identifying communication shortcomings in a company with a high budget but lower impact, thereby enabling a deeper understanding of potential weaknesses and the formulation of targeted recommendations. Slovak Telekom a.s. (or predecessors under other names) has been operating in Slovakia since 1990 as the first mobile operator and also became a pioneer in building the fixed-line branch of the telecommunications sector by purchasing a stake in the state-owned company Slovenské Telekomunikácie and later taking over the company. At the same time, the company has the largest share of its transmitters and is expanding its coverage. It is highly rated in quality assessments and invests in infrastructure and technology development, which gives it a significant competitive advantage. Despite this dominant position, strong history, and position in the minds of customers, the company is gradually declining, which appears to be a shortcoming in its communication strategy. The first phase, utilising the mixed method, provided an overview and context of the issue, while the second phase aimed to verify and supplement the findings through a questionnaire survey. Qualitative and quantitative methods were deliberately combined to complement each other and enable a more comprehensive understanding of the issue under investigation. The qualitative part, which included content analysis of annual reports, monitoring of social media activity, and personal observation, served to identify key areas where communication processes may have room for improvement. These findings were then used to design a questionnaire survey which made it possible to quantitatively verify hypotheses about the relationship between social media activity, marketing budget utilization, and customer perception of the brand.
A comparison of basic data on investments in marketing communications, social media activities, and the level of interaction between the analysed telecommunications companies is provided in this methodological section to give the reader context before interpreting the results. The description of the basic data will be further used as a basis for testing hypotheses in the Results section, which focuses exclusively on the presentation of statistical results, their interpretation, and discussion of the degree to which the presented hypotheses are confirmed or refuted.
H1 and H2 were subjected to statistical verification in this section. Spearman’s and Pearson’s correlation coefficients were used to verify H1 and H2. Spearman’s correlation coefficient is a non-parametric statistical method that measures the strength of the relationship between two variables. Pearson’s correlation analysis assumes the existence of a linear relationship between variables [72].

3.3. Secondary Data Collection and Analysis

On the social platform Facebook, Orange Slovakia is one of the most followed telecommunications operators, with a global following of 30,055,722. However, it has the lowest engagement in terms of comments compared to other operators. O2, also ranking third in the number of followers, generates the highest level of interaction with the company’s posts, which is reflected in its rise to second place as the largest telecommunications operator. Slovak Telekom is the only company that displays customer ratings, achieving a rating of 1.6 out of 5 based on 1335 ratings. For their advertising campaigns, companies collaborate with influencers from various fields and age groups, ensuring greater diversity in their outreach. A comparison of social media activity, based on custom processing using Zoomsphere [72], is presented in Table 4.
In 2023, KPMG conducted a survey to assess customer satisfaction with individual brands in the Slovak market. Customers identified personalisation, integrity, and problem-solving as the most important factors influencing their satisfaction, followed by expectations, time and effort, and empathy. Key factors shaping the customer experience include the swift and efficient resolution of issues and genuine concern for their individual needs. No telecommunications operator ranked among the top fifty most popular brands. A total of ten sectors were analysed, with the telecommunications sector placing ninth. The most popular brand was 4 ka, which customers particularly appreciated for its affordable prices and clear communication. The company also made improvements in areas such as empathy and managing customer expectations [73].
Advertising expenditures and rankings based on Kantar Media [74] are presented in Table 5.
In sector comparisons for 2022, telecommunications ranked sixth among the largest TV advertisers. Within the telecommunications sector, Orange Slovensko held the leading position. Despite lower advertising expenditures, O2 became the second-largest operator in Slovakia among all communications operators, surpassing Slovak Telekom, which fell to third place.
Companies are also engaged in socially responsible activities. In the area of sustainable activities, companies are striving to reduce their carbon footprint, minimise emissions and waste, and promote separate waste collection and water conservation. Additionally, companies are working to reduce paper waste by embracing digitalisation. They regularly inform their stakeholders about these activities through annual reports.

3.4. Second Phase of Research

The primary research aimed to determine the level of effectiveness of the communication mix tools used and their impact on the target customers. Based on the results from qualitative research, one company was selected for further quantitative research, as it appeared to be spending its marketing communication resources least efficiently. Quantitative research involves the collection of quantifiable data, their analysis, and interpretation using a logical method focused on theory verification [75]. This approach relies on empirical evaluation based on numerical measurements [76]. In this study, the questionnaire survey method was used. The questionnaire method was chosen as the most suitable approach because it is a versatile and effective tool for data collection. In a standardised and structured format, it facilitates the collection of necessary data and is cost-effective, accessible, and capable of reaching a vast population while also efficiently gathering complex information [77]. The questionnaire was created based on the recommendations of Kuphanga [77]. Key aspects included clearly defined objectives, a structured format, logically arranged questions, a mix of open and closed questions, and clarity and simplicity of wording. Another recommendation was to pilot test to clarify ambiguities and ensure a representative sample. Ethical aspects such as respondents’ anonymity and voluntary participation were upheld throughout the research. Additionally, the questionnaire’s structure adhered to the guidelines for marketing research survey design and reliability.
The baseline sample consisted of 592 respondents, with data obtained from the organisation’s internal database. The criteria for inclusion were that the respondents were active users of services and existing customers of Slovak Telekom who had engaged in an activity at one of the company’s sales points within six months before the survey. The survey was carried out among customers of one of the company’s brick-and-mortar stores. The research employed the questionnaire method, and customers were contacted in person, by phone, or via the online survey tool Survio.com accesed on 25 February 2022. The survey was conducted from 25 February 2022 to 15 March 2022. The questionnaire primarily consisted of multiple-choice questions.
The representative sample consisted of 186 respondents, with a 90% confidence level and a 5% margin of error. A total of 150 completed questionnaires were returned, resulting in a return rate of 81%, with 90% confidence and a 5% margin of error. 54% of men and 46% of women aged 18 and older participated in the survey (43% of respondents were aged 36 to 55). The results are presented in graphs in the following section of the article for a clearer overview.
H3 and H4 were subjected to statistical verification in this section. The chi-square test of independence was used to verify H3. This test represents a non-parametric statistical test and is based on using contingency tables to analyse categorical data and its frequencies and counts [78]. A binomial test was used to test H4. This test is a parametric hypothesis test used when research samples are divided into two distinct groups or classes [79].
Each phase of data collection directly corresponds to the hypotheses: social media engagement data supports H1, advertising spend data supports H2, and survey responses regarding customer preferences address H3 and H4. This clear connection ensures that the empirical results can be directly interpreted in the context of the initial research objectives.

3.5. Reliability and Validity of the Study

To ensure the reliability and validity of the study, several steps were taken:
Internal validity: The research sample consisted exclusively of active customers from the company. A prerequisite for participation in the survey was customer account activity, defined as the activation or renewal of a service within the past six months. The questionnaire was pretested on a small sample to identify potential ambiguities and ensure clarity. Additionally, triangulation was employed by comparing self-reported data with social media engagement analytics and secondary reports.
External validity: The research sample was designed to represent active customers of a primary telecommunication provider. Various demographic factors, including age, gender, education, and income, were considered in the selection process, with customer activity serving as a key criterion, as it reflects their interest in telecommunications services. The approach ensured that the sample mirrored the composition of customers across different operators, thereby enhancing the generalizability of findings to the Slovak telecommunications sector.

4. Results

4.1. Analysis of the Communication Mix Tools Used by the Largest Telecommunication Service Providers in Slovakia

Based on the procedures outlined in the previous section of the Methodology, data were collected to compare the investment of individual companies in their marketing communication, their social media activity, and the results of brand popularity surveys. From the obtained data, we can analyse the relationship between variables and the competitive positions of the companies within the industry. This section presents a comparison of their activities and the efficiency of the resources allocated to them. A clear comparison of key indicators, such as the number of followers, engagement rate and advertising expenditure allows us to understand the starting position of the analysed company Slovak Telekom, in comparison with competitors.
Notably, Slovak Telekom’s advertising costs accounted for nearly half of its profit in 2022. Table 6 presents a descriptive analysis of enabled data.
Spearman’s and Pearson’s correlation statistical methods were chosen to address RQ1 and RQ2, and to verify H1 and H2. This method was selected based on similar research that examined the relationship between advertising expenditure and the influence of competitors on decision-making, as well as the impact on a company’s market value [80]. It should be noted that the correlation analysis was performed based on data from only four companies, which significantly limits the possibility of generalising the results. Statistical conclusions should, therefore, be understood as indicative and limited in their interpretation. The correlation value suggests a potential trend rather than a causal relationship, and the results should be further verified using a larger data sample or across multiple markets.
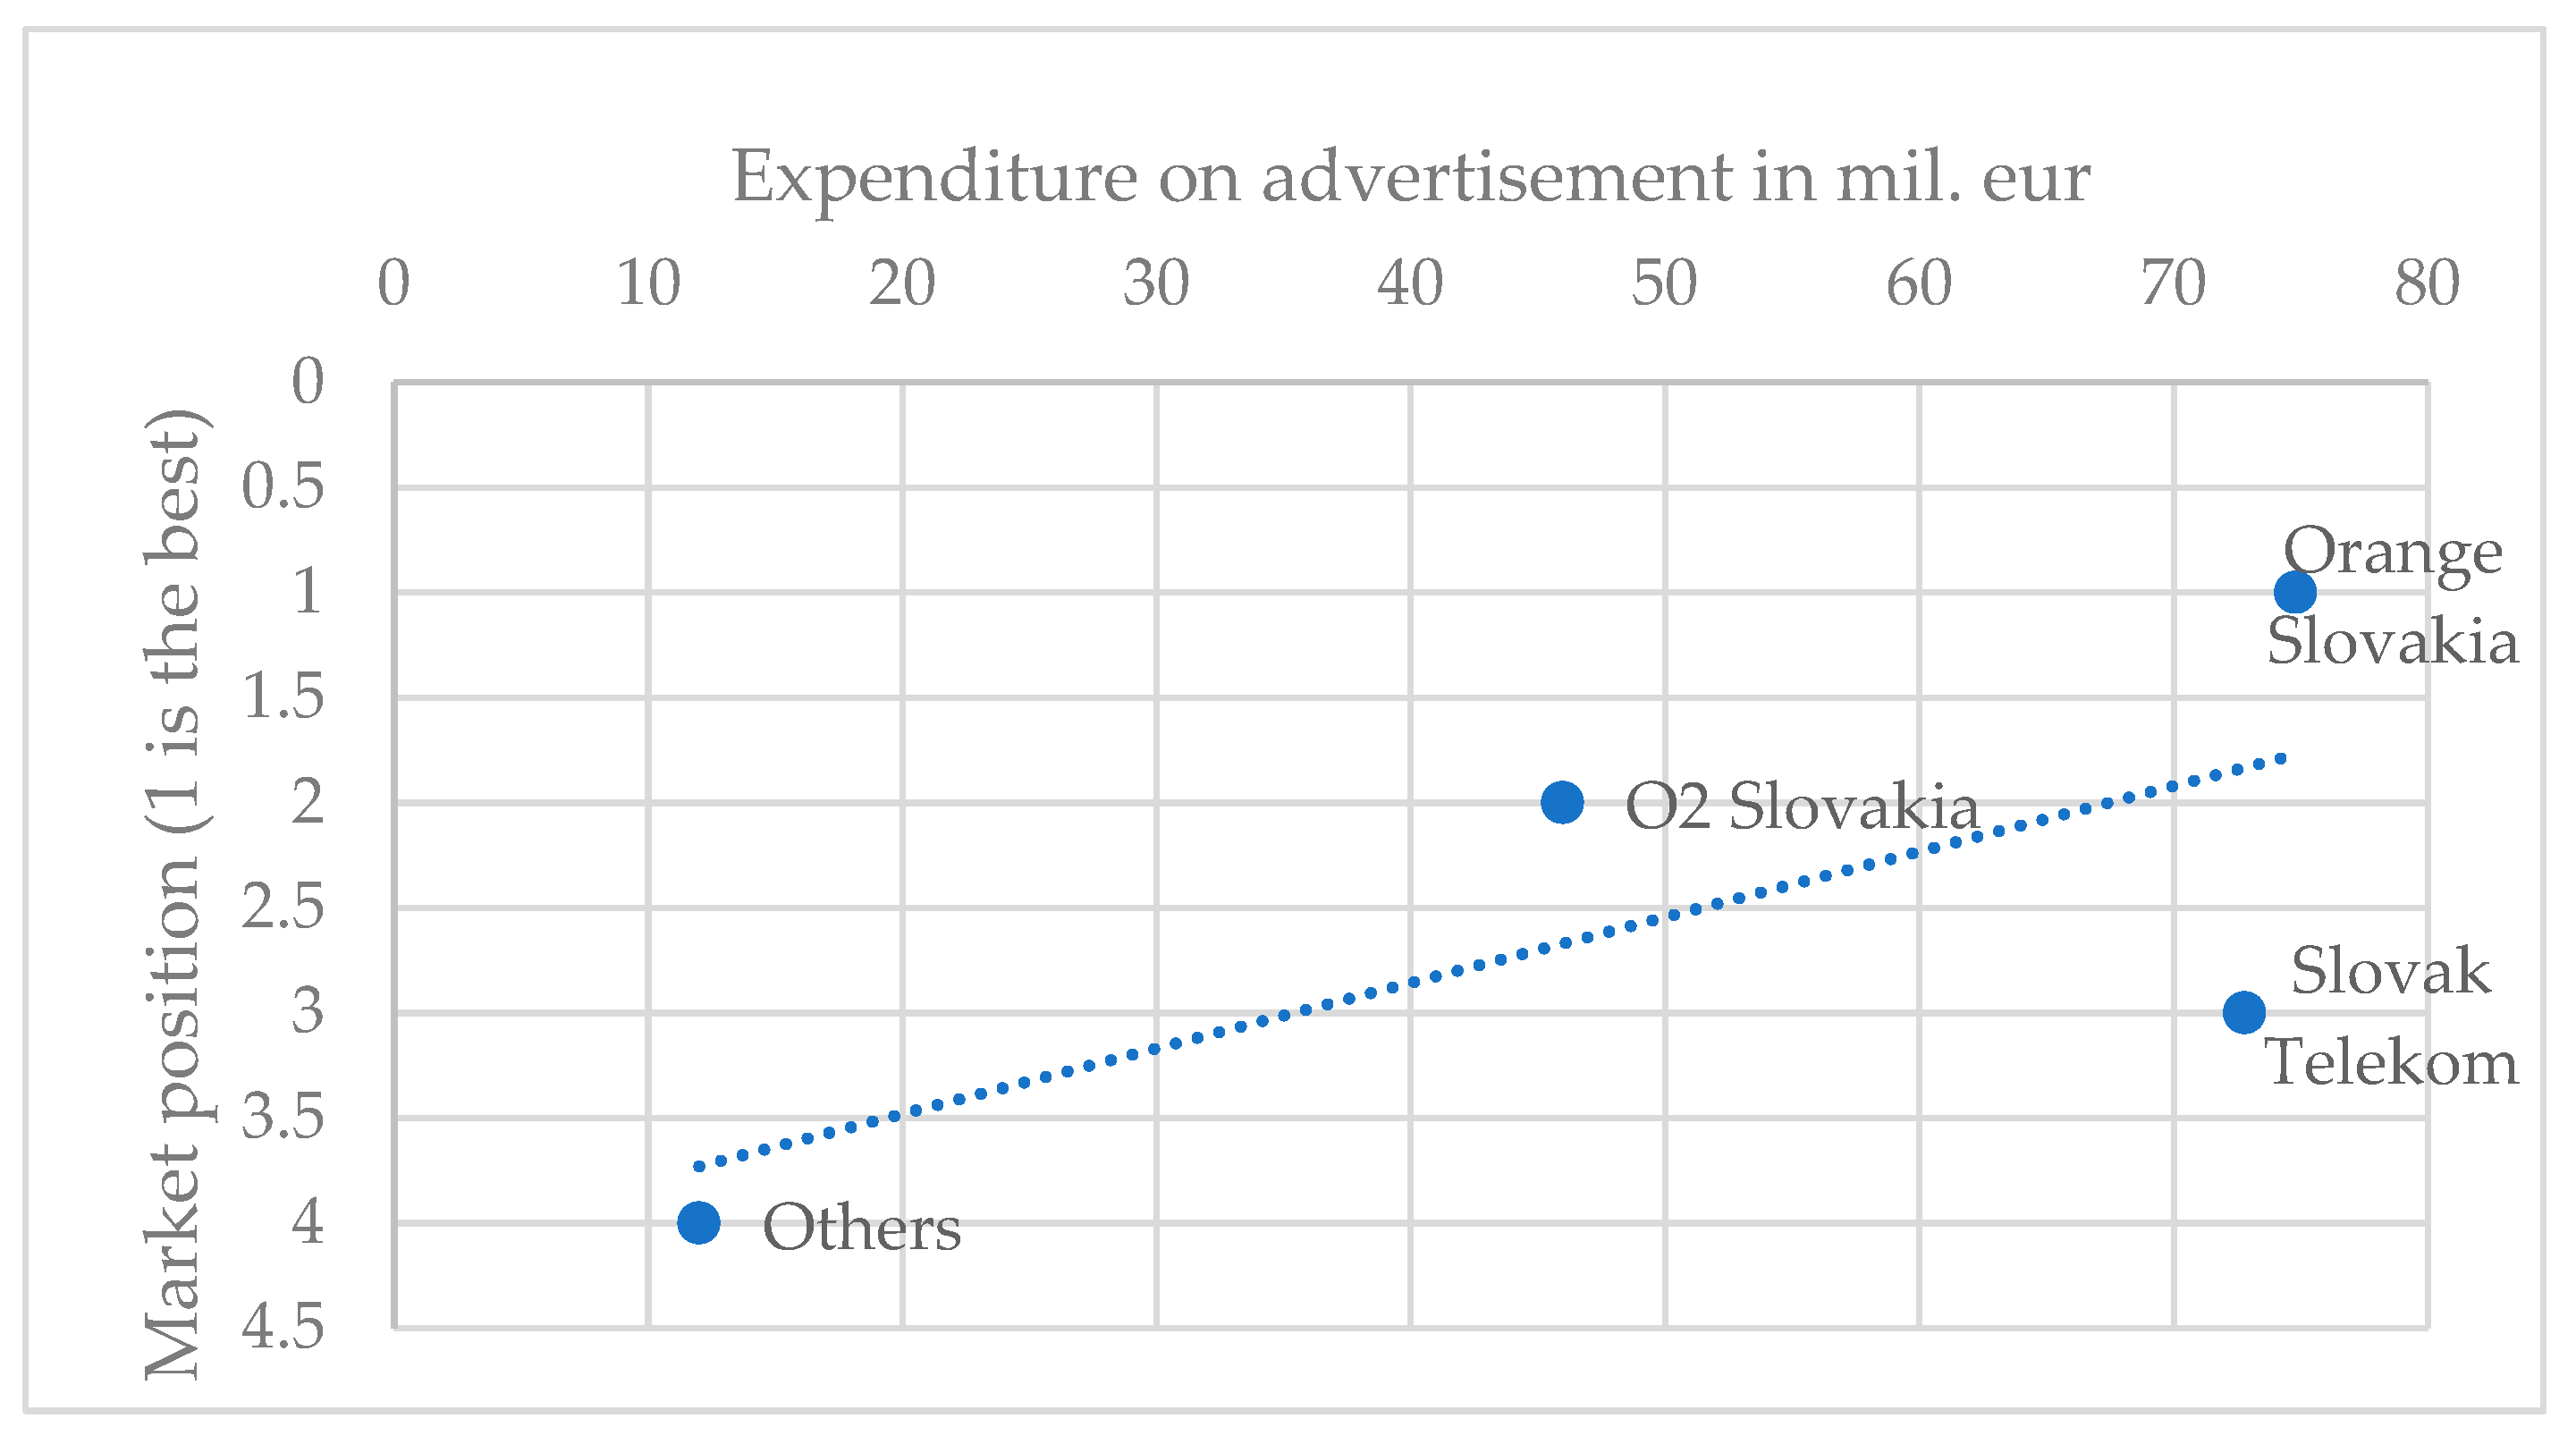
Based on Spearman’s correlation calculation between rankings based on expenditure on advertisements and market position, the resulting value was rho = 0.8 with a p-value of 0.333, which confirms a robust correlation between the amount of investment and market position. Pearson’s correlation was r = 0.800 and p-value = 0.200, indicating a linear correlation. The correlation between advertising expenditure and market position falls within a 95% confidence interval of [−0.509, 0.998], indicating high uncertainty due to the small sample size. Similarly, Spearman’s rho coefficient value of 0.800 should be supplemented by an effect size estimate or a significance test, even though the p-value is not statistically significant (p > 0.05). However, since the confirmation of the hypothesis is limited to only four companies, the results cannot be generalised; however, they can be used to indicate a trend.
Figure 2 illustrates the relationship between advertising investment and the market position of individual companies. It is clear that despite the high expenditure of Orange and Slovak Telekom, their market positions differ, suggesting that the effectiveness of campaigns is not only a question of budget but also of channel selection and communication content. Notably, O2 achieved second place with significantly lower spending, highlighting the effective use of modern tools and technologies.
RQ2 aims to examine the online activities of the analysed companies in more detail, including their adoption of modern digital trends, and to compare their effectiveness in achieving long-term sustainability. H2 verifies the relationship between the number of interactions on social networks and the market position of the analysed companies. Spearman’s and Pearson’s correlations were used to verify H2, which, in previous studies, was also used to verify the relationship between interactions on social networks and brand image and market position [81]. Parson’s r = −0.800, p-value = 0.200. Spearman’s rho = −0.800, p-value 0.333. The negative sign of Pearson’s correlation coefficient (−0.800) indicates an inverse relationship between the two variables, specifically, between the level of interaction on social networks and the company’s market position. This value can be interpreted as indicating that a higher number of interactions is associated with a lower market position, which is likely due to the more active use of social networks by smaller or newer players in the market who are attempting to establish their brands through digital communication.
Based on the evaluation of the current situation, a clear relationship can be observed between advertisement, social media communication, a company’s market position, and brand popularity. This may be due to the age composition of customers. Although these companies have a broad customer base across different age groups, the Slovak population is ageing. However, traditional media still play an essential role, and their combination with modern tools and digital technologies can lead to greater efficiency, especially for companies with a diverse customer base across various age groups. For new or smaller companies, however, it appears more effective to utilise tools tailored to their target audience. For younger age groups, this means more frequent and interactive communication on social networks. Companies that prioritise online communication, engage with customers on social networks, and actively interact with their audience tend to strengthen their market position and increase brand popularity, even with lower marketing communication costs. Thus, efficient allocation of resources to marketing communication can positively influence both a company’s market position and brand image.

4.2. The Result of a Questionnaire Survey Focused on the Influence of Communication Channels on the Customers of the Selected Company

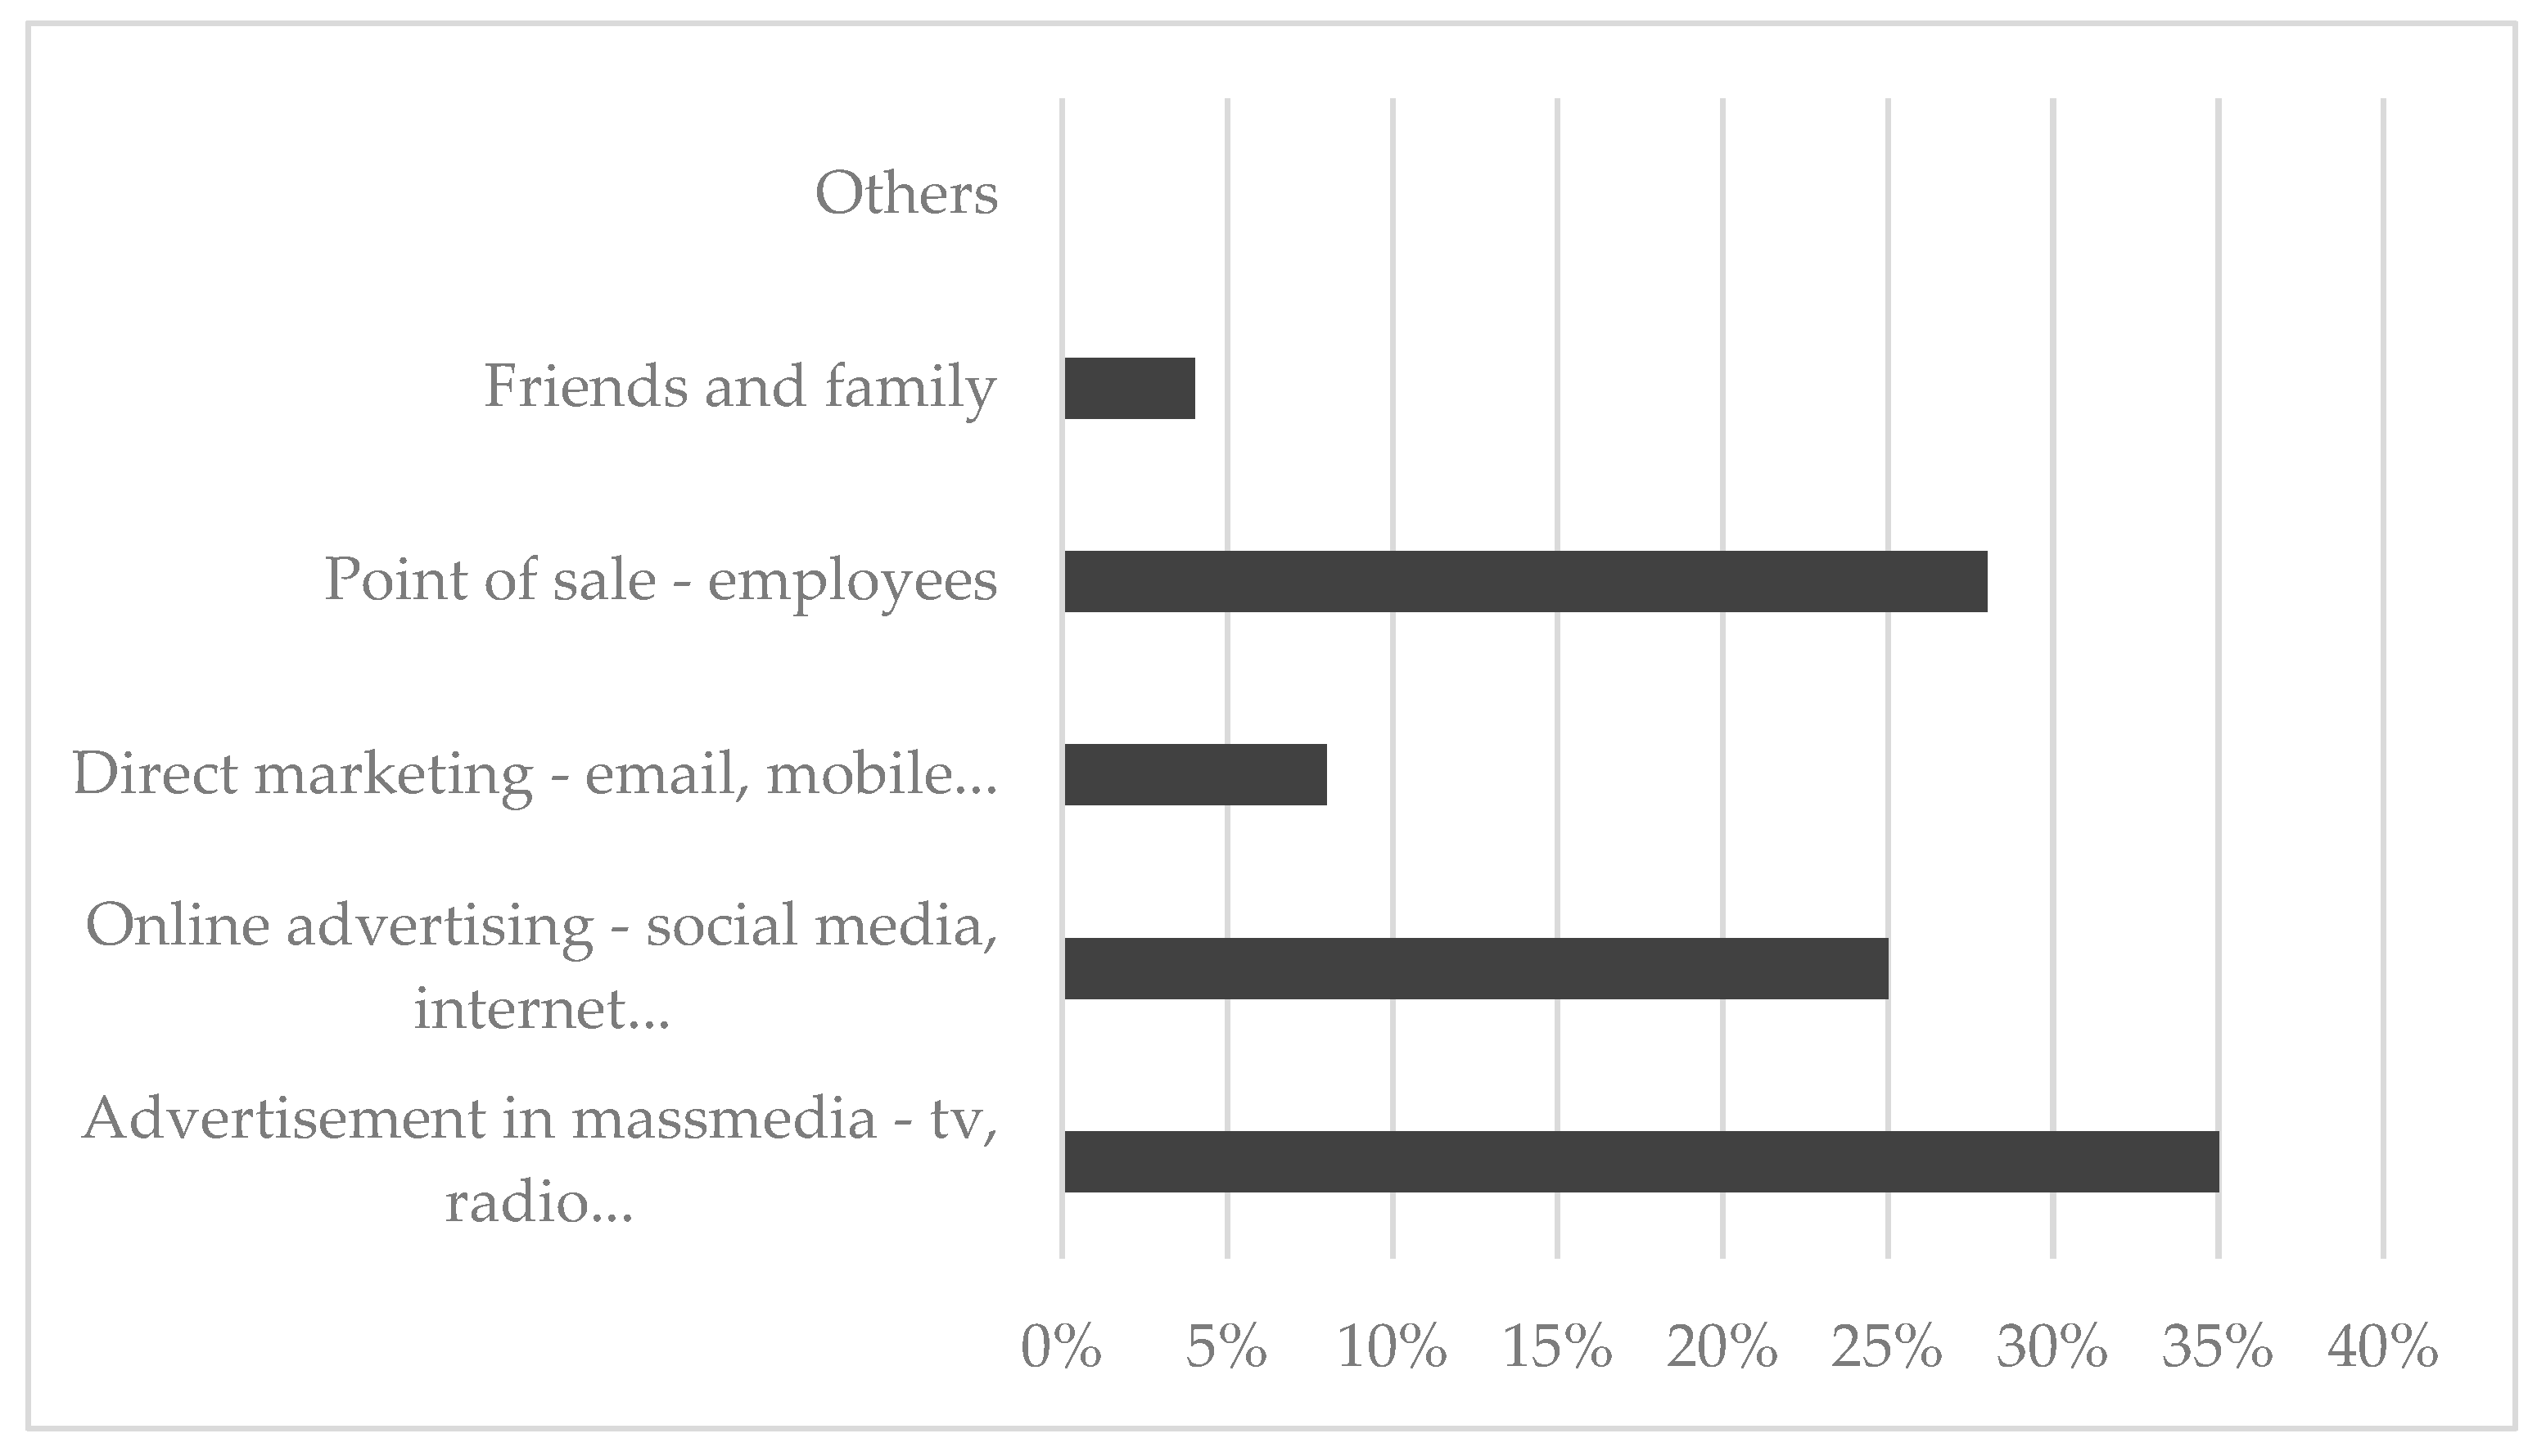
In the questionnaire survey, 35% of respondents indicated that they most frequently obtain information about goods and services through advertising communication in the media. The second-highest share, 28%, reported gathering information at the point of sale from company employees. Twenty-five per cent of respondents stated that they most often encounter information through advertising on the Internet and social media networks. Communication via phone or email had a smaller share, with only 8% of respondents selecting this option, while 4% indicated that they obtain information through referrals from friends and family. None of the respondents selected the “Other” option. A graphical representation of the responses to the question of how respondents most often find out about the company’s offering is presented in Figure 3.
The responses indicated that customers are primarily influenced by advertising in mass media. This may be attributed to the fact that Slovak Telekom is the most widely used TV service provider in the market, with the majority of customers relying on its services. Another possible explanation is the age distribution of the respondents, with the most significant portion of the sample (up to 43%) being individuals aged 36–55. It can be inferred that if a greater proportion of the sample had been younger, this trend would likely have decreased, as younger people tend to favour streaming platforms such as Voyo and Netflix, whose popularity increases every year.
Up to 60% of customers obtain information about the company’s current offers or promotions through advertising, whether in the media or on the Internet and social networks. Additionally, 28% of respondents reported learning about products from staff at the point of sale. Responses to the survey revealed that 52% of respondents stated that recommendations from company employees influence their purchasing decisions.
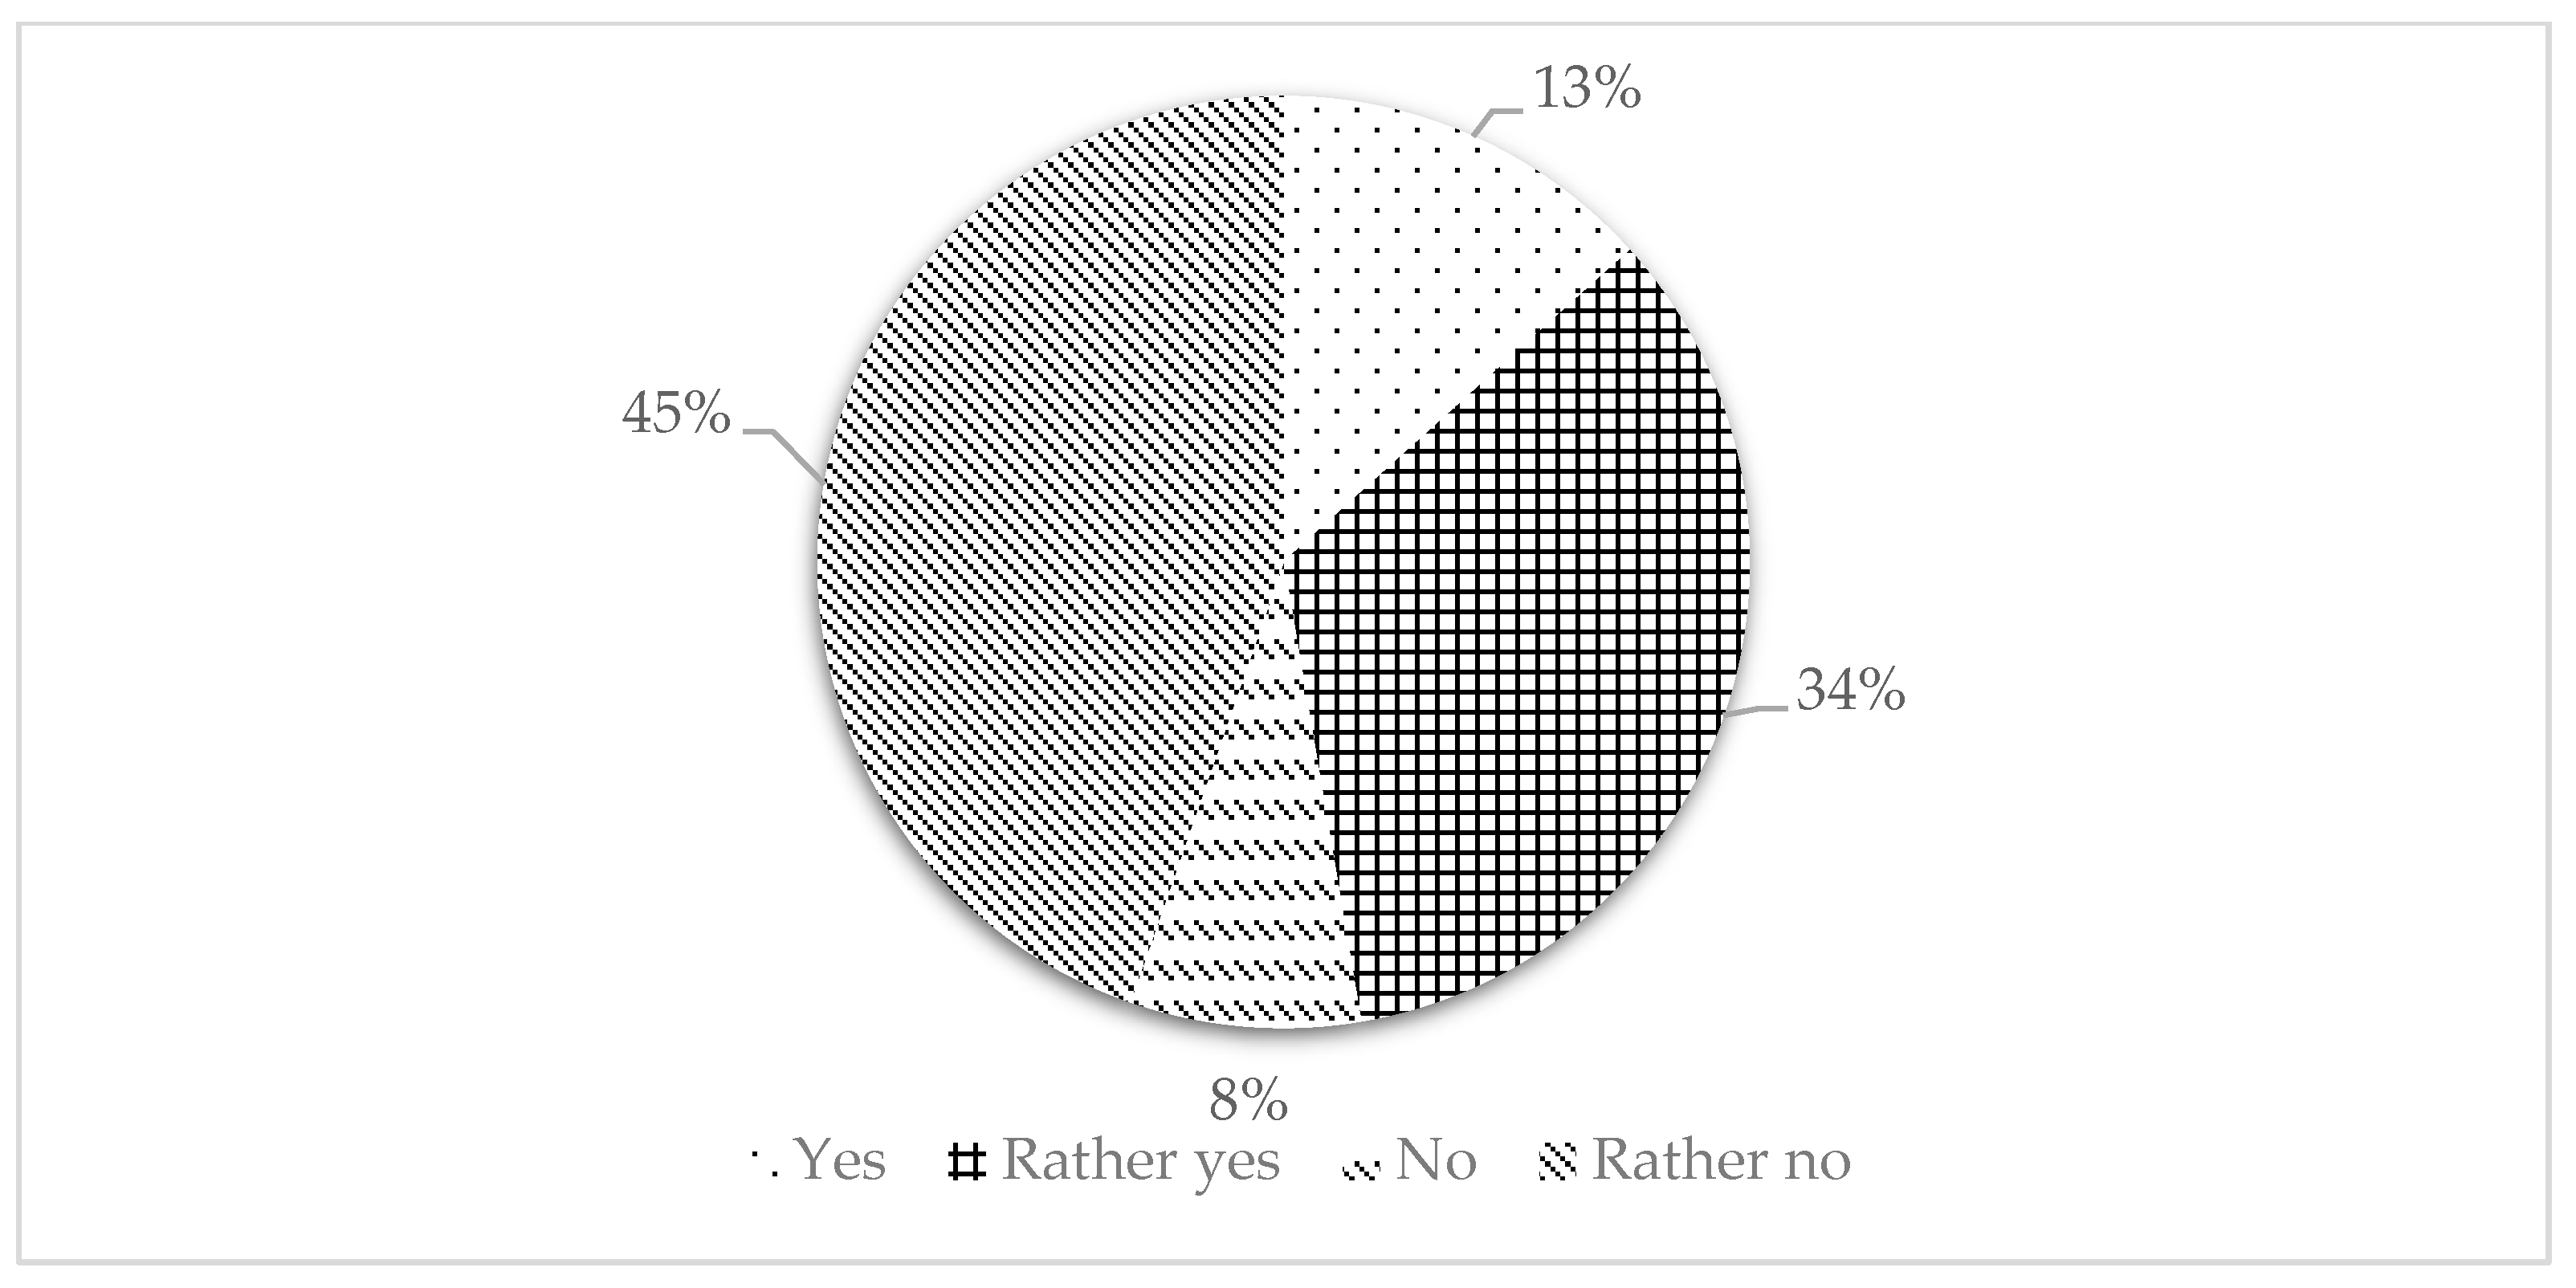
Figure 4 presents a graphical representation of the responses to the question regarding the influence of employees’ behaviour and information on customers’ decision-making. The results indicate that recommendations from company employees influence up to 62% of customers’ purchasing decisions. This suggests that while marketing communication tools do not necessarily guarantee a purchase decision, employees still exert a significant influence on it. However, the marketing mix tools related to services are not the focus of this thesis.
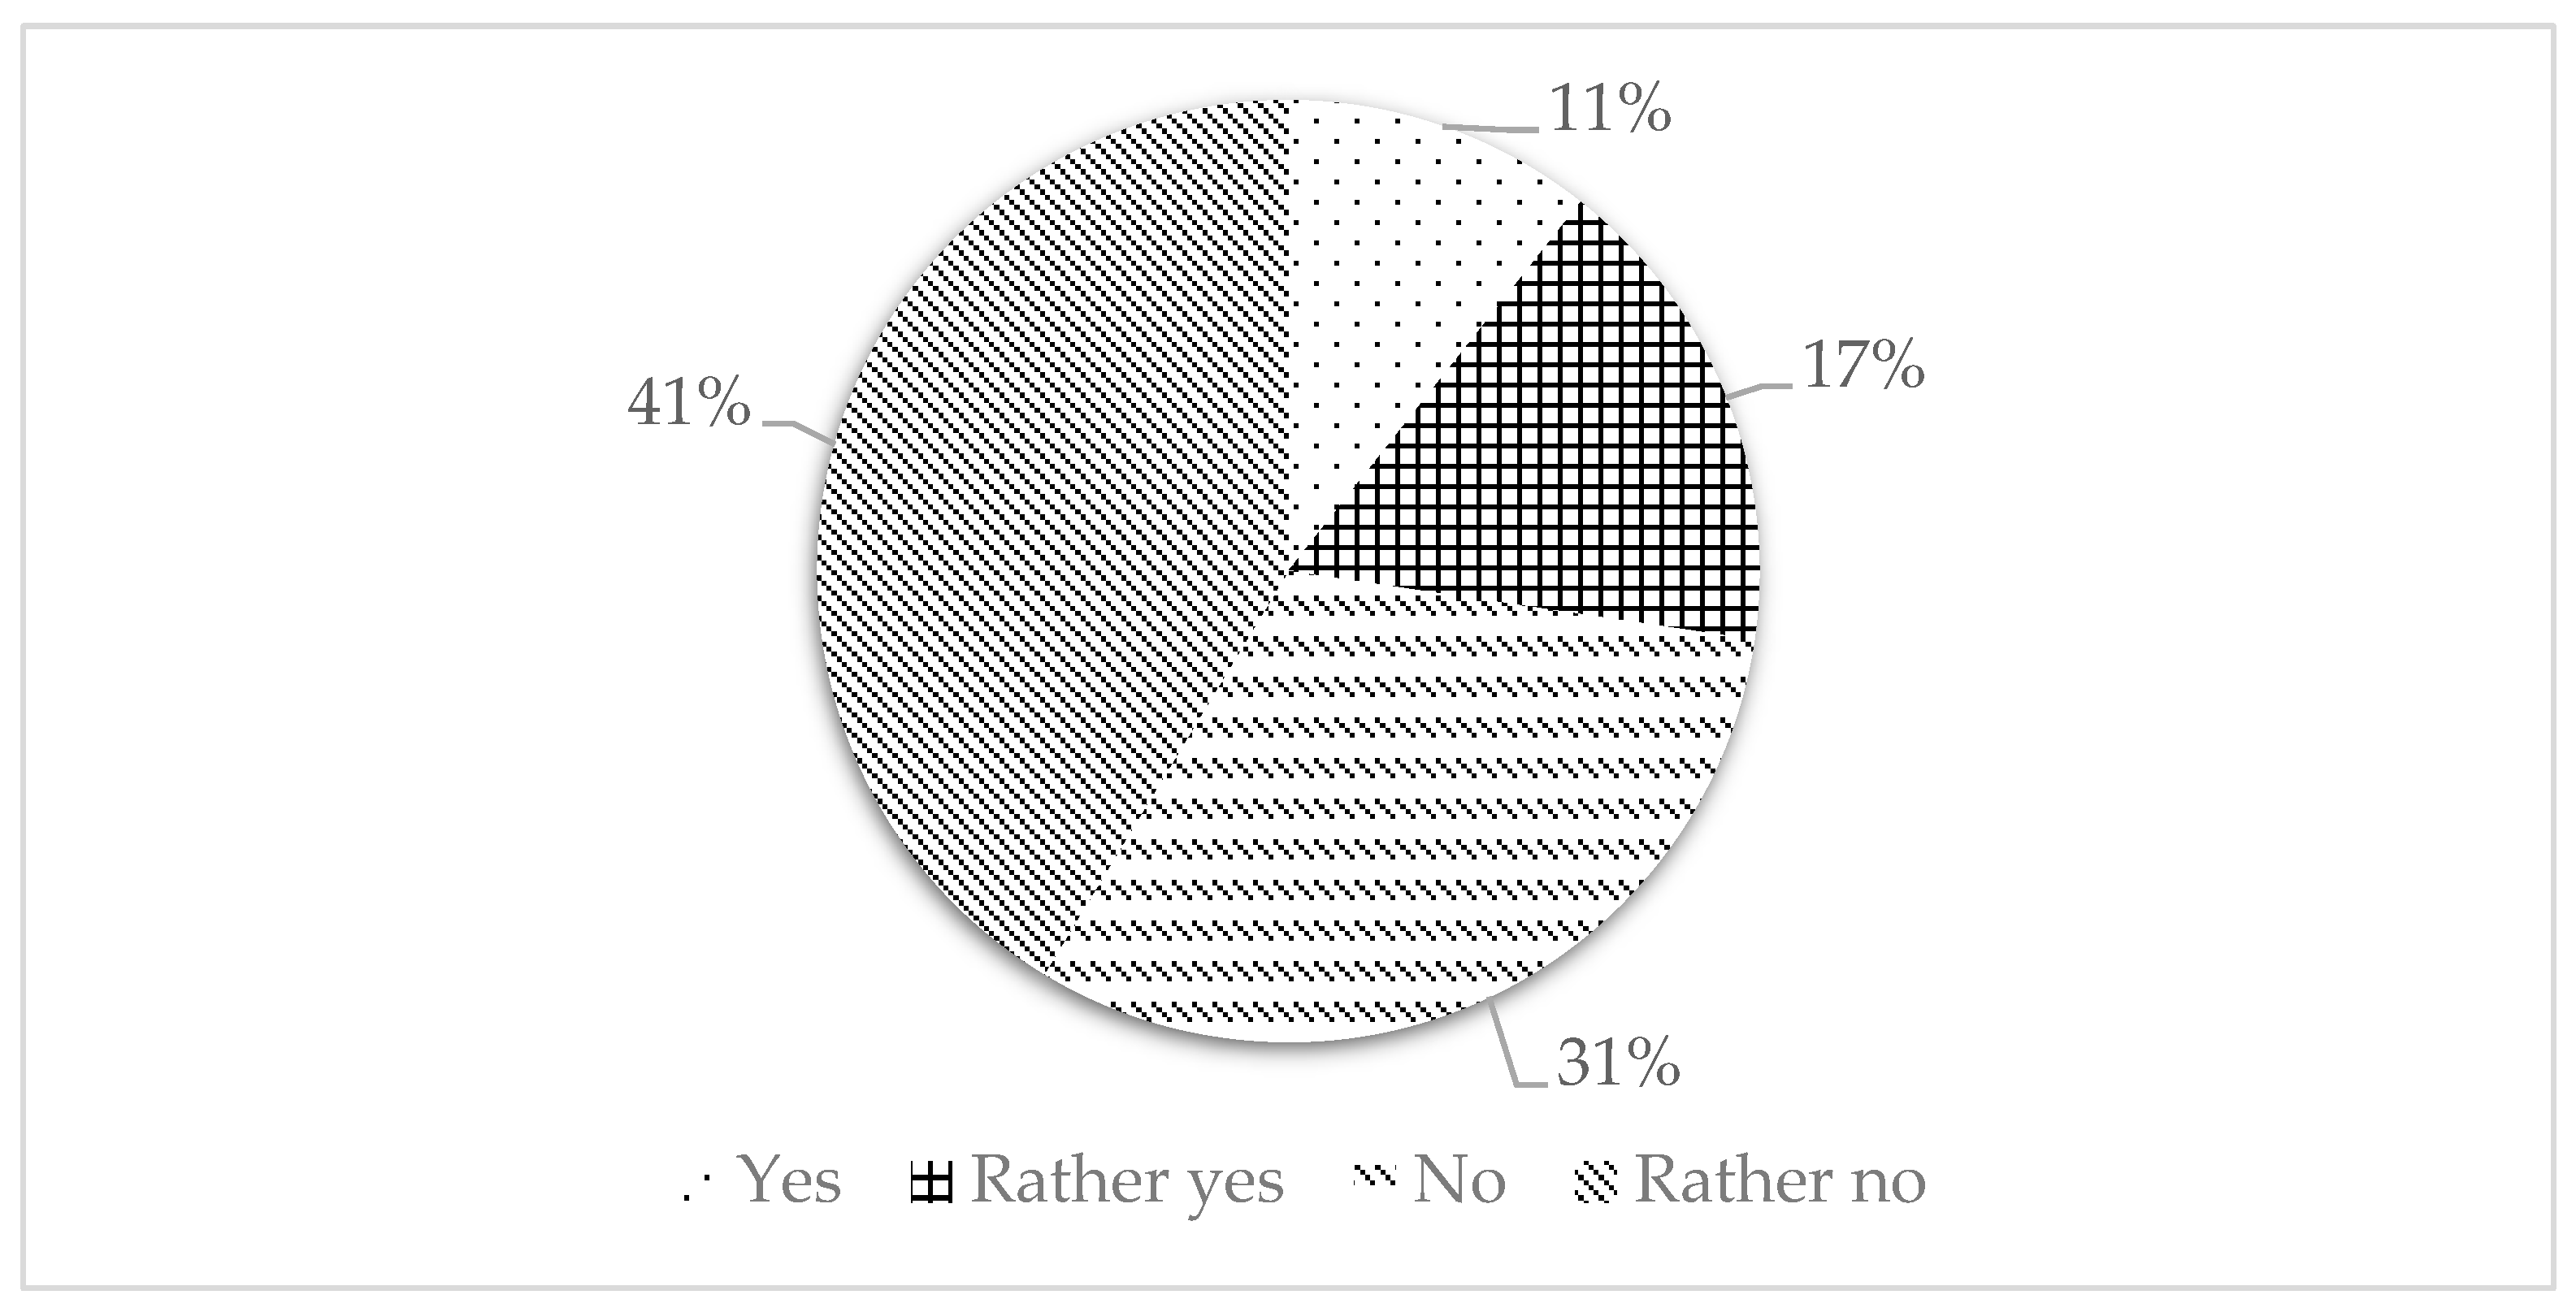
Advertising alone has an essential influence on customers’ purchasing decisions in only 47% of cases. This suggests that although most customers initially learn about products through advertising, other factors, such as recommendations, experience, and especially quality, play a significant role in their purchase decision-making process. The reason why customers do not base their decision solely on ad. advertising may stem from the complexity of the services offered, the wide range of options, and the necessary paperwork, which they typically become aware of through other sales channels. However, it is worth noting that advertising plays a key role in prompting customers to consider purchasing a product, providing an initial impulse to buy or think about the company, and enhancing brand perception and image. The responses to the question of whether advertising influences customers’ purchasing decisions are illustrated in Figure 5.
Figure 6 presents a graphical representation of the responses to the question of whether celebrity endorsements influence customers’ purchasing decisions. Up to 72% of customers reported that they do not follow these endorsements. This may be attributed to the age composition of the respondents and the nature of the services provided, as a customer must be over the age of 18. Although users may be younger, purchasing decisions are legally made only by adults.
For 79% of customers, the information provided by the company is straightforward to understand. The survey conducted among Slovak Telekom customers suggests that customers are generally satisfied with the company’s marketing communications. It can be concluded that customers primarily learn about products and the company through advertising, although other factors also significantly influence their purchasing decisions. Advertising is key, butit does not guarantee success. Therefore, its use is beneficial for the company, but this use must be effective, targeted, and integrated with other marketing tools. The summary based on descriptive statistics is presented in Table 7.
Based on the data in Figure 2 and Figure 3, the Chi-square test of independence was used to verify RQ3 and H3. Respondents evaluate the influence of two communication tools–personal recommendations from employees and advertising—using a four-point Likert scale: Yes, Rather yes, Rather no, and No. The results of the Chi-square test indicated a statistically significant association between the communication channels. It perceived influence on purchasing decisions, value x2 = 23.389 (N = 300), df = 3, p < 0.001, (p-value is less than 0.05, H0 was rejected and dependence was confirmed) which confirms the influence of the type of marketing communication on customer decision-making and support H3, that marketing communication channels involving personal recommendations from employees have a greater impact on customer decision-making than advertising in the media. This highlights the importance of integrating personal communication tools into the company’s marketing communication strategy.
Based on the data in Figure 3, it was possible to test H4 by categorising communication tools into two groups: personal (employees, friends, family recommendations, and direct marketing) with a total of 60 responses, and non-personal (TV advertising and online advertising) with a total of 90 responses. A binomial test was conducted to determine whether there is a statistically significant difference in preference between these two categories. This test tested H4 with the assumption of an even distribution (50:50). The test result showed a p-value of 0.018. Since p is less than the significance level of 0.05, the null hypothesis was rejected. This statistically confirms that respondents in the survey significantly prefer non-personal communication channels over personal ones, with a ratio of 0.6 to 0.4 in favour of non-personal tools. This applies to the analysed company, one of the telecommunication market leaders. Given that 43% of respondents were in the 36–55 age group, it can be assumed that this group significantly influenced the results in terms of preferred communication channels. Older age groups may prefer traditional media, such as television or personal contact at a branch, while younger generations are more likely to respond to digital channels. For a more in-depth interpretation of the results, it would be beneficial to perform a segmented analysis by age, which is a recommended approach for future research.
However, the questionnaire confirmed the continuous need for market analysis and interest in improving and adapting the communication strategy to the results, which can be achieved by applying the PDCA cycle to the decision-making process. However, the results are limited by the composition and sample size of the research. Therefore, it would be appropriate to continue the study by examining the entire spectrum of customers and age groups across several companies to verify the results. Despite these shortcomings, it is possible to outline an inevitable trend for the basic application of the decision-making system.
The following Table 8 provides a summary of the hypothesis testing results, including the type of analysis used, statistical significance, and conclusions derived from the data. These results address the research questions presented in the methodology section.
All four hypotheses were statistically confirmed. Positive relationships were observed between social media engagement and market position, as well as between marketing investment and market share. The data further supported the more decisive influence of employee recommendations over traditional advertising and showed a clear customer preference for digital communication channels.

5. Discussion

This discussion section returns directly to each of the four hypotheses, comparing the findings with the theoretical background and explaining how the results confirm or refute existing studies. It also highlights how the use of the PDCA cycle allows companies to translate these insights into continuous improvement of their marketing communication strategies.

5.1. Summary and Interpretation of Findings

Telecommunications companies currently hold a significant share of the advertising market. Television advertising is still popular and continues to reach a large customer base, as confirmed by previous research [82]. However, television advertising is one of the most expensive forms of promotion and is most effective for large companies aiming to reach a broad audience. It is not surprising that television advertising and recommendations continue to exert a considerable influence on customers and their decision-making. Previous studies have confirmed that other companies in the industry imitate advertising expenditures by leaders, and leaders, in turn, imitate the spending of their competitors. This study confirms the positive impact of advertising expenditure on a company’s market value (Hypothesis H1) and sales, aligning with previous studies [80]. However, its effectiveness in maintaining a competitive advantage is gradually diminishing, particularly among younger customers, but it still holds an essential position. Digital and interactive communication tools, along with the analysis of consumer behaviour, provide companies with a greater likelihood of success [49] and a higher chance of return on investment due to their targeted approach and lower costs [5]. This finding is consistent with the results of this study; however, the use of digital communication does not have a significant influence on market position (hypothesis H2). However, this finding is partly at odds with some previous studies. Research has confirmed a positive relationship between the use of social media and a brand’s market position, as well as its value [5,83]. The impact of interactive communication on building relationships with customers was also established [84]. It has also been demonstrated that social media usage is a cost-effective method with higher efficiency [85] and has a positive impact on company performance and entrepreneurial orientation [86]. Nilasari [87] confirms the significant impact of social media use on entrepreneurial performance and cost efficiency in his research. However, this study is based solely on quantitative data, a limitation that the authors themselves acknowledge. Additionally, the research focuses on small and medium-sized enterprises in the hospitality sector, meaning the conclusions may not be fully applicable to large enterprises in the telecommunications sector. Furthermore, research should be repeated and updated in response to shifts in customer behaviour, expectations, and communication methods following the COVID-19 pandemic.
Hypothesis H2 assumed a positive relationship between the level of digital communication and market share. However, this relationship was not statistically confirmed. A possible explanation is that companies with a lower market share (e.g., 4 ka) are significantly more active on social media but do not achieve a leading market position. This activity, therefore, does not yet have a direct impact on market share but may influence other indicators such as loyalty or brand. However, for smaller and newer companies on the market, utilising these tools is more effective and sustainable in the long term. The results of this study partially contradict those of Dwivedi [49], who found a strong positive correlation between digital communication and the market performance of companies. Nevertheless, the use of technology remains essential to successful and effective reputation management and should be an integral part of corporate strategy [88]. However, in our research, the influence of digital communication (H2) was not confirmed, which may be due to the specific nature of the Slovak market and the differing demographic structures of customers of large telecommunication operators. Notably, younger respondents predominantly preferred social media and digital channels, while older demographics still valued traditional channels.
For an advertising campaign to be effective, it is essential that the advertisement conveys a strong central idea, provokes a response from customers regarding the advertised products, and captures their attention. Many companies continue to place significant trust in the effectiveness of advertising, as reflected in the relatively high investment in this communication tool [89]. However, the findings suggest that high investment in TV advertising influence is gradually diminishing. Investing in customer research can help ensure that advertising expenditures are allocated efficiently and effectively. According to research, personalisation and integrity play a significant role in customer satisfaction, which should be considered when designing an advertising campaign. This finding supports the need for continuous market analysis, evaluation, and strategy adjustment. Reducing the cost of mass media is key to sustainable communication campaigns. While the survey results indicate that mass media advertising has a considerable impact on customer decision-making, it also incurs the highest costs for the company. This study also confirms that social media interaction enhances brand image and customer loyalty [84]. Companies investing more resources in social media marketing, interactive content, and consumer engagement generally achieve higher brand popularity, as supported by observed studies [72]. Therefore, the resources allocated to online communication are more cost-effective, especially for smaller or new companies in the telecommunications market. To optimise the campaigns, it is advisable to focus on this form of communication. A surprising finding was that direct personal recommendations from employees have a more significant influence on customer decision-making than advertising (Hypothesis H3), indicating the need for continuous improvement and the necessity of achieving higher employee satisfaction. This finding contradicts traditional approaches that emphasise mass communication. On the contrary, it supports the growing importance of the so-called human-to-human approach in marketing and the need to focus not only on campaign content but also on staff training and customer service. For managers, leadership is a key area that should be integrated into the strategic decision-making process. The findings that customers continue to prefer traditional media as their primary source of information may be related to the age composition of the sample and the high level of trust in television as a medium.
The findings also revealed that customers prefer non-personal communication channels over personal ones (hypothesis H4). The results indicated that different customers are reached by various tools, not only within traditional and digital communication tools, but there are also differences within individual digital communication channel tools [90]. This diversity is particularly significant for large companies with a broad customer base, underscoring the need for thorough analysis, ongoing market research, and continuous adaptation and evaluation of communication strategies. For marketing practice, companies need to take a differentiated approach to media, for example, combining television for older audiences and social media for younger customers.

5.2. Implications of This Study and Proposed Guidance

The theoretical implications of this study lie in highlighting the significance of traditional marketing communication and emphasising the necessity for integrity and active customer interaction, particularly for large firms in the telecommunications sector. Large companies must deliver information on a mass scale. Still, the increasing influence of marketing communication trends, especially in the realm of interactive marketing, is also having a growing impact on a company’s market position, as well as its traditional advertising efforts. The results of this research, which reflect the current relevance of modern trends and digital marketing, remain applicable to traditional advertising, particularly for higher age groups. For large companies with diverse customer bases, it is crucial to integrate multiple communication channels. This is supported by findings comparing the effects of the Internet on marketing communication in small, medium, and large enterprises [27], which underscores the importance of integrated marketing communication [23].
The managerial implications of this study provide guidance and recommendations for optimising strategy communication, decision-making, and expenditures. Companies should reconsider large-scale investments in traditional forms of communication, particularly television advertising, and instead allocate more resources to modern communication tools and strategies that leverage digital technologies and social networks to remain sustainable. However, traditional advertising still holds an essential position and impact on a company’s market position. Digital tools, on the other hand, have a broad effect on customers and facilitate direct interaction at a low cost. A key managerial consequence is the enhancement of customer engagement. Companies are advised to focus on strategies that build relationships with customers, fostering interactions. It is important to respond promptly and create personalised campaigns. Active participation on social networks and effective customer interaction enhance brand awareness, strengthen a company’s competitive advantage, and improve its market position. The findings suggest that companies must continually monitor and adapt to modern trends in marketing communication while increasing their investment in contemporary technologies and analytical tools, especially for collecting and evaluating customer data. Organisations should also strive to improve their communication strategies and integrate customers into their processes. This customer integration must be continually assessed using appropriate analytical tools and metrics to ensure ongoing effectiveness. To increase customer interactions, organisations could leverage artificial intelligence or increase the number of employees responsible for communication. However, before making these decisions, it is necessary to understand and evaluate customer expectations. The collection of data and the management of organisational and communication strategies based on these insights will be facilitated by the selection of appropriate analytical tools. This will, in turn, enable further optimisation of marketing and communication strategy and enhance market position. Given that up to 60% of respondents said they obtain information from online advertising and social networks, and that interaction on social networks (e.g., 4 ka and O2) correlated with positive brand perception, the proposed recommendation is specifically strengthening investment in digital communication, particularly in the form of interactive content and active moderation.
The study identified the following problem: high spending on TV advertising does not always correlate with a higher market position (e.g., Slovak Telekom vs. O2). Recommendation: Conduct an audit of the effectiveness of individual communication channels to optimise investments. Measure the return on Investment (ROI) for each channel and shift part of the budget from traditional media to more effective digital formats.
Table 8 shows how the recommended communication activities across the decision-making process phases align with the actual activities observed and analysed in this study.
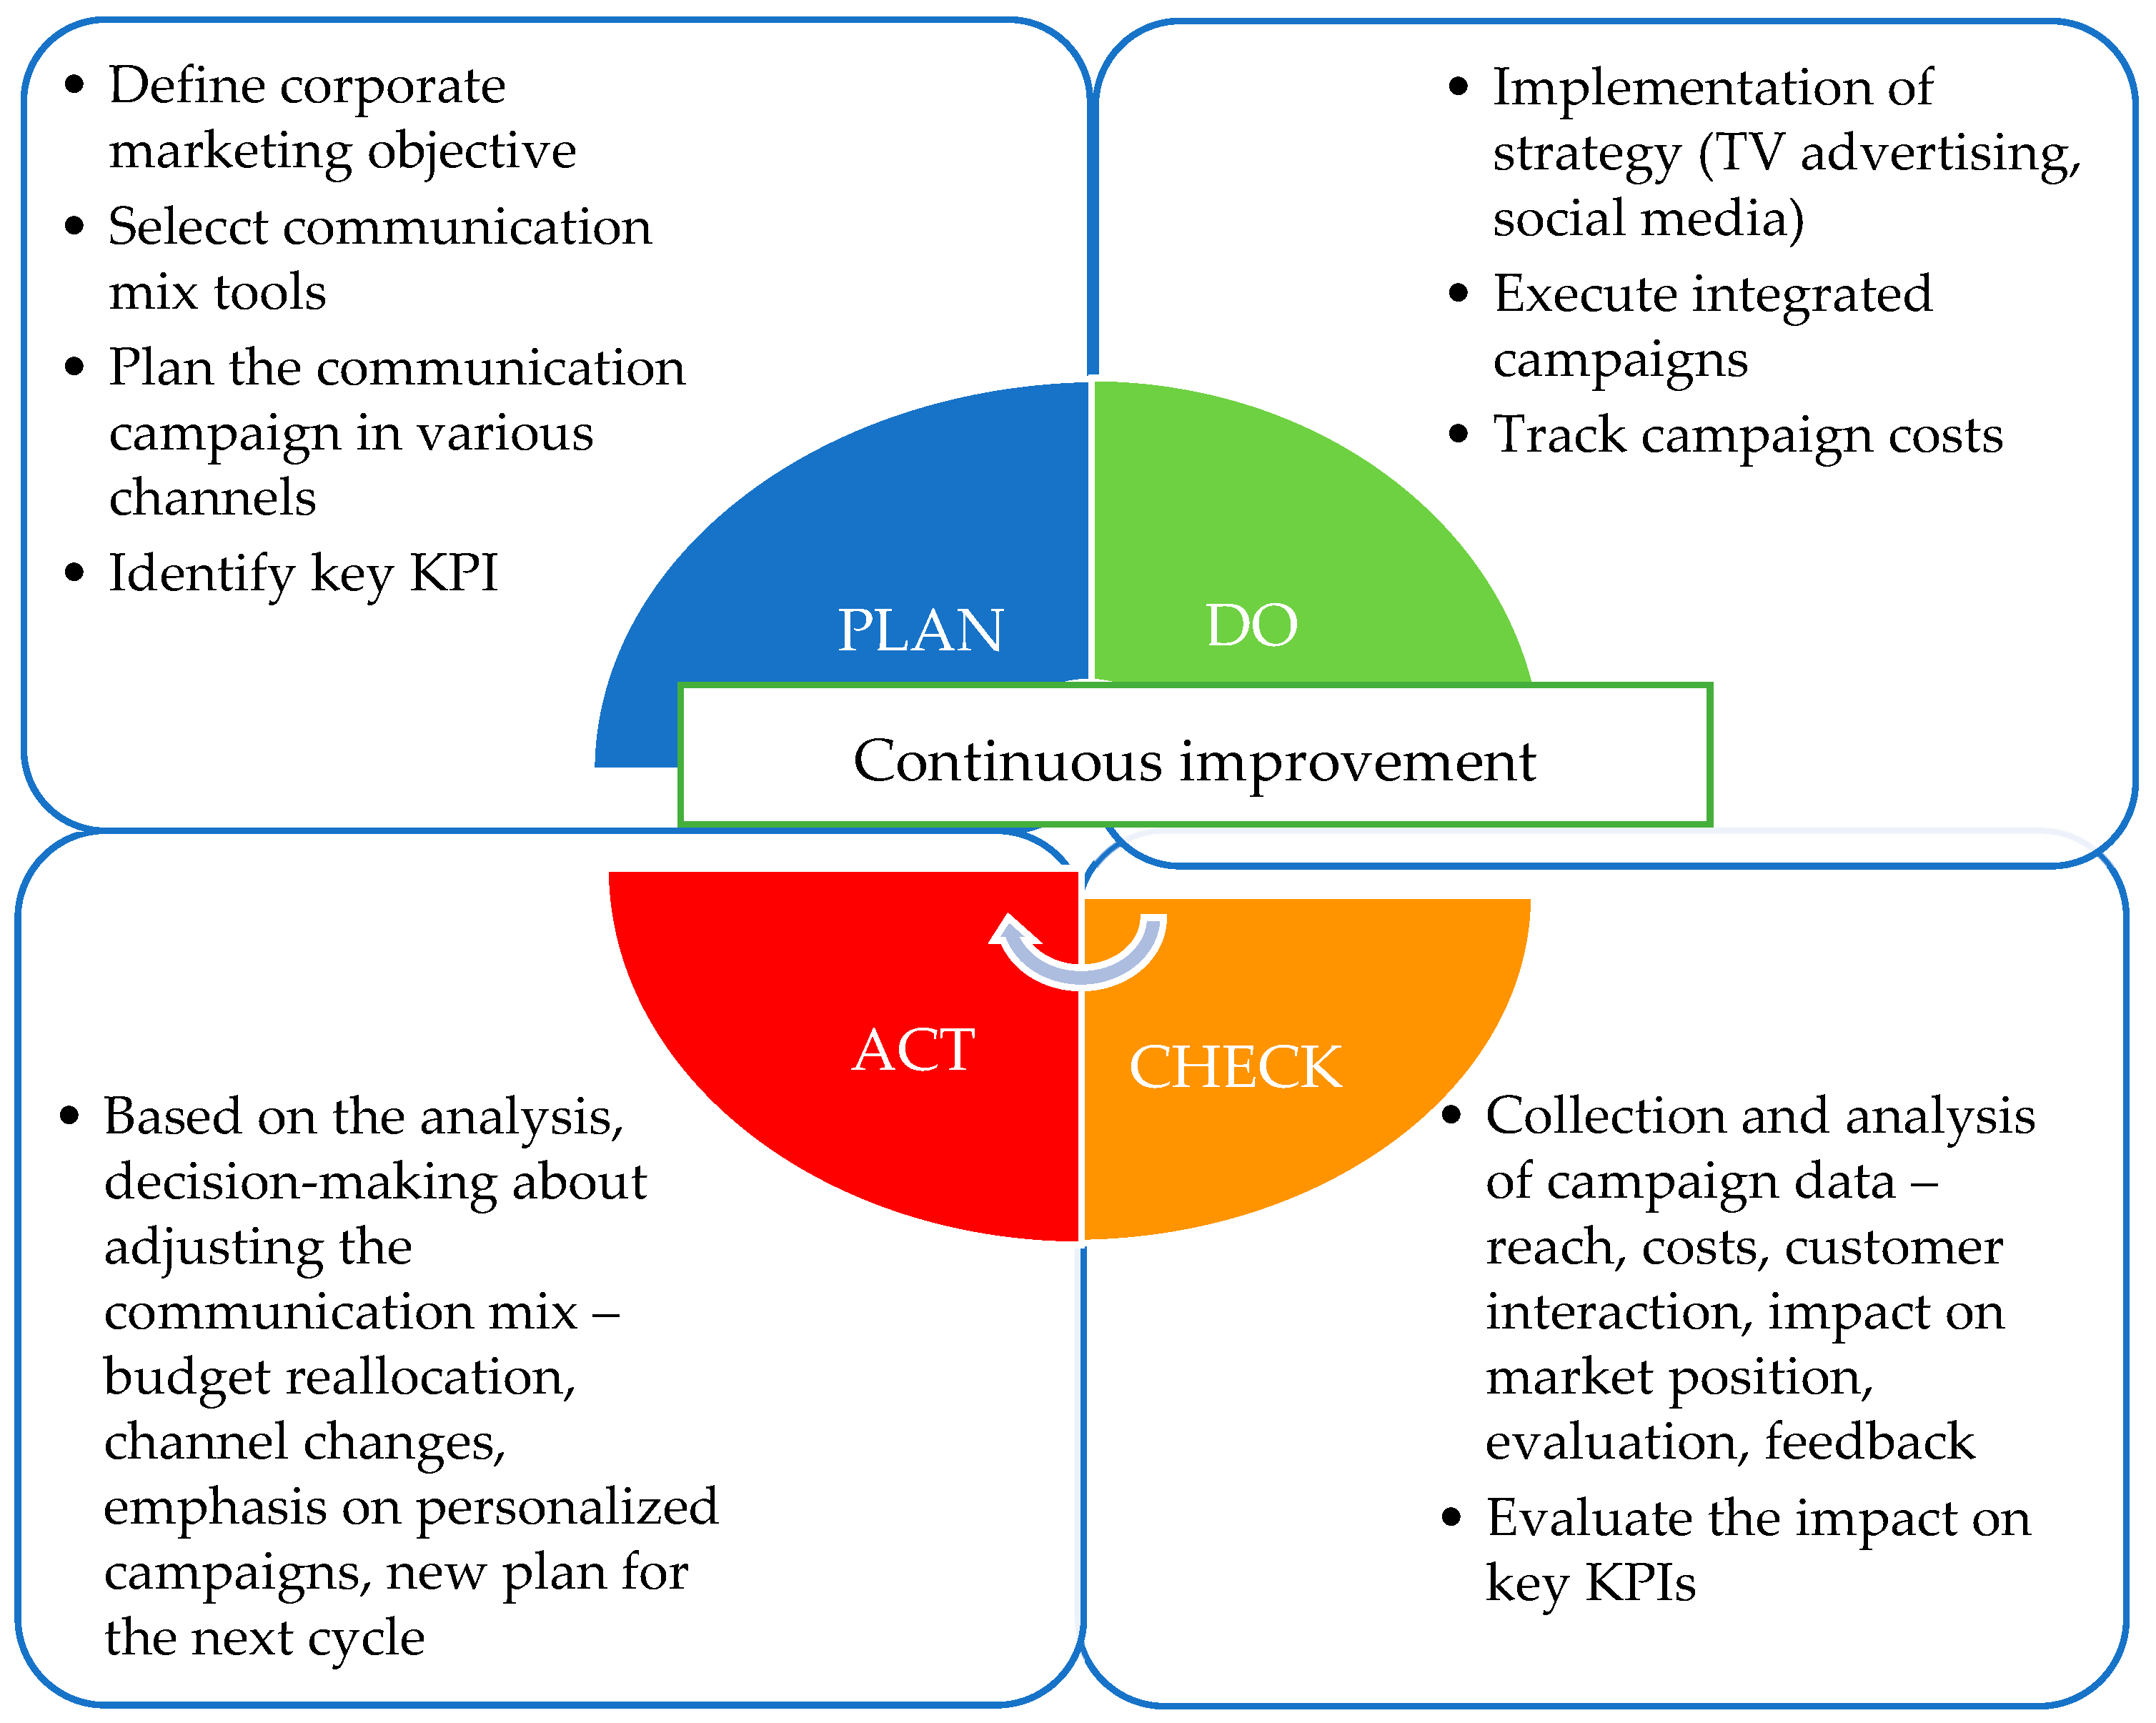
Each phase of the decision-making process includes the PDCA cycle and continuous improvement. Based on the data, a PDCA cycle, as proposed by Deming, has been suggested for market leaders and other companies, as illustrated in Figure 7.
For the successful implementation of the steps in the PDCA continuous improvement cycle, companies are advised to use a practical checklist based on Table 9.
This simple checklist serves as a guideline for companies in various sectors to support the implementation of the recommended PDCA cycle, which actions. However, there are some differences in communication and decision-making in the market between leaders and other companies, such as smaller ones or new companies in the sector. Specific details apply to the implementation of the PDCA cycle, as shown in Table 10.
From a systems thinking perspective, the research demonstrates the importance of approaching marketing communication as a complex, adaptive system, where decision-making processes must be continuously evaluated and adjusted. The integration of the PDCA cycle into communication decision-making ensures ongoing improvement and enables organisations to respond effectively.
For both leaders and other companies, it is essential to prioritise both customer satisfaction and employee satisfaction, ensuring that employees feel like an integral part of the company. Modern technologies and sustainable human resource management already play a key role in the recruitment process for successful business [91]. The key is to implement and strengthen the role of indicators that address leadership, employee training, personal development skills, and their integration into performance measurement systems [92]. In customers’ relationships, it is essential, in addition to monitoring complaints, to regularly and systematically measure satisfaction using various techniques [93]. To increase both customer and employee satisfaction, it is also recommended to use the PDCA cycle. The proposed guidance emphasises the necessity of combining multiple communication channels into decision-making processes, integrating customers and employees, and applying the PDCA cycle to continuously monitor, evaluate, and adjust communication strategies. By following these recommendations, managers can optimise their decision-making systems, enhance operational sustainability, and improve market position, while staying flexible to market changes, dynamics, customer feedback, and emerging trends. The application of a decision-making model based on the PDCA cycle can be used not only in the telecommunication sector, but also by organisations in other areas, such as services, education, and sports management. When planning content campaigns and conducting market analyses, it is also recommended to integrate AI-based tools, which enable more effective campaign targeting and facilitate comprehensive market research. Although these recommendations are primarily applicable to markets with similar geographical, demographic, and cultural characteristics to the Slovak market or the broader Central and Eastern European region, with appropriate adjustments, they can be adapted and implemented in other countries, taking into account the specific conditions and dynamics of the respective markets.
Given that the PDCA model is presented in the article as a recommended solution, its illustrative application by the company under review can be illustrated through the following model example. Slovak Telekom a.s. is one of the market leaders, primarily focusing its communication campaign on mass media channels. However, in 2023, the company faced a crisis due to its Christmas campaign and television commercial. Table 11 illustrates the application of the PDCA cycle model in this specific case.
It is evident from Table 12 that the company followed the PDCA cycle steps. However, adjustments had to be made continuously until the commercial was taken off the air. Therefore, the campaign ultimately proved ineffective, as many customers threatened to leave the company or boycott its services. One possible explanation may lie in insufficient focus on audience analysis, market research, and customer behaviour. While the campaign was launched in multiple countries, it was met with mostly adverse reactions in the Slovak market. Nevertheless, this case study illustrates that the PDCA cycle can also be applied in crisis communication scenarios, not just in planned improvements.
Based on the empirical findings, several practical implications for managers responsible for corporate communication strategies can be formulated. These implications relate to optimising resource allocation, increasing employee engagement, and adapting communication to the preferences of specific target groups.
Optimising Resource Allocation: The study highlights a clear shift in audience preferences towards digital communication channels. This change is particularly evident among younger audiences, as well as the gradual replacement of television programming by streaming platforms. In practice, this suggests the importance of reallocating the communication budget effectively. An example is reducing television advertising by 10%—and investing those resources in interactive content on social media. This will enable targeted and effective customer engagement, leading to increased customer satisfaction and integrity, as proven in this study.
Engaging employees as communication ambassadors—The data indicated the key role and importance of employees in communicating with customers. Employees are, therefore, an essential part of the information transfer and value mediators who appear trustworthy and authentic to customers. Recommendations include introducing internal training and motivational programs that enable employees to participate in external communication (e.g., as brand ambassadors on social networks or at public events). Additionally, increase the proportion of employees responsible for rapid communication on social networks, which will reduce the time customers wait for responses and increase their satisfaction.
Adapting strategies to target groups—Differences in media behaviour between age groups have been confirmed. Younger audiences prefer fast-paced visual content, making platforms like Instagram, TikTok, or YouTube more effective. Older groups may be more receptive to traditional channels, such as television advertising or print media. Managers should adjust their content and communication mix accordingly. It is essential to determine who they want to reach with a given campaign and what message to convey, which requires thorough market and customer behaviour analysis, as confirmed by this study.
Recommendations are linked to the PDCA cycle, which are present in the practical checklist for managers in Table 13.
Table 12 presents a practical checklist as a management tools for systematic monitoring and evaluation of communication strategies in line with the PDCA model. By following the outlined steps, managers can effective identify and address critical or problematic areas within the communication strategy. This structured approach enables more efficient resource allocation and supports the timely and consistent achievement of campaign objectives.

5.3. Limitations and Suggestions for Future Research

While this study provides valuable insights, several limitations restrict the generalizability of the findings. The case study has certain limitations that must be taken into account when interpreting the results. The research sample was limited to customers of one company (Slovak Telekom, Bratislava, Slovakia) and one geographical area, representing a narrow customer segment within the Slovak telecommunications market, which may lead to selection bias and reduce external validity. Additionally, the sample size, though statistically adequate, may not fully reflect the diversity of customer behaviours across other regions or sectors. The results are, therefore, primarily illustrative and cannot be directly applied to the entire market without further verification. Time frame of the data which was limited to the period of 2022 and therefore does not capture the development of communication trends over a longer time horizon. Another limitation lies in the comparison, given the lack of parameters that may affect market position, as well as the sector-specific focus. Decision-making dynamics in telecommunications may differ from those in industries such as retail, banking, or public services. These limitations are crucial for interpreting the results, as findings on the influence of personal recommendations on purchasing decisions, for example, may be influenced by the specific corporate culture or approach of the staff of the selected company. Results relating to communication channel preferences may also be distorted by the age composition of the sample, which was not evenly distributed across generations. However, despite these limitations, it is possible to discern a particular trend in the use of communication channels. The guidance provided aligns with the trends revealed in the research and the literature reviewed, serving as a starting point for informed managerial decision-making in communication strategy. This study serves as preliminary research, offering foundational knowledge for future investigations into this market and emphasising the need for analysis and research within the internal customer structure of companies. The use of correlation analysis basic insight into the relationship between variables, but for a deeper understanding of causal relationship, it would be appropriate to apply more advanced methods in the future, such as regression modelling, panel data, or multivariate analysis. Future research should expand the metrics monitored (e.g., customer engagement by age group, segmentation by behaviour, or return on investment in specific communication channels) and track data over a longer period of time capture changes in trends and effectiveness of communication tools.
To increase the reliability of the results, future research should compare other factors influencing market position; comparing multiple sectors include more companies from the industry and ideally conduct an international comparison (e.g., comparing Slovakia with the Czech Republic); expand the sample to a representative population with an emphasis on equal representation of age categories and other demographic variables; conduct a longitudinal study to track changes in customer preferences over time and verify the long-term impact of changes in communication strategy; include mixed research involving qualitative interviews with managers or customer, which would allow for a better explanation of some quantitative findings. Additionally, investigate the applicability and adaptability of the proposed PDCA–based communication decision model across multiple sectors, as well as in cross-cultural contexts. This would enable a comprehensive understanding of the issues surrounding decision-making and the effectiveness of communication strategies.
Despite these limitations, we consider the findings to be a valuable basis for discussion on systematic decision-making in the field of sustainable market communication and as a starting point for future comparative studies in other market segments.

6. Conclusions

This study provided a systematic view of the effectiveness of marketing communication in the telecommunications sector and offered a practical framework for decision-making using the PDCA model. The results of the study confirm all four hypotheses: H1 demonstrates a strong link between customer engagement on social media and market share; H2 confirms the importance of advertising investments; H3 shows that personal recommendations from employees have a greater influence on customer decisions than traditional advertising; H4 demonstrates that customers still prefer impersonal channels, especially in the 36–55 age group. These findings directly support the recommendation for managers to redirect part of the budget into targeted digital communication and employee training.
A significant contribution of this study is the application of a decision-making framework based on the PDCA principle, which provides a structured and cyclical approach to optimizing communication strategies. By integrating customer feedback, marketing research results, and campaign performance data into a continuous improvement process, managers can increase the effectiveness and sustainability of marketing communication systems. Incorporating artificial intelligence-based tools into marketing research, content preparation, and creation can further enhance the effectiveness and accuracy of a company’s communication strategy. The benefit of the proposed PDCA model is its ability to transform chaotic and intuitive marketing decisions into a repeatable and measurable process. By implementing it, companies can, for example, reduce costs associated with ineffective channels, increase customer engagement in the digital space, and better align customer expectations with the content of their communications. In the long term, continuous feedback loops enabled by the PDCA cycle can significantly enhance brand loyalty and customer lifetime value. Proposed recommendations are applicable after minor adjustments reflecting market specifics, across other sectors and in geographically and culturally different countries.
Unlike previous studies, which focus only on describing tools or trends, this work provides a specific strategic tool for optimising communication in a real business environment. The novelty lies in the combination of data analysis with the quality management decision-making cycle, which enables companies to increase the effectiveness of their communication strategy in line with market dynamics and customer expectations.

Author Contributions

Conceptualization, M.Ř. and V.L.; methodology, M.Ř., L.L. and V.L.; software, M.Ř.; validation, M.Ř. and L.L.; formal analysis, M.Ř. and L.L.; investigation, M.Ř.; resources, L.L. and V.L.; data curation, M.Ř.; writing—original draft preparation, M.Ř., L.L. and V.L.; writing—review and editing, M.Ř. L.L. and V.L.; visualization, M.Ř. and V.L.; supervision, M.Ř., L.L. and V.L.; project administration, L.L. and V.L.; funding acquisition, L.L. All authors have read and agreed to the published version of the manuscript.

Funding

Funded by the EU Next Generation EU through the Recovery and Resilience Plan for Slovakia under the project No. 09I05-03-V02-00011.

Data Availability Statement

Data from the survey in the researched topic are available upon request to the authors. The data are stored in the internal storage facilities of the University in Žilina in the work files of employees.

Conflicts of Interest

The authors declare no conflicts of interest.

References

  1. Alsaqer, S.; Katar, I.M.; Abdelhadi, A. Investigating TQM Strategies for Sustainable Customer Satisfaction in GCC Telecommunications. Sustainability 2024, 16, 6401. [Google Scholar] [CrossRef]
  2. Kita, J. Marketing; IURA EDITION: Bratislava, Slovakia, 2010; ISBN 978-80-8078-327-3. [Google Scholar]
  3. Chowdhury, R.H. Sentiment analysis and social media analytics in brand management: Techniques, trends, and implications. World J. Adv. Res. Rev. 2024, 23, 287–296. [Google Scholar] [CrossRef]
  4. George, B.; Paul, J. (Eds.) Digital Transformation in Business and Society: Theory and Cases; Springer International Publishing: Cham, Switzerland, 2020; ISBN 978-3-030-08276-5. [Google Scholar]
  5. Jeswani, R. The Role and Importance of Social Media Marketing in Brand Building. Ir. Interdiscip. J. Sci. Res. 2023, 7, 1–9. [Google Scholar] [CrossRef]
  6. Kaur, T. Online Marketing Communication. Biz Bytes 2017, 8, 132–137. [Google Scholar]
  7. Koman, G.; Kubina, M.; Holubčík, M.; Soviar, J. Possibilities of Application a Big Data in the Company Innovation Process. In Knowledge Management in Organizations; Uden, L., Hadzima, B., Ting, I.-H., Eds.; Communications in Computer and Information Science; Springer International Publishing: Cham, Switzerland, 2018; Volume 877, pp. 646–657. ISBN 978-3-319-95203-1. [Google Scholar]
  8. Dekay, S.H. How Large Companies React to Negative Facebook Comments. Corp. Commun. Int. J. 2012, 17, 289–299. [Google Scholar] [CrossRef]
  9. Kubenka, M. Prosperity Prediction in Czech Manufacturing Industries. Eng. Econ. 2018, 29, 516–525. [Google Scholar] [CrossRef]
  10. Kubenka, M. Predictive Ability of the Index of Creditworthiness. In Proceedings of the 7th International Scientific Conference Finance and Performance of Firms in Science, Education and Practice; Univerzita Tomáše Bati ve Zlíně:; Zlín, Czech Republic, 2015; pp. 795–804. ISBN 978-80-7454-482-8. [Google Scholar]
  11. Honková, I.; Myšková, R. Techniques, Objectives and Motivations of Creative Accounting: Evidence from the Czech Republic. Natl. Account. Rev. 2024, 6, 333–351. [Google Scholar] [CrossRef]
  12. Pernica, B.; Fuka, J.; Baťa, R.; Zdražil, P. Nervi Rei Publicae: Local Governments as Economic Populists? Policy Stud. 2025, 46, 628–651. [Google Scholar] [CrossRef]
  13. Fernández-Souto, A.B.; Puentes-Rivera, I.; Vázquez-Gestal, M. The Communicative Management of Large Companies in Spain: Structure, Resources and Main Challenges of Those Managers. Commun. Soc. 2019, 32, 161–177. [Google Scholar] [CrossRef]
  14. Šalgovičová, J.; Šalgovičová Ferriero, J. New Trends in Marketing and Communication in the Italian Banking Sector. Mark. Identity 2017, 247–254. [Google Scholar]
  15. Marčeková, R.; Malachovský, A. Nové Trendy v Marketingovej Komunikácii Podnikov Cestovného Ruchu Ako Faktor Regionálneho Rozvoja. In Proceedings of the XVIII. mezinárodní kolokvium o regionálních vědách. Sborník příspěvků. 18th International Colloquium on Regional Ciences. Conference Proceedings; Masarykova Univerzita: Brno, Czech Republic, 2015; pp. 713–721. [Google Scholar] [CrossRef]
  16. Grančičová, K.; Hrušovská, D. Tradičné Nástroje Verzus Nové Formy a Trendy v Marketingovej Komunikácii Podnikov Na Slovensku. Trendy V Podn. 2015, 5, 3–12. [Google Scholar]
  17. Sousa Filho, J.; Wanderley, L.; Lucian, R.; Kooy, K. Comunicação Da Responsabilidade Social Empresarial Em Websites Corporativos: Estudo Comparado Com Grandes Empresas de Países Emergentes. Rev. Gest. Ambient. Sustentabilidade 2014, 3, 122–134. [Google Scholar] [CrossRef]
  18. Capriotti, P.; Moreno, Á. Corporate Citizenship and Public Relations: The Importance and Interactivity of Social Responsibility Issues on Corporate Websites. Public Relat. Rev. 2007, 33, 84–91. [Google Scholar] [CrossRef]
  19. Arvidsson, S. Communication of Corporate Social Responsibility: A Study of the Views of Management Teams in Large Companies. J. Bus. Ethics 2010, 96, 339–354. [Google Scholar] [CrossRef]
  20. Pollach, I.; Johansen, T.S.; Ellerup Nielsen, A.; Thomsen, C. The Integration of CSR into Corporate Communication in Large European Companies. J. Commun. Manag. 2012, 16, 204–216. [Google Scholar] [CrossRef]
  21. Hawabhay, B.B.; Abratt, R.; Peters, M. The Role of Corporate Communications in Developing a Corporate Brand Image and Reputation in Mauritius. Corp. Reput. Rev. 2009, 12, 3–20. [Google Scholar] [CrossRef]
  22. Thrassou, A.; Vrontis, D. A Small Services Firm Marketing Communications Model for SME-Dominated Environments. J. Mark. Commun. 2006, 12, 183–202. [Google Scholar] [CrossRef]
  23. Camilleri, M.A. Integrated Marketing Communications. In Travel Marketing, Tourism Economics and the Airline Product; Tourism, Hospitality & Event Management; Springer International Publishing: Cham, Switzerland, 2018; pp. 85–103. ISBN 978-3-319-49848-5. [Google Scholar]
  24. Asemah, E.S.; Nkwam-Uwaoma, A.O.; Amah, F.O. Notes on Integrated Marketing Communication; Jos University Press: Jos, Nigeria, 2023; ISBN 978-978-798-033-0. [Google Scholar]
  25. Csikósová, A.; Antošová, M.; Čulková, K. Strategy in Direct and Interactive Marketing and Integrated Marketing Communications. Procedia—Soc. Behav. Sci. 2014, 116, 1615–1619. [Google Scholar] [CrossRef]
  26. Zlatanov, S.; Đuričanin, J. The Evolving Interaction between Traditional Marketing Channels and the Digital Age. In Proceedings of the International Scientific Conference on Economy, Management and Information Technologies—ICEMIT 2023, Blace, Serbia, 21–23 September 2023; pp. 175–181. [Google Scholar] [CrossRef]
  27. Lagrosen, S. Effects of the Internet on the Marketing Communication of Service Companies. J. Serv. Mark. 2005, 19, 63–69. [Google Scholar] [CrossRef]
  28. Frey, P. Marketingová Komunikace: Nové Trendy 3.0, 3rd ed.; Management Press: Praha, Czech Republic, 2011; ISBN 978-80-7261-237-6. [Google Scholar]
  29. Todorova, G. Marketing Communication Mix. Trakia J. Sci. 2015, 13, 368–374. [Google Scholar] [CrossRef]
  30. Kotler, P.; Armstrong, G.; Harris, L.C. Principles of Marketing, 7th ed.; Pearson: Harlow, UK, 2017; ISBN 978-1-292-09289-8. [Google Scholar]
  31. Komarova, N.V.; Slav, S.I.; Tikhomirova, A.M. Strategic analysis of the demand for satellite communication services in the telecommunications market and construction of marketing strategy. Rev. Univ. Zulia 2021, 13, 257–275. [Google Scholar] [CrossRef]
  32. Chołodecki, M. The Future EU Postal Regulation. What Can Be Learnt from the Telecommunication Regulations. Comput. Law Secur. Rev. 2024, 52, 105938. [Google Scholar] [CrossRef]
  33. Kankam-Kwarteng, C.; Donkor, G.N.A.; Forkuoh, S.K. Corporate Social Responsibility, Marketing Capabilities and Consumer Behavioral Responses. Rev. Gest. 2022, 29, 410–423. [Google Scholar] [CrossRef]
  34. Havrysh, O.; Kubiv, S.; Avramchuk, L.; Martynenko, M.; Kyrychenko, A.; Aisulu, A. Features of Income Formation of Telecommunications Market Organizations. Financ. Credit. Act. Probl. Theory Pract. 2023, 5, 134–148. [Google Scholar] [CrossRef]
  35. Arisar, M.M.K.; Lian-Ju, N.; Jokhio, S.H. Business Approaches Pathways towards Strategic Market Capture in Telecommunication Industry. Access J.—Access Sci. Bus. Innov. Digit. Econ. 2024, 5, 222–247. [Google Scholar] [CrossRef]
  36. Jemal, M.K.; Melese, K.B. The Impact of Advertising on Consumers’ Buying Behavior: The Case of Safaricom Ethiopia, Addis Ababa, Ethiopia. Cogent Soc. Sci. 2025, 11, 2454355. [Google Scholar] [CrossRef]
  37. Attor, C.; Bashiru Jibril, A.; Chovancová, M. Does Brand Personality Mediate the Link between Social Media Usage and Customer Buying Decisions on Telecommunication’s Products and Services? Evidence from Ghana. Innov. Mark. 2022, 18, 84–98. [Google Scholar] [CrossRef]
  38. Spivakovskyy, S.; Spivakovska, T.; Zozulov, O.; Heiets, I. Designing Online Communication Mix for Machinery Manufacturers. Int. J. Bus. Perform. Manag. 2022, 23, 166–185. [Google Scholar] [CrossRef]
  39. Wirtz, J. Winning in Service Markets: Success through People, Technology and Strategy; World Scientific: Hackensack, NJ, USA, 2016; ISBN 978-1-944659-04-2. [Google Scholar]
  40. Callen, B. Manager’s Guide to Marketing, Advertising, and Publicity; McGraw Hill Professional: New York, NY, USA, 2011; ISBN 978-0-07-171346-7. [Google Scholar]
  41. Čichovský, L.; Boháček, J.; Urban, J. Moderní Pojetí Inovací a Jejich Typologií pro Praxi; VŠEM: Praha, Czech Republic, 2012; ISBN 978-80-904645-3-7. [Google Scholar]
  42. Rane, N.L.; Achari, A.; Choudhary, S. Enhancing Customer Loyalty Through Quality of Service: Effective Strategies to Improve Customer Satisfaction, Experience, Relationship, and Engagement. Int. Res. J. Mod. Eng. Technol. Sci. 2023, 5, 427–452. [Google Scholar] [CrossRef]
  43. Allen, R. Marketing Communication Based on Customer Satisfaction and Loyalty: Zantel Tanzania. Int. J. Innov. Manag. Technol. 2017, 8, 284–288. [Google Scholar] [CrossRef]
  44. Almohaimmeed, B. Pillars of Customer Retention: An Empirical Study on the Influence of Customer Satisfaction, Customer Loyalty, Customer Profitability on Customer Retention. Serbian J. Manag. 2019, 14, 421–435. [Google Scholar] [CrossRef]
  45. Ngoc Luu, T.M.; Phuong Mai, N.; Dang, T.H.; Hien Vu, T.M. The Impact of Internal Marketing on Employee Satisfaction in the Vietnamese Telecommunication Industry. Contemp. Econ. 2022, 16, 424–442. [Google Scholar] [CrossRef]
  46. Pollák, F.; Markovič, P.; Kalamen, K. Digital vs. Traditional: Selected Views on Creating Optimal Marketing Communication Mix. Mark. -Tržište 2025, 37, 85–97. [Google Scholar] [CrossRef]
  47. Milichovský, F. New Tools for Effective Marketing Communications. Acta Univ. Bohem. Merid. 2013, 16, 35–43. [Google Scholar] [CrossRef]
  48. Burešová, J. Online Marketing: Od Webových Stránek k Sociálním Sítím, 1st ed.; Grada Publishing: Praha, Czech Republic, 2022; ISBN 978-80-271-1680-5. [Google Scholar]
  49. Dwivedi, Y.K.; Ismagilova, E.; Hughes, D.L.; Carlson, J.; Filieri, R.; Jacobson, J.; Jain, V.; Karjaluoto, H.; Kefi, H.; Krishen, A.S.; et al. Setting the Future of Digital and Social Media Marketing Research: Perspectives and Research Propositions. Int. J. Inf. Manag. 2021, 59, 102168. [Google Scholar] [CrossRef]
  50. Ismagilova, E.; Slade, E.L.; Rana, N.P.; Dwivedi, Y.K. The Effect of Electronic Word of Mouth Communications on Intention to Buy: A Meta-Analysis. Inf. Syst. Front. 2020, 22, 1203–1226. [Google Scholar] [CrossRef]
  51. Rehman, S.U.; Gulzar, R.; Aslam, W. Developing the Integrated Marketing Communication (IMC) through Social Media (SM): The Modern Marketing Communication Approach. Sage Open 2022, 12, 21582440221099936. [Google Scholar] [CrossRef]
  52. Gao, W.; Fan, H. Omni-Channel Customer Experience (In)Consistency and Service Success: A Study Based on Polynomial Regression Analysis. J. Theor. Appl. Electron. Commer. Res. 2021, 16, 1997–2013. [Google Scholar] [CrossRef]
  53. Sarda, U. The Impact of Social Media Marketing on Gen Z’s Consumer Behavior—A Conceptual Study. Int. J. Sci. Res. Eng. Manag. 2024, 08, 1–8. [Google Scholar] [CrossRef]
  54. Bačuvčík, R. Kreativita a Efektivita v Marketingové Komunikaci, 1st ed.; Radim Bačuvčík—VeRBuM: Zlín, Czech Republic, 2016; ISBN 978-80-87500-83-5. [Google Scholar]
  55. Crane, A.; Glozer, S. Researching Corporate Social Responsibility Communication: Themes, Opportunities and Challenges. J. Manag. Stud. 2016, 53, 1223–1252. [Google Scholar] [CrossRef]
  56. Ihlen, Ø.; Bartlett, J.L.; May, S. (Eds.) The Handbook of Communication and Corporate Social Responsibility, 1st ed.; Wiley: Hoboken, NJ, USA, 2011; ISBN 978-1-4443-3634-4. [Google Scholar]
  57. Mansilla, R.R.; Hernandez, V.V.; Paredes, M.P.; Sifuentes, C.T. The Influence of Inbound Marketing and the PDCA Cycle on the Adoption of Best Practices for Customer Loyalty in a Retail SME. In Proceedings of the 2024 Congreso Internacional de Innovación y Tendencias en Ingeniería (CONIITI), Bogotá, Colombia, 2–4 October 2024; IEEE: Piscataway, NJ, USA, 2024; pp. 1–5. [Google Scholar] [CrossRef]
  58. Nguyen, V.; Nguyen, N.; Schumacher, B.; Tran, T. Practical Application of Plan–Do–Check–Act Cycle for Quality Improvement of Sustainable Packaging: A Case Study. Appl. Sci. 2020, 10, 6332. [Google Scholar] [CrossRef]
  59. Rangel-Sánchez, M.-Á.; Urbina-González, J.-D.-J.; Carrera-Escobedo, J.-L.; Guirette-Barbosa, O.-A.; Murillo-Rodríguez, V.-A.; Celaya-Padilla, J.-M.; Durán-Muñoz, H.-A.; Cruz-Domínguez, O. Enhancing Scrap Reduction in Electric Motor Manufacturing for the Automotive Industry: A Case Study Using the PDCA (Plan–Do–Check–Act) Approach. Appl. Sci. 2024, 14, 2999. [Google Scholar] [CrossRef]
  60. Rajić, M.N.; Stanković, Z.Z.; Mančić, M.V.; Milosavljević, P.M.; Maksimović, R. Business Process Reengineering with a Circular Economy PDCA Model from the Perspective of Manufacturing Industry. Processes 2024, 12, 877. [Google Scholar] [CrossRef]
  61. Singh, J.; Gandhi, S.K. Benefits Using PDCA Cycle of Continuous Improvement in Manufacturing Industry—A Case Study. Int. J. Manag. Concepts Philos. 2024, 17, 83–97. [Google Scholar] [CrossRef]
  62. Hakim, L.; Rosadi, K.I.; Widdah, M.E.; Shalahudin, M.M. Did PDCA Cycle, Service Quality and Innovation Capability Influence Private Universities Performance? Syst. Rev. Pharm. 2020, 11, 874–883. [Google Scholar]
  63. Röthlin, M. Management of Data Quality in Enterprise Resource Planning Systems, 1st ed.; Reihe: Wirtschaftsinformatik; Eul: Lohmar, Germany; Köln, Germany, 2010; ISBN 978-3-89936-963-2. [Google Scholar]
  64. Sautter, T.; West, S.; Biesinger, B.; Powell, D. Transforming a New-Build Factory into a Service Operations Workshop: A PDCA Approach to Change Management in Industrial Servitization. In Advances in Production Management Systems. Production Management Systems for Volatile, Uncertain, Complex, and Ambiguous Environments, Proceedings of the 43rd IFIP WG 5.7 International Conference, APMS 2024, Chemnitz, Germany, 8–12 September 2024; IFIP Advances in Information and Communication Technology; Springer Nature: Cham, Switzerland, 2024; pp. 229–244. ISBN 978-3-031-71636-2. [Google Scholar] [CrossRef]
  65. Belash, O.Y.; Ryzhov, N.G. The Stakeholders’ Feedback Mechanisms for Degree Programs Quality Assurance. In Proceedings of the 2018 IEEE International Conference Quality Management, Transport and Information Security, Information Technologies (IT&QM&IS), St. Petersburg, Russia, 24–28 September 2018; IEEE: Piscataway, NJ, USA, 2018; pp. 35–39. [Google Scholar] [CrossRef]
  66. JASP Team. JASP (Version 0.95.0) [Computer Software]. 2024. Available online: https://jasp-stats.org/ (accessed on 21 May 2025).
  67. Kaur, P.; Stoltzfus, J.; Yellapu, V. Descriptive Statistics. Int. J. Acad. Med. 2018, 4, 60–63. [Google Scholar] [CrossRef]
  68. Johnson, R.B.; Onwuegbuzie, A.J.; Turner, L.A. Toward a Definition of Mixed Methods Research. J. Mix. Methods Res. 2007, 1, 112–133. [Google Scholar] [CrossRef]
  69. Patton, M.Q. Qualitative Research & Evaluation Methods: Integrating Theory and Practice, 4th ed.; SAGE: London, UK; New Delhi, India, 2015; ISBN 978-1-4129-7212-3. [Google Scholar]
  70. Jackson, R.L.; Drummond, D.K.; Camara, S. What Is Qualitative Research? Qual. Res. Rep. Commun. 2007, 8, 21–28. [Google Scholar] [CrossRef]
  71. Zoomsphere. Available online: https://www.zoomsphere.com/ (accessed on 21 February 2024).
  72. Bocianowski, J.; Wrońska-Pilarek, D.; Krysztofiak-Kaniewska, A.; Matusiak, K.; Wiatrowska, B. Comparison of Pearson’s and Spearman’s Correlation Coefficients for Selected Traits of Pinus sylvestris L. Biom. Lett. 2024, 61, 115–135. [Google Scholar] [CrossRef]
  73. KPMG. Available online: https://kpmg.com/sk/sk/home/campaigns/2023/03/najoblubenejsie-znacky-na-slovensku-za-rok-2022-cx.html (accessed on 31 January 2024).
  74. Kantar Media. Available online: https://www.kantarmedia.com (accessed on 4 February 2024).
  75. Ghanad, A. An Overview of Quantitative Research Methods. Int. J. Multidiscip. Res. Anal. 2023, 6, 3794–3803. [Google Scholar] [CrossRef]
  76. Olanrewaju, A.-S.T.; Hossain, M.A.; Whiteside, N.; Mercieca, P. Social Media and Entrepreneurship Research: A Literature Review. Int. J. Inf. Manag. 2020, 50, 90–110. [Google Scholar] [CrossRef]
  77. Kuphanga, D. Questionnaires in Research: Their Role, Advantages, and Main Aspects; ActionAid International: Amsterdam, The Netherlands, 2024. [Google Scholar] [CrossRef]
  78. Thukral, S.; Kovac, S.; Paturu, M. Chi Square. In Translational Interventional Radiology; Elsevier: Amsterdam, The Netherlands, 2023; pp. 145–148. ISBN 978-0-12-823026-8. [Google Scholar]
  79. Dodge, Y. Binomial Test. In The Concise Encyclopedia of Statistics; Springer: New York, NY, USA, 2008; pp. 47–49. ISBN 978-0-387-31742-7. [Google Scholar]
  80. Su, Z.; Wang, L.; Liao, J.; Cui, X. Peer Effects in Corporate Advertisement Expenditure: Evidence from China. Res. Int. Bus. Financ. 2023, 64, 101808. [Google Scholar] [CrossRef]
  81. Balida, D.A.R.; Encarnacion, R.E.; Siyyabi, B.A.A.A.; Alegre, R.A. The Utilisation of Social Media Platforms for Brand Image and Market Position Development Among SMEs. In Mixed Methods Perspectives on Communication and Social Media Research; Routledge: London, UK, 2022; pp. 113–128. ISBN 978-1-003-26588-7. [Google Scholar]
  82. Rauf, S. Impact of Television advertisement on Consumer Behavior: Targeting the Young Customers. Print Radio TV Film. Stud. 2020, 1, 16–28. [Google Scholar] [CrossRef]
  83. Saha, T.; Kumar, N.; Jannat, F.; Nahar, N. Influence of Social Media on Brand Positioning and Brand Equity: A Study on Fast Moving Consumer Goods of Bangladesh. Eur. J. Bus. Manag. 2021, 13, 118–125. [Google Scholar] [CrossRef]
  84. Kim, A.J.; Ko, E. Do Social Media Marketing Activities Enhance Customer Equity? An Empirical Study of Luxury Fashion Brand. J. Bus. Res. 2012, 65, 1480–1486. [Google Scholar] [CrossRef]
  85. Laradi, S.; Elfekair, A.; Alrawad, M.; Hashim, M.; Derouez, F. Leveraging capabilities of social media marketing for business success. Comput. Hum. Behav. Rep. 2024, 16, 100524. [Google Scholar] [CrossRef]
  86. Parveen, F.; Jaafar, N.I.; Ainin, S. Social Media’s Impact on Organizational Performance and Entrepreneurial Orientation in Organizations. Manag. Decis. 2016, 54, 2208–2234. [Google Scholar] [CrossRef]
  87. Nilasari, B.M.; Jasfar, F.; Sri Wahyudi, A. The Effect of Interactivity, Cost Effectiveness, and Compatibility on the Use of Social Media and Its Implications for Organizational Performance. Am. Res. J. Bus. Manag. 2019, 5, 1–17. [Google Scholar] [CrossRef]
  88. Soviar, J.; Holubčík, M.; Vodák, J.; Rechtorík, M.; Pollák, F. The Presentation of Automotive Brands in the On-Line Environment—The Perspective of KIA, Peugeot, Toyota and VW in the Slovak Republic. Sustainability 2019, 11, 2132. [Google Scholar] [CrossRef]
  89. Dermawan, E.M.; Barkah, C.S. Effective Communication in Advertising. J. Ekon. Bisnis Entrep. (e-J.) 2022, 16, 148–155. [Google Scholar] [CrossRef]
  90. Pires, P.B.; Santos, J.D.; Brito, P.Q.D.; Marques, D.N. Connecting Digital Channels to Consumers’ Purchase Decision-Making Process in Online Stores. Sustainability 2022, 14, 14392. [Google Scholar] [CrossRef]
  91. Koman, G.; Boršoš, P.; Kubina, M. Sustainable Human Resource Management with a Focus on Corporate Employee Recruitment. Sustainability 2024, 16, 6059. [Google Scholar] [CrossRef]
  92. Stříteská, M.; Zapletal, D.; Jelínková, L. Performance Management Systems in Czech Companies: Findings from A Questionnaire Survey. E&M Econ. Manag. 2016, 19, 44–55. [Google Scholar] [CrossRef]
  93. Striteska, M.; Jelinkova, L. Strategic Performance Management with Focus on the Customer. Procedia—Soc. Behav. Sci. 2015, 210, 66–76. [Google Scholar] [CrossRef]
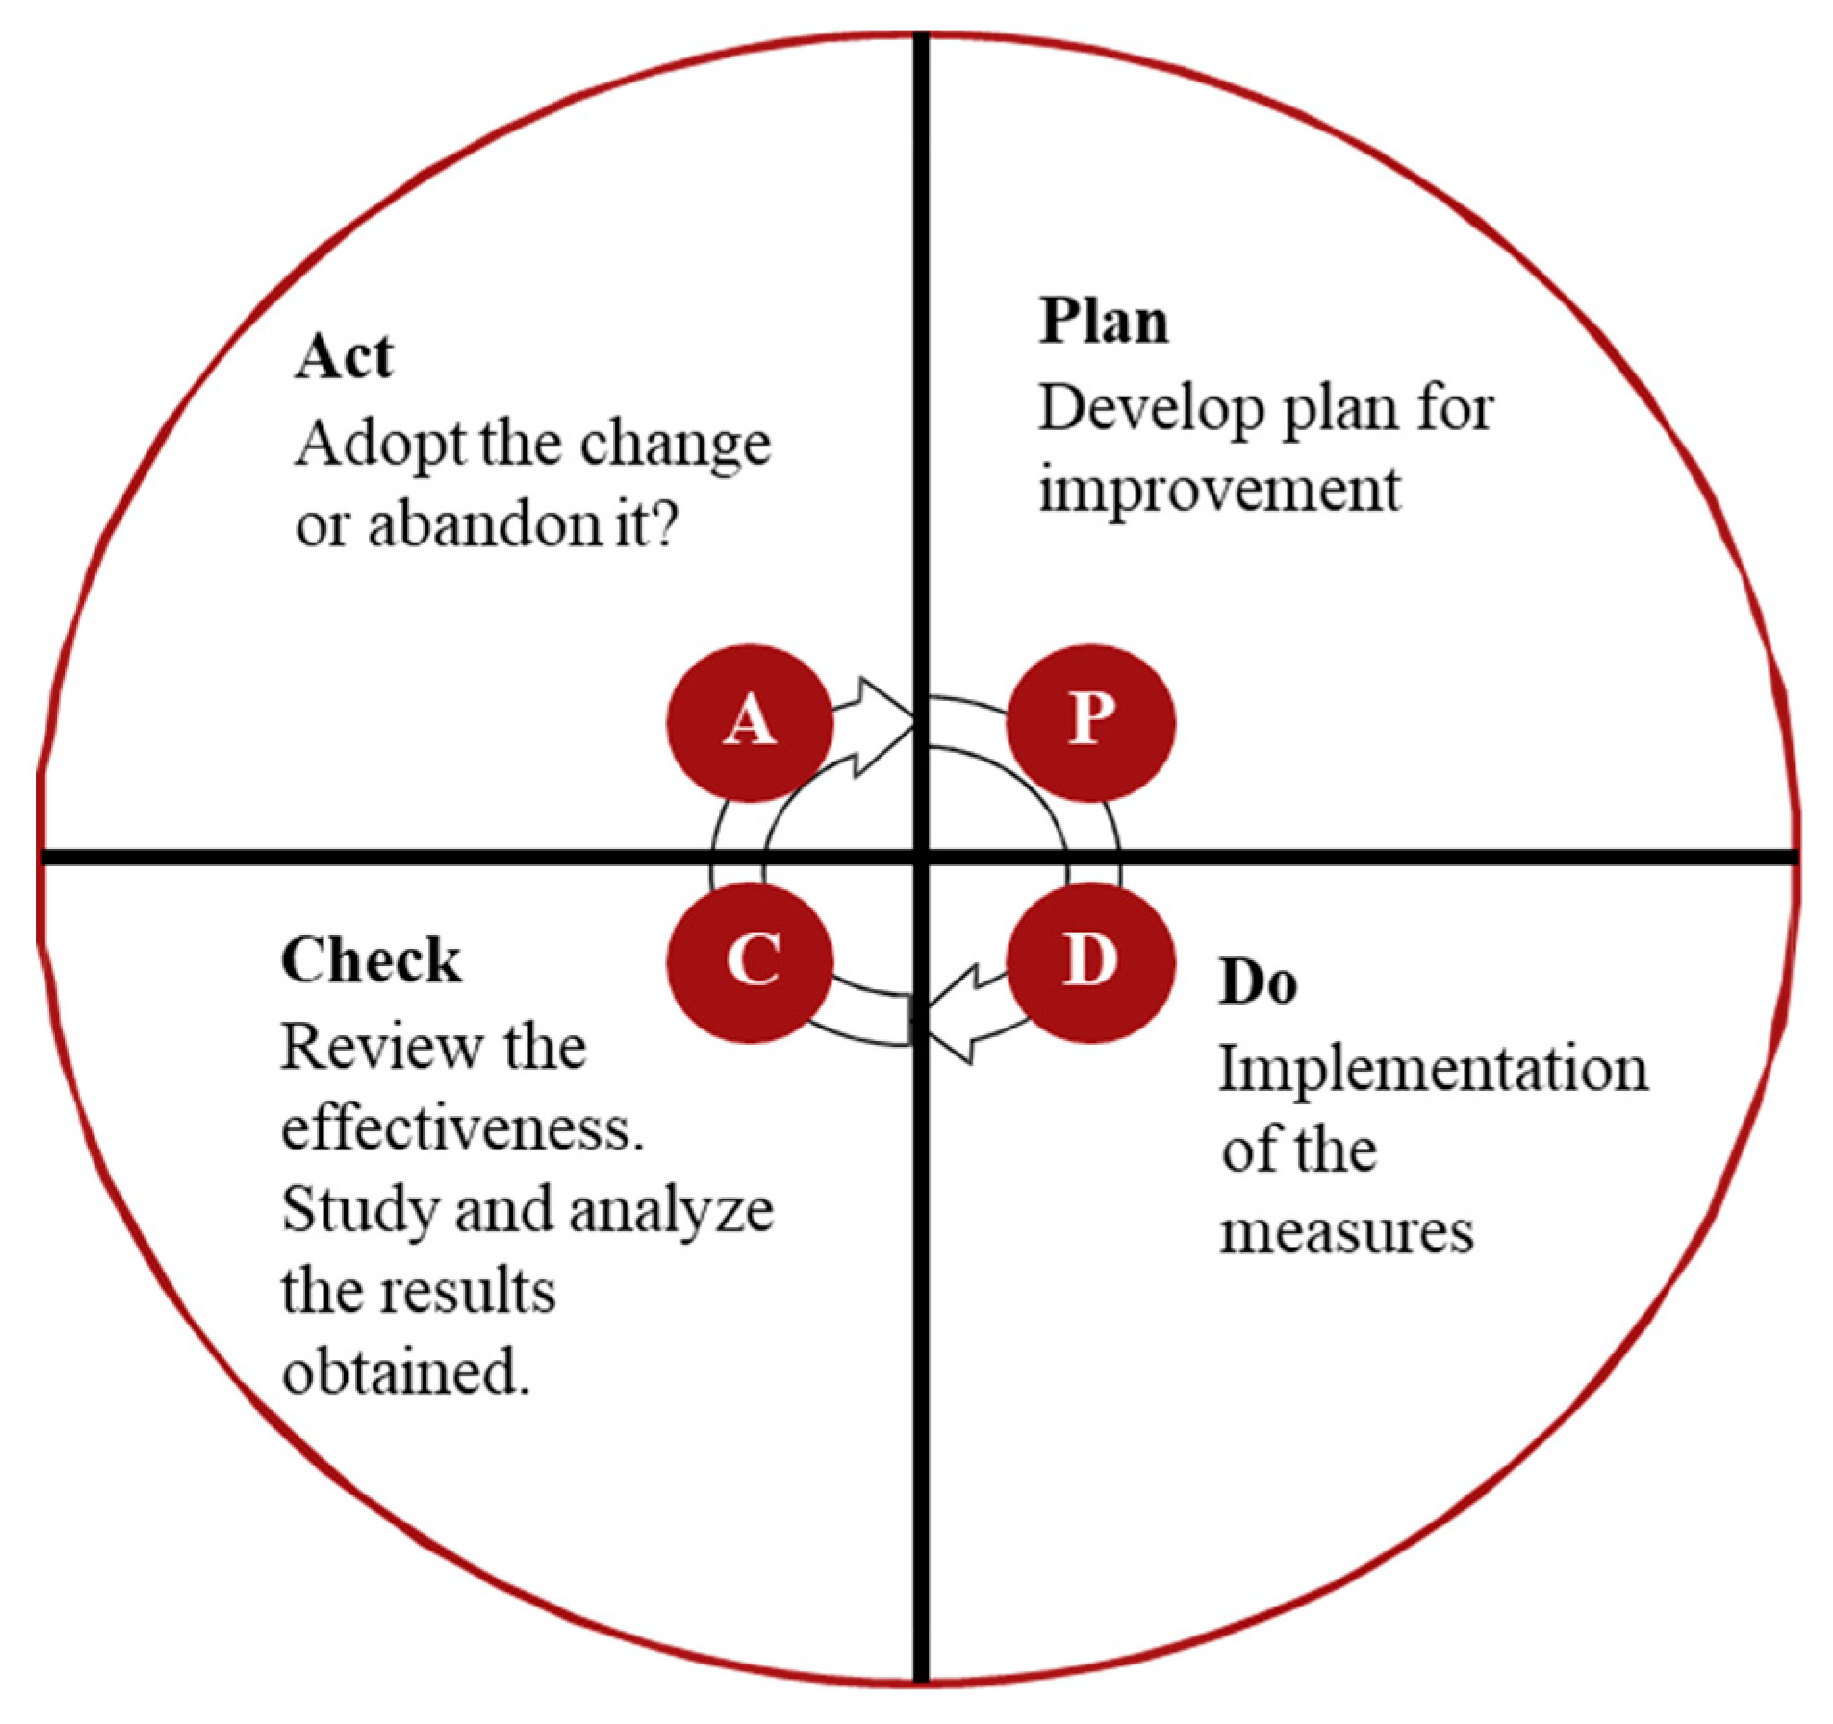
Figure 1. PDCA cycle [58].
Systems 13 00721 g001
Figure 2. Relationship between expenditure on advertising and market position in 2022.
Systems 13 00721 g002
Figure 3. Communication channels through which customers are most often informed the company and its products.
Systems 13 00721 g003
Figure 4. The impact of employee recommendations on purchasing decisions.
Systems 13 00721 g004
Figure 5. The impact of advertising on purchasing decisions.
Systems 13 00721 g005
Figure 6. The impact of influencer marketing on purchasing decisions.
Systems 13 00721 g006
Figure 7. Decision-making model for sustainable marketing communication (PDCA-based).
Systems 13 00721 g007
Table 1. The classification of communication mix tools for services, according to Wirtz [39].
AdvertisingSales Support/Sales PromotionDirect Personal CommunicationsPublic (Media) RelationsService Access PointsCorporate Design and Brand Presentation
Broadcast media—adverts via television and radio
Press/printed channels—newspaper and magazines
Outdoor advertising—billboards, posters
Direct/targeted marketing campaigns
Online/digital marketing via online platforms
Product free Sampling
Vouchers and coupons for future purchase
Free gifts, complimentary items, giveaways
Sign up for loyalty (reward) schemes
Cash-back offers, rebates
Price offers and discounts
In-person selling—face to face
Telemarketing—phone based communication
Trainings, educations, workshops, seminars.
Trade shows and exhibitions
Word of mouth, recommendations
Online communication via social media and platforms and online communities
Press releases/kits/media statements
Press conferences, meetings and briefings
Hosting special public and stakeholders events
Sponsorships and supporting events
Thought leadership content and expert opinions
Coverage in both traditional and online media
Physical service points for customers
Staff/employees in frontline
Self-service points and automated kiosks
Company’s websites, digital portals and mobile apps
Brochures with detailed information
FAQs with the answers on them
Business signage and logo
Décor, furnishing, equipment and interior design reflecting corporate style
Vehicles branding
Corporate uniforms and standardized employee dress code
Table 2. Research questions (RQ) and hypotheses (H).
Research QuestionsHypothesis 0Hypothesis
RQ1: What is the impact of social media use and online marketing activities on brand perception and position? H0: There is no relationship between the level of interaction on social networks and the company’s market position.H1: A higher average monthly engagement rate on social media increases a company’s market share.
RQ2: Is the level of investment in advertising linked to a higher market share for telecommunications companies in Slovakia?H0: There is no relationship between marketing investment and market shareH2: The higher the annual advertising investment, the higher the company’s annual percentage market share.
RQ3: Which marketing communication channels have the most significant influence on customers’ purchasing decisions?H0: Personal recommendations from employees have no greater influence on the final purchasing decision than traditional television advertising.H3: Employee recommendations have a greater influence on purchasing decisions than television advertising.
RQ4: Which marketing communication channels are most preferred by customers?H0: The share of customers who prefer direct personal channels is no higher than 50%.H4: More than 50% of customers prefer direct personal communication channels over impersonal channels when making purchasing decisions.
Table 3. Research phases, objective, data collection and analysis.
Phase ObjectiveData/ResearchData Collection Methods of Analysis
1.StrategicDefine the position in the market and compare the marketing communication activities used by the most significant competitors.Qualitative/Quantitative/Secondary/PrimarySurveys conducted, annual reportsRQ1, H1Content analysis, Comparative analysis
Statistical method:
Spearmans
Correlations, Pearson’s Correlation
Descriptive statistic
RQ2, H2
2.AnalyticalAnalyse the influence of the communication mix tools on the customers’ behaviour and brand perception.Quantitative/PrimaryQuestionnaire SurveyRQ3, H3Chi-square testing
Descriptive statistic
ImplementationEvaluate customer preferences and select the most effective tools for campaign implementation.Quantitative/PrimaryQuestionnaire SurveyRQ4, H4Binomial testing
Table 4. Comparison of activity on social networks (1 August 2023–20 February 2024).
CompanyFollowersChangeInteractionActivity
Systems 13 00721 i001
Orange
30,055,722−61,811 (−0.21%)Systems 13 00721 i005 7252
Comments: 2872
Shares: 971
Total: 11,095
Links: 9
Videos: 18
Photos: 74
Total: 101
Systems 13 00721 i002
Telekom
232,646−224 (−0.1%)Systems 13 00721 i005 10,094
Comments: 6473
Shares: 983
Total: 17,550
Links: 9
Videos: 29
Photos: 34
Total: 72
Systems 13 00721 i003
O2 SK
221,179−14 (−0.01%)Systems 13 00721 i005 22,162
Comments: 21,287
Shares: 2891
Total: 46,340
Links: 18
Videos: 5
Photos: 38
Total: 61
Systems 13 00721 i004
4 ka
69,581+1341 (+1.93%)Systems 13 00721 i005 36,532
Comments: 8862
Shares: 1958
Total: 47,352
Links: 31
Videos: 10
Photos: 142
Total: 183
Table 5. Advertising expenditures and ranking in 2022.
CompanyAdvertising ExpenditureAllocated to TV AdvertisingRanked Based on Spending on AdvertisingMarket Position
Orange Slovakia74,808,08699.3%11
Slovak Telekom72,842,75297.9%23
O245,970,424-32
Others<12,000,000-44
Table 6. Descriptive analysis of advertising expenditures and key social media indicators [66].
MinimumMaximumMeanMedianStd. Deviation
Advertisement expenditure (EUR)1.200 × 1077.481 × 1075.141 × 1075.941 × 1072938 × 107
Followers69,581.0003.006 × 1077.645 × 106226,912.5001.494 × 107
Interactions11,095.00047,352.00030,584.25031,945.00018,965.966
Number of company activities61.000183.000104.25086.50055.145
Table 7. Descriptive statistics of influence aspects on customers’ decision-making [66].
MinimumMaximumMeanMedianSt.dev
Employees16.000 (11.000%)53.000 (35.000%)37.500 (25.000%)40.500 (27.000%)15.503 (10.066%)
Advertising12.000 (11.000%)67.000 (45.000%)37.500 (25.000%)35.500 (23.500%)25.878 (17.455%)
Influencers16.000 (11.000%)62.000 (41.000%)37.500 (25.000%)36.000 (24.000%)20.889 (13.565%)
Table 8. Summary of Hypothesis, Tested Variables, Methods, Results, Statistical Indicators and Conclusions.
HypothesisTested Variables/RelationshipMethods UsedResultStatistical IndicatorsConclusion
H1Relationship between the level of interaction on social media and the company’s market positionCorrelation analysis (Pearson correlation coefficient)Positive correlation confirmedr = 0.67; p < 0.01Hypothesis confirmed
H2Relationship between the volume of marketing investments and market shareLinear regression analysisSignificant positive relationshipR2 = 0.54; p < 0.05Hypothesis confirmed
H3Influence of personal employee recommendations vs. traditional advertising on customer decision-makingComparison of means (t-test)Significant difference in favour of personal recommendationst = 2.89; p = 0.004Hypothesis confirmed
H4Customer preference: digital vs. traditional channelsDescriptive statistics, comparison of meansHigher preference for digital channels68% of respondents prefer digital; p < 0.05Hypothesis confirmed
Table 9. Phases of decision-making and study findings.
Recommended ActivityActivity Based on the StudyHypothesis Verified
StrategicDefine communication objectives aligned with corporate goals, identify target customer segments, and select the most suitable communication tools to achieve these objectives. Define the company’s market position and compare the marketing communication strategies of key competitors.The level of marketing investment and market position have a positive correlation.
The level of interactions on social media and market position have a negative correlation.
AnalyticalCollect and analyse data on market trends, campaign performance, costs, and communication effectiveness.Analyse the impact of communication mix tools on customers’ behaviour and brand perception.Personal recommendations from employees have a greater impact on customer decision-making than advertising in the media, when implemented as part of a strategy.
ImplementationExecute the communication campaign and make tactical and operational adjustments based on feedback and results.Evaluate customer preferences and identify the most effective tools for campaign implementation.Leaders’ customers prefer non-personal communication.
Table 10. Practical checklist for companies (recommended PDCA framework).
StepQuestionRecommended Action
PlanDo we know which channels our customers prefer?Survey customer preferences (e.g., questionnaire, interaction analysis).
DoAre campaigns tailored to the target audience?Segment customers by age and behaviour and select the appropriate channels.
CheckDo we measure the impact of individual channels?Track metrics such as engagement, conversion, and ROI at the level of each tool.
ActDo we tailor campaigns based on results?Optimise your budget based on effectiveness and customer feedback.
Table 11. PDCA cycle for leaders and other companies.
LeadersOthers
Marketing communication orientationBroader customer base, more financial resources, and comparison with the competition of the largest market leadersFocus on a specific segment, and make an effective investment.
PlanMass communication campaign planPersonalised communication campaign plan
DoTV advertising with higher investmentCommunication via social media, higher interaction, and higher influence of activities
CheckMarket research, influence of TV advertisement, number of new customers acquired, volume of up-selling and cross-sellingCustomer reviews and satisfaction on social media, satisfaction via survey, and increasing customer value
ActContent change of campaigns, re-evaluation of investment used, re-evaluation of communication mix usedChange in investment, increase/decrease in the volume of interactions on social networks, personalised campaigns
Table 12. Application of the PDCA Cycle to the Christmas Marketing Campaign of Slovak Telekom.
GoalChristmas Campaign 2023
PlanPreparation of a Christmas campaign focused on promoting the company’s values and addressing social issues, specifically, highlighting inclusion and diversity under the theme “Respect.” Measurable objectives and campaign budget were defined.
DoLaunch of the campaign—TV commercial featuring various types of families and situations during Christmas dinner.
CheckContinuous monitoring and evaluation of the campaign—the company tracked public reactions, social media discussions, the ratio of positive to negative feedback, and overall media coverage.
Findings—public opinion was polarised—some viewers praised the ad, while others criticised it, considering it inappropriate and calling for its withdrawal.
ActIn response to the feedback, the company issued a public statement to clarify the campaign’s message, adjusted the tone of communication, and ultimately withdrew the commercial from broadcast.
Table 13. A PDCA-Based Management Checklist for Communication Strategy Evaluation.
PDCA PhaseKey Managerial ActionsExample of Questions for Process TrackingRecommended Activity
PlanDefine objectives, target audience, and allocate budgetWhat are the goals of the campaigns? Who are we trying to reach? How will the resources be distributed?Conduct market research—Analyse customer behaviour. Define KPIs and success metrics. Create a campaign brief.
DoExecute the communication strategyAre messages tailored to the audience? Are all communication tools in place? Are the messages conveyed clear and concise?Develop content and creative materials. Coordinate internal teams, employee training and motivating. Launch campaign through selected channels.
CheckMonitor and evaluate campaign performanceAre engagement and reach meeting expectations? What is the tone of public response?Track analytics (e.g., impressions, comments, interactions) on social media. Conduct sentiment analysis. Monitor social media and media coverage. Monitor audience reactions and customer satisfaction.
ActAdapt strategy based on feedback and performanceWhat adjustments are needed?
Should the budget or message be changed?
Revise the campaign based on data. Reallocate budget it necessary. Issue public statement or clarification. Update internal communication guidelines. Campaign withdrawal.
Disclaimer/Publisher’s Note: The statements, opinions and data contained in all publications are solely those of the individual author(s) and contributor(s) and not of MDPI and/or the editor(s). MDPI and/or the editor(s) disclaim responsibility for any injury to people or property resulting from any ideas, methods, instructions or products referred to in the content.