Abstract
With the accelerated development of economic globalization, it is of great significance to strengthen the ability to measure, evaluate, and warn of systemic financial risks for preventing and defusing financial risks. Thus, this research established the Time-Varying Parameter Factor-Augmented Vector Autoregression model (TVP-FAVAR), combined with the Markov Regime Switching Autoregressive Model, to dynamically measure China’s systemic financial risk. The network public opinion index is constructed and introduced into the financial risk early warning system to capture the dynamic impact of market sentiment on financial risks. After testing the nonlinear causal relationship between financial indicators based on the transfer entropy method, the Transformer deep learning model is applied to build a financial risk early warning system, and the performance is compared to traditional methods. The experimental results showed that (1) the trend of the systemic financial risk index based on the dynamic measurement of the TVP-FAVAR model fitted the actual situation well and that (2) the Transformer model public opinion index could fully and effectively mine the nonlinear relationship between data. Compared to traditional machine learning methods, the Transformer model has significant advantages in stronger prediction accuracy and generalization ability. This study provided a new technical path for financial risk early warning and has important reference value for improving the financial regulatory system.
1. Introduction
In today’s world, the businesses of various financial institutions are interpenetrating and interconnected, forming a huge and complex financial market network. Although this deep connection has improved the efficiency of resource allocation, it has also led to the evolution of financial risks from the individual risks of single institutions to more comprehensive and complex systemic risks; consequently, the difficulty of risk isolation has increased, and the challenges of risk prevention and control are becoming increasingly severe. Against this background, traditional financial risk supervision can hardly cope with the systematic transmission of risks. Therefore, in order to realize early identification, early warning, and early treatment of systemic financial risks, it is of great theoretical and practical significance to explore the dynamic change law of systemic financial risks and establish an early warning system for these risks.
The efficient and scientific measurement of systemic financial risk is a vital issue in the study of early warning of risks [1]. For the early monitoring of systemic financial risks, scholars mainly use the value-at-risk (VaR) method [2]. The VaR model measures the potential maximum loss of an asset portfolio in a specific period by setting a confidence interval [3], but it also suffers from the obvious drawback of being unable to accurately measure expected losses under extreme market conditions [4,5]. Based on this deficiency, scholars have proposed the expected loss (EL) indicator, which is more sensitive to the shape of the tail of the loss distribution [6,7]. Furthermore, scholars have proposed the use of marginal expected loss (MEL) [8] and systemic expected loss (SEL) [9] to measure the expected losses that a single financial institution may face when the market yield drops significantly [10]; these tools can be used to compare the risk contributions of various institutions.
However, special information and irrelevant noise can affect the reliability of a single measurement indicator, such that it can only reflect one aspect of financial risk and cannot fully and comprehensively measure the risk of an entire financial system [11]. At the same time, due to the development of financial markets, a single risk indicator can no longer accurately measure the trend of systemic financial risk in a complex and changing financial environment [12]. Therefore, research on systemic financial risk measurement indicators has begun to turn to the construction of an indicator system or a comprehensive indicator [13]. Many scholars use methods such as PCA and entropy weight to synthesize various risk indicators into a comprehensive index that can be used to measure systemic financial risk [14,15]. However, the indicator weights of the entropy weight method and principal component analysis method are mostly subjectively set and relatively fixed [16]. In recent years, scholars have begun to widely use models based on time-varying parameters (TVPs) to construct dynamic weights that change over time [17,18,19].
One valid way to prevent and reduce systemic financial risks is to establish an early warning system. In the early days, the academic community mainly used traditional statistical and econometric models to build early warning models [20]. Mainstream models include the regression model [21], the Bayesian network [22], hierarchical clustering [23], and the Markov Switching Model [24]. Although these models exhibit good performance in static forecasting, they face challenges in describing dynamic changes. Some scholars have also used the MS-VAR model, after constructing a systemic financial risk index, to identify and judge the risk index status and provide early warning information [25].
Compared to traditional econometric models, machine learning methods can better capture the complex correlation characteristics between multiple variables, which has opened up a new path for risk early warning research [26]. Ristolainen (2018) predicted the occurrence of banking crises by constructing an ANN-based model. The results showed that this model is a very promising tool for predicting banking crises [27]. Bluwstein et al. (2023) used machine learning technology to predict financial crises. The study found that most nonlinear machine learning models, such as random forest, performed better than logistic regression [28].
Moreover, with the advancement of technology, some hybrid machine learning methods and deep learning models, such as the Long Short-Term Memory (LSTM) neural network, have been applied in the early warning of financial risks [29]. Ouyang et al. (2021) proposed an Attention-LSTM neural network model and studied its application in the early warning of systemic risks in China [30]. Tang et al. (2024) found that the LSTM model achieved effective dynamic forecasting in a multidimensional network, with the forecasting network being essentially consistent with the actual network [31].
Although the abovementioned traditional models have achieved a certain degree of success in the early warning of systemic financial risks, they still entail significant limitations in terms of their prediction accuracy and generalization ability in the face of the high-dimensional nonlinear characteristics and time-varying structure of financial markets. In recent years, the Transformer deep learning framework has demonstrated groundbreaking advantages in capturing long sequence dependencies and unstructured data features thanks to its unique self-attention mechanism [32]. However, the literature on its application in the field of financial risk early warning remains scarce.
According to the above summary of the existing literature, great progress has been made in research on the measurement and early warning of systemic financial risks. However, there are still many issues that necessitate further examination, such as the limitations of measurement indicator dimensions, the time-varying characteristics of market structure, and professional text information processing. Based on this, the marginal contributions of this study are as follows:
(1) The establishment of the TVP-FAVAR model for constructing a systemic financial risk index. This model captures the dynamic evolution of the financial system through time-varying parameters (TVPs), overcoming the limitations of traditional static models. Additionally, the FAVAR model addresses the issue of dimensionality that affects conventional VAR models when processing high-dimensional macroeconomic data.
(2) The construction of a financial risk early warning system based on the Transformer model. The Transformer model is a deep learning architecture based on a self-attention mechanism that effectively captures nonlinear relationships and long-term dependencies in financial data. It efficiently resolves the long-range dependency problem faced by traditional recurrent neural networks when processing long sequences. Compared to conventional early warning models, this model demonstrates higher accuracy and robustness in out-of-sample forecasting.
(3) The innovative introduction of the network public opinion index into the early warning system. By scraping stock discussion forum text data, a network public opinion index is constructed to reflect irrational behavior among market participants. This not only enhances the effectiveness and scientific rigor of the early warning system but also expands the boundaries of traditional quantitative analysis.
The rest of our study is structured as follows: Section 2 introduces the models and methods established in this study. Section 3 analyzes the measurement results of China’s systemic financial risk index. Section 4 builds an early warning system based on the systemic financial risk index and compares its performance to that of traditional models. Section 5 presents the conclusions of this study and proposes some suggestions for risk prevention. The framework of this study is presented in Figure 1.
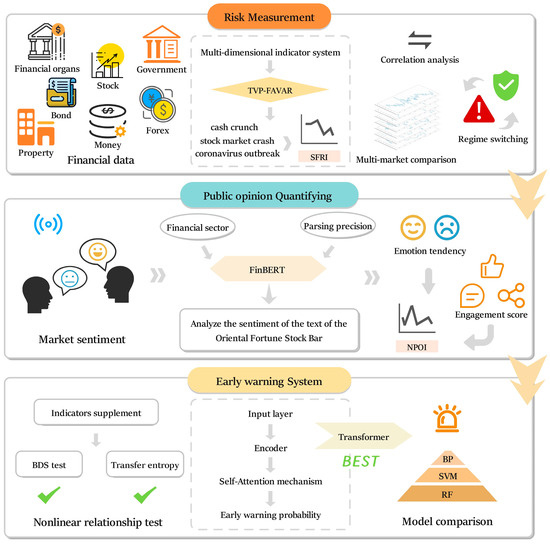
Figure 1.
Framework of this study. Arrow indicates the direction of the flow.
2. Model Construction
The work undertaken in this study on the dynamic measurement and early warning of systemic financial risk includes the construction of a systemic financial risk index (SFRI), a network public opinion index (NPOI), and a systemic financial risk early warning system. This section introduces the basic theory and framework of this process.
2.1. Construction of the Systemic Financial Risk Index (SFRI)
In this section, the Time-Varying Parameter Factor-Augmented Vector Autoregression model is established and used to construct the systemic financial risk index (SFRI). This process includes state space model setting, parameter evolution, and dynamic weighting.
2.1.1. State Space Model Setting
The traditional Vector Autoregression (VAR) model has obvious dimensional limitations when dealing with high-dimensional macroeconomic data [33]. The Factor-Augmented Vector Autoregression (FAVAR) model alleviates these dimensionality issues by integrating factor analysis and the VAR framework, but its fixed parameter assumption means that it struggles to capture the time-varying characteristics of financial risks. Although the Time-Varying Parameter (TVP)-VAR model introduces time-varying properties, it has the problem of the “curse of dimensionality”. To overcome the abovementioned problems, this paper constructs a Time-Varying Parameter Factor-Augmented Vector Autoregression (TVP-FAVAR) model. By combining the dimensionality reduction advantage of FAVAR with the time-varying characteristics of TVP-VAR, the model can more effectively capture the structural mutations and policy shock effects of the financial market. At the same time, it can reflect changes in the importance of variables in real time through its dynamic weight mechanism and more accurately characterize the dynamic evolution of risk factors.
Based on the idea of factor augmentation [20], this paper constructs a state space system containing latent factors and observable variables. The model is divided into observation equations and state equations, which transform the dynamic evolution of systemic risk into a recursive estimation of state variables. The specific equation for this calculation is as follows:
where is the endogenous variable vector, representing the macroeconomic and financial information set (t = 1, …, T); is the potential common factor vector, representing the core driving factors of systemic risk; is the time-varying factor loading matrix, characterizing the sensitivity of endogenous variables to common factors; is the observation noise covariance matrix, ensuring the independence of heterogeneous shocks; represents the time-varying coefficient matrix (p is the lag order), describing the autoregressive dynamics of common factors; is the equation of state noise; and is the state noise covariance matrix, which is adaptively adjusted by the attenuation factor.
2.1.2. Parameter Evolution Process
In the initialization phase, common factors are extracted from high-dimensional endogenous variables through dynamic factor analysis. First, the Minnesota prior distribution is used to constrain the parameter space, and the lag operator matrix is constructed to generate the lag term combination of . Then, the Kalman filter iteration is run to calculate the one-step forward forecasting value and the Kalman gain matrix, and modified parameter estimation is performed. The specific calculation steps are as follows.
where and are the factor loading matrix and the predicted value of the factor at moment t (based on the information at moment t − 1), respectively; is the Kalman gain used to dynamically balance the weights of new observations and historical predictions; and is the state prediction error covariance matrix, which is used to estimate the state uncertainty.
Finally, the time-varying parameters are updated; for this, a random walk process is adopted for the factor loading matrix, while the VAR coefficient matrix is updated through the state space model:
where is the noise term of the load matrix, with denoting the covariance matrix of the load matrix noise, and is the noise term of the VAR coefficients, with denoting the covariance matrix of the VAR coefficient noise.
2.1.3. Dynamic Weighting Process
Our proposed measurement model calculates the dynamic weight by extracting the absolute value of the dominant factor loading matrix and then normalizing it by dividing it by the sum of the absolute values of all variable loadings to ensure that the sum of the weights is 1. The time-varying weights are dynamically adjusted with the factor loadings to capture the time-varying characteristics of variable importance. The calculation method is as follows:
where denotes the loading of variable i on the first principal factor at moment t. Larger absolute values indicate a stronger contribution of the variable to systematic risk.
Finally, this paper synthesizes the systemic risk index by weighting, with a variable’s weight reflecting its time-varying importance to the systemic risk. In this process, regularization technology is used to solve the matrix singularity problem. The model sets up an outlier processing mechanism, and pseudo-inverse substitution is used when the matrix is not invertible. The specific construction method is as follows:
where is the ith standardized financial indicator; n is the total number of indicators; is the n × n unit matrix; and is the regularization coefficient.
2.2. Construction of the Network Public Opinion Index (NPOI)
FinBERT, a pre-trained sentiment analysis model specifically designed for application in the financial field, is applied to construct the NPOI. This model can accurately capture the sentiment tendencies of professional texts and directly output the sentiment intensity in a particular financial context without the need for traditional word segmentation processing, providing professional technical support for the efficient analysis of investor sentiment.
2.2.1. Calculation of the Sentiment Score for a Single Comment
Assuming that the output of the sentiment analysis model for the ith comment is a logical value vector , the sentiment probability distribution is calculated through the Softmax function:
where represents the probability of positive emotion, represents the probability of negative emotion, and represents the probability of neutral emotion.
The sentiment score of a single comment is defined as follows:
This score represents the relative strength of positive and negative emotions, effectively filtering out the interference of neutral emotions, and its absolute value directly reflects the strength of emotional tendencies.
2.2.2. Standardization of Interactive Data
For the interactive feature vector of the ith comment, is the number of reads, is the number of likes, is the number of comments, and is the number of shares.
The min–max normalization method is used:
where and correspond to the sample maximum and minimum values of the k-th interaction feature, respectively. After normalization, .
2.2.3. Interaction Weight Distribution
The interaction type weight vector is defined as follows:
The weights correspond to the number of reads, likes, comments, and shares. The interactive influence score of a single comment is calculated as follows:
Here, likes, comments, and shares reflect the active participation of users; so, they are given a higher weight (0.3), while the number of reads is a passive dissemination indicator and is thus given a lower weight (0.1).
2.2.4. Comprehensive Calculation of the Public Opinion Index
The weighted public opinion score of a single comment is defined as
This index comprehensively reflects the product effect of the emotional tendency of a comment and its communication influence. For a sample containing n valid comments, the overall network public opinion index (NPOI) is defined as
The expanded form is as follows:
In order to improve computational efficiency, this paper standardizes the format of the raw data so that the program can parse the fields efficiently.
2.3. Construction of a Systemic Financial Risk Early Warning System
The Transformer model, a deep learning architecture based on a self-attention mechanism, is applied for early warning. It can effectively solve the long-distance dependency problem faced by traditional recurrent neural networks when processing long sequences. It is very suitable for processing and predicting time series data with complex dependencies. The model includes modules such as a position-aware feedforward network, multi-head attention, and masked multi-head self-attention. After the input has been represented with word element embedding and added to the position code, it enters a module composed of multiple repeated units. In each unit, the internal dependency of the input sequence is first captured by the multi-head self-attention mechanism. After residual connection and layer normalization are carried out by Add & Norm, they are further processed by the position-aware feedforward network. The output part (iterative right shift) is also represented with word element embedding and added to the position code, before it enters multiple repeated units. The units are, in turn, processed by masked multi-head self-attention (shielding future position information), multi-head attention, and the position-aware feedforward network. After each step, residual connection and layer normalization are implemented by Add & Norm. Finally, through linear layer transformation, the output probability is calculated using Softmax function. Figure 2 shows the structure of the Transformer model.
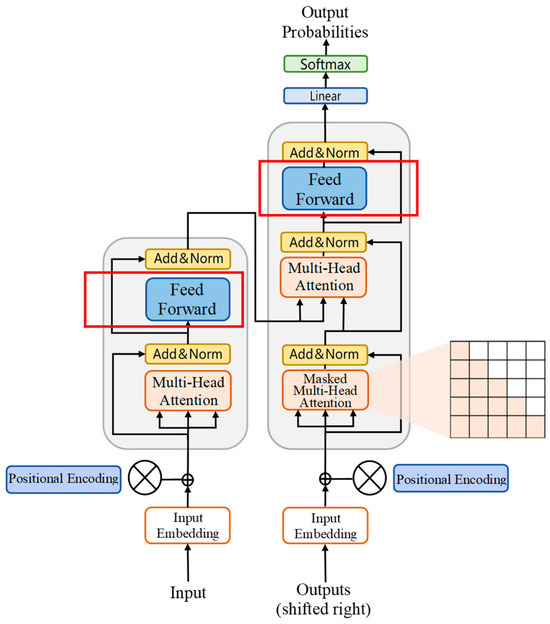
Figure 2.
Transformer structure diagram.
The self-attention mechanism captures the global dependency by calculating the correlation between any two elements in the sequence. For the input sequence , the query matrix , key matrix , and value matrix are first obtained through linear transformation, and then, the attention weight is calculated:
where is the dimension of the key vector. The multi-head attention mechanism runs h groups of self-attention in parallel, concatenates the results, and projects them through . Position encoding is added to the input to provide the model with the positional information of the sequence. The feedforward neural network layer further extracts features.
For deterministic forecasting, several commonly used indicators are used to quantitatively compare the accuracy, stability, and directionality of the proposed forecasting system. Error-based indicators used to measure the system’s forecasting accuracy include the mean absolute error (MAE), root mean square error (RMSE), and Theil inequality coefficient (TIC). The index of agreement (IA) of forecasts is used to measure the degree of similarity between observations and forecasting values. Furthermore, the variance (VAR) of the forecasting error is used to measure the stability of the forecasting model. The concrete calculation formulas for these indicators are presented in Table 1.

Table 1.
Calculation formula for the evaluation indicators.
3. Measuring China’s Systemic Financial Risk
3.1. Data Description
In accordance with the theoretical analysis, and drawing on relevant studies [8,11,12,22], we selected 26 financial indicators corresponding to seven dimensions—financial institutions, the stock market, the bond market, the money market, the foreign exchange market, the real estate market and government agencies—and studied their trends over the period of January 2010 to December 2024. The specific content is shown in Table 2. All data are from CSMAR and Wind databases. For missing data, such as the capital adequacy ratio, the interpolation method was used to fill in these gaps. For quarterly data, such as GDP and the non-performing loan ratio, we referred to relevant studies and converted the data into monthly values using Eviews 13.0 [13,14]. Table 3 shows a descriptive statistical analysis of the various financial indicators. Covering the period from 2010 to 2024, these indicators comprehensively characterize the changes that have occurred in China’s systemic financial risks in recent years.
Table 2.
Indicator system for each dimension.
Table 3.
Descriptive statistics of indicators.
3.2. Time-Varying Analysis of Systemic Financial Risk
3.2.1. Trends in Systemic Financial Risks
Based on monthly data from 2010 to 2024, the TVP-FAVAR model was established and used to construct China’s systemic financial risk index (SFRI). The calculation results are shown in Figure 3. The larger the index value, the higher the risk. It can be seen that, from 2010 to 2012, affected by the European debt crisis, China’s systemic financial risks were consistently at a high level. In 2013, affected by the “money shortage” incident, systemic financial risks continued to rise. In June 2015, the Shanghai Composite Index suddenly fell from a high level, and abnormal fluctuations in the stock market caused the level of systemic financial risk to rise sharply. From 2016 onwards, the Chinese government began to successively introduce strong regulatory policies; the period from 2016 to 2018 is known as “the strictest financial regulatory cycle in history”. During this period, regulatory orders were intensively given out, large fines were continuously issued, and systemic financial risks were effectively curbed. However, after March 2018, factors such as friction in Sino–US trade led to increased pressure on China’s real economy, and the financial market was significantly impacted. The annual report on A-share market value released by the Research Center for Market Value Management of Listed Companies in China states that the market value of the A-share market decreased by about CNY 14.94 trillion in 2018, and systemic financial risks rose again in this period. In early 2020, the COVID-19 epidemic had an impact on the real economy, and the risk exposure of financial institutions expanded. Subsequently, the Chinese government took active measures to restore and stabilize the economy, and systemic financial risks began to gradually decline. In 2021, affected by factors such as the continued overseas epidemic and risk exposure in the real estate industry, China’s systemic financial risks rose again. Since 2022, changes in the international financial environment, such as the tightening of the Federal Reserve’s monetary policy, have caused China’s systemic financial risks to continue to fluctuate at a high level.
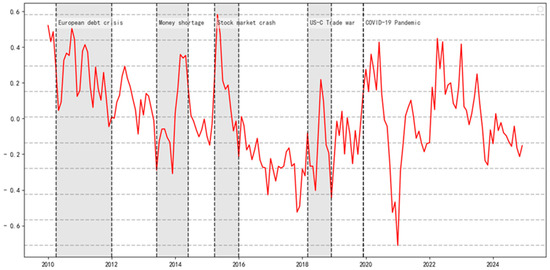
Figure 3.
Trends in systemic financial risks.
3.2.2. Comparative Analysis of Systemic Financial Risks in Various Markets
In order to further analyze the relationship between the systemic financial risk index and various market dimensions, this study constructs China’s systemic financial risk index on the basis of seven aspects, as shown in Figure 4.
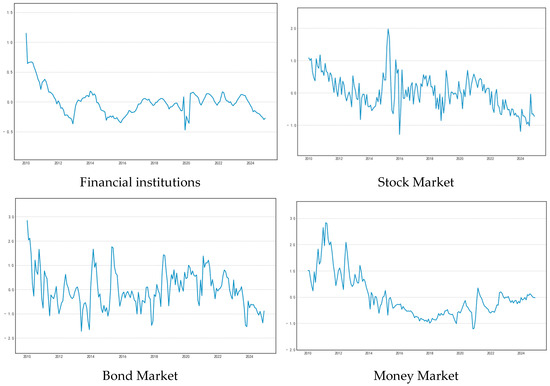
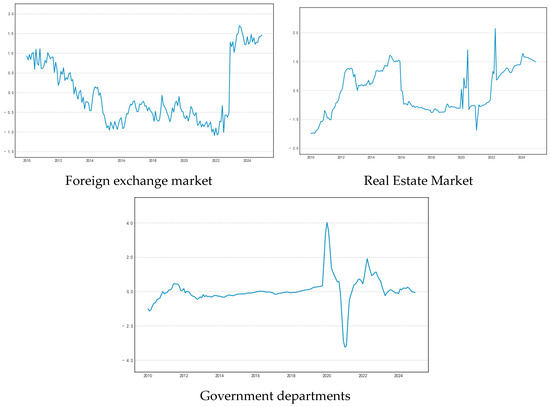
Figure 4.
Dimensional systemic financial risk index.
By using correlation coefficients to analyze the correlation between the SFRI and the seven dimensions shown in Table 4, the relationship between the SFRI and the indicators of each dimension in any given time period can be further analyzed to facilitate more targeted and appropriate risk prevention and control measures.
Table 4.
Correlation coefficient table.
From the correlation, we can see that from January 2010 to December 2024, the markets that align most closely with the trend of the SFRI are the bond market, the money market, financial institutions, government departments, the foreign exchange market, the stock market, and the real estate market. The bond market risk index has the strongest correlation with overall financial risk, confirming its central role in spreading systemic financial risk. When problems occur in the bond market, they directly affect the funding situation of banks, which, in turn, affects the entire financial system. In contrast, the real estate market risk index has the weakest correlation with overall financial risk, reflecting China’s strict control of risk in the real estate market.
According to Figure 4, the financial institutions’ risk index is generally stable, indicating that China has implemented effective supervision of financial institutions. The stock market and bond market are highly volatile, and their trends are basically the same. They both experienced a rapid increase in risk around 2015. The foreign exchange market’s risk rose rapidly after 2022, which may be related to a hike in the US interest rate.
In terms of time, China was greatly affected by the European debt crisis around 2010, which mainly resulted in a rapid increase in financial risks in various dimensional indicators. In 2014, a money shortage incident broke out, and the financial risks in the money market fluctuated sharply. In 2015, affected by the stock market crash, the stock market, bond market, and real estate market risk indicators rose rapidly; during this period, the SFRI was mainly affected by these indicators. In 2020, affected by the COVID-19 epidemic, China’s government risk index fluctuated greatly and then began to decline.
3.2.3. Identification of Risk Status and Inflection Points
Based on the Markov Regime Switching Autoregression Model (MRS-AR), this research constructs a dual-regime model to identify the state of China’s systemic financial risk. The model settings are as follows:
where is the potential state variable, and the transition probability matrix satisfies . According to information criteria such as the AIC and BIC, we chose to use the MSIAH (2)-AR (1) first-order lagged two-regime transition model, where the two regimes represent a low-risk state and a high-risk state, respectively. At the same time, this paper constrains the autoregressive coefficients for different district systems to minimize the risk of overfitting. The transition probability, state probability, and average duration are shown in Table 5.
Table 5.
MSIAH (2)-AR (1) estimation results.
From the volatility in the table above, we can judge that Regime 1 and Regime 2 correspond to low-risk and high-risk states, respectively. The state probability and average duration show that China’s systemic risk tends to remain in a low-risk state for a long time, and the short-term persistence of risk is similar across zones. From Figure 5, it can be seen that China’s systemic financial risks show obvious dual-regime characteristics, among which the high-risk stage is consistent with the previous analysis.
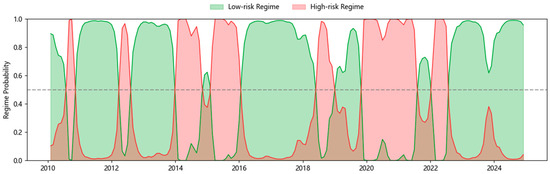
Figure 5.
State probability curve.
4. Research on Early Warning of Systemic Financial Risks in China
In this section, the NPOI is introduced into the financial risk early warning system to improve the performance.
4.1. Network Public Opinion Index
The prevention and control of systemic financial risks always face the complex challenge of integrating multidimensional information. The spread of investor sentiment through online public opinion is a key hidden factor that induces irrational market fluctuations. Therefore, this study further considers introducing the network public opinion index into China’s financial risk early warning system.
Texts in the financial field are characterized by being densely populated with professional terms and being highly dependent on semantic contexts. Traditional methods of constructing public opinion indexes often suffer from distortions in sentiment analysis due to word segmentation bias, a lack of attention to interactions between market participants, and the lack of a unified standard quantitative weight design. These factors make it difficult to accurately capture the intensity and breadth of market sentiment transmission, making it impossible for existing early warning systems to fully and effectively function in extreme market environments.
In the context of the deep integration of big data and financial technology, massive interactive texts generated by platforms such as stock forums and financial forums can provide a suitable resource for the real-time tracking of investor sentiment. In China, not only can user discussions in vertical communities contain investors’ immediate feedback on market events but their interactive data, such as the reading volume and reply volume, can also reflect emotional resonance effects among the group members, providing a unique perspective that facilitates forward-looking judgment of systemic risks. Therefore, building a public opinion index that fits the financial context is not only a key path to solving the problem of a “lack of field adaptation” that characterizes traditional methods but also a necessary step in improving financial risk early warning systems.
In view of this, this study advances the general text processing framework and innovatively uses the financial field pre-training model FinBERT to directly analyze text sentiment, overcoming the challenges faced by traditional word segmentation tools in the semantic segmentation of professional terms and significantly improving the accuracy of sentiment recognition in complex contexts. In addition, this study applied web crawling tools to integrate three million valid posts from 2010 to 2024 in the East Money Stock Forum and incorporated active interaction data, such as likes and reposts, into the weight system. Through differentiated assignment, this strategy highlights the logic that “investors’ active participation behavior can better reflect the real emotional intensity”, more accurately depicting the quality and quantity of emotional communication. As shown in Figure 6, during extreme events, such as the European debt crisis in 2010, the money shortage in 2013, the stock market crash in 2015, and the global epidemic in 2020, the volatility characteristics of the index exhibit significant coupling with changes in systemic market risks, which effectively verifies the rationality and early warning value of the proposed method.
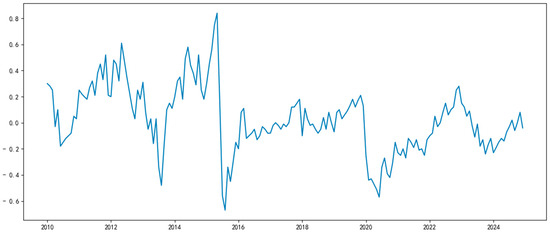
Figure 6.
Network public opinion index trend.
The method of construction of the public opinion index, integrating deep domain models and behavioral weighting mechanisms, not only overcomes the professional barriers posed by the semantic analysis of financial texts but also makes up for traditional indexes’ insufficient quantification of the intensity of emotional transmission. This index provides a new tool that combines accuracy and validity to facilitate the dynamic monitoring of systemic risks and has important practical significance for the improvement of financial market risk early warning systems.
The empirical analysis further proves that there is a nonlinear causal relationship between the early warning indicators included in the network public opinion index and financial risks. They can be included in the early warning system as early warning indicators of financial risks, expanding the dimensionality of financial risk early warning systems.
4.2. Financial Risk Early Warning Indicators
Several macro-state variables, including the network public opinion index, R007, PPI MoM (PPI), inventory YoY of industrial enterprises above a designated size (INV), accounts receivable YoY of industrial enterprises above a designated size (AR), and margin balance MoM (MAR), are selected as early warning indicators. Since the systemic financial risk index will also have an effect on its own early warning, the systemic financial risk index is included in the early warning indicators. The frequency of the early warning variables in this study is monthly; so, daily data are taken as the monthly average. Table 6 shows the final early warning indicators.
Table 6.
Financial risk early warning indicators.
This study uses the Transformer model to construct a financial risk early warning system for China. The specific structure and parameters are shown in Table 7.
Table 7.
Transformer model parameters and structure.
4.3. Construction of Financial Risk Early Warning System
To ensure that the macro-state variables could effectively warn of financial risks, we first used the VAR model to filter the linear relationship between variables. The optimal lag order was determined to be 1 based on the AIC criterion. Then, the BDS test was used to verify the nonlinear dynamic relationship between variables. As shown in Table 8, the BDS test p-values of all variables are less than 0.01, indicating that the residual sequence of each variable has a significant nonlinear dependence structure, which supports the suitability of the nonlinear model proposed in this paper for risk warning.
Table 8.
BDS nonlinear test results for each variable.
In order to further quantify the direction of risk transmission, the transfer entropy method was applied to analyze the nonlinear causal relationship between variables. The results are shown in Table 9.
Table 9.
Transfer entropy analysis results (k = 3, bins = 8).
When the risk index is used as an explanatory variable, the year-on-year accounts receivable and finished goods inventory of industrial enterprises above a designated size have the highest intensity of information transmission, indicating that corporate credit risk and inventory turnover pressure are the factors that are most sensitive to the impact of systemic risk. Furthermore, when the risk index is used as an explanatory variable, its impact on the Internet public opinion index and the PPI month-on-month is the most significant, reflecting that financial risks will be spread through the market sentiment conduction and industrial price volatility channels of diffusion. Among other things, the reverse character of the PPI may be due to the long-tail effect of financial risks hitting the real economy.
Based on the results of the BDS testing and transfer entropy analysis, it is obvious that there is a significant nonlinear relationship between the macro-state variables and the risk index, and these indicators can be used as effective early warning indicators of financial risks. At the same time, the complex nonlinear transmission mechanism between variables shows that it is theoretically necessary to select nonlinear models in the study of financial risk early warning.
In order to fully illustrate the effectiveness of the Transformer model, BP neural network (BP), support vector machine (SVM), and random forest (RF) were selected for comparative training. Considering that the data frequency is monthly and the time span is long, Figure 7 shows a comparison of each model’s predictive performance for the training set and the validation set. From the intuitive performance, the prediction curve of the BP neural network over the first 34 time steps of the training set shows obvious fluctuations, and the error in the later stage of the validation set is significantly amplified. The predicted value of the support vector machine (SVM) exhibits high deviation from the true value, with a lagged response, especially during the period of violent fluctuations in the risk index. Although random forest (RF) has a good fitting effect in the early stages of the training set, the overall error band for the validation set is wide, exposing the insufficient robustness of the model. It can be seen that the Transformer model performs well on the training set and test set, and its overall learning error remains at a low level. This directly reflects the model’s good generalization ability and fully verifies the effectiveness of the selected macro-state variables as financial risk warning indicators.
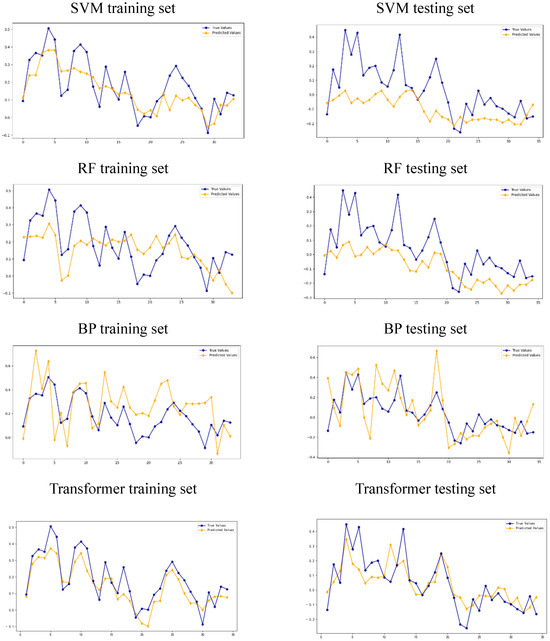
Figure 7.
Learning results of different models.
To further quantify the models’ performance, the learning errors of each model are listed in Table 10. Consistent with the observations in Figure 7, the learning errors of BP, SVM, and RF are significantly higher than those of the Transformer model. The data show that traditional models generally exhibit the limitations of large training errors and weak generalization ability. The BP neural network is limited by gradient vanishing and cannot capture long sequence dependencies; SVM falls into local optimality when faced with high-dimensional time series data; and random forest struggles to characterize the nonlinear coupling relationship between financial variables, due to the natural limitations of tree structure.
Table 10.
Multi-model learning performance evaluation.
In contrast, the Transformer model achieves the smallest errors among the four models in both the training and test sets, and its forecasting curve during extreme events is the most consistent with the true value. This is because its self-attention mechanism enables efficient modeling of long-distance risk transmission paths and because its position encoding enables temporal features to be accurately captured. In contrast to the other models, the Transformer model not only achieves numerically lower forecasting errors but also logically resolves the architectural bottleneck of traditional models and can deeply explore the complex relationships between macro-state variables, market data, and public opinion indexes, building a more accurate and adaptable analysis framework for financial risk warning.
5. Conclusions and Suggestions
5.1. Research Conclusions
This study dynamically measured systemic financial risk in China using the TVP-FAVAR model, identified the structural changes in different risk states by incorporating the MS-AR model, and conducted a correlation analysis of the direction of financial risk in different dimensions. In addition, in order to effectively prevent financial risks, after testing the nonlinear causal relationship between financial indicators, this study innovatively established a Transformer deep learning model and used it to construct a financial risk early warning mechanism; then, this model was further compared to traditional methods such as the BP neural network, support vector machine (SVM), and random forest (RF) to examine its early warning accuracy, with the aim of assessing its capability to provide policy recommendations on how to strengthen the stability of China’s financial market and establish a risk early warning mechanism. Three main conclusions can be drawn from this study:
(1) The time-varying analysis of systemic financial risk showed that the systemic financial risk index dynamically measured by the TVP-FAVAR model can effectively characterize changes in China’s financial risks. The TVP-FAVAR model constructed in this study realizes dynamic tracking of financial risk factors in China through time-varying parameters and adaptive filtering. However, due to limitations posed by the difficulty of identifying nonlinear systems, there is still room for improving the economic explanatory power of the factors in the cross-sectional dimension. Future research can draw on the factor orthogonalization combination method to suppress factor drift through heteroskedasticity adjustment and improve cross-sectional interpretability while maintaining the advantage of time series dynamics [34]. Meanwhile, to further capture nonlinear synergistic effects among variables, explicit interaction term construction methods can also be incorporated, such as the construction of dummy variables to interact with the factors, in order to enhance the model’s ability to capture dynamic changes in the factors [35]. In addition, the nonlinear threshold effect of relevant key indicators should be taken into account when measuring the systemic financial risk index in the future. For example, recent studies have shown that the stability of the beta coefficient of the CAPM is significantly weakened when the inflation rate exceeds about 4% [36]. Furthermore, China’s systemic risk exhibits obvious dual-regime characteristics, with the tendency to remain in a low-risk state for a long time. From a dimensional perspective, the financial risk indexes of the bond market and the money market best explain the systemic financial risk index, indicating that these two markets, as the main players in China’s financial industry, play a key role in the prevention and control of systemic financial risks.
(2) The results of BDS testing and transfer entropy analysis showed that there was a significant nonlinear relationship between the macro-state variables selected in this paper, i.e., the network public opinion index and the systemic financial risk index, which verifies the effectiveness of these indicators as risk warning factors.
(3) In the field of financial risk prediction, the support vector machine (SVM), a traditional machine learning model, is widely used, but its nature still relies on kernel function mapping, which means that it struggles to capture long-range dependencies among financial variables [37]. Furthermore, SVM easily falls into local optimization when faced with high-dimensional time series data, and it cannot dynamically adjust variable weights to adapt to unexpected scenarios such as policy shocks [38]. Although the neural network quantile regression model can characterize the tails of the risk distribution, the quantile parameter setting relies on a priori assumptions and fails to address the problem of gradient vanishing associated with long time series data [39]. Integrated models such as random forest demonstrate more robust performance in short-term forecasting, but they obtain significantly higher prediction errors for medium- and long-term risks and have difficulty explaining nonlinear coupling between variables [40]. In the field of deep learning, the gating mechanism of LSTM relies on chained memory updating, and this model has limited ability to capture long-run risk conduction [38]. The Transformer model adopted in this study overcomes the structural limitations of traditional time series models that hinder their application in the field of systemic financial risk early warning. Its direct modeling of global dependence through its self-attention mechanism eliminates the need to rely on the implicit mapping of the kernel function and more accurately captures the financial risks that may arise from extreme events such as the 2015 stock market crash and the 2020 epidemic [32]. Furthermore, the Transformer’s multi-attention mechanism can adjust the influence weights of each indicator in real time through time-varying attention weights, it can capture the risk correlation between short-term fluctuations and long-term trends in parallel, and the modeling of long-distance dependence is not limited by the length of the series, which significantly reduces medium- and long-term forecast errors [41]. At the same time, it overcomes the limitation of SVM-type models’ reliance on solely structured data, such as price and volume, through its mechanism of fusion of public opinion indexes and structured indicators, and it effectively incorporates the nonlinear influence of investor sentiment.
The results of this study show that, compared to traditional machine learning methods such as the BP neural network, support vector machine (SVM), and random forest (RF), the Transformer model demonstrated significant advantages in terms of prediction accuracy and stability on both the training and test sets. However, as a black-box model, although the attention weights of Transformer can reveal the strength of variable associations to a certain extent, it cannot clarify the specific path of risk transmission, making it weak in this regard compared to the visual explanation of the decision tree-type model; this may limit its ability to meet the demand for risk traceability in financial regulation [32]. In the future, we may consider introducing the principle of deep Taylor decomposition in order to integrate the attention weights and correlation scores, quantify the contribution of each layer of features to the prediction results, and solve the problem of ambiguous attention visualization [42].
5.2. Policy Recommendations
Based on the conclusions of this study, we put forward three relevant policy recommendations:
(1) Adherence to the combination of dynamic supervision and key supervision, the establishment of a risk “firewall” mechanism, and the blocking of cross-institutional and cross-departmental risk contagion. Supervisory authorities should strengthen the dynamic monitoring of systemic financial risks of financial institutions, regularly assess the risk profile of financial institutions, and focus supervision on institutions whose assessment results are at the tail end of the range. In addition, financial institutions should conduct regular stress tests, covering multiple sectors, to simulate risk transmission paths under extreme scenarios and to formulate risk segregation and disposal plans accordingly; they should also clarify the disposal process should a major risk event occur.
(2) The establishment of a scientific and effective monitoring and early warning system, not only focusing on the financial data of the macro system but also paying attention to the impact of the network public opinion index on financial risks. As digital currencies (DCs) gradually become a systemic asset class, future research could incorporate DC-related indicators into the analytical framework to enhance the breadth of coverage of risk monitoring [43]. At the same time, it is necessary to fully consider the superiority of the Transformer deep learning model for early warning of systemic financial risks and to continuously improve and develop early warning systems for such risks.
(3) The strengthening of risk education and warnings for investors to enhance their awareness of risk prevention. Financial institutions should collate and analyze typical investment fraud cases and major loss events and produce warning and educational materials, which can be directed and promoted to investors through channels such as APP and offline outlets, so as to enhance investors’ vigilance in real-life scenarios. In addition, before an individual investor handles a high-risk business account, such as a personal pension investment account, financial institutions can set up a suitable risk cognitive ability assessment session to provide targeted risk education to individual investors whose assessments fail to meet the required standards.
Author Contributions
Conceptualization, H.Y.; methodology, J.C.; software, W.W.; data curation, J.C.; writing—original draft preparation, L.L. and H.Y.; writing—review and editing, Y.G.; visualization, L.L. All authors have read and agreed to the published version of the manuscript.
Funding
This research was funded by the Humanities and Social Sciences Youth Foundation, Ministry of Education, grant number 23YJCZH261, and the Startup Foundation for Introducing Talent of Nanjing University of Posts and Telecommunications, grant number NYY222024.
Data Availability Statement
The raw data supporting the conclusions of this article can provide if required.
Conflicts of Interest
The authors declare no conflicts of interest.
References
- Yang, Z.; Chen, Y.; Lin, S. A Literature Review of Systemic Risk: Status, Development and Prospect. J. Financ. Res. 2022, 1, 185–206. [Google Scholar]
- Tobias, A.; Brunnermeier, M.K. CoVaR. Am. Econ. Rev. 2016, 106, 1705. [Google Scholar] [CrossRef]
- Ismal, R. Volatility of the Returns and Expected Losses of Islamic Bank Financing. Int. J. Islam. Middle East. Financ. Manag. 2010, 3, 267–279. [Google Scholar] [CrossRef]
- Yamai, Y.; Yoshiba, T. Value-at-Risk versus Expected Shortfall: A Practical Perspective. J. Bank. Financ. 2005, 29, 997–1015. [Google Scholar] [CrossRef]
- Wang, Z.; Liu, Y. Nonlinear Relationship between Physical Environment Risks, Investor Attentions, and Financial Systemic Risks: Evidence from MLSTM-CoVaR Networks. J. Environ. Manag. 2025, 374, 124065. [Google Scholar] [CrossRef] [PubMed]
- Acerbi, C.; Tasche, D. On the Coherence of Expected Shortfall. J. Bank. Financ. 2002, 26, 1487–1503. [Google Scholar] [CrossRef]
- Chen, A.; Nguyen, T. Risk Management under Weighted Limited Expected Loss. Quant. Financ. 2024, 24, 593–612. [Google Scholar] [CrossRef]
- Acharya, V.V.; Pedersen, L.H.; Philippon, T.; Richardson, M. Measuring Systemic Risk. Rev. Financ. Stud. 2017, 30, 2–47. [Google Scholar] [CrossRef]
- DeYoung, R.; Huang, M. The External Effects of Bank Executive Pay: Liquidity Creation and Systemic Risk. J. Financ. Intermediat. 2021, 47, 100920. [Google Scholar] [CrossRef]
- Dalla Valle, L.; Giudici, P. A Bayesian Approach to Estimate the Marginal Loss Distributions in Operational Risk Management. Comput. Stat. Data Anal. 2008, 52, 3107–3127. [Google Scholar] [CrossRef]
- Gadanecz, B.; Jayaram, K. Measures of Financial Stability-a Review. Irving Fish. Comm. Bull. 2008, 31, 365–383. [Google Scholar]
- Bisias, D.; Flood, M.; Lo, A.W.; Valavanis, S. A Survey of Systemic Risk Analytics. Annu. Rev. Financ. Econ. 2012, 4, 255–296. [Google Scholar] [CrossRef]
- Dumičić, M. Financial Stability Indicators—The Case of Croatia. J. Cent. Bank. Theory Pract. 2016, 5, 113–140. [Google Scholar] [CrossRef]
- Giglio, S.; Kelly, B.; Pruitt, S. Systemic Risk and the Macroeconomy: An Empirical Evaluation. J. Financ. Econ. 2016, 119, 457–471. [Google Scholar] [CrossRef]
- Tian, S.; Li, S.; Gu, Q. Measurement and Contagion Modelling of Systemic Risk in China’s Financial Sectors: Evidence for Functional Data Analysis and Complex Network. Int. Rev. Financ. Anal. 2023, 90, 102913. [Google Scholar] [CrossRef]
- Benoit, S.; Colliard, J.E.; Hurlin, C.; Pérignon, C. Where the Risks Lie: A Survey on Systemic Risk. Rev. Financ. 2017, 21, 109–152. [Google Scholar] [CrossRef]
- Yu, B.; Ouyang, H.; Guan, C.; Lin, B. Network Measurement and Influence Mechanism of Dynamic Risk Contagion among Global Stock Markets: Based on Time-Varying Spillover Index and Complex Network Method. N. Am. J. Econ. Financ. 2024, 74, 102258. [Google Scholar] [CrossRef]
- Wang, Y.; Zhao, X.; Shang, J. Dynamic Risk Spillover in Green Financial Markets: A Wavelet Frequency Analysis from China. Energy Econ. 2025, 143, 108301. [Google Scholar] [CrossRef]
- Huang, A.; Qiu, L.; Li, Z. Applying Deep Learning Method in TVP-VAR Model under Systematic Financial Risk Monitoring and Early Warning. J. Comput. Appl. Math. 2021, 382, 113065. [Google Scholar] [CrossRef]
- Li, H. Research on Financial Risk Early Warning System Model Based on Second-Order Blockchain Differential Equation. Intell. Decis. Technol. 2024, 18, 327–342. [Google Scholar] [CrossRef]
- Zhu, K.; Liu, D.; Wu, J.; Sun, L. The Research of the Regional Financial Risk Early-Warning Model Integrating the Regression of Lagging Factors. AASRI Procedia 2012, 1, 428–434. [Google Scholar] [CrossRef]
- Wei, L.; Yu, H.; Li, B. Energy Financial Risk Early Warning Model Based on Bayesian Network. Energy Rep. 2023, 9, 2300–2309. [Google Scholar] [CrossRef]
- Owoo, N.; Odei-Mensah, J. Hierarchical Clustering-Based Early Warning Model for Predicting Bank Failures: Insights from Ghana’s Financial Sector Reforms (2017–2019). Res. Int. Bus. Financ. 2025, 77, 102944. [Google Scholar] [CrossRef]
- Wang, Y.; Xi, W. Measurement and Early Warning of Systemic Financial Risk in China: Markov Switching Models. Comput. Econ. 2025, 65, 1–29. [Google Scholar] [CrossRef]
- Bu, Y.; Du, X.; Li, H.; Yu, X.; Wang, Y. Research on the FinTech Risk Early Warning Based on the MS-VAR Model: An Empirical Analysis in China. Glob. Financ. J. 2023, 58, 100898. [Google Scholar] [CrossRef]
- Zhang, W. Dynamic Monitoring of Financial Security Risks: A Novel China Financial Risk Index and an Early Warning System. Econ. Lett. 2024, 234, 111445. [Google Scholar] [CrossRef]
- Ristolainen, K. Predicting Banking Crises with Artificial Neural Networks: The Role of Nonlinearity and Heterogeneity. Scand. J. Econ. 2018, 120, 31–62. [Google Scholar] [CrossRef]
- Bluwstein, K.; Buckmann, M.; Joseph, A.; Kapadia, S.; Şimşek, Ö. Credit Growth, the Yield Curve and Financial Crisis Prediction: Evidence from a Machine Learning Approach. J. Int. Econ. 2023, 145, 103773. [Google Scholar] [CrossRef]
- Chen, P.; Ji, M. Deep Learning-Based Financial Risk Early Warning Model for Listed Companies: A Multi-Dimensional Analysis Approach. Expert Syst. Appl. 2025, 283, 127746. [Google Scholar] [CrossRef]
- Ouyang, Z.; Yang, X.; Lai, Y. Systemic Financial Risk Early Warning of Financial Market in China Using Attention-LSTM Model. N. Am. J. Econ. Financ. 2021, 56, 101383. [Google Scholar] [CrossRef]
- Tang, P.; Xu, W.; Wang, H. Network-Based Prediction of Financial Cross-Sector Risk Spillover in China: A Deep Learning Approach. N. Am. J. Econ. Financ. 2024, 72, 102151. [Google Scholar] [CrossRef]
- Vaswani, A.; Shazeer, N.; Parmar, N.; Uszkoreit, J.; Jones, L.; Gomez, A.N.; Kaiser, Ł.; Polosukhin, I. Attention Is All You Need. Adv. Neural Inf. Process. Syst. 2017, 30, 1–8. [Google Scholar]
- Bernanke, B.S.; Boivin, J.; Eliasz, P. Measuring the Effects of Monetary Policy: A Factor-Augmented Vector Autoregressive (FAVAR) Approach. Q. J. Econ. 2005, 120, 387–422. [Google Scholar]
- Agrrawal, P.; Clark, J.M. A multivariate liquidity score and ranking device for ETFs. In Proceedings of the Academy of Financial Services Annual Conference, Boca Raton, FL, USA, 2009; Available online: https://www.researchgate.net/publication/257890697_A_Multivariate_Liquidity_Score_and_Ranking_Device_for_ETFs (accessed on 2 February 2025).
- Waggle, D.; Agrrawal, P.; Johnson, D. Interaction between Value Line’s timeliness and safety ranks. J. Investig. 2001, 10, 53–62. [Google Scholar] [CrossRef]
- Valadkhani, A. Inflation-driven instability in US sectoral betas. J. Asset Manag. 2025, 1–8. [Google Scholar] [CrossRef]
- Huang, W.; Nakamori, Y.; Wang, S.Y. Forecasting stock market movement direction with support vector machine. Comput. Oper. Res. 2005, 32, 2513–2522. [Google Scholar] [CrossRef]
- Hochreiter, S.; Schmidhuber, J. Long short-term memory. Neural Comput. 1997, 9, 1735–1780. [Google Scholar] [CrossRef]
- Pfreundschuh, S.; Eriksson, P.; Duncan, D.; Rydberg, B.; Håkansson, N.; Thoss, A. A neural network approach to estimating a posteriori distributions of Bayesian retrieval problems. Atmos. Meas. Technol. 2018, 11, 4627–4643. [Google Scholar] [CrossRef]
- Wang, J.; Xu, Y.; Liu, L.; Wu, W.; Shen, C.; Huang, H.; Zhen, Z.; Meng, J.; Li, C.; Qu, Z.; et al. Comparison of LASSO and random forest models for predicting the risk of premature coronary artery disease. BMC Med. Inform. Decis. Mak. 2023, 23, 297. [Google Scholar] [CrossRef]
- Coelho e Silva, L.; Fonseca, G.F.; Castro, P.A.L. Transformers and attention-based networks in quantitative trading: A comprehensive survey. In Proceedings of the 5th ACM International Conference on AI in Finance, New York, NY, USA, 14–17 November 2024; pp. 822–830. [Google Scholar]
- Chefer, H.; Gur, S.; Wolf, L. Transformer interpretability beyond attention visualization. In Proceedings of the IEEE/CVF Conference on Computer Vision and Pattern Recognition, Nashville, TN, USA, 20–25 June 2021; pp. 782–791. [Google Scholar]
- Kim, Y.S.; Kwon, O. Central Bank Digital Currency and Financial Stability. Bank of Korea WP 2019-6. Available online: https://papers.ssrn.com/sol3/papers.cfm?abstract_id=3330914 (accessed on 8 February 2019).


Disclaimer/Publisher’s Note: The statements, opinions and data contained in all publications are solely those of the individual author(s) and contributor(s) and not of MDPI and/or the editor(s). MDPI and/or the editor(s) disclaim responsibility for any injury to people or property resulting from any ideas, methods, instructions or products referred to in the content. |
© 2025 by the authors. Licensee MDPI, Basel, Switzerland. This article is an open access article distributed under the terms and conditions of the Creative Commons Attribution (CC BY) license (https://creativecommons.org/licenses/by/4.0/).