Abstract
Background: Employee turnover poses a multi-faceted challenge to organizations by undermining productivity, morale, and financial stability while rendering recruitment, onboarding, and training investments wasteful. Traditional machine learning approaches often struggle with class imbalance and lack transparency, limiting actionable insights. This study introduces an Explainable AI (XAI) framework to achieve both high predictive accuracy and interpretability in turnover forecasting. Methods: Two publicly available HR datasets (IBM HR Analytics, Kaggle HR Analytics) were preprocessed with label encoding and MinMax scaling. Class imbalance was addressed via GAN-based synthetic data generation. A three-layer Transformer encoder performed binary classification, and SHapley Additive exPlanations (SHAP) analysis provided both global and local feature attributions. Model performance was evaluated using accuracy, precision, recall, F1 score, and ROC AUC metrics. Results: On the IBM dataset, the Generative Adversarial Network (GAN) Transformer model achieved 92.00% accuracy, 96.67% precision, 87.00% recall, 91.58% F1, and 96.32% ROC AUC. On the Kaggle dataset, it reached 96.95% accuracy, 97.28% precision, 96.60% recall, 96.94% F1, and 99.15% ROC AUC, substantially outperforming classical resampling methods (ROS, SMOTE, ADASYN) and recent literature benchmarks. SHAP explanations highlighted JobSatisfaction, Age, and YearsWithCurrManager as top predictors in IBM and number project, satisfaction level, and time spend company in Kaggle. Conclusion: The proposed GAN Transformer SHAP pipeline delivers state-of-the-art turnover prediction while furnishing transparent, actionable insights for HR decision-makers. Future work should validate generalizability across diverse industries and develop lightweight, real-time implementations.
1. Introduction
Employee turnover denotes the gradual reduction in a firm’s workforce composition due to factors typically beyond the organization’s direct control [1,2]. It emerges as a critical managerial challenge across diverse sectors, entailing not only the loss of human capital but also the waste of investments in recruitment, orientation, and training processes [3,4]. An average annual attrition rate of 12–15% imposes a substantial burden on human resources management; for instance, replacing a software engineer entails a direct cost of approximately USD 40,000 [5]. The recurrence of such turnover events amplifies overall expenses, giving rise to financial strain, declines in sales volume, and erosion of brand reputation [1]. Consequently, significant increases in separation rates represent a multifaceted problem for businesses, manifesting through both tangible and intangible costs.
To address and mitigate these challenges by identifying underlying causes, retaining at-risk employees, and quantifying turnover rates, organizations are increasingly adopting artificial intelligence (AI) tools. Such systems integrate historical personnel data (e.g., hire-to-exit dates, performance scores, absenteeism records), employee workplace behaviors (e.g., job satisfaction surveys, promotion histories, shift patterns), and external variables like economic conditions and industry trends to forecast whether an employee is likely to remain with the company. These predictive analyses enable human resources departments to anticipate attrition risks and devise proactive strategies aimed at reducing them [4]. Insights derived from AI further allow managers to pinpoint the training and development needs of employees exhibiting turnover tendencies and to implement targeted, solution-oriented interventions [6]. Moreover, by uncovering the reasons behind employees’ decisions to leave, these data support both the retention of current staff and the recruitment of new hires with high long-term retention potential, thereby promoting organizational continuity, efficiency, and sustainable growth [4]. Some firms leverage AI to augment their HR capabilities, while others automate routine HR processes to alleviate workload and allow HR professionals to concentrate on more strategic decision-making tasks [6].
The primary aim of this study is to empower organizations to make more effective, data driven managerial decisions in human resources by developing Explainable Artificial Intelligence (XAI)–supported models for predicting employee turnover. By analyzing the key factors that influence attrition, this research seeks to render the turnover process more predictable and actionable for HR managers.
1.1. Literature Review
Employee attrition directly impacts both operational continuity and human resources (HR) strategies, making the development of reliable, interpretable prediction models a matter of growing interest. Prior work has proposed a range of approaches, from traditional machine learning algorithms to advanced deep learning architectures, to forecast employees’ likelihood of leaving. However, many of these studies face methodological challenges such as class imbalance, small sample sizes, and limited model interpretability. For example, Transformer-based architectures may overfit on small datasets, whereas some classical classifiers, despite high accuracy, offer little transparency in their decision processes. In recent years, XAI techniques have been introduced to address these issues, with methods like SHAP, LIME, and PDP enhancing the understandability of model outputs. Findings drawn from diverse datasets, balancing procedures, and explanation tools underscore the importance of multifaceted strategies in attrition prediction. Li et al. [7] developed a Transformer-based deep learning model using the IBM HR Analytics Employee Attrition dataset (1470 records). After applying one-hot encoding, normalization, and data partitioning, they reported 85.07% accuracy, 74.52% AUC ROC, and 38.49% AUC PR, while noting the architecture’s tendency to overfit on limited data. Building on classical techniques, Guerranti et al. [8] compared Logistic Regression, Classification Tree, Random Forest, Naive Bayes, Neural Network, and a Voting Ensemble on the same dataset (1470 samples, 34 features). With normalization and cross-validation to mitigate imbalance, Logistic Regression attained the best performance: 87.96% accuracy, a 31.26 F1 score, and 85.01% AUC ROC. The authors cited data imbalance and small sample size as key limitations. Using real-world data from an Italian financial institution (5767 employees, 309 resignations), Manafi Varkiani et al. [9] applied the ROSE method to rebalance the dataset and tested Logistic Regression, Naive Bayes, Decision Trees, and Random Forest on 14 predictors. Random Forest emerged best, achieving 94.7% accuracy, 94.4% recall, 100% specificity, and 99.9% AUC. Fallucchi et al. [10] conducted a detailed analysis on the IBM HR dataset (1470 records, 35 features), performing data cleaning, categorical encoding, and statistical feature analysis. Among several classifiers, Gaussian Naive Bayes yielded the highest recall (54.1%), alongside 82.5% accuracy, 38.6% precision, and a 44.6% F1 score. Vaiyapuri et al. [11] introduced ensemble models (AdaBoost, Gradient Boosting, LightGBM, XGBoost, and CatBoost) whose hyperparameters were tuned via Bayesian optimization. On the IBM dataset, after data cleaning, categorical encoding, normalization, Chi-square feature selection, and balancing with SMOTE, CatBoost achieved 95.8% accuracy, 95% precision, 95% recall, a 95% F1 score, and 98% AUC. Limitations included reliance on a single dataset and the computational cost of optimization. Finally, Marín Díaz et al. [4] leveraged XAI in conjunction with XGBoost on a SMOTE Tomek balanced version of the IBM HR data (1470 samples). Their model produced 85.91% accuracy, 65% recall, and 85% AUC. They identified class imbalance and the low prevalence of “Attrition = Yes” as performance constraints and used PDP, SHAP, LIME, and ELI5 to reveal key attrition drivers such as job satisfaction, salary, and overtime.
1.2. Novelties and Contributions
The proposed methodology offers a holistic framework that simultaneously tackles class imbalance, model performance, and interpretability requirements in HR analytics. Below, the study’s novelties and contributions are summarized under distinct headings.
Novelties
- Generative Adversarial Network: (GAN)-based synthetic data generation to produce both diverse and realistic samples for the minority class.
- A three-layer Transformer encoder architecture uniquely adapted for binary classification tasks.
- A modular pipeline encompassing data preprocessing, resampling, model training, and explainability stages.
- Unlike previous studies that often apply sampling methods, model architectures, and explainability techniques separately, our work uniquely combines GAN-based synthetic data generation, a multi-layer Transformer encoder, and SHAP analysis into an integrated methodological approach for turnover prediction. This holistic integration simultaneously addresses class imbalance, model interpretability, and predictive performance within a single unified framework.
Contributions
- Achieving 92.00% accuracy on the IBM HR Dataset and 96.95% on the Kaggle HR Analytics Dataset, thereby outperforming comparable approaches in the literature.
- Employing SHAP analysis to quantify and qualitatively explain each feature’s impact on attrition, providing actionable managerial insights.
- Delivering a transparent, ready-to-deploy infrastructure that can be seamlessly integrated into both academic research and enterprise applications.
- Beyond improving predictive accuracy, our framework contributes practically by generating transparent and actionable insights through SHAP analysis, enabling HR managers to make data-driven retention decisions informed by the model’s most influential factors.
2. Material
This study adopts a modeling approach that delivers high accuracy in predicting employee attrition while prioritizing interpretability. The developed framework comprises multiple stages: data preprocessing, rectification of class imbalance, application of classification algorithms, and rendering model outputs interpretable. In the modeling process, alongside performance, transparency to support managerial decision-making systems was also targeted. Accordingly, both classical and advanced analytical techniques were integrated into a holistic methodology. In particular, GANs were employed to resolve the class imbalance issue, and interpretability was reinforced through SHapley Additive exPlanations (SHAP). Together, these methods aim not only to produce accurate predictions but also to furnish HR professionals with actionable insights. This comprehensive analytical workflow was applied to two distinct open-access HR datasets. These two datasets were selected to demonstrate the effectiveness of the proposed method on datasets of different sizes and characteristics. Using both the smaller IBM HR dataset and the larger Kaggle HR Analytics dataset allows us to evaluate model performance under varying conditions and compare results with prior studies in the literature.
2.1. IBM HR Dataset
This study uses a synthetic employee dataset created by IBM data scientists [12] to emulate real-world HR data and uncover the drivers of Attrition. The dataset comprises 1470 records and 35 variables spanning demographics (age, gender, marital status, education level, and field), job attributes (job title, department, business travel frequency, monthly income, job level, years at company, and distance from home), and performance and satisfaction measures (Performance Rating, Job Involvement, Job Satisfaction, Environment Satisfaction, Work Life Balance and Relationship Satisfaction). The target variable, Attrition (Yes/No), indicates whether an employee left the organization. Several categorical predictors employ ordinal coding. Education is scored 1 (Below College) through 5 (Doctor); Environment Satisfaction, Job Involvement, Job Satisfaction and Relationshi Satisfaction range from 1 (Low) to 4 (Very High); Performance Rating spans 1 (Low) to 4 (Outstanding); and Work Life Balance from 1 (Bad) to 4 (Best) facilitating quantitative analysis of satisfaction, involvement and performance dimensions. This structure renders the dataset highly suitable for both classification tasks and exploratory data analysis. To reveal patterns underlying attrition, we conducted a visual examination (Figure 1), finding that younger employees, those in sales roles, single individuals, and employees with Life Sciences or Medical backgrounds exhibited higher attrition rates. These preliminary insights guided our feature selection strategy and informed subsequent modeling decisions, emphasizing the importance of both personal and role-specific variables in predicting turnover.
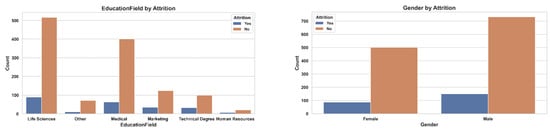
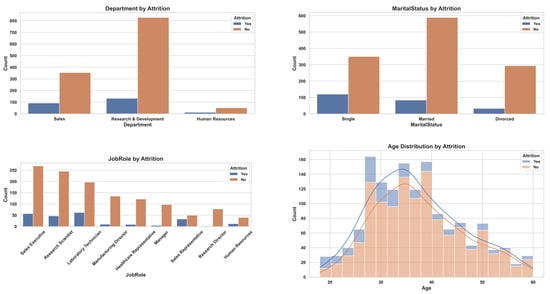
Figure 1.
Attrition distribution across key demographic and organizational attributes in the IBM HR Analytics dataset. The plots illustrate differences in employee attrition (Yes/No) by Education Field, Gender, Department, Marital Status, Job Role, and Age.
2.2. Kaggle HR Analytics Dataset
The second dataset employed in this study is the HR Analytics dataset published on Kaggle, which comprises anonymized HR records from a single company [13]. Consisting of 14,999 employee entries, it features the binary target variable left (0 = Stayed, 1 = Left) alongside a range of predictors including satisfaction level, last evaluation, number project, average monthly hours, time spend company, promotion last 5years, and salary (low, medium, high), as well as department. Examination of the class distribution reveals that approximately 24% of employees have left, creating a pronounced imbalance that can hinder the accurate prediction of the minority class; accordingly, resampling techniques such as SMOTE were applied to restore balance. Visual analyses (Figure 2) demonstrate that attrition rates are notably higher among sales staff and markedly lower in IT and technical departments, that employees in the low salary bracket are more likely to leave, and that those reporting low job satisfaction exhibit a pronounced increase in turnover. These observations underscore the critical influence of satisfaction and compensation factors on employee attrition.
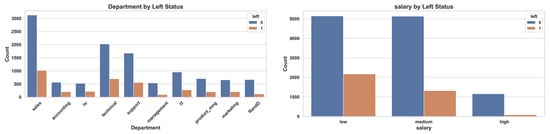
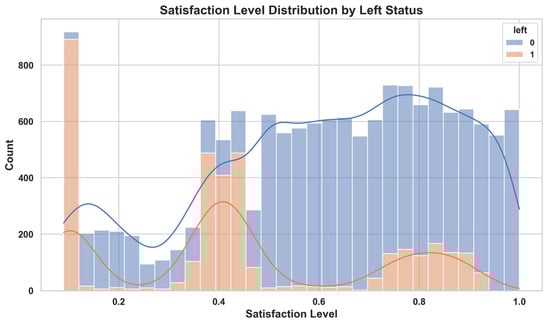
Figure 2.
Distribution of employee attrition by department, salary level, and satisfaction level in the Kaggle HR Analytics dataset. The plots show that attrition is more prevalent among low-salary employees, those working in sales departments, and individuals with low satisfaction levels.
3. Motivation and Our Method
The proposed methodological pipeline is depicted in Figure 3. As illustrated, the process begins with loading the dataset and converting the target variable into a binary format, with attrition coded as 1 and non-attrition as 0. Numerical features are then scaled, and irrelevant variables are removed to ensure consistency and enhance model performance. To mitigate class imbalance, a balanced dataset is generated via GAN-based synthetic sampling. The refined dataset is subsequently split into training and test subsets. Leveraging the transformer encoder’s ability to capture complex feature interactions, a deep learning model is trained on the training partition, while classification is performed on the test partition. Finally, interpretability is enhanced through SHAP analysis, which quantifies feature contributions for each prediction. As detailed in Figure 3, this structured, modular framework not only optimizes predictive accuracy but also supports transparent, interpretable decision-making in HR analytics.
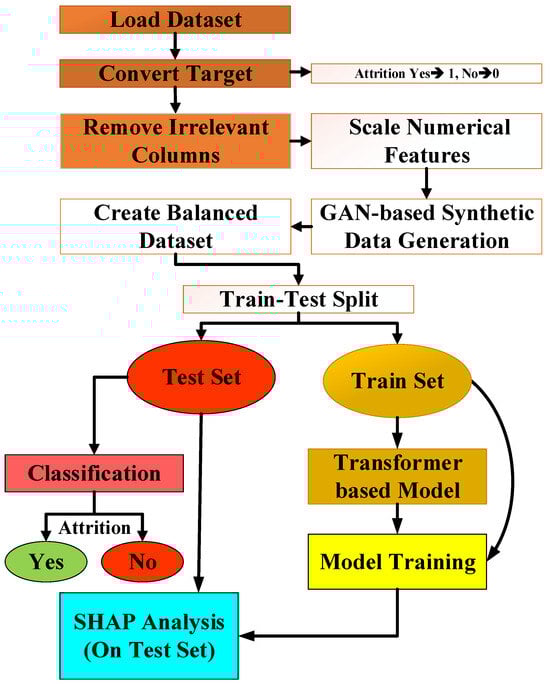
Figure 3.
The overall architecture of the proposed attrition prediction framework.
Step 1: Load and Define Binary Classification Target
Step 2: Encode Categorical Features
Categorical variables in the dataset were numerically encoded to make them compatible with machine learning algorithms. We applied the Label Encoder method to assign integer labels to each unique category. For example, the Business Travel column’s values (“Travel Rarely,” “Travel Frequently,” and “Non Travel”) were mapped to 0, 1, and 2, respectively, while Gender was binarized for “Male” and “Female.” Several features were also removed: Employee Count, Standard Hours, and Over18 were excluded because they held the same value for all records and thus provided no discriminative information; Employee Number was discarded as it served solely as a unique identifier with no predictive relevance. Eliminating such constant or semantically irrelevant variables reduces model complexity and promotes a more robust learning process.
Let be a categorical variable, label encoded using:
Step 3: Data Preprocessing and Scaling
The numerical features are scaled using MinMax normalization to the [0, 1] range:
Step 4: GAN-based Synthetic Data Generation
GANs, first introduced by Goodfellow et al. in 2014, are powerful deep learning architectures designed to address generative modeling problems by learning the underlying probability distribution of observed data [14,15]. A GAN consists of two neural networks, the generator and the discriminator, that engage in an adversarial training process. The generator produces synthetic samples from random noise vectors that increasingly resemble real data, while the discriminator evaluates whether each sample is real or generated. Through this competitive dynamic, the generator progressively refines its outputs to achieve greater realism [16]. In our study, the GAN is configured to sample from a 16-dimensional latent space. As detailed in Table 1, the generator comprises three fully connected layers with 128, 256, and 30 neurons, respectively, which yield 30-dimensional synthetic observations. The discriminator, in turn, processes these 30-dimensional inputs through layers of 256 and 128 neurons before producing a final probability score indicating sample authenticity. During training, we froze the discriminator’s weights and optimized only the generator, ensuring that the model focuses on generating balanced and realistic data for the minority class. In this study, we implemented a vanilla GAN architecture adapted for tabular data synthesis, without conditioning on class labels.

Table 1.
The details of generator and discriminator layers of the GAN model.
Synthetic minority class instances (y = 1) are generated via GAN to balance the dataset:
Step 5: Dataset Splitting into Training and Test Sets
Balanced test and training datasets are created:
Step 6: Transformer-based Model Definition
The proposed classification model is built on a Transformer encoder architecture. It consists of three encoder blocks, each incorporating multi-head attention, layer normalization, and residual connections. At the end of each block, a feed-forward sublayer projects the attention output back to the original input dimension. Following the encoder stack, the network applies a flattening layer, two fully connected layers with 256 and 64 units respectively, and a dropout layer before a final single-neuron classifier with a sigmoid activation function. The overall architecture is depicted in Figure 4, with detailed layer parameter summaries presented in Table 2. By leveraging the encoder’s capacity to learn long-range dependencies in sequential inputs, this model is designed to deliver high accuracy on binary classification tasks. The Transformer encoder was implemented with four attention heads (head size 64), a feedforward dimension of 128, layer normalization (epsilon = 1 × 10⁻⁶), and residual connections in each block. Dropout rates of 0.1 within the encoder and 0.4 and 0.3 in subsequent dense layers were applied to mitigate overfitting. Positional encoding was not employed, as the data is tabular and lacks sequential dependencies. The model was trained with the Adam optimizer (learning rate 0.0001) using binary cross-entropy loss over 50 epochs, with validation monitoring to observe generalization performance.
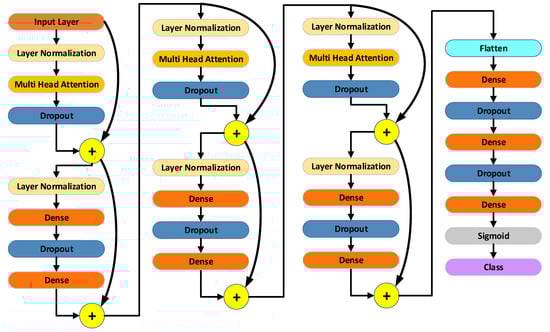
Figure 4.
Architecture of the proposed Transformer-based classification model.
Table 2.
Transformer-based classification model layer summary.
A Transformer encoder model is constructed for binary classification:
Step 7: Model Training and Evaluation
The model was trained using the binary cross-entropy loss function in conjunction with the Adam optimizer, both of which are well-suited to binary classification tasks. During training, performance was monitored through accuracy, confusion matrix analysis, and ROC AUC scores as key evaluation metrics. The loss itself was computed according to the classical log loss formulation given in Equation (8).
Step 8: Evaluate Model with Test Set Metrics
Model performance was assessed using four widely adopted metrics in classification tasks: accuracy, precision, recall, and the F1 score. Accuracy represents the proportion of correct classifications out of all predictions (Equation (9)). Precision quantifies the share of true positives among instances labeled as positive (Equation (10)), while recall measures the fraction of actual positives correctly identified by the model (Equation (11)). The F1 score, defined as the harmonic mean of precision and recall (Equation (12)), provides a balanced evaluation of these two measures. These metrics are especially critical for a thorough performance analysis when working with class-imbalanced datasets.
SHAP (SHapley Additive Explanations)
SHAP (SHapley Additive exPlanations), first introduced by Lundberg and Lee (2017) [17], provides a numerical and interpretable means of explaining the decision processes of complex machine learning models. It assigns to each input feature a Shapley value representing its contribution to the model’s output, enabling analysis both at the global model level and for individual predictions. For any given instance, the model’s prediction can be decomposed into the sum of a baseline expectation and the SHAP values of its features, as formalized in Equation (13).
Step 9: Compute SHAP values on test set.
where denotes the SHAP value for feature .
In this formula, represents the model’s prediction for the given input; denotes the model’s baseline value; and corresponds to the contribution of feature to the prediction. Thus, the model’s output can be decomposed into the contributions of each feature. The sum of the SHAP values exactly equals the model’s prediction for that observation, reflecting SHAP’s additive nature. Each SHAP value indicates both the direction (positive or negative) and the magnitude of the respective feature’s impact on the model’s decision. When SHAP values are computed for individual instances, they can be interpreted as follows:
Step 10: Test Significance of Top SHAP-Ranked Features
- and represent the mean values of the feature in the attrition and non-attrition groups, respectively.
- and are the standard deviations of the feature in these respective groups.
- and denote the sample sizes of the attrition and non attrition groups, respectively.
In this step, the average effect of each feature on the model is measured by taking the mean of the absolute values of all individual contributions obtained from the SHAP analysis. This measure is commonly used to create a feature importance ranking and provides decision support in managerial fields such as human resources. Therefore, the equation to be used here is as follows:
Step 9: Interpret SHAP Outputs for Managerial Insight
After model training, we performed SHAP analysis using the DeepExplainer module to quantify feature contributions. Global feature importance was calculated by averaging the absolute SHAP values across all test instances, while local explanations provided instance-level insights into individual attrition predictions.
4. Experimental Results
The Transformer-based classification model developed in this study was evaluated on two distinct datasets: the IBM HR Dataset and the Kaggle HR Analytics Dataset. All experimental analyses were carried out in a Jupyter Notebook (version: 7.3.2) environment using Python (version: 3.12.7). The experiments were conducted on a system running Windows 11, powered by a 13th-generation Intel® Core™ i9 13900K processor, 128 GB of RAM, and an NVIDIA (Santa Clara, CA, USA) GeForce RTX 4080 SUPER GPU. This hardware configuration provided a robust platform for high-dimensional data processing and model training. Below, we present the experimental results obtained on the IBM HR Dataset and the Kaggle HR Analytics Dataset.
4.1. IBM HR Dataset-Based Experimental Evaluation
In this subsection, we detail the experimental evaluation conducted on the IBM HR dataset, comparing multiple oversampling techniques and analyzing classifier performance, training dynamics, and model interpretability.
The confusion matrices for the ROS, GAN, and SMOTE oversampling methods are presented in Figure 5. The GAN-based approach achieves the fewest misclassifications, with only three false positives and thirteen false negatives, whereas ROS yields twenty-four false positives and twenty-three false negatives, and SMOTE produces twenty false positives and twenty false negatives. This comparison underscores the superior discrimination capability afforded by GAN oversampling.
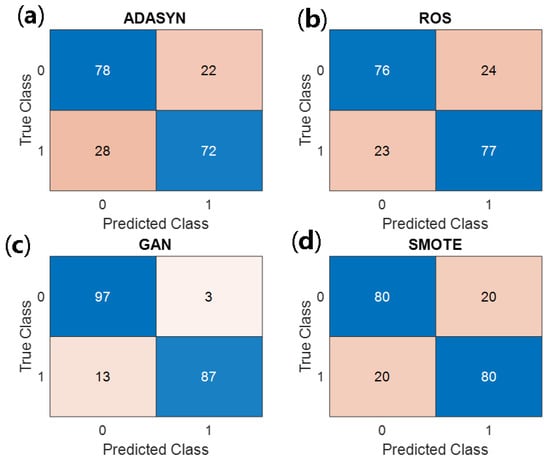
Figure 5.
Confusion matrices for the IBM HR dataset under four oversampling strategies: (a) ADASYN, (b) ROS, (c) GAN, and (d) SMOTE. Each matrix displays the number of true negatives (top left), false positives (top right), false negatives (bottom left), and true positives (bottom right), highlighting GAN’s superior reduction of misclassification errors.
Table 3 summarizes the principal performance metrics accuracy, precision, recall, F1 score, and ROC AUC for ADASYN, ROS, GAN, and SMOTE, with all values expressed as percentages. GAN oversampling markedly outperforms the alternatives, attaining 92.00% accuracy, 96.67% precision, 87.00% recall, 91.58% F1 score, and 96.32% ROC AUC. The ROS and SMOTE methods both achieve ROC AUC values in the vicinity of 87%, while ADASYN reaches 84.24%.
Table 3.
Key performance metrics of ADASYN, ROS, GAN, and SMOTE methods for the IBM HR dataset.
The experimental evaluation results on the IBM HR dataset are summarized in Table 3. The GAN-based oversampling strategy outperformed all other methods, achieving 92.0% accuracy, 96.7% precision, 87.0% recall, a 91.6% F1 score, and a 0.963 ROC AUC. While ADASYN and ROS yielded moderate improvements, SMOTE also produced a significant increase compared with the original model.
Figure 6 illustrates the ROC curves for each oversampling method. The GAN-derived curve remains closest to the ideal top left corner, corroborating its highest AUC of 96.32%, whereas ROS and SMOTE both approximate 87%, and ADASYN attains 84.24%.
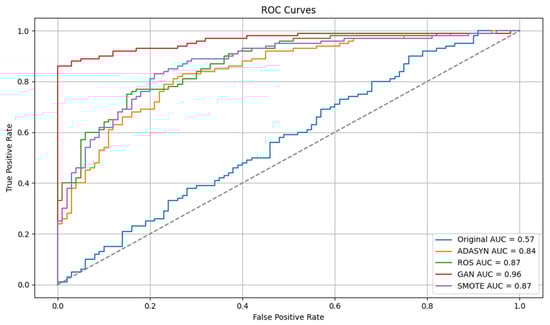
Figure 6.
Receiver Operating Characteristic (ROC) curves comparing the discrimination performance of the original data and four oversampling methods, ADASYN, ROS, GAN, and SMOTE, on the IBM HR dataset. The GAN-based approach achieves the highest AUC (0.96), followed by ROS and SMOTE (0.87 each), ADASYN (0.84), and the original imbalanced data (0.57).
The epoch-wise evolution of training and validation loss is depicted in Figure 7, and the corresponding accuracy trajectories in Figure 8. Under GAN oversampling, loss declines precipitously below 50 within the first ten epochs and then plateaus, while validation accuracy surpasses 90%. In contrast, the other methods exhibit slower convergence and stabilize between 80% and 85% validation accuracy.
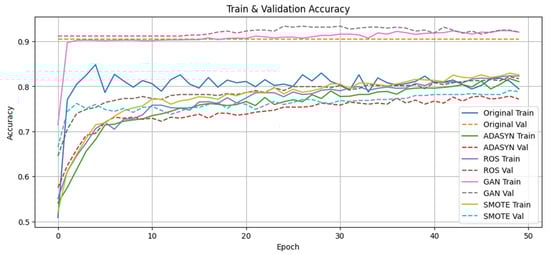
Figure 7.
Epoch-wise training and validation accuracy curves for the IBM HR dataset classifier under Original, ADASYN, ROS, GAN, and SMOTE sampling strategies. GAN-based oversampling facilitates rapid convergence to above 90% validation accuracy, whereas the other methods progress more gradually, plateauing between 75% and 82%.
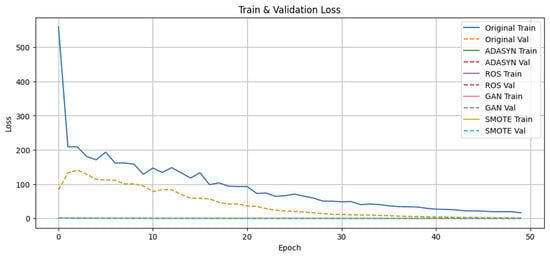
Figure 8.
Epoch-wise training and validation loss trajectories for the IBM HR dataset classifier across Original, ADASYN, ROS, GAN, and SMOTE sampling strategies. GAN oversampling yields a steep loss decline, dropping below 50 within the first ten epochs, and then stabilizes at low values; the remaining methods exhibit slower loss reduction and later convergence.
The classifier-by-method heatmap in Figure 9 provides a comprehensive overview of five evaluation metrics—accuracy, precision, recall, F1 score, and AUC—for a suite of fifteen classifiers applied to each oversampled dataset. GAN-generated data consistently yields the highest AUC values, with algorithms such as Extra Trees, Gradient Boosting, and LDA achieving over 95%. Conversely, classifiers trained on the original imbalanced data predominantly remain within the 60–85% AUC interval.
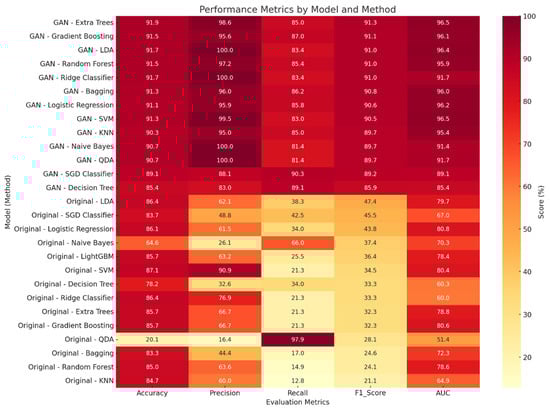
Figure 9.
Comparative heatmap of classification performance across fifteen algorithms and five sampling conditions Original and GAN on the IBM HR dataset. Cells encode percentage values for Accuracy, Precision, Recall, F1 Score, and ROC AUC, with darker red shades indicating superior performance. GAN-based oversampling consistently delivers the highest metric values, particularly in ROC AUC and Precision across nearly all classifiers.
As depicted in Figure 10, JobSatisfaction stands out as the single most influential determinant of the retention prediction, followed by age and years with curr manager, which together underscore the centrality of employee contentment and tenure-related factors. Mid-ranking features such as job ınvolvement, hourly rate, and years since last promotion further highlight how both subjective engagement and objective career progression metrics modulate churn risk. In contrast, demographic and structural variables, for example, department, education field, and stock option level exhibit comparatively minor average impacts. This hierarchy of importance not only elucidates the drivers of model decisions but also aligns with theoretical expectations that satisfaction and managerial continuity are pivotal in curbing voluntary attrition.
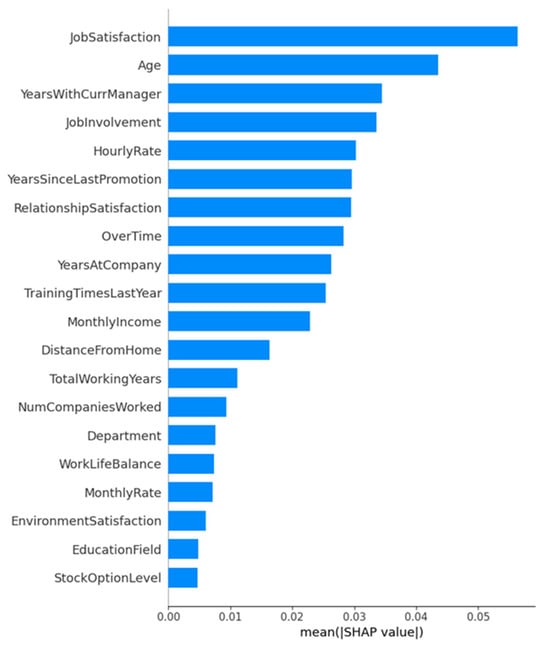
Figure 10.
Global feature importance for the IBM HR dataset classifier under GAN oversampling, as measured by mean absolute SHAP values. Each bar indicates the average magnitude of a feature’s contribution to the model’s output.
As shown in Figure 10, global SHAP analysis identifies job satisfaction, age, and years with currmanager as the three most influential predictors in the GAN-oversampled IBM HR model, together accounting for the largest mean absolute contributions to retention forecasts. Figure 11 complements this overview by depicting the distribution and directionality of individual SHAP values: higher job satisfaction scores (red points) consistently drive negative contributions to the attrition risk (i.e., favoring retention), whereas lower scores (blue points) shift the prediction toward separation. Analogously, older employees and those with longer service under the same manager exhibit predominantly retention-oriented impacts, while younger or more recently reassigned individuals tend toward positive SHAP values (increased attrition propensity). Features such as over time and years since last promotion display more heterogeneous effects, indicating that their influence varies across employee subgroups. Together, Figure 10 and Figure 11 provide both a global hierarchy of feature importance and a nuanced, instance-level understanding of how specific employee attributes modulate churn risk.
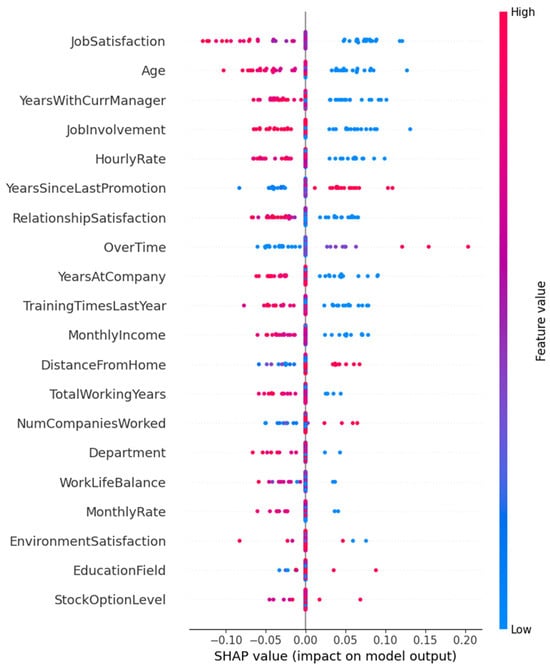
Figure 11.
Beeswarm plot of SHAP values for the top twenty features in the GAN-oversampled IBM HR dataset classifier. Each point represents an individual employee; the horizontal axis denotes the impact on the model’s log-odds output (SHAP value), and color encodes the original feature magnitude (red = high, blue = low).
4.2. Kaggle HR Dataset-Based Experimental Evaluation
In this subsection, we present a comprehensive evaluation of four oversampling strategies—ADASYN, ROS, SMOTE, and GAN—applied to the Kaggle HR dataset. Confusion matrices in Figure 12 demonstrate a clear reduction in both false positives and false negatives as one moves from ADASYN through GAN, with the GAN approach achieving 973 true negatives and 966 true positives.
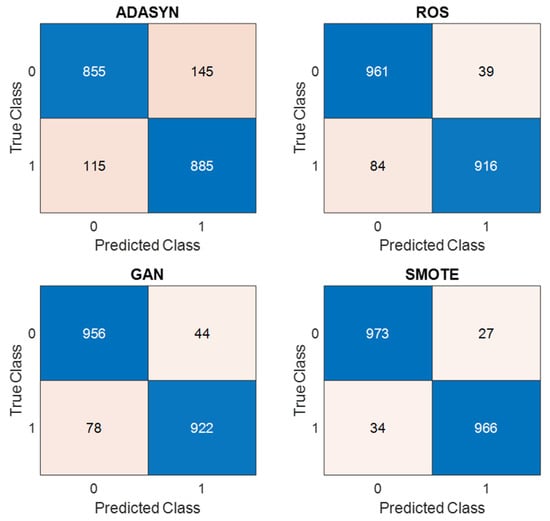
Figure 12.
Confusion matrices for ADASYN, ROS, SMOTE, and GAN on the Kaggle HR dataset.
The primary performance metrics are summarized in Table 4, where GAN-based oversampling attains the highest scores across all criteria: 96.95% accuracy, 97.28% precision, 96.60% recall, 96.94% F1 score, and 99.15% ROC AUC. SMOTE and ROS follow closely, while ADASYN lags behind (87.00–3.31%).
Table 4.
Performance metrics (%) for ADASYN, ROS, SMOTE, and GAN on the Kaggle HR dataset.
Receiver Operating Characteristic curves in Figure 13 further illustrate the superior discrimination of the GAN-augmented model (AUC = 0.99) relative to SMOTE and ROS (both AUC = 0.98), ADASYN (AUC = 0.93), and the imbalanced baseline (AUC = 0.77).
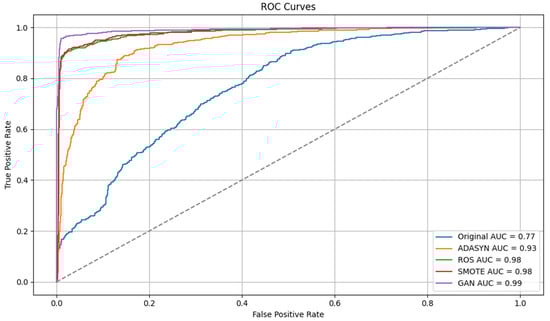
Figure 13.
ROC curves for each oversampling method.
Epoch-wise training and validation accuracy (see Figure 14) reveal that GAN oversampling achieves over 95% validation accuracy within five epochs and maintains stability thereafter. Corresponding loss trajectories in Figure 15 show that GAN reduces validation loss below 0.4 rapidly, indicating both fast convergence and strong generalization; the other methods converge more gradually and to higher loss values.

Figure 14.
Epoch-wise training and validation accuracy.
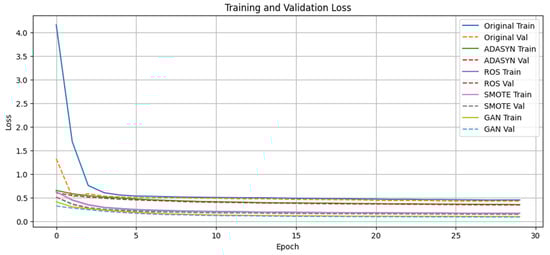
Figure 15.
Epoch-wise training and validation loss.
A classifier-by-method heatmap in Figure 16 offers a holistic comparison across fifteen algorithms: Random Forest, LightGBM, and Extra Trees trained on GAN-augmented data consistently exceed 98% AUC, whereas their counterparts on the original data remain below this threshold.
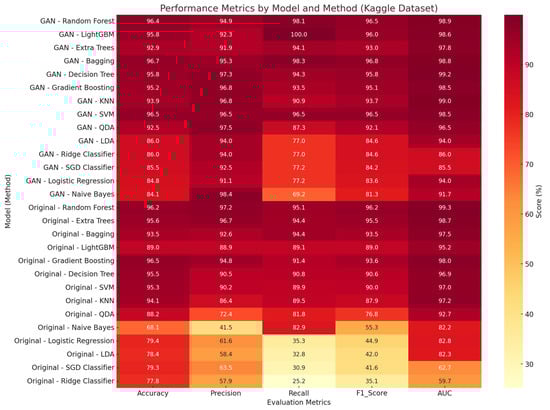
Figure 16.
Classifier performance heatmap across sampling methods.
The global feature importance plot in Figure 17 quantifies each predictor’s average contribution to the model’s output on the Kaggle HR dataset. Here, number project emerges as the most influential variable, indicating that employees involved in a larger number of projects are systematically more likely to be classified as churn candidates. satisfaction level follows as the second strongest driver, reflecting that lower job satisfaction markedly increases predicted attrition risk. The third-ranked feature, time spend company, further corroborates tenure effects, whereby longer service duration under the same employer exerts a stabilizing (retention-oriented) influence. Lesser-impact variables such as last evaluation, average montly hours, Department, salary, promotion last 5years, and Work accident contribute comparatively minor average effects, underscoring the preeminence of workload and satisfaction metrics in this classification task.
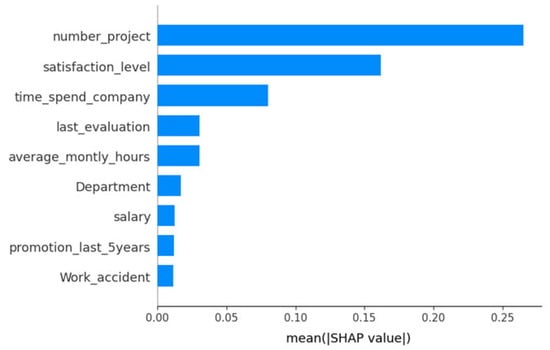
Figure 17.
Mean absolute SHAP feature importance for the Transformer-based model trained on the Kaggle HR dataset.
The SHAP beeswarm in Figure 18 provides an instance-level perspective on how feature values drive individual predictions. For number project, red points on the right (high project counts) align with positive SHAP values, signifying increased attrition probability, whereas blue dots (low counts) cluster toward retention. In contrast, satisfaction level exhibits the opposite pattern: high satisfaction (red) shifts predictions toward retention (negative SHAP), and low satisfaction (blue) toward attrition. time spend company displays a more nuanced distribution: mid-range tenures yield mixed effects, but both very low and very high tenures can sway predictions depending on concurrent satisfaction and workload levels. Collectively, this beeswarm visualization confirms and refines the global hierarchy of Figure 17 by revealing the directional and heterogeneous influences of each feature across the employee population.
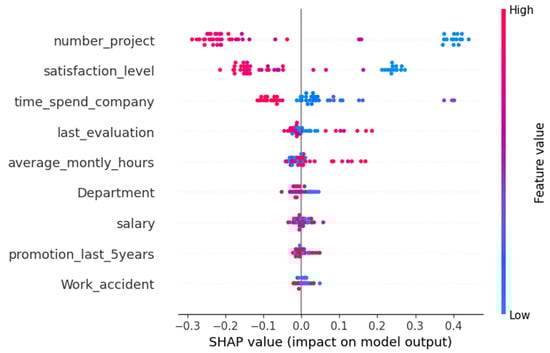
Figure 18.
SHAP beeswarm plot showing individual feature impacts for the Transformer-based model trained on the Kaggle HR dataset.
5. Discussion
This study contributes to the growing theoretical and practical discourse on explainable artificial intelligence (XAI) in human resources analytics. Prior research has emphasized the importance of transparency and interpretability when applying predictive models in HR contexts, where algorithmic outputs influence retention strategies, employee morale, and managerial trust. By combining SHAP-based explanations with a high-performing predictive framework, this work aligns with contemporary XAI literature that seeks not only to maximize predictive accuracy but also to provide theoretically grounded, actionable insights to support evidence-based HR decision-making. The proposed GAN-supported Transformer-based classification framework outperforms comparable approaches in the literature on both the IBM HR Dataset and the Kaggle HR Analytics Dataset. In particular, achieving 92.00% accuracy on the IBM dataset and 96.95% on the Kaggle dataset substantially exceeds the 94.16% and 92.17% accuracies reported by Al Darraji et al. [18] and Mortezapour Shiri et al. [19], respectively. This improvement is driven by the GAN’s ability to generate realistic synthetic samples that mitigate class imbalance, thereby strengthening minority class representation, and by the Transformer’s superior capacity to capture complex feature interactions (see Table 5).
Table 5.
Comparative performance results.
The SHAP analysis that underpins the model’s interpretability brought employee engagement and satisfaction factors to the fore. In the IBM dataset, JobSatisfaction, Age, and YearsWithCurrManager emerged as the most influential variables, whereas in the Kaggle dataset, number project, satisfaction level, and time spend company were most decisive for attrition. These insights go beyond classical methods such as L SVM and Random Forest to directly answer HR professionals’ key question, “Which factors should we focus on?” thereby delivering not only high predictive accuracy but also the transparency and actionable insight required by managerial decision support systems. It is important to note that the most influential features identified by SHAP analysis differ across datasets. In the IBM HR dataset, JobSatisfaction, Age, and YearsWithCurrManager emerged as key predictors, highlighting the importance of employee satisfaction and tenure-related factors in this simulated HR context. Conversely, in the Kaggle HR dataset, features such as number project, satisfaction level, and time spend company were more influential, reflecting how workload and project assignment pressures drive attrition in real organizational data. These differences underscore the impact of varying organizational structures, data collection practices, and contextual factors on the predictors of turnover, emphasizing the need for HR analytics frameworks to adapt to the specific organizational environment in which they are applied. Additionally, while Transformer models are often designed for large datasets, recent studies have shown their potential in tabular data applications. We combined this architecture with dropout regularization and GAN-based synthetic data generation to mitigate overfitting, allowing effective use even on moderate-sized HR datasets. This choice was motivated by the Transformer’s ability to model complex feature interactions, which are critical in understanding multifaceted employee turnover behaviors. Furthermore, training and validation learning curves and comparative test set results confirmed that our model did not suffer from overfitting, further supporting the robustness of our proposed approach.
Nevertheless, this study has limitations. First, the synthetic nature of the IBM dataset may not fully capture real-world dynamics. Second, the Kaggle dataset originates from a single, anonymized company; cross-validation on data from different sectors and geographies is therefore necessary. Third, the computational cost of model training and inference may demand further optimization, especially for large-scale corporate deployment.
Future work should validate the proposed framework on diverse geographic and sectoral datasets to assess its generalizability. In addition, model pruning and integration into real-time monitoring infrastructures could enhance HR departments’ ability to intervene swiftly. Finally, a comparative evaluation of alternative XAI methods, such as LIME or counterfactual explanations, could deepen interpretability further.
In summary, this study presents a comprehensive approach that successfully unites high accuracy and interpretability requirements in employee attrition prediction. Enhancing the effectiveness of decision support systems in HR analytics offers a rich reference point for future research.
5.1. Future Work
In future studies, it would be valuable to evaluate the proposed framework across diverse industries and organizational settings to examine its generalizability and effectiveness under different corporate cultures and management structures. Such research could tailor the feature engineering, model architecture, and interpretability components of the proposed methodological approach to incorporate industry-specific variables, cultural factors, and hierarchical dynamics. Moreover, integrating sectoral norms related to turnover behavior and combining domain expertise with machine learning models could help produce even more accurate and actionable insights for HR managers. Finally, developing lightweight or real-time implementations and comparing alternative explainability approaches, such as counterfactual or example-based methods, would further strengthen the practical contribution of this line of research. Moreover, incorporating k-fold cross-validation techniques and formal statistical significance testing would further enhance the empirical rigor of the proposed framework and strengthen the reliability of the observed performance gains. In addition, incorporating k-fold cross-validation techniques and formal statistical significance testing would further enhance the empirical rigor of the proposed framework and strengthen the reliability of the observed performance gains.
5.2. Limitations
Despite the promising results, this study has several limitations. First, the use of synthetic data (particularly in the IBM HR dataset) may not fully reflect the complexity of real-world organizational dynamics. Second, although the framework achieved strong performance on two datasets, its generalizability to other industries, geographic regions, and organizational structures remains untested. Furthermore, the high parameter complexity of Transformer models may hinder their ability to generalize effectively when trained on small to moderately sized datasets, such as the IBM HR dataset, despite strong internal performance metrics. Finally, adapting the model across domains with different HR practices, data schemas, or workforce characteristics could present challenges, suggesting the need for future research on domain adaptation and transfer learning approaches. Moreover, the computational cost of GAN training and Transformer inference could pose challenges for real-time or large-scale deployment. Further work should focus on developing lightweight model variants and assessing practical implications in diverse organizational settings to maximize impact.
6. Conclusions
In this study, we have introduced a comprehensive, Explainable AI–driven framework for predicting employee turnover that harmonizes generative oversampling, deep learning, and interpretability. By leveraging a GAN to synthetically balance class distributions, followed by a three-layer Transformer encoder for binary classification, and concluding with SHAP value analysis for feature attributions, our approach addresses both the accuracy and transparency challenges that have long plagued HR analytics. Empirical evaluations on the IBM HR Analytics and Kaggle HR Analytics datasets demonstrated that our method surpasses classical resampling techniques (ROS, SMOTE, ADASYN) and recent state-of-the-art benchmarks, achieving up to 96.95% accuracy and 99.15% ROC AUC.
Beyond raw performance gains, the incorporation of SHAP explanations proved essential for managerial decision support, revealing that variables such as job satisfaction, tenure with the current manager, and project load exert the most substantial influence on turnover risk. These insights not only validate existing HR theory but also furnish practitioners with actionable guidance for targeted retention strategies.
Despite these strengths, certain limitations must be acknowledged. Both datasets originate from particular organizational contexts, and thus, the model’s cross-industry generalizability remains to be established. Furthermore, the computational intensity of GAN training and Transformer inference could impede real-time deployment in resource-constrained environments. Future research should focus on (1) validating the framework across diverse sectors and geographic regions, (2) developing lightweight or distilled model variants to enable near real-time inference, and (3) exploring complementary XAI techniques such as counterfactual explanations to further enrich interpretability.
Overall, by uniting cutting-edge predictive performance with rigorous, human-centric explanations, our pipeline constitutes a robust foundation for data-driven, proactive workforce retention policies. We anticipate that this work will spur both academic inquiry and practical innovation at the intersection of artificial intelligence and strategic human resource management. These insights can support HR managers in proactively designing retention strategies, adjusting workload or project assignments, and prioritizing interventions focused on job satisfaction, thereby translating predictive results into practical managerial actions. Beyond the immediate application to employee retention, the proposed XAI-powered framework contributes to a broader understanding of how explainable machine learning can support data-driven decision-making across organizational domains. By combining predictive accuracy with transparent, interpretable outputs, this approach strengthens managerial trust in algorithmic recommendations, an essential condition for real-world adoption. The integration of GANs for data augmentation and SHAP for interpretability demonstrates how advanced AI techniques can be adapted not only to forecast human behavior but also to guide strategic interventions in areas such as workforce planning, risk management, and operational efficiency. As such, this research exemplifies how AI, when thoughtfully applied, can bridge the gap between complex data analysis and actionable organizational decisions.
Author Contributions
Conceptualization; Writing-original draft; Writing-review & editing; Visualization; Supervision: İ.T.B. Methodology; Software; Validation; Writing- original draft; Writing-review & editing; Visualization; Supervision; Project administration: B.T. All authors have read and agreed to the published version of the manuscript.
Funding
This work was supported by the İİBF.25.02 project fund provided by the Scientific Research Projects Coordination Unit of Firat University.
Institutional Review Board Statement
Not applicable.
Data Availability Statement
Publicly available datasets were analyzed in this study. These datasets can be found here: https://www.kaggle.com/datasets/pavansubhasht/ibm-hr-analytics-attrition-dataset (accessed on 24 May 2025) and https://www.kaggle.com/code/devisangeetha/predicting-employee-churn (accessed on 24 May 2025).
Conflicts of Interest
The authors declare no conflicts of interest.
References
- Hamid, D.; Hassan, C.A.U.; Yasin, A.U.; Shabir, S.; Akram, T.; Aslam, M.A. Retaining the Best: How AI and IoT Can Combat Employee Turnover. In Proceedings of the 2024 2nd International Conference on Computing and Data Analytics (ICCDA), Shinas, Oman, 12–13 November 2024; pp. 1–7. [Google Scholar]
- Hom, P.W.; Allen, D.G.; Griffeth, R.W. Employee Retention and Turnover: Why Employees Stay or Leave; Routledge: New York, NY, USA, 2019. [Google Scholar]
- Leung, C.K.; Imran, R.; Pazdor, A.G.; Souza, J. An Explainable Artificial Intelligence Solution for the Practical Application of Employee Turnover. In Proceedings of the 2024 28th International Conference Information Visualisation (IV), Coimbra, Portugal, 22–26 July 2024; pp. 1–6. [Google Scholar]
- Marín Díaz, G.; Galán Hernández, J.J.; Galdón Salvador, J.L. Analyzing employee attrition using explainable AI for strategic HR decision-making. Mathematics 2023, 11, 4677. [Google Scholar] [CrossRef]
- Darapaneni, N.; Turaga, R.N.; Shah, V.C.; Paduri, A.R.; Kumar, R.D.; Suram, M.; Venkatraman, V. A detailed analysis of AI models for predicting employee attrition risk. In Proceedings of the 2022 IEEE 10th Region 10 Humanitarian Technology Conference (R10-HTC), Hyderabad, India, 16–18 September 2022; pp. 243–246. [Google Scholar]
- Paigude, S.; Pangarkar, S.C.; Hundekari, S.; Mali, M.; Wanjale, K.; Dongre, Y. Potential of artificial intelligence in boosting employee retention in the human resource industry. Int. J. Recent Innov. Trends Comput. Commun. 2023, 11, 1–10. [Google Scholar] [CrossRef]
- Li, W. A transformer-based deep learning framework to predict employee attrition. PeerJ Comput. Sci. 2023, 9, e1570. [Google Scholar] [CrossRef] [PubMed]
- Guerranti, F.; Dimitri, G.M. A comparison of machine learning approaches for predicting employee attrition. Appl. Sci. 2022, 13, 267. [Google Scholar] [CrossRef]
- Varkiani, S.M.; Pattarin, F.; Fabbri, T.; Fantoni, G. Predicting employee attrition and explaining its determinants. Expert Syst. Appl. 2025, 126575. [Google Scholar] [CrossRef]
- Fallucchi, F.; Coladangelo, M.; Giuliano, R.; William De Luca, E. Predicting employee attrition using machine learning techniques. Computers 2020, 9, 86. [Google Scholar] [CrossRef]
- Vaiyapuri, T.; Sbai, Z. Bayesian Optimized Boosted Ensemble Models for HR Analytics-Adopting Green Human Resource Management Practices. Int. J. Technol. 2025, 16, 561–572. [Google Scholar] [CrossRef]
- Subhash, P. Ibm Hr Analytics Employee Attrition & Performance. 2017. Available online: https://www.kaggle.com/datasets/pavansubhasht/ibm-hr-analytics-attrition-dataset (accessed on 24 May 2025).
- Mzinic; Kaggle. Employee Churn Prediction. 2019. Available online: https://www.kaggle.com/code/devisangeetha/predicting-employee-churn (accessed on 24 May 2025).
- Goodfellow, I.; Pouget-Abadie, J.; Mirza, M.; Xu, B.; Warde-Farley, D.; Ozair, S.; Courville, A.; Bengio, Y. Generative adversarial networks. Commun. ACM 2020, 63, 139–144. [Google Scholar] [CrossRef]
- Yalçın, O.G. Generative adversarial network. In Applied Neural Networks with TensorFlow 2: API Oriented Deep Learning with Python; Springer: Berlin/Heidelberg, Germany, 2020; pp. 259–284. [Google Scholar]
- Popuri, A.; Miller, J. Generative Adversarial Networks in Image Generation and Recognition. In Proceedings of the 2023 International Conference on Computational Science and Computational Intelligence (CSCI), Las Vegas, NV, USA, 13–15 December 2023; pp. 1294–1297. [Google Scholar]
- Lundberg, S.M.; Lee, S.-I. A unified approach to interpreting model predictions. Adv. Neural Inf. Process. Syst. 2017, 30, 1–10. [Google Scholar]
- Al-Darraji, S.; Honi, D.G.; Fallucchi, F.; Abdulsada, A.I.; Giuliano, R.; Abdulmalik, H.A. Employee attrition prediction using deep neural networks. Computers 2021, 10, 141. [Google Scholar] [CrossRef]
- Mortezapour Shiri, F.; Yamaguchi, S.; Ahmadon, M.A.B. A Deep Learning Model Based on Bidirectional Temporal Convolutional Network (Bi-TCN) for Predicting Employee Attrition. Appl. Sci. 2025, 15, 2984. [Google Scholar] [CrossRef]
- Pratt, M.; Boudhane, M.; Cakula, S. Employee attrition estimation using random forest algorithm. Balt. J. Mod. Comput. 2021, 9, 49–66. [Google Scholar] [CrossRef]
- Raza, A.; Munir, K.; Almutairi, M.; Younas, F.; Fareed, M.M.S. Predicting employee attrition using machine learning approaches. Appl. Sci. 2022, 12, 6424. [Google Scholar] [CrossRef]
- Atef, M.; S Elzanfaly, D.; Ouf, S. Early prediction of employee turnover using machine learning algorithms. Int. J. Electr. Comput. Eng. Syst. 2022, 13, 135–144. [Google Scholar] [CrossRef]
- Prihanto, B.; Sereati, C.O.; Kartawidjaja, M.A.; Siregar, M. Atrition Analysis using XG Boost and Support Vector Machine Algorithm. Int. J. Innov. Sci. Res. Technol 2023, 8, 2096–2112. [Google Scholar]
- Al Akasheh, M.; Hujran, O.; Malik, E.F.; Zaki, N. Enhancing the Prediction of Employee Turnover with Knowledge Graphs and Explainable AI. IEEE Access 2024, 12, 77041–77053. [Google Scholar] [CrossRef]
- Lim, C.S.; Malik, E.F.; Khaw, K.W.; Alnoor, A.; Chew, X.; Chong, Z.L.; Al Akasheh, M. Hybrid GA–DeepAutoencoder–KNN Model for Employee Turnover Prediction. Stat. Optim. Inf. Comput. 2024, 12, 75–90. [Google Scholar] [CrossRef]
Disclaimer/Publisher’s Note: The statements, opinions and data contained in all publications are solely those of the individual author(s) and contributor(s) and not of MDPI and/or the editor(s). MDPI and/or the editor(s) disclaim responsibility for any injury to people or property resulting from any ideas, methods, instructions or products referred to in the content. |
© 2025 by the authors. Licensee MDPI, Basel, Switzerland. This article is an open access article distributed under the terms and conditions of the Creative Commons Attribution (CC BY) license (https://creativecommons.org/licenses/by/4.0/).