Article

An Optimization Model of Coupled Medical Material Dispatching Inside and Outside Epidemic Areas Considering Comprehensive Satisfaction

1
Faculty of Maritime and Transportation, Ningbo University, Fenghua Road 818#, Ningbo 315211, China
2
College of Automobile and Traffic Engineering, Nanijng Forestry University, Nanjing 210037, China
3
School of Architecture and Transportation, Guilin University of Electronic Technology, Jiniji Road 1#, Guilin 541004, China
4
School of Transportation, Southeast University, Nanjing 211189, China
*
Author to whom correspondence should be addressed.
Systems 2025, 13(8), 714; https://doi.org/10.3390/systems13080714
Submission received: 26 March 2025 / Revised: 1 August 2025 / Accepted: 12 August 2025 / Published: 19 August 2025

Abstract

This study addresses the critical challenge of emergency material distribution during atypical public health crises, using the COVID-19 pandemic in Hubei Province as a representative case. An innovative internal–external coupled dispatching framework is proposed by integrating regional medical resource allocation with cross-regional supply chain networks. Our methodology employs the SEIR epidemiological model to forecast infection rates and corresponding material demands, then incorporates bidirectional dispatching efficiency as a key determinant of demand urgency. Through systematic risk stratification of affected areas, we develop a dual-objective optimization model that simultaneously minimizes logistical time and cost, solved by the NSGA-II algorithm. The results demonstrate that the internal–external coupled emergency material dispatching approach significantly enhances demand satisfaction in affected regions and improves overall dispatching effectiveness. This study offers practical recommendations and valuable references for emergency material dispatching during public health crises.

1. Introduction

In recent years, the COVID-19 pandemic and other sudden public health events have had a huge impact on social and economic activities and resulted in immeasurable loss of life and property [1]. Timely and effective deployment of emergency supplies is critical. Because the epidemic and other public health emergencies involve contagious, sudden and long-range disease spread [2], once an outbreak has occurred, the affected area will often experience a shortage of internal materials and need external material rescue. Therefore, timely dispatch of emergency supplies internally and externally appears to be critical.
For the study of emergency material dispatching during public health emergencies, the existing literature is mostly focused on objectives such as the shortest time, the smallest cost, and fairness, among others. For example, Chen et al. [3] ranked the emergency logistics response capabilities of different provinces in China based on the entropy weight TOPSIS method and revealed regional differences and their causes through panel quantile regression. They found that the overall response capability was strongest in the eastern region and weakest in the western region. In addition, social labor input, urbanization, and digitalization levels had a significant positive impact on emergency logistics response capabilities. In terms of multi-depot routing optimization, Yin et al. [4] employed K-means clustering to decompose the problem into multiple single-depot problems and conducted a comparative analysis of the performance of guided local search (GLS), Tabu Search (TS), and Simulated Annealing (SA) algorithms. The results indicated that the GLS algorithm performed optimally in multi-depot emergency logistics distribution routing. Regarding the emergency logistics vehicle routing optimization problem during major public health events (such as the COVID-19 pandemic), Tan et al. [5] proposed an improved PSO algorithm that incorporates transportation costs, time costs, early/late arrival penalties, and fixed vehicle costs into the objective function. Combined with a soft time window constraint model, empirical evidence showed that the total cost was reduced by approximately 20% compared to the basic PSO algorithm. Wu et al. [6] combined the Estimation Distribution Algorithm (EDA) with the Multi-Objective Snow Goose Algorithm (MOSGA) to construct a multi-objective chance-constrained model. A case study during the COVID-19 pandemic in Chengdu demonstrated the superior performance of this method in real-world applications. With the development of deep reinforcement learning technology, Wang et al. [7] introduced an algorithm based on Deep Deterministic Policy Gradient (DDPG) to address the problem of rescue resource allocation and scheduling in storm surge inundation scenarios. By comparing the Mixed Integer Linear Programming (MILP) and DDPG methods in a case study during Typhoon Mangkhut in Futian District, Shenzhen, the advantages of DDPG in real-time performance and scalability were verified. Fan et al. [8] proposed the DHL (Deep Humanitarian Logistics) method, which models through a Markov Decision Process (MDP) and considers multiple objectives such as disaster area needs, initial state and transportation costs, material scarcity costs, and distribution fairness. In terms of hybrid and quantum algorithms, Sun and Cai [9] utilized the Quantum Particle Swarm Optimization (QPSO) algorithm to solve the location-routing coordination problem in complex environments. The study employed trapezoidal fuzzy numbers to characterize the uncertainties in congestion time and maximum rescue time. Experiments showed that QPSO achieved a 36.7% improvement in convergence speed compared to traditional PSO. Yan et al. [10] proposed a hybrid metaheuristic algorithm (DPSO-HHO) to address the multi-objective location-routing problem in the early stages after a disaster. Ge et al. [11] adopted a two-stage model approach to study the distribution of emergency logistics centers in the Yangtze River Delta region during the COVID-19 lockdown. The model includes principal component analysis (PCA) for screening candidate centers and the NSGA II algorithm for solving the bi-objective location model. Eshghi et al. [12] proposed a multi-objective robust optimization model that combines NSGA II and Taguchi parameter tuning methods. The model’s robustness to demand and cost uncertainties was validated in a case study of resource allocation and casualty evacuation in earthquake-prone areas of Iran. Li [13] proposed an ESD MEC method based on Mobile Edge Computing (MEC), which integrates ant colony optimization and supplier allocation algorithms to address tracking, deadhead trips, and delay issues in emergency logistics, significantly improving prediction accuracy and scheduling efficiency. Lei et al. [14] employed Qualitative Comparative Analysis (QCA) to study the generation mechanism of cross-regional emergency cooperation in major and catastrophic accidents and disaster relief in China. The study proposed three paths, autonomous adjustment, system-driven function, and demand generation, emphasizing the role of information assurance, regulatory support, and social resource investment in enhancing cooperation efficiency.
From the above, it can be seen that the current stage of epidemic material dispatching research mainly focuses on the objective or optimization algorithm of emergency material dispatching. There are some shortcomings: (1) Most of the epidemic emergency material dispatching studies have focused on emergency material dispatching according to the demand under the premise of the overall material sufficiency at the time of the epidemic, and seldom considered the situation of the overall material shortage in the early stage of the epidemic. (2) Most studies are limited to the optimization of material dispatching within the affected area, while ignoring the possibility of external rescue. (3) The evaluations of the results in the emergency material dispatching studies mostly analyze the objective optimization effect and parameter sensitivity, and lack of overall assessments of satisfaction perspective.
Therefore, this paper focuses on the characteristics of the COVID-19 epidemic. This paper takes the overall shortage of materials in the epidemic area as the premise and considers the material dispatching optimization not only within the epidemic area but also regarding external rescue to achieve the internal and external coupling of emergency material dispatching optimization. This paper builds a complete emergency material dispatching process based on the epidemic and describes the internal and external emergency material dispatching program. The specific number of people is obtained by the epidemic spreading model. Medical material demand is predicted by the epidemic risk level and the population number. A set of evaluation indicators for disaster sites is also established to quantify the urgency of demand for internal and external coupling situations. Finally, this paper puts forward comprehensive satisfaction and demand satisfaction results (and other emergency material dispatching results) for evaluations in order to achieve a better emergency material dispatching effect. This paper hopes to give some suggestions regarding epidemic emergency material dispatching.

2. Coupled Medical Material Dispatching Model for the Internal and External Infected Area Considering Comprehensive Satisfaction

2.1. Problem Description

Public health emergencies such as epidemics are characterized by contagiousness and diffusivity. After the outbreak of an epidemic, it will quickly spread to the surrounding area, forming a more serious internal area and a less serious external area. Compared with the external region, the degree of the epidemic in the internal region is more serious and the emergency supplies are also more limited, so the internal region emergency supplies are in high shortage. Therefore, the external region of the epidemic can be organized to carry out emergency supply rescue to the internal region of the epidemic to make up for the shortage of emergency supplies in the internal region of the epidemic. The disaster sites in the internal region of the epidemic, the demand for emergency supplies, and the degree of urgency will show differences in the limited time available due to the severity of the epidemic, the number of people, economic conditions, etc. How to scientifically allocate limited emergency materials in such limited time according to different disaster situations plays an important role in improving the effectiveness and precision of the rescue work. At the same time, the contagiousness of the epidemic makes it difficult to predict the number of people affected by the disaster and the amount of material demand, and it is necessary to introduce the theory of infectious disease dynamics for research. Zhu et al. [15] proposed a multi-objective fuzzy optimization model based on IT2TFS, aiming to optimize material delivery time, transportation frequency, and inventory cost, thereby enhancing the efficiency of disaster relief supplies. Ding et al. [16] designed a multi-objective emergency material scheduling method based on gray interval numbers, which improves the efficiency of disaster response by optimizing objectives such as time cost, transportation, and production cost. Guo et al. [17] designed a multi-objective shortest path problem for multi-mode transportation in emergency logistics, aiming to optimize transportation time, distance, and cost. Xu et al. [18] constructed a multi-mode path optimization model for emergency material transportation, aiming to minimize transportation time and cost. By introducing a risk coefficient, uncertain parameters are converted into deterministic values, further optimizing transportation paths and scheduling, and improving the emergency response efficiency of the logistics system. Ye et al. [19] proposed a multi-objective optimization emergency response framework integrating pre-disaster and post-disaster stages. The pre-disaster stage aims to minimize cost; in the post-disaster stage, third-party emergency forces are introduced to optimize material scheduling schemes with the objective of simultaneously minimizing transportation cost and rescue time. Hu et al. [20] proposed a multi-objective robust optimization model for designing optimization schemes in epidemic emergency logistics, thereby minimizing transportation time, transportation cost, and material shortage, improving emergency response efficiency and reducing costs. Wang et al. [21] constructed a multi-period emergency material distribution optimization model, using the NSGA-II algorithm to optimize material allocation. The objectives of the model include improving time-perceived satisfaction in disaster areas, reducing the pain effect of material loss, and lowering overall rescue cost. Liu et al. [22] analyzed the complex adaptive characteristics of cross-regional emergency collaboration in China through stochastic evolutionary game theory, constructing two game models: regional integration and paired assistance. The research showed that intergovernmental collaboration efficiency, emergency fund reserves, and external support have a significant impact on the stability and effectiveness of emergency collaboration. Therefore, in the epidemic disaster situation, we need reasonable classification of the epidemic population, scientific prediction of the epidemic material demand and classification of the risk level of each disaster point according to the disaster information of the internal region of each disaster point. After determining the degree of urgency of the demand, we implement a differentiated emergency material dispatch strategy to efficiently deploy the resources in the internal and external region of the epidemic. The key issue of this paper is to achieve the best prevention and control of the epidemic. The network of emergency material dispatching is shown in Figure 1.

2.2. Epidemic Spreading Model

Therefore, the SEIR model is established, which is based on the following assumptions:
(1)
The population within the infected region at time t is divided into four categories, namely the susceptible population S(t), the non-infectious incubator population E(t), the infected population with disease flare-ups I(t), and the recovered population with acquired immunity R(t), and the four categories are homogeneously mixed.
(2)
The infected region is considered closed, disregarding population movements, births and deaths, and the total population is held constant, namely, S ( t ) + E ( t ) + I ( t ) + R ( t ) = N .
(3)
At moment t, the incubators are transformed into infected people in a certain proportion and their number is proportional to the number of incubators, noting the proportion as δ .
(4)
α is the recovery rate, which is the probability that an infected person is successfully cured and transformed into a recovered person after treatment.
Provided that the above assumptions are valid, the following differential equation can be obtained:
d S ( t ) d t = β I ( t ) S ( t ) N d E ( t ) d t = β I ( t ) S ( t ) N δ E ( t ) d I ( t ) d t = δ E ( t ) α I ( t ) d R ( t ) d t = α I ( t )
The SEIR model is shown in Figure 2.

2.3. Demand Forecast for Emergency Supplies

Through the relevant literature research, this paper mainly selects the epidemic risk level and the number of people affected by the epidemic as the factors determining the demand for epidemic materials, in which the population affected by the epidemic is subdivided into susceptible population, latent population, infected population and rehabilitated population. The specific number of people is obtained by the epidemic spreading model and the materials are selected as medical materials. The emergency medical material demand prediction model is established as follows:
X s = I s k M k J s
X s denotes the total demand for medical supplies for category k in area s;
I s k indicates the number of people in category k in area s who have a need for medical supplies;
M k denotes the average demand for medical supplies for category k;
J s denotes the coefficient of the epidemic risk level in area s;
k denotes the population affected by the outbreak, mainly including susceptible, latent, infected and recovered populations.

2.4. Consideration of the Urgency of the Demand for Internal and External Coupling

Irrational distribution of materials in the process of dispatching emergency supplies, such as in disaster areas where some are allocated too many materials and some receive insufficient materials, further aggravates the epidemic. This paper considers the differences in the affected points, that is, determining the degree of urgency of the needs of different regions to make a fair and reasonable distribution. The dispatching process of epidemic emergency supplies is carried out in both internal and external areas. Therefore, in defining the degree of urgency of the demand, this paper not only needs to consider the differences in the disaster situation of the affected points of the internal region of the epidemic, but also the degree of dispatching between the internal region of the epidemic and the external rescue points. This is the internal and external coupling degree. Ultimately, the degree of urgency of the demand is calculated.

2.4.1. Internal and External Dispatching Degree

(1)
Calculation of internal and external dispatching degree
Internal and external dispatching degree refers to the degree of dispatching between the external area that can be involved in rescue and the internal affected point of the epidemic. It mainly depends on the specific situation of the internal affected point and the dispatching ability of the external epidemic area. According to a survey, it is found that the higher the infection degree of the internal affected point of the epidemic area is, the higher the degree of demand for external rescue is. Meanwhile, the degree of shortage of materials of the internal affected point of the epidemic area also affects the degree of demand for external rescue. The distance from the external rescue point to the internal affected point determines the speed and efficiency of external rescue dispatching. So the degree of infection, the degree of material shortage, and the distance of external dispatching are selected to calculate the internal and external dispatching degree to determine the priority of external rescue dispatching.
σ = k n k m
ρ i o k = ρ 1 σ + ρ 2 γ + ρ 3 d i o k
ρ i o k denotes the extent to which external relief points dispatch internal disaster points;
σ denotes the degree of infection at affected sites within the infected area;
γ denotes the scarcity of supplies at the internal disaster site in the affected area;
d i o k denotes the distance between the external relief point and the internal disaster point;
ρ 1 , ρ 2 , ρ 3 denotes the weight of each factor;
kn denotes the number of infected people in point k;
km denotes the total number of people in affected point k;
ka denotes the demand for materials at affected point k;
kb denotes material available at disaster site k.
(2)
Application of internal and external dispatching degree
The internal and external coupling degree mainly helps external regions to make decisions on the amount of emergency relief material. For external regions, according to their internal and external coupling degree, the rescue priority is determined. And ultimately the infected areas are selected. The total number of external rescue materials is proportionally allocated according to the sorting priority of their rescue regions.

2.4.2. Demand Urgency Factors

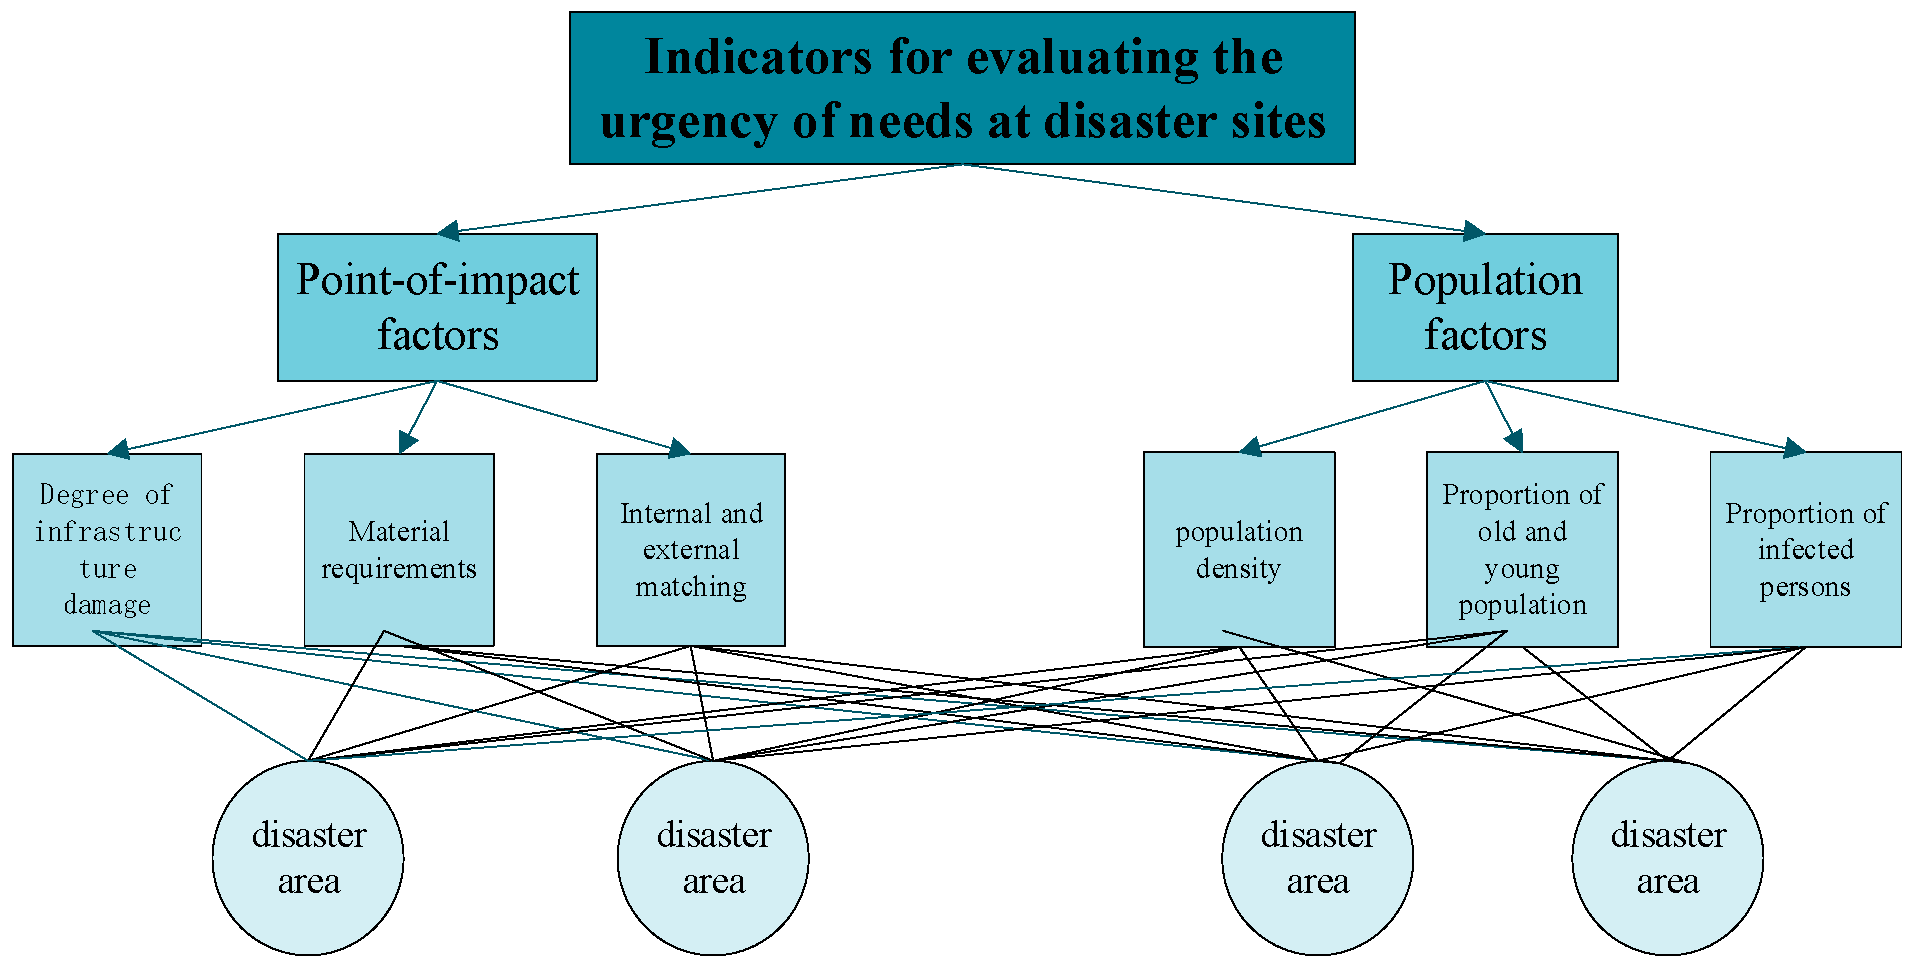
In this paper, the urgency degree of demand is taken into account in the distribution of supplies to ensure that the supplies at demand points with a higher degree of urgency of demand are met with higher priority. As shown in Figure 3, the degree of internal and external dispatching, regional population density, proportion of injured and stranded people, proportion of old and young people, demand for emergency supplies, and the degree of damage to infrastructure are selected as the evaluation indicators of the degree of urgency of the demand for emergency supplies at the disaster site.

2.4.3. Calculation of Demand Urgency

Considering the deviation brought about by the subjective weight assignment of the evaluation index experts, the TOPSIS entropy weight method is used to comprehensively evaluate and calculate the degree of urgency of the emergency material demand of each disaster site. Based on the results of the ranking of the degree of urgency of the demand of each disaster site, the risk level of each disaster site is divided.

2.5. Material Dispatching Model

This paper establishes an emergency material dispatching model with the goal of achieving minimum time and cost. At the same time, this paper considers the urgency of the demand and the internal and external coupling to prioritize and achieve reasonable dispatching.
Minimum total dispatching time is the first objective function f1:
min f 1 = min i ϵ I k ϵ K t i k x i k s k
where I is the set of distribution centers, I = { 1 , 2 , , i } , which are mainly divided into internal distribution centers in and external distribution centers io; K is the set of disaster points, K = { 1 , 2 , , k } ; t i k is the transport time from distribution center i to disaster point k; x i k indicates if there is a material sent from distribution center i to disaster point k; otherwise, it is 0.
Minimum total cost f2:
min f 2 = i ϵ I k ϵ K C 1 s k ( y k x i k ) + i ϵ I k ϵ k C 2 d i k a i k
where I is the set of distribution centers, I = { 1 , 2 , , i } , mainly divided into internal distribution centers in and external distribution centers io; K is the set of affected points, K = { 1 , 2 , , k } ; C 1 is the penalty cost per unit quantity of material; s k is the demand urgency score of demand point k; y k is the demand for material at demand point k; x i k is the determined material distribution volume of distribution center i delivering medical material to demand point k; C 2 is the transport cost per unit vehicle per unit distance; d i k is the shortest transport mileage of material delivered by distribution center i to demand point k; a i k is the total number of vehicles of distribution center i delivering material to demand point k.
f 3 = min w 1 f 1 + w 2 f 2
f3 denotes the sum of the minimum cost and the time of availability of the supplies, taking into account the epidemic level, and the sum of these two is minimal, with weights w1 and w2, respectively.
The transport time from distribution center i to disaster point k is
t i k = d i k / v i k
where d i k is the dispatch distance from distribution center i to disaster point k, km; v i k is its corresponding distribution speed, km/h.
Constraints:
(1)
The number of emergency supplies dispatched to disaster point k must not exceed their demand: i ϵ I q i k x i k Q k , k ϵ K ;
(2)
The total number of emergency supplies dispatched is not greater than the total supply: i ϵ I k ϵ K q i k x i k B i , where B i is the number of emergency supplies available at distribution center i;
(3)
Ensure that limited emergency supplies are fully distributed: i ϵ I B i = i ϵ I k ϵ K x i k q i k ;
(4)
A 0 to 1 decision variable indicates whether distribution center i dispatches to disaster point k or not: x i k = 0 , q i k = 0 1 , q i k > 0 , i ϵ I , k ϵ K ;
(5)
At least one distribution center i dispatches supplies to disaster point k: i ϵ I x i k 1 ;
(6)
A distribution center i dispatches supplies to at least one disaster point k: k ϵ K x i k 1 ;
(7)
Demand satisfaction at disaster point k is not less than 10 per cent, with demand satisfaction equal to supply divided by demand: h k 20 % , h k = x i k y i k ;
(8)
The range of values of each variable is q i k 0 , B i 0 , Q k 0 .

2.6. Comprehensive Satisfaction

Comprehensive satisfaction refers to the dispatch to the internal area of the epidemic based on the simultaneous consideration of the external rescue effect, including time satisfaction and cost satisfaction. It is mainly used to measure the gap between the desired and actual effect of the reasonableness of the emergency supply dispatching program.
v = m 1 λ 1 + m 2 λ 2
where λ 1 is time satisfaction; λ 2 is cost satisfaction; m 1 and m 2 , respectively, are the weight of time and cost satisfaction.
(1)
Time satisfaction:
λ 1 = i I k K s k ( t ¯ t i k )
t ¯ = d i k v ¯ + 0.5
The expected time t ¯ is the sum of transport time and dispatching time, where the dispatching time is 0.5 h; tik is the actual time; sk is the demand point k demand urgency score; dik is the shortest transport mileage of distribution center i delivering materials to demand point k; v ¯ is the ideal state of the vehicle driving speed, 65 km per hour.
(2)
Cost satisfaction:
λ 2 = i I k K ( c ¯ c i k )
c ¯ is the total expected cost of material dispatching, namely the sum of the expected cost of emergency material transport and the delayed penalty cost; dik is the shortest transport mileage of distribution center i delivering materials to demand point k; aik is the total number of vehicles of distribution center i delivering materials to demand point k; C4 is the ideal cost of transporting per unit of vehicle per unit of distance, which is set as 3 CNY/km; C3 is the ideal penalty cost of material per unit of quantity, which is 8 CNY/unit; sk is the demand urgency score of demand point k; yk is the demand for the material at demand point k; xik is the determined material distribution volume of medical supplies delivered by distribution center i to demand point k.

3. Numerical Experiments

In 2020, the COVID-19 epidemic broke out comprehensively in China, which brought great losses to people’s life and health and social and economic development. In order to verify the effectiveness of the model and algorithm, the case is analyzed in the context of Hubei Province, which was the hardest-hit area in the early stage of the epidemic. The case selects medical materials as emergency dispatch materials and a national emergency material reserve center as well as 10 provincial emergency material reserve centers as emergency material distribution centers. According to the official notification of the epidemic, 17 cities and municipalities in Hubei Province were selected as the points affected by the epidemic (i.e., the points in need of emergency supplies). The distances between the reserve center and the epidemic areas of the cities and municipalities are obtained through Baidu Maps. The stock levels of emergency supplies in the 11 distribution centers originate from the emergency supplies reserve warehouse datasets. By checking the statistical yearbooks of each city and the officially released data of the epidemic, the values of each evaluation index of the urgency of emergency material demand of the 17 disaster points are determined. According to the information of each disaster site, the TOPSIS entropy weight method is used to obtain the ranking urgency of the demand for emergency supplies and to classify the risk level in each disaster site. In reality, the disaster level of the disaster point can be changed accordingly based on the actual situation.

3.1. Prediction of the Number of Infected People

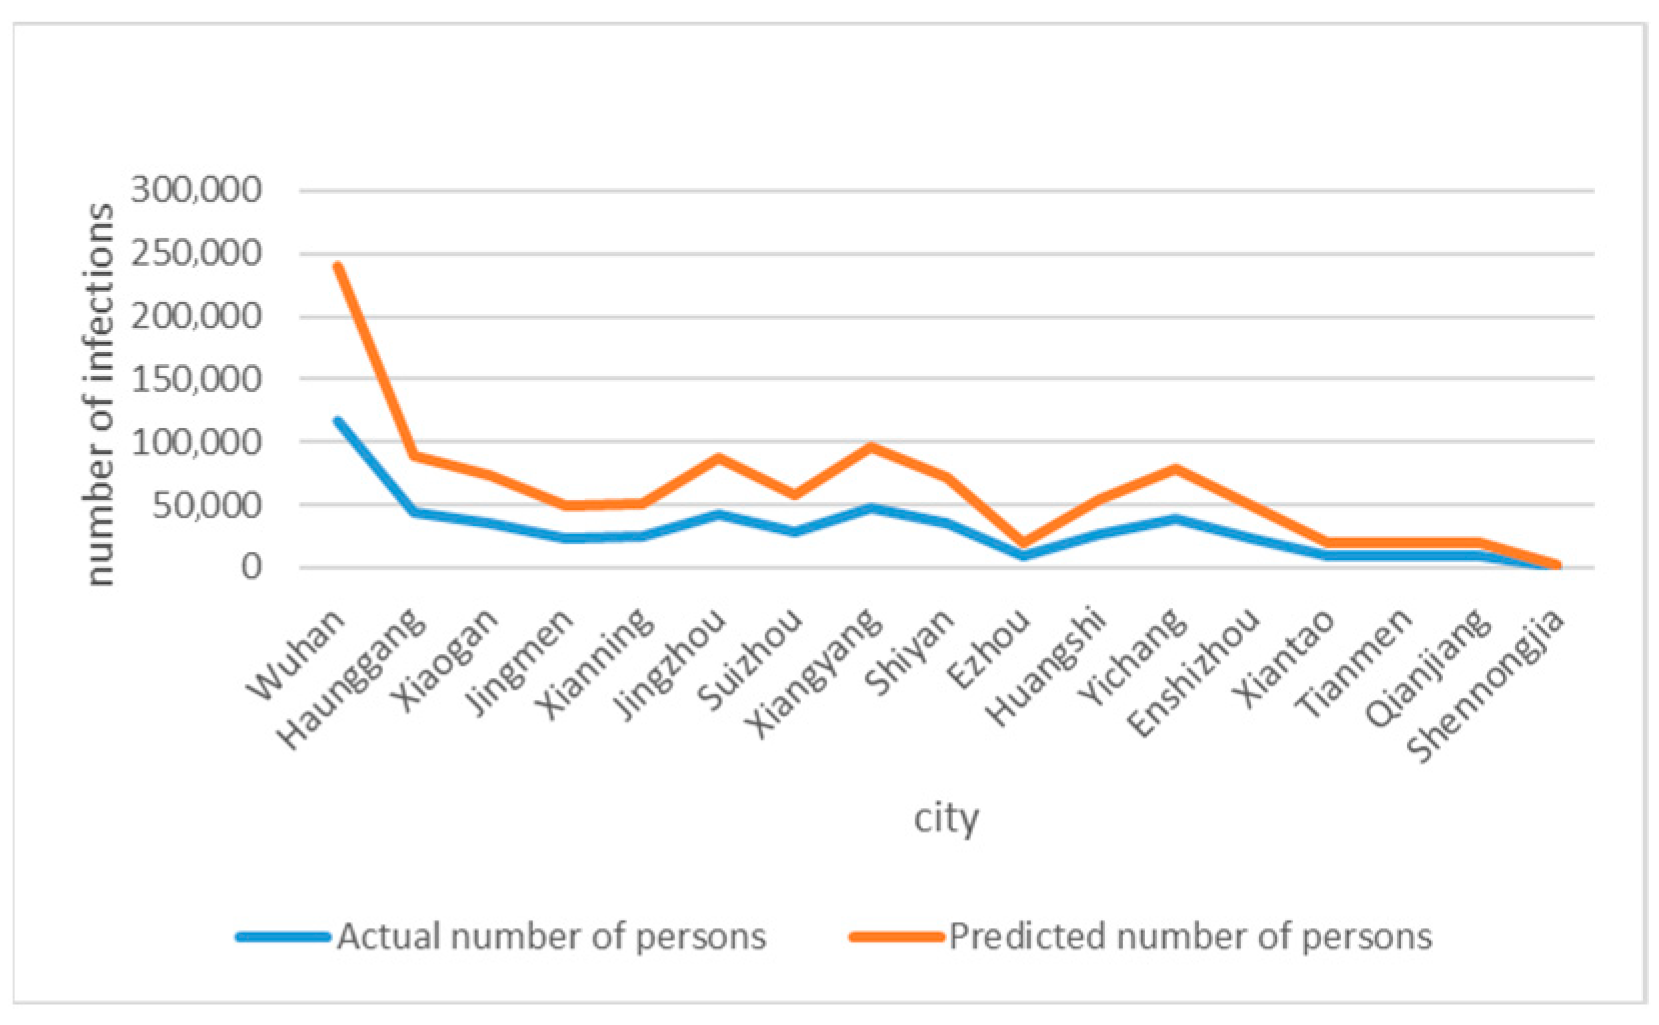
By using the SEIR model to predict the number of infected people in various cities in Hubei Province, we obtain the fitted prediction data of the epidemic (as shown in Table 1). By comparing this with the real-world data, we obtain the following Figure 4, which shows that the forecasting results are good.

3.2. Epidemic Medical Material Demand Prediction

Medicine required by infected people is used as the emergency medical demand material for this study. After predicting the infected population in various cities in Hubei Province and classifying the epidemic level, medicine is used as the materials required by infected people in units. The material demand coefficient is set according to the coefficient of epidemic level in Table 2 and the forecasting demand of infections in Table 3. The material demand coefficient of high-risk areas is 1.5. The material demand coefficient of medium-risk areas is 0.8. The material demand coefficient of low-risk areas is 0.5. Then the material demand of each affected point is calculated.

3.3. Measurement of the Urgency of Demand

By checking the statistical yearbooks of various cities and the official epidemic data released, the value of each evaluation index for the urgency of emergency material demand of 17 disaster sites is determined. According to the TOPSIS entropy weight method, we sort the results of the demand urgency for emergency supplies and divide the risk levels in each disaster area. In reality, the disaster level of the disaster point can be changed according to the actual situation. Beijing, Shanghai, Hangzhou and Shenzhen are selected as the external relief cities. And the internal and external dispatching degree is calculated based on three factors shown in Table 4: the number of people infected at the beginning of each infected area, the amount of material shortage, and the distance. The supply volume of external supply points refers to the average value of the city’s annual report on emergency material reserves in the past three years. It is revised proportionally according to the scale of its GDP to ensure that the dispatch capacity matches the economic strength.
According to the above internal and external dispatching degree evaluation index in Table 5, the number of infected persons, the amount of material scarcity, and the percentage of distance are assigned 0.5, 0.3, and 0.2, respectively. We calculate the degree of internal and external dispatching, and the results are as shown in Table 6.
According to the above evaluation index dataset, the TOPSIS entropy weight method is applied to grade the regional disaster situation. The final grading results are obtained as shown in Table 7.

3.4. Emergency Material Dispatching Model Solutions

Model assumptions: (1) The demand for emergency resources in each affected region is known; (2) the supply quantity of emergency resources at each supply point and each distribution center as well as the geographic location information are known; (3) each distribution center has enough vehicles of the same type for dispatching, and the road trip is consistent during delivery; (4) the effect of road capacity and the number of emergency resources on the speed of emergency transport vehicles is not considered; (5) loading and unloading times of emergency resources at the distribution centers are not considered.

3.5. Analysis of Emergency Material Dispatching Results

In order to verify the effectiveness of the model, this paper takes the COVID-19 outbreak in Hubei Province as the case background. We select four cities, Beijing, Shanghai, Hangzhou and Shenzhen, as the external rescue cities for external rescue dispatching. The demand for internal and external supply points is presented in Table 8 and Table 9 respectively. The material requirements for cities are shown in Table 10. According to the data from Baidu Maps, the distance of the infected areas from each city’s supply points is shown in Table 11.
According to the above case information, the genetic algorithm is used to solve the model in Matlab R2021a. The relevant parameters of the NSGA-II algorithm are as follows: population size = 100; the maximum number of iterations (maxgen) = 300; chromosome crossover rate = 0.8; mutation rate = 0.01; the objective function weights are set to w1 = 0.7 and w2 = 0.3. The vehicle drives at a uniform speed during the vehicle dispatch and the transport speed is 50 km/h. The material penalty cost is 10 CNY/unit and transport cost is 5 CNY/km. A vehicle can be loaded with 2000 units of goods.
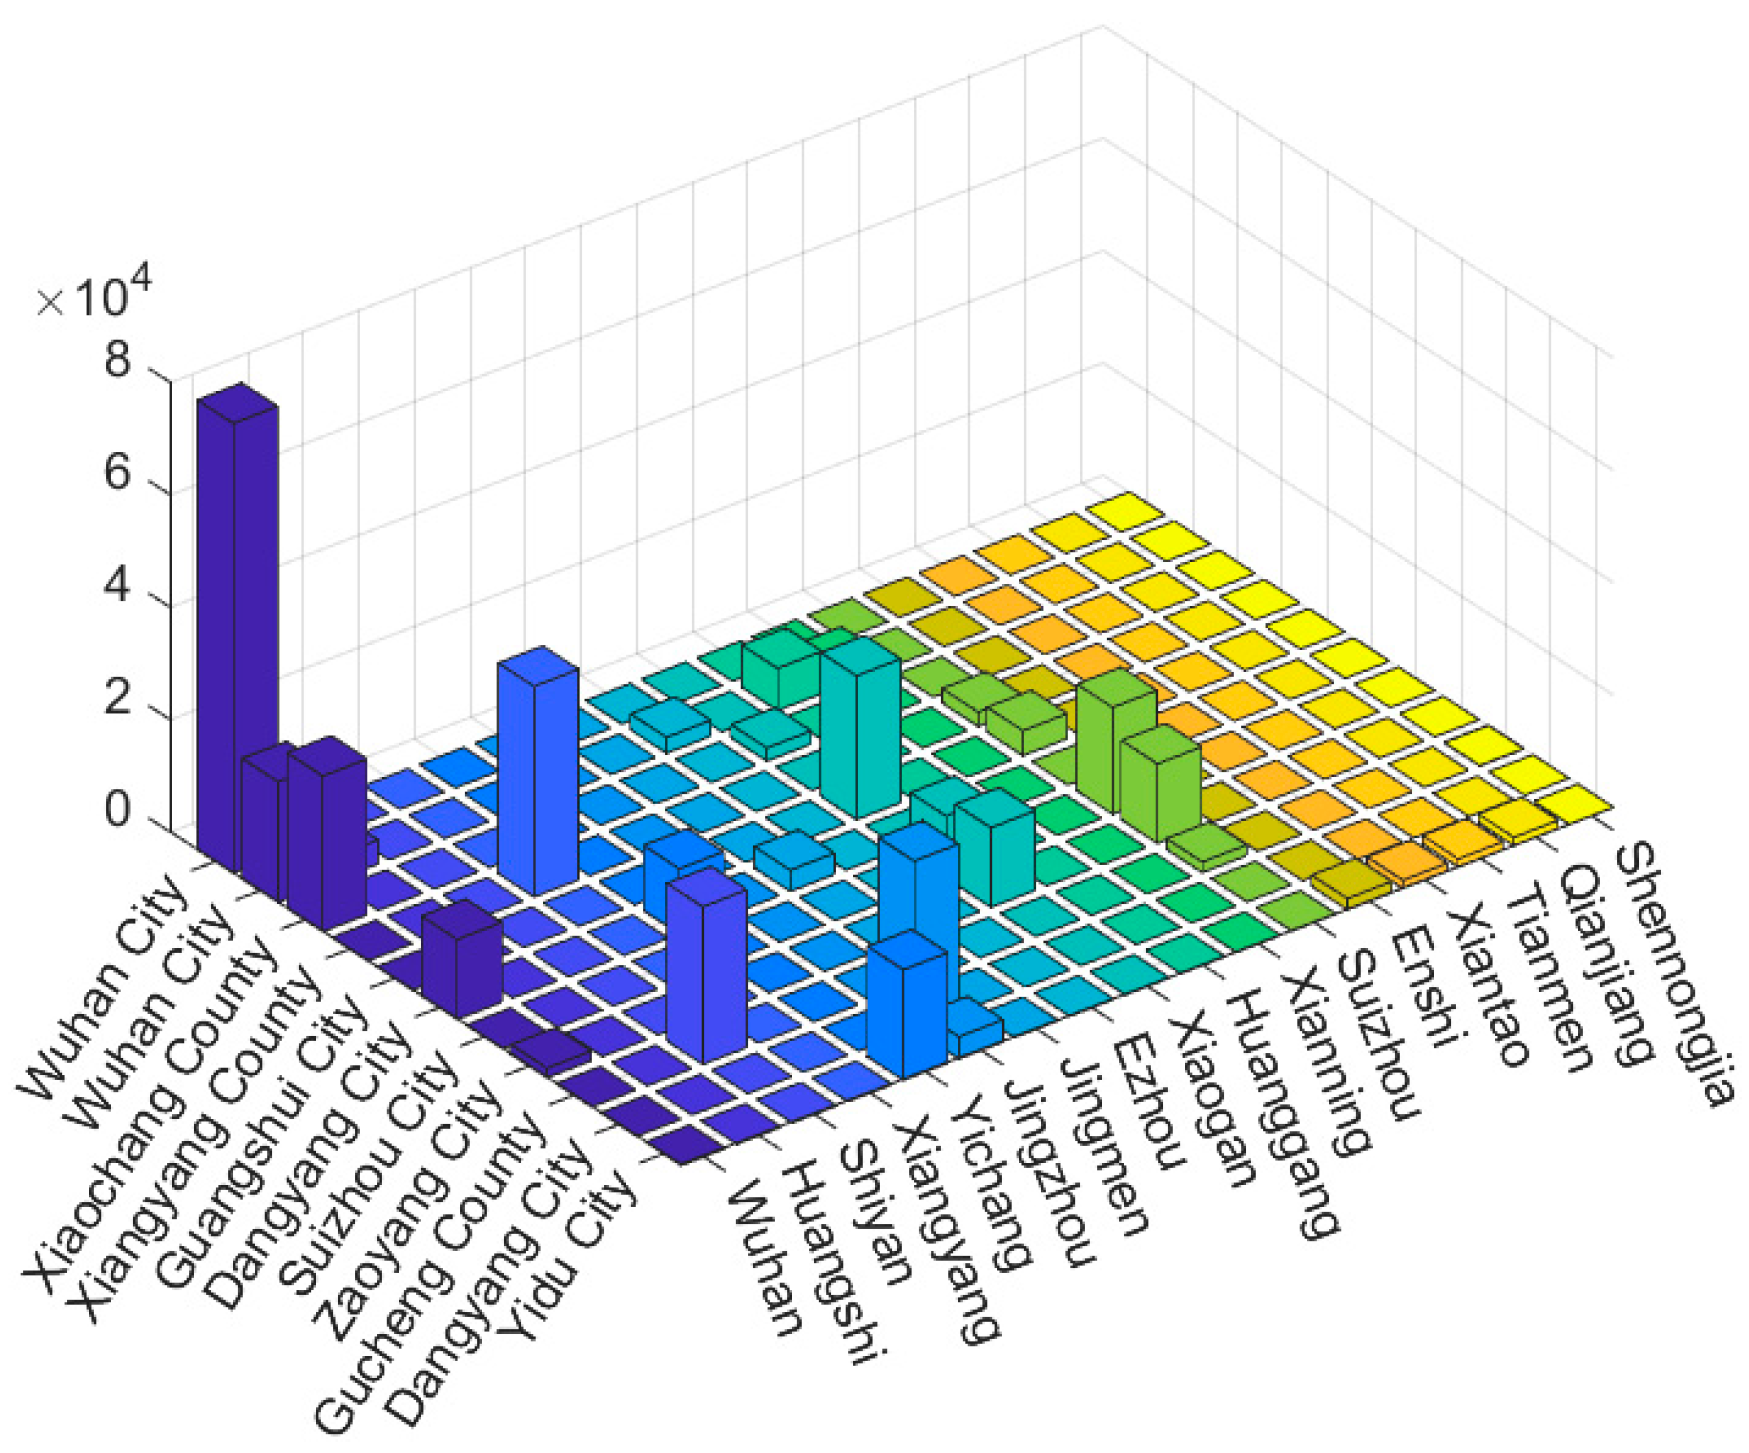
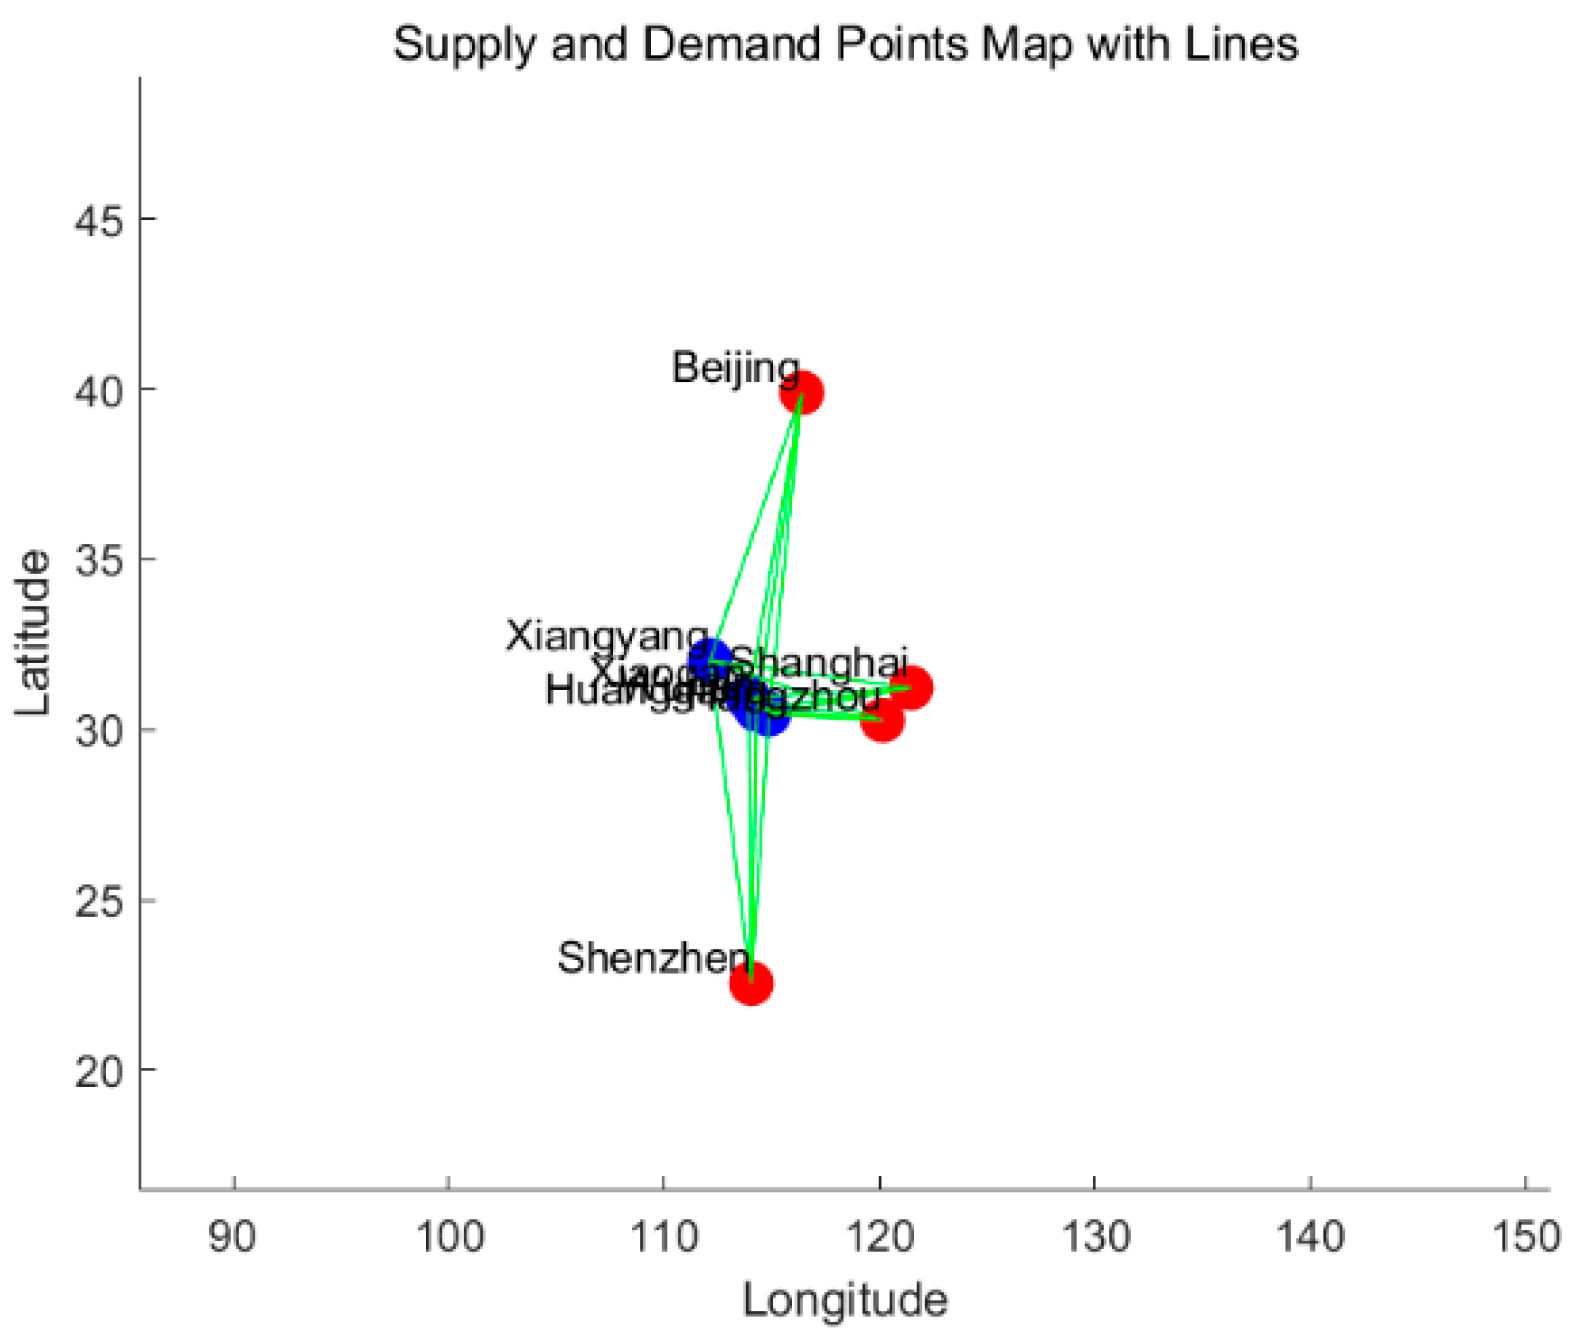
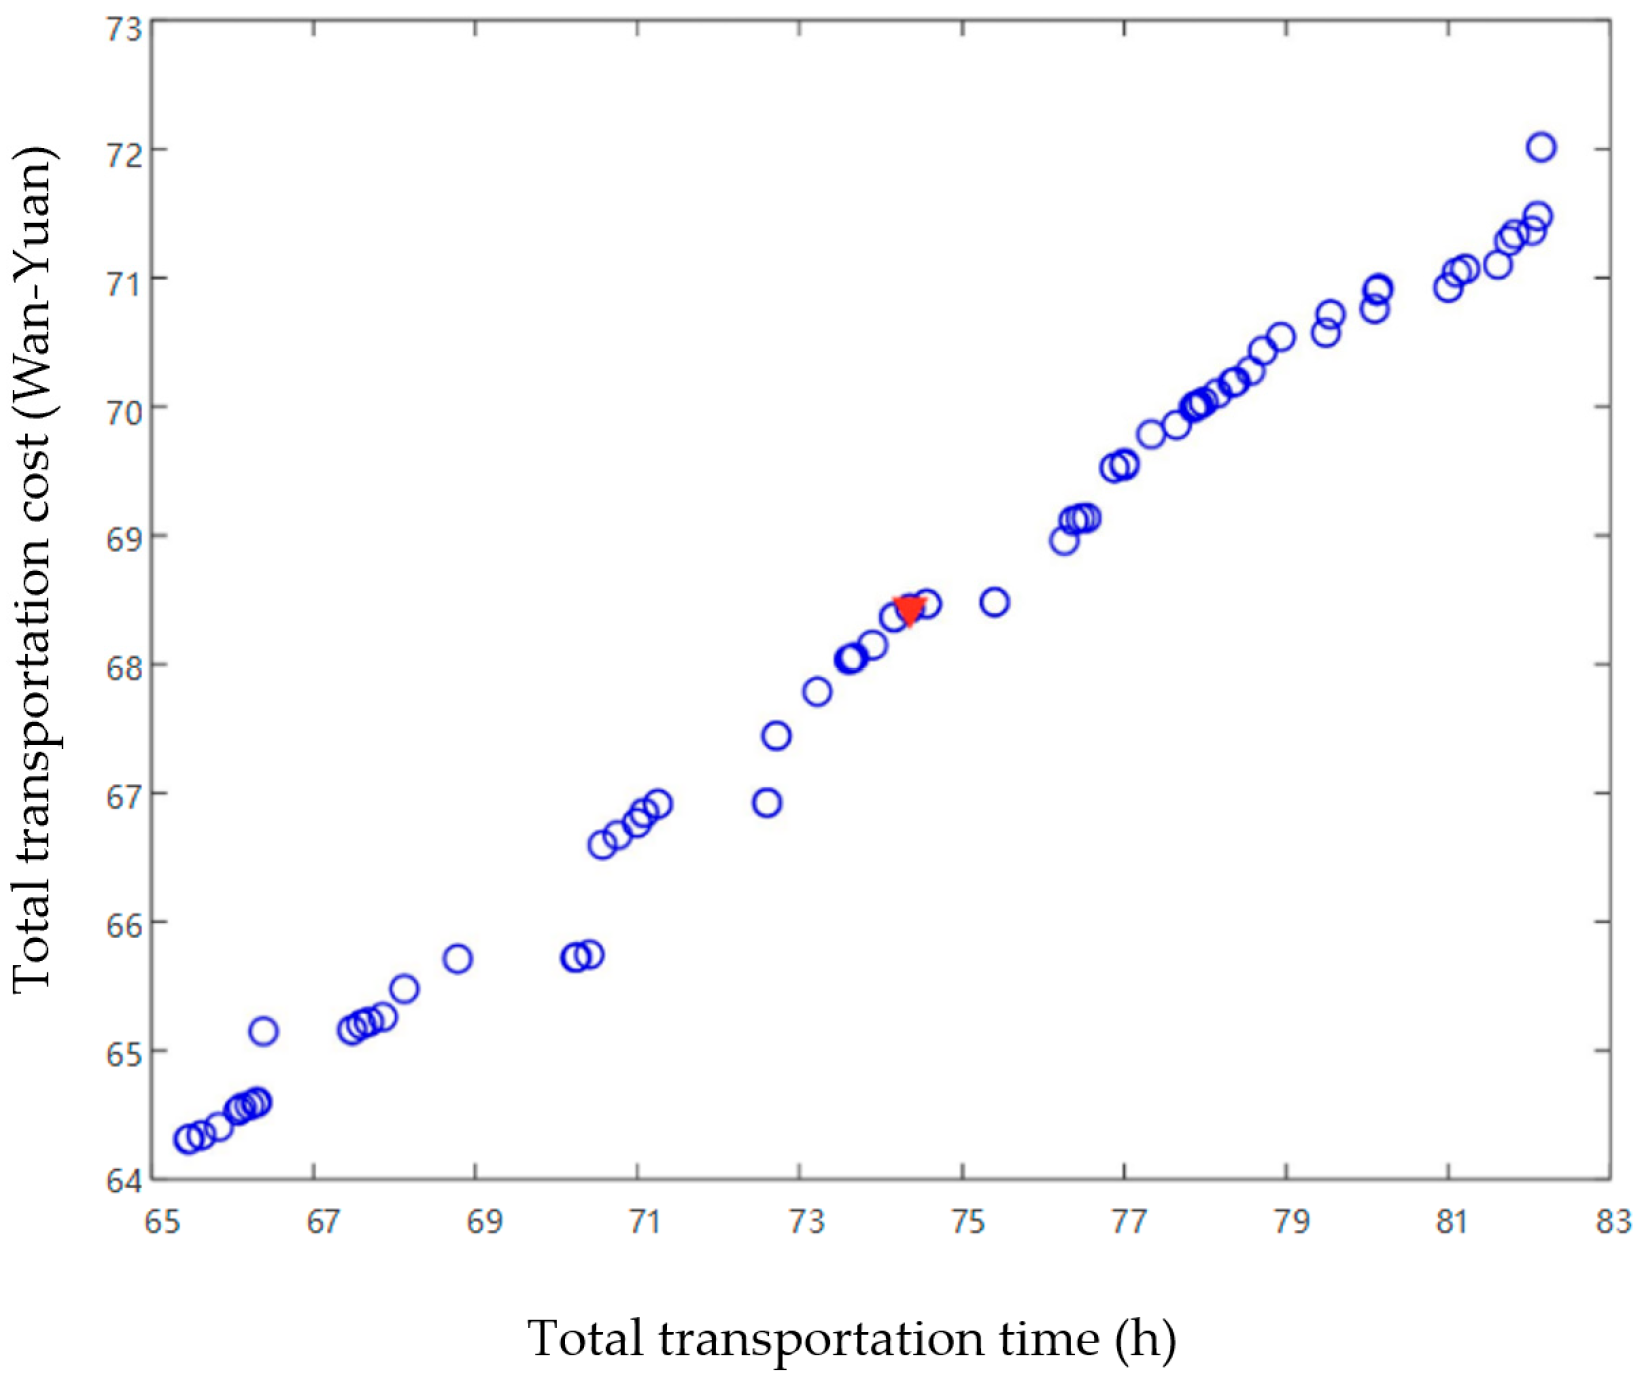
Through the calculation of this scenario to achieve the emergency supply dispatching program, the objective functions are as follows: f1 is 74.2 h; f2 = CNY 385,743.9. The internal dispatching program is shown in Table 12 and in Figure 5. The external dispatching program is displayed in Figure 6. Based on actual logistics and vehicle deployment statistics from Hubei Province’s pandemic response, the daily vehicle utilization rate is 85–92%, and in accordance with the “COVID-19 Emergency Logistics Vehicle Allocation Guidelines” issued by China’s Ministry of Transport, our model incorporates specific operational metrics: an average vehicle capacity of 8–12 t, daily operating ranges of 200–300 km, and typical fleet sizes of 15–30 homogeneous vehicles per distribution center. All of these values reflect the real-world emergency logistics operations during the crisis.
As can be seen from Table 13, the number of medical supplies obtained by disaster sites at all levels is more or less in line with the differences in risk ratings at the disaster level. As an example, Wuhan experienced the most serious disaster, with a risk rating of 1, and therefore received five supply points for the dispatch of supplies and the largest number of supplies. This reflects the characteristics of the hierarchy of the dispatch of emergency supplies and is in line with the needs of actual emergency relief work.
The same is shown in Table 14 for external rescue. Focusing on selecting the four affected cities with the highest degree of external dispatching for external rescue dispatching reflects the priority and focus of external rescue dispatching. Wuhan has the highest degree of external dispatching and the most serious disaster situation, and thus receives the most external rescue supplies; Xiaogan has a lower degree of external dispatching and a more serious disaster situation, and receives relatively fewer external rescue supplies. In addition, as can be seen in the epidemic internal emergency supply dispatching plan, Wuhan supply center (2) and Dangyang City supply center (1) undertook the task of dispatching supplies for five and four demand points, respectively, assuming important roles in this emergency supply dispatching process. It can provide a reference for the subsequent dispatching of supplies, personnel, vehicles and other reserve configurations from distribution centers.
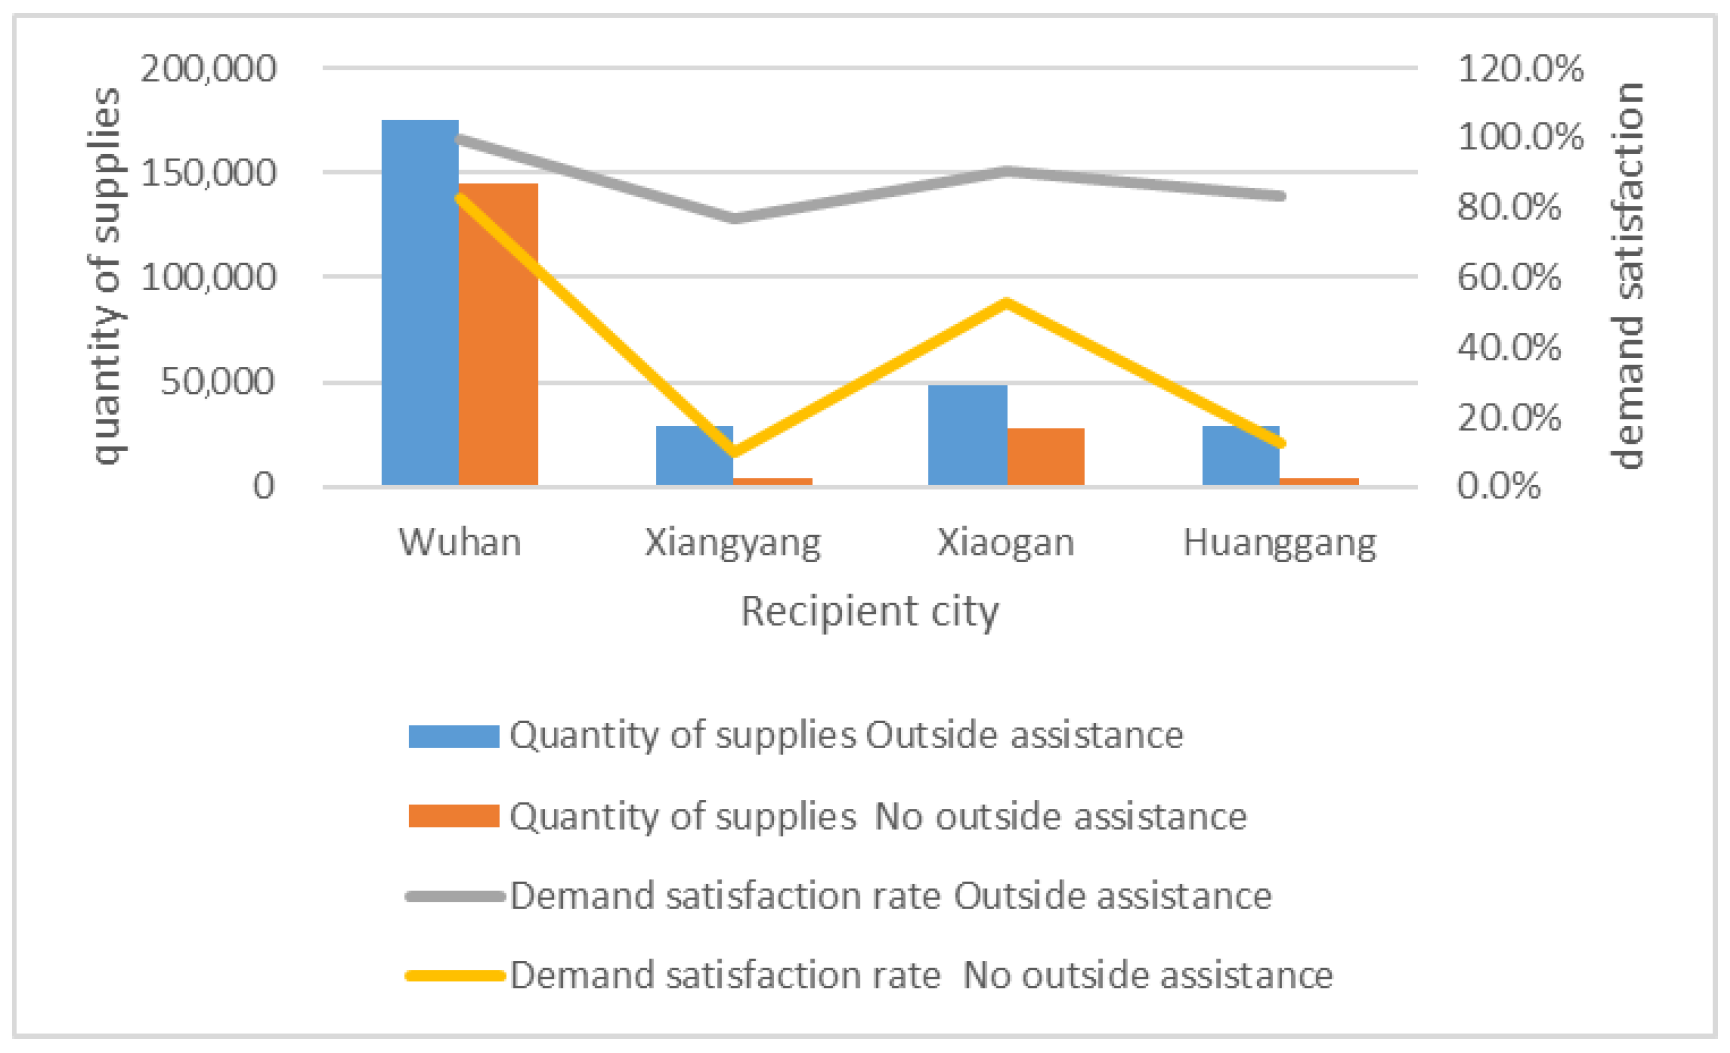
In order to verify the effectiveness of the model, this paper compares the difference in emergency material dispatching effect with and without considering external rescue (Table 14) and draws a comparison between the quantity of materials and demand satisfaction before and after obtaining external rescue (Figure 7). It shows that the material demand satisfaction of the cities at the affected points rises significantly after considering external rescue, which makes up for the shortcomings of the internal emergency material dispatching. It reflects the scientific rationality of including external rescue.
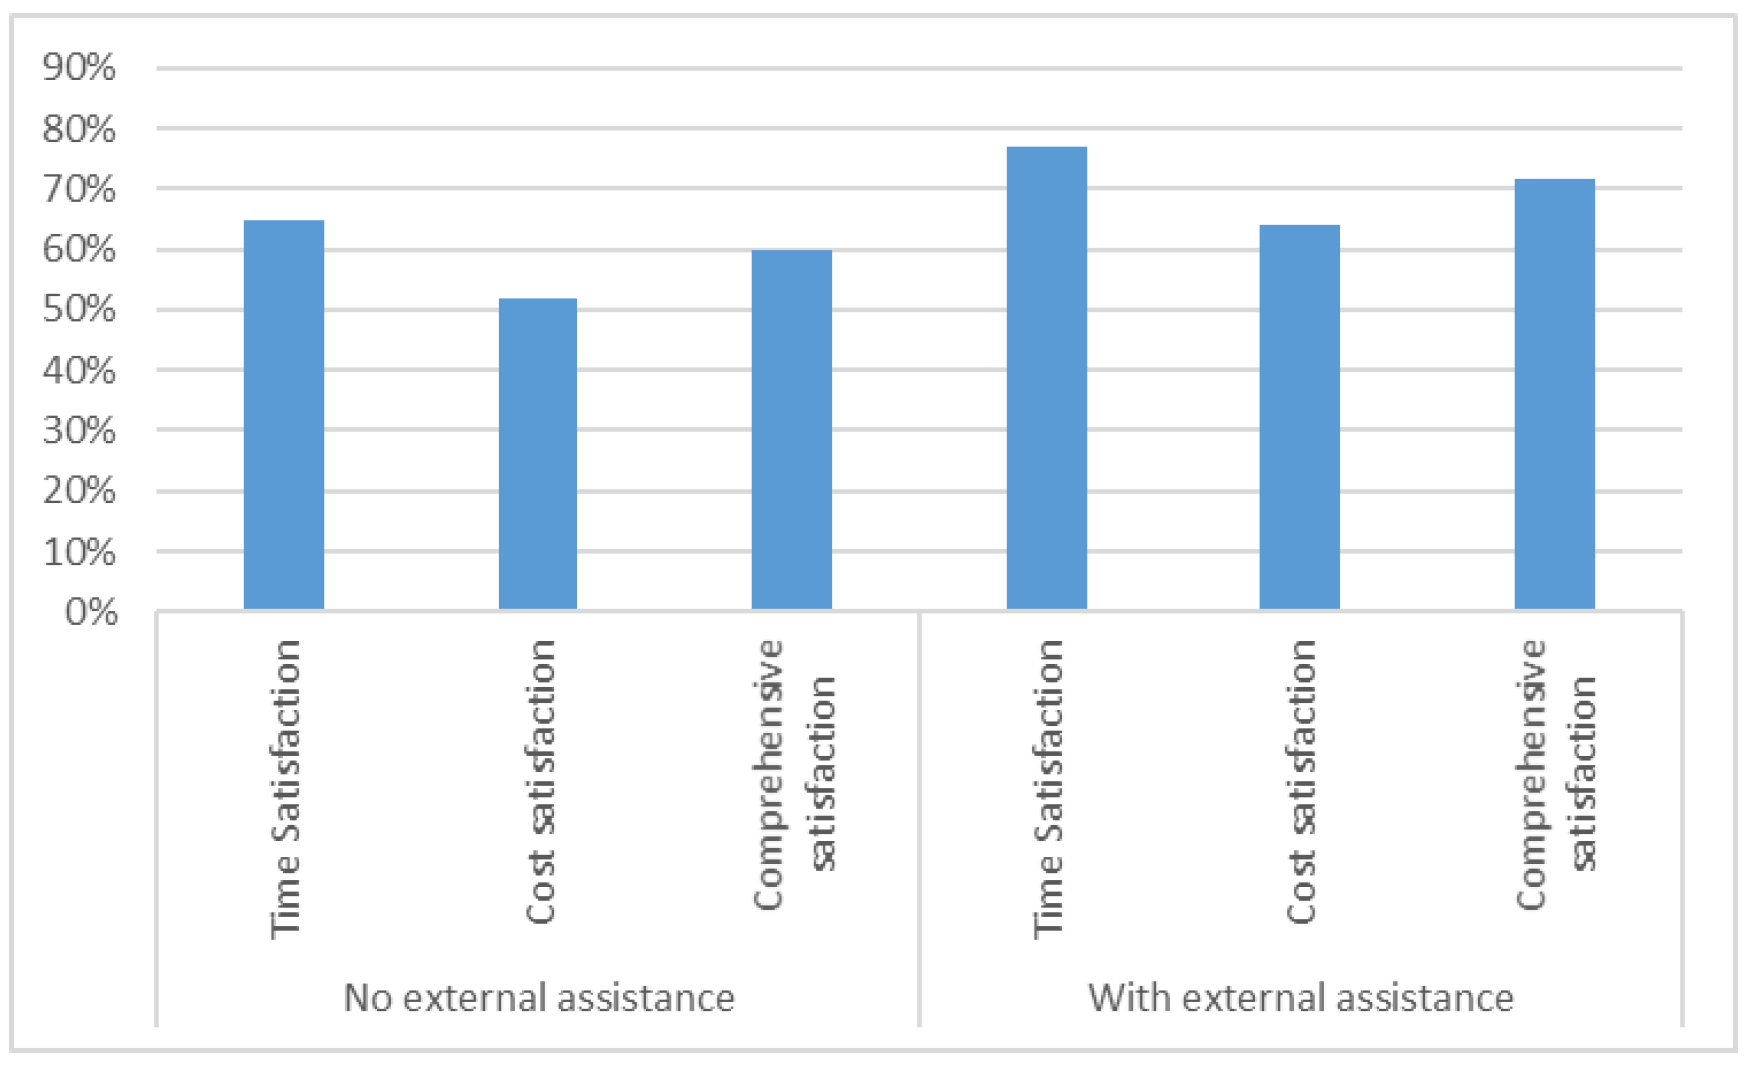
In this paper, we also set a comprehensive satisfaction function to verify the difference in comprehensive satisfaction with and without external rescue in Figure 8. It can be seen that since external rescue increases the time and cost of rescue, both time satisfaction and cost satisfaction increase. It also leads to an increase in comprehensive satisfaction, which is in line with the actual situation of emergency material dispatch and rescue.
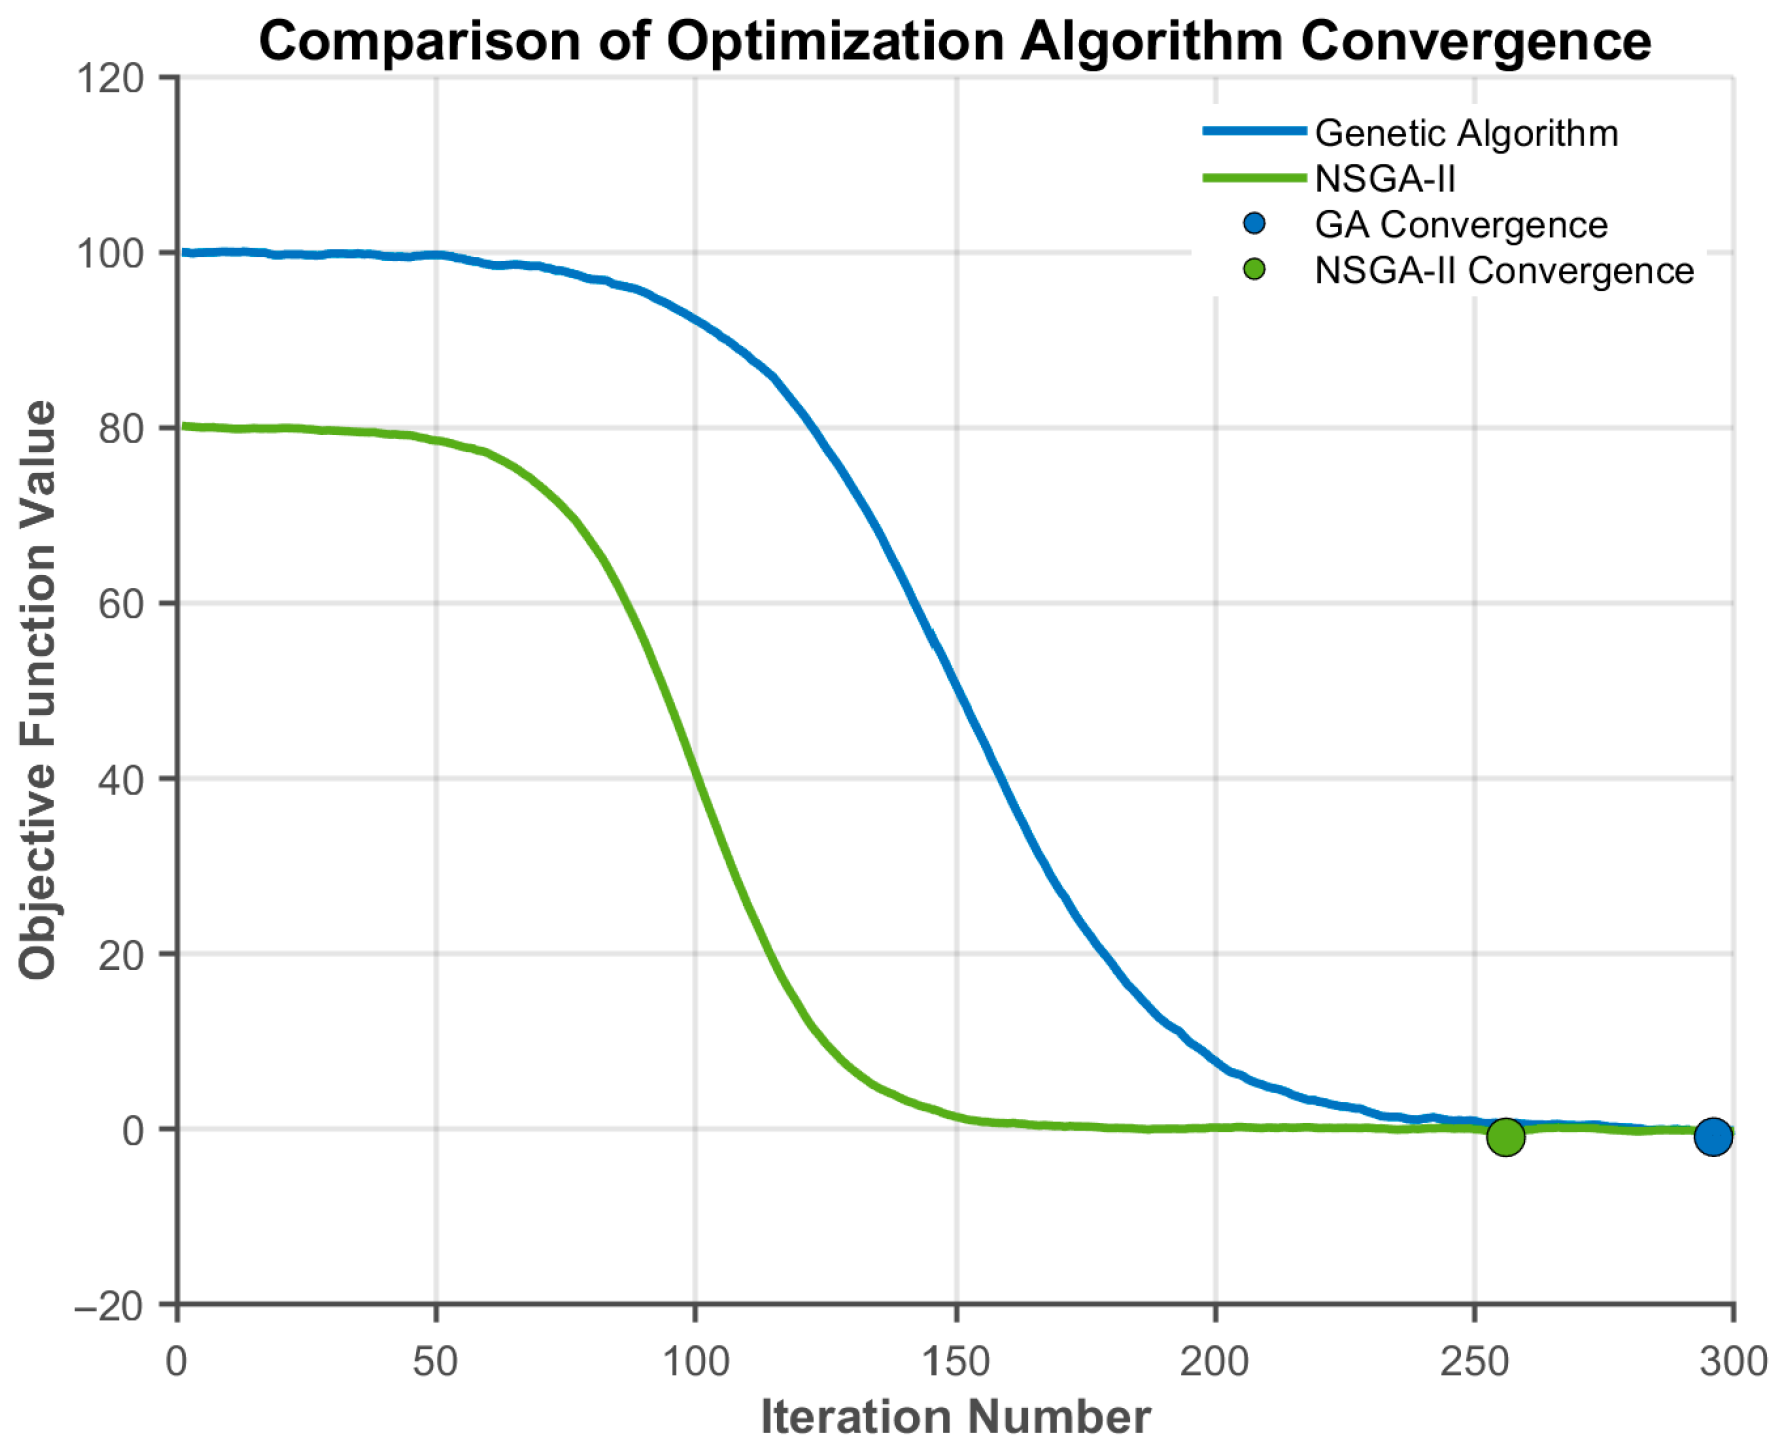
In order to verify the effectiveness of the algorithm, the two objectives of this paper are transformed into a single objective, solved by the GA algorithm, and then compared with NSGA-II. The parameters of the GA algorithm and the data settings of the algorithm are kept the same as those of NSGA-II, and the iterative curves of the two algorithms are obtained. The iterative curves of the GA and NSGA-II algorithms are shown in Figure 9 and Figure 10. It is seen that the NSGA-II algorithm is better than the GA algorithm.

4. Conclusions and Discussion

This paper addresses the characteristics of emergency material dispatch in response to sudden public health incidents such as epidemics. It proposed an internally and externally coupled emergency material dispatching model that simultaneously conducts internal dispatch and external rescue when the affected areas face overall material shortages. The results indicate the following:
(1)
When dispatching materials during public health incidents like epidemics, subdividing the infected population and predicting the number of infections using the SEIR model allows for a more scientific prediction of material needs, thereby more effectively responding to the actual epidemic material dispatch.
(2)
Introducing external rescue when there is a shortage of materials within the affected area can significantly improve the satisfaction of demand in the affected area and enhance the effectiveness of the rescue efforts.
(3)
By calculating the internal and external matching degree, it is possible to clarify the matching degree between the affected area and the external rescue points, improving the specificity of the rescue while reducing rescue costs.
From this study on the internally and externally coupled material dispatch during epidemic events, it is evident that coupling internal and external dispatch during disasters can effectively improve the effectiveness and level of rescue operations. Relying solely on internal material dispatch within the affected area cannot effectively meet the demand in a timely manner, nor is it realistic. In fact, external rescue is commonly present and effective in actual emergency dispatch events. Therefore, considering coupled internal and external material dispatch would be a key focus of future research.
This paper introduces the perspective of external rescue for epidemic internal and external coupled dispatch, but it has some limitations: the selection of external rescue cities is relatively subjective, lacking a scientific and reasonable method, making it difficult to choose the most suitable external rescue city for different affected points; the external rescue process is relatively simple and idealized, lacking consideration of possible issues during the rescue process. Therefore, a future study will attempt to construct a scientific method for selecting external rescue cities, subdivide the external rescue process, investigate possible issues, and propose corresponding strategies.

Author Contributions

Conceptualization, J.Y.; Data curation, X.Y. (Xiaofei Ye) and R.C.; Formal analysis, J.Y. and X.Y. (Xingchen Yan); Funding acquisition, X.Y. (Xiaofei Ye), X.Y. (Xingchen Yan), T.W., P.Z. and J.C.; Investigation, J.Y. and R.C.; Investigation, Methodology, S.P.; Writing—original draft, J.Y. and X.Y. (Xiaofei Ye); Writing—review and editing, X.Y. (Xiaofei Ye), X.Y. (Xingchen Yan), T.W. and J.C. All authors have read and agreed to the published version of the manuscript.

Funding

This research was funded by the Natural Science Foundation of Zhejiang Province, China (No. MS25E080023), the Natural Science Foundation of Ningbo City, China (No. 2024J130), the Fundamental Research Funds for the Provincial Universities of Zhejiang (No. SJLY2023009), the National “111” Center on Safety and Intelligent Operation of Sea Bridge (D21013), National Natural Science Foundation of China (Nos. 71971059, 52262047, 52302388, 52272334, and 61963011), the Natural Science Foundation of Jiangsu Province, China (No. BK20230853), the Specific Research Project of Guangxi for Research Bases and Talents (No. AD20159035), in part by the Guilin Key R&D Program [No. 20210214-1], and the Liuzhou Key R&D Program (No. 2022AAA0103).

Conflicts of Interest

The authors declare no conflicts of interest.

References

  1. Ropke, S.; Pisinger, D. An Adaptive Large Neighborhood Search Heuristic for the Pickup and Delivery Problem with Time Windows. Transp. Sci. 2006, 40, 455–472. [Google Scholar] [CrossRef]
  2. Dasaklis, T.K.; Rachaniotis, N.P.; Pappis, C.P. Emergency supply chain management for controlling a smallpox outbreak: The case for regional mass vaccination. Int. J. Syst. Sci. Oper. Logist. 2017, 4, 27–40. [Google Scholar] [CrossRef]
  3. Chen, H.; Guo, Y.; Lin, X.; Qi, X. Study on regional differences and causes of emergency logistics responsiveness under the impact of public emergencies—Findings from Chinese samples. Front. Public Health 2024, 12, 1508467. [Google Scholar] [CrossRef] [PubMed]
  4. Yin, Z.; Yin, Z.; Ye, J.; Liu, R. Optimization of emergency logistics delivery path based on guided local search algorithm. J. Comput. Methods Sci. Eng. 2024, 24, 1889–1902. [Google Scholar] [CrossRef]
  5. Tan, K.; Liu, W.; Xu, F.; Li, C. Optimization model and algorithm of logistics vehicle routing problem under major emergency. Mathematics 2023, 11, 1274. [Google Scholar] [CrossRef]
  6. Wu, J.; Wang, X.Y.; Tian, A.Q.; Du, Z.G.; Yang, Z.J. A hybrid meta-heuristic approach for emergency logistics distribution under uncertain demand. IEEE Access 2024, 12, 135701–135729. [Google Scholar] [CrossRef]
  7. Wang, Y.; Chen, X.; Wang, L. Deep reinforcement learning-based rescue resource distribution scheduling of storm surge inundation emergency logistics. IEEE Trans. Ind. Inform. 2023, 19, 10004–10013. [Google Scholar] [CrossRef]
  8. Fan, J.; Chang, X.; Mišić, J.; Mišić, V.B.; Kang, H. DHL: Deep reinforcement learning-based approach for emergency supply distribution in humanitarian logistics. Peer—Peer Netw. Appl. 2022, 15, 2376–2389. [Google Scholar] [CrossRef]
  9. Sun, H.; Cai, Q. Emergency logistics siting-path question for engineering construction projects based on quantum particle swarm algorithm. J. Comput. Methods Sci. Eng. 2024, 24, 1993–2005. [Google Scholar] [CrossRef]
  10. Yan, T.; Lu, F.; Wang, S.; Wang, L.; Bi, H. A hybrid metaheuristic algorithm for the multi-objective location-routing problem in the early post-disaster stage. J. Ind. Manag. Optim. 2023, 19, 4663–4691. [Google Scholar] [CrossRef]
  11. Ge, J.; Li, X.; Wu, Z.; Sun, Y.; Kanrak, M. The distribution of emergency logistics centers under the covid-19 lockdown: The case of yangtze river delta area. Sustainability 2022, 14, 10594. [Google Scholar] [CrossRef]
  12. Eshghi, A.; Tavakkoli-Moghaddam, R.; Ebrahimnejad, S.; Ghezavati, V. Multi-objective robust mathematical modeling of emergency relief in disaster under uncertainty. Sci. Iran. 2022, 29, 2670–2695. [Google Scholar] [CrossRef]
  13. Li, T. Emergency logistics resource scheduling algorithm in cloud computing environment. Phys. Commun. 2024, 64, 102340. [Google Scholar] [CrossRef]
  14. Lei, Y.; Zhang, G.; Lu, S.; Qian, J. Revealing the generation mechanism of cross-regional emergency cooperation during accidents and disasters rescue. Saf. Sci. 2023, 163, 106140. [Google Scholar] [CrossRef]
  15. Zhu, J.; Shi, Y.; Venkatesh, V.G.; Islam, S.; Hou, Z.; Arisian, S. Dynamic collaborative optimization for disaster relief supply chains under information ambiguity. Ann. Oper. Res. 2024, 335, 1303–1329. [Google Scholar] [CrossRef]
  16. Ding, Z.; Xu, X.; Jiang, S.; Yan, J.; Han, Y. Emergency logistics scheduling with multiple supply-demand points based on grey interval. J. Saf. Sci. Resil. 2022, 3, 179–188. [Google Scholar] [CrossRef]
  17. Guo, J.; Liu, H.; Liu, T.; Song, G.; Guo, B. The multi-objective shortest path problem with multimodal transportation for emergency logistics. Mathematics 2024, 12, 2615. [Google Scholar] [CrossRef]
  18. Xu, Z.; Zheng, C.; Zheng, S.; Ma, G.; Chen, Z. Multimodal transportation route optimization of emergency supplies under uncertain conditions. Sustainability 2024, 16, 10905. [Google Scholar] [CrossRef]
  19. Ye, J.; Jiang, W.; Yang, X.; Hong, B. Emergency materials response framework for petrochemical enterprises based on multi-objective optimization. Energy 2023, 269, 126670. [Google Scholar] [CrossRef]
  20. Hu, Y.; Liu, Q.; Li, S.; Wu, W. Robust emergency logistics network design for pandemic emergencies under demand uncertainty. Transp. Res. Part E 2025, 196, 103957. [Google Scholar] [CrossRef]
  21. Wang, F.; Ge, X.; Li, Y.; Zheng, J.; Zheng, W. Optimising the distribution of multi-cycle emergency supplies after a disaster. Sustainability 2023, 15, 902. [Google Scholar] [CrossRef]
  22. Liu, J.; Dong, C. Understanding the complex adaptive characteristics of cross-regional emergency collaboration in China: A stochastic evolutionary game approach. Fractal Fract. 2024, 8, 98. [Google Scholar] [CrossRef]
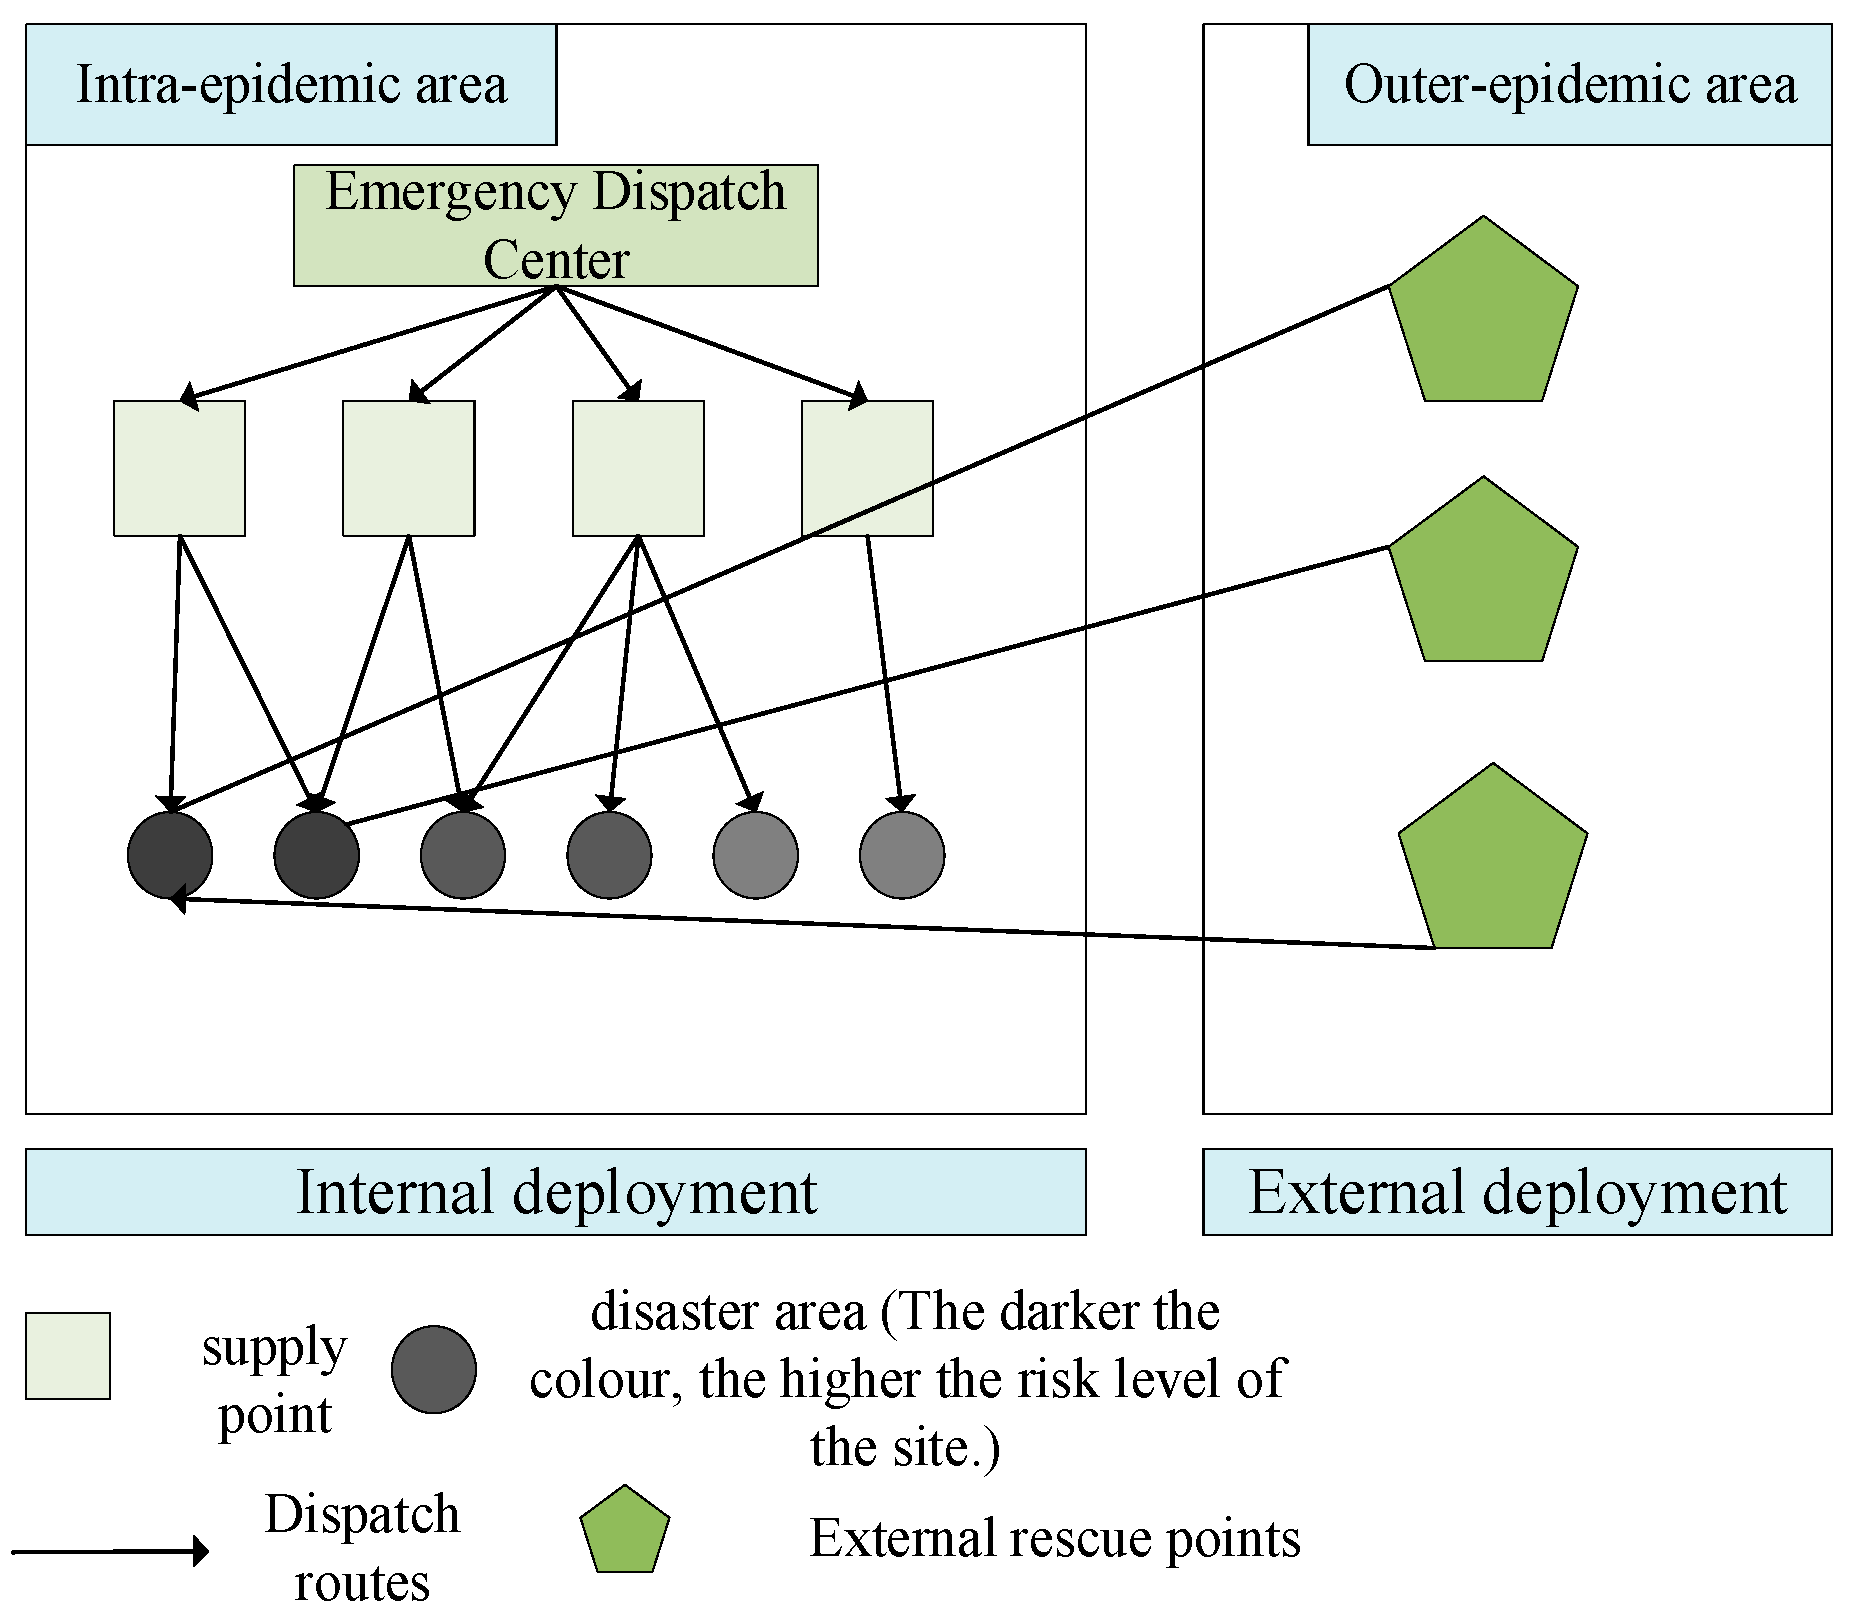
Figure 1. Emergency material dispatch network.
Systems 13 00714 g001
Figure 2. SEIR model silo flow diagram.
Systems 13 00714 g002
Figure 3. Indicators for evaluating the urgency of disaster sites.
Systems 13 00714 g003
Figure 4. SEIR model predictions versus true values.
Systems 13 00714 g004
Figure 5. Dispatch program for internal emergency supplies in an epidemic situation.
Systems 13 00714 g005
Figure 6. Outbreak external emergency material dispatch program.
Systems 13 00714 g006
Figure 7. Changes in quantity of goods and satisfaction of needs before and after receiving external assistance.
Systems 13 00714 g007
Figure 8. Comparison of overall satisfaction with and without external assistance.
Systems 13 00714 g008
Figure 9. Pareto solution set.
Systems 13 00714 g009
Figure 10. GA algorithm iteration diagram.
Systems 13 00714 g010
Table 1. Prediction of the number of infected persons in various municipalities in Hubei Province.
CityNumber of Infections
Wuhan117,100
Huanggang43,919
Xiaogan35,384
Jingmen23,714
Xianning24,560
Jingzhou42,422
Suizhou27,997
Xiangyang46,804
Shiyan35,038
Ezhou9429
Huangshi26,806
Yichang39,069
Enshi23,800
Xiantao9062
Tianmen9190
Qianjiang9392
Shennongjia799
Table 2. Classification of outbreak levels in Hubei Province on 27 February.
CityEpidemic Level
WuhanHigh-risk
HuanggangHigh-risk
XiaoganHigh-risk
JingmenHigh-risk
Xianning Medium-risk
JingzhouMedium-risk
SuizhouMedium-risk
XiangyangMedium-risk
ShiyanMedium-risk
EzhouMedium-risk
HuangshiMedium-risk
YichangMedium-risk
EnshiMedium-risk
XiantaoMedium-risk
TianmenMedium-risk
QianjiangLow-risk
ShennongjiaLow-risk
Table 3. Forecasting of demand for medical supplies by city in Hubei Province on 27 February.
CityNumber of Infections
Wuhan175,650
Huanggang35,135.2
Xiaogan53,076
Jingmen18,971.2
Xianning 19,648
Jingzhou33,937.6
Suizhou41,995.5
Xiangyang37,443
Shiyan28,030
Ezhou14,143
Huangshi21,444
Yichang31,255
Enshi11,900
Xiantao7249
Tianmen7352
Qianjiang7513
Shennongjia399
Table 4. Evaluation indicators for internal and external dispatching.
Disaster AreaNumber of Infected PersonsMaterial ShortagesDistance
BeijingShanghaiHangzhouShenzhen
Wuhan117,10052,69511498017221092
Huangshi26,806587211817566821001
Shiyan35,03876071158117611431448
Xiangyang46,80410,6321058107610001277
Yichang39,06984601294110810561149
Jingzhou42,4229974125110169591072
Jingmen23,7142975117910129381160
Ezhou9429124811507736781014
Xiaogan35,38415,28511278347621102
Huanggang43,91910,40011437436691028
Xianning24,56040651252832727994
Suizhou27,99712,55910539118571196
Enshi23,80033801514131712671326
Xiantao9062212338978341060
Tianmen9190411809138391059
Qianjiang9392412249518941047
Shennongjia79901227119711341339
Table 5. The degree of internal and external dispatching.
Disaster AreaDegree
Wuhan1.0000
Huangshi0.1989
Shiyan0.2625
Xiangyang0.3541
Yichang0.2931
Jingzhou0.3217
Jingmen0.1667
Ezhou0.0626
Xiaogan0.2953
Huanggang0.3331
Xianning0.1765
Suizhou0.2344
Enshi0.1697
Xiantao0.0553
Tianmen0.0562
Qianjiang0.0576
Shennongjia0
Table 6. Indicators for evaluating the urgency of needs.
Disaster AreaNumberEvaluation Indicators
Population Density (person/km2)Infected Person/%Ratio of Old to Young/%Emergency Material Requirements/SetDegree of Infrastructure DamageInternal and External Dispatch
WuhanY11308.4446.005231.41175,65001.0000
HuangshiY7540.132.988334.2821,444.800.1989
ShiyanY12143.582.290431.2728,030.400.2625
XiangyangY4287.924.902934.1737,443.200.3541
YichangY9194.913.507233.3831,255.200.2931
JingzhouY5391.104.464532.6933,937.600.3217
JingmenY10233.593.086729.0718,971.200.1667
EzhouY8663.972.737833.6314,143.500.0626
XiaoganY2552.678.213334.1153,07600.2953
HuanggangY3362.7811.147934.3135,135.200.3331
XianningY11261.322.648336.3619,64800.1765
SuizhouY6231.024.097732.6041,995.500.2344
EnshiY16140.600.993136.7911,90000.1697
XiantaoY13449.211.512032.827249.600.0553
TianmenY14475.741.028932.58735200.0562
QianjiangY15482.090.313127.957513.600.0576
ShennongjiaY1723.390.062635.94399.500
Table 7. Disaster risk levels in affected areas.
Disaster AreaNumberScoreDisaster Risk Value Ranking ResultsDisaster Risk Level
WuhanY11001Class Ⅰ
HuangshiY711.79557Class II
ShiyanY128.679112Class II
XiangyangY414.87974Class II
YichangY911.23029Class II
JingzhouY514.58585Class II
JingmenY108.872310Class II
EzhouY811.25428Class II
XiaoganY224.07612Class Ⅰ
HuanggangY323.05823Class II
XianningY118.678611Class II
SuizhouY614.16456Class II
EnshiY164.192116Class III
XiantaoY136.661113Class II
TianmenY146.290014Class II
QianjiangY155.455515Class III
ShennongjiaY17017Class III
Table 8. Supply of materials at internal supply points.
Wuhan (1)Wuhan (2)XiaochangXiangyangGuangshuiDangyang (1)SuizhouZaoyangGuchengDangyang (2)Yidu
80,00040,00030,00040,00030,00030,00030,00030,00030,00030,00030,000
Table 9. Supplies at external supply points.
BeijingShanghaiHangzhouShenzhou
25,00025,00025,00025,000
Table 10. Material requirements by need score.
CityPredicted Need
Wuhan175,650
Huangshi35,135.2
Shiyan53,076
Xiangyang18,971.2
Yichang19,648
Jingzhou33,937.6
Jingmen41,995.5
Ezhou37,443
Xiaogan28,030
Huanggang14,143
Xianning21,444
Suizhou31,255
Enshi11,900
Xiantao7249
Tianmen7352
Qianjiang7513
Shennongjia399
Table 11. Distance of stockpile centers from infected areas in municipalities.
Supply/NeedWuhan (1)Wuhan (2)XiaochangXiangyangGuangshuiDangyang (1)SuizhouZaoyangGuchengDangyang (2)Yidu
Wuhan32493323145270171246355286309
Huangshi10276167397221330245320429345387
Shiyan62884026590262115190299273325
Xiangyang2402242161392616121819220376123
Yichang11294175405228336253328437336328
Jingzhou22521325321629811426625128010897
Jingmen1581709217963263491200256318
Ezhou298309244212111881568166180251
Xiaogan449441376179343312289212101302352
Huanggang7582177390230350256313422365381
Xianning94102201416253393279354448377407
Suizhou321313322264367693242982967453
Enshi503521515457560256517491489270246
Xiantao103121151322191234190264373241217
Tianmen134143118274230191198254338189164
Qianjiang157167185274230181198254338189164
Shennongjia483472407237374203326300192206256
Table 12. Dispatch program for emergency supplies within an outbreak.
Supply/NeedWuhan (1)Wuhan (2)XiaochangXiangyangGuangshuiDangyang (1)SuizhouZaoyangGuchengDangyang (2)Yidu
Wuhan80,00021,44427,6620014,20901713000
Huangshi04289000000000
Shiyan0000000028,03000
Xiangyang00037,443.20000000
Yichang0000011,607000019,648
Jingzhou00000000030,0003937
Jingmen00000379400000
Ezhou03755000000000
Xiaogan002338025,565011,02814,143000
Huanggang07507000000000
Xianning03929000000000
Suizhou00025564434018,97114,143188900
Enshi0000038800001991
Xiantao00000000001449
Tianmen00000000001470
Qianjiang00000000001502
Shennongjia000000008000
Table 13. Dispatch program for external emergency response to an epidemic.
Supply/NeedBeijingShanghaiHangzhouShenzhen
Wuhan7505749774957503
Xiangyang6248624962466256
Xiaogan5007499549925006
Huanggang6260624462416255
Table 14. Effectiveness of material movement with and without consideration of external assistance.
NeedDemand Point Base DataNo Consideration of External RescueConsideration of External Rescue
WuhanMaterial needsInternal and external dispatchQuantity of material acquiredDemand shortfallDemand satisfactionMaterial needsDemand shortfallDemand satisfaction
Xiaogan175,6501145,02830,62282.6%175,02862299.6%
Huanggang53,0760.3028,03025,04652.8%48,030504690.5%
Xiangyang35,1350.33428930,84612.2%29,289584783.4%
Disclaimer/Publisher’s Note: The statements, opinions and data contained in all publications are solely those of the individual author(s) and contributor(s) and not of MDPI and/or the editor(s). MDPI and/or the editor(s) disclaim responsibility for any injury to people or property resulting from any ideas, methods, instructions or products referred to in the content.