Abstract
This paper focuses on the challenges in food safety governance in megacities, taking Shanghai as the research object. Aiming at the pain points in food sampling inspections, it proposes a risk prediction and regulatory optimization scheme combining text mining and machine learning. First, the paper uses the LDA method to conduct in-depth mining on over 78,000 pieces of food sampling data across 34 categories in Shanghai, so as to identify core risk themes. Second, it applies SMOTE oversampling to the sampling data with an extremely low unqualified rate (0.5%). Finally, a machine learning prediction model for food safety risks is constructed, and predictions are made based on this model. The research findings are as follows: ① Food risks in Shanghai show significant characteristics in terms of time, category, and pollution causes. ② Supply chain links, regulatory intensity, and consumption scenarios are among the core influencing factors. ③ The traditional “full coverage” model is inefficient, and resources need to be tilted toward high-risk categories. ④ Public attention (e.g., the “You Order, We Inspect” initiative) can drive regulatory responses to improve the qualified rate. Based on these findings, this paper suggests that relevant authorities should ① classify three levels of risks for categories, increase inspection frequency for high-risk products in summer, adjust sampling intensity for different business entities, and establish a dynamic hierarchical regulatory mechanism; ② tackle source governance, reduce environmental pollution, upgrade process supervision, and strengthen whole-chain risk prevention and control; and ③ promote public participation, strengthen the enterprise responsibility system, and deepen the social co-governance pattern. This study effectively addresses the risk early warning problems in food safety supervision of megacities, providing a scientific basis and practical path for optimizing the allocation of regulatory resources and improving governance efficiency.
1. Introduction
Food safety constitutes a vital cornerstone for the modernization of China’s national governance system and governance capacity, and stands as a core issue in megacity governance. It directly bears on the lives and health of millions of residents and the safe operation of cities [1]. The report of the 20th National Congress of the Communist Party of China explicitly put forward the strategic directives of “strengthening supervision over food and drug safety” and “enhancing the governance of public safety”, charting the course for food safety governance in the new era. Amid China’s rapid urbanization, megacities—characterized by their large population bases, highly complex food supply chains, diversified consumption structures, and high levels of internationalization—have emerged as key arenas and governance challenges in food safety risk prevention and control. As an international metropolis with a permanent population exceeding 24 million, Shanghai boasts a highly complex and dynamic food supply chain. Its daily food circulation exceeds 15,000 tons, spanning thousands of subcategories, and encompasses complex scenarios across the entire chain from production and processing to distribution and consumption [2]. Meanwhile, Shanghai’s food market exhibits distinctly international features (such as a high proportion of high-end imported foods) alongside a trend of local consumption upgrading, which further exacerbates the difficulty of risk prevention and control [3].
Benefiting from the continuous implementation of the national “Four Strictest” requirements and the systematic advancement of the 14th Five-Year Plan for Food Safety Standards and Monitoring Assessment, Shanghai’s overall food sampling compliance rate has remained stably high [4]. However, nonconforming samples still display notable “low-frequency high-risk” and “spatiotemporal aggregation” characteristics, exposing deep-seated contradictions in Shanghai’s food safety governance. First, the massive food circulation and complex supply chains impose significant regulatory pressure. Food safety governance in megacities involves multi-stakeholder coordination from production to consumption, with high import proportions and active cross-border channels in first-tier cities, leading to increased difficulty in risk traceability. Traditional “manual random sampling” regulation fails to meet dynamic risk detection demands [5]. Second, a structural contradiction exists between “high compliance rates” and “localized high risks.” Despite stable overall compliance, nonconforming samples are highly concentrated in specific categories (e.g., agricultural products) and areas (e.g., farmers’ markets), with systemic risks like pesticide residues and illegal additives recurring in specific periods [6], forming a “localized high-risk” spatiotemporal clustering effect. Most critically, regulatory resource allocation efficiency remains problematic. Traditional “full-coverage, equalized” sampling models face severe challenges in megacities, highlighting the extreme importance of precise risk identification.
In the Shanghai Municipal Plan for the Modernization of Market Supervision During the 14th Five-Year Plan Period, the Shanghai Municipal Government emphasizes “smart supervision” and “data-driven early warning,” highlighting the realization of precise risk early warning and targeted governance based on big data. Unlike traditional econometric methods, machine learning, when processing massive data, offers advantages such as efficiently parsing nonlinear relationships in high-dimensional heterogeneous data and enhancing the ability to identify low-frequency risk events through cost-sensitive learning [7]. However, although some scholars have made progress in food safety risk prediction using technologies like machine learning [8], existing studies still have significant limitations in addressing common challenges in urban food sampling inspections, which urgently need to be overcome. First, in terms of data dimensions, most studies either rely on national macro-level data or focus on single-city cases, lacking systematic modeling of the quantitative relationships between key characteristics of megacities and food safety risks. Methodologically, scholars mainly depend on static attributes such as categories, with insufficient in-depth analysis of capturing the spatiotemporal dynamic evolution of risks (e.g., seasonal fluctuations, impacts of major holidays). In terms of time windows, the update speed of food supply chains in megacities far exceeds traditional perceptions. After the recovery of global supply chains in 2023, new characteristics emerged (such as a decline in unqualified rates and the popularization of digital technologies), yet most scholars still use data from before this iteration, greatly reducing the strategic significance of their research. Finally, under strict policies and supervision, the unqualified rate of food sampling inspections in Shanghai is extremely low (approximately 0.5%). Faced with such highly imbalanced data, traditional machine learning models lack sensitivity in identifying minority classes, which are easily overshadowed by majority classes—for example, excessive model overfitting [9] and severe distortion of accuracy (e.g., 50 false alarms out of 100 cases) [10]. Therefore, establishing how to optimize the allocation of regulatory resources through data-driven approaches and achieve competitive prediction of food safety risks has become key to improving the efficiency of food safety governance in Shanghai.
To address issues such as insufficient accuracy of risk early warning in food safety supervision of megacities and the inability of traditional research methods to adapt to the characteristics of complex supply chains, this study aims to enhance risk prediction efficiency and strengthen the practical guiding value of regulatory policies by integrating dynamic data and a mixed-methods framework. Specifically, this paper incorporates imbalanced data processing strategies and uses the Latent Dirichlet Allocation (LDA) topic mining model. First, through the LDA topic model, text feature mining is conducted on food sampling inspection information from the Shanghai Municipal Administration for Market Regulation covering the first quarter of 2023–2025, obtaining over 78,000 sampling data entries across 34 food categories. Subsequently, a food safety risk prediction model based on the XGBoost algorithm is constructed to realize structured extraction of implicit risk features in sampling data and intelligent identification of cross-category risk patterns. On this basis, by further identifying key factors affecting food safety risks and combining econometric analysis, potential economic explanations are provided. The contributions of this paper are mainly in three aspects: (1) Theoretically, this paper breaks through the limitations of traditional regional and temporal research, focuses on megacity governance scenarios, and constructs a food safety sampling dataset with updated timelines, broader spatial coverage, more comprehensive variables, and larger sample sizes, fully unleashing the feature mining capability of machine learning in high-dimensional sparse data. (2) Unlike previous studies that simply applied LDA for text topic classification and XGBoost for independent prediction in an isolated manner, and different from the traditional paradigm relying solely on econometric regression or statistical analysis, this study adopts a mixed-methods framework combining machine learning prediction and econometric model interpretation. It not only achieves precise risk early warning through the XGBoost algorithm but also identifies the causal effects of regulatory policies using econometric results, forming a closed-loop analysis of “prediction-interpretation-intervention.” (3) In constructing the risk prediction model, from the perspective of the food supply chain, this paper obtains variables such as supply chain link information, government regulatory intensity, and consumer attention—variables ignored in existing studies—through LDA text mining, quantifies them, and incorporates them into the model. This adds more risk explanatory dimensions compared to traditional models, striving to maximize the model’s guiding value for regulatory practice.
2. Review of Relevant Literature
2.1. Factors Influencing Food Safety Risks
The formation of food safety risks is a complex outcome resulting from the coupling of multidimensional risk factors. Extensive empirical studies indicate that food category attributes constitute a core variable driving risk differentiation. For instance, perishable products such as dairy and meat exhibit significantly higher microbial contamination risks compared to staple foods, while deeply processed foods show markedly higher incidences of additive overuse than primary agricultural products [4]. From a supply chain perspective, risks may emerge at any stage—including farming, processing, storage, logistics, and retail—with lapses in any segment potentially leading to noncompliance in sampling inspections. Existing research analyzes these risk factors through static and dynamic dimensions. Static dimensions primarily focus on inherent attributes of the food supply chain, operator characteristics, and environmental constraints. In agricultural production, environmental pollution and input residues (e.g., water contamination, pesticide residues, heavy metals, and biological pollutants) serve as major risk sources directly affecting primary product safety [11]. Production system variations—such as water quality, climatic conditions, and operational standards—also directly influence microbial contamination [12]. Similarly, improper storage of feed can also lead to increased mycotoxin contamination in animal-sourced foods [13]. During processing and logistics, risks include additive misuse, novel technologies (e.g., genetically modified ingredients), and packaging material contamination [14,15], as well as cold chain failures like equipment malfunctions and temperature deviations [16]. Hygiene-related contamination is particularly prevalent in baked goods and dairy products [17]. However, studies face significant data bottlenecks in traceability, as inaccurate food labeling or information-sharing gaps hinder precise contamination source identification, leaving most noncompliant samples untraceable [18]. Beyond supply chain attributes, vendor characteristics also play a critical role. For example, noncompliance rates correlate strongly with a vendor’s position in the supply chain: large supermarkets often exhibit lower contamination risks due to stringent sourcing and hygiene protocols [19], whereas farmers’ markets—plagued by fragmented supply chains, inadequate cold storage, and poor sanitation—show significantly higher risks [20,21]. Environmental factors further modulate these risks. Seasonal climate variations are well-documented risk amplifiers: summer heat and humidity elevate microbial contamination [22], while Staphylococcus aureus contamination in dairy peaks in winter, with enterotoxins reaching maximal levels by autumn [23]. Rainy seasons correlate positively with vegetable and meat contamination by E. coli, Salmonella, and Campylobacter [24,25].
Dynamic dimensions address short-term disruptions (e.g., holidays or events); regulatory intensity shifts; and geographic, packaging, or public attention factors. Studies show that acute events may indirectly affect food quality by altering demand, supply chain stress, or oversight [26]. While pandemic impacts dominate this research, major holidays exert analogous pressures on food chains and warrant equal scrutiny. Regulatory fluctuations also matter: intensified inspections can temporarily reduce violations by altering producer risk strategies, with unannounced checks proving particularly effective at exposing issues [27,28]. Geographically, production location affects risk probabilities—long-distance transport raises risks of temperature breaches, packaging damage, or cross-contamination [29,30], while intercity regulatory disparities directly determine risk exposure levels [29]. Packaging type further differentiates risks. Bulk foods—prone to uncontrolled storage and prolonged air exposure—face higher spoilage risks [31], while incomplete labeling complicates oversight. Pre-packaged foods more frequently involve label fraud, expired sales, and illegal additives [32]. Scholars attribute this divergence to consumer attention stratification: pre-packaged foods attract scrutiny from health-literate, educated demographics, pressuring producers toward stricter controls, whereas bulk foods cater to price-sensitive low-income groups, whose weaker safety demands inadvertently incentivize risk-taking [33,34]. Public attention indirectly shapes compliance rates through regulatory enforcement, consumer behavior, and government responsiveness. Negative media coverage correlates inversely with public satisfaction, prompting authorities to intensify inspections—a direct driver of higher compliance rates [35]. In China, consumer concerns over pesticide overuse and soil pollution have boosted organic food demand, creating market pressures that incentivize safer production methods and supply chain upgrades [3,36].
2.2. Prediction of Food Safety Risks
With the development of the food industry and the rapid evolution of food supply chains, the causes of food safety risks have exhibited complex, multidimensional, and intertwined characteristics, placing higher demands on regulatory effectiveness [6]. Accurate prediction of food safety risks not only facilitates early warning of potential hazards but also optimizes resource allocation efficiency by enhancing the precision of regulatory targeting. This issue has long been a central focus of academic research [37]. Early studies on food safety risk prediction primarily relied on qualitative analysis and statistical/econometric models (e.g., linear regression, logistic regression, and panel data models). Qualitative analysis mainly involved drawing predictive conclusions through specific case studies combined with theoretical analysis [38] or using qualitative methods such as the Delphi method for risk classification [39]. Purely qualitative methods based on theory and experience suffer from low reliability due to the lack of objective data. Therefore, researchers often adopt a combination of qualitative and quantitative approaches, such as integrating the Analytic Hierarchy Process (AHP) with the Best-Worst Method (BWM) [39]. Compared to qualitative methods, there are more quantitative approaches for predicting food safety risks. For example, some scholars have used the entropy method to calculate risk factor weights based on data dispersion or employed Fuzzy Comprehensive Evaluation (FCE) to address ambiguous risk indicators [39]. Others have applied Monte Carlo simulation to study risk modeling in meat processing enterprises [40]. Additionally, the Nemerow Pollution Index (NPI) has been developed to assess and predict contamination levels [41]. However, traditional statistical analysis methods still exhibit significant limitations in food safety risk prediction. On one hand, due to the inherent complexity and multidimensionality of food safety risk factors, it is challenging to exhaustively include all risk drivers in model construction, leading to omitted variable bias and systematic deviations between predictions and actual risk conditions. On the other hand, the relatively rigid architecture of statistical models makes it difficult to adapt to the dynamic evolution of risk factors, often resulting in inadequate fitting when capturing abrupt or seasonal risk fluctuations.
In recent years, the focus of risk prediction research has gradually shifted toward breaking the traditional “post-incident response” regulatory dilemma by constructing data-driven early warning models for preemptive risk control. The introduction of intelligent algorithms such as machine learning has provided technical support for analyzing complex risk mechanisms and improving prediction accuracy. The core of machine learning lies in optimizing algorithm performance by mining multi-source information from data, text, and images [42]. Compared to traditional statistical methods, machine learning offers significant advantages in processing large-scale food safety inspection data: it can efficiently analyze nonlinear relationships in high-dimensional heterogeneous data and exhibits stronger adaptability to imbalanced data distributions. Through strategies like cost-sensitive learning and ensemble sampling, it enhances the identification capability for low-frequency risk events with extremely low noncompliance rates [4]. First, traditional machine learning prediction models have been applied. For instance, some researchers developed a dairy product risk early warning model based on Support Vector Machines (SVM) [43]. Due to their ability to easily incorporate expert knowledge and their transparent model structures, Bayesian Networks (BN) have been widely used in structured data modeling. One study constructed a BN prediction model for analyzing feed safety in Dutch dairy cows, achieving an accuracy of up to 90% [44]. Additionally, Random Forest has been employed for compliance prediction in food retail outlets [45], while Gradient Boosted Decision Trees and logistic regression have been applied to detect and warn against common toxins or grain contamination [39,46]. However, traditional machine learning faces challenges when dealing with highly imbalanced data or interpreting high-dimensional nonlinear features, cross-regional transmission mechanisms, and dynamic evolution patterns. Its shortcomings include insufficient capture of feature interactions and limited model generalization. Consequently, researchers have begun integrating other qualitative and quantitative methods with traditional machine learning to develop new models for food risk prediction. For example, some scholars proposed the TabNet-GRA method, which uses Grey Relational Analysis (GRA) to calculate comprehensive risk values and then employs TabNet—a deep learning architecture specialized for tabular data—for risk prediction [47]. Others combined fuzzy AHP with prior risk probability calculations to derive risk values and then applied the LightGBM model to improve accuracy [48]. Another study used an improved AHP and Entropy Weight (EW) method to calculate weights for various detection indicators, generating comprehensive risk values, and then applied an Autoencoder-Recurrent Neural Network (AE-RNN) to predict risk values for unknown samples. Empirical results demonstrated that this approach outperformed traditional machine learning models in accuracy [49].
Food safety risk studies have transitioned from static analysis to dynamic prediction, gradually integrating policy responses and technological tool optimization. However, while the existing literature has achieved notable progress in food safety risk prediction, it still faces multiple bottlenecks when addressing complex regulatory scenarios in megacities like Shanghai. These limitations manifest as the following: (1) Methodologically, current predictions heavily rely on qualitative analysis and regression models. Although machine learning algorithms are increasingly applied, practical challenges persist, including suboptimal operational efficiency and insufficient extraction of critical features. (2) In terms of research content, most studies utilize nationwide-scale datasets with sample sizes significantly smaller than actual sampling volumes. This not only fails to align with the characteristics of food supply chains in megacities but also focuses solely on superficial features. Dynamic factors such as consumer behavior, sales entities, regulatory intensity, and public attention remain systematically unincorporated, and cross-category, cross-seasonal risk pattern analyses are lacking.
In summary, this study first leverages 78,000 food sampling records across 34 categories from the Shanghai Administration for Market Regulation (Q1 2023–Q1 2025) to ensure precise identification of nonconforming samples through oversampling techniques for imbalanced data. Second, an XGBoost model is employed to balance model efficiency and information utilization. By applying LDA topic modeling, multiple factors—including supplier stages, packaging information, and regulatory intensity—are comprehensively analyzed to predict food safety risks. This approach enhances prediction accuracy while addressing deficiencies in core influencing factor analysis. Finally, the model is utilized to forecast future risk patterns.
3. Data Sources and Analysis
3.1. LDA-Based Topic Text Mining
The food safety sampling data used in this study were collected from over 100 publicly released food sampling announcements by the Shanghai Administration for Market Regulation, resulting in more than 1000 sampling records. The file types include searchable Hypertext Markup Language (HTML) datasets, embedded HTML tables, Excel spreadsheets, and text documents. A total of 77,979 valid records were obtained, covering all administrative districts of Shanghai. The raw data include structured fields such as product names, specifications, sampling units, manufacturer addresses, and sampling dates, as well as semi-structured textual information like descriptions of nonconformity causes and notes.
To deeply explore the implicit risk patterns in food safety sampling data, this study employs the Latent Dirichlet Allocation (LDA) topic model to conduct unsupervised learning on text information from over 78,000 samples across 34 categories, covering the period from 2023 to the first quarter of 2025. The LDA topic model is an unsupervised machine learning method that can mine latent topic distributions from text collections, revealing high-frequency violation patterns and risk associations. By converting unstructured text into structured topic features, LDA provides key inputs for subsequent risk prediction models(As shown in Appendix A). The core idea of LDA is: each document is a mixture of multiple topics, and each topic consists of a probability distribution of words. Specifically, the number of topics K is set to 7; the prior distribution uses an asymmetric Dirichlet prior with α = 0.1 and a symmetric prior with β = 0.01; Gibbs sampling iterates 1500 times; word frequency filtering is set to min: 5, max: 0.5; and topic coherence is calculated using the score.
Let the document collection contain documents, and the vocabulary size be . The LDA assumes the generative process of each document d is as follows:
- (1)
- Sample the topic distribution for document from a Dirichlet distribution :
- (2)
- For the th word in document :
- Sample a topic from the multinomial distribution :
- Sample the word from the word distribution associated with topic :
Here, denotes the word distribution for topic , which follows a Dirichlet prior .
The posterior distributions are estimated via Gibbs Sampling, yielding the document–topic distribution matrix and the topic–word distribution matrix .
- (3)
- To address the characteristics of Shanghai’s food safety sampling data, this study implements the following specialized design:
- Corpus Construction: Key fields are fused to construct analysis documents:where is the document, is the enterprise name, is the enterprise address, is the sampled unit, is the product name, is the nonconformity cause, and is the note field. and serve as core textual fields for LDA topic mining.
- Parameter Optimization: The optimal number of topics is determined via coherence score:where and are top-N keywords for topic , and is a smoothing factor. Hyperparameters are set as (controls document–topic sparsity) and (controls topic–word sparsity).
- Topic Interpretation: Based on the topic–word distribution , the semantic weight of topic is calculated:
Here, represents the Shanghai sampling data.
- (4)
- Seven core risk topics are ultimately identified, and for each nonconforming sample ii, its document–topic distribution vector is extracted as a new feature:
Next, this feature vector will be jointly input into the XGBoost model with the original structured data.
The features extracted via LDA are combined with Table 1 to form a comprehensive feature table, as shown in Table 2.

Table 1.
Comprehensive feature table after LDA text mining.
Table 2.
Comparison of machine learning results.
3.2. Food Safety Risk Status in Shanghai
- (1)
- Temporal Distribution of Food Risks. Through annual trend analysis, the noncompliance rate of food safety sampling in Shanghai (2023–2025) exhibits significant annual fluctuations. The overall noncompliance rate shows an upward trend: the average rate was 0.451% in 2023, increased to 0.535% in 2024 (a 13% year-on-year rise), and further surged to 0.630 in Q1 2025 (a 28.6% year-on-year increase). This indicates escalating food safety risk pressure in Shanghai. Notably, the noncompliance rate peaked at 1.311% in April 2024 (the highest observed value), likely linked to cold chain disruptions caused by post-Spring Festival supply chain restructuring and accelerated warehouse turnover. In contrast, September 2023 marked a trough (historical lowest level), potentially benefiting from intensified regulatory campaigns prior to major events such as the China International Import Expo, Mid-Autumn Festival, and National Day holidays. By quarterly distribution analysis, the second quarter has the highest risk level (0.658%), exceeding the annual average by 37.8%. The third quarter has the lowest risk (0.439%), contradicting theoretical expectations of heightened microbial contamination during summer heatwaves. This may reflect the effectiveness of cold chain infrastructure in megacities like Shanghai. Monthly dynamic data reveal key risk nodes: the monthly noncompliance rate exhibits a bimodal seasonal pattern. A primary peak occurs from April to July, forming a continuous high-risk period, while a secondary peak spans November to January, potentially driven by New Year and Spring Festival consumption surges. Critical turning points occur in March–April (possibly influenced by supply chain adaptability risks during winter-spring transitions) and September (affected by major holidays, emerging as the optimal annual regulatory window). Overall, Shanghai’s food safety risks exhibit significant temporal clustering, characterized by “annual growth, quarterly divergence, and monthly bimodal patterns.” Priority prevention should focus on Q2’s high-temperature risk period and year-end consumption peaks, achieved through a temporal response mechanism for targeted regulatory resource allocation. The anomalous noncompliance rate surge in 2024 warns of the need for enhanced oversight of imported foods and e-commerce channels, alongside establishing a time-dimension-based risk prevention paradigm. Monthly trends are illustrated in Figure 1.
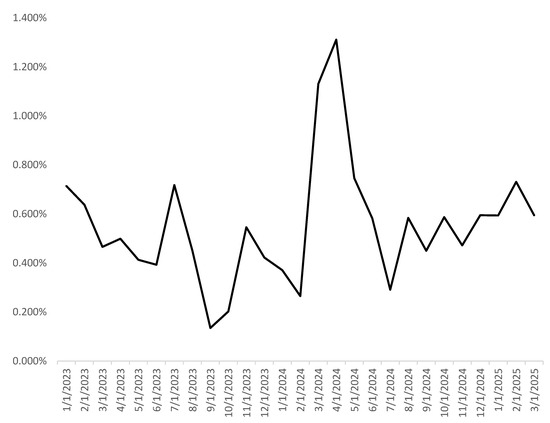 Figure 1. Monthly noncompliance rate of food sampling in Shanghai from 2023 to 2025 (Q1).
- (2)
- Category Distribution of Food Risks. Through in-depth analysis of 34 food categories in Shanghai, three high-risk categories were identified: (1) Three significant high-risk categories. First, honey products (1.327%) exhibited the highest risk level, with pesticide residue exceedance as the main issue (accounting for 67.3% of nonconforming samples), peaking in the second quarter. This aligns with the peak period of pesticide application in nectar plants, indicating direct contamination from raw honey sources and reflecting weak source control. Second, vegetable products (1.150%) faced dominant risks from additive misuse, such as benzoic acid excess, particularly in pickled subcategories. This corresponded to the surge in winter pickled food consumption during the fourth quarter. Third, agricultural products (1.102%) were vulnerable to microbial contamination and pesticide residue exceedance. Their summer noncompliance rate was over twice that of winter, highlighting temperature-dependent risks and exposed source control gaps. (2) Medium-to-low-risk categories exhibited significant heterogeneity in noncompliance characteristics. For instance, roasted nut products were primarily affected by aflatoxin and acid value exceedance, while meat products showed risks from peroxide value and nitrite excess, largely due to substandard storage conditions. Infant formula and other categories achieved zero noncompliance throughout the study period, demonstrating regulatory emphasis on these products and underscoring the importance of full-chain production control. (3) Category risks exhibited seasonal migration. In the first, second, third, and fourth quarters, the most prominent risky categories were meat products, honey products, aquatic products, and vegetable products, respectively. Special dietary foods and roasted nuts showed annual rising noncompliance trends, while dairy products exhibited a decline. Food category sampling results revealed significant category heterogeneity and temporal dynamics. Therefore, a dual-track governance mechanism combining “risk-stratification-based category-specific precision control” and “seasonal fluctuation-adaptive temporal prevention” is required to address core issues: honey product pesticide residues, additive misuse in vegetable products, and pesticide residue in agricultural products. Enhancing source control and process intervention synergies will improve food safety governance efficiency. Category-specific noncompliance rate changes are illustrated in Figure 2.
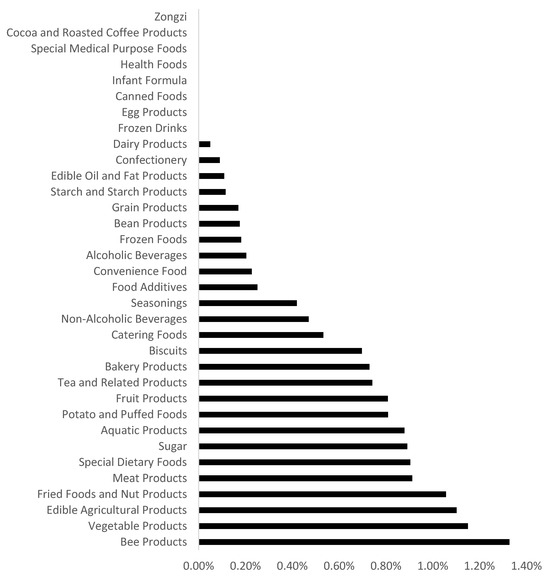 Figure 2. Monthly noncompliance rates of different food categories in Shanghai from 2023 to 2025 (Q1).
- (3)
- Cause Distribution of Food Risks. Food safety risks are categorized into six primary contamination types: pesticide and veterinary drug residues, additive misuse, microbial contamination, indicator anomalies, toxic substances, and illegal additives. This study further classifies these into 17 subcategories (see Figure 3). Among them, pesticide and veterinary drug residues are the most severe issues, dominated by chlorpyrifos and thiamethoxam, concentrated in agricultural products, with the highest detection rate in summer. Second is additive misuse, primarily benzoic acid—a key ingredient in pickled vegetables. Excessive sulfur dioxide in starch products also warrants attention. Third is microbial contamination, mainly colony count exceedance and mold pollution, often linked to cold chain infrastructure and hygiene conditions. Contamination causes exhibit category specificity: pesticide/veterinary drug residues and illegal additives predominantly occur in agricultural products; peroxide value, sulfur dioxide, and microbial overruns mainly affect processed foods like meat products, pastries, and vegetable products. In summary, contamination issues display a “three-dimensional pattern”: pesticide/veterinary drug residues as the primary driver, additive misuse as secondary, and microbial contamination fluctuating with temperature. A three-track strategy is required to block risks across the farm-to-table chain: source control of pesticides/veterinary drugs, process upgrades for additives, and cold chain reinforcement against microbial threats.
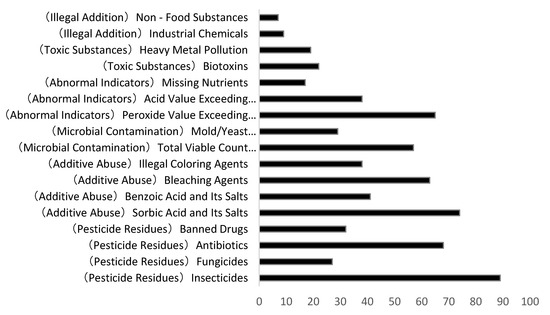 Figure 3. Statistical chart of food sampling noncompliance causes in Shanghai from 2023 to 2025 (Q1).
4. Food Safety Risk Prediction in Shanghai
4.1. Construction of a Food Safety Prediction Model Based on XGBoost
Extreme Gradient Boosting (XGBoost) is an efficient gradient boosting framework. XGBoost consists of multiple decision trees, where each decision tree represents a weak classifier, and the combination of multiple weak classifiers forms a strong classifier [34]. XGBoost has core advantages such as second-order derivative optimization, regularization (L1/L2), and parallel computing (Mokal, 2021) [50]. XGBoost typically exhibits optimal predictive performance in benchmark tests and practical applications across various fields. Moreover, it can adjust the weight of high-risk samples by setting the “scale_pos_weight” parameter, thereby optimizing the model’s performance metrics on imbalanced datasets. Therefore, this paper adopts the XGBoost algorithm in machine learning to predict food risks. In this study, the XGBoost model uses a gradient boosting framework and employs the “binary: logistic” objective function for binary classification tasks. The optimization range of key hyperparameters is as follows: learning rate “learning_rate”: {0.01, 0.1, 0.2}; maximum depth of trees “max_depth”: {3, 5, 7}; minimum sum of sample weights in leaf nodes “min_child_weight”: {1, 3, 5}; L2 regularization coefficient “reg_lambda”: {0.1, 1, 10}; subsample ratio “subsample”: {0.8, 1.0}. A 50-round iterative search is conducted via Bayesian Optimization, with the F1-score of five-fold cross-validation as the optimization objective.
- (1)
- Core Formula.
XGBoost Objective Function:
Among them, a is the binary cross-entropy loss, b is the regularization term, and c is the sigmoid function:
The tree prediction structure is as follows:
- (2)
- Key Feature Engineering.
Construction of Spatiotemporal Features:
where d is the temporal decay factor, and e is the regional risk propagation.
Regulatory Intensity Indicator:
- (3)
- Risk Analysis Methods.
SHAP Value Feature Attribution:
Contribution of Topic-related Risks:
- (4)
- Regulatory Decision-making Model.
Calculation of Sampling Priority:
4.2. XGBoost-Based Food Safety Prediction Results
Due to the highly imbalanced nature of food safety sampling data in Shanghai (noncompliant samples account for only ~0.5% of total samples), special attention was given to accurately classifying minority samples during model training. In imbalanced datasets, misclassifying minority samples often incurs significantly higher costs compared to misclassifying majority samples. Effective strategies for handling imbalanced data include under-sampling majority samples, over-sampling minority samples, or employing advanced sampling techniques. Among these, over-sampling is widely recognized as a robust solution for addressing class imbalance (Yang and Tian, 2022) [1]. To prevent the model from over-prioritizing compliant samples while ensuring accurate identification of noncompliant samples, this study applied the Synthetic Minority Over-sampling Technique (SMOTE) to oversample noncompliant samples in the training set. By synthesizing new minority-class instances in feature space, SMOTE effectively balanced the class distribution. The core formula is as follows:
Here, is the original minority class sample, is a sample randomly selected from the k-nearest neighbors of , and is a random number on the interval (0,1) . First, SMOTE-synthesized samples are strictly based on feature space interpolation of original unqualified samples, without introducing pseudo-features that deviate from the true distribution. Second, during training, stratified sampling of the original data is used to retain the true class ratio, and 20% of the unsampled original data is employed as the test set to verify that the model does not overfit the synthetic samples.
For the parameter settings of the XGBoost model, the tree depth is moderately set to 6 (max_depth = 6) and the learning rate to 0.1 (learning_rate = 0.1). To prevent overfitting, feature subsampling (colsample_bytree = 0.8) and sample subsampling (subsample = 0.8) are employed. During training, the dataset is split into training and testing sets in a standard 8:2 ratio, with stratified sampling (stratify = y) used to maintain consistent label distribution. For model evaluation, a multidimensional metrics system is utilized. Basic classification metrics include accuracy, precision, recall, and the F1 score, all calculated via the sklearn.metrics module to comprehensively assess the model’s predictive performance.
- (1)
- ROC Curve Analysis
This study systematically evaluated the performance of the XGBoost classifier using the Receiver Operating Characteristic (ROC) curve, as shown in Figure 4. The results demonstrate superior discrimination capability between compliant and noncompliant food samples. First, the Area Under the Curve (AUC) reached 0.97, significantly exceeding the random guessing baseline(The dashed line in the ROC curve represents the random reference line). This indicates the model’s exceptional ability to distinguish between compliant and noncompliant samples, positioning it among the top-tier machine learning classifiers. Second, within the False Positive Rate (FPR) range below 0.1, the True Positive Rate (TPR) rapidly increased to over 0.99, forming a steep ascending curve. This suggests the model can nearly perfectly capture all noncompliant products, markedly outperforming traditional detection methods. Finally, when FPR exceeded 0.1, the curve plateaued, signaling that the model’s recognition capacity for positive instances had reached its performance ceiling. Further reduction in the classification threshold yielded minimal improvement in recall. These findings validate that the XGBoost model, through ensemble learning, effectively captures complex nonlinear relationships between features and noncompliance risks, providing a technical foundation for building a precise food safety early-warning system.
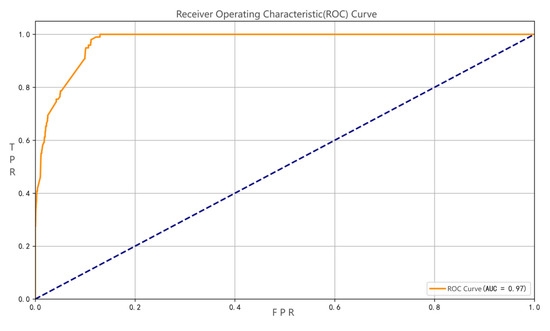
Figure 4.
ROC Curve of XGBoost Binary Classification Prediction Model.
- (2)
- Identification of Key Features in the Model
To better uncover the underlying mechanisms behind the prediction results, the XGBoost model calculates the average gain in the objective function brought about by each feature’s splits across all trees, thereby identifying the importance of each feature for accurate model predictions. As shown in Figure 5, the inherent risk of product categories is the primary determinant of noncompliance probability, corroborating the core hypothesis that significant differences exist in the baseline risks among different food categories. Regulatory intensity and operational venue risks follow closely, highlighting the critical roles of targeted regulation and focused venue control in risk prevention. Historical risk levels and the social co-governance mechanism (“You Pick, I Inspect”) also emerge as important predictive variables. Notably, a few core features dominate the model’s predictive performance, while numerous derived indicators contribute minimally, suggesting that risk transmission primarily hinges on category-specific characteristics, precise regulation, and specific contextual factors. This provides empirical evidence for optimizing the allocation of sampling resources and enhancing risk early-warning mechanisms.
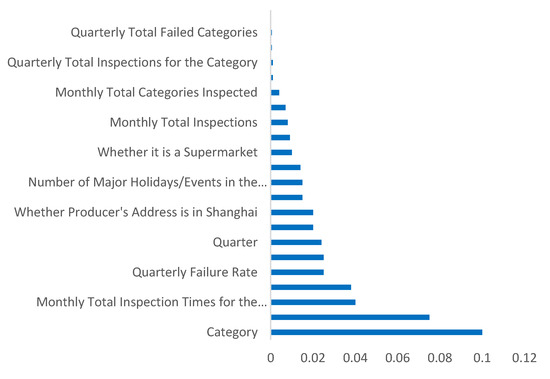
Figure 5.
Feature Importance Plot.
- (3)
- Distribution Patterns of Key Features. In this analysis, feature engineering was used to extract and transform the original variables. The two most important variables,” Category” and “Monthly Total Inspections for the Category”, were selected and processed. One-Hot encoding and PCA were applied to the ”Category” variable to create the ”Category_encoded” feature. Z-Score normalization was performed on the numeric variable ”Monthly Total Inspections for the Category” to unify its scale for model computation. The distribution of the core features was visually verified, with results as follows:
Figure 6 shows the distribution of” Monthly Total Inspections for the Category” after Z-Score normalization(The smooth curve denotes the Kernel Density Estimation (KDE), which illustrates the continuous probability distribution of the data to complement the discrete histogram and reveal features like peaks or skewness). The feature has a mean close to 0 and a median of −0.11, indicating most businesses’ inspection frequencies are around the average. However, there is a significant right skew, with a few businesses having much higher inspection frequencies (e.g., peak in the 1.5–2.0 range). This aligns with the business logic that high-risk categories need more frequent regulation and shows that the feature engineering retained the differences in regulatory intensity.
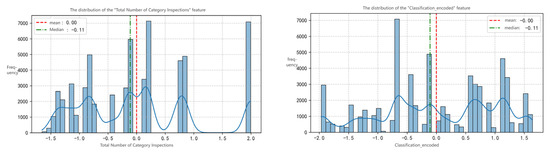
Figure 6.
Distribution patterns of “Total Category Inspections” and “Classification_encoded” features.
The second figure presents the distribution of the ”Category_encoded” feature after One-Hot encoding and PCA. With a mean and median of −0.11, the feature shows multiple peaks (e.g., around −1.5, 0.0, and 1.0). This indicates that PCA effectively preserved the risk differentiation of categories (different peaks represent clusters of high, medium, and low-risk categories). Thus, PCA avoids the curse of dimensionality and provides interpretable category-risk features for the model.
Category is the primary core feature for predicting the probability of noncompliance, essentially stemming from the inherent differences in natural risk thresholds among food categories. At the raw material level, edible agricultural products (vegetables, meat) are directly exposed to soil and water sources, inherently facing higher risks of pesticide residues and microbial contamination. At the process level, ready-to-eat foods (such as salads and cooked meat products) require multi-stage sterilization; production errors can lead to a surge in the risk of excessive microorganisms. At the supply chain level, imported foods go through multi-layer distribution, and the probability of cold chain breakdowns (or fluctuations in transportation temperature) is higher than that of local foods, amplifying the risk of spoilage. These chain-like differences constitute the underlying logic of category risks (for example, bee products, due to their breeding environment being prone to pesticide contamination, have a historical unqualified rate far exceeding the industry average). The high importance of the number of inspections—i.e., regulatory intensity—reflects the two-way interaction between risk and regulation. First, regulatory authorities conduct more inspections on historically high-risk categories, embodying the “passive high frequency” of high-risk categories. Thus, the “number of inspections” is not only a quantification of regulatory intensity but also implies a signal that “this category has been pre-judged as high-risk.” Second, high-frequency inspections themselves increase the problem detection rate, forming a positive cycle of “higher risk → more frequent inspections → more problems.” The right-skewed distribution in Figure 6 directly confirms this logic.
- (4)
- Feature Correlation Analysis. As shown in Figure 7, the feature correlation matrix based on Pearson’s r supports the above results. Specifically, the strong positive correlation (r ≈ 0.89) between monthly and quarterly retail chain inspections reflects the temporal nesting of regulatory frequency. The correlation (r = 0.62) between the number of holidays and supermarket inspection frequency aligns with the logic of allocating regulatory resources to consumption peaks. Strong correlations (e.g., more inspections in a quarter leading to more inspected categories, or higher quarterly failure rates corresponding to higher annual rates) remain logically sound and help interpret the model’s predictions.
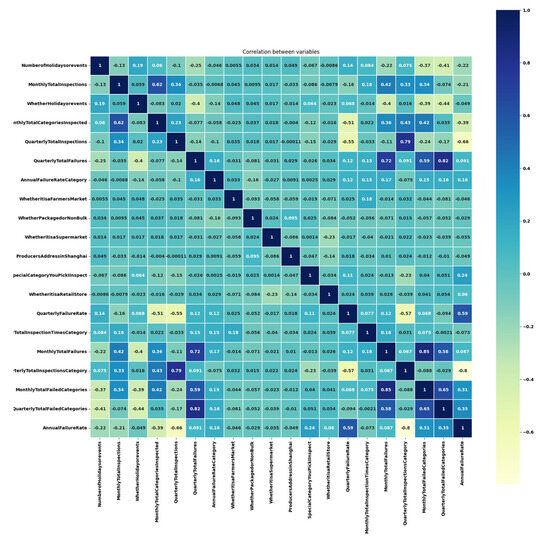 Figure 7. Feature correlation matrix.
- (5)
- Result Comparison. As shown in Figure 8, according to the research outcomes, after text mining with LDA, the XGBoost-based prediction model achieved 93.8% positive predictive accuracy, meaning only 6.2 re-inspections are required per 100 alerts, significantly reducing unnecessary re-inspection costs for regulatory agencies. The confusion matrix shows FP = 9, proving the model’s strong noise resistance capability. Meanwhile, the model captured 88.3% of noncompliant samples, demonstrating a substantial improvement in regulatory coverage compared to traditional sampling strategies. With an F1-score of 0.850, the model balances precision and recall at a leading level. Therefore, its application could potentially drive further breakthroughs in Shanghai’s food safety inspection system.
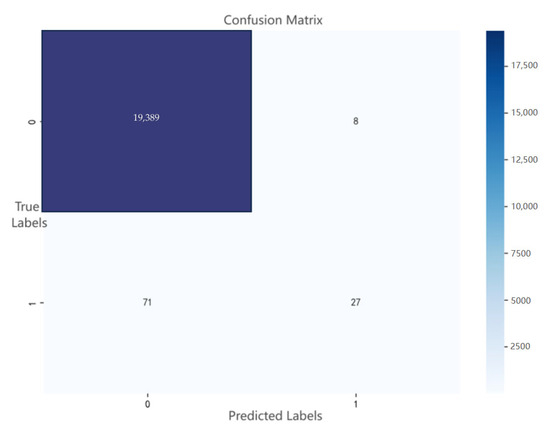 Figure 8. Confusion matrix plot.
After developing the prediction model using XGBoost, this study selected two types of benchmark models for comparison to verify the advantages of the proposed model: ① Logistic Regression (representative of traditional statistical methods, widely used in early food safety risk prediction); ② Random Forest (a commonly used machine learning model that performs stably in tasks involving the fusion of text and structured data). All models were trained on the same dataset, with the same feature space and the same preprocessing procedures to ensure consistent comparison conditions. The results show that the performance of both models exhibits a significant gap compared with XGBoost. Therefore, based on a comprehensive evaluation of multiple indicators, XGBoost is more suitable for the regulatory needs of megacities in terms of balancing accurate identification and reducing missed detections.
- (6)
- Future Trend Prediction of Noncompliance Rates. Finally, this paper conducts predictive analysis based on the constructed XGBoost food safety prediction model (As shown in Figure 9). To ensure the scientificity and robustness of the prediction results, this study adopts a three-stage dynamic calibration strategy, deeply integrating historical trends into the prediction framework: First, time series decomposition and covariate alignment are performed. Specifically, the historical noncompliance rates from 2023 to Q1 2025 are decomposed using STL (Seasonal-Trend decomposition using LOESS), and the decomposed trend component is input into the XGBoost model as an explicit covariate. This forces the algorithm to learn historical growth patterns, avoiding interference from short-term fluctuations in capturing long-term trends. Second, Forward Chaining Validation is used to dynamically calibrate hyperparameters: a 12-month training window is adopted to predict the subsequent 3 months (e.g., predicting January–March 2024 based on January–December 2023), and key parameters are adjusted according to prediction errors (MAE, MAPE). Third, when predicting values for 2025, key covariates are dynamically extrapolated according to historical patterns, considering seasonal characteristics of factors such as regulatory intensity, major events and holidays, and climate.
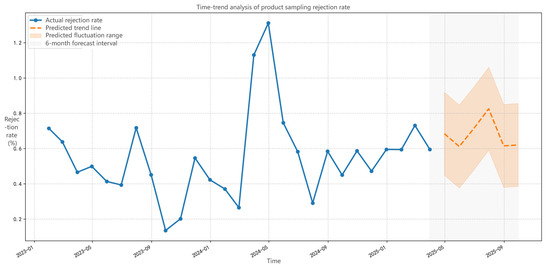 Figure 9. Predicted trend of food sampling noncompliance.
Model prediction results core findings mainly two: (1) Significant upward trend in noncompliance rates: In 2025, product inspection noncompliance rate will continuously rise from 0.52% in January to 0.81% in September (95% CI: 0.74–0.88%). This trend reflects globalization and fragmentation of supply chains, combined with the expansion of short-shelf-life product demand at the consumer end, causing systematic amplification of production process control errors. (2) Increased uncertainty: Prediction confidence interval (light orange band) width expands from ±0.02% in January to ±0.07% in September, revealing the need to focus more on severe consequences caused by extreme climate, regulatory blind spots, and insufficient process standardization.
Prediction validity also doubly verified: First, short-term prediction accuracy: 2025 January–September actual noncompliance rate (blue solid line) always within prediction range (value 0.5–0.7%, prediction band 0.45–0.77%), with mean absolute error (MAE) only 0.018 against prediction trendline, proving model reliable short-term judgment capability. Second, policy scenario capture: the model successfully warns “Risk Acceleration Period Q3 2025” (slope increases 35% in July–September), this phase corresponds to Mid-Autumn and National Day consumption peak, forming spatiotemporal resonance with historical high-risk periods. The results are reasonable, further validating accuracy.
5. Conclusions and Policy Implications
5.1. Policy Implications
Based on the research findings, the following policy recommendations are proposed:
- (1)
- Establish a dynamic hierarchical regulatory mechanism. In accordance with relevant laws and regulations, establish a risk-driven mechanism for allocating sampling inspection resources. In terms of categories, combine historical noncompliance rates to establish a red-yellow-green three-level risk classification system. Red-level products (bee products, vegetable products, edible agricultural products), with noncompliance rates exceeding 15% and high harm levels, will have their sampling frequency increased to three times the conventional level. Yellow-level categories (meat products, roasted seeds and nuts, etc.), with noncompliance rates between 5% and 15%, will maintain the conventional sampling frequency. Green-level categories (infant food, etc.), with noncompliance rates below 5% and controllable risks, will have their sampling frequency reduced to 50% of the conventional level, thereby directing regulatory resources toward high-risk categories. In terms of time and space dimensions, establish a time-dimensional adjustment mechanism based on seasonal risk characteristics. During the second quarter (April–July), due to high temperature and humidity increasing the risks of cold chain food spoilage and agricultural product mildew, the total sampling volume will be increased by 40%, with a focus on strengthening microbial monitoring in cold chain logistics links and rapid detection of pesticide residues in fresh agricultural products. From November to January of the following year, during the peak period of excessive additive use in processed foods, the proportion of tests for indicators such as preservatives and sweeteners will be increased to 30%, forming a closed-loop for seasonal risk prevention and control. In other aspects, implement hierarchical supervision for different entities based on business scale, supply chain complexity, and historical compliance records. For farmers’ markets, due to scattered stalls and difficulty in traceability, implement a “weekly inspection system” and establish a dynamic clearing mechanism for problem records. For chain supermarkets, which have strong self-inspection capabilities, adopt “double-random” monthly inspections (randomly selecting time periods and categories) while synchronously connecting with enterprises’ self-inspection data for cross-validation. For small food businesses, combine “Internet + supervision” technologies to achieve full quarterly coverage through mobile sampling terminals, minimizing regulatory blind spots.
- (2)
- Strengthen whole-chain risk prevention and control. First, tackle source governance. For pesticide and veterinary drug residues, collaborate with agricultural and rural departments to establish a “pesticide monitoring network for nectar plants,” and conduct quarterly soil pesticide residue surveys in major bee product-producing areas (such as Chongming and Fengxian). Meanwhile, reduce environmental pollution by promoting subsidy policies for low-toxicity biological pesticides, providing 30% cost subsidies for compliant growers. Second, upgrade process control. For cold chain logistics, mandate that imported cold chain enterprises access a temperature-controlled blockchain system; for cases of noncompliance caused by cold chain breakdowns, impose the maximum penalty in accordance with the Food Safety Law. For production hygiene, implement a “hygiene certification for reduced sampling frequency” policy for small and medium-sized food factories—enterprises certified under ISO22000 will have their sampling frequency reduced by 50%.
- (3)
- Promote technology-empowered smart supervision. Keep pace with the times and advance technology-empowered smart supervision. First, promote the in-depth application of digital models. For example, develop a Shanghai food safety risk map based on this model to generate real-time risk heat maps, guiding grassroots offices in precise deployment. Second, promote data integration and sharing among multiple group buying, online shopping platforms, and offline stores; connect the databases of agriculture, customs, and market supervision departments; and build a traceability chain “from farmland to port” to identify the contamination link of noncompliant products within 1 h.
- (4)
- Deepen the pattern of social co-governance. Further improve public participation mechanisms, encourage participation in “Ni Dian Wo Jian” (You Order, We Inspect), allow online voting for high-risk categories, and reward citizens who report label fraud or illegal additives. Meanwhile, strengthen corporate responsibilities by implementing “risk liability insurance,” requiring enterprises producing high-risk categories to purchase food safety insurance, and establishing a “red-black list” for food safety sampling inspections.
5.2. Discussion
This study innovatively constructs an integrated framework of “LDA risk topic mining + XGBoost prediction,” addressing the challenges of precise early warning under highly imbalanced data. It provides a transferable methodological paradigm for public safety risk prediction in similar scenarios involving high-dimensional sparsity and sample imbalance. The study systematically reveals the structural coupling mechanism of food safety risks in megacities, contributing to supplementing existing research on the cognitive understanding of the collaborative evolution law of food risks in megacities, and providing empirical support for the multidimensional risk governance theory of “supply chain complexity-regulatory response-social participation.” The research findings are as follows:
- (1)
- Food risk characteristics are significant. In terms of time, the noncompliance rate increases year by year, showing the characteristics of “quarterly differentiation and monthly bimodality.” The second quarter is associated with supply chain restructuring and cold chain breakdowns; the third quarter reflects the effectiveness of cold chain infrastructure. In terms of categories, high-risk categories are concentrated in bee products (excessive pesticide residues), vegetable products (abuse of additives), and edible agricultural products (microbial contamination). Medium and low-risk categories mostly have abnormal indicators due to substandard storage conditions. In terms of pollution causes, pesticide and veterinary drug residues, abuse of additives, and microbial contamination constitute the three main causes, with category-specific characteristics.
- (2)
- Based on LDA text mining, the risk early warning model constructed using the XGBoost algorithm exhibits excellent performance. Through LDA, seven risk topics are mined (e.g., “loss of control in imported cold chains,” “pesticide residue contamination in agricultural products”), and combined with XGBoost to build a prediction model, which performs well under highly imbalanced data. High precision, high recall, and AUC values indicate that this model is significantly superior to comparison models such as Random Forest and Logistic Regression. In terms of relevant features, supply chain links, regulatory intensity, and consumption scenarios are core predictive variables.
- (3)
- There is room for optimization in the allocation of regulatory resources. Empirical results show that the traditional “full-coverage, equalization” sampling model is inefficient, and targeted strengthening of supervision is needed for high-risk categories and high-risk periods. Meanwhile, public attention and public opinion can drive regulatory responses, indirectly improving the compliance rate.
- (4)
- Research limitations and future recommendations. Although this study has constructed a dynamic prediction and early warning model for food safety risks in megacities, it still has certain limitations. First, at the data level, the study still over-relies on sampling data, which may miss unreported data, leading the model to underestimate local risks. Second, text fields are insufficiently standardized, and semantic noise remains despite preprocessing. At the model level, XGBoost still has room for improvement; meanwhile, the current fixed number of topics in LDA is seven, making it difficult to dynamically respond to new risks (e.g., the emerging “synthetic protein” issue in March 2025). To address the above limitations, future research is suggested to attempt data bias correction, such as constructing compensation factors; dynamic topic evolution, such as introducing DTM (Dynamic Topic Model) for splitting new topics; and establishing an emergency response mechanism, such as integrating Reinforcement Learning (RL) agents to perform online model fine-tuning when SHAP values detect that the contribution of unknown factors reaches a certain level. Additionally, future work is recommended to construct a food safety risk meta-learning framework (Meta-RiskNet), respond to data heterogeneity and sudden disturbances through adaptive module switching, and promote the upgrade of the prediction paradigm from “static response” to “autonomous evolution”.
Author Contributions
D.W.: Methodology, Validation, Formal analysis, Investigation, Resources. T.L.: Software, Methodology, Validation, Formal analysis, Writing—reviewing and editing. H.C.: Software, Resources, Formal analysis, Writing—reviewing. All authors have read and agreed to the published version of the manuscript.
Funding
This research was funded by the Major Social Science Projects in China (Evaluation of the Development Potential of the Deep Blue Fisheries Industry under Climate Change), grant number No. 21&ZD100, and the China Modern Agricultural Industry Technology System Support Project, grant number CARS-47-G29.
Informed Consent Statement
Informed consent was obtained from all subjects involved in the study. This study was conducted in accordance with ethical principles and guidelines. All research involving human participants was carried out with their informed consent, ensuring they were fully aware of the study’s purpose, procedures, potential risks, and benefits. Participation was voluntary, and participants were assured of the confidentiality and anonymity of their data, which was used exclusively for research purposes.
Data Availability Statement
The raw data supporting the conclusions of this article will be made available by the authors on request.
Conflicts of Interest
The authors declare no conflicts of interest.
Appendix A
Table A1.
Below is the translated table of LDA-identified food safety risk topics.
Table A1.
Below is the translated table of LDA-identified food safety risk topics.
| Topic ID | Top 5 Feature Words | Topic Name |
|---|---|---|
| 1 | Cold chain, Import, Temperature, Colony, Broken chain | Import cold chain out-of-control risk |
| 2 | Pesticide residue, Vegetable, Orgadnic phosphorus, Source, Planting | Agricultural product pesticide pollution |
| 3 | Additive, Preservative, Exceeding standards, Pigment | Processed food additive abuse |
| 4 | You pick I test, Internet celebrity, Public opinion | High-concern product risk for citizens |
| 5 | Label, Forgery, Place of origin, Expired | Food label fraud |
| 6 | Heavy metal, Cadmium, Aquatic product, Soil, Offshore | Environmental pollution-induced heavy metal excess |
| 7 | Disinfection, Hygiene, Workshop, Equipment, Operation | Production hygiene management deficiency |
References
- Peng, S.X.; Zhang, R.X. Optimization of Organizational Model of Public Food Safety Emergency Management in China. Chin. J. Eng. Sci. 2023, 24, 88–98. [Google Scholar] [CrossRef]
- Yasuda, J.K. Why food safety fails in China: The politics of scale. China Q. 2015, 223, 745–769. [Google Scholar] [CrossRef]
- Chai, D.; Meng, T.; Zhang, D. Influence of food safety concerns and satisfaction with government regulation on organic food consumption of Chinese urban residents. Foods 2022, 11, 2965. [Google Scholar] [CrossRef]
- Yang, H.; Tian, Y. Application Research of Machine Learning in Food Safety Risk Early Warning and Sampling Inspection Program. Manag. Rev. 2022, 34, 315. [Google Scholar]
- Zhou, J.; Wei, K.; Jin, Y.; Xu, Z. Food Safety Risk Prediction and Regulatory Policy Implications Based on Machine Learning: Evidence from Fresh Aquatic Products. Issues Agric. Econ. 2024, 5, 4–19. [Google Scholar] [CrossRef]
- Zhou, J.; Jin, Y.; Liang, Q. Effects of Regulatory Policy Mixes on Traceability Adoption in Wholesale Markets: Food Safety Inspection and Information Disclosure. Food Policy 2022, 107, 102218. [Google Scholar] [CrossRef]
- Nogales, A.; Díaz-Morón, R.; García-Tejedor, Á.J. A Comparison of Neural and Non-Neural Machine Learning Models for Food Safety Risk Prediction with European Union RASFF Data. Food Control 2022, 134, 108697. [Google Scholar] [CrossRef]
- Zhang, R.; Zhou, L.; Zuo, M.; Zhang, Q.; Bi, M.; Jin, Q.; Xu, Z. Prediction of Dairy Product Quality Risk Based on Extreme Learning Machine. In Proceedings of the 2018 2nd International Conference on Data Science and Business Analytics (ICDSBA), Changsha, China, 21–23 September 2018; IEEE: Piscataway, NJ, USA, 2018; pp. 448–456. [Google Scholar]
- Alkhawaldeh, I.M.; Albalkhi, I.; Naswhan, A.J. Challenges and limitations of synthetic minority oversampling techniques in machine learning. World J. Methodol. 2023, 13, 373. [Google Scholar] [CrossRef]
- Brabec, J.; Machlica, L. Bad practices in evaluation methodology relevant to class-imbalanced problems. arXiv 2018, arXiv:1812.01388. [Google Scholar] [CrossRef]
- Liu, G.; Li, G.; Yang, R.; Guo, L. Improving Food Safety in Supply Chain Based on Big Data. E3S Web Conf. 2018, 53, 03084. [Google Scholar] [CrossRef]
- Holvoet, K.; Sampers, I.; Seynnaeve, M.; Jacxsens, L.; Uyttendaele, M. Agricultural and Management Practices and Bacterial Contamination in Greenhouse Versus Open Field Lettuce Production. Int. J. Environ. Res. Public Health 2015, 12, 32–63. [Google Scholar] [CrossRef]
- Stoev, S.D. Foodborne Diseases Due to Underestimated Hazard of Joint Mycotoxin Exposure at Low Levels and Possible Risk Assessment. Toxins 2023, 15, 464. [Google Scholar] [CrossRef] [PubMed]
- Lebelo, K.; Malebo, N.; Mochane, M.J.; Masinde, M. Chemical Contamination Pathways and the Food Safety Implications Along the Various Stages of Food Production: A Review. Int. J. Environ. Res. Public Health 2021, 18, 5795. [Google Scholar] [CrossRef] [PubMed]
- Virumbrales, C.; Hernández-Ruiz, R.; Trigo-López, M.; Vallejos, S.; García, J.M. Sensory Polymers: Trends, Challenges, and Prospects Ahead. Sensors 2024, 24, 3852. [Google Scholar] [CrossRef] [PubMed]
- Ibrahim, M.S. Mitigasi Risiko Rantai Pasok Daging Sapi di PT Gizi Pangan Utama Bekasi. Sharia Agribus. J. 2022, 2, 91–146. [Google Scholar] [CrossRef]
- Liu, N.; Mao, A. Food Safety Management System in Star Hotel and Safety Hazards Countermeasures. Adv. J. Food Sci. Technol. 2015, 9, 911–913. [Google Scholar] [CrossRef]
- Majumdar, S. The Role of Food Safety Regulations in Preventing E. coli Contamination in Leafy Greens. Int. J. Agric. Nutr. 2022, 4, 87–90. [Google Scholar] [CrossRef]
- Hernández-Rubio, J.; Pérez-Mesa, J.C.; Piedra-Muñoz, L.; Galdeano-Gómez, E. Determinants of Food Safety Level in Fruit and Vegetable Wholesalers’ Supply Chain: Evidence from Spain and France. Int. J. Environ. Res. Public Health 2018, 15, 2246. [Google Scholar] [CrossRef]
- Colon, C.; Brännström, Å.; Rovenskaya, E.; Dieckmann, U. Fragmentation of Production Amplifies Systemic Risks from Extreme Events in Supply-Chain Networks. PLoS ONE 2020, 15, e0244196. [Google Scholar] [CrossRef]
- Macieira, A.; Barbosa, J.; Teixeira, P. Food Safety in Local Farming of Fruits and Vegetables. Int. J. Environ. Res. Public Health 2021, 18, 9733. [Google Scholar] [CrossRef]
- Aqeel, A.; Abbas, T.; Mirani, Z.A.; Naveed, T.; Ahmed, N.; Basit, A. Seasonal Variation in Microbial Contamination of Various Food Items in Karachi: Microbial Contamination of Various Food. Biol. Sci.-PJSIR 2021, 64, 75–80. [Google Scholar]
- Bianchi, D.M.; Maurella, C.; Lenzi, C.; Fornasiero, M.; Barbaro, A.; Decastelli, L. Influence of Season and Food Type on Bacterial and Entero-Toxigenic Prevalence of Staphylococcus aureus. Toxins 2022, 14, 671. [Google Scholar] [CrossRef]
- Leonard, S.R.; Simko, I.; Mammel, M.K.; Richter, T.K.S.; Brandl, M.T. Seasonality, Shelf Life and Storage Atmosphere Are Main Drivers of the Microbiome and E. coli O157:H7 Colonization of Post-Harvest Lettuce Cultivated in a Major Production Area in California. Environ. Microbiome 2021, 16, 25. [Google Scholar] [CrossRef]
- Smith, B.A.; Meadows, S.; Meyers, R.; Parmley, E.J.; Fazil, A. Seasonality and Zoonotic Foodborne Pathogens in Canada: Relationships Between Climate and Campylobacter, E. coli and Salmonella in Meat Products. Epidemiol. Infect. 2019, 147, e190. [Google Scholar] [CrossRef]
- Marty, L.; de Lauzon-Guillain, B.; Nicklaus, S. Short- and Mid-Term Impacts of COVID-19 Outbreak on the Nutritional Quality and Environmental Impact of Diet. Front. Nutr. 2022, 9, 838351. [Google Scholar] [CrossRef] [PubMed]
- Miller, V.; Webb, P.; Cudhea, F.; Shi, P.; Zhang, J.; Reedy, J.; Erndt-Marino, J.; Coates, J.; Mozaffarian, D.; Global Dietary Database. Global Dietary Quality in 185 Countries from 1990 to 2018 Show Wide Differences by Nation, Age, Education, and Urbanicity. Nat. Food 2022, 3, 694–702. [Google Scholar] [CrossRef] [PubMed]
- Kosola, M.; Kiviniemi, K.; Lundén, J. Factors Affecting Effectiveness of Food Control Inspections in Food Production Establishments in Finland. Sci. Rep. 2022, 12, 4230. [Google Scholar] [CrossRef]
- Li, K.; Yin, S.; Chen, Y. Analysis of Cross-Regional Transfer of Food Safety Risks and Its Influencing Factors—An Empirical Study of Five Provinces in East China. Foods 2023, 12, 1596. [Google Scholar] [CrossRef]
- Amaiach, R.; Lairini, S.; Fadil, M.; Benboubker, M.; Bouslamti, R.; Amrani, S.E.; Lalami, A.E.O. Microbiological Profile and Hygienic Quality of Foodstuffs Marketed in Collective Catering in Central Morocco. Int. J. Food Sci. 2023, 2023, 2820506. [Google Scholar] [CrossRef] [PubMed]
- Legesse, A.; Muluken, A.; Getasew, A. A Survey on Awareness of Consumers About Health Problems of Food Additives in Packaged Foods and Their Attitude Toward Consumption of Packaged Foods: A Case Study at Jimma University. Int. Food Res. J. 2016, 23, 375. [Google Scholar]
- Making, M.S.S.; Ratu, K.; Lada, C.O. The Correlation Between Knowledge and Behavior of Reading Composition Label of Packaged Food on Public 2 JHS and Giovani JHS Students in Kupang. World Nutr. J. 2023, 6, 1–9. [Google Scholar] [CrossRef]
- Sołtysiak, M.; Zając, D. Formation as a Factor in Consumer Demand for Organic Food. Humanit. Soc. Sci. 2022, 29, 51–64. [Google Scholar] [CrossRef]
- Indu, S. A Comparative Study to Assess the Knowledge Regarding Food Adulteration and Its Detection and to Create Awareness Among Homemakers in Selected Rural and Urban Community of Durg District, Chhattisgarh. Pondicherry J. Nurs. 2020, 12, 31–37. [Google Scholar] [CrossRef]
- Wang, H.; Ma, L. Media Coverage and Citizens’ Perceptions of Food Safety in Urban China. China Policy J. 2020, 2, 55–76. [Google Scholar] [CrossRef]
- Moruzzo, R.; Riccioli, F.; Boncinelli, F.; Zhang, Z.; Zhao, J.; Tang, Y.; Tinacci, L.; Massai, T.; Guidi, A. Urban Consumer Trust and Food Certifications in China. Foods 2020, 9, 1153. [Google Scholar] [CrossRef] [PubMed]
- Stoitsis, G.; Papakonstaninou, M.; Karvounis, M.; Manouselis, N. The Role of Big Data and Artificial Intelligence in Food Risk Assessment and Prediction. In Present Knowledge in Food Safety; Elsevier: Amsterdam, The Netherlands, 2023; pp. 1032–1044. [Google Scholar]
- Berrueta, L.A.; Alonso-Salces, R.M.; Héberger, K. Supervised Pattern Recognition in Food Analysis. J. Chromatogr. A 2007, 1158, 196–214. [Google Scholar] [CrossRef] [PubMed]
- Chen, Y.; Wu, C.; Zhang, Q.; Wu, D. Review of Visual Analytics Methods for Food Safety Risks. npj Sci. Food 2023, 7, 49. [Google Scholar] [CrossRef]
- Xiong, Y.; Li, W.; Liu, T. Risk Early Warning of Food Quality Safety in Meat Processing Industry. Int. J. Environ. Res. Public Health 2020, 17, 6579. [Google Scholar] [CrossRef] [PubMed]
- Hao, C.; Zhang, Q.; Wang, S.; Jiang, T.; Dong, W. Prediction of Safety Risk Levels of Benzopyrene Residues in Edible Oils in China Based on the Variable-Weight Combined LSTM-XGBoost Prediction Model. Foods 2023, 12, 2241. [Google Scholar] [CrossRef]
- Song, D.; Hu, G.; Li, H.; Zhao, H.; Wang, Z.; Liu, Y. Real Estate Market Forecasting for Enterprises in First-Tier Cities: Based on Explainable Machine Learning Models. Systems 2025, 13, 513. [Google Scholar] [CrossRef]
- Ma, Y.; Hou, Y.Y.; Liu, Y.S.; Xue, Y.H. Research of Food Safety Risk Assessment Methods Based on Big Data. In Proceedings of the IEEE International Conference on Big Data Analysis, Hangzhou, China, 12–14 March 2016. [Google Scholar]
- Mu, W.; Kleter, G.A.; Bouzembrak, Y.; Dupouy, E.; Frewer, L.J.; Al Natour, F.N.R.; Marvin, H.J.P. Making Food Systems More Resilient to Food Safety Risks by Including Artificial Intelligence, Big Data, and Internet of Things into Food Safety Early Warning and Emerging Risk Identification Tools. Compr. Rev. Food Sci. Food Saf. 2024, 23, e13296. [Google Scholar] [CrossRef] [PubMed]
- Gholami, S.; Knippenberg, E.; Campbell, J.; Andriantsimba, D.; Kamle, A.; Parthasarathy, P.; Sankar, R.; Birge, C.; Ferres, J.L. Food Security Analysis and Forecasting: A Machine Learning Case Study in Southern Malawi. Data Policy 2022, 4, e33. [Google Scholar] [CrossRef]
- Qasrawi, R.; Hoteit, M.; Tayyem, R.; Bookari, K.; Al Sabbah, H.; Kamel, I.; Dashti, S.; Allehdan, S.; Bawadi, H.; Waly, M.; et al. Machine Learning Techniques for the Identification of Risk Factors Associated with Food Insecurity Among Adults in Arab Countries During the COVID-19 Pandemic. BMC Public Health 2023, 23, 1805. [Google Scholar] [CrossRef]
- Chen, Y.; Li, H.; Dou, H.; Wen, H.; Dong, Y. Prediction and Visual Analysis of Food Safety Risk Based on Tabnet-Gra. Foods 2023, 12, 3113. [Google Scholar] [CrossRef]
- Jing, W.; Qian, B.; Yannian, L. Study on Food Safety Risk Based on LightGBM Model: A Review. Food Sci. Technol. 2022, 42, e42021. [Google Scholar] [CrossRef]
- Zhong, J.; Sun, L.; Zuo, E.; Chen, C.; Chen, C.; Jiang, H.; Li, H.; Lv, X. An Ensemble of AHP-EW and AE-RNN for Food Safety Risk Early Warning. PLoS ONE 2023, 18, e0284144. [Google Scholar] [CrossRef] [PubMed]
- Mokal, V.U. Hard Disk Drive Failure Detection Using Hybrid Algorithm. Int. J. Res. Appl. Sci. Eng. Technol. 2021, 9, 1233–1244. [Google Scholar] [CrossRef]


Disclaimer/Publisher’s Note: The statements, opinions and data contained in all publications are solely those of the individual author(s) and contributor(s) and not of MDPI and/or the editor(s). MDPI and/or the editor(s) disclaim responsibility for any injury to people or property resulting from any ideas, methods, instructions or products referred to in the content. |
© 2025 by the authors. Licensee MDPI, Basel, Switzerland. This article is an open access article distributed under the terms and conditions of the Creative Commons Attribution (CC BY) license (https://creativecommons.org/licenses/by/4.0/).