Article

Does Data Asset Information Disclosure Mitigate Supply Chain Risk? Causal Evidence from Double-Debiased Machine Learning

1
Business School, Jiangsu Normal University, Xuzhou 221116, China
2
Sino-Russia College, Jiangsu Normal University, Xuzhou 221116, China
*
Author to whom correspondence should be addressed.
Systems 2025, 13(10), 844; https://doi.org/10.3390/systems13100844
Submission received: 18 August 2025 / Revised: 21 September 2025 / Accepted: 24 September 2025 / Published: 25 September 2025

Abstract

As a vital driver of supply chain management, data has evolved into both a foundational resource and a critical production factor for optimizing supply chains and mitigating risk. This study adopts a four-dimensional framework (i.e., visibility, coordination, flexibility, and redundancy) to investigate how data asset information disclosure (DAID) shapes supply chain risk (SCR). Relative to the existing literature, this paper contributes by examining the determinants of supply chain risk from the perspective of data asset information disclosure and by conducting empirical analyses using double debiased machine learning and causal mediation analysis. The results show that DAID significantly lowers SCR, with results robust to multiple sensitivity checks. Economically, a one-standard-deviation increase in DAID leads to an average decline in SCR of 0.63%. Causal mediation analysis, aligned with the theoretical dimensions, reveals that DAID mitigates SCR through four channels: enhancing information transparency, improving visibility, strengthening agile responsiveness, and increasing supply chain concentration. Heterogeneity tests reveal stronger effects among firms facing fewer financing constraints, operating in more marketized environments, and designated as chain master firms. Further evidence suggests that reduced SCR promotes a greater capacity for coordinated innovation within the supply chain.

1. Introduction

The integration of the expanding intricacy of supply chains and the accelerating frequency of black swan events has heightened firms’ vulnerability to a diverse range of risks. Supply chain risks (SCR), which encompass the combination of inherent uncertainties (operational risk) and major events (disruption risk), affecting the supply chain’s capability to fulfill demand in terms of cost, quality, or timeliness [1], have led to increasingly severe losses and social repercussions for individual firms, as well as for national and global economies. For example, due to the surge in COVID-19 cases, high-exposure sectors in China recorded year-over-year declines of 6.2% in employment, 12.7% in imports, and 21.1% in exports in April 2020 [2]. Moreover, global supply chain disruptions contributed around 60% of the surge in U.S. inflation from early 2021 through 2022 [3]. Amid these circumstances, firms face an urgent imperative to develop innovative strategies that enhance supply chain robustness and adaptive capacity in the face of growing external complexity and uncertainty. Data assets serve as a foundational pillar of the digital economy, functioning as a novel class of strategic productive resources alongside labor, capital, and technology [4]. Via supporting concurrent information dissemination, intelligent decision-making, and resource optimization, data assets facilitate the digital disruption of conventional industries and the emergence of novel digital business models [5,6].
As data assets increasingly become a core component of firms’ intangible resources, their strategic and economic value cannot be fully realized without transparent and credible disclosure mechanisms. Data asset information disclosure not only facilitates market participants’ understanding of a firm’s digital capabilities but also reduces information asymmetry [7], enhances market efficiency [8], and supports data-driven decision-making [9]. National policymakers globally have come to acknowledge the strategic value of data assets and have introduced policies to promote their standardized disclosure. For example, the U.S. implemented the Open Data Policy, which required public government data assets to be published as machine-readable data. China issued the Provisional Regulations on the Accounting Treatment of Corporate Data Resources in 2023, followed by the Guidelines on Strengthening the Management of Data Assets in 2024. These regulatory efforts formally incorporated data assets into corporate disclosure practices and specified their accounting treatment. In practice, China Mobile, the largest wireless carrier in China, had disclosed data assets totaling 616 million yuan by the end of 2024, primarily consisting of intangible assets formed through the capitalization of R&D expenditures related to big data products and AI foundation models. Leveraging its big data platform, China Mobile has accumulated over 2000 PB of data resources, achieved the highest domestic level in data governance, and recorded annual data access volumes in the hundreds of billions. These data assets are widely applied across various sectors, encompassing data governance, emergency management, and smart cultural tourism.
The management of SCR has developed into a comparatively mature body of theory. SCR is shaped by a combination of internal, network, external, and technological factors. Internally, early research claimed that demand and supply uncertainties, production capacity constraints, process inefficiencies, and quality problems increased the likelihood of disruptions [1,10]. At the network level, high supply chain complexity, geographic concentration of facilities, dependency on key suppliers or customers, and weak relational governance heighten vulnerability [11]. Externally, natural disasters, geopolitical instability, public health crises, and macroeconomic volatility can trigger severe operational and disruption risks [12]. Technological and information-related factors, such as limited visibility, weak IT system resilience, and insufficient data analytics capabilities, also impair a supply chain’s ability to anticipate and mitigate the impacts of disruptions [13,14]. Together, these drivers determine the scale and nature of SCR, and they also highlight potential leverage points through which effective risk management strategies can be designed.
Although the literature on the economic consequences of data asset disclosure and the drivers of supply chain risk is extensive, few studies have explored the relationship between the two. Based on the above analysis, this paper poses the following research questions: Does data asset disclosure mitigate supply chain risk? If so, through which channels does it achieve this? Does this effect differ across firms with varying characteristics? Does the reduction in supply chain risk further promote collaborative innovation within the supply chain? Through these questions, this paper aims to explore how data asset disclosure reduces supply chain risk based on the four-dimensional supply chain resilience framework proposed by Christopher and Peck [15], and to provide an in-depth analysis incorporating information asymmetry theory, signaling theory, and the resource-based view.
Specifically, enhanced visibility, achieved through the transparent and timely disclosure of operational and logistical data, enables partners to monitor inventory positions, production schedules, and transport flows in real-time, thereby mitigating demand–supply mismatches and forecasting errors [16]. Improved collaboration, fostered by greater trust in a firm’s data governance and analytics capabilities, facilitates joint planning, information sharing, and coordinated responses to disruptions [17]. Flexibility is strengthened as comprehensive data access allows both ecosystem participants to swiftly reallocate resources, switch suppliers, or adjust production in response to environmental changes [18]. Finally, data assets information disclosure supports redundancy by enabling accurate risk assessment, which can justify investments in safety stock, backup capacity, and geographically diversified sourcing to buffer against unexpected shocks [10]. Through these four resilience capabilities, data assets information disclosure ultimately enhances the supply chain’s capacity to absorb, production function shift, and disruption risks.
To empirically examine this, we employ a double-debiased machine learning (DDML) model, addressing potential endogeneity concerns through omitted variable tests, instrumental variable estimation, and propensity score matching, and conducting a series of robustness checks to validate the findings. To explore the mechanism channels, we perform causal mediation analysis (CMA), selecting mediating variables corresponding to visibility, collaboration, flexibility, and redundancy. Furthermore, we partition the sample into two groups based on financing constraints, marketization level, and chain master status to examine whether the effect varies across different firm characteristics. In extended analysis, we further uncover that alleviating SCR fosters collaborative innovation within the supply chain via the CMA.
The marginal contribution of this paper lies in threefold. First, unlike prior studies that examine only the economic consequences of data assets information disclosure from the aspects of stock market [19] and firms’ decision-making [7,20,21], this study provides the first empirical examination of how DAID influences SCR, uncovering the unique role of data assets in SCR management and expanding the boundary of non-mandatory disclosure research. Second, although technology-related factors have been regarded as the drivers of SCR in prior studies [13,14], we broaden the current research on the driving force of SCR by unleashing a new internal factor (i.e., data assets information disclosure). The CMA further deepens the understanding of the mechanism of SCR and enriches the toolkit for preventing the risks. Finally, our findings offer valuable implications for SCR management, particularly in the context of increasing global uncertainty. Rooted in the theoretical and empirical research, we propose recommendations at the micro, meso, and macro levels to foster a more resilient supply chain. Consequently, this research extends the theoretical frontier in organizational resource allocation and offers policymakers a solid foundation for balancing innovation-driven growth with SCR prevention.
The remainder of this paper is organized as follows. Section 2 reviews the relevant literature and presents the theoretical framework and research hypotheses. Section 3 describes the empirical design. Section 4 reports and analyzes the empirical results. The final section concludes the paper and discusses the implications of the findings, policy recommendations, limitations, and outlook for future work.

2. Literature Review and Hypotheses Development

2.1. Supply Chain Risk and the Bullwhip Effect

The bullwhip effect is a distorted information phenomenon that amplifies demand variability within supply chains [22] and is essentially a form of SCR. Lee et al. formally introduced the concept and identified four classic root causes: demand signal processing, rationing games, order batching, and price fluctuations [23]. Subsequent research confirmed the fundamental role of information sharing in dampening the amplification [24].
The drivers of the bullwhip effect can be classified along two dimensions: internal and external. Internally, we further divide the drivers into behavioral, informational, and financial categories. At the behavioral and decision-making level, managers’ systematic neglect of in-transit inventory and supply line weighting can trigger amplification [25], although its magnitude varies markedly across industries, product categories, and supply chain tiers, indicating that the bullwhip effect is not universally present [26]. At the informational and forecasting level, research has progressed from early emphases on inventory visibility through information sharing [24] and empirical studies on information transmission and decay [27,28], to recent frameworks that incorporate forecast uncertainty itself into measurement and governance [29]. A consensus has emerged that stabilizing and improving the interpretability of forecasts, rather than merely pursuing point accuracy, demonstrates superior efficacy in suppressing the bullwhip effect. On the financial dimension, trade credit within supply chains is strongly shaped by bargaining power. Upstream suppliers may offer more flexible payment terms and credit conditions, which in turn affect firms’ cash flows and inventory management and thereby indirectly influence the propagation of demand fluctuations [30]. In addition, Patil and Prabhu [31] argue that corporate cash flow volatility is amplified along the supply chain, giving rise to a cash flow bullwhip effect.
From the external perspective, we categorize the drivers into structural and geopolitical dimensions. From the structural and external shock perspective, corporate strategies and technological advances are reshaping the phenomenon. For example, servitization in manufacturing alters demand structures and internal coordination [32], while artificial intelligence and data-driven forecasting and collaboration have been shown to effectively smooth the bullwhip effect across diverse industry contexts [29,33]. In summary, a coordinated approach combining behavioral correction, stabilized information and forecasting, and structural collaboration and governance represents the most robust strategy for mitigating the bullwhip effect. From the geopolitical perspective, geopolitical frictions are regarded as major exogenous shocks that often undermine supply chain transparency and trigger inventory adjustments, thereby amplifying demand fluctuations [34]. In strategic industries such as oil and gas, geopolitical risks are particularly salient. Multiple case studies demonstrate that conflicts in production regions and transportation constraints rapidly transmit upstream along the supply chain, magnifying demand volatility [35].
Focusing on disclosure, Wu, et al. [36] find that greater transparency in supply chain ESG mitigates the bullwhip effect. However, ESG disclosures are typically score-based and largely principle-based, with a narrative component, and have limited verifiability; textual intensity can diverge from genuine operational improvements. In contrast, data asset disclosure does not center on financial outcomes or ESG pledges. It concerns the firm’s data assets and its capability to operationalize them. These elements are process-oriented, computable, and verifiable indicators of operational capacity, which differ fundamentally from the post hoc aggregates in financial reporting and the institution-driven objectives emphasized in ESG disclosure.

2.2. Economic Consequences of Data Assets Information Disclosure

From the perspective of capital market mechanisms, disclosure can effectively mitigate information asymmetry, enhance market liquidity, and decrease the cost of capital—an enduring consensus in the economics of disclosure [37,38]. Focusing on data assets, disclosure has been shown to significantly diminish stock price synchronicity [8] and improve pricing efficiency [19]. In terms of external financing, more comprehensive and transparent disclosure of data resources typically lowers the cost of equity capital, eases financing constraints, and improves access to bank lending [7]. At the resource allocation and operational performance level, data asset disclosure is closely associated with improvements in capital market information efficiency, enhanced corporate liquidity, and stronger growth potential [39]. It also facilitates greater credit availability and reduces resource misallocation [40]. Moreover, as a key component of production in the digital economy, Data assets stimulate corporate innovation and green innovation by mitigating financing constraints and facilitating R&D efficiency [41]. This effect can be further reinforced through channels such as improved corporate governance, enhanced reputation, and strengthened legitimacy [42].
However, when there is a substantial gap between the disclosed data assets and a firm’s actual data holdings or exploitable capabilities, disclosure may misguide resource allocation and dampen green innovation capacity [43]. In addition, the institutional framework for data asset accounting and disclosure remains under development, and the absence of unified standards and robust verification mechanisms heightens the risk of selective disclosure [44].

2.3. Hypothesis Development

2.3.1. Data Assets Information Disclosure and Supply Chain Risk

The reasons that data asset information disclosure affects SCR are summarized as follows. First, information asymmetry theory posits that asymmetries in cost information within supply chains are a fundamental source of risk. Parties possessing private information may exaggerate or understate cost data [45], and such asymmetry in cost information can directly undermine supply chain performance [46]. In practice, suppliers often keep their production cost information strictly confidential [47] and may even misreport costs [48]. These information barriers can trigger negative chain reactions, exacerbating the double marginalization effect in supply chains and ultimately creating a risk transmission chain of “information concealment → cost misreporting → imbalanced profit distribution → reduced supply chain efficiency.” Data asset information disclosure drives a shift in cost information from concealment to transparency, directly disrupting this pattern of information asymmetry. Standardized disclosure enables uniform information sharing, allowing all supply chain participants to clearly understand the true production cost structure. This curbs suppliers’ incentives for cost misreporting at the source, mitigates efficiency losses stemming from double marginalization, and cuts off the initial link in the risk transmission process.
From the perspective of signaling theory [49], firms holding informational advantages about their data assets can signal their data management capabilities through disclosure. Data asset information disclosure enables investors to access corporate information at lower cost and with higher efficiency, helping them identify the true value of data assets, better understand a firm’s operational and growth potential, and accurately evaluate and forecast its future development, thereby reducing information asymmetry between investors and firms [39]. This means that transparent disclosure of data assets not only improves investors’ perception of corporate value but also extends this informational advantage beyond firm boundaries, transmitting credible signals to upstream and downstream supply chain partners. In doing so, it helps mitigate collaboration and operational risks in supply chains caused by information asymmetry [50].
According to the resource-based view [51], data can be transformed into information and knowledge, becoming a valuable, rare, inimitable, and non-substitutable resource that generates competitive advantage. Data asset information disclosure is, therefore, not merely the transmission of information but also the conversion of internal resources into risk defense capabilities. Specifically, given the uniqueness of risk assessment data, supply chain partners cannot obtain equivalent information through alternative channels, making them more reliant on cooperation under data disclosure, which significantly reduces default risk arising from a lack of trust. Moreover, the disclosure of data asset information enables firms to identify and manage operational risks within their supply chain. By disclosing data assets, firms can integrate data from various supply chain stages, use data analytics to detect potential risk factors, and convey to supply chain partners their commitment to risk control, thereby reducing operational risk [50]. Simultaneously, firms can leverage these data to enhance supply chain governance processes, improve operational efficiency, and minimize losses from potential risks. Accordingly, we posit the following hypothesis:
Hypothesis 1 (H1).
Ceteris paribus, data asset information disclosure reduces SCR.
In addition, drawing on the theoretical framework developed by Christopher and Peck [15], we posit that visibility, collaboration, flexibility, and redundancy jointly contribute to the management of supply chain risk. Visibility and collaboration enhance supply chain decision-making through greater information transparency and resource integration, while flexibility and redundancy mitigate risk exposure by strengthening the capacity to respond to unexpected disruptions. Data asset disclosure provides the foundational support by improving performance along these dimensions, thereby effectively reducing supply chain risk arising from information asymmetry, forecasting errors, and resource misallocation. Consequently, we examine the mechanisms through which these four dimensions shape the impact of data asset information disclosure on SCR.

2.3.2. Corporate Information Transparency (Visibility)

Data asset information disclosure can increase corporate information transparency, thereby improving supply chain visibility. Information transparency, conceptualized as the degree of corporate information accessibility, interpretability, and disclosure completeness, serves as a fundamental determinant of organizational decision-making efficacy and output quality [52]. By disclosing data asset information, firms enable investors, creditors, and managers to better understand the form and value mechanism of their assets [7], while also allowing input suppliers and output distributors in the supply chain to grasp dynamic changes more accurately, thus improving coordination efficiency across supply chain stages. On this basis, market participants can make more accurate assessments of a firm’s innovation capability and growth potential. Such transparency reduces information asymmetry with external stakeholders and strengthens market trust in the firm.
Enhancing information transparency plays a foundational role in mitigating SCR. In traditional supply chains, information exchange is often confined to adjacent tiers, leading to the progressive distortion of information [36] and exacerbating the bullwhip effect within SCR. By sharing information, supply chain members can coordinate production schedules more accurately and avoid unilateral overreactions caused by information asymmetry [53], thereby reducing the likelihood of SCR. Moreover, transparent information disclosure enables members to anticipate market changes better and reduce irrational decision-making, which strengthens system stability [54], minimizes demand fluctuations, and further lowers SCR. Therefore, we propose the following hypothesis:
Hypothesis 2 (H2).
Data asset information disclosure reduces SCR by enhancing corporate information transparency.

2.3.3. Supply Chain Stability (Collaboration)

Data asset information disclosure can enhance supply chain stability. High-quality disclosure of data assets conveys the firm’s true operational status and risk profile to suppliers, customers, and other supply chain partners. Such information sharing, grounded in data asset disclosure, reduces information asymmetry, strengthens trust among supply chain participants, fosters more efficient collaboration, and reinforces partners’ recognition of the firm’s reliability [55], thereby providing a trust foundation for maintaining supply chain stability.
Enhancing supply chain stability can effectively decrease SCR. The stability of a supply chain depends on trust-based governance mechanisms in buyer-supplier ecosystems [56]. Such trust mitigates suspicion and uncertainty in cooperation, thereby reducing the risk of supply chain disruptions. Moreover, improved supply chain stability standardizes information transmission and decision-making processes, reducing the generation and propagation of order fluctuations at the source [57]. This stable state, underpinned by information transparency, directly weakens the drivers of fluctuation amplification [58], ultimately alleviating SCR.
Hypothesis 3 (H3).
Data asset information disclosure reduces SCR by enhancing supply chain stability.

2.3.4. Supply Chain Agility (Flexibility)

Data asset information disclosure can significantly enhance a firm’s agility, that is, its operational flexibility. As the transparency and processing efficiency of data assets improve, firms can respond to market changes more rapidly and accurately, enabling dynamic optimization of resource allocation and scheduling [59]. Concurrently, data asset information disclosure helps firms optimize inventory management and improve inventory turnover. This inventory-level flexibility frees production systems from rigid constraints, allowing firms to rapidly adjust production batches in response to match consumption patterns [60], ultimately achieving agile responses to market dynamics.
Enhancing a firm’s agility can reduce SCR. Strategic flexibility, as the core of agility, enables firms to break rigid constraints, flexibly expand or switch suppliers to mitigate capacity constraint risks, and avoid resource misallocation, thereby reducing problems of excess inventory or stockouts [61]. In addition, agility also manifests in operational flexibility, allowing firms to move beyond rigid batch-ordering strategies and leverage joint inventory management to reallocate stock dynamically. This reduces the amplification of order fluctuations, enabling rapid responses to sudden demand changes and lowering the risk associated with order volatility [61].
Hypothesis 4 (H4).
Data asset information disclosure reduces SCR by enhancing agility.

2.3.5. Supply Chain Concentration (Redundancy)

Data asset information disclosure can increase supply chain concentration. When core firms disclose data assets, they enhance their capabilities in data governance, analysis, and utilization, thereby extracting and converting the value of disclosed information more effectively and strengthening their bargaining power and dominance within the supply chain. However, this also intensifies information asymmetry between core firms and small and medium-sized enterprises (SMEs). Given that SMEs already exhibit strong resource dependence on core firms [62], the reinforcement of informational advantages further amplifies this dependency, driving greater resource aggregation toward core firms and ultimately increasing supply chain concentration.
Increasing supply chain concentration helps reduce SCR primarily by optimizing redundancy and improving the accuracy of information flows. Distorted information and insufficient processing capacity are core drivers of the bullwhip effect in SCR [63]. Higher supply chain concentration can streamline information flow paths, reduce delays and distortions caused by redundant suppliers, and thereby improve information transmission. Additionally, greater supplier concentration suggests closer relationships between core firms and their upstream and downstream partners [64]. This enhances overall information processing efficiency and prevents forecast errors that may arise when redundant suppliers act independently, ultimately mitigating SCR.
Hypothesis 5 (H5).
Data asset information disclosure reduces SCR by increasing supply chain concentration.
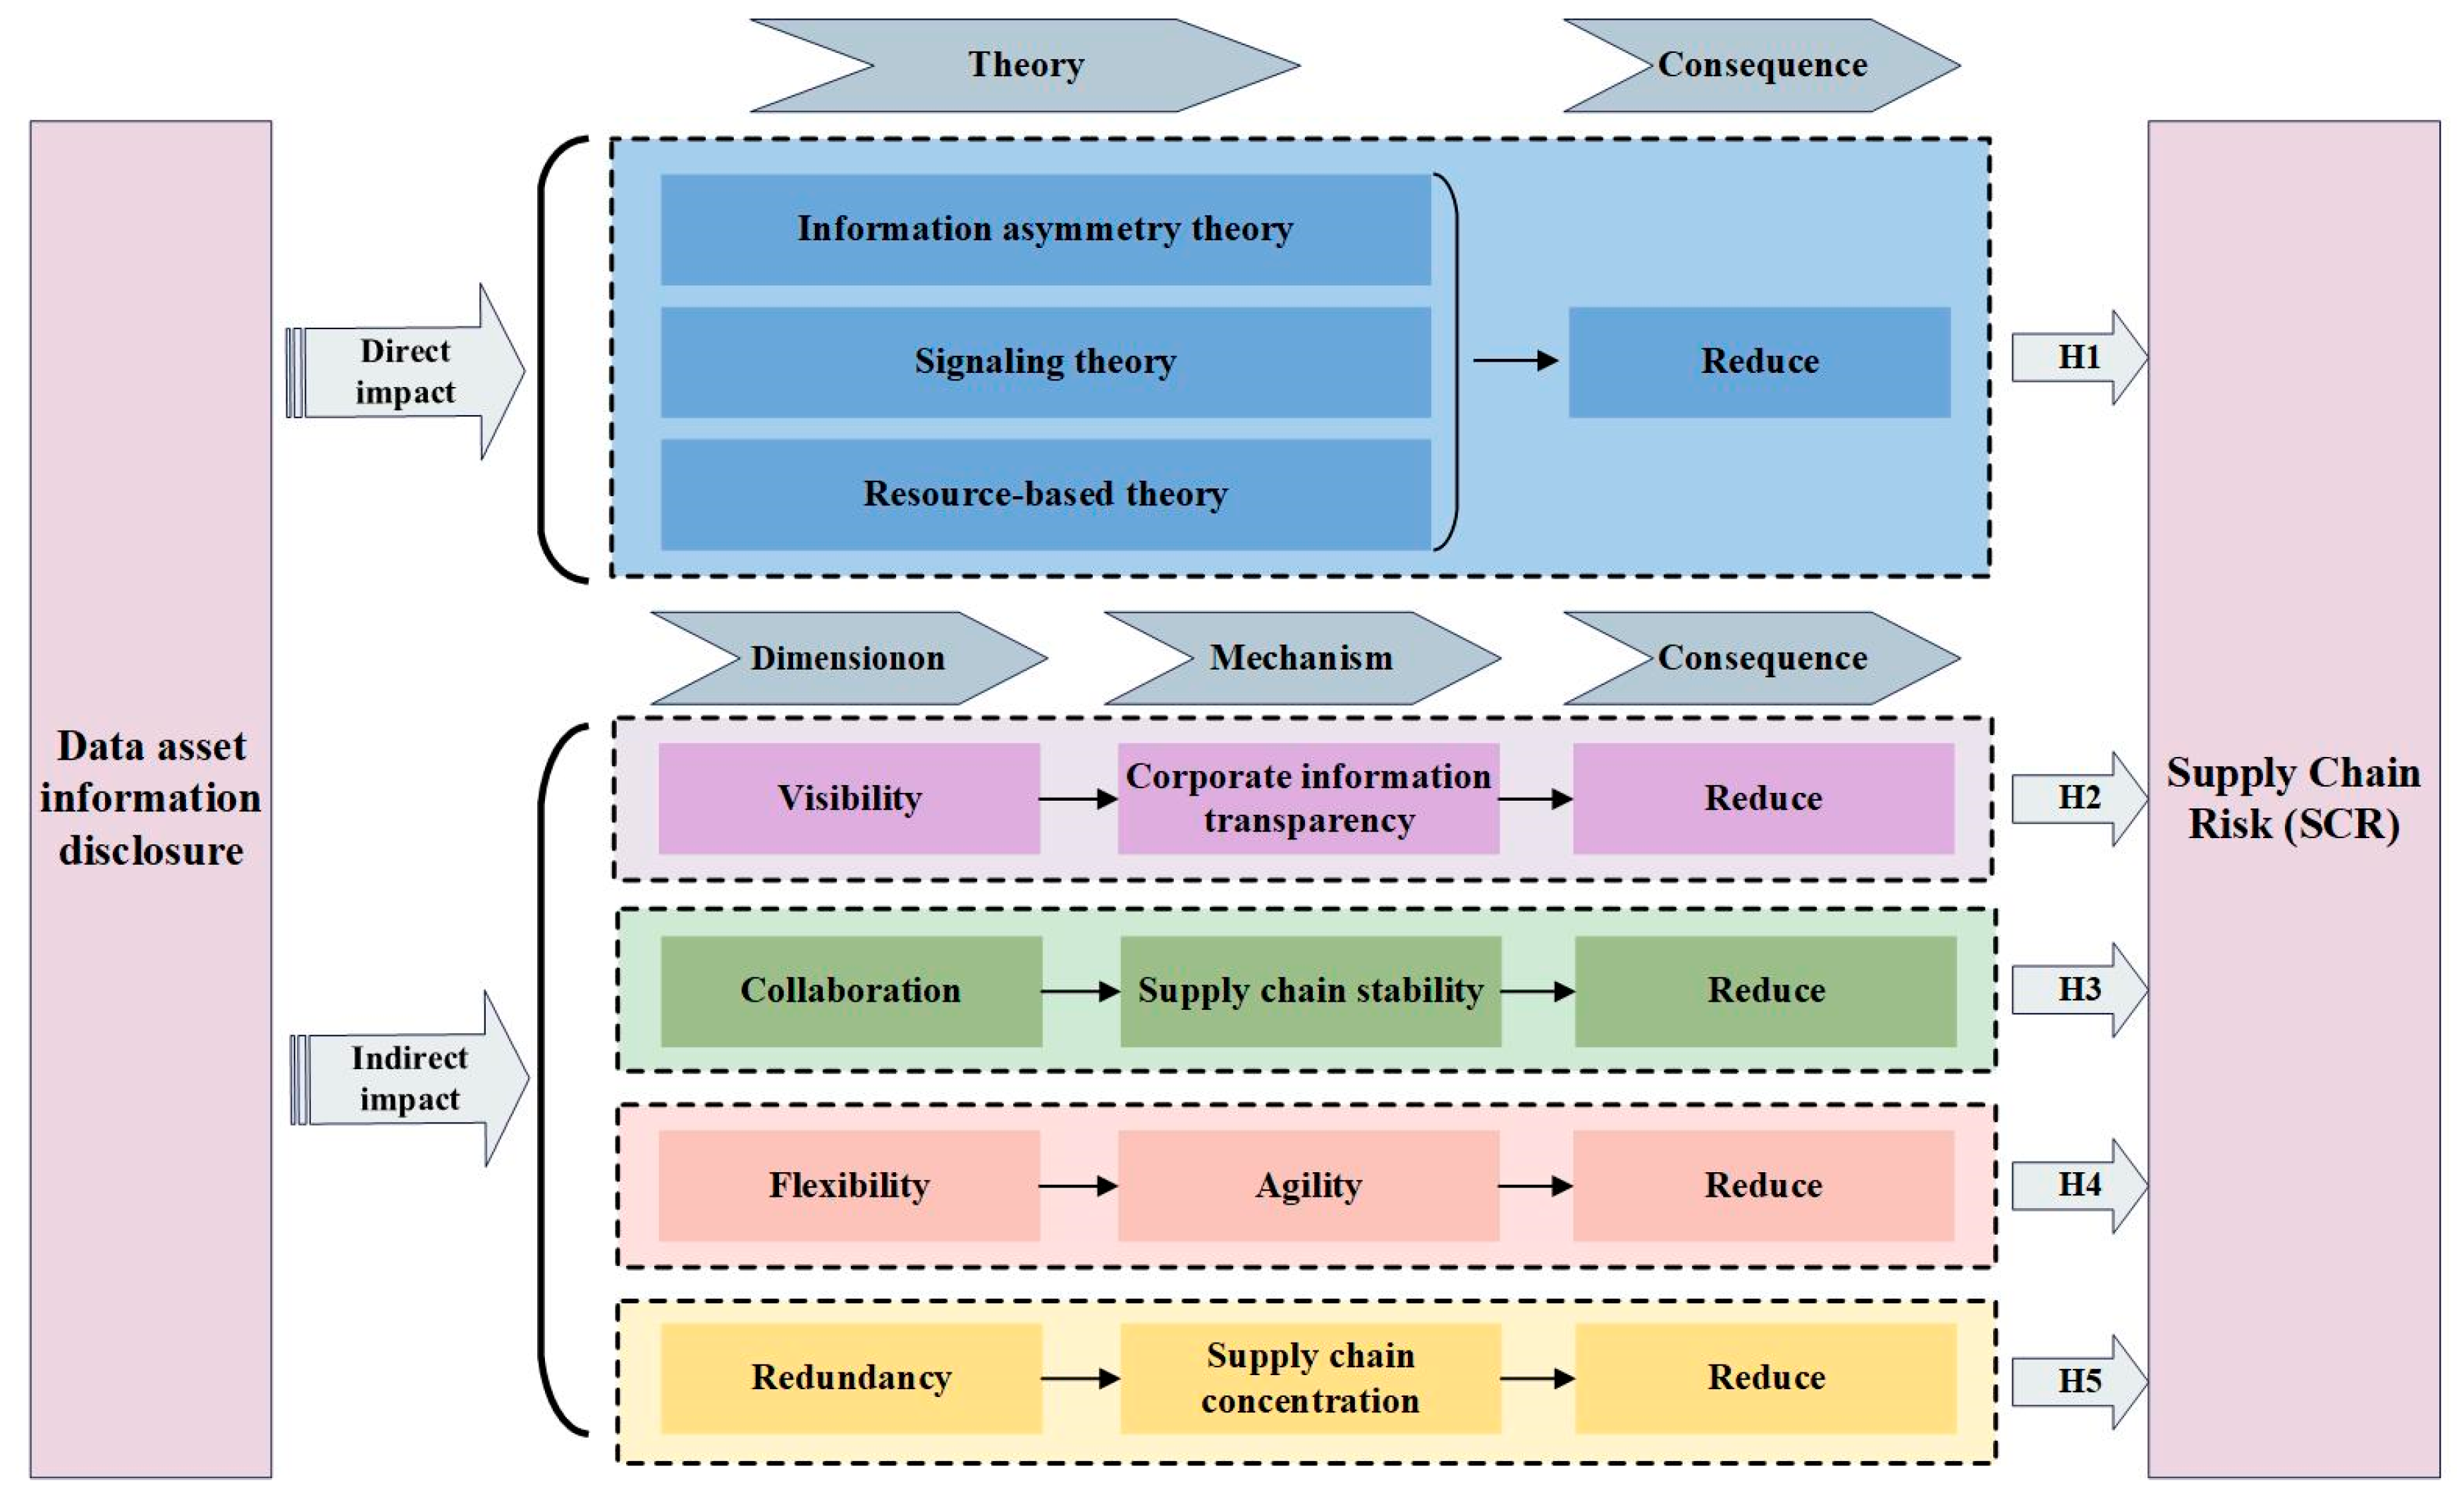
Figure 1 presents the theoretical framework of the influence of data asset information disclosure on SCR.

3. Empirical Design

3.1. Data

Our analysis draws upon the universe of A-share firms listed on the Shanghai and Shenzhen Stock Exchanges over the period 2010–2024. Information on data asset disclosures is obtained from firms’ annual reports, whereas all remaining financial variables are compiled from the Wind and CSMAR databases.
To ensure the reliability of the dataset, a series of preprocessing steps is undertaken. First, firms classified as ST, *ST, or PT are removed from the sample. Second, all companies operating in the financial sector are excluded. Third, we drop those with a listing history of fewer than three years. Fourth, only firms with data available for at least three consecutive years are retained. Finally, all continuous variables are winsorized at the 1st and 99th percentiles.

3.2. Variables

3.2.1. Supply Chain Risk

An imbalance between upstream supply and downstream demand in core enterprise-led supply chains can trigger SCR. Accordingly, following Shan, et al. [65], this study measures SCR (SCR) by the degree of divergence between a firm’s production volatility and demand volatility. SCR here is a positive indicator. The specific construction is as follows:
S C R i , t = σ P r o d u c t i o n i , t σ D e m a n d i , t
where σ P r o d u c t i o n i , t denotes the standard deviation (SD) of a firm’s quarterly output, calculated as the sum of quarterly cost of goods sold and quarterly net inventory. Here, σ D e m a n d i , t refers to the SD of a firm’s quarterly sales, measured as the total of revenue from principal operations and other business income. Both quarterly output and quarterly sales are log-transformed and first-differenced prior to computing the SD.

3.2.2. Data Assets Information Disclosure

Adopting the approach of Shi, Xia, Li, Hua and Fu [43], we apply a text-mining technique to quantify the extent of data asset information disclosure. Using an initial seed lexicon together with a semantic similarity tool, we compile an extensive dictionary pertaining to data assets. The disclosure measure is subsequently derived by computing the occurrence frequency of these terms within firms’ annual reports.
To build a lexicon of semantically related expressions, this study inputs the seed terms “data assets” and “data resources” into the Word2Vec model. Only those with a similarity coefficient exceeding 0.5 are retained in the final keyword list to ensure precise measurement of data asset information disclosure. The widely adopted term-frequency method [7] sums the frequencies of all identified keywords, implicitly treating seed words and weakly related terms as equally important. We argue that this assumption neglects the degree of semantic proximity between each keyword and the seed terms. Accordingly, we enhance the conventional approach by applying a weighted average frequency method, assigning each term a weight proportional to its similarity score with the seed words generated by the Word2Vec model. The weighted frequencies are subsequently employed to quantify the extent of corporate data asset information disclosure as follows:
D A I D i , t = F r e i , t , n × S i m n T o t a l F r e i , t × 100 ,
where subscript i and t denote firm i at year t. Here, D A I D denotes the measure of data asset information disclosure normalized by the total number of words excluding English terms and numerical values, i.e., T o t a l F r e . Moreover, F r e i , t , n denotes the frequency of the n-th keyword in the dictionary (see the Appendix A for details). S i m n herein reflects the similarity between the n-th word and seeds, with the similarity of the seed words itself set to 1.

3.2.3. Control Variables

Following Ning and Yao [66], this study selects control variables (CVs) from the perspectives of corporate operating conditions, operational performance, and market competitiveness. First, leverage and cash flow influence a firm’s capacity to withstand risk; therefore, we include the debt-to-asset ratio (LEV) and operating cash flow (Cashflow). Second, firms with stronger profitability and higher operating efficiency are better positioned to adjust and optimize their supply chains, leading us to incorporate return on assets (ROA) and asset turnover (ATO). Finally, companies with greater competitiveness are more likely to secure high-quality suppliers and maintain stable partnerships within the supply chain, so we include firm size (Size) and CEO duality (DUAL).

3.3. Double-Debiased Machine Learning

Following Ma, et al. [67], we employ the DDML approach to more flexibly handle high-dimensional control variables, capture nonlinear relationships, and incorporate interaction effects, thereby reducing the likelihood of model misspecification. We specify the following partially linear model:
S C R = a × D A I D + u X + M ,
D A I D = v X + N ,
where M and N denote the error terms. X includes one-year-lagged CVs, along with year- and industry- fixed effects. Moreover, this method imposes no further structural assumptions on u and v , allowing their estimation in a nonparametric manner.
Under the conditional Neyman orthogonality assumption, we can estimate the uniform marginal effect a :
a = E ( S C R l X ) ( D A I D v ( X ) ) E [ ( D A I D v ( X ) ) 2 ] ,
where v X E [ D | X ] and l X E [ Y | X ] . To derive the two conditional expectation functions and avoid the biases arising from overfitting, DDML employs a K-fold cross-fitting under machine learning methods. Concretely, DDML randomly splits the sample into K evenly-sized folds I 1 ,   I 2 ,   ,   I K . For each fold k, the conditional expectations l and m are estimated using I k c , which denotes only observations not in the k-th fold. The estimates are symbolled as l ^ I k c and v ^ I k c . The predictions of sample i in the k-th fold are then derived via l ^ I k c ( X i ) and v ^ I k c ( X i ) . The process loops for all folds, and the conditional average treatment effect a is calculated as:
a ^ n = 1 n i = 1 n ( Y i l ^ I k i c ( X i ) ) ( D A I D i v ^ I k i c ( X i ) ) 1 n i = 1 n ( D A I D i v ^ I k i c ( X i ) ) 2 ,
where k i presents the fold of the i-th observation. We use several alternative numbers of K and different machine learning methods to provide robustness results in this paper.
To provide a comparison with the DDML approach, we also establish the following TWFE model:
S C R i , t = β 0 + β 1 D A I D i , t 1 + γ C o n t r o l i , t 1 + μ t + υ c + ε i , t ,
where the C o n t r o l denotes the set of CVs. Here, μ t and υ c , respectively, symbolize the year- and industry-fixed-effects. ε herein is the error term. Notably, to mitigate endogeneity concerns, the core explanatory variable and CVs are lagged by one period.

3.4. Descriptive Statistics

Table 1 displays the descriptive statistics of the main variables. The dependent variable, SCR, has a mean of 0.950, close to 1, indicating that SCR is generally at a high level. Its maximum value of 1.856 is far above the mean, suggesting a right-skewed distribution in which a small number of firms face substantial SCR, thereby raising the average. The core explanatory variable, DAID, has a mean of 0.001 and a maximum of 0.047, also revealing pronounced right skewness. This implies that only a few firms exhibit high levels of disclosure, while most have yet to recognize the importance of data asset information disclosure. This finding is consistent with the results of Li, Wang and Zheng [20].

4. Empirical Results

4.1. Results of Baseline Regression

The baseline regression results are reported in Table 2. First, we estimate the model using the DDML framework with the XGBoost (XGB) algorithm and a 5-fold cross-fitting procedure. Column (1) presents the DDML estimates, where the coefficient of DAID is −1.203 (p < 0.01), demonstrating that data asset information disclosure significantly reduces SCR, thus supporting H1. From an economic perspective, a one standard deviation increase in DAID leads to an average decline in SCR of 0.63% (−1.203 × 0.005/0.950). This shift implies that by enhancing DAID, firms can, to some extent, mitigate the impact of SCR. For management, this suggests that the transparency and systematic disclosure of data assets can significantly strengthen supply chain resilience and reduce potential operational disruptions. From a policy perspective, this result underscores the substantial risk-mitigation effects that policy interventions promoting data asset disclosure can have for firms, particularly in the face of increasing external uncertainty and complexity. Policymakers should consider data disclosure as a key strategy for improving supply chain stability and reducing economic losses. A plausible explanation is that data asset information disclosure enhances the availability and transparency of information among upstream and downstream partners, enabling supply chain members to more accurately forecast changes in demand and supply, thereby mitigating volatility and reducing SCR arising from delayed or distorted information.
To assess the robustness of this finding, we conduct several supplementary regressions. First, we cluster the standard errors at the firm, industry, city, and provincial levels, as reported in Columns (2)–(5) of Table 2, and the coefficients remain significantly negative at the 1% level. Second, to account for the influence of local industrial bases and macroeconomic policies, we add city and provincial fixed effects separately. As shown in Columns (6)–(7), the results remain robust and significant after controlling for these fixed effects.
Moreover, we re-estimate the relationship using the conventional TWFE model. As shown in Column (8), the coefficient of DAID is −1.591 and remains significantly negative at the 1% level, confirming that our conclusions are not driven by model specification.

4.2. Potential Endogeneity Issues

4.2.1. Omitted Variable Bias

To evaluate the potential bias arising from unobserved omitted variables, we adopt the method of Oster [68] and present both the upper and lower bounds of the true β coefficient, assuming δ = 1 , along with the δ value required for unobserved factors to entirely offset the estimated effect. The lower bound of the true β coefficient is derived under two conditions. First, the R 2 of Equation (7) is assumed to rise to 130% of its current level if unobserved variables were incorporated. Second, δ is set to 1, implying that the influence of unobserved factors is equivalent to that of the observed controls. The upper bound corresponds to the baseline estimate without adjustment.
Column (8) of Table 2 reveals that the true β is likely bounded within the interval [−1.591, −0.853]. The two conditions proposed by Oster [68] for testing coefficient robustness show that the 99.5% confidence interval of β is [−2.446, −0.736], which contains the likely bounds [−1.591, −0.853]. Second, the interval does not include zero. Additionally, we report a δ value of 1.862, indicating that for the true β to be zero, the impact of unobserved variables would be at least 1.862 times greater than that of the observed covariates. Therefore, we conclude that the impact of unobserved variables is unlikely to overturn our results, thereby confirming the robustness of our findings.

4.2.2. Instrumental Variable Approach

Although the explanatory variable is lagged in the model specification to mitigate endogeneity, confounding factors that simultaneously affect both variables may still exist. To address the potential bidirectional causality between data asset information disclosure and SCR, we employ an instrumental variable approach, specifying the following partially linear model:
S C R = a × D A I D + u X + M ,
Z = v X + N .
where Z denotes the IV. As a is the parameter of interest, the IV approaches use Z to identify a .
First, following Nunn and Qian [69], we construct IV1 as the product of local science and technology expenditure and the average DAID of other firms within the same industry.
Second, following Qian, Pan and Liang [7], we use the degree of digital transformation as IV2. Specifically, we adopt the approach of Chen, et al. [70] and employ the digital transformation indicators from the CSMAR database.
The rationale for selecting these two instrumental variables is as follows. First, in terms of relevance, both local science and technology expenditure and the degree of digital transformation capture the level of regional digital infrastructure, which can influence a firm’s data asset information disclosure. Second, regarding exogeneity, both variables are policy-driven and independent of firms’ own decision-making.
As reported in Columns (1) and (2) of Table 3, the coefficients of DAID remain significantly negative. Moreover, a series of diagnostic tests confirms the validity of the instrumental variables. The Sanderson-Windmeijer F test indicates strong relevance, while the Cragg-Donald Wald F test and the Kleibergen-Paap rk Wald F test show that the weak IV hypothesis can be rejected. The Kleibergen-Paap rk Wald F test also confirms that the model passes the underidentification test. These results indicate that, after addressing endogeneity concerns, data asset information disclosure continues to reduce SCR significantly.

4.3. Robustness Tests

To validate the robustness of the empirical research, we further conduct a series of additional robustness checks employing multiple methodological approaches.

4.3.1. Alternative Model Specifications

First, we conduct a robustness test utilizing the Difference-in-Differences (DID) approach. In 2014, China’s Government Work Report introduced the concept of “Big Data”, after which the development of data trading platforms accelerated markedly. Such policy initiatives provide fundamental infrastructure for data supply, which is anticipated to have a significant effect on the level of data asset information disclosure. Specifically, between 2015 and 2016, a total of twelve data exchanges were established nationwide. By 2021, platforms in cities such as Beijing, Shanghai, and Shenzhen had gone online, signaling the country’s heightened emphasis on data trading.
In this study, the data trading platform policy is treated as a quasi-natural experiment. Firms located in pilot cities are assigned to the treatment group, while those in non-pilot areas form the control group. Given the phased rollout of this policy across regions, we construct the policy variable DataTrade to capture the interaction between treatment status and the timing of implementation. This variable serves as the key explanatory term in the staggered DID framework, which is specified as follows:
S C R i , t = β 0 + β 1 D a t a T r a d e i , t 1 + γ C o n t r o l i , t 1 + μ t + υ c + ε i , t ,
where D a t a T r a d e i , t 1 is a dummy variable that equals 1 if firm i is located in a city designated as a pilot area in year t −1, and 0 otherwise.
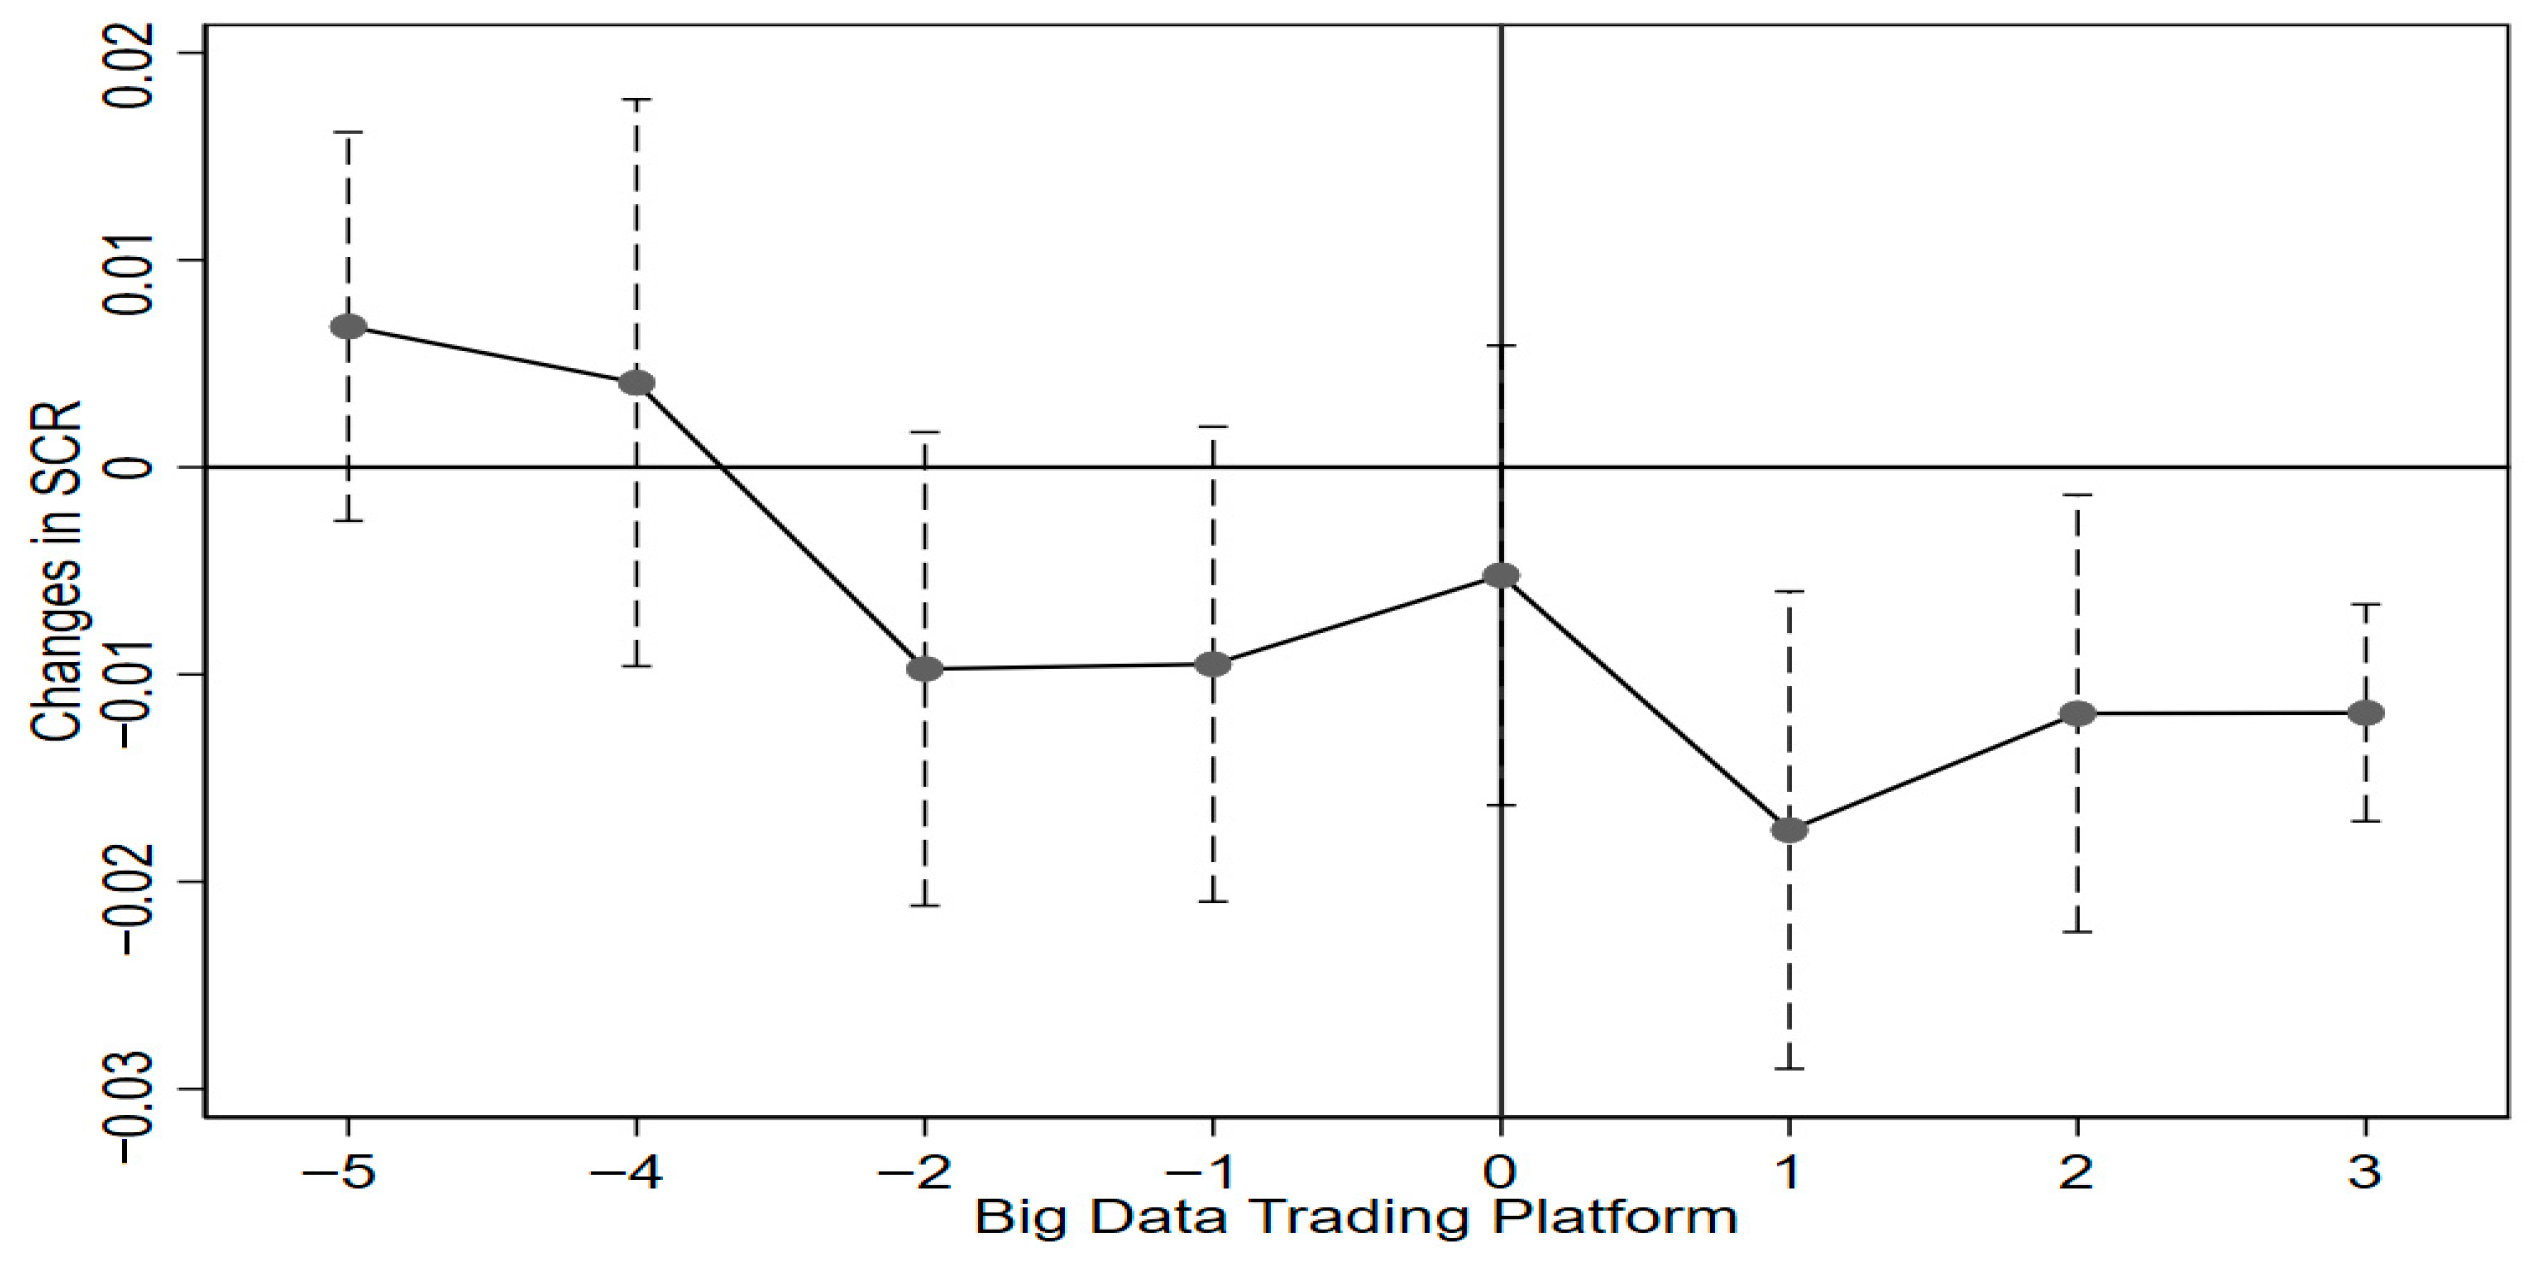
As shown in Column (3) of Table 3, β 1 is −0.009 (p < 0.01). In addition, we conduct a parallel trends test, with the results presented in Figure 2. The dashed lines represent the 90% confidence intervals for the estimated policy effects in each year. Using the year of the data trading platform pilot implementation as the benchmark, all pre-treatment confidence intervals include zero, indicating that the changes in supply chain risk for the treatment and control groups followed a similar trajectory prior to policy implementation, thereby supporting the parallel trends assumption. In contrast, all post-treatment confidence intervals exclude zero, suggesting that the policy effect is statistically significant.
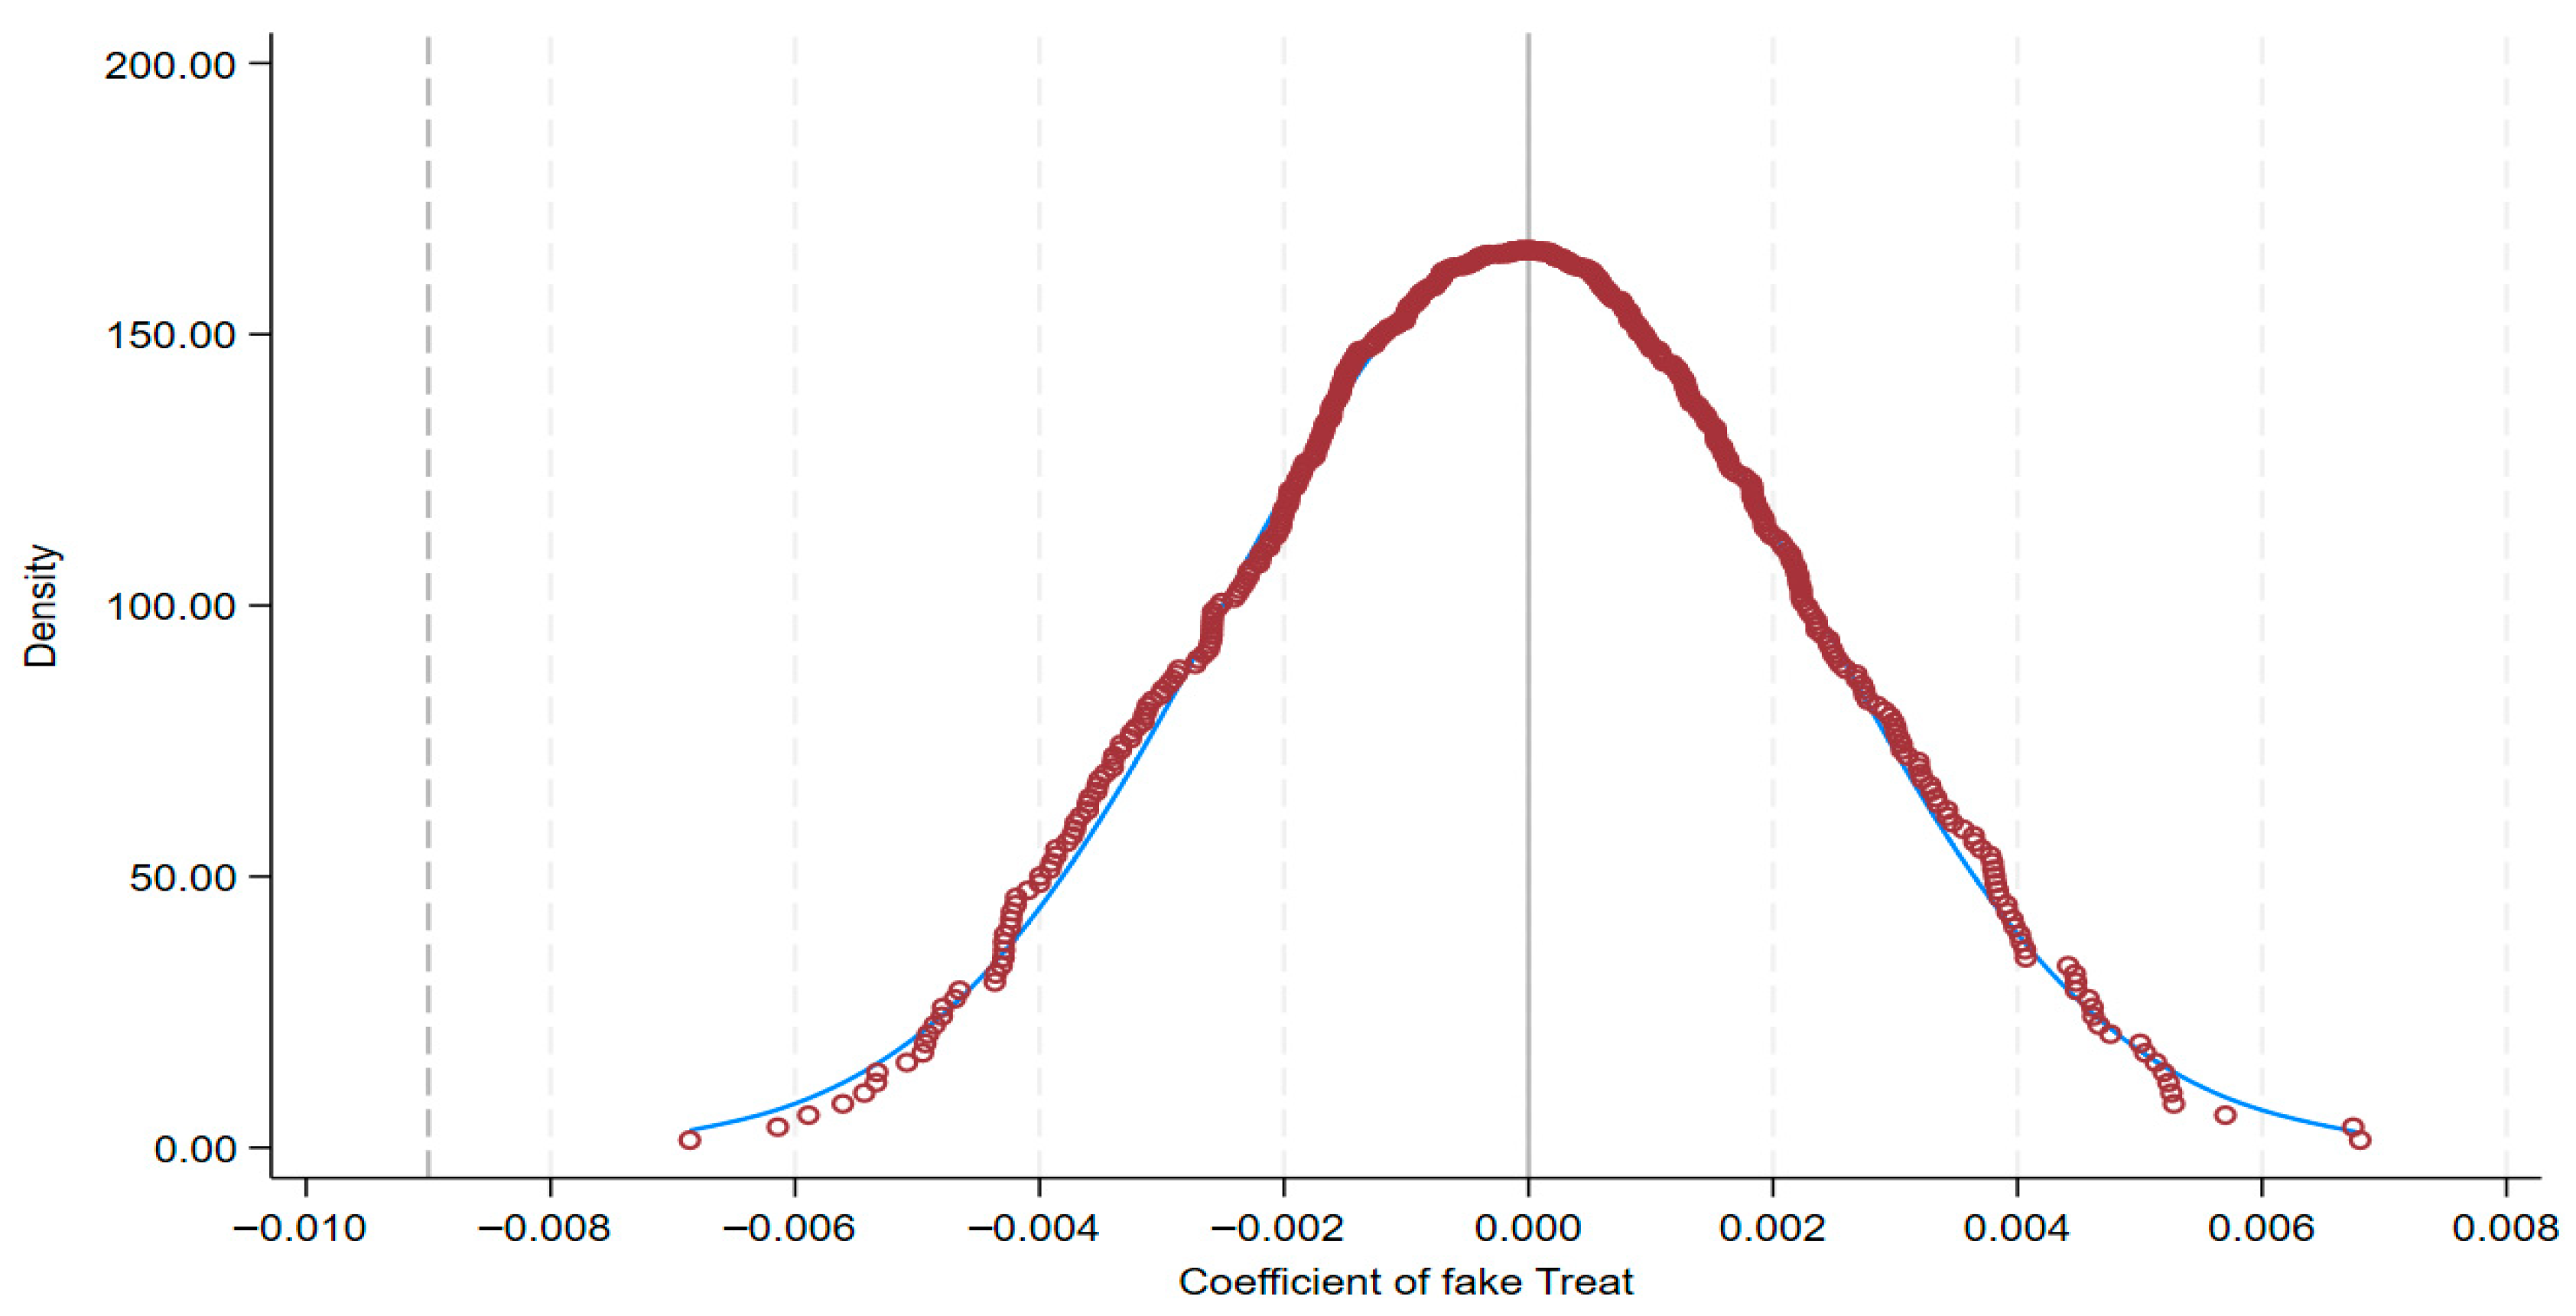
Furthermore, to rule out the influence of omitted variables, we perform a placebo test. Specifically, we implement a permutation-based placebo procedure by randomly assigning treatment status and re-estimating the coefficient 500 times. The distribution of these coefficients, shown in Figure 3, is approximately normal and centered around zero, lying far from the β 1 estimate reported in Equation (10). These results indicate that the DID estimates in this study are highly unlikely to be driven by omitted variable bias.

4.3.2. Alternative Dependent Variable

Following Yang, et al. [71], we recalculate SCR by replacing quarterly sales with quarterly cost of goods sold to measure production volatility in the SCR computation. The regression results using the recalculated SCR are reported in Column (4) of Table 3, where the coefficient of DAID is −1.375 (p < 0.01), providing further support for H1.

4.3.3. Alternative Explanatory Variable

As noted earlier, DAID is measured from annual reports, reflecting a firm’s overall operational and financial status. In contrast, the Management Discussion and Analysis (MD&A) section focuses on managerial strategic intentions, offering deeper insights into responses to internal and external environments [72]. Accordingly, we re-estimate DAID based on MD&A text for robustness testing. The results, reported in Column (5) of Table 3, show that the coefficient of DAID is −0.065 (p < 0.01), confirming the robustness of our findings.

4.3.4. Additional Robustness Checks

To further verify the robustness of our conclusions, we conduct a propensity score matching test as well as a series of additional robustness checks. For the sake of brevity, these two parts are presented in Appendix B and Appendix C, respectively.

4.4. Potential Channels

Based on the preceding analysis, we have established that data asset information disclosure reduces SCR. To uncover the underlying pathways through which it affects SCR, this section conducts a mechanism analysis. As outlined earlier, the theoretical framework posits that data asset information disclosure influences SCR through four dimensions: visibility, collaboration, flexibility, and redundancy. Corresponding indicators are selected for each dimension.
For visibility, given that information asymmetry is a major source of SCR, we use corporate information transparency (Opaque) as the indicator. For collaboration, stable supply chain relationships help strengthen trust and cooperation between upstream and downstream partners, facilitating information sharing and joint decision-making. We therefore adopt supply chain stability as the measure of collaboration, which comprises supplier stability (Supp_ST) and customer stability (Cus_ST). For flexibility, high agility enables firms to quickly adjust and reduce risk when facing demand fluctuations, and we thus use corporate agility (Agility) as the indicator. For redundancy, which is reflected in the structural configuration of the supply chain, we employ supply chain concentration (SCC) as an important structural measure.
Building on the above analysis, this study employs the CMA approach to empirically test the four proposed transmission mechanisms, following Shi, Xia, Li, Hua and Fu [43]. This method enables us to separate the direct effect of data assets information disclosure on corporate green innovation bubbles and its indirect effects through the identified mediating channels. The specific econometric models are constructed as follows:
T r e a t m e n t   g r o u p   ( D i r e c t ) = E Y 1 , M 1 Y 0 , M 1 ,
C o n t r o l   g r o u p   ( D i r e c t ) = E Y 1 , M 0 Y 0 , M 0 ,
T r e a t m e n t   g r o u p   ( I n d i r e c t ) = E Y 1 , M 1 Y 1 , M 0 ,
C o n t r o l   g r o u p   ( I n d i r e c t ) = E Y 0 , M 1 Y 0 , M 0 .

4.4.1. Corporate Information Transparency

Following Hutton, et al. [73], we measure corporate information transparency (Opaque) using accounting earnings transparency. A higher value of Opaque indicates lower information transparency. The CMA results are reported in Table 4. Both the total effect and the direct effect are significantly negative, suggesting that data asset information disclosure reduces SCR, thereby providing further support for H1. Notably, the indirect effect for the control group is significantly positive, implying that firms with insufficient data asset information disclosure may exacerbate information asymmetry, thereby increasing SCR. In contrast, the indirect effect for the treatment group is negative, indicating that firms with high levels of data asset information disclosure can mitigate SCR by enhancing corporate information transparency, thus supporting H2.

4.4.2. Supply Chain Stability

To examine whether data asset information disclosure can reduce SCR by enhancing supply chain stability, we follow Tu, et al. [74] and measure stability from two aspects: supplier stability (Supp_ST) and customer stability (Cus_ST). Supp_ST is measured as the number of the firm’s top five suppliers in the current year that also appeared in the previous year, divided by five. Cus_ST is measured as the number of the firm’s top five customers in the current year that also appeared in the previous year, divided by five. The CMA results, presented in Table 4, show that the total, direct, and indirect effects are all negative. These findings not only confirm H1 but also demonstrate that data asset information disclosure can improve supply chain stability by strengthening both supplier and customer relationship stability, thereby reducing SCR, providing support for H3.

4.4.3. Agility

To test H4, we follow Fan and Pan [75] and measure corporate agility (Agility) using the number of board meetings in the current period. Major decisions in modern firms, particularly publicly listed companies, are made through board discussions. Board meetings serve as a key forum for analyzing critical issues and making high-quality decisions, making them a good indicator of a firm’s responsiveness to external shocks. A higher Agility value indicates a faster response to external changes. The CMA results, reported in Table 4, show that both the total effect and the direct effect for the treatment group are significantly negative, indicating that data asset information disclosure significantly reduces SCR. The indirect effects are also significantly negative, suggesting that regardless of the level of data asset information disclosure, it reduces SCR by enhancing agility, thus supporting H4.

4.4.4. Supply Chain Concentration

To investigate the mechanism of supply chain concentration (SCC), we follow Jiang, et al. [76] and measure SCC as the average of the combined proportions of purchases from and sales to the top five suppliers and customers. A higher SCC value indicates a more concentrated supply chain. As shown in Table 4, both the total effect and the direct effect are significantly negative, supporting H1. Regarding the indirect effect, the coefficient for the treatment group is significantly negative, confirming H5, whereas the result for the control group is not significant. A possible explanation for this difference is that firms with high disclosure levels often possess stronger risk management capabilities, enabling them to complement high concentration with backup capacity and emergency inventories to better mitigate risks. In contrast, for firms with low disclosure levels, the lack of transparency hinders accurate assessment of operational stability, and concentration may even be perceived as a source of risk.
Table 4. Results of causal mediation effect.
(1)(2)(3)(4)(5)
VariablesTotal EffectTreatment Group (Direct)Control Group (Direct)Treatment Group (Indirect)Control Group (Indirect)
Opaque−0.037 ***−0.039 ***−0.032 ***−0.005 *0.002 **
(0.011)(0.011)(0.011)(0.003)(0.001)
Supp_ST−0.16 ***−0.105 **−0.135 ***−0.025 ***−0.055 ***
(0.046)(0.047)(0.046)(0.010)(0.008)
Cus_ST−0.138 ***−0.140 ***−0.122 **−0.016 ***0.001 ***
(0.048)(0.048)(0.048)(0.004)(0.000)
Agility−0.040 ***−0.039 ***−0.024−0.017 ***−0.002 **
(0.012)(0.012)(0.015)(0.006)(0.001)
SCC−0.065 ***−0.061 ***−0.052 ***−0.013 *−0.004
(0.022)(0.020)(0.017)(0.007)(0.003)
Note: Robust standard errors are reported in parentheses. *** p < 0.01; ** p < 0.05; * p < 0.1.

4.5. Heterogeneity Analysis

4.5.1. Financing Constraints

The mitigating effect of data information disclosure on SCR varies with the level of financing constraints faced by firms. Enterprises with low financing constraints typically possess more abundant capital, enabling them to make sustained investments in digital infrastructure and enhance their disclosure systems [77]. High-quality disclosure reduces uncertainty for suppliers, allowing upstream and downstream partners to coordinate operational rhythms, schedule production more effectively, and lower the risk of supply disruptions [13]. In contrast, firms with high financing constraints suffer from tight internal cash flows and limited access to external financing. To survive, they often prioritize allocating scarce resources to day-to-day operations rather than committing to high-risk, long-term digital strategies. When the quality and credibility of disclosure deteriorate, these firms face a persistent risk of cash flow breakdowns, which, in turn, diminishes the behavioral propensity of supply chain partners to rely on their information [78].
Based on the above analysis, we divide the sample into two subsamples, high financing constraints (High_FC) and low financing constraints (Low_FC), according to the median value of the KZ index. The specific data for the KZ index are obtained from the CSMAR database. A higher KZ index indicates a greater degree of financing constraint. We then run regressions separately for the two subsamples. As reported in Columns (1) and (2) of Table 5, the results show that DAID is not significant for the high financing constraint group, whereas for the low financing constraint group, the coefficient of DAID is −1.063 (p < 0.05). This finding also indicates that firms with high financing constraints face limitations in capital and resources, making it difficult to implement timely risk mitigation measures even when they obtain more supply chain information, thereby weakening the risk-reducing effect of data asset information disclosure. In contrast, such limitations do not exist for firms with low financing constraints, resulting in a significant risk-reducing effect.
To further examine whether the estimated coefficients on DAID within the two groups are significantly different, we follow Shi, Xia, Li, Hua and Fu [43] and create a 500-time bootstrapping permutation test and report the empirical p-value in the final row of Table 5. As shown in Columns (1) and (2), the p-value equals 0.024, confirming that the risk-reducing effect of data asset information disclosure on SCR is significant only for firms with low financing constraints.

4.5.2. Marketization

The external institutional environment in which a firm operates is closely intertwined with SCR. In regions with a high degree of marketization, legal and institutional frameworks tend to be more robust. Within such contexts, corporate information disclosure is subject to stronger legal constraints, enhancing its credibility and thereby more effectively mitigating SCR [79]. Moreover, investors in highly marketized regions are better equipped to discern and utilize relevant information as a basis for decision-making. High-quality disclosure can elicit positive market responses, foster more stable supply chain partnerships, and strengthen risk management capabilities [80]. Conversely, in regions with lower levels of marketization, institutional deficiencies weaken the legal enforceability of disclosure, reducing its credibility. Underdeveloped market mechanisms may delay the dissemination of information, hindering timely adjustments to emerging operational issues [81]. Consequently, a highly marketized environment can more effectively dampen supply chain volatility, thereby reducing SCR.
We divide the sample into two groups, high marketization (High_market) and low marketization (Low_market), based on the median level of regional marketization. The regression results, reported in Columns (3) and (4) of Table 5, show that data asset information disclosure significantly reduces SCR for firms in regions with high marketization, while the effect is not significant for those in regions with low marketization. A possible explanation is that firms in highly marketized regions have more developed market mechanisms and greater resource allocation efficiency, enabling them to better leverage data asset information disclosure to optimize supply chain management and thereby substantially reduce SCR. In addition, the bootstrapped permutation test yields a p-value of 0.018, further confirming the statistical significance of this differential effect.

4.5.3. (Non-) Chain Master

Huo, et al. [82] note that chain master firms typically occupy central positions within supply networks, enabling them to leverage their authority to establish and promote standardized disclosure practices and rules. With advantages in resource integration and collaborative platform coordination, these firms can drive the creation of a transparent supply chain ecosystem from the top down. Their advanced information technology capabilities facilitate the transformation of disclosed information into actionable decisions [83], thereby enhancing risk management. In contrast, non-chain-master firms, positioned at the periphery of the supply chain, exert weaker signaling effects and struggle to secure the full attention of critical partners. As a result, their disclosures are less likely to serve as chain-wide early warning signals, and the informational value dissipates accordingly [84]. Consequently, their capacity to mitigate risk is comparatively limited, and their contribution to overall supply chain stability remains modest.
Based on the above analysis, we divide the sample into chain master firms (Chain) and non-chain-master firms (Non-chain). As shown in Columns (5) and (6) of Table 5, the coefficients are significantly negative in both groups. We further assess the economic significance of these results. For chain master firms, the coefficient of DAID is −1.210, indicating that a one standard deviation increase in DAID reduces SCR by an average of 7.63% (−1.210 × 0.006/0.952). For non-chain-master firms, the coefficient of DAID is −1.069, implying that a one standard deviation increase in DAID reduces SCR by an average of 5.63% (−1.069 × 0.005/0.949). These results clearly indicate that data asset information disclosure has a stronger impact on reducing SCR for chain master firms. This is because, compared with non-chain-master firms, chain master firms hold greater bargaining power and resource integration capabilities within the supply chain, enabling them to leverage data asset information disclosure more effectively to enhance risk management and significantly lower SCR. Furthermore, the p-value is 0.002, providing strong empirical support for this conclusion.
Table 5. Results of the moderating effect and heterogeneity analysis.
Financing ConstraintsMarketization(Non-) Chain Master
High_FCLow_FCHigh_MarketLow_MarketChainNon-Chain
(1)(2)(3)(4)(5)(6)
VariablesSCRSCRSCRSCRSCRSCR
DAID−0.682−1.063 **−0.843 ***−1.239−1.210 *−1.069 ***
(0.482)(0.414)(0.322)(1.183)(0.687)(0.348)
N1776917767309654571448631050
Controls
Industry FE
Year FE
Empirical p-value0.0240.0180.002
Note: Robust standard errors are reported in parentheses. *** p < 0.01; ** p < 0.05; * p < 0.1. The empirical p-value is obtained through a coefficient difference significance test based on 500 bootstrap permutations. 5-fold cross-validation XGBoost is employed for the DDML approach.

4.6. Further Analysis: Do Reductions in Supply Chain Risk Increase Supply Chain Collaborative Innovation?

According to the resource-based view [51], firm resources are inherently limited. In a turbulent supply chain, substantial resources must be diverted to risk management, leaving fewer available for core value-creating activities. When SCR is reduced, the capital, labor, and other factors previously tied up can be released, providing the material foundation for pursuing innovative projects. This, in turn, enhances a firm’s innovation capacity while strengthening supply chain resilience, creating a virtuous cycle between the two. Social capital theory [85] likewise underscores the importance of relational capital. Greater supply chain stability fosters higher levels of trust among partners. In a low-risk environment, frequent communication facilitates knowledge sharing, significantly improving cross-firm innovation coordination and technological advancement. Furthermore, drawing on dynamic capability theory [86], managerial attention itself constitutes an exceedingly scarce strategic resource. A stable supply chain environment enables managers to dynamically capture a wider range of innovation opportunities, focusing on emerging markets and cutting-edge technologies. Under low-risk operating conditions, firms can respond collaboratively with greater efficiency, jointly mobilizing and reconfiguring resources to markedly accelerate and improve the quality of innovation. We therefore posit that, by mitigating SCR, data assets can substantially enhance collaborative innovation within the supply chain.
To examine whether data asset information disclosure can enhance supply chain collaborative innovation by reducing SCR, we employ the CMA approach. Following Jiali, et al. [87], we first construct the collaborative innovation indicator (SCC_INNOV1) as the product of the number of jointly applied supply chain patents and supply chain concentration. Additionally, for robustness testing, we create an alternative indicator (SCC_INNOV2) by taking the logarithm of the number of jointly applied patents plus one and multiplying it by the supply chain concentration. The CMA results, reported in Table 6, show that both the total effect and the direct effect for the treatment group are significantly positive, indicating that data asset information disclosure promotes supply chain collaborative innovation. Moreover, the indirect effects are also positive, confirming that data asset information disclosure can enhance collaborative innovation capacity by reducing SCR.

5. Conclusions, Implications and Limitations

5.1. Conclusions

As a key driver of supply chain management, data has gained recognition as a foundational resource and critical factor of production for supply chain optimization and risk mitigation. Drawing on an analytical framework encompassing visibility, collaboration, flexibility, and redundancy, we investigate the mechanisms through which data asset information disclosure influences SCR. Using panel data on Chinese A-share listed firms from 2010 to 2024 and employing a DDML model, the empirical results show that data asset information disclosure significantly reduces SCR, and this conclusion remains robust under alternative specifications of fixed effects and standard errors. To address potential endogeneity concerns, the analysis further incorporates omitted variable tests, instrumental variable estimation, and propensity score matching. In addition, the study tests alternative model specifications, dependent variables, independent variables, fold numbers, machine learning algorithms, and sample periods, all of which consistently support the finding that data asset information disclosure mitigates SCR. CMA reveals that this effect operates through four channels: enhancing information transparency, improving supply chain visibility, strengthening agile response capabilities, and increasing supply chain concentration. Heterogeneity tests further indicate that the impact is more pronounced among firms with lower financing constraints, in regions with higher levels of marketization, and among chain master enterprises. Finally, the results demonstrate that a reduction in SCR contributes to strengthening collaborative innovation capabilities within the supply chain.

5.2. Implications

Building on the above analysis, we contend that coordinated efforts at the micro, meso, and macro levels are essential to advancing the implementation of data asset information disclosure policies and achieving tangible and effective reductions in SCR. Accordingly, this study offers policy recommendations for each of these three dimensions:
First, at the micro level, firms should strengthen their data governance capabilities by enhancing their capacity for data collection, processing, analysis, and sharing, thereby ensuring the authenticity, completeness, and usability of disclosed information and improving supply chain visibility and responsiveness. Second, they should accelerate the development of digital platforms to optimize real-time operational data sharing with supply chain partners, fostering greater value co-creation and trust. Finally, firms should maintain appropriate redundancy to bolster their capacity to respond effectively to unexpected disruptions.
Second, at the meso level, efforts should be made to accelerate the standardization of industry-wide data asset evaluation systems by establishing uniform disclosure formats, thereby enhancing the comparability of supply chain data across industries and firms. In addition, third-party institutions can be encouraged to develop corporate data exchange and collaboration platforms to facilitate the accelerated flow, integration, and optimization of supply chain information.
Finally, at the macro level, regulatory authorities should establish a comprehensive data disclosure framework that, while safeguarding data security, clearly defines the standards and mechanisms for data asset information disclosure to ensure its effectiveness. Governments may implement tax incentives or fiscal subsidies to encourage firms to engage in high-quality disclosure and participate in supply chain data collaboration, thereby reducing the costs associated with digitalization. Furthermore, a SCR monitoring platform could be developed to enable dynamic cross-regional and cross-industry surveillance, coupled with timely emergency response measures.

5.3. Limitations and Outlook for Future Work

This study is subject to certain limitations.
First, the application of data assets is continually evolving, and the associated terminology is likewise undergoing constant change. Moreover, data assets have yet to be established as a standardized term in corporate disclosure practices, which may affect the comprehensiveness of the keyword-based measurement of data asset information disclosure. In addition, in constructing DAID we retain only terms with a similarity coefficient greater than 0.5, and the sensitivity of results to this parameter choice remains to be explored.
Second, China has a relatively comprehensive top-down system of data governance and digital economy policies. Firms disclose data assets and data governance structures in their annual reports not only to meet operational needs but also to comply with policy and regulatory requirements. As a result, the mitigating effect on supply chain risk is more pronounced in the Chinese context. Accordingly, this study is limited to Chinese listed firms. Future research can explore cross-country evidence on the nexus between DAID and supply chain risk.
Finally, although we control for year and industry fixed effects and include a rich set of covariates in the CMA, we may not fully rule out the possibility that time-varying unobserved factors within the same year–industry dimension may jointly affect the mediator and the outcome. Future research could incorporate exogenous structural shocks or instrumental variables to further relax the identification assumptions of CMA.
Author Contributions

Conceptualization, H.S. and Y.X.; methodology, H.S. and Y.X.; software, H.S. and Y.X.; validation, H.S., Y.X. and J.S.; formal analysis, Z.Z., Y.H. and X.C.; investigation, H.S. and Y.X.; resources, H.S. and Y.X.; data curation, H.S. and Y.X.; writing—original draft preparation, H.S., Y.X., Z.Z., Y.H. and X.C.; writing—review & editing, H.S. and Y.X.; visualization, H.S. and Y.X.; supervision, Y.X.; project administration, Y.X.; funding acquisition, Y.X. All authors have read and agreed to the published version of the manuscript.

Funding

This research was funded by the National Natural Science Foundation of China (Grant No. 72103082), the Social Science Foundation of Jiangsu Province (Grant No. 25GLB020), the Major Project of Philosophy and Social Sciences Foundation of the Higher Education Institutions of Jiangsu Province (Grant No. 2025SJZD051), the Postgraduate Research & Practice Innovation Program of Jiangsu Normal University (Grant No. 2025XKT1374), Key Project of National Social Science Foundation of China (Grant No. 23AGL029), and the Humanities and Social Science Fund of Ministry of Education of China (Grant No. 23YJA910004).

Data Availability Statement

The original data presented in the study are openly available in the CSMAR database at CSMAR.

Acknowledgments

We sincerely thank the editor and reviewers for their meticulous work in handling our manuscript. Their thorough review and constructive feedback have been immensely helpful in improving our research, allowing us to refine and enhance our paper.

Conflicts of Interest

The authors declare no conflicts of interest.

Abbreviations

The following abbreviations are used in this manuscript:
SCRSupply chain risk
DADIData asset information disclosure
DDMLDouble-debiased machine learning
CMACausal mediation analysis

Appendix A. Construction of Data Asset Information Disclosure (DAID)

At present, disclosing information regarding data assets is non-mandatory in annual reports, rendering the pattern of disclosure varying a lot among firms. Following Brochet, et al. [88], we employ a text-mining technique to evaluate the extent of data assets within annual reports by counting the word frequency.
Concretely, this paper inputs “data assets” and “data resources” to the Word2Vec algorithm as seeds and generates a dictionary of similar words. Only words with a similarity score above 0.5 are included in the keyword corpus to accurately capture the data asset information disclosure level. A word-frequency method [7,8] is commonly used by simply counting the total frequencies of the keywords. However, it assumes an equal weight for the seed words (most related to data assets information) and other less related keywords. We believe the ignorance of the similarity between keywords and the seed words is unreasonable. Consequently, we modified the simple word-frequency method into a weighted average word-frequency one. The weight of each word is determined by its degree of similarity to the seed word given by the Word2Vec algorithm. The specific keywords and corresponding similarity scores can be found in Table A1.
Table A1. Keywords and corresponding similarity scores of data assets information (in Chinese and English).
KeywordsSimilarityKeywordsSimilarity
信息资源 (Information resources)0.7167网络资源 (Network resources)0.5383
数据挖掘 (Data mining)0.6392计算资源 (Computing resources)0.5368
数据源 (Data sources)0.5927数据交换 (Data exchange)0.5322
大数据 (Big data)0.5921地图信息 (Map information)0.5319
数据共享 (Data sharing)0.5917共享平台 (Sharing platform)0.5285
海量数据 (Massive data)0.5877系统资源 (System resources)0.5243
数据平台 (Data platform)0.5777数据仓库 (Data warehouse)0.5224
数据分析系统 (Data analysis system)0.5642数据分析 (Data analysis)0.5195
基础信息 (Basic information)0.5581政务信息 (Government information)0.5176
知识库 (Knowledge base)0.558知识管理 (Knowledge management)0.5103
空间数据 (Spatial data)0.5544信息共享 (Information sharing)0.5083
基础数据 (Foundational data)0.5461数据信息 (Data information)0.5054
数据模型 (Data model)0.5446数据存储 (Data storage)0.5009
We subsequently count the frequencies of these keywords in each firm’s annual report to assess the firm-year data asset information disclosure as follows:
D A I D i , t = F r e i , t , n × S i m n T o t a l F r e i , t × 100 ,
where subscript i and t denote firm i at year t. Here, D A I D represents data asset information disclosure adjusted by the total word counts excluding English terms and numerical values, i.e., T o t a l F r e . Moreover, F r e i , t , n denotes the frequency of the n-th keyword in the dictionary. S i m n herein reflects the similarity between the n-th word and seeds, with the similarity of the seed words itself set to 1.

Appendix B. Propensity Score Matching

To address potential sample selection bias, we follow Xu, et al. [89] and apply propensity score matching. Specifically, firms that disclose data asset information are classified as the treatment group. We then employ the nearest-neighbor matching method (caliper = 0.01). Finally, using all CVs as matching covariates, we construct the control group from firms that have never disclosed data asset information, adopting a 1:2 matching ratio.
To validate the robustness of the above matching technique, two alternative matching strategies are also implemented. The first maintains the caliper nearest-neighbor method (caliper = 0.01) but increases the matching ratio to 1:3. The second applies the radius matching method (caliper = 0.05).
The balance test results are presented in Table A3. After matching, the mean differences in covariates between the treatment and control groups are no longer statistically significant, indicating that PSM effectively reduces sample selection bias. We then re-estimate the regressions using the matched sample, and as shown in Columns (1)–(3) of Table A2, the coefficients remain significantly negative, suggesting that the mitigating effect of data asset information disclosure on SCR is not driven by sample selection bias.
Table A2. Results of propensity score matching (PSM).
VariablesPSM
(1)(2)(3)
SCRSCRSCR
DAID−0.800 **−0.883 ***−0.853 ***
(0.339)(0.332)(0.309)
Controls
Year FE
Industry FE
Observations16,32619,89435,523
Note: Robust standard errors in parentheses. *** p < 0.01; ** p < 0.05. 5-fold cross-validation XGBoost is employed for the DDML approach. In addition, √ denotes “yes” and × denotes “no.” Robust standard errors are reported in parentheses.
Table A3. Results of balance test of propensity score matching.
Unmatched/MatchedMean t-test
VariablesTreadControlBias (%)tP > |t|
SIZEU22.30922.2236.64.820.000
M22.30922.2901.40.780.433
LEVU0.3920.403−5.7−4.060.000
M0.3920.3920.20.100.921
ROAU0.0410.049−13.0−9.700.000
M0.0410.0411.10.590.556
ATOU0.6250.656−7.2−5.290.000
M0.6260.629−0.8−0.470.637
CashFlowU0.0450.052−9.8−7.040.000
M0.0450.0450.50.270.790
DUALU0.3550.29413.29.750.000
M0.3550.356−0.2−0.130.898
Note: The symbols U and M indicate unmatched and matched cases, respectively.

Appendix C. Additional Robustness Checks

Since DDML relies on cross-fitting to improve estimation accuracy [90], varying the number of folds alters the proportion of training to validation samples, potentially introducing bias. To mitigate the impact of parameter selection, we conduct a robustness check by adjusting the number of folds to 3 and 8. As reported in Columns (1)–(2) of Table A4, the coefficients remain significantly negative at the 1% level, confirming that our conclusions are largely unaffected by the choice of this parameter.
To further mitigate potential specification bias in the DDML framework, we substitute the baseline XGBoost learner with a range of alternative machine learning methods, including LASSO, gradient boosting, neural networks, support vector machines (SVM), and random forest (RF), in order to the arbitrariness inherent in model choice [91]. As reported in Columns (3)–(7) of Table A4, the estimated coefficients of DAIDI remain significantly negative across all alternative learners. These results confirm that the findings further support H1.
To eliminate the influence of extraordinary events, we re-estimate the model after excluding observations from 2015. That year, China’s stock market experienced a severe crash, and the resulting extreme volatility may have prompted atypical adjustments in corporate operations and supply chain management, potentially distorting the relationship between data asset information disclosure and SCR. Using the sample excluding 2015, the coefficient of DAID is −0.949 (p < 0.01), providing further support for H1.
Table A4. Additional robustness checks.
Alternative Number of FoldsAlternative Machine Learning AlgorithmAlternative Sample Periods
(1)(2)(3)(4)(5)(6)(7)(8)
VariablesSCRSCRSCRSCRSCRSCRSCRSCR
DAID−1.039 ***−0.963 ***−1.605 ***−1.384 ***−1.384 ***−1.383 ***−1.322 ***−0.949 ***
(0.311)(0.318)(0.304)(0.311)(0.311)(0.311)(0.315)(0.314)
Controls
Industry FE
Year FE
Learning modelXGBoostXGBoostLassoGradient boostingMulti-layer perceptronSVMRFXGBoost
K-folds38555555
N35,53635,53635,53635,53635,53635,53635,53633,580
Note: Robust standard errors are reported in parentheses. *** p < 0.01. In addition, √ denotes “yes” and × denotes “no.”

References

  1. Tang, C.S. Perspectives in supply chain risk management. Int. J. Prod. Econ. 2006, 103, 451–488. [Google Scholar] [CrossRef]
  2. Meier, M.; Pinto, E. Covid-19 supply chain disruptions. Covid Econ. 2020, 48, 139–170. [Google Scholar] [CrossRef]
  3. Liu, Z.; Nguyen, T.L. Global supply chain pressures and US inflation. FRBSF Econ. Lett. 2023, 14, 1–6. [Google Scholar]
  4. Birch, K.; Cochrane, D.; Ward, C. Data as asset? The measurement, governance, and valuation of digital personal data by Big Tech. Big Data Soc. 2021, 8, 20539517211017308. [Google Scholar] [CrossRef]
  5. Hannila, H.; Silvola, R.; Harkonen, J.; Haapasalo, H. Data-driven Begins with DATA; Potential of Data Assets. J. Comput. Inf. Syst. 2019, 62, 29–38. [Google Scholar] [CrossRef]
  6. Sjödin, D.; Parida, V.; Kohtamäki, M. Artificial intelligence enabling circular business model innovation in digital servitization: Conceptualizing dynamic capabilities, AI capacities, business models and effects. Technol. Forecast. Soc. Change 2023, 197, 122903. [Google Scholar] [CrossRef]
  7. Qian, K.; Pan, C.; Liang, X. Does data asset disclosure affect bank lending acquisition? Int. Rev. Financ. Anal. 2024, 97, 103834. [Google Scholar] [CrossRef]
  8. Wei, Y.; Zhang, J.; Cheng, M.; Liu, T. Does data asset disclosure contribute to the market efficiency? Evidence from China. Res. Int. Bus. Financ. 2024, 73, 102549. [Google Scholar] [CrossRef]
  9. Hu, C.; Li, Y.; Zheng, X. Data assets, information uses, and operational efficiency. Appl. Econ. 2022, 54, 6887–6900. [Google Scholar] [CrossRef]
  10. Wagner, S.M.; Bode, C. An empirical examination of supply chain performance along several dimensions of risk. J. Bus. Logist. 2008, 29, 307–325. [Google Scholar] [CrossRef]
  11. Bode, C.; Wagner, S.M. Structural drivers of upstream supply chain complexity and the frequency of supply chain disruptions. J. Oper. Manag. 2015, 36, 215–228. [Google Scholar] [CrossRef]
  12. Ivanov, D.; Dolgui, A. A digital supply chain twin for managing the disruption risks and resilience in the era of Industry 4.0. Prod. Plan. Control 2021, 32, 775–788. [Google Scholar] [CrossRef]
  13. Li, S.; Lin, B. Accessing information sharing and information quality in supply chain management. Decis. Support Syst. 2006, 42, 1641–1656. [Google Scholar] [CrossRef]
  14. Yang, M.; Lim, M.K.; Qu, Y.; Ni, D.; Xiao, Z. Supply chain risk management with machine learning technology: A literature review and future research directions. Comput. Ind. Eng. 2023, 175, 108859. [Google Scholar] [CrossRef]
  15. Christopher, M.; Peck, H. Building the resilient supply chain. Int. J. Logist. Manag. 2004, 15, 1–13. [Google Scholar] [CrossRef]
  16. Agrawal, T.K.; Kalaiarasan, R.; Olhager, J.; Wiktorsson, M. Supply chain visibility: A Delphi study on managerial perspectives and priorities. Int. J. Prod. Res. 2024, 62, 2927–2942. [Google Scholar] [CrossRef]
  17. Brintrup, A.; Pak, J.; Ratiney, D.; Pearce, T.; Wichmann, P.; Woodall, P.; McFarlane, D. Supply chain data analytics for predicting supplier disruptions: A case study in complex asset manufacturing. Int. J. Prod. Res. 2020, 58, 3330–3341. [Google Scholar] [CrossRef]
  18. Gupta, S.; Drave, V.A.; Bag, S.; Luo, Z. Leveraging Smart Supply Chain and Information System Agility for Supply Chain Flexibility. Inf. Syst. Front. 2019, 21, 547–564. [Google Scholar] [CrossRef]
  19. Sun, X.; Du, Z. Enhancing capital market efficiency: The role of data assets disclosure in reducing stock price synchronicity. Int. Rev. Econ. Financ. 2024, 94, 103351. [Google Scholar] [CrossRef]
  20. Li, Y.; Wang, X.; Zheng, X. Data assets and corporate sustainable development: Evidence from ESG in China. Pac.-Basin Financ. J. 2024, 85, 102378. [Google Scholar] [CrossRef]
  21. Zheng, X.; Zhang, X.; Yang, G. Can data assets spur corporate R&D investment? Appl. Econ. Lett. 2025, 32, 538–545. [Google Scholar] [CrossRef]
  22. Song, H.; Zhang, D. Bullwhip Effect in Supply Chains and Cost Rigidity. J. Risk Financ. Manag. 2025, 18, 284. [Google Scholar] [CrossRef]
  23. Lee, H.L.; Padmanabhan, V.; Whang, S. Information Distortion in a Supply Chain: The Bullwhip Effect. Manag. Sci. 1997, 43, 546–558. [Google Scholar] [CrossRef]
  24. Cachon, G.P.; Fisher, M. Supply Chain Inventory Management and the Value of Shared Information. Manag. Sci. 2000, 46, 1032–1048. [Google Scholar] [CrossRef]
  25. Croson, R.; Donohue, K. Behavioral Causes of the Bullwhip Effect and the Observed Value of Inventory Information. Manag. Sci. 2006, 52, 323–336. [Google Scholar] [CrossRef]
  26. Cachon, G.P.; Randall, T.; Schmidt, G.M. In Search of the Bullwhip Effect. Manuf. Serv. Oper. Manag. 2007, 9, 457–479. [Google Scholar] [CrossRef]
  27. Bray, R.L.; Mendelson, H. Information Transmission and the Bullwhip Effect: An Empirical Investigation. Manag. Sci. 2012, 58, 860–875. [Google Scholar] [CrossRef]
  28. Cui, R.; Allon, G.; Bassamboo, A.; Van Mieghem, J.A. Information Sharing in Supply Chains: An Empirical and Theoretical Valuation. Manag. Sci. 2015, 61, 2803–2824. [Google Scholar] [CrossRef]
  29. Saoud, P.; Kourentzes, N.; Boylan, J.E. The importance of forecast uncertainty in understanding the Bullwhip effect. Int. J. Prod. Res. 2025, 1–22. [Google Scholar] [CrossRef]
  30. Parviziomran, E.; Elliot, V. The effects of bargaining power on trade credit in a supply network. J. Purch. Supply Manag. 2023, 29, 100818. [Google Scholar] [CrossRef]
  31. Patil, C.; Prabhu, V. Supply chain cash-flow bullwhip effect: An empirical investigation. Int. J. Prod. Econ. 2024, 267, 109065. [Google Scholar] [CrossRef]
  32. Niu, Y.; Wu, J.; Jiang, S.; Jiang, Z. The Bullwhip Effect in Servitized Manufacturers. Manag. Sci. 2024, 71, 1–20. [Google Scholar] [CrossRef]
  33. Wang, X.; Disney, S.M. The bullwhip effect: Progress, trends and directions. Eur. J. Oper. Res. 2016, 250, 691–701. [Google Scholar] [CrossRef]
  34. Bednarski, L.; Roscoe, S.; Blome, C.; Schleper, M.C. Geopolitical disruptions in global supply chains: A state-of-the-art literature review. Prod. Plan. Control 2025, 36, 536–562. [Google Scholar] [CrossRef]
  35. Zhu, T.; Balakrishnan, J.; da Silveira, G.J.C. Bullwhip effect in the oil and gas supply chain: A multiple-case study. Int. J. Prod. Econ. 2020, 224, 107548. [Google Scholar] [CrossRef]
  36. Wu, L.; Wang, M.; Kumar, A.; Choi, T.-M. Mitigating the bullwhip effect through supply chain ESG transparency: Roles of digitalization and signal strength. Int. J. Oper. Prod. Manag. 2024, 44, 1707–1731. [Google Scholar] [CrossRef]
  37. Diamond, D.W.; Verrecchia, R.E. Disclosure, Liquidity, and the Cost of Capital. J. Financ. 1991, 46, 1325–1359. [Google Scholar] [CrossRef]
  38. Botosan, C.A. Disclosure Level and the Cost of Equity Capital. Account. Rev. 1997, 72, 323–349. [Google Scholar]
  39. Chen, L. Data assetization and capital market information efficiency: Evidence from Hidden Champion SMEs in China. Future Bus. J. 2024, 10, 110. [Google Scholar] [CrossRef]
  40. Xu, Q.; Nie, Y. How Data Transparency Reshapes New Firm Credit and Misallocation Under Uncertainty. 2025. Available at SSRN 5351319. [Google Scholar] [CrossRef]
  41. Zhang, J.; Xie, T.; Kong, X.; Liu, B.; Zhang, W. Can data assets promote green innovation in enterprises? Financ. Res. Lett. 2025, 72, 106554. [Google Scholar] [CrossRef]
  42. Acheampong, A.; Elshandidy, T. Does sustainability disclosure improve analysts’ forecast accuracy? Evidence from European banks. Financ. Innov. 2025, 11, 25. [Google Scholar] [CrossRef]
  43. Shi, H.; Xia, Y.; Li, Y.; Hua, Y.; Fu, Y. Data asset information disclosure divergence and green innovation: Causal evidence from double-debiased machine learning. Financ. Res. Lett. 2025, 84, 107757. [Google Scholar] [CrossRef]
  44. Mehnaz, L.; Scott, T.; Zang, Z. The Disclosure of Recognised and Unrecognised Intangibles: Evidence from New Zealand. Aust. Account. Rev. 2024, 34, 346–365. [Google Scholar] [CrossRef]
  45. Lau, A.H.L.; Lau, H.-S.; Zhou, Y.-W. Considering asymmetrical manufacturing cost information in a two-echelon system that uses price-only contracts. IIE Trans. 2006, 38, 253–271. [Google Scholar] [CrossRef]
  46. Wang, X.; Guo, H.; Yan, R.; Wang, X. Achieving optimal performance of supply chain under cost information asymmetry. Appl. Math. Model. 2018, 53, 523–539. [Google Scholar] [CrossRef]
  47. Li, Z.; Qian, C.; Ryan, J.K.; Sun, D. Robust mechanism design and production structure for assembly systems with asymmetric cost information. Eur. J. Oper. Res. 2022, 301, 609–623. [Google Scholar] [CrossRef]
  48. Chen, P.; Liu, X.; Zhou, P.; Zhu, S.X. The interplay between strategic inventories and cost misreporting in supply chains. Transp. Res. Part E Logist. Transp. Rev. 2022, 163, 102737. [Google Scholar] [CrossRef]
  49. Spence, M. Job market signaling. In Uncertainty in Economics; Academic Press: New York, NY, USA, 1978; pp. 281–306. [Google Scholar] [CrossRef]
  50. de Sousa Jabbour, A.B.L.; Fiorini, P.D.C.; Latan, H.; Laguir, I.; Jabbour, C.J.C. Supply chain risk identification: Signaling companies’ social sustainability reputation. J. Clean. Prod. 2024, 478, 143817. [Google Scholar] [CrossRef]
  51. Barney, J. Firm resources and sustained competitive advantage. J. Manag. 1991, 17, 99–120. [Google Scholar] [CrossRef]
  52. Ren, Y.; Liu, X.; Zhu, Y. Can the development of digital finance and information transparency improve enterprise investment efficiency? Financ. Res. Lett. 2025, 73, 106597. [Google Scholar] [CrossRef]
  53. Lee, H.L.; Billington, C. Managing supply chain inventory: Pitfalls and opportunities. Sloan Manag. Rev. 1992, 33, 65–73. [Google Scholar]
  54. Croson, R.; Donohue, K. Impact of POS data sharing on supply chain management: An experimental study. Prod. Oper. Manag. 2003, 12, 1–11. [Google Scholar] [CrossRef]
  55. Chen, J.; Wu, W.; Zhuang, Y. Impact of Digital Supply Chain on Sustainable Trade Credit Provision: Evidence from Chinese Listed Companies. Sustainability 2023, 15, 11861. [Google Scholar] [CrossRef]
  56. Jin, H. Challenges to corporate supply chain stability under the trend of expert power concentration. Int. Rev. Financ. Anal. 2025, 97, 103820. [Google Scholar] [CrossRef]
  57. Ouyang, Y. The effect of information sharing on supply chain stability and the bullwhip effect. Eur. J. Oper. Res. 2007, 182, 1107–1121. [Google Scholar] [CrossRef]
  58. Ouyang, Y.; Li, X. The bullwhip effect in supply chain networks. Eur. J. Oper. Res. 2010, 201, 799–810. [Google Scholar] [CrossRef]
  59. Zhang, M.; Huang, Z. The Impact of Digital Transformation on ESG Performance: The Role of Supply Chain Resilience. Sustainability 2024, 16, 7621. [Google Scholar] [CrossRef]
  60. Ma, J.; Yang, X.; Li, M. Are Data Assets Useful?—Evidence Based on Corporate Cost Stickiness. Emerg. Mark. Financ. Trade 2024, 60, 3734–3752. [Google Scholar] [CrossRef]
  61. Hsu, C.-H.; Yang, X.-H.; Zhang, T.-Y.; Chang, A.-Y.; Zheng, Q.-W. Deploying Big Data Enablers to Strengthen Supply Chain Agility to Mitigate Bullwhip Effect: An Empirical Study of China’s Electronic Manufacturers. J. Theor. Appl. Electron. Commer. Res. 2021, 16, 3375–3405. [Google Scholar] [CrossRef]
  62. Dong, J.; Zhang, Q. Sustainable Development of the Real Economy: Supply Chain Finance and Enterprise Financialization. Sustainability 2024, 16, 3574. [Google Scholar] [CrossRef]
  63. Liu, F.; Fang, M.; Xiao, S.; Shi, Y. Mitigating bullwhip effect in supply chains by engaging in digital transformation: The moderating role of customer concentration. Ann. Oper. Res. 2025, 344, 825–846. [Google Scholar] [CrossRef]
  64. Li, Q.; Tian, W.; Zhang, H. Digital Transformation for Sustainability in Industry 4.0: Alleviating the Corporate Digital Divide and Enhancing Supply Chain Collaboration. Systems 2025, 13, 123. [Google Scholar] [CrossRef]
  65. Shan, J.; Yang, S.; Yang, S.; Zhang, J. An Empirical Study of the Bullwhip Effect in China. Prod. Oper. Manag. 2014, 23, 537–551. [Google Scholar] [CrossRef]
  66. Ning, L.; Yao, D. The Impact of Digital Transformation on Supply Chain Capabilities and Supply Chain Competitive Performance. Sustainability 2023, 15, 10107. [Google Scholar] [CrossRef]
  67. Ma, Y.; Li, Z.; He, L. Data Elements Marketization and Corporate Investment Efficiency: Causal Inference via Double Machine Learning. Systems 2025, 13, 609. [Google Scholar] [CrossRef]
  68. Oster, E. Unobservable Selection and Coefficient Stability: Theory and Evidence. J. Bus. Econ. Stat. 2019, 37, 187–204. [Google Scholar] [CrossRef]
  69. Nunn, N.; Qian, N. US Food Aid and Civil Conflict. Am. Econ. Rev. 2014, 104, 1630–1666. [Google Scholar] [CrossRef]
  70. Chen, Q.-a.; Zhao, X.; Zhang, X.; Jiang, Z.; Wang, Y. Driving forces of digital transformation in chinese enterprises based on machine learning. Sci. Rep. 2024, 14, 6177. [Google Scholar] [CrossRef]
  71. Yang, Z.; Tang, S.; Li, Z. Capital Market Information Disclosure, Relational Contracts, and the Supply: Demand Bullwhip Effect Based on Empirical Evidence from Supply Chain Information Spillovers. Manag. World 2020, 36, 89–105+217–218. (In Chinese) [Google Scholar] [CrossRef]
  72. Muslu, V.; Radhakrishnan, S.; Subramanyam, K.; Lim, D. Forward-looking MD&A disclosures and the information environment. Manag. Sci. 2015, 61, 931–948. [Google Scholar] [CrossRef]
  73. Hutton, A.P.; Marcus, A.J.; Tehranian, H. Opaque financial reports, R2, and crash risk. J. Financ. Econ. 2009, 94, 67–86. [Google Scholar] [CrossRef]
  74. Tu, Y.; Hu, L.; Hua, X.; Li, H. Supply chain stability and corporate green technology innovation. Int. Rev. Econ. Financ. 2025, 97, 103769. [Google Scholar] [CrossRef]
  75. Fan, H.; Pan, N. Digital transformation, agile responsiveness, and corporate resilience. Econ. Manag. 2024, 46, 36–54. (In Chinese) [Google Scholar]
  76. Jiang, M.; Fang, J.; Yang, Y.; Yu, C.; Li, J. Supply chain concentration, industry concentration and enterprise innovation performance. Financ. Res. Lett. 2024, 63, 105394. [Google Scholar] [CrossRef]
  77. Zhang, S.; Wen, Y.; Yang, X. Equity pledge equity structure and earnings management. Friends Account. 2019, 14, 130–136. (In Chinese) [Google Scholar]
  78. Du, T.C.; Lai, V.S.; Cheung, W.; Cui, X. Willingness to share information in a supply chain: A partnership-data-process perspective. Inf. Manag. 2012, 49, 89–98. [Google Scholar] [CrossRef]
  79. Wang, Q.; Wong, T.J.; Xia, L. State ownership, the institutional environment, and auditor choice: Evidence from China. J. Account. Econ. 2008, 46, 112–134. [Google Scholar] [CrossRef]
  80. Morck, R.; Yeung, B.; Yu, W. The information content of stock markets: Why do emerging markets have synchronous stock price movements? J. Financ. Econ. 2000, 58, 215–260. [Google Scholar] [CrossRef]
  81. Gilson, R.J.; Kraakman, R.H. The mechanisms of market efficiency. Va. L. Rev. 1984, 70, 549. [Google Scholar] [CrossRef]
  82. Huo, B.; Han, Z.; Chen, H.; Zhao, X. The effect of high-involvement human resource management practices on supply chain integration. Int. J. Phys. Distrib. Logist. Manag. 2015, 45, 716–746. [Google Scholar] [CrossRef]
  83. Cao, M.; Zhang, Q. Supply Chain Collaboration: Roles of Interorganizational Systems, Trust, and Collaborative Culture; Springer: Berlin/Heidelberg, Germany, 2013. [Google Scholar]
  84. Connelly, B.L.; Certo, S.T.; Ireland, R.D.; Reutzel, C.R. Signaling Theory: A Review and Assessment. J. Manag. 2010, 37, 39–67. [Google Scholar] [CrossRef]
  85. Krause, D.R.; Handfield, R.B.; Tyler, B.B. The relationships between supplier development, commitment, social capital accumulation and performance improvement. J. Oper. Manag. 2007, 25, 528–545. [Google Scholar] [CrossRef]
  86. Teece, D.J.; Pisano, G.; Shuen, A. Dynamic capabilities and strategic management. Strateg. Manag. J. 1997, 18, 509–533. [Google Scholar] [CrossRef]
  87. He, J.; Zheng, Z.; Hu, X. Supply chain digitalization and corporate markups. Secur. Mark. Her. 2025, 3–14. (In Chinese) [Google Scholar]
  88. Brochet, F.; Loumioti, M.; Serafeim, G. Speaking of the short-term: Disclosure horizon and managerial myopia. Rev. Account. Stud. 2015, 20, 1122–1163. [Google Scholar] [CrossRef]
  89. Xu, A.; Song, M.; Wu, Y.; Luo, Y.; Zhu, Y.; Qiu, K. Effects of new urbanization on China’s carbon emissions: A quasi-natural experiment based on the improved PSM-DID model. Technol. Forecast. Soc. Change 2024, 200, 123164. [Google Scholar] [CrossRef]
  90. Chernozhukov, V.; Chetverikov, D.; Demirer, M.; Duflo, E.; Hansen, C.; Newey, W.; Robins, J. Double/debiased machine learning for treatment and structural parameters. Econom. J. 2018, 21, C1–C68. [Google Scholar] [CrossRef]
  91. Zhao, X.; Ke, X.; Jiang, S.; You, X. Exploring the dynamics of urban energy efficiency in China: A double machine learning analysis of green finance influence. Environ. Technol. Innov. 2024, 35, 103653. [Google Scholar] [CrossRef]
Figure 1. Theoretical framework of the impact of data asset information disclosure on SCR.
Systems 13 00844 g001
Figure 2. Parallel trend test. Note: To avoid the dummy variable trap, the year three years the event (t = −3) is set as the reference year.
Systems 13 00844 g002
Figure 3. An illustration of permutation placebo test. Note: The red dots plot the coefficients obtained by randomly assigning treatment status and reestimating the model 500 times. The blue curve shows the normal fit. The gray dashed line marks the estimate of β1 reported in Equation (10).
Systems 13 00844 g003
Table 1. Descriptive statistics.
Variables NMeanSDMinMedianMax
Dependent variablesSCR35,5360.9500.2240.1510.9611.856
Core explanatory variableDAID35,5360.0010.0050.0000.0000.047
Control variablesSIZE35,53622.2401.30020.11022.02026.410
LEV35,5360.4010.1980.0520.3930.857
ROA35,5360.0480.059−0.1750.0440.221
ATO35,5360.6510.4280.0860.5572.582
Cashflow35,5360.0500.066−0.1400.0490.234
DUAL35,5360.3050.4600.0000.0001.000
Note: SD = standard deviation.
Table 2. Results of baseline regression.
DDML ApproachAlternative Standard ErrorsAlternative Fixed EffectsTWFE
(1)(2)(3)(4)(5)(6)(7)(8)
VariablesSCRSCRSCRSCRSCRSCRSCRSCR
DAID−1.203 ***−1.203 ***−1.203 ***−1.203 ***−1.203 ***−0.837 **−1.072 ***−1.591 ***
(0.317)(0.388)(0.254)(0.338)(0.367)(0.339)(0.330)(0.305)
Controls
Industry FE
Year FE
City FE×××××××
Province FE×××××××
N35,53635,53635,53635,53635,53635,53635,53635,536
Bound on the treatment effect
(δ = 1, Rmax = 1.3 × R2)
-------[−1.591, −0.853]
δ (Rmax = 1.3 × R2)-------1.862
Note: Robust standard errors in parentheses. *** p < 0.01; ** p < 0.05; 5-fold cross-validation XGBoost is employed for the DDML approach. In addition, √ denotes “yes” and × denotes “no.”
Table 3. Results of the instrumental variable (IV) approach and robustness checks.
Partial Linear IV ModelAlternative Model SpecificationsAlternative Dependent VariableAlternative Explanatory Variable
IV1IV2
(1)(2)(3)(4)(5)
VariablesSCRSCRSCRSCRSCR
DAID−23.885 *−2.588 ***−0.009 ***−1.375 ***−0.065 ***
(13.086)(0.764)(0.003)(0.293)(0.017)
Controls
Industry FE
Year FE
Learning modelXGBoostXGBoost-XGBoostXGBoost
K-folds55-55
N35,50635,53535,26735,53635,360
Sanderson-Windmeijer F test6605.490 ***10,114.240 ***---
Kleibergen-Paap rk LM2021.637 ***2402.259 ***---
Cragg-Donald Wald F70,000.00071,000.000---
Kleibergen-Paap rk Wald F6605.48910,000.000---
Note: Robust standard errors are reported in parentheses. *** p < 0.01; * p < 0.1. In addition, √ denotes “yes” and × denotes “no.”
Table 6. Results of further analysis.
(1)(2)(3)(4)(5)
VariablesTotal EffectTreatment Group (Direct)Control Group (Direct)Treatment Group (Indirect)Control Group (Indirect)
SCC_INNOV10.028 **0.025 *0.0220.006 **0.004 **
(0.013)(0.013)(0.014)(0.003)(0.002)
SCC_INNOV20.092 ***0.086 ***0.084 ***0.007 ***0.006 ***
(0.013)(0.013)(0.014)(0.003)(0.001)
Note: Robust standard errors are reported in parentheses. *** p < 0.01; ** p < 0.05; * p < 0.1.
Disclaimer/Publisher’s Note: The statements, opinions and data contained in all publications are solely those of the individual author(s) and contributor(s) and not of MDPI and/or the editor(s). MDPI and/or the editor(s) disclaim responsibility for any injury to people or property resulting from any ideas, methods, instructions or products referred to in the content.