Article

A Dual-Level Model of AI Readiness in the Public Sector: Merging Organizational and Individual Factors Using TOE and UTAUT

Faculty of Public Administration, University of Ljubljana, 1000 Ljubljana, Slovenia
*
Author to whom correspondence should be addressed.
Systems 2025, 13(8), 705; https://doi.org/10.3390/systems13080705
Submission received: 9 July 2025 / Revised: 12 August 2025 / Accepted: 14 August 2025 / Published: 17 August 2025
(This article belongs to the Special Issue Data-Driven Decision Making for Complex Systems)

Abstract

Artificial intelligence (AI) is increasingly transforming the public sector, although the willingness of organizations to adopt such technologies varies widely. Existing models, such as the technology–organization–environment (TOE) model, highlight systemic drivers and barriers but overlook the individual-level factors that are also critical to successful adoption. To address this gap, we propose a decision model that combines the TOE model with the unified theory of acceptance and use of technology (UTAUT) and combines the dimensions of technology, organization, environment, and individual readiness. The model was developed using the Analytic Hierarchy Process (AHP) and supports group decision-making by combining the pairwise comparison matrices of multiple experts into a consolidated priority structure. Specifically, many expert judgments were used to create a group matrix for the four main categories and four additional group matrices for the criteria within each category. This structured approach allows for a systematic assessment of whether a public sector organization is ready for AI adoption. The results show the importance of both systemic factors (such as data, technology, innovation, and readiness for change) and individual factors (such as social influence and voluntariness of use). The final model provides a comprehensive and practical decision-making tool for public sector organizations to assess readiness, identify gaps, and guide the strategic adoption of AI.

1. Introduction

Over the past four decades, AI has moved from a laboratory curiosity to a general-purpose technology that is reshaping how organizations plan, decide, and deliver value. Early debates in management science framed AI as a tool for relieving managers of data-intensive routines so they could concentrate on strategy [1,2]. More recent scholarship argues that the real promise lies in augmentation: humans and machines collaborating so that algorithms execute repetitive analytics while managers apply judgment, negotiate trade-offs, and engage stakeholders [3,4]. In the public sector, this promise is even more compelling because governments must balance efficiency gains with fairness, transparency, and accountability. COVID-19 put that tension in sharp relief: agencies that had already embedded AI in forecasting, triage, or service-delivery systems were faster at pivoting policies and reallocating resources [5,6]. Yet comparative studies show that public organizations lag behind private firms in systematic AI deployment, owing to legal constraints, fragmented data, and limited change-management capacity [7]. Moreover, it has been acknowledged that much less has been written on various organizational and socio-technological challenges of public organizations in general in comparison to private ones [8,9].
AI adoption in government is shaped by normative commitments that have no direct analog in business. Mandates for due process, equal treatment, and public scrutiny restrict the use of opaque “black-box” models and raise the stakes of algorithmic error [10,11]. At the organizational level, risk-averse cultures, budget cycles, and political oversight slow down experimentation, while at the macro level, governments face mounting pressure to modernize frontline services and regulatory enforcement [12,13]. From the public management perspective, a hierarchical way of delivering services prevails and joint decision-making in the form of collaborative governance is promoted [8]. Conceptual ambiguity adds another hurdle: commentators routinely invoke AI as a catch-all label for everything from rules-based process automation to self-learning generative models, making it hard to compare cases or design targeted interventions. What is labeled as public management is itself an evolving, interdisciplinary construct that blends economics, administration, data science, and law; its boundaries and success criteria are still contested. These factors create a dual knowledge gap: we lack both a clear vocabulary for “AI readiness” in public administration and a diagnostic instrument that accounts for institutional, technological, and behavioral dimensions.
To close this gap, we propose a dual-level model of AI readiness that combines the technology–organization–environment (TOE) framework [14] with the unified theory of acceptance and use of technology (UTAUT; [15]). TOE captures systemic enablers such as IT infrastructure, organizational culture, and regulatory climate, while UTAUT explains how perceived usefulness, effort expectancy, and social influence drive individual uptake. Merging these lenses allows us to diagnose whether structural conditions and human attitudes are aligned for successful AI adoption. Because readiness involves multiple, partly qualitative criteria, we operationalize the model with the Analytic Hierarchy Process (AHP), a well-established multi-criteria decision-making (MCDM) technique that derives consistent priority weights from pairwise expert judgments [16]. Prior work has validated AHP in public-sector technology selection, including digital government dashboards and blockchain-enabled procurement [17,18,19]. We extend that line of research by applying AHP to an integrated TOE–UTAUT hierarchy and testing it with municipal decision-makers.
The resulting model advances scholarship and practice simultaneously: it bridges the digital–government, public–management, and technology–acceptance literature through an empirically prioritized hybrid framework, and it equips managers with a transparent tool for spotting capability gaps and allocating resources to data, infrastructure, or training. Municipal governments—often resource-constrained yet under strong pressure to digitalize—stand to benefit most from this evidence-based roadmap. Ultimately, this study supports responsible, citizen-centered, and accountable AI integration in public administration.
The following research questions guide this paper:
  • RQ1: How can a comprehensive multi-criteria decision-making model be developed to assess organizational readiness to adopt AI in public administration?
  • RQ2: What technological, organizational, environmental, and individual factors influence this readiness?
  • RQ3: How can these factors be structured and weighted to support strategic decision-making in the public sector?
  • RQ4: How does the integration of TOE and UTAUT frameworks enhance the robustness and relevance of AI readiness assessments?
The remainder of the paper is organized as follows: Section 2 surveys the literature on public-sector AI adoption and MCDM applications; Section 3 details the TOE, UTAUT, and AHP foundations and describes the research design; Section 4 applies the proposed model in a two-round expert evaluation across Slovenian municipalities; Section 5 presents and discusses the results; and Section 6 concludes with managerial implications and future research avenues.

2. The Literature Review

The integration of AI into public-sector operations is a fast-moving research frontier because of AI’s promise to boost efficiency, effectiveness, and public value. Explaining why some agencies adopt AI while others resist, therefore, requires models that capture both general technology predispositions and system-specific perceptions (see Table 1). Early studies relied on the Technology Acceptance Model (TAM; [20]), which explained roughly 37% of variance in behavioral intention through perceived usefulness and perceived ease of use. Subsequent versions progressively addressed TAM’s limitations: TAM2 added social influence and cognitive instrumental processes, lifting explanatory power; TAM3 introduced antecedents of ease/usefulness (e.g., computer self-efficacy), raising the variance explained to about 40–53% [21,22]. In parallel, the Technology Readiness Index (TRI; [23]) captured an individual’s general predisposition toward new technologies; its latest form, TRI 2.0, condensed the original 36 items to 16 while retaining the two enablers (optimism and innovativeness) and two inhibitors (discomfort and insecurity) that segment citizens and employees into readiness profiles [24]. Bridging these two approaches, the Technology Readiness and Acceptance Model (TRAM; [25]) integrates TRI and TAM to explain how readiness beliefs shape perceptions of usefulness and ease of use, offering a more holistic view of user acceptance of emerging technologies like AI.
The most comprehensive stream emerged with the unified theory of acceptance and use of technology (UTAUT; [15]), which integrates eight predecessor models and, with its moderators (age, gender, experience, and voluntariness), can account for up to 70% of intention variance—substantially higher than any single TAM iteration. Its consumer-oriented extension, UTAUT2, broadened the lens beyond organizational settings by adding hedonic motivation, price value, and habit [26]. Comparative reviews show distinct strengths: the TAM family excels at diagnosing perceptions of a specific system during organizational rollouts; TRI 2.0 is useful for segmenting general technology predispositions in citizen or employee populations; and UTAUT/UTAUT2 provides the highest predictive validity when contextual moderators are salient.
Building on these insights, our study adopts UTAUT, rather than TAM3 or TRI 2.0, as the individual-level layer of a dual-level readiness model because (i) UTAUT offers the greatest explanatory power, (ii) its moderator set aligns with public-sector heterogeneity (e.g., tenure-based voluntariness), and (iii) its constructs map cleanly onto the organizational and environmental factors captured by the technology–organization–environment (TOE) framework. By nesting UTAUT within TOE and operationalizing their combined constructs through the Analytic Hierarchy Process, we provide a multi-criteria decision model that can diagnose whether a public agency is structurally and behaviorally prepared for AI adoption.
Moreover, for the literature review, we used papers from the Web of Science, which we found using the search parameters “AI acceptance” AND “public sector” AND (“TOE framework” OR “UTAUT model”) AND “decision models”. As mentioned in [27], the Web of Science is widely regarded as the world’s leading platform for retrieving the scientific literature and citation-based analysis. We chose Web of Science because its strengths lie in its broad coverage of the scholarly literature, robust citation analysis tools, and ability to track the impact of research without sacrificing historical coverage and focus on traditional science disciplines. In addition, Web of Science may be better suited for searching and analyzing Open Access resources at the publication level [28].
The search initially yielded 100 records. We added an additional record identified from a different source. Based on an assessment of full-text relevance, five papers were selected for final inclusion. The remaining 96 records were excluded based on relevance, conceptual orientation, and methodological suitability (see Figure 1).
The five studies examined various aspects of AI adoption and acceptance of AI in governmental and organizational contexts.
Specifically, they address the following:
(1)
The impact of AI-enabled services on citizen satisfaction in government agencies [19];
(2)
The factors that influence the trust and perceived usefulness of AI-based HR tools among professionals [29];
(3)
Citizens’ acceptance of AI in the delivery of public services [30];
(4)
The perception and willingness of government employees to support the use of AI technologies [17];
(5)
The determinants of the acceptance of AI technologies by employees within organizations [31].
These studies include a range of stakeholders—including citizens, public sector employees, and HR professionals—and overall provide valuable insight into the challenges and opportunities associated with the adoption of AI in the public sector.
While these studies provide a broad understanding of stakeholder perspectives, they focus largely on individual acceptance and attitudes and do not provide a comprehensive framework for assessing organizational readiness to adopt AI. This highlights the need for an integrated multi-criteria decision-making model that considers both organizational and individual factors, as proposed in our study.
As can be seen from the literature, none of the studies examined explicitly uses a decision-making model to assess the readiness for artificial intelligence. The existing research focuses primarily on individual perceptions, citizen acceptance, or the impact of AI adoption rather than the organizational determinants that influence readiness for AI implementation—especially in the public sector.
The identified research gap is the lack of a comprehensive and structured framework for assessing AI readiness at the organizational level. No study uses multi-criteria decision-making (MCDM) methods to assess and weigh the relative importance of different readiness criteria. While some papers refer to theoretical models such as UTAUT or TOE, they often do so in isolation. The lack of integration between these frameworks limits the explanatory and predictive power of existing models.
To address this gap, this study proposes a hybrid decision model that combines the technology–organization–environment (TOE) framework with the unified theory of acceptance and use of technology (UTAUT). This approach enables the inclusion of both systemic organizational factors and individual readiness variables. In addition, the model incorporates MCDM techniques—in particular, the Analytic Hierarchy Process (AHP)—to derive weightings for each criterion, thus supporting evidence-based, transparent, and context-sensitive assessments of organizational readiness to adopt AI in public administration.
AHP was selected as the central decision-making method for this study because it has proven to be effective in addressing complex, multi-criteria decision problems and can systematically quantify the judgments of experts. This approach is particularly well-suited for modeling organizational readiness to adopt AI, where different factors—technological, organizational, environmental, and individual dimensions—need to be prioritized within a hierarchical structure. AHP facilitates the decomposition of the decision problem, supports the consistency check of expert contributions, and enables the aggregation of multiple expert judgments into a coherent group decision. The application of AHP has been proven in previous research on technology adoption, digital transformation, and strategic planning in the public sector, which underlines its suitability for this context. For example, it has been used to evaluate the quality of AI-generated digital educational resources using the combined Delphi method and AHP [32], to prioritize corruption-prone stages in public procurement for blockchain integration [33], and to identify critical success factors for BIM implementation [34]. Furthermore, studies such as ceramic antenna manufacturing [35] demonstrate the use of AHP within the TOE framework, similar to the hybrid approach adopted in our study. Another study, such as chatbot adoption intention in the public sector [36], highlights a real-world gap where user-level perspectives could be added. Building on this established methodology, our study contributes to a novel application of AHP to assess the organizational readiness to adopt AI in the public sector while integrating the TOE and UTAUT frameworks to capture both systemic and individual determinants. Integrating both TOE and UTAUT frameworks is a viable methodology for assessing different technological, organizational, environmental, and individual factors influencing the adoption of a new technology [37,38].

3. Methodology

3.1. Research Design

This study adopts a multi-level, empirical approach to assess AI readiness in public sector organizations, with a specific focus on Slovenian municipalities. The unit of analysis includes both the organizational level (municipal administration) and the individual level (municipal managers), in alignment with the dual-level conceptual framework proposed in this paper. This structure enables the integration of individual perceptions (as captured through the AHP-based questionnaire) into a broader organizational readiness assessment.
The research unfolded in two sequential rounds, each designed to support instrument refinement, data consistency, and model robustness. In Round 1, a small municipality served as a pilot site, where 10 managers completed the online survey on 1 April 2025. In addition to providing data, respondents were asked to offer feedback on questionnaire clarity and logic, which informed the final design. This round served to test the usability and reliability of the AHP decision model in a real-world administrative context.
In Round 2, the refined instrument was distributed to four additional municipalities—ranging from small to medium size—with 19 completed responses collected between 3 April and 11 June 2025. The selection of municipalities was purposive, ensuring variability in the population size (from <10,000 to >40,000 residents), digital maturity, and AI exposure. The data collection was conducted via the 1 ka platform, using email invitations. Respondents evaluated AI readiness criteria using pairwise comparisons on a 1–9 scale, based on the AHP methodology. On average, completion time was approximately 20 min.
Sample: descriptive statistics (see Table 2).
The dataset included 29 respondents from Slovenian municipalities. The average respondent age was 46.9 years, ranging from 25 to 65 years. The average total work experience (tenure) was 21.4 years, with values ranging from 3 to 35 years. The sample comprised 62.1% women, 31.0% men, and 6.9% of respondents who did not disclose their gender. In terms of educational attainment, 51.7% held a university degree, 34.5% held a master’s degree or specialization, and 13.8% had a secondary or vocational degree. Only 20.7% of participants held a leadership role. Regarding self-assessed digital competencies, 20.7% rated their ICT skills as very high, 62.1% as good, and 13.8% as average. These descriptive characteristics indicate a relatively experienced, predominantly female, and well-educated sample with moderate leadership responsibilities and strong digital readiness—an important factor for AI adoption readiness assessments.
To ensure analytical rigor, we implemented several quality controls. Consistency ratios (CR) were calculated for each participant and for the aggregated matrices, with only responses meeting the threshold of CR < 0.10 included in the analysis. Priority weights for each AI-readiness criterion were derived using the eigenvector method, and geometric mean aggregation was used to synthesize group-level judgments. A sensitivity analysis was conducted by perturbing local weights ±10% and computing the impact on global priorities. Kendall’s W was also calculated to assess the level of agreement across municipalities.
The validity and reliability of the instrument were addressed through multiple strategies: (1) content validity was verified through expert review by two digital government scholars and one senior municipal CIO; (2) construct reliability was confirmed with a Cronbach’s α of 0.91 in the pilot round; and (3) internal consistency was strong, with group-level CR values of 0.024 (Round 1) and 0.004 (Round 2). To assess non-response bias, we compared early and late responders using t-tests on key priority weights, finding no significant differences (p > 0.10).
This study complied with all relevant ethical standards: participation was voluntary, informed consent was obtained, and all data were stored on an encrypted university server in line with GDPR regulations. By structuring the research in two iterative phases and ensuring methodological transparency, this study builds a robust and replicable empirical foundation for understanding and supporting AI adoption in the public sector.

3.2. Method

Firstly, to determine the relative importance of the factors identified within these frameworks, this study applies the Analytic Hierarchy Process (AHP) [39]. According to previous research, the AHP is well-suited to be used in group decision problems and conflict resolution. The creator of AHP argues that pairwise comparisons are essential for measuring intangible factors and deriving relative scales [39,40]. However, the AHP has faced criticism for potentially producing arbitrary rankings [41]. Despite this, AHP is a widely used method for group decision-making [42], offering several advantages as it allows for the aggregation of individual judgments or priorities using geometric or arithmetic means [43,44]. AHP can prioritize elements, establish key measures, and provide more accurate judgments in business decisions [45]. The method incorporates consistency tests to improve response quality [45]. Various approaches exist for assigning weights to decision-makers, including the geometric mean method (GMM) and eigenvector method [42,46], which will be used in our case.

3.3. Proposed Model

The proposed decision model for assessing organizational readiness for AI was developed as a hierarchical, tree-like structure that embeds thirteen criteria into four categories—namely, technology, organization, environment, and individual readiness. The proposed decision model comprises four categories: technology, organization, and environment, derived from the TOE framework, and individual readiness, derived from the UTAUT model. The TOE framework is well-suited for assessing external and organizational factors that influence technology adoption as it focuses on technological, organizational, and environmental factors. However, the TOE framework does not explicitly address individual-level factors that are critical to understanding user acceptance and readiness, especially in the public sector, where acceptance often depends on employee attitudes and behavior.
To address this gap, the proposed model includes individual readiness based on UTAUT, which was specifically developed to explain individual technology acceptance and use. UTAUT includes constructs such as performance expectancy, effort expectancy, social influence, and facilitating conditions, which are directly relevant to assessing whether people are ready, willing, and able to adopt and use new technologies. By integrating the individual level of UTAUT with the organizational and contextual aspects of TOE, the proposed model provides a comprehensive view of AI readiness that captures both the systemic (TOE) and human (UTAUT) dimensions of adoption.
Secondly, we created a structured questionnaire that was distributed to municipal managers. In this structured questionnaire, we asked managers to rate the relative importance of each criterion and category. They were asked to make pairwise comparisons between the criteria in each category and pairwise comparisons between all four categories. Managers had to rate each comparison on a scale of one to nine, where one meant that both criteria were equally important; three meant that the first criterion was moderately more important than the second; five meant that the first criterion was significantly more important than the second; seven meant that the first criterion was very significantly more important than the second; and nine meant that the first criterion was extremely more important than the second. Managers used pairwise comparisons to prioritize the evaluation criteria. Manager participation was voluntary, respondents were informed of the purpose of our study, and anonymity and confidentiality were guaranteed so we did not influence their judgment in the pairwise comparison.
Third, since our questionnaire was distributed to numerous municipal managers and we conducted numerous pairwise comparisons, we applied AHP to our group decision problem. Quantitative data were analyzed using AHP to determine the weight of various factors influencing organizational readiness for artificial intelligence. Their responses were translated into pairwise comparison matrices. Based on these pairwise comparison matrices, the final weights were calculated using the geometric mean method. Finally, we calculated the consistency index (CI) and consistency ratio (CR) to check whether the collected pairwise comparisons are consistent.
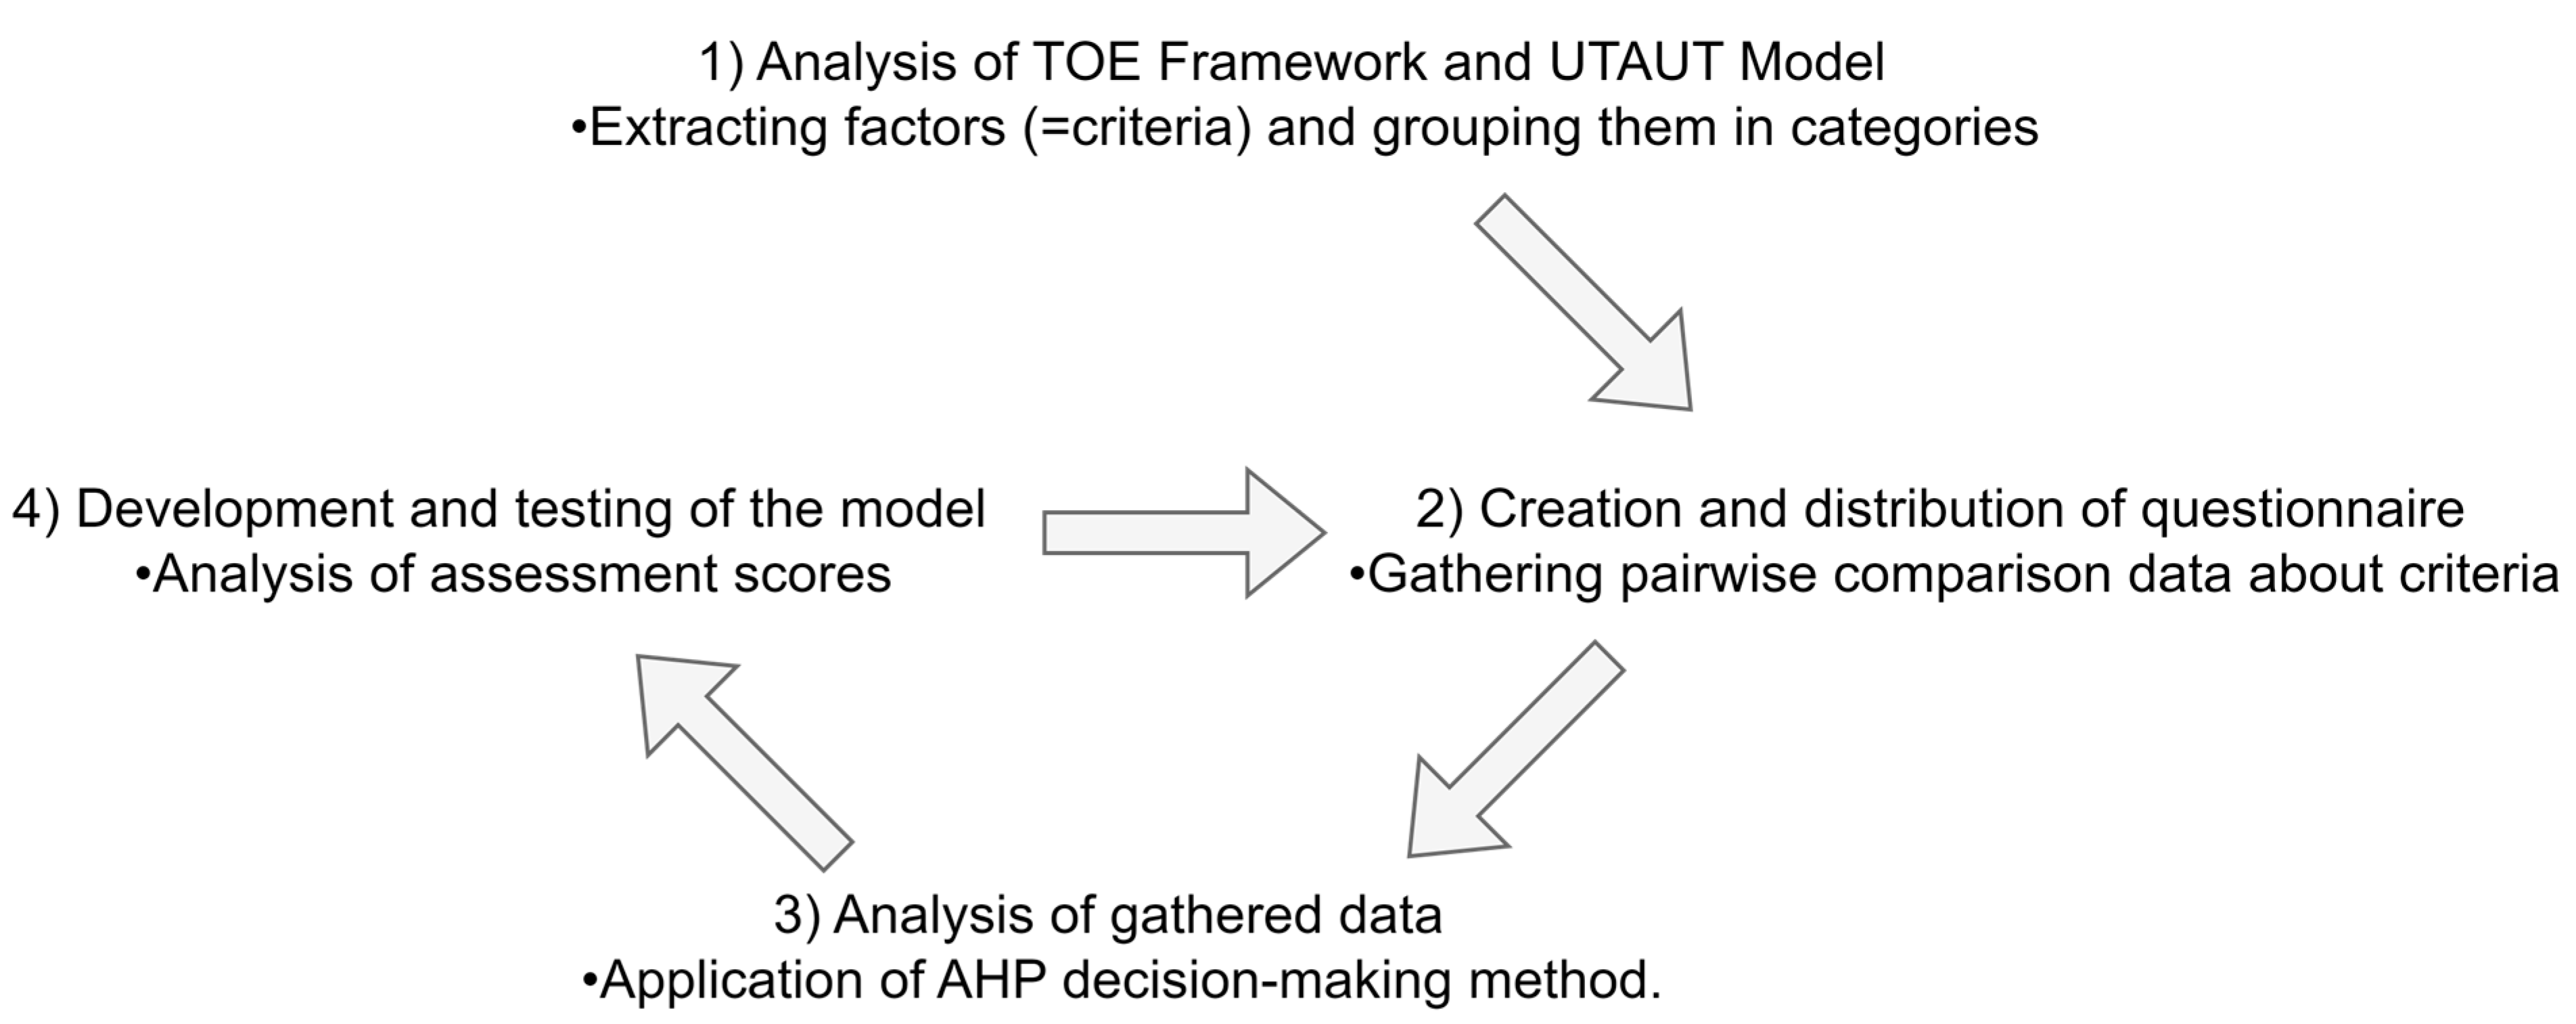
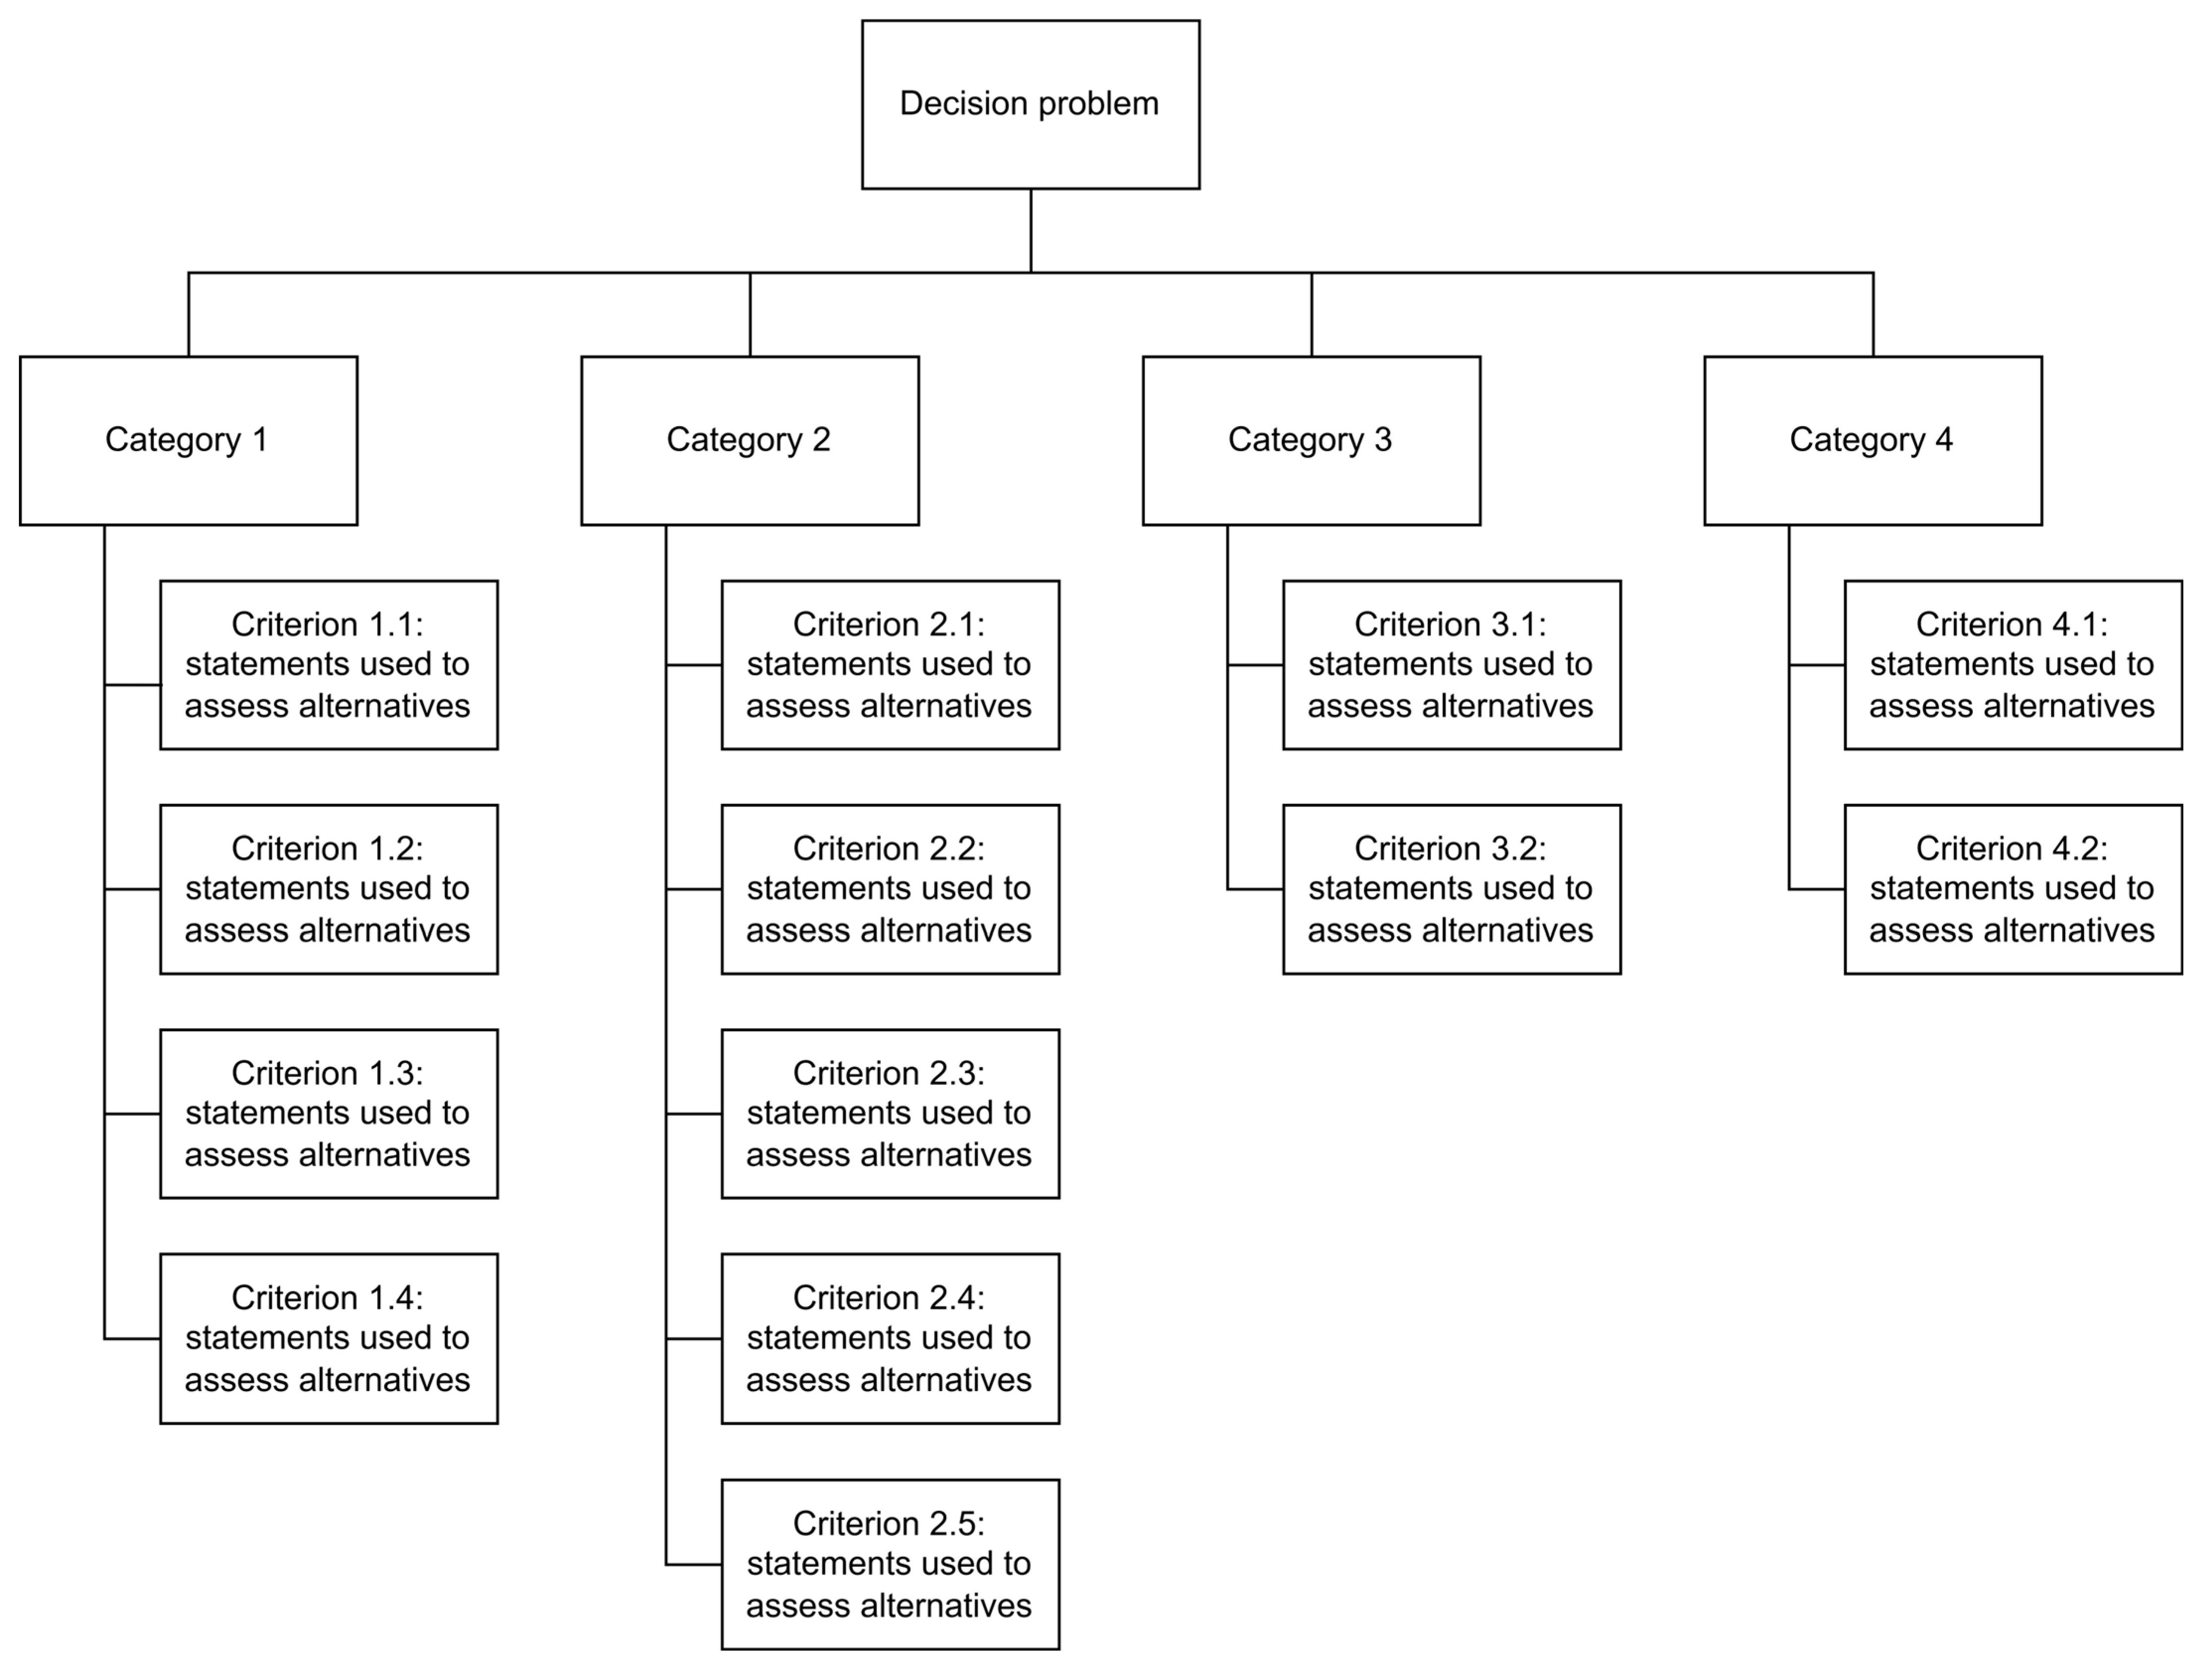
Lastly, we developed our model and tested it on synthetic cases (see Figure 2). Figure 3 shows the general structure of the decision support model.
After collecting the managers’ questionnaire responses, we analyzed them using AHP [40]. First, we created the pairwise comparison matrices. For each level (e.g., criteria), we constructed a reciprocal matrix,
A = a i j
where
  • aij represents the relative importance of element I compared to element j;
  • aji = 1/aij and aii = 1.
Once we had created pairwise comparison matrices for all respondents, we aggregated the individual judgments using the geometric mean and combined the pairwise-comparison matrices into a single matrix. We then normalized these new matrices and calculated priority vectors. By calculating the priority vectors, we obtained a weighting for each category and for all criteria used in our decision model. The priority vectors (weights) were calculated using the eigenvector method:
Let
A     w = λ m a x     w
where
  • A is the comparison matrix;
  • w is the eigenvector of priorities;
  • λmax is the maximum eigenvalue of matrix A.
We normalized the resulting eigenvector w so
i = 1 n w i = 1
Once we calculated the lambda max, we calculated the CI. We used the principal eigenvalue, lambda max, calculated from
λ m a x = 1 n i = i n A w i w i
The consistency index was then computed as follows:
C I = λ m a x n n 1
Finally, we calculated the consistency ratio:
C R =   C I R I
where RI is the random index that depends on the matrix size n, shown in Table 3.
All calculations, including aggregation, normalization, eigenvalue approximation, and consistency checks, were implemented in Microsoft Excel. User-defined formulas based on the standard AHP method were used, enabling transparent and reproducible calculation of weights and consistency measures.
If CI is 0, the pairwise comparisons are perfectly consistent; if CI is close to 0, most pairwise comparisons are largely consistent, which is also acceptable. If CI > 0.1, the pairwise comparisons are too inconsistent, and a review is required. The situation is similar to the CR. Matrices with CR < 0.1 are considered sufficiently consistent. The whole procedure was also repeated for the second-level criteria.
We also calculated global weights for all criteria:
g w c i j =   w c i w c i j
The attributes at the lowest level (i.e., the basic attributes) have a scale with yes/partially/no options/values, i.e., for each basic criterion presented, a question is defined that must be answered on a yes/partially/no scale. This three-point scale is translated into numerical values 1 (yes), 0.5 (partially), and 0 (no).
The overall score of the organization is calculated with a bottom-up approach using the weighted average. In general, we first calculate the score for the first-level categories:
  • Score for the category technology is calculated as follows:
S c 1 = j = 1 n e c 1 j w c 1 j
  • Score for the category organization is calculated as outlined below:
S c 2 = j = 1 n e c 2 j w c 2 j
  • Score for the category environment is calculated as follows:
S c 3 = j = 1 n e c 3 j w c 3 j
  • Score for the category individual readiness is calculated as detailed below:
S c 4 = j = 1 n e c 4 j w c 4 j
Finally, we calculate the overall score for the organization.
  • Overall score for the organization:
S 0 = j = 1 m S c i w c i
All the variables used are explained in Table 4.
The resulting overall score is a normalized value between 0 and 1, which we express as a percentage (0–100%) for clarity and interpretability, as is common in AHP-based decision models. This percentage represents the relative proximity of the organization to full readiness for artificial intelligence adoption.
The readiness of an organization for artificial intelligence is based on the overall percentage (0–100%). There are five readiness levels, namely initial level (0–20%), basic level (20.1–40%), developing level (40.1–60%), advanced level (60.1–80%), and optimized level (80.1–100%) (see Table 5).
The initial level means that the organization is not yet ready for the implementation of AI. An organization that has achieved enough points to be classified at the basic level is at an early stage of readiness for the use of AI. An organization that is rated at the developing level is an organization that is moving towards readiness for AI implementation. Organizations that are well-prepared for AI implementation are classified at an advanced level. Organizations that are fully prepared for the implementation and optimization of AI use are classified at the “optimized” level.

4. Results

4.1. Structure of the Decision Model

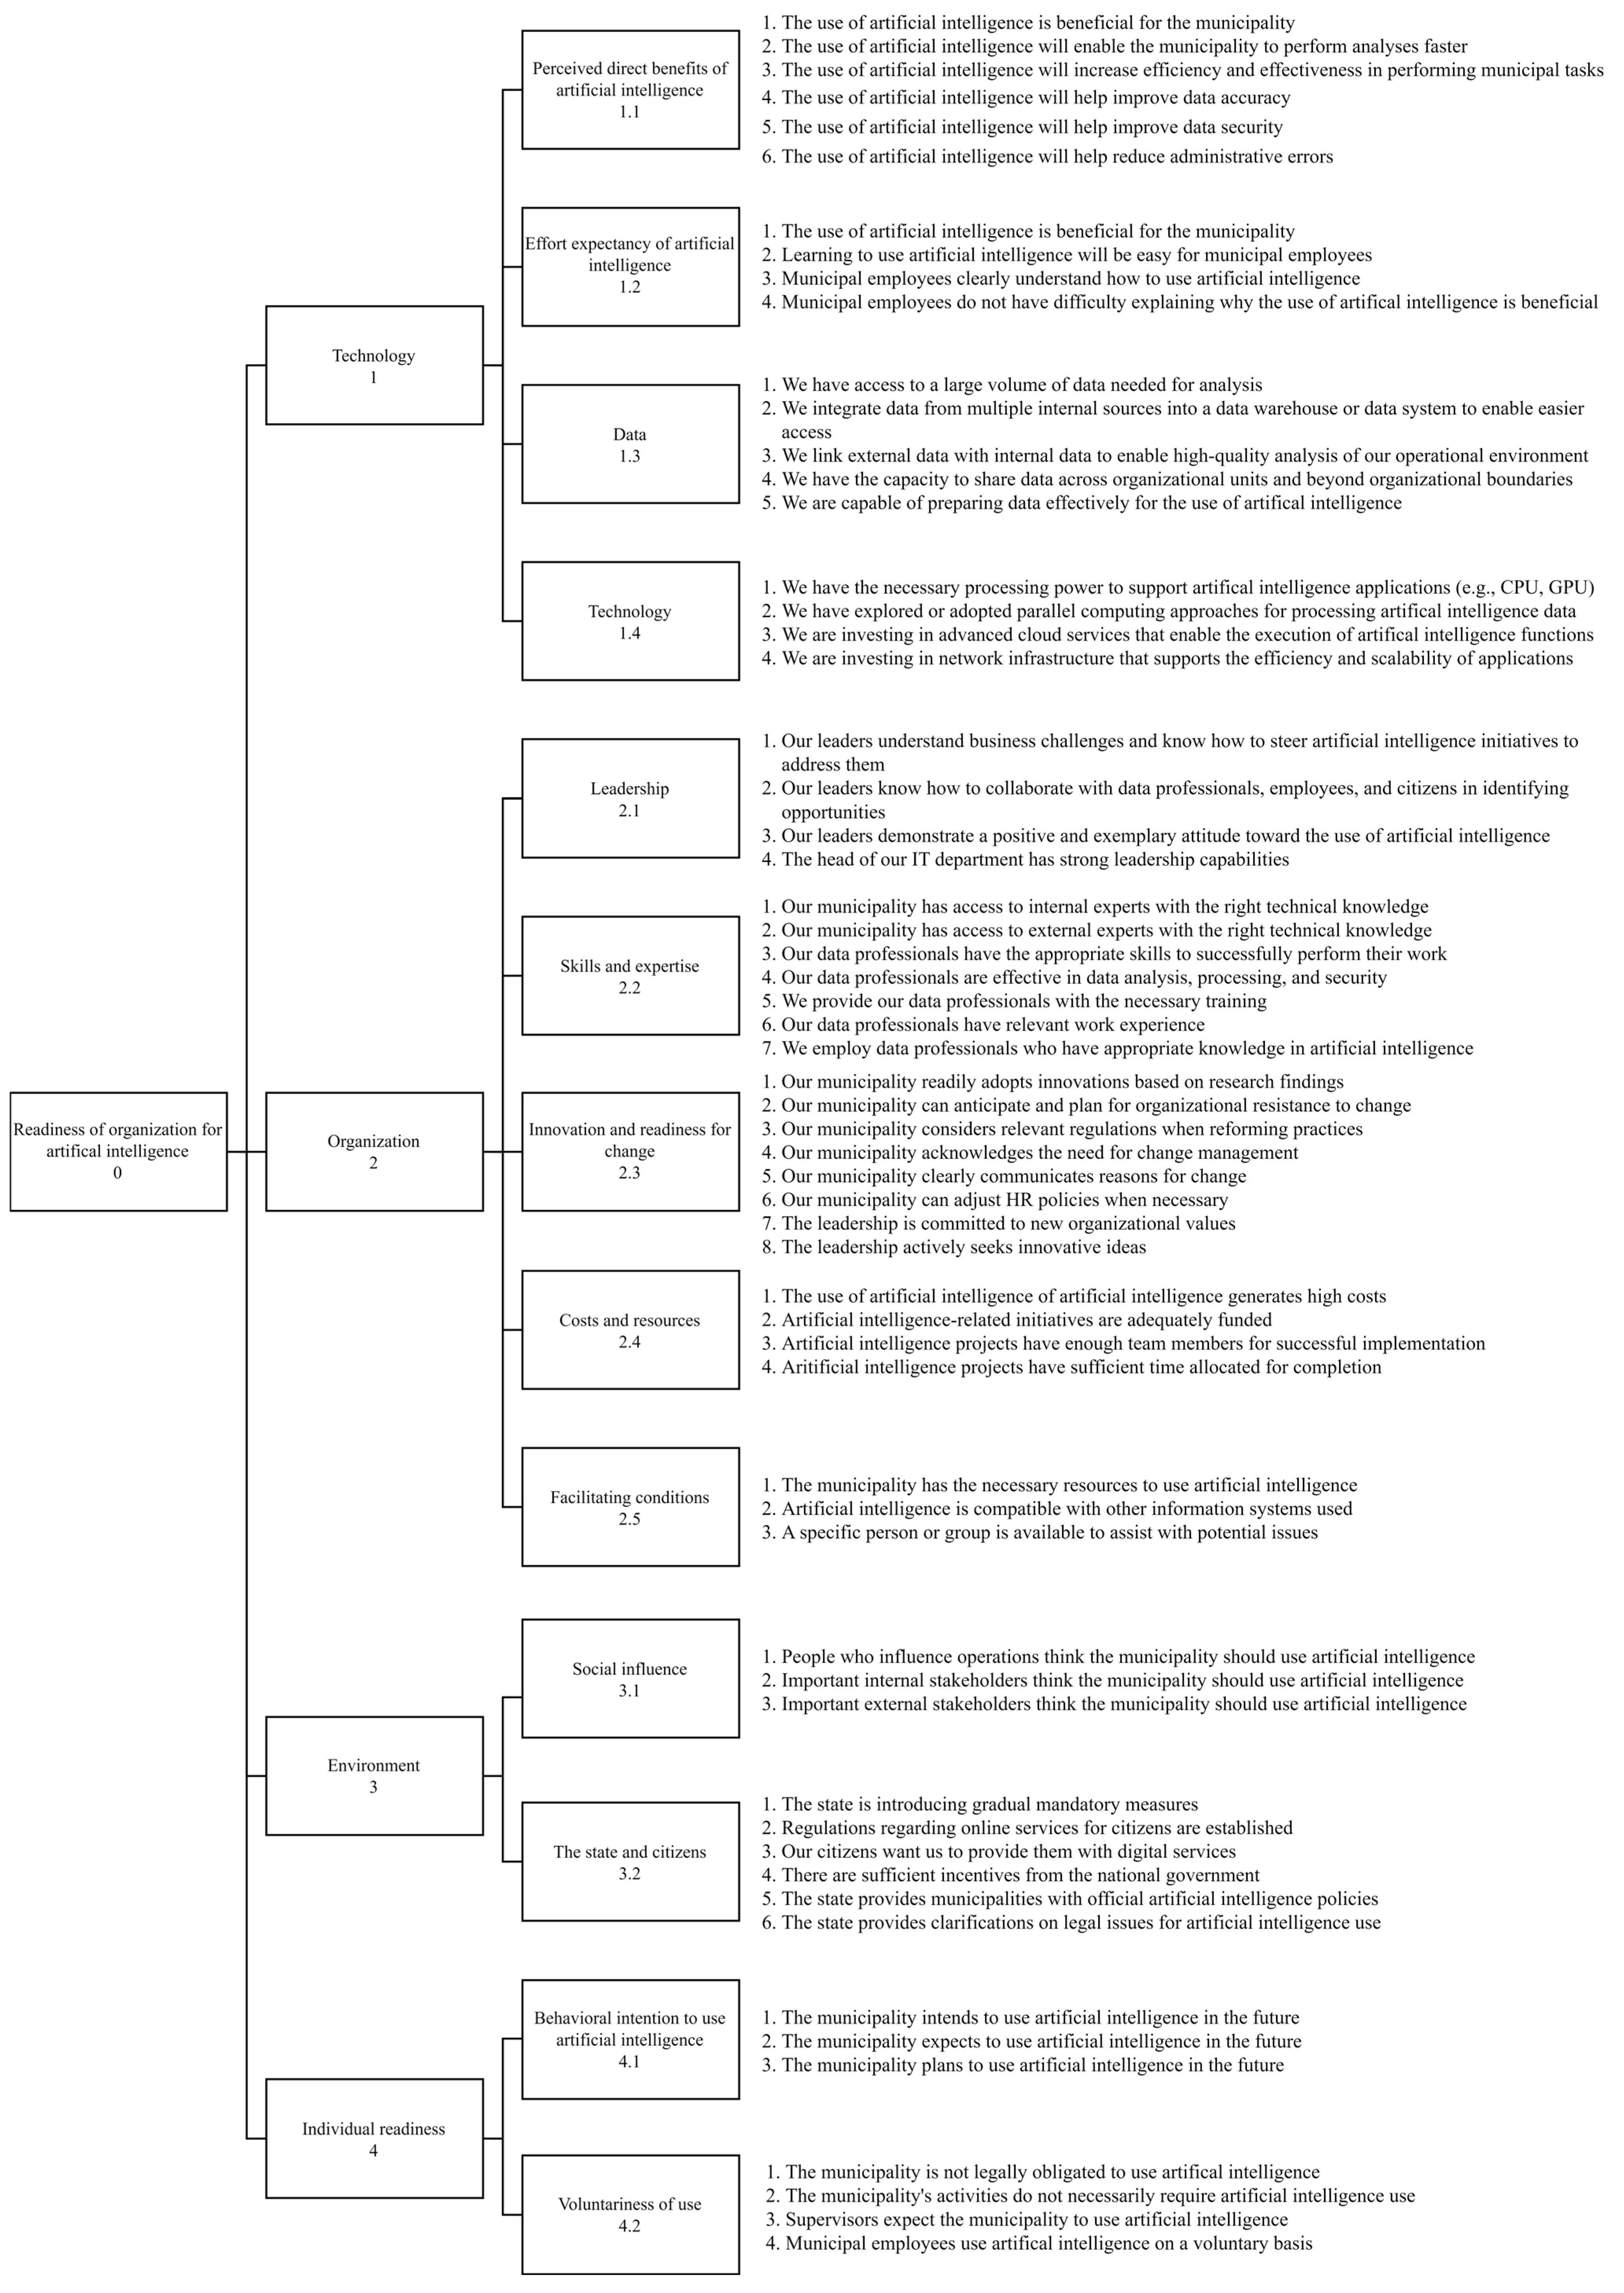
Figure 4 below presents the proposed decision model. The proposed decision model is hierarchical and consists of four categories, namely technology, organization, environment, and individual readiness. Each category consists of several criteria that are relevant for assessing an organization’s readiness to adopt AI.
To support a consistent and meaningful assessment, each criterion is operationalized through a set of guiding statements that the decision-maker considers during the assessment process. These statements serve to clarify the intent and scope of each criterion to ensure that the assessments are based on a common understanding of the underlying dimensions being assessed.
The following list presents all the criteria grouped under their respective categories, along with their associated guiding statements.
  • 1. Technology
    • 1.1. Perceived direct benefits of artificial intelligence
      • 1.1.1. The use of artificial intelligence is beneficial for the municipality;
      • 1.1.2. The use of artificial intelligence will enable the municipality to perform analyses faster;
      • 1.1.3. The use of artificial intelligence will increase efficiency and effectiveness in performing municipal tasks;
      • 1.1.4. The use of artificial intelligence will help improve data accuracy;
      • 1.1.5. The use of artificial intelligence will help improve data security;
      • 1.1.6. The use of artificial intelligence will help reduce administrative errors.
    • 1.2. Effort expectancy of artificial intelligence
      • 1.2.1. It will be easy for municipal employees to acquire the skills needed to use artificial intelligence;
      • 1.2.2. Learning to use artificial intelligence will be easy for municipal employees;
      • 1.2.3. Municipal employees clearly understand how to use artificial intelligence;
      • 1.2.4. Municipal employees do not have difficulty explaining why the use of artificial intelligence is beneficial.
    • 1.3. Data
      • 1.3.1. We have access to a large volume of data needed for analysis;
      • 1.3.2. We integrate data from multiple internal sources into a data warehouse or data system to enable easier access;
      • 1.3.3. We link external data with internal data to enable high-quality analysis of our operational environment;
      • 1.3.4. We have the capacity to share data across organizational units and beyond organizational boundaries;
      • 1.3.5. We are capable of preparing data effectively for the use of artificial intelligence.
    • 1.4. Technology
      • 1.4.1. We have the necessary processing power to support artificial intelligence applications (e.g., CPU, GPU);
      • 1.4.2. We have explored or adopted parallel computing approaches for processing artificial intelligence data;
      • 1.4.3. We are investing in advanced cloud services that enable the execution of artificial intelligence functions;
      • 1.4.4. We are investing in network infrastructure that supports the efficiency and scalability of applications.
  • 2. Organization
    • 2.1. Leadership
      • 2.1.1. Our leaders understand business challenges and know how to steer artificial intelligence initiatives to address them;
      • 2.1.2. Our leaders know how to collaborate with data professionals, employees, and citizens in identifying opportunities;
      • 2.1.3. Our leaders demonstrate a positive and exemplary attitude toward the use of artificial intelligence;
      • 2.1.4. The head of our IT department has strong leadership capabilities.
    • 2.2. Skills and abilities
      • 2.2.1. Our municipality has access to internal experts with the right technical knowledge;
      • 2.2.2. Our municipality has access to external experts with the right technical knowledge;
      • 2.2.3. Our data professionals have the appropriate skills to successfully perform their work;
      • 2.2.4. Our data professionals are effective in data analysis, processing, and security;
      • 2.2.5. We provide our data professionals with the necessary training;
      • 2.2.6. Our data professionals have relevant work experience;
      • 2.2.7. We employ data professionals who have appropriate knowledge in AI.
    • 2.3. Innovation and readiness for change
      • 2.3.1. Our municipality readily adopts innovations based on research findings;
      • 2.3.2. Our municipality can anticipate and plan for organizational resistance to change;
      • 2.3.3. Our municipality considers relevant regulations when reforming practices;
      • 2.3.4. Our municipality acknowledges the need for change management;
      • 2.3.5. Our municipality clearly communicates reasons for change;
      • 2.3.6. Our municipality can adjust HR policies when necessary;
      • 2.3.7. The leadership is committed to new organizational values;
      • 2.3.8. The leadership actively seeks innovative ideas.
    • 2.4. Costs and resources
      • 2.4.1. The use of artificial intelligence generates high costs;
      • 2.4.2. Artificial intelligence-related initiatives are adequately funded;
      • 2.4.3. AI projects have enough team members for successful implementation;
      • 2.4.4. AI projects have sufficient time allocated for completion.
    • 2.5. Facilitating conditions
      • 2.5.1. The municipality has the necessary resources to use artificial intelligence;
      • 2.5.2. Artificial intelligence is compatible with other information systems used;
      • 2.5.3. A specific person or group is available to assist with potential issues.
  • 3. Environment
    • 3.1. Social influence
      • 3.1.1. People who influence operations think the municipality should use AI;
      • 3.1.2. Important internal stakeholders think the municipality should use AI;
      • 3.1.3. Important external stakeholders think the municipality should use AI.
    • 3.2. The state and the citizens
      • 3.2.1. The state is introducing gradual mandatory measures;
      • 3.2.2. Regulations regarding online services for citizens are established;
      • 3.2.3. Our citizens want us to provide them with digital services;
      • 3.2.4. There are sufficient incentives from the national government;
      • 3.2.5. The state provides municipalities with official AI policies;
      • 3.2.6. The state provides clarifications on legal issues for AI use.
  • 4. Individual readiness
    • 4.1. Behavioral intention to use artificial intelligence
      • 4.1.1. The municipality intends to use artificial intelligence in the future;
      • 4.1.2. The municipality expects to use artificial intelligence in the future;
      • 4.1.3. The municipality plans to use artificial intelligence in the future.
    • 4.2. Voluntariness of use
      • 4.2.1. The municipality is not legally obligated to use artificial intelligence;
      • 4.2.2. The municipality’s activities do not necessarily require AI use;
      • 4.2.3. Supervisors expect the municipality to use artificial intelligence;
      • 4.2.4. Municipal employees use artificial intelligence on a voluntary basis.
In the next subsection, the results gathered will be presented.

4.2. Outputs of the Decision Model

The data collected using questionnaires and analyzed using the AHP decision method are presented in the following tables and figures. The values for the weights (priority vectors), consistency index (CI), and consistency ratio (CR) were calculated based on the formulas described in the Methodology Section (see Section 3.3. Proposed Model, Equations (2)–(6).
Specifically,
  • The weights were derived using the principal eigenvector of the aggregated pairwise comparison matrices;
  • CI was calculated C I = λ m a x n n 1 ;
  • CR was calculated as C R =   C I R I , where RI is the random index.
Table 6 shows the weights, CI, and CR of the categories at level 1. After the first round of data gathering, the most important criterion based on managers’ responses to the questionnaire is individual readiness, the second most important is organization, the third is technology, and the least important is the environment. The consistency index and consistency ratio are below 0.1, which means that they are sufficiently consistent. After the second round of data gathering, the criteria weights and ranking changed. The most important criterion is still individual readiness, and the second most important is organization. Environment and technology change order, where environment is now the third most important criterion, and the least important criterion is technology. The consistency index and consistency ratio also stayed below 0.1.
In the technology category (Table 7), criterion importance ranking after the first round of data gathering is as follows: data are the most important criterion; technology is in second place; the effort expectancy of artificial intelligence is in third place; and the least important criterion is the perceived direct benefits of artificial intelligence. Consistency index and consistency ratio are 0.043 and 0.047, respectively, which means that the weights are sufficiently consistent.
After the second round of data gathering, the importance of the criteria has changed. Data are still the most important criterion, effort expectancy of artificial intelligence is second, closely followed by technology, and the least important is the perceived direct benefits of artificial intelligence. Consistency index and consistency ratio change to 0.0024 and 0.0027, respectively, which means that as they stayed below 0.1, the weights are sufficiently consistent.
Table 8 shows the weights, CI, and CR in the organization category. After the first round of data gathering, the most important criterion is skills and expertise, the second is innovation and readiness for change, the third is costs and resources, the fourth is leadership, and the least important criterion is facilitating conditions. Weights are sufficiently consistent as the consistency index and consistency ratio are below 0.1. After the second round of data gathering, the most important criterion becomes innovation and readiness for change; the second is skills and expertise; the third criterion is leadership; fourth is facilitating conditions; and the least important criterion is costs and resources. Consistency index is 0.0052 and consistency ratio is 0.0046, which means that weights are sufficiently consistent.
The environment category (Table 9) has only two criteria, and after both rounds of data gathering, social influence is much more important than the state and citizens.
Table 10 shows the weights and the consistency ratio for the category individual readiness. After both rounds of data gathering, voluntariness is much more important than the behavioral intention to use artificial intelligence. Table 9 and Table 10 also show a perfect CI and CR, which means that all pairwise judgments are perfectly aligned.
Table 11 shows the global weights and ranks for all criteria, based on both rounds of data collection. These weights were calculated using the hierarchical aggregation formula, shown in Equation (7), in which the local weight of each criterion was multiplied by the weight of its parent category to obtain its global weight.
In both rounds, the three most important criteria remained the same: voluntariness of use, social influence, and behavioral intention to use artificial intelligence. These criteria have the greatest influence on the overall readiness score due to their high global weights. In addition, three other criteria are worth mentioning: skills and expertise (from the first round of data gathering), innovation and readiness for change, and the state and citizens (after both rounds of data gathering). The criterion skills and expertise exceeded the average global weight in the first round of data gathering, while innovation and readiness for change and the state and citizens exceeded the average in the second round of data gathering.
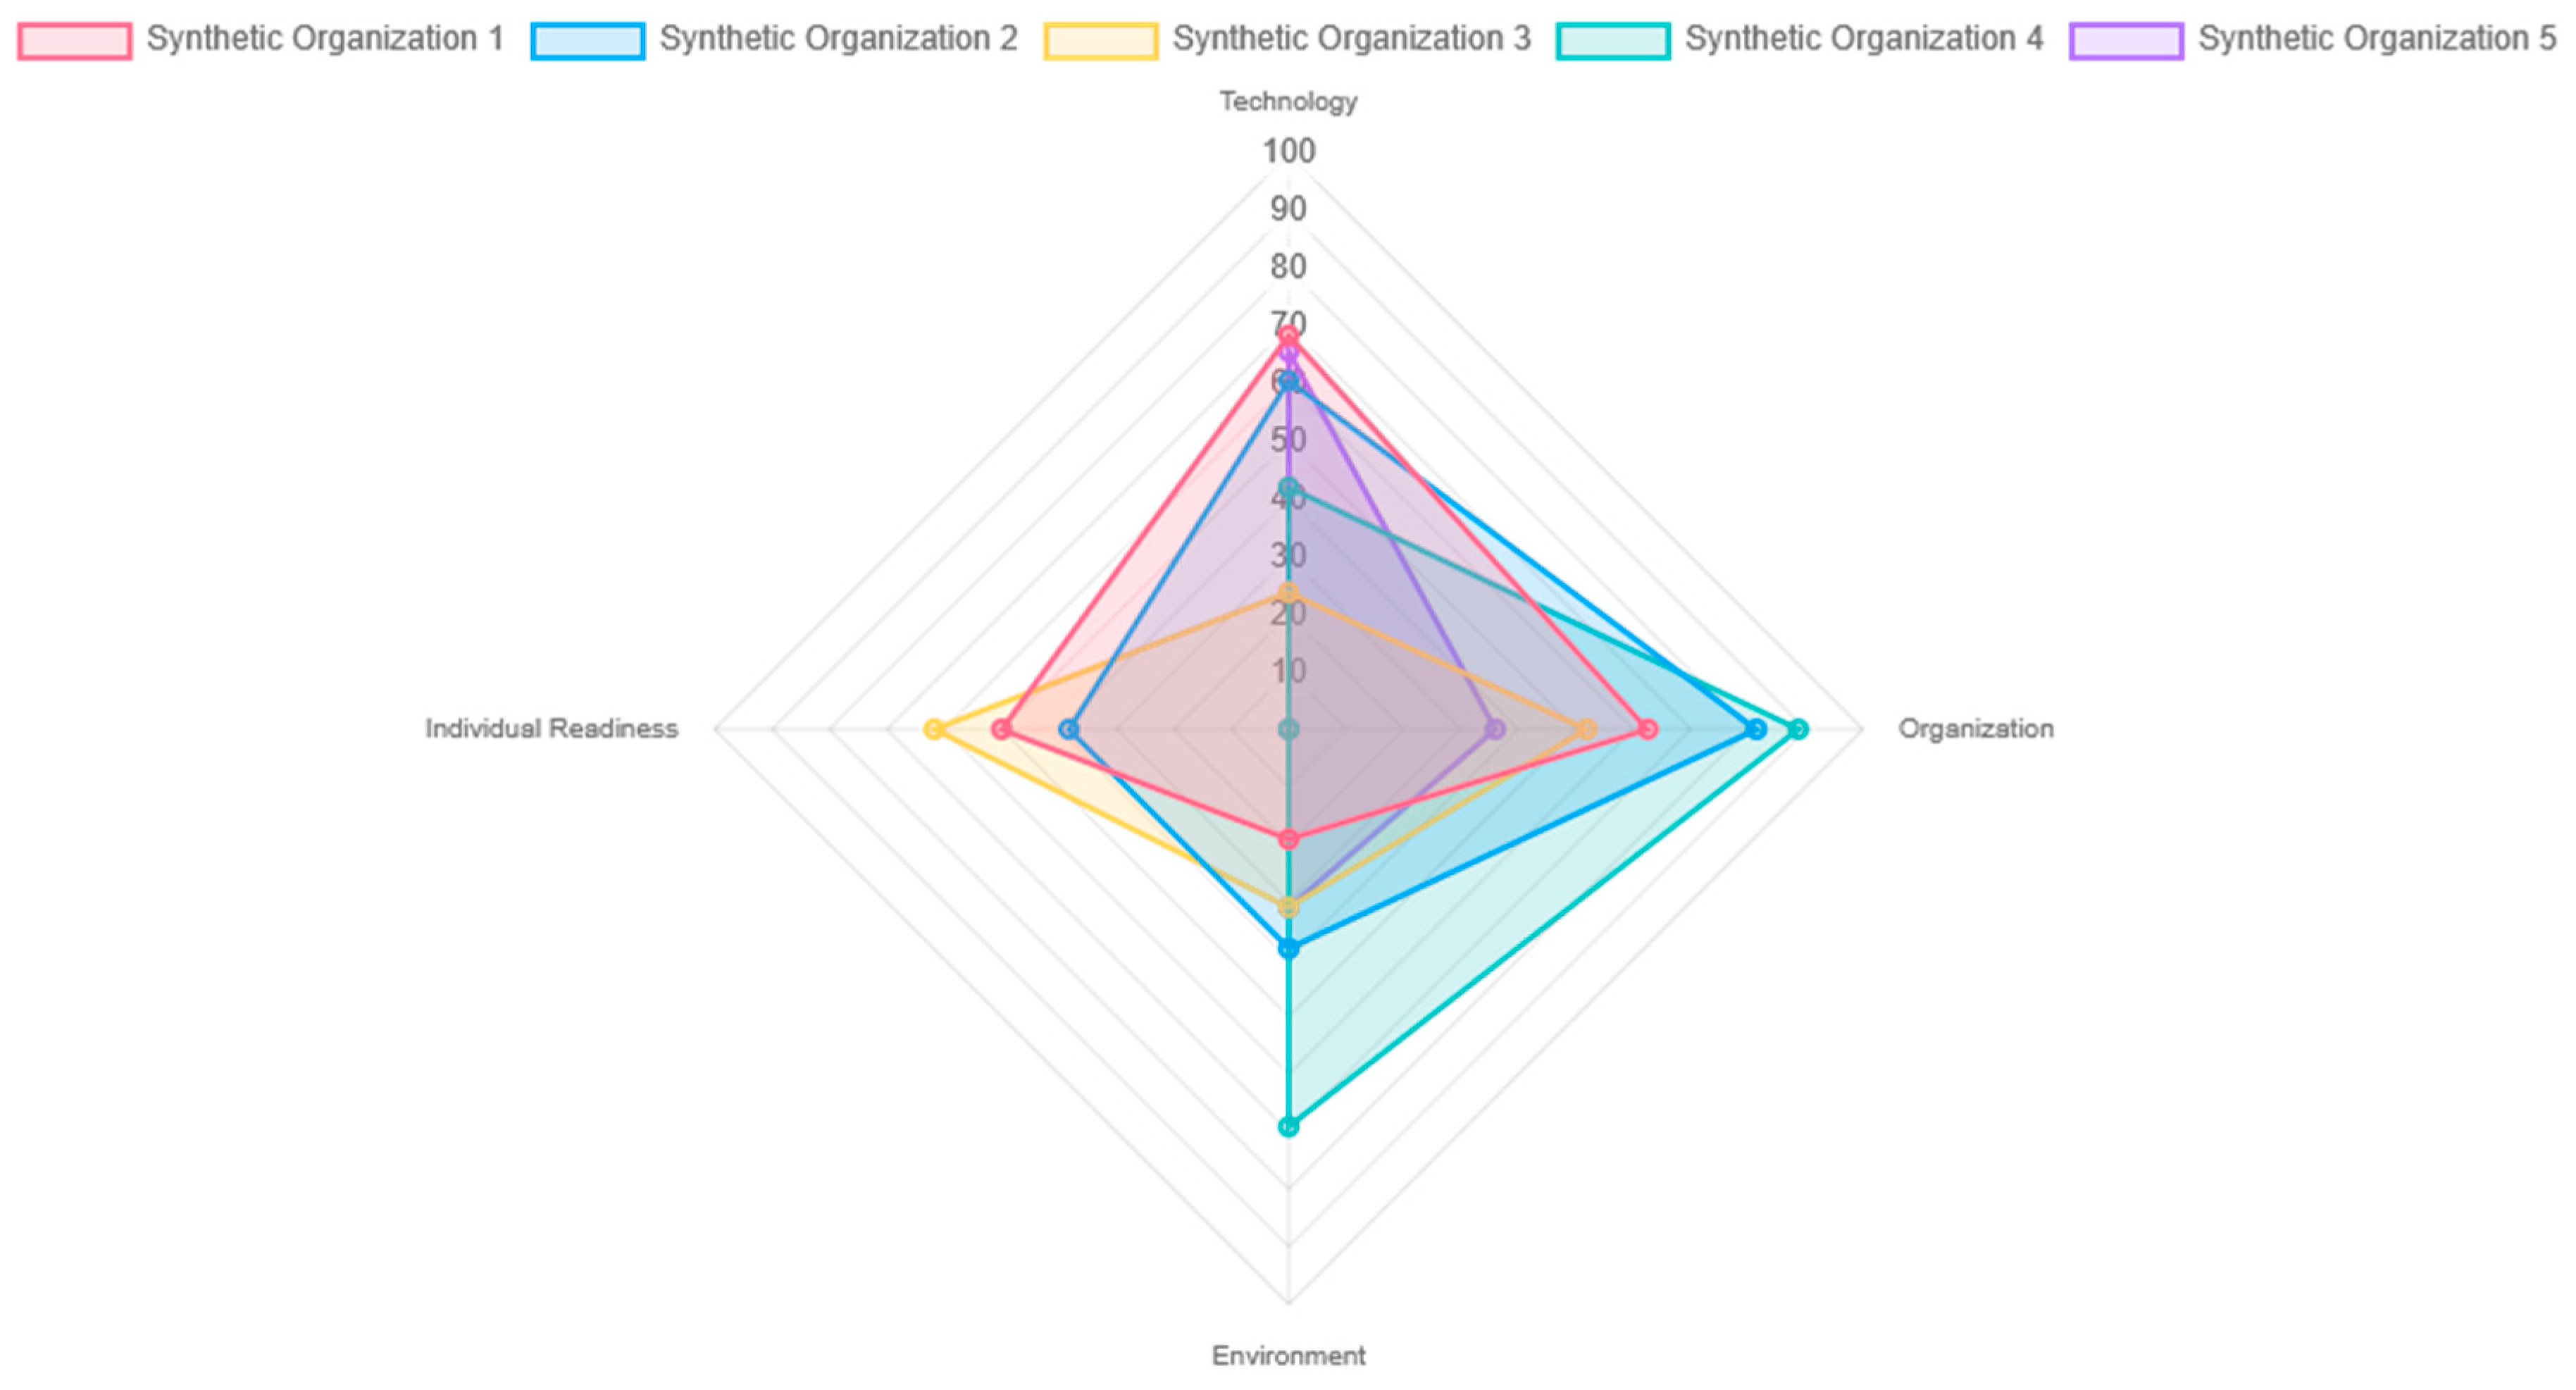
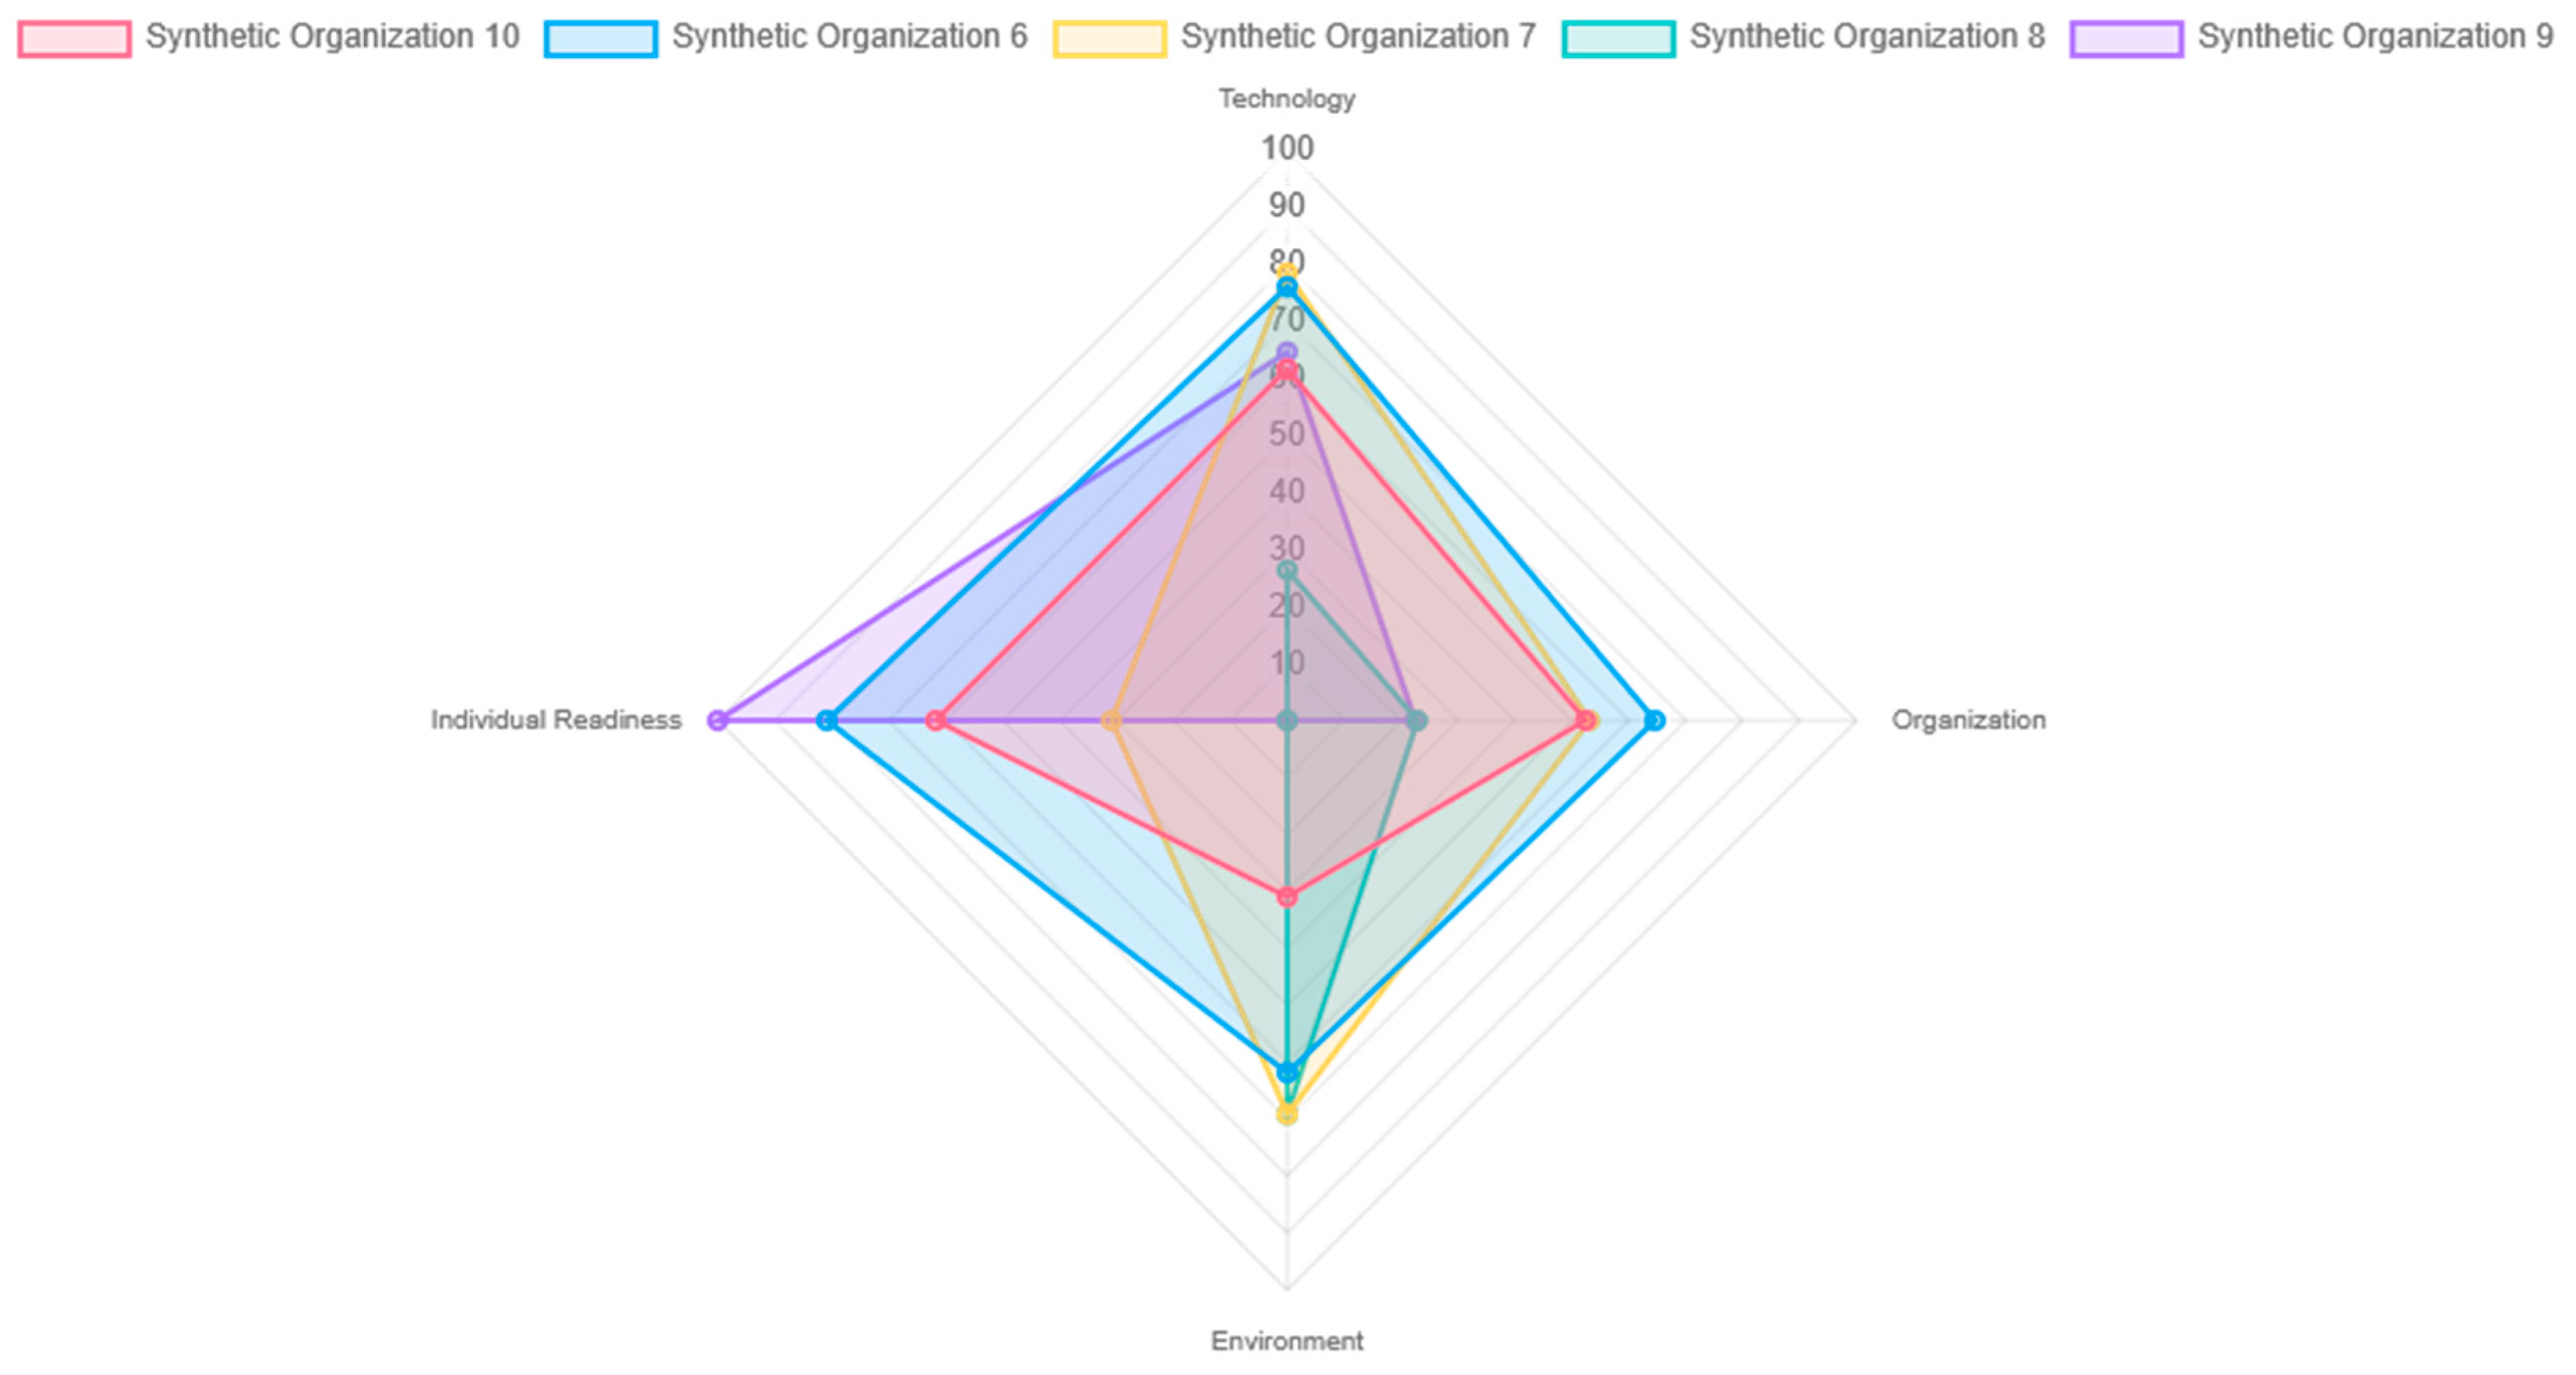
Figure 5 and Figure 6 show the assessment results for all synthetic organizations after the first round of data gathering based on four categories on a radar chart. The radar chart shows the score on a scale from 0 to 100 for each organization it received in the corresponding category.
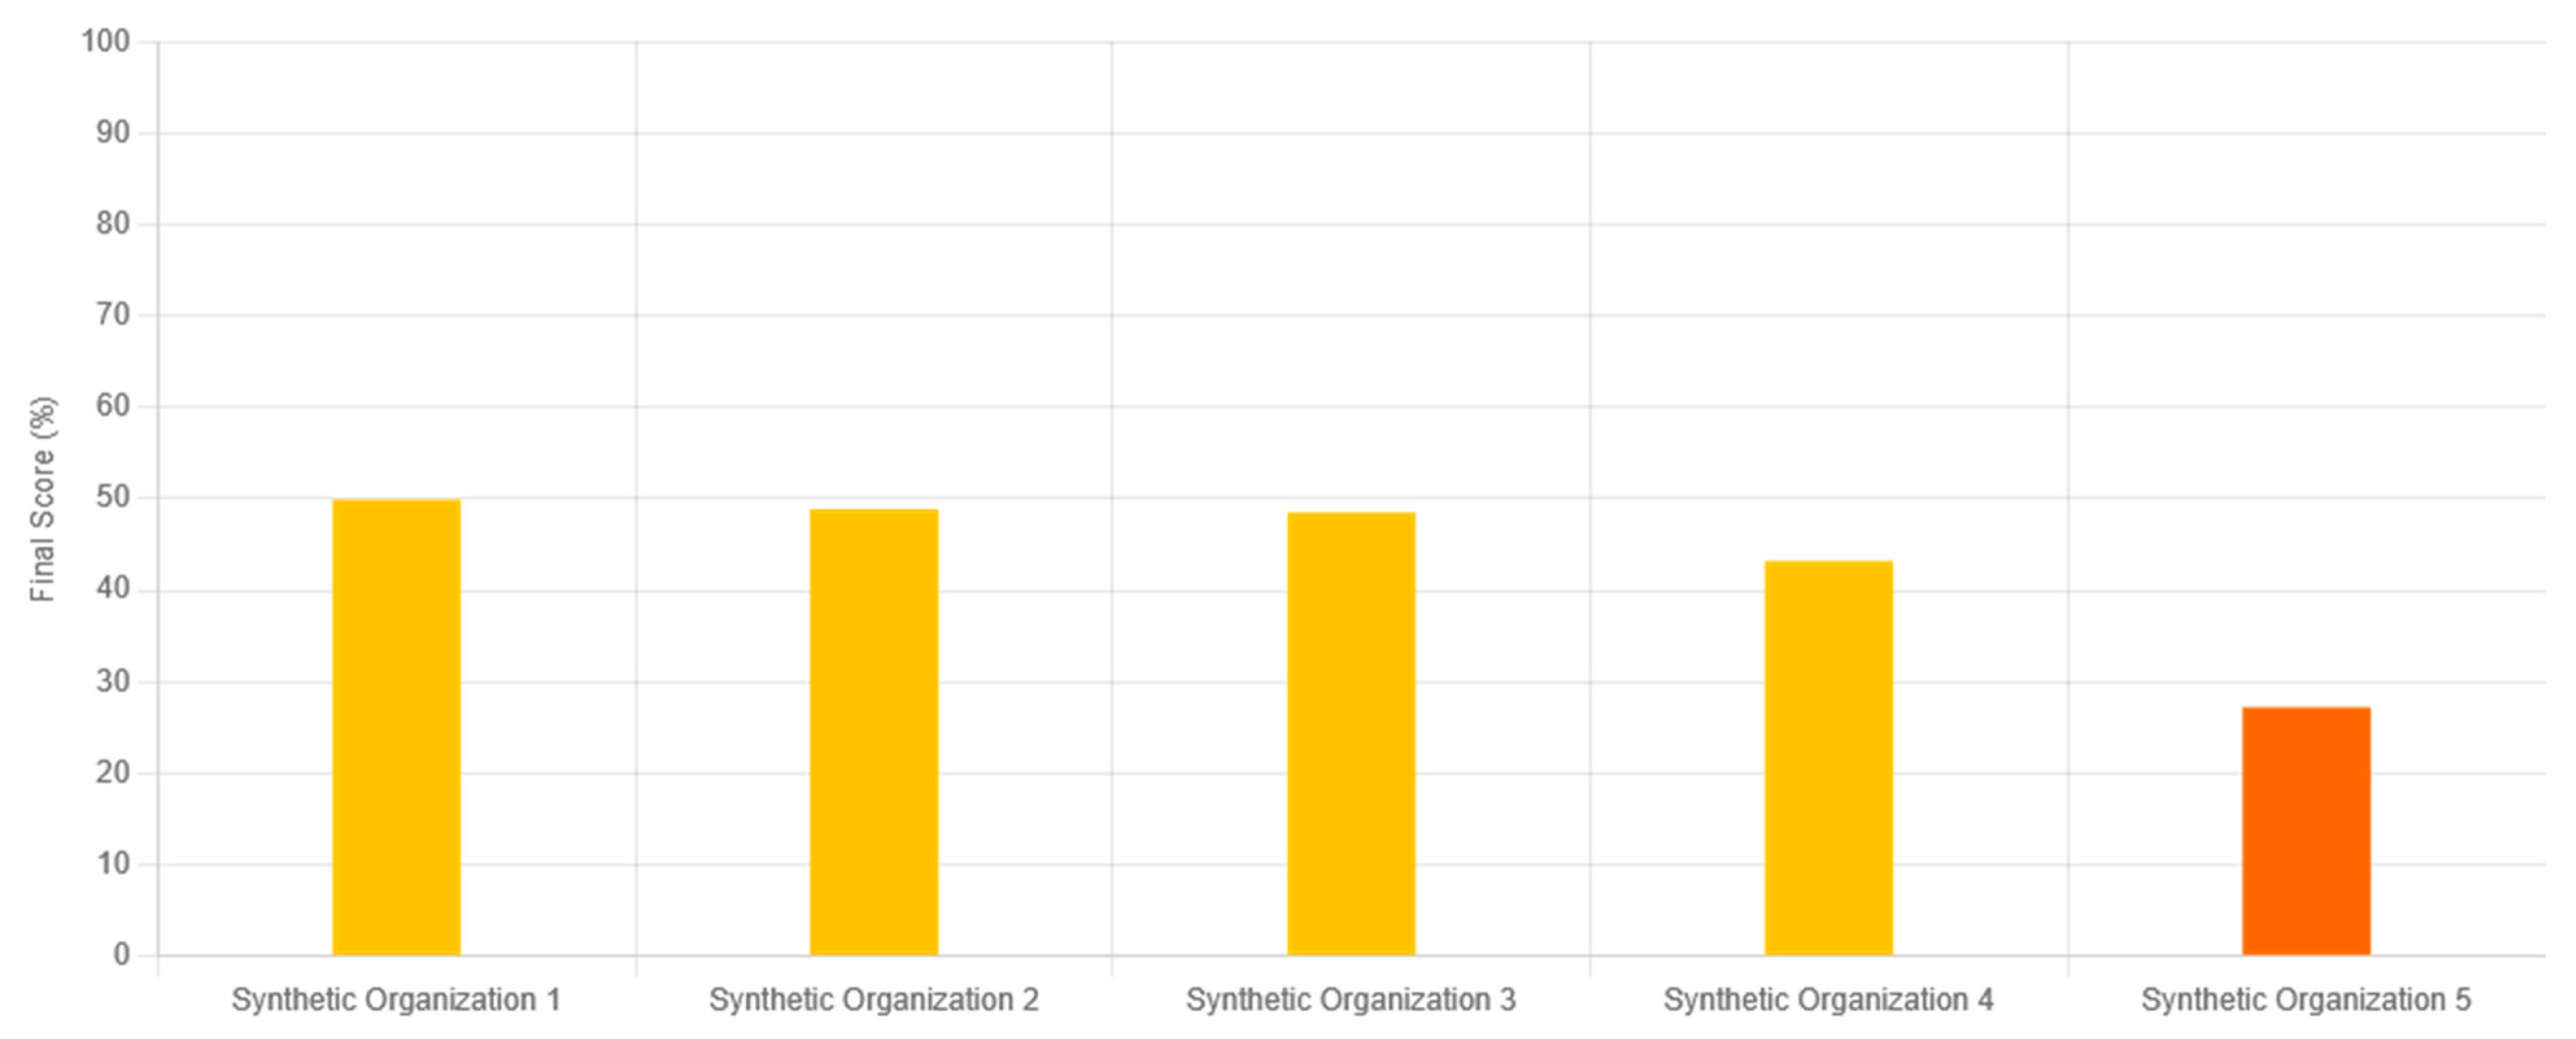
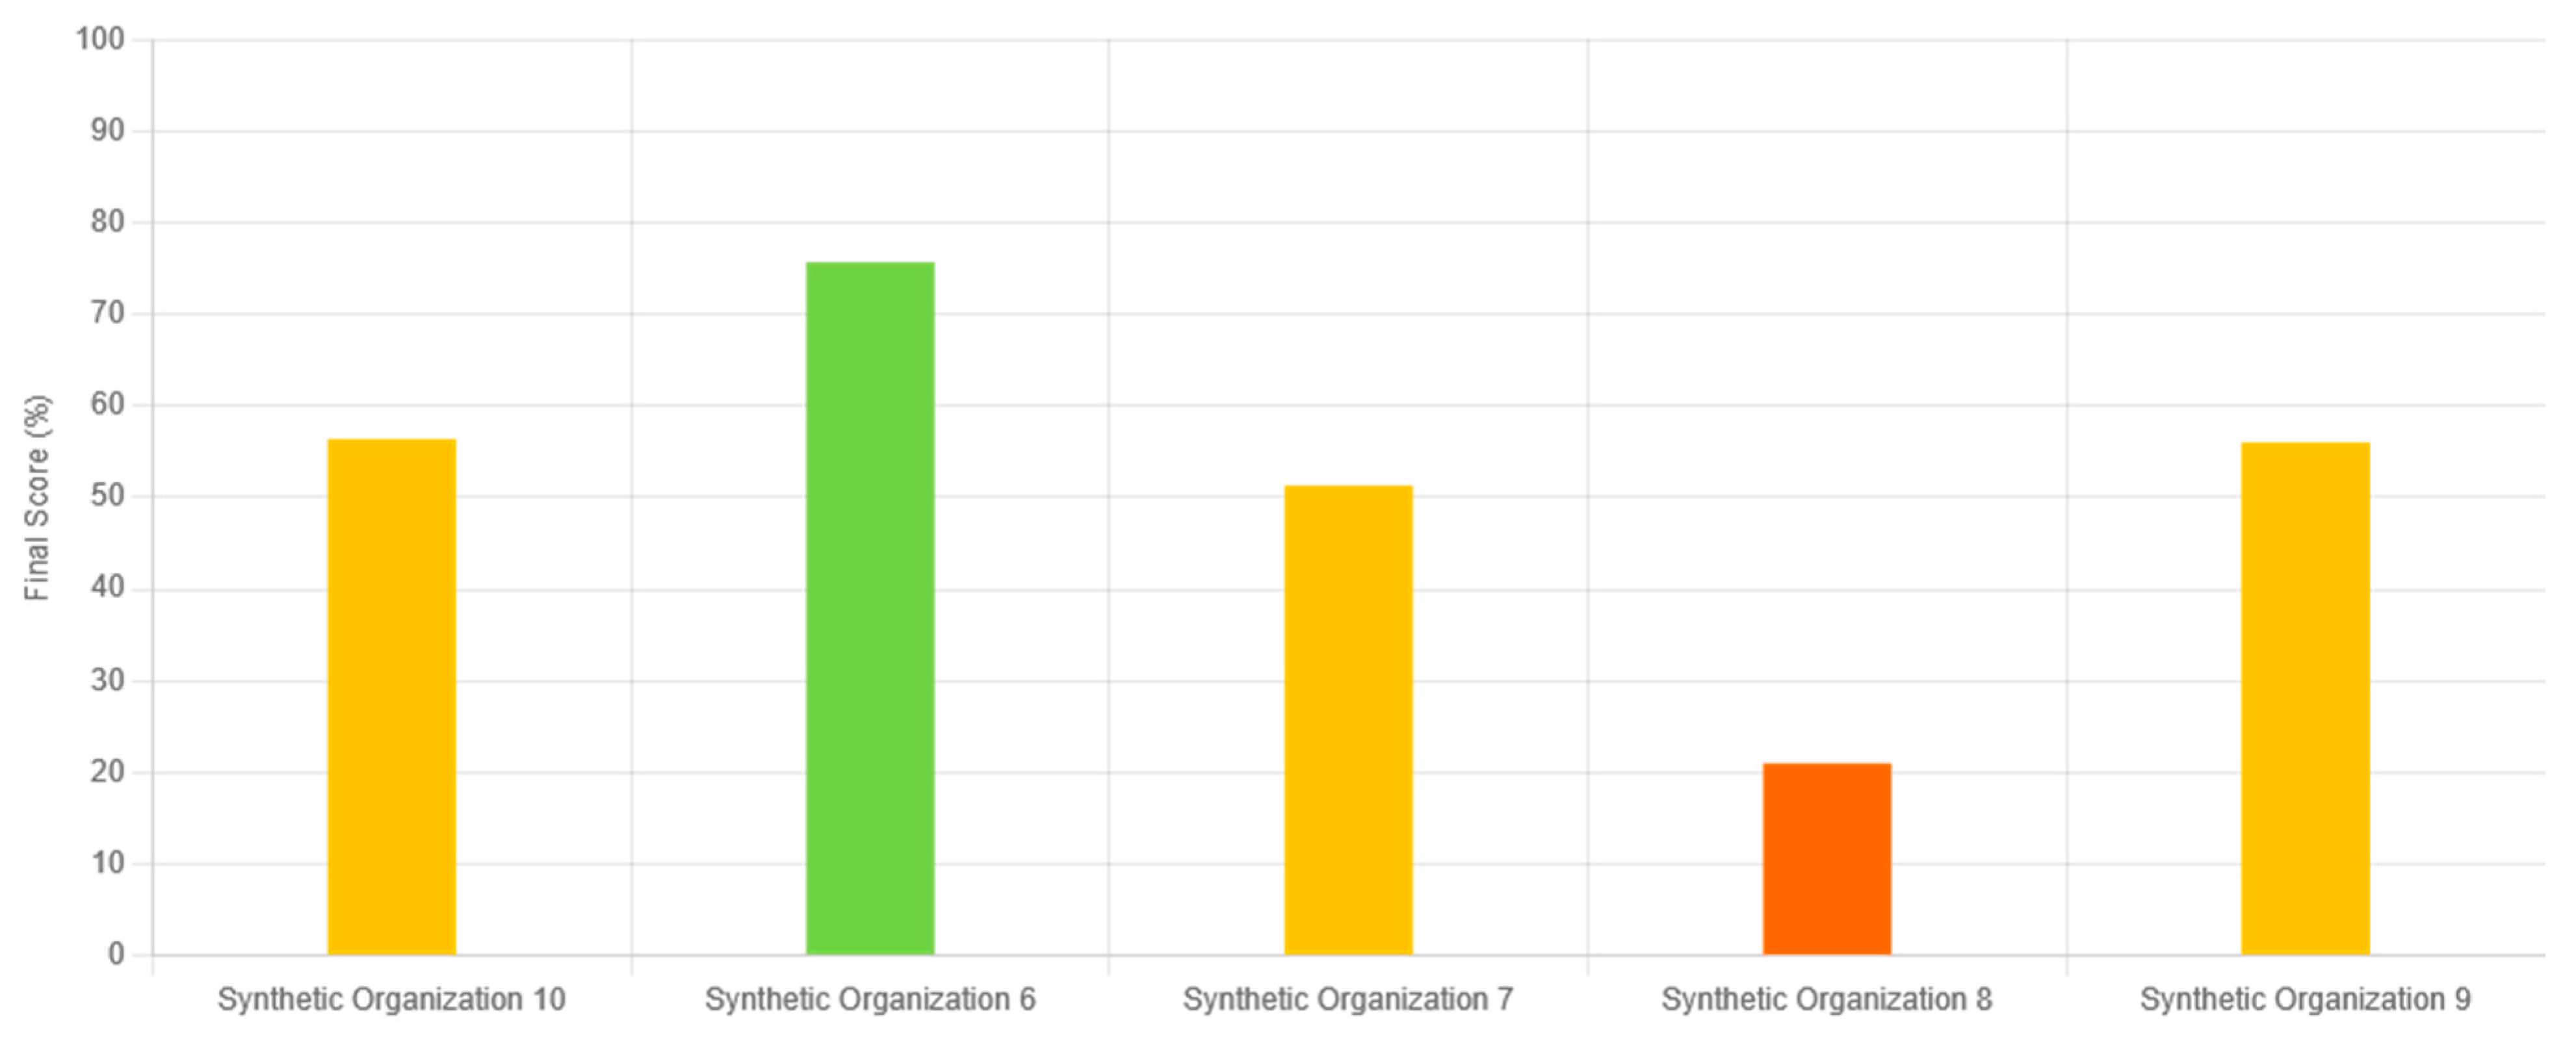
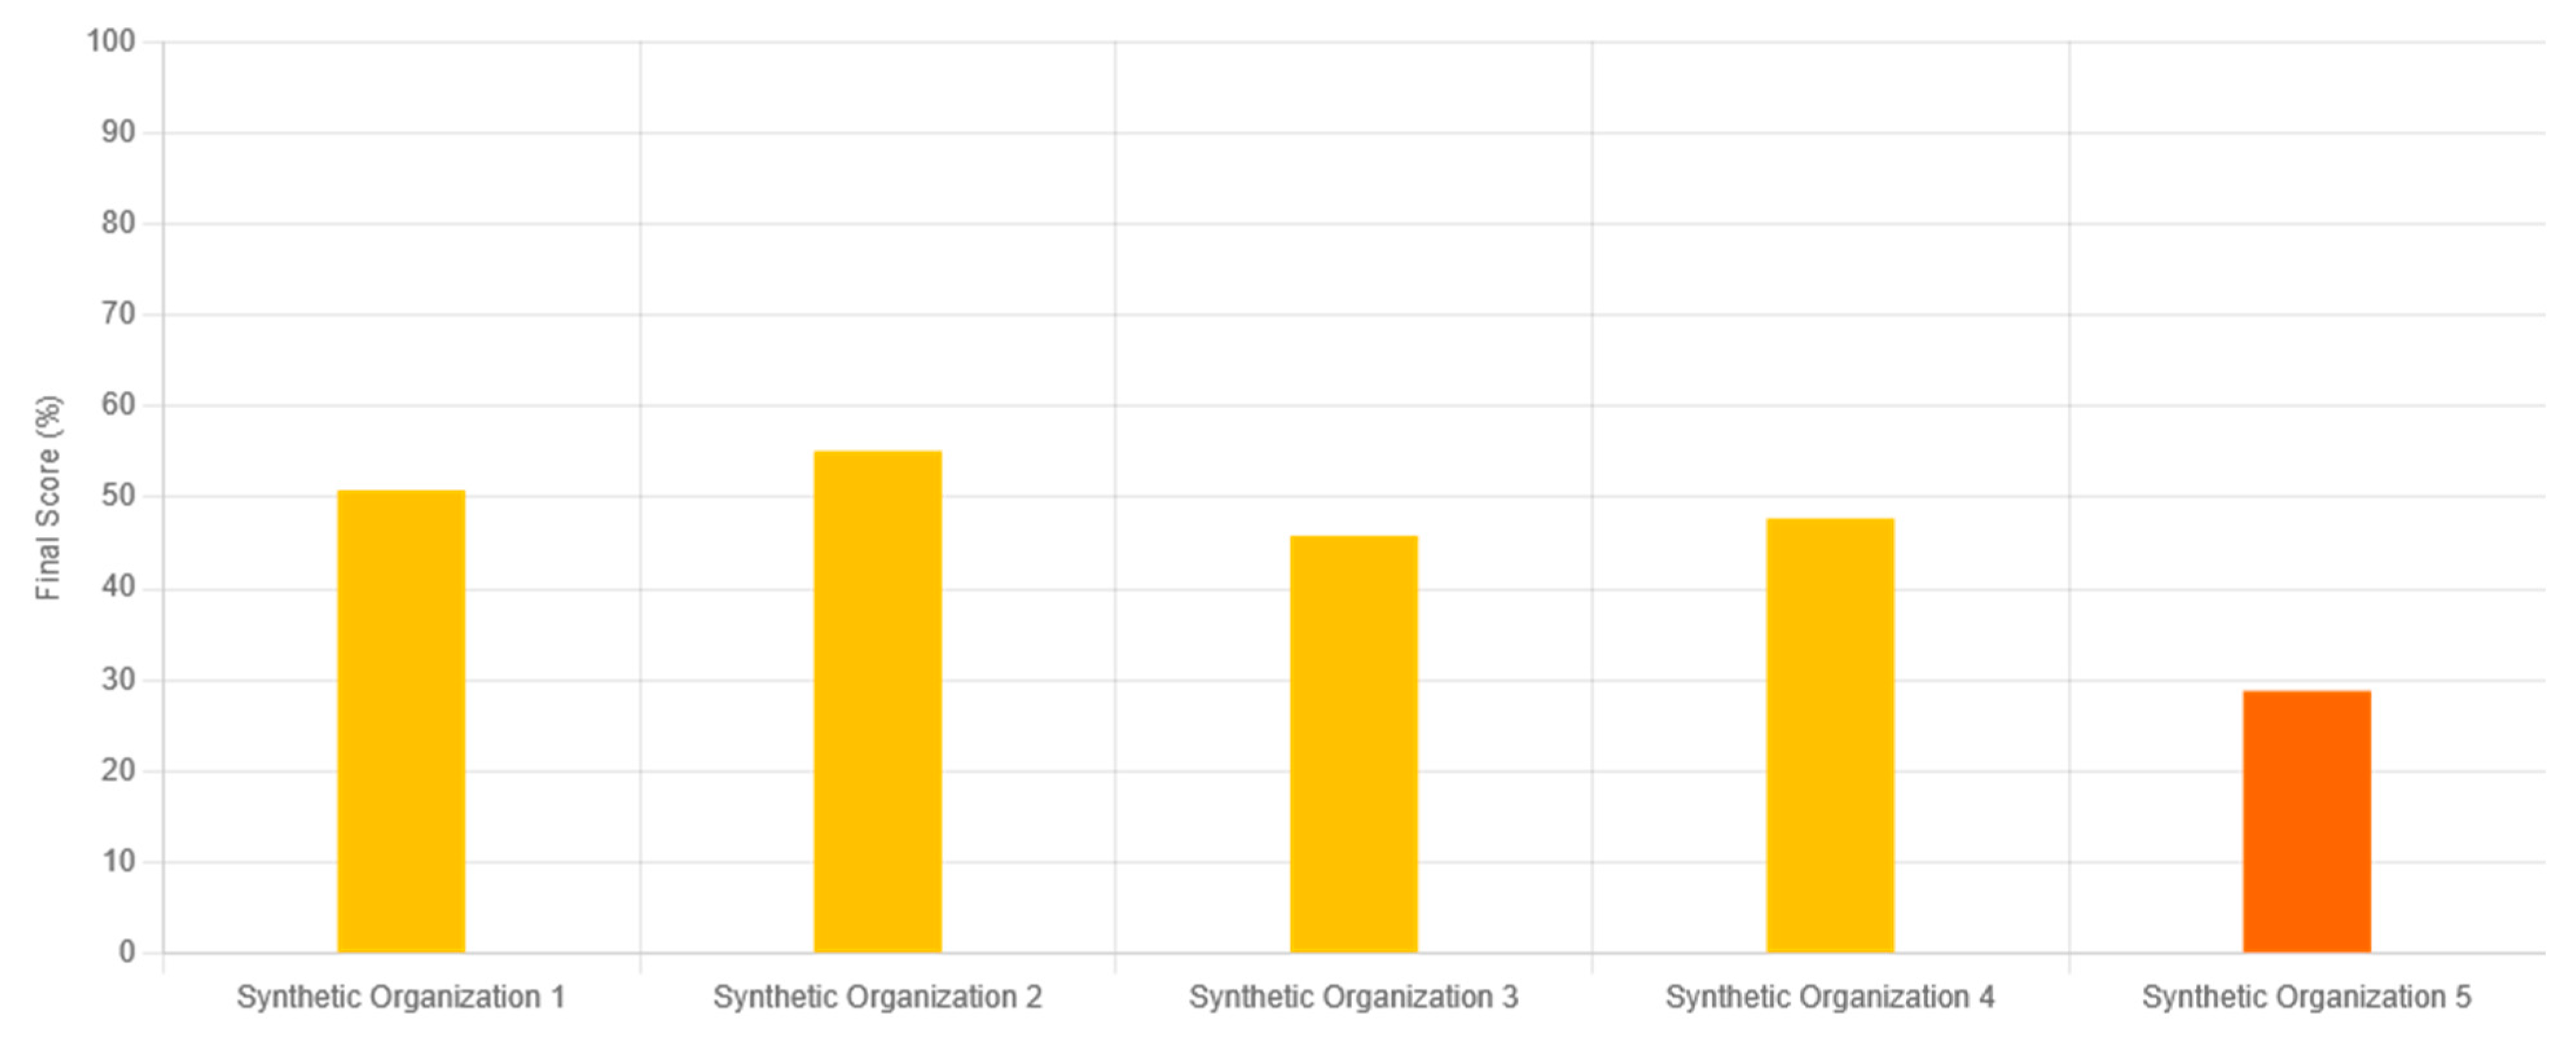
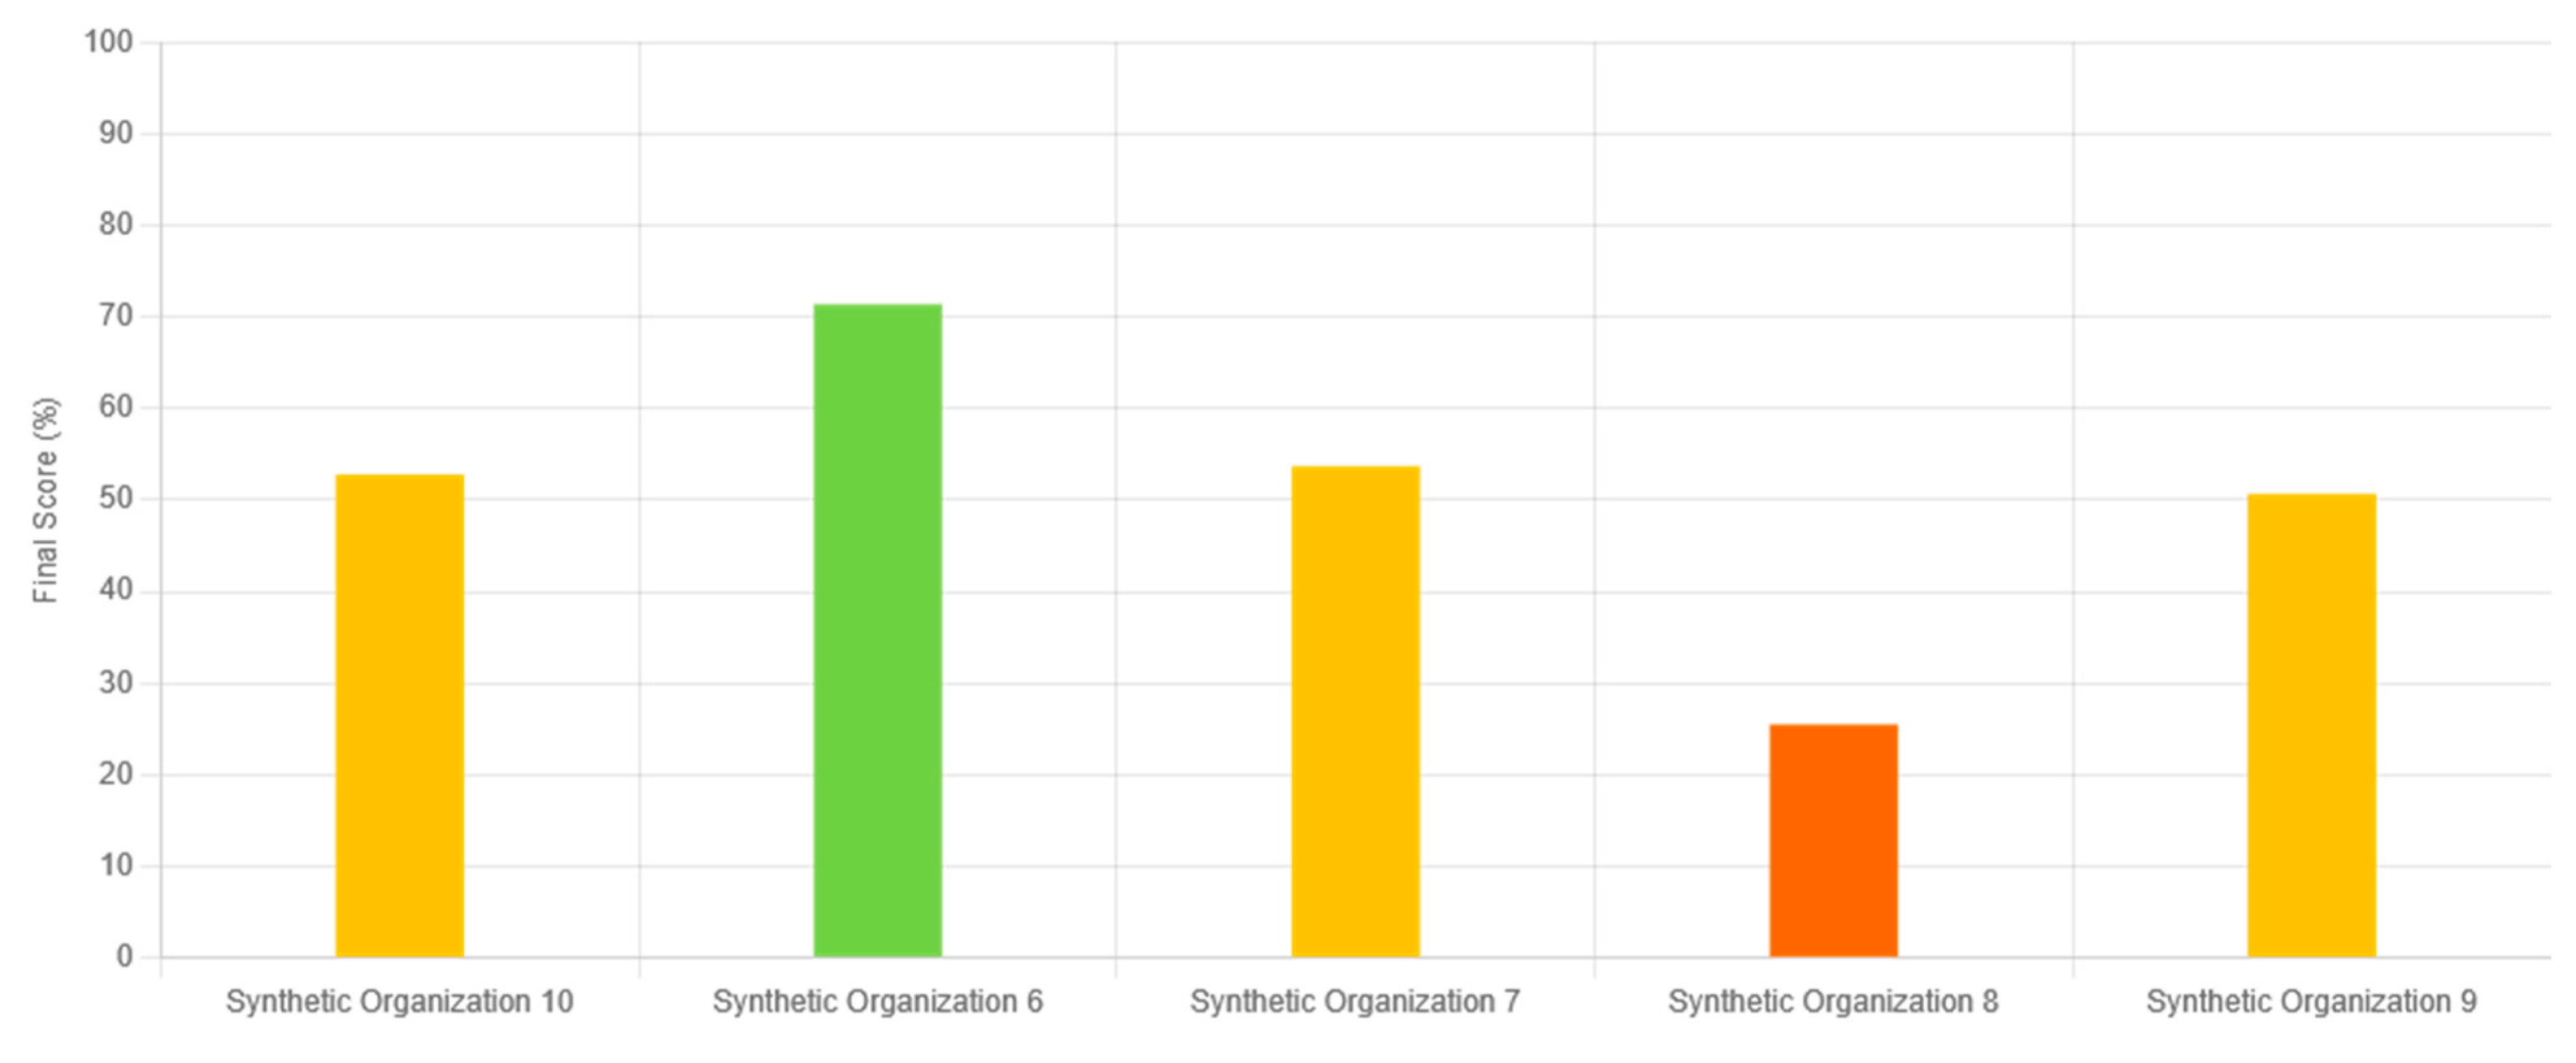
The final assessment results after the first round of data gathering for our synthetic cases can be seen in Figure 7 and Figure 8. The colors of the bars depend on the readiness classes the synthetic organization is in.
The proposed decision model is acceptable as it provides a clear differentiation between the alternatives, with clear point gaps that justify their classification into meaningful ranking groups or classes. Our synthetic organizations were ranked in three out of five groups, with one synthetic organization narrowly missing the worst group (less than 1%). The proposed decision model is robust. Minor changes do not affect the class boundaries, and it is consistent as the final ranking matches the preferences of municipal managers. Synthetic organizations that received a high score in the individual readiness category received a higher score, which was consistent with the model’s preferences.
Figure 9 and Figure 10 show the assessment results after the second round of data gathering for all synthetic organizations based on four categories or a radar chart. The radar chart shows the score on a scale from 0 to 100 for each organization it received in the corresponding category.
The final assessment results after the second round of data gathering for our synthetic cases can be seen in Figure 11 and Figure 12. The colors of the bars depend on the readiness classes the synthetic organization is in.
After the second round of data gathering, the results changed a little bit; this difference was due to the updated weights. The proposed decision model provides a clear differentiation between the alternatives, with clear point gaps that justify their classification into meaningful ranking groups or classes. Our synthetic organizations were still ranked in three out of five groups, although the overall difference between the best and the worst synthetic organization is lower because the criteria are more evenly weighted (see Table 11). We can see that minor changes do not affect the class boundaries, and they are consistent as the final ranking matches the preferences of municipal managers.

5. Discussion

This study developed and empirically validated a dual-level model for assessing AI readiness in the public sector by combining the TOE framework and the AHP method. By integrating individual-level perceptions with organizational-level decision structures, the model enables systematic prioritization of readiness factors relevant to public administration.
The proposed model addresses notable gaps in the literature. First, while much of the existing research on AI adoption has focused on private-sector contexts or technical implementations, few studies provide a structured, multi-level framework for public managers. The scrutinization of AI implementation in a Belgian public trade agency has pointed out that AI adoption must be supported by organizational change and intangible investments (e.g., training and the redesign of workflows) [47]. An EU-wide survey of public managers—involving integration of UTAUT and TOE frameworks—has pointed out that organizational factors (leadership support, innovative culture, and having a clear AI strategy) are the strongest drivers of AI adoption, and successful AI adoption requires both competence development and governance innovation [48]. Similarly, the analysis involving selected Swiss public sector organizations, and focusing on TOE dimensions, has pointed out that technology fit and organizational culture are the most critical dimensions for the adoption of AI, whereas environmental factors like public trust, transparency, and regulatory compliance are shaping the implementation of AI [49].
Clearly, there has been a lack of integrated approaches focusing on the intentions to use AI, focusing on the public sector context; and the focus of those studies has been mostly on factor identification, i.e., exposition of drivers and inhibitors of AI utilization. By providing a structured, multi-level framework for public managers, this work contributes to ongoing debates at the intersection of digital government, public sector innovation, and decision-support systems. The AHP-based tool developed here offers a transparent mechanism for diagnosing readiness and informing resource allocation, particularly useful in small and medium-sized municipalities and other similar public organizations, which often face constraints in available expertise and infrastructure. In addition, it shall make judgments and calculations easy because of paired comparisons, and it enables multi-criteria decision-making, as portrayed by the evidence from its practical utilization elsewhere [50]. Furthermore, we have extended the approach by considering the dynamic context induced by stages—the approach proposed as highly warranted by [51]. We have also focused on the application of AHP to the areas where this approach is less frequently applied, as suggested by [52,53].
Second, from a theoretical perspective, this study extends the TOE framework by incorporating behavioral variables from UTAUT into a multi-level operational model tailored to public administration, thereby addressing another notable gap in the literature. Namely, although there has been a tendency recently, although not sufficiently documented yet, to combine UTAUT and TOE (i.e., technology–organization–environment theory and the unified theory of acceptance and use of technology) frameworks, there has been a lack of empirical investigations practically evaluating it. The push for this integration has been motivated by the fact that this enhances predictive power and provides a multi-dimensional view of specific technology adoption behavior under investigation. According to the systematic review of overlaps and distinctions among these two frameworks, it has been emphasized that no single framework is universally sufficient, and integration offers a more nuanced understanding of adoption dynamics, enabling more accurate, context-sensitive predictions. Namely, while UTAUT captures user-centric variables, TOE adds depth by considering structural and contextual constraints, and integration becomes especially useful for tailoring adoption strategies to specific sectors [54].
It needs to be stressed that these kinds of integration procedures have been rather scarce in the literature, focusing on different technologies, and supporting more TOE-based factors. For instance, ref. [55] have provided a ten-factor framework of four contexts from both TOE and UTAUT to provide insights into technology adoption. Their results show that technology adoption is more driven by TOE factors than by individual factors. Similarly, ref. [56] have tested the intention to adopt IoT and revealed that almost all variables in TOE have significant direct impacts on intention, while no variables in UTAUT have significant direct impacts. Similarly, the findings on the intentions to use blockchain technology suggest that cybersecurity concerns including technological, organizational, and environmental factors significantly affect the adoption of blockchain. Specifically, the behavioral use of blockchain should relate to the unique attributes of the technology on top of social and organizational attributes [57]. Following, for e-government implementation in developing countries, the study uncovered substantial issues rooted in organizational limitations like limited awareness and inadequate top-management support. The scarcity of essential infrastructure exacerbates these issues, and the crucial role of clear regulations and unwavering top-management support is needed as success in the e-government adoption and implementation depends on the synergy between organizational, technological, and environmental factors [37]. In addition, the investigation of the barriers preventing consumers from using FinTech services in the banking industry highlighted mainly TOE-based promoters and inhibitors to the usage of FinTech, and the promoters included self-efficacy, electronic word-of-mouth, system quality, bank image, and performance expectancy [58].
In contrast, there has been rather limited evidence on the importance of individual factors within the integrated context, e.g., studies examining the factors influencing science teachers’ intentions to adopt humanoid robots in educational settings revealed the moderating role of professional experience in the adoption process. Within these findings, performance expectancy, hedonic motivation, and social influence were strong UTAUT predictors; however, organizational readiness, technical infrastructure, and policy support were critical TOE factors. Interestingly, professional experience moderated adoption as in-service teachers responded more to organizational factors, while pre-service teachers were more influenced by personal motivation [38]. Therefore, our findings provide important evidence on UTAUT and TOE frameworks’ integration in the context of AI, where both are perceived as important, thus balancing the evidence missing in the existing literature.

6. Conclusions

This study developed and empirically validated a dual-level model for assessing AI readiness in the public sector by combining the TOE framework and the AHP method. By integrating individual-level perceptions with organizational-level decision structures, the model enables systematic prioritization of readiness factors relevant to public administration. This research was guided by the main question: what are the most relevant organizational and individual-level factors that determine AI readiness in the public sector, and how can they be prioritized using a structured decision-making model? The three most relevant factors are as follows: voluntariness of use, social influence, and behavioral intention to use artificial intelligence. The findings provide an evidence-based answer by identifying organizational culture, top-management support, and perceived usefulness as the most influential criteria across sampled municipalities.
Methodologically, it demonstrates how AHP can be applied to structure judgments and generate actionable insights for AI-related decision-making in government settings. In practice, the model serves as a decision-support tool that municipal leaders can use to assess readiness, identify capability gaps, and align investments with strategic objectives. Some limitations of the research can be identified. The relatively small sample limits statistical generalizability, and the national focus on Slovenian municipalities might limit applicability in other governance contexts, even though we have ensured analytical soundness. Furthermore, the exclusive use of the Web of Science may have resulted in relevant studies indexed elsewhere being omitted.
Future research could extend this study in several important directions. First, cross-national validation in diverse governance systems, such as Nordic, Asian, or federal contexts, would test the model’s transferability and illuminate how institutional structures shape AI readiness. Second, longitudinal studies could track how readiness evolves throughout the different phases of AI implementation, providing a dynamic view of change processes and organizational adaptation. Third, to address growing citizen expectations around transparency and ethics in public sector AI, future models could incorporate trust, fairness, and public acceptability as additional factors, enriching the UTAUT dimension. More broadly, this study lays the groundwork for future AI readiness frameworks. At the same time, while the current sample and geographic scope limit generalizability, the hybrid methodology and dual-level design offer a robust foundation. Researchers are encouraged to build on this integrated approach to capture the multi-level complexities of AI adoption better. For practitioners, the model offers a flexible tool that, when adapted to local conditions, can support more informed and context-sensitive AI integration strategies.
To sum up, this research contributes to the development of a replicable, evidence-informed framework for assessing and supporting AI readiness in the public sector. It reinforces the need for multidimensional approaches to digital transformation that consider not only technological infrastructure but also organizational capacity and human agency.

Author Contributions

Conceptualization, R.H., K.D., and P.P.; methodology, R.H.; software, R.H.; validation, R.H., K.D., and P.P.; formal analysis, R.H.; investigation, K.D. and P.P.; resources, K.D. and P.P.; data curation, R.H. and K.D.; writing—original draft preparation, R.H. and K.D.; writing—review and editing, R.H. and P.P.; visualization, R.H.; supervision, P.P.; project administration, K.D.; funding acquisition, K.D. and P.P. All authors have read and agreed to the published version of the manuscript.

Funding

This research was co-funded by the Slovenian Research and Innovation Agency, research core funding number P5-0093. The APC was funded by financial support from the internal UL FPA’s project, “The impact of demographic change and artificial intelligence on the public sector labor market”, funded by the Slovenian Research and Innovation Agency, Institutional Pillar of Financing.

Data Availability Statement

The datasets presented in this article are not readily available because the data are part of an ongoing study. Requests to access the datasets should be directed to the authors of the manuscript.

Conflicts of Interest

The authors declare no conflicts of interest. The funders had no role in the design of this study; in the collection, analyses, or interpretation of data; in the writing of the manuscript; or in the decision to publish the results.

Abbreviations

The following abbreviations are used in this manuscript:
AHPAnalytic Hierarchy Process
AIArtificial intelligence
BIMBuilding Information Modeling
CIConsistency index
CIOChief Information Office
GMMGeometric mean method
CRConsistency ratio
GDPRGeneral Data Protection Regulation
HRHuman resources
ICTInformation and Communication Technology
MCDMMulti-criteria decision-making
RQResearch question
TAMTechnology Acceptance Model
TOETechnology–organization–environment
TRAMTechnology Readiness and Acceptance Model
TRITechnology Readiness Index
UTAUTUnified theory of acceptance and use of technology

References

  1. Brynjolfsson, E.; McAfee, A. The Business of Artificial Intelligence. Harv. Bus. Rev. 2017, 7, 3–11. [Google Scholar]
  2. Davenport, T.H.; Ronanki, R. Artificial Intelligence for the Real World. Harv. Bus. Rev. 2018, 96, 108–116. [Google Scholar]
  3. Kolbjørnsrud, V.; Amico, R.; Thomas, R.J. Partnering with AI: How Organizations Can Win over Skeptical Managers. Strategy Leadersh. 2017, 45, 37–43. [Google Scholar] [CrossRef]
  4. Wilson, H.J.; Daugherty, P.R. Collaborative Intelligence: Humans and AI Are Joining Forces. Harv. Bus. Rev. 2018, 96, 114–123. [Google Scholar]
  5. OECD. The State of the Public Sector Response to COVID-19; OECD Publishing: Paris, France, 2022. [Google Scholar]
  6. Wirtz, B.W.; Langer, P.F.; Fenner, C. Artificial Intelligence in the Public Sector—a Research Agenda. Int. J. Public Adm. 2021, 44, 1103–1128. [Google Scholar] [CrossRef]
  7. Mergel, I.; Edelmann, N.; Haug, N. Defining Digital Transformation: Results from Expert Interviews. Gov. Inf. Q. 2019, 36, 101385. [Google Scholar] [CrossRef]
  8. Entwistle, T. Public Management; Routledge: London, UK, 2021; ISBN 9780429331046. [Google Scholar]
  9. Kelman, S. Public Management Needs Help! Acad. Manag. J. 2005, 48, 967–969. [Google Scholar] [CrossRef]
  10. Eubanks, V. Automating Inequality: How High-Tech Tools Profile, Police, and Punish the Poor; St. Martin’s Press: New York, NY, USA, 2018; ISBN 9781250074317. [Google Scholar]
  11. Janssen, M.; van den Hoven, J. Big and Open Linked Data (BOLD) in Government: A Challenge to Transparency and Privacy? Gov. Inf. Q. 2015, 32, 363–368. [Google Scholar] [CrossRef]
  12. Hood, C. A Public Management for All Seasons? Public Adm. 1991, 69, 3–19. [Google Scholar] [CrossRef]
  13. Margetts, H.; Dorobantu, C. Rethink Government with AI. Nature 2019, 568, 163–165. [Google Scholar] [CrossRef]
  14. Tornatzky, L.G.; Fleischer, M. The Processes of Technological Innovation; Lexington Books: Lanham, MD, USA, 1990; ISBN 0669203483. [Google Scholar]
  15. Venkatesh, V.; Morris, M.G.; Davis, G.B.; Davis, F.D. User Acceptance of Information Technology: Toward a Unified View. MIS Q. 2003, 27, 425–478. [Google Scholar] [CrossRef]
  16. Saaty, T.L. Decision Making with the Analytic Hierarchy Process. Int. J. Serv. Sci. 2008, 1, 83. [Google Scholar] [CrossRef]
  17. Ahn, M.J.; Chen, Y.C. Digital Transformation toward AI-Augmented Public Administration: The Perception of Government Employees and the Willingness to Use AI in Government. Gov. Inf. Q. 2022, 39, 101664. [Google Scholar] [CrossRef]
  18. Baker, J. The Technology—Organization—Environment Framework. In Integrated Series in Information Systems; Dwivedi, Y., Wade, M., Schneberger, S., Eds.; Springer: New York, NY, USA, 2012; Volume 1, pp. 231–245. [Google Scholar]
  19. Chatterjee, S.; Khorana, S.; Kizgin, H. Harnessing the Potential of Artificial Intelligence to Foster Citizens’ Satisfaction: An Empirical Study on India. Gov. Inf. Q. 2022, 39, 101621. [Google Scholar] [CrossRef]
  20. Davis, F.D. Perceived Usefulness, Perceived Ease of Use, and User Acceptance of Information Technology. MIS Q. 1989, 13, 319–339. [Google Scholar] [CrossRef]
  21. Venkatesh, V.; Davis, F.D. A Theoretical Extension of the Technology Acceptance Model: Four Longitudinal Field Studies. Manag. Sci. 2000, 46, 186–204. [Google Scholar] [CrossRef]
  22. Venkatesh, V.; Bala, H. Technology Acceptance Model 3 and a Research Agenda on Interventions. Decis. Sci. 2008, 39, 273–315. [Google Scholar] [CrossRef]
  23. Parasuraman, A. Technology Readiness Index (Tri). J. Serv. Res. 2000, 2, 307–320. [Google Scholar] [CrossRef]
  24. Parasuraman, A.; Colby, C.L. An Updated and Streamlined Technology Readiness Index: TRI 2.0. J. Serv. Res. 2015, 18, 59–74. [Google Scholar] [CrossRef]
  25. Chen, S.C.; Liu, M.L.; Lin, C.P. Integrating Technology Readiness into the Expectation—Confirmation Model: An Empirical Study of Mobile Services. Cyberpsychology Behav. Soc. Netw. 2013, 16, 604–612. [Google Scholar] [CrossRef]
  26. Venkatesh, V.; Thong, J.Y.L.; Xu, X. Consumer Acceptance and Use of Information Technology: Extending the Unified Theory of Acceptance and Use of Technology. MIS Q. 2012, 36, 157–178. [Google Scholar] [CrossRef]
  27. Li, K.; Rollins, J.; Yan, E. Web of Science Use in Published Research and Review Papers 1997–2017: A Selective, Dynamic, Cross-Domain, Content-Based Analysis. Scientometrics 2018, 115, 1–20. [Google Scholar] [CrossRef] [PubMed]
  28. Pranckutė, R. Web of Science (WoS) and Scopus: The Titans of Bibliographic Information in Today’s Academic World. Publications 2021, 9, 12. [Google Scholar] [CrossRef]
  29. Revillod, G. Trust Influence on AI HR Tools Perceived Usefulness in Swiss HRM: The Mediating Roles of Perceived Fairness and Privacy Concerns. AI Soc. 2025. [Google Scholar] [CrossRef]
  30. Gesk, T.S.; Leyer, M. Artificial Intelligence in Public Services: When and Why Citizens Accept Its Usage. Gov. Inf. Q. 2022, 39, 101704. [Google Scholar] [CrossRef]
  31. Choi, Y. A Study of Employee Acceptance of Artificial Intelligence Technology. Eur. J. Manag. Bus. Econ. 2020, 30, 318–330. [Google Scholar] [CrossRef]
  32. Huang, Q.; Lv, C.; Lu, L.; Tu, S. Evaluating the Quality of AI-Generated Digital Educational Resources for University Teaching and Learning. Systems 2025, 13, 174. [Google Scholar] [CrossRef]
  33. Adjorlolo, G.; Tang, Z.; Wauk, G.; Adu Sarfo, P.; Braimah, A.B.; Blankson Safo, R.; N-yanyi, B. Evaluating Corruption-Prone Public Procurement Stages for Blockchain Integration Using AHP Approach. Systems 2025, 13, 267. [Google Scholar] [CrossRef]
  34. Ottaviani, F.M.; Zenezini, G.; Saba, F.; De Marco, A.; Gavinelli, L. System-Level Critical Success Factors for BIM Implementation in Construction Management: An AHP Approach. Systems 2025, 13, 94. [Google Scholar] [CrossRef]
  35. An, S.Y.; Ngayo, G.; Hong, S.P. Applying Blockchain, Causal Loop Diagrams, and the Analytical Hierarchy Process to Enhance Fifth-Generation Ceramic Antenna Manufacturing: A Technology—Organization—Environment Framework Approach. Systems 2024, 12, 184. [Google Scholar] [CrossRef]
  36. Jais, R.; Ngah, A.H.; Rahi, S.; Rashid, A.; Ahmad, S.Z.; Mokhlis, S. Chatbots Adoption Intention in Public Sector in Malaysia from the Perspective of TOE Framework. The Moderated and Mediation Model. J. Sci. Technol. Policy Manag. 2024. [Google Scholar] [CrossRef]
  37. Alfiani, H.; Kurnia Aditya, S.; Lusa, S.; Indra Sensuse, D.; Wibowo Putro, P.A.; Indriasari, S. E-Government Issues in Developing Countries Using TOE and UTAUT Frameworks: A Systematic Review. Policy Gov. Rev. 2024, 8, 169. [Google Scholar] [CrossRef]
  38. Ates, H.; Polat, M. Exploring Adoption of Humanoid Robots in Education: UTAUT-2 and TOE Models for Science Teachers. Educ. Inf. Technol. 2025, 30, 12765–12806. [Google Scholar] [CrossRef]
  39. Saaty, T.L. How to Make a Decision: The Analytic Hierarchy Process. Eur. J. Oper. Res. 1990, 48, 9–26. [Google Scholar] [CrossRef]
  40. Saaty, T.L. Relative Measurement and Its Generalization in Decision Making Why Pairwise Comparisons Are Central in Mathematics for the Measurement of Intangible Factors the Analytic Hierarchy/Network Process. Rev. R. Acad. Cienc. Exactas. Fis. Nat. A. Mat. 2008, 102, 251–318. [Google Scholar] [CrossRef]
  41. Dyer, J.S. Remarks on the Analytic Hierarchy Process. Manag. Sci. 1990, 36, 249–258. [Google Scholar] [CrossRef]
  42. Janković, A.; Popović, M. Methods for Assigning Weights to Decision Makers in Group AHP Decision-Making. Decis. Mak. Appl. Manag. Eng. 2019, 2, 147–165. [Google Scholar] [CrossRef]
  43. Huang, Y.; Liao, J.; Lin, Z. A Study on Aggregation of Group Decisions. Syst. Res. Behav. Sci. 2009, 26, 445–454. [Google Scholar] [CrossRef]
  44. Ossadnik, W.; Schinke, S.; Kaspar, R.H. Group Aggregation Techniques for Analytic Hierarchy Process and Analytic Network Process: A Comparative Analysis. Group Decis. Negot. 2016, 25, 421–457. [Google Scholar] [CrossRef]
  45. Cheng, E.W.L.; Li, H. Analytic Hierarchy Process. Meas. Bus. Excell. 2001, 5, 30–37. [Google Scholar] [CrossRef]
  46. Ramanathan, R.; Ganesh, L.S. Group Preference Aggregation Methods Employed in AHP: An Evaluation and an Intrinsic Process for Deriving Members’ Weightages. Eur. J. Oper. Res. 1994, 79, 249–265. [Google Scholar] [CrossRef]
  47. Nurski, L. AI Adoption in the Public Sector: A Case Study; Bruegel: Brussels, Belgium, 2023. [Google Scholar]
  48. Grimmelikhuijsen, S.; Tangi, L. What Factors Influence Perceived Artificial Intelligence Adoption by Public Managers? A Survey Among Public Managers in Seven EU Countries; Publications Office of the European Union: Luxembourg, 2024. [Google Scholar]
  49. Neumann, O.; Guirguis, K.; Steiner, R. Exploring Artificial Intelligence Adoption in Public Organizations: A Comparative Case Study. Public Manag. Rev. 2024, 26, 114–141. [Google Scholar] [CrossRef]
  50. Taherdoost, H. Decision Making Using the Analytic Hierarchy Process (AHP); A Step by Step Approach. Int. J. Econ. Manag. Syst. 2017, 2, 244–246. [Google Scholar]
  51. Abastante, F.; Corrente, S.; Greco, S.; Ishizaka, A.; Lami, I.M. A New Parsimonious AHP Methodology: Assigning Priorities to Many Objects by Comparing Pairwise Few Reference Objects. Expert Syst. Appl. 2019, 127, 109–120. [Google Scholar] [CrossRef]
  52. Fountzoula, C.; Aravossis, K. Decision-Making Methods in the Public Sector during 2010–2020: A Systematic Review. Adv. Oper. Res. 2022, 2022, 1750672. [Google Scholar] [CrossRef]
  53. Khaira, A.; Dwivedi, R.K. A State of the Art Review of Analytical Hierarchy Process. Mater. Today Proc. 2018, 5, 4029–4035. [Google Scholar] [CrossRef]
  54. Hasan Emon, M.M. Insights Into Technology Adoption: A Systematic Review of Framework, Variables and Items. Inf. Manag. Comput. Sci. 2023, 6, 55–61. [Google Scholar] [CrossRef]
  55. Awa, H.O.; Ukoha, O.; Igwe, S.R. Revisiting Technology-Organization-Environment (T-O-E) Theory for Enriched Applicability. Bottom Line 2017, 30, 2–22. [Google Scholar] [CrossRef]
  56. Li, L.; Min, X.; Guo, J.; Wu, F. The Influence Mechanism Analysis on the Farmers’ Intention to Adopt Internet of Things Based on UTAUT-TOE Model. Sci. Rep. 2024, 14, 15016. [Google Scholar] [CrossRef]
  57. Tan, K.S.T.; Lee, A.S.H. Key Determinants of Blockchain Adoption: A Unified Framework Integrating UTAUT and TOE Models. In Proceedings of the 2024 7th International Conference on Blockchain Technology and Applications, Xi’an, China, 6 December 2024; ACM: New York, NY, USA, 2024; pp. 60–65. [Google Scholar]
  58. Bouteraa, M. Mixed-Methods Approach to Investigating the Diffusion of FinTech Services: Enriching the Applicability of TOE and UTAUT Models. J. Islam. Mark. 2024, 15, 2036–2068. [Google Scholar] [CrossRef]
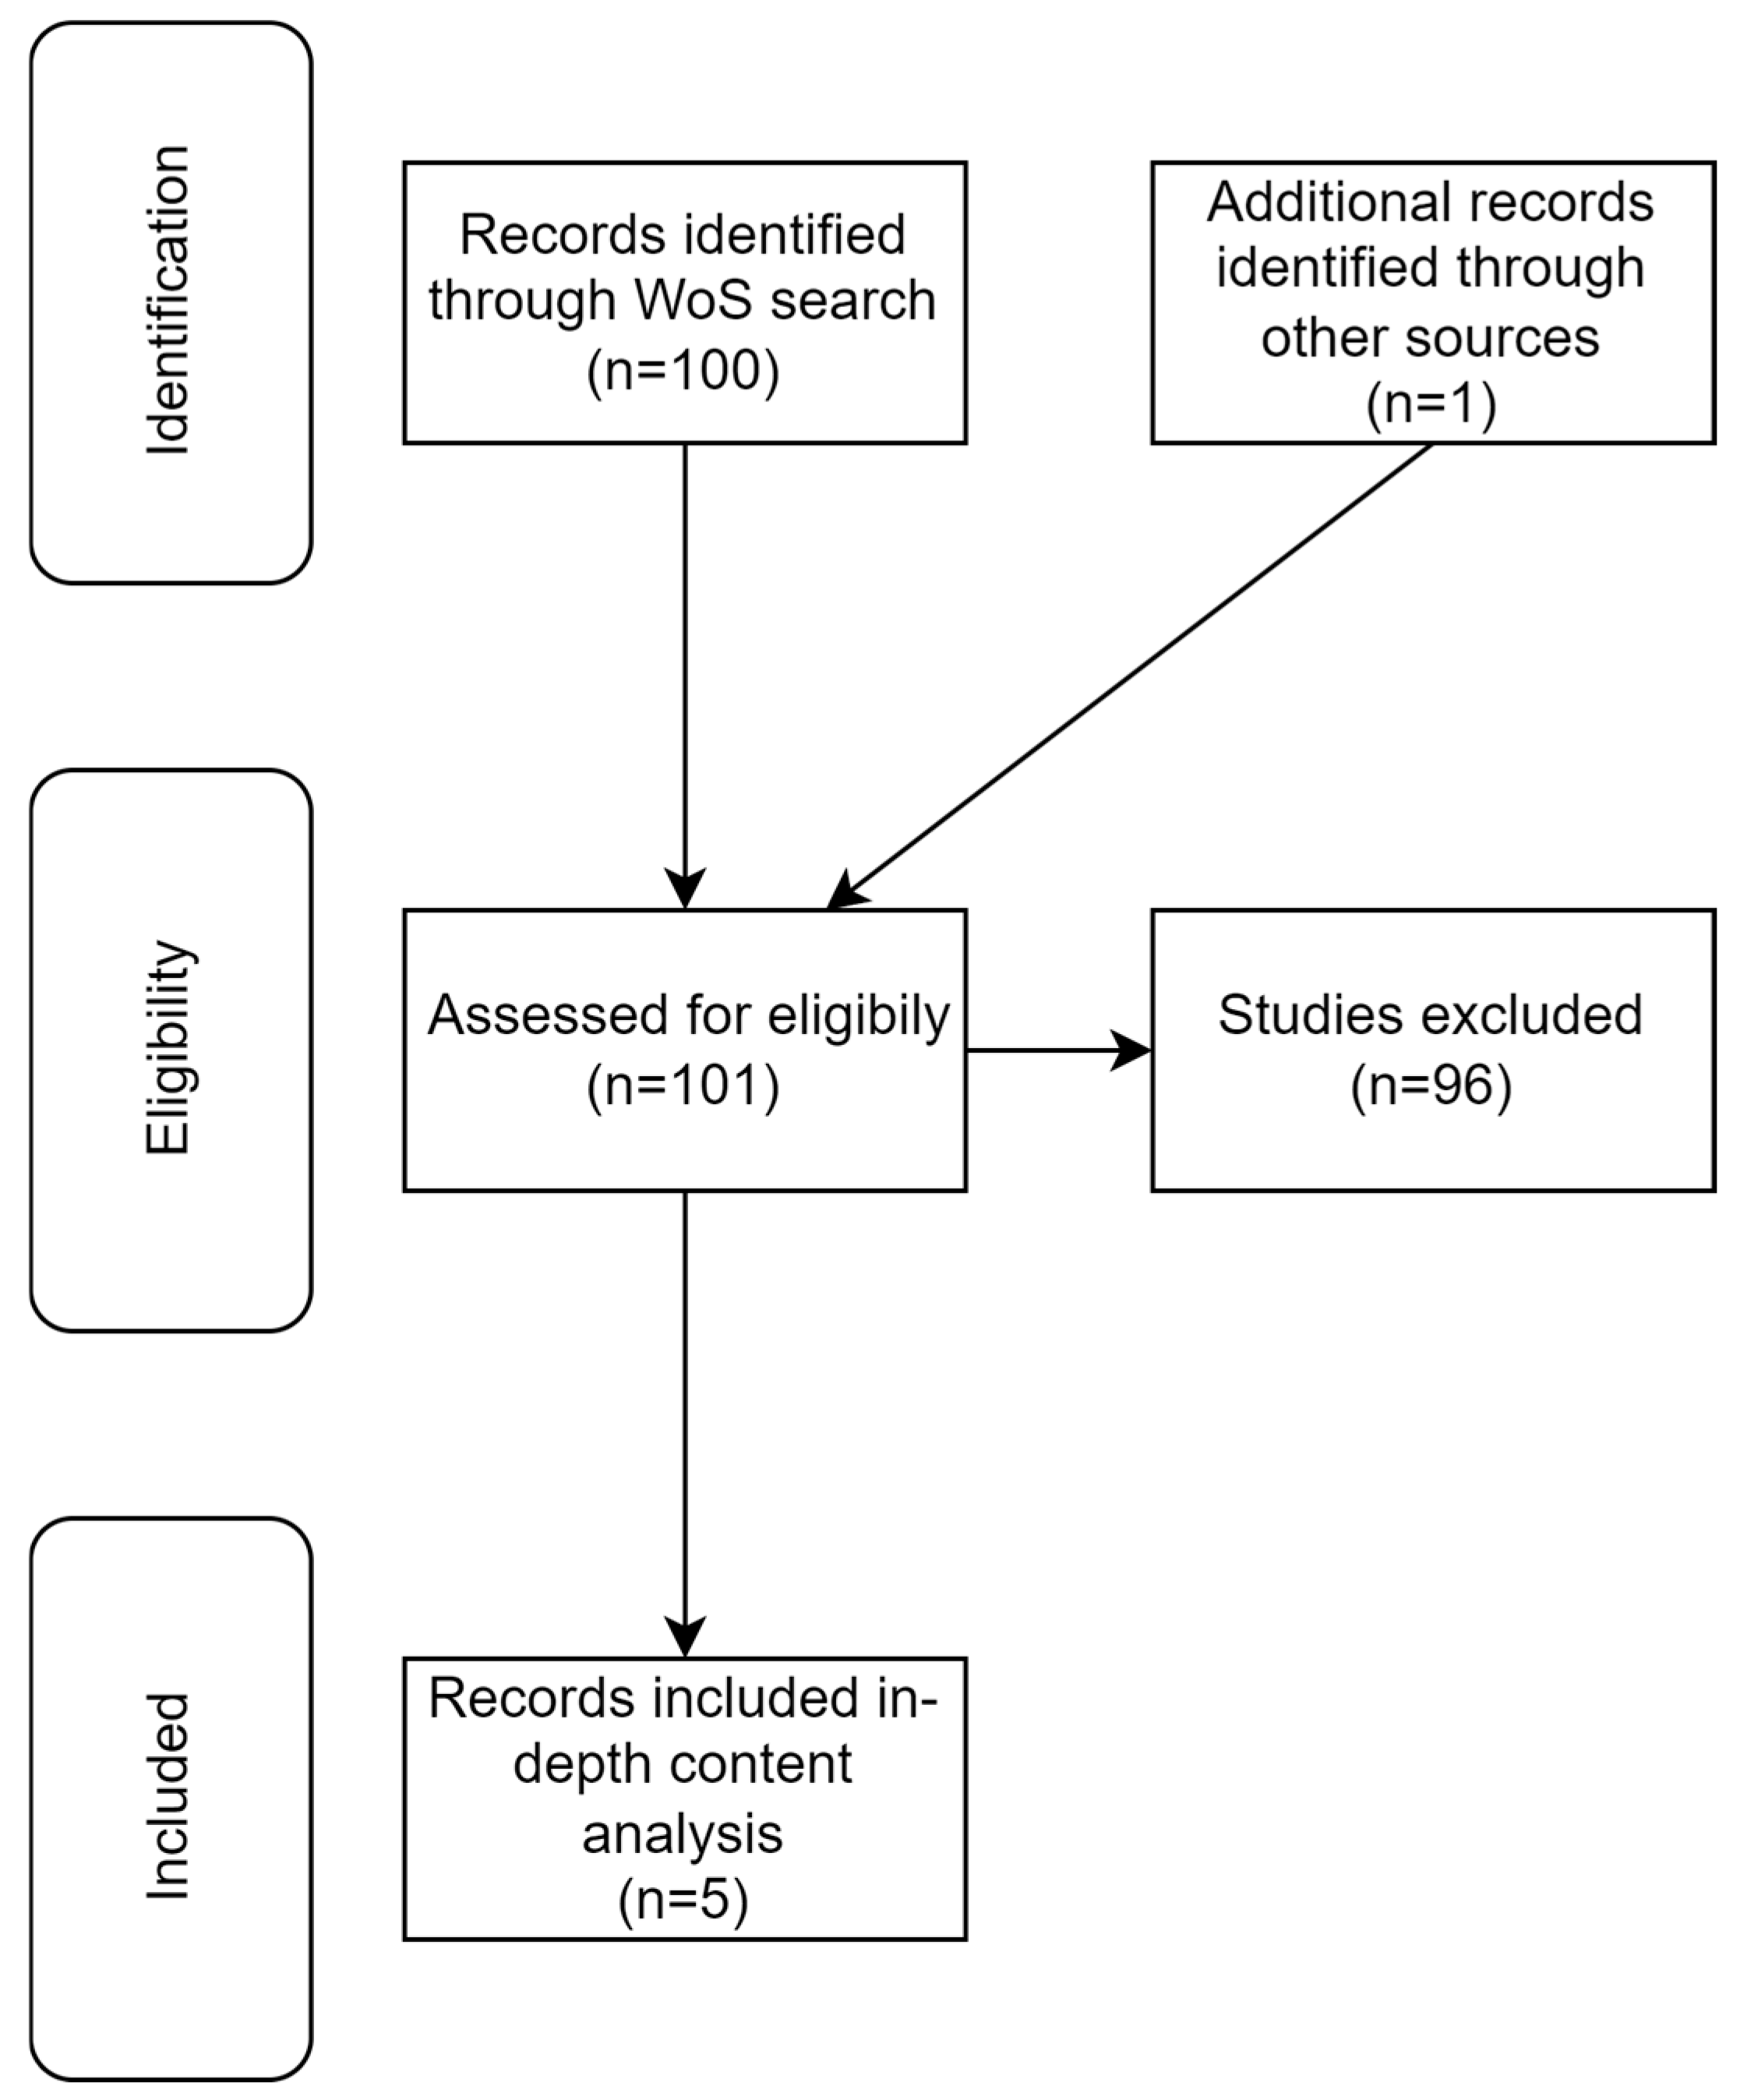
Figure 1. PRISMA diagram presenting the selection of included studies.
Systems 13 00705 g001
Figure 2. Steps to create and test proposed decision model.
Systems 13 00705 g002
Figure 3. Hierarchical decision model.
Systems 13 00705 g003
Figure 4. Proposed decision model.
Systems 13 00705 g004
Figure 5. Assessment scores for synthetic organizations 1–5 for all four categories—first round.
Systems 13 00705 g005
Figure 6. Assessment scores for synthetic organizations 6–10 for all four categories—first round.
Systems 13 00705 g006
Figure 7. Final assessment scores for synthetic organizations 1–5—first round.
Systems 13 00705 g007
Figure 8. Final assessment scores for synthetic organizations 6–10—first round.
Systems 13 00705 g008
Figure 9. Assessment scores for synthetic organizations 1–5 for all four categories—second round.
Systems 13 00705 g009
Figure 10. Assessment scores for synthetic organizations 6–10 for all four categories—second round.
Systems 13 00705 g010
Figure 11. Final assessment scores for synthetic organizations 1–5—second round.
Systems 13 00705 g011
Figure 12. Final assessment scores for synthetic organizations 6–10—second round.
Systems 13 00705 g012
Table 1. AI adaptation models.
Model Name and
Version
AuthorsYearKey Constructs
TAM (Original)[20]1989Perceived usefulness (PU)
Perceived ease of use (PEOU)
TAM2[21]2000PU + PEOU
Subjective norm
Image
Job relevance
Output quality
Result demonstrability
Moderators: experience, voluntariness
TAM3[22]2008TAM2 constructs
Antecedents of PEOU: computer self-efficacy,
anxiety, playfulness
Anchors and adjustments for PEOU/PU
TRI (Original)[23]2000Optimism
Innovativeness
Discomfort
Insecurity
TRI 2.0[24]2015Optimism
Innovativeness
Discomfort
Insecurity (streamlined to 16 items)
UTAUT (Original)[15]2003Performance expectancy
Effort expectancy
Social influence
Facilitating conditions
Moderators: age/gender/experience
UTAUT2[26]2012UTAUT constructs
Hedonic motivation
Price value
Habit
TRAM[25]2005TRI dimensions
TAM constructs
Table 2. Descriptive statistics.
IndicatorValue
Average Age46.9
Min Age25.0
Max Age65.0
Average Total Tenure (years)21.4
Min Total Tenure3.0
Max Total Tenure35.0
Female (%)62.5
Male (%)31.2
Non-disclosed Gender (%)3.1
University Degree (%)56.2
Master’s Degree (%)31.2
Secondary or Lower (%)9.4
Leadership Role (%)21.9
High ICT Skills (%)21.9
Good ICT Skills (%)62.5
Average ICT Skills (%)12.5
Table 3. Values of random index.
nRI
10
20
30.58
40.9
51.12
61.24
71.32
81.41
91.45
101.49
Table 4. Variables used in the evaluation of organizational readiness for artificial intelligence.
VariablesExplanation
S0final score of the organization
Sciscore for category i
Sc1score for category technology
Sc1score for category organization
Sc1score for category environment
Sc1score for category individual readiness
eC1jend user assessment for an alternative under criterion j of category technology
eC2jend user assessment for an alternative under criterion j of category organization
eC3jend user assessment for an alternative under criterion j of category environment
eC4jend user assessment for an alternative under criterion j of category individual readiness
wciglobal weight of category i
wc1jlocal weight of criterion j within category technology
wc2jlocal weight of criterion j within category organization
wc3jlocal weight of criterion j within category environment
wc4jlocal weight of criterion j within category individual readiness
gwcijglobal weight of criterion j in category i.
i1, 2, …, m number of top-level categories
j1, 2, …, n number of criteria in that subcategory
Table 5. Readiness levels based on the overall percentages.
Readiness LevelPercentages
Initial level0–20%
Basic level20.1–40%
Developing level40.1–60%
Advanced level60.1–80%
Optimized level80.1–100%
Table 6. Weights, CI, and CR for first level.
VariableCategoryWeight—First RoundWeight—Second Round
wC1Technology18.5%18.0%
wC2Organization28.4%29.5%
wC3Environment16.4%20.1%
wC4Individual readiness36.6%32.3%
CI1Consistency index0.0220.0036
CR1Consistency ratio0.0240.004
Table 7. Weights, CI, and CR for category technology.
VariableCategoryWeight—First RoundWeight—Second Round
wC11Perceived direct benefits of artificial intelligence16.1%21.4%
wC12Effort expectancy of artificial intelligence22.4%23.8%
wC13Data35.4%31.4%
wC14Technology26.2%23.4%
CIC1Consistency index0.0430.0024
CRC1Consistency ratio0.0470.0027
Table 8. Weights, CI, and CR for category organization.
VariableCategoryWeight—First RoundWeight—Second Round
wC21Leadership17.0%19.5%
wC22Skills and expertise27.3%22.5%
wC23Innovation and readiness for change22.4%26.2%
wC24Costs and resources19.8%14.7%
wC25Facilitating conditions13.5%17.1%
CIC2Consistency index0.0320.0052
CRC2Consistency ratio0.0290.0046
Table 9. Weights, CI, and CR for category environment.
VariableCategoryWeight—First RoundWeight—Second Round
wC31Social influence71.0%61.9%
wC32The state and citizens29.0%38.1%
CIC3Consistency index00
CRC3Consistency ratio00
Table 10. Weights, CI, and CR for category individual readiness.
VariableCategoryWeight—First RoundWeight—Second Round
wC41Behavioral intention to use artificial intelligence31.8%38.3%
wC42Voluntariness of use68.2%61.7%
CIC4Consistency index00
CRC4Consistency ratio00
Table 11. Global weights for all criteria.
VariableCategoryGlobal Weight—First RoundGlobal Rank—First RoundGlobal Weight—Second RoundGlobal Rank—Second Round
wC11Perceived direct benefits of artificial intelligence3.0%13th3.8%13th
wC12Effort expectancy of artificial intelligence4.1%11th4.3%10–11th
wC13Data6.6%5th5.6%8th
wC14Technology4.9%8th4.2%12th
wC21Leadership4.8%9–10th5.8%7th
wC22Skills and expertise7.8%4th6.6%6th
wC23Innovation and readiness for change6.3%6th7.7%4–5th
wC24Costs and resources5.6%7th4.3%10–11th
wC25Facilitating conditions3.8%12th5.1%9th
wC31Social influence11.7%2nd–3rd12.5%2nd
wC32The state and citizens4.8%9–10th7.7%4–5th
wC41Behavioral intention to use artificial intelligence11.7%2nd–3rd12.4%3rd
wC42Voluntariness of use25.0%1st20.0%1st
Disclaimer/Publisher’s Note: The statements, opinions and data contained in all publications are solely those of the individual author(s) and contributor(s) and not of MDPI and/or the editor(s). MDPI and/or the editor(s) disclaim responsibility for any injury to people or property resulting from any ideas, methods, instructions or products referred to in the content.