Abstract
As a crucial vehicle for green technological innovation, cooperative networks significantly promote resource integration and knowledge sharing. Yet, their dynamic evolution and micro-mechanism remain underexplored. Drawing on data from the joint applications of green invention patents between 2006 and 2021, this study constructed a multi-agent GTCIN involving multiple stakeholders, such as enterprises, universities, and research institutions, and analyzed the topological structure and evolutionary characteristics of this network; an exponential random graph model (ERGM) was introduced to elucidate its endogenous and exogenous driving mechanisms. The results indicate that while innovation connections increased significantly, the connection density decreased. The network evolved from a “loose homogeneity” to “core aggregation” and then to “outward diffusion”. State-owned enterprises in the power industry and well-known universities are located at the core of the network. Preferential attachment and transitive closure as endogenous mechanisms exert strong and continuous positive effects by reinforcing local clustering and cumulative growth. The effects of exogenous forces exhibit stage-specific characteristics. State ownership and regional location become significant positive drivers only in the mid-to-late stages. The impact of green innovation capability is nonlinear, initially promoting but later exhibiting a significant inhibitory effect. In contrast, green knowledge diversity exerts an opposite pattern, having a negative effect in the early stage due to integration difficulties that turns positive as technical standards mature. Geographical, technological, social, and institutional proximity all have a positive promoting effect on network evolution, with technological proximity being the most influential. However, organizational proximity exerts a significant inhibitory effect in the later stages of GTCIN evolution. This study reveals the shifting influence of endogenous and exogenous mechanisms across different evolutionary phases, providing theoretical and empirical insights into the formation and development of green innovation networks.
1. Introduction
The world is confronted with formidable challenges, including environmental pollution, resource exhaustion, and climate change, which seriously endanger the sustainable development of human society. Green technology, as a key means to reduce pollutant emissions and conserve resources, has gradually become an essential solution to the global environmental crisis [1]. However, traditional closed innovation modes, constrained by limited resource sharing and information blockages, may no longer be suitable for high-difficulty, high-risk green technology innovation activities. An increasing number of innovators are now breaking through organizational boundaries, constructing open green innovation networks, and collaborating with other network participants to acquire complementary innovation resources and reduce the complexity and risk of innovation [2,3].
In recent years, China’ green patent applications have reached unprecedented levels globally, achieving significant breakthroughs in key areas such as energy conservation, energy storage, and clean energy. These achievements are inseparable from the multi-party collaborative innovation strategy promoted by the government [4]. They encourage close cooperation among enterprises, universities, research institutions, government bodies, and non-governmental organizations for the purpose of promoting the sharing and diffusion of green technologies and provide strong momentum for continuous green technology advancements. Green technology cooperation innovation networks (GTCINs) reflect the distribution and flow of green knowledge, green resources, and green innovation capabilities among different actors. Clarifying the structural characteristics and dynamic evolution of this multi-agent CTCIN is crucial for understanding green technology cooperation, improving the green technology system, and enhancing the green innovation capabilities of key innovation players.
Existing literature generally agreed that proximity has been a crucial driver influencing the network hierarchical and network clustering. The similarity among innovation actors in terms of geographic location, technological foundation, and institutional norms facilitates mutual understanding, knowledge exchange, and resource sharing among organizations, thereby promoting collaborative innovation in green technologies. For example, Liu et al. (2021) empirically confirmed that geographic proximity, cognitive proximity, institutional proximity, and technological proximity all positively contribute to the development of intercity green innovation networks [5]. Similarly, Liang et al. (2022) employed Quadratic Assignment Procedure (QAP) method and discovered that green innovation linkages are influenced by geographical proximity [6].These studies provide a solid foundation for understanding the formation and evolution of green innovation networks. However, a single proximity-based perspective can only capture how dyadic relationships external to the collaboration network alter interaction opportunities and facilitate cooperation, yet it falls short of revealing the structural characteristics and underlying mechanisms shaping network evolution.
Resource dependence theory emphasizes that organizational behavior is a strategic response to external environmental conditions. The core motivation for innovation actors to participate in collaborative networks lies in obtaining critical external resources to compensate for their own innovation deficiencies [7]. In the context of green technological innovation—a highly complex and knowledge-intensive endeavor—external resources such as green knowledge, green technologies, and supportive green policies constitute indispensable inputs. Due to the dual externalities of knowledge spillovers and environmental spillovers, green innovation processes are often accompanied by heightened uncertainty and risk across stages such as capital investment, technology commercialization, and market application. Consequently, firms exhibit an increased dependence on external resource acquisition [8,9,10]. Against this backdrop, partner selection within collaborative networks is far from random. Instead, actors exhibit a distinct green preference attribute in forming partnerships. Specifically, organizations make rational choices when acquiring resources, favoring partners that possess comparative advantages in green knowledge, policy responsiveness, and technological capabilities, include state-owned enterprises, universities and public research institutes, and high-resource entities located in provincial capital cities [11,12,13]. Collaborating with such partners not only facilitates access to a diverse set of external resources but also enhances stability in terms of institutional guarantees and policy support, which helps mitigate the uncertainty and transaction costs associated with green innovation activities [14]. This preference-driven selection mechanism facilitates the emergence of high-capability, high-resource nodes as core nodes during network evolution, further reinforcing the structural heterogeneity of the network [15]. In turn, these structural patterns influence the formation and expansion of network relationships throughout the network’s evolutionary process [16]. Therefore, this paper predicts that the dynamic evolution of a multi-agent GTCIN is likely influenced by node attribute characteristics, dyadic proximity relations, and overall network structure.
Micro-level entities are important actors in green technological innovation and serve as the fundamental units of the GTCIN. Exploring the driving mechanisms of GTCIN from a micro-level perspective helps uncover the behavioral decision-making logic of innovation entities, provides insights into the intricate details of network formation, and enhances our understanding of the dynamic evolution of GTCIN. This paper aims to construct a multi-agent GTCIN, conduct a visual analysis of its topological structure and evolutionary characteristics, and introduce an Exponential Random Graph Model (ERGM) to examine the driving mechanisms behind the network’s evolution from three dimensions: actor attributes, dyadic proximity relations, and network structure. The marginal contributions of this study are as follows: First, this paper directly puts the spotlight on the micro-level of innovation entities and elucidates the evolutionary logic of multi-agent GTCIN, thereby offering a scientific decision-making reference for guiding organizational innovation cooperation. Second, we extend the exploration of the driving mechanisms behind GTCIN evolution by not only investigating the role of multidimensional proximities in the GTCIN formation process but also delving into the influence of network entity attributes and structural properties. Third, distinct from traditional regression methods such as QAP, which assume the independence of variables, ERGM highlights the interdependence of factors driving network evolution. It offers a more accurate and objective quantification of the driving mechanisms behind the evolution of GTCIN, thereby laying a theoretical foundation for promoting the deep integration and development of green innovation entities.
The remainder of this study is organized as follows. Section 2 reviews the literature and proposes research hypotheses. Section 3 provides a detailed description of the research methods, indicator construction, and data sources. In Section 4, we elaborate on the results of the analysis, including the structural evolution of the multi-agent GTCIN and its underlying driving mechanisms. Section 5 discusses the main findings, offers policy implications, highlights limitations and further research directions. Section 6 presents our main conclusions.
2. Literature Review and Hypothesis Development
2.1. Green Innovation Network
The increasing dynamism and complexity of the external environment have led firms to recognize that no organization can generate all the knowledge required for technological innovation solely from internal sources; instead, it is essential to acquire additional information and resources from external partners. Open innovation networks that are characterized by multi-actor interaction, multi-level coexistence, distributed structures, and complex system dynamics have emerged as an effective mechanism for knowledge exchange and technological collaboration among innovation actors, drawing growing attention from the academic community. The concept of innovation networks originates from social network theory, which highlights the impact of inter-organizational or interpersonal relationships and interactions on behavior and outcomes. Freeman (1991) was one of the first to define innovation networks, describing them as a fundamental institutional arrangement distinguished by informal and implicit relationships, with inter-firm innovation collaboration serving as the core mechanism for the formation of network structures [17]. The construction of innovation networks accelerates information flow and resource sharing, enhances communication efficiency among innovation actors, and facilitates access to diverse explicit and tacit knowledge resources [18]. Recently, as environmental concerns have become increasingly prominent and sustainable development strategies have advanced, collaborative innovation networks in the green and ecological domains have emerged as a prominent focus of scholarly inquiry.
The existing literature has predominantly focused on the spatial distribution characteristics of green innovation networks. For instance, Dong (2023) found that green technological innovation activities were highly concentrated in a few developed cities, with green innovation networks exhibiting pronounced polarization and a distinct core–periphery structure [19]. Yang (2024) pointed out that in the spatial correlation network of green innovation efficiency, provinces with strong innovation capabilities tend to attract more innovation linkages from other provinces, demonstrating a clear “gravitational effect” [20]. Hu et al. (2024) revealed that the evolution of the photovoltaic technology innovation network was profoundly influenced by core nodes [21]. Some scholars have attempted to investigate the driving mechanisms behind the evolution of green technological innovation networks, among which the proximity theory has been widely applied to explain the formation of collaborative relationships and network dynamics. Originally proposed by Boschma (2005), this theory argues that proximity influencing inter-organizational interactions is not only limited to geographic distance but also includes multiple dimensions such as cognitive, organizational, social, and institutional proximity [22]. Proximity reduces the cost and uncertainty of inter-organizational collaboration, enhances communication efficiency and trust formation, and thereby facilitates resource sharing, knowledge exchange, and joint innovation. Liang (2018) closely examined the innovation network of solar photovoltaic technology cooperation in China and found that participants are more likely to collaborate with previous partners [16]. Li (2024) further indicated that the influence of proximity on the wind power industry exhibits both type-specific and stage-dependent heterogeneity: technological and institutional proximities show significant positive effects across all stages, organizational proximity only demonstrates a positive impact during the early stage, and geographic proximity even exerts a negative effect during the mid-stage [23].
Despite the valuable insights provided by proximity theory in understanding the formation of green innovation collaborations, several significant limitations remain to be addressed. On the one hand, a single perspective of proximity captures only how dyadic relationships external to the cooperation network influence the opportunities for node interactions and ease of collaboration; it fails to fully reveal how internal network structural characteristics like node centrality and clique structures affect node behaviors and the evolutionary trajectories of the network. On the other hand, existing studies have commonly employed the QAP method, which follows the traditional regression analysis framework and assumes the independence of innovation actors. However, the formation and evolution of green innovation ties are inherently an interdependent process, relying on the intricate interplay and interactions among actors and their existing relationships. The assumptions underlying regression methods clearly contradict the realities of green technology cooperative innovation network evolution. Therefore, there is an urgent need to introduce methods to comprehensively reveal the generative mechanisms and evolutionary logic of green technology cooperative innovation networks.
In recent years, ERGM, as a statistical modeling approach capable of capturing the endogenous dependencies within network structures, has gradually been introduced into the study of innovation networks. Unlike traditional regression models, ERGM assumes that ties within a network are not independent but interdependent and influenced by other node relationships and the overall network structure. Moreover, it simulates the network formation process to estimate the likelihood of specific network features emerging, such as triadic closure, preferential attachment, and attribute homophily, thereby identifying the driving mechanisms behind network evolution. In this model, network structures emerge from the network’s self-organizing processes, serving as the endogenous driving force for the evolution of GTCIN. Meanwhile, entity attributes and dyadic proximity relations originate from independent external information sources beyond the GTCIN, acting as exogenous drivers of network evolution [24]. ERGM has gained considerable recognition among social network researchers since its introduction. For instance, Kim et al. (2016) applied ERGM to inter-organizational networks in strategic management, validating that reciprocity and triadic closure serve as critical endogenous structures shaping board networks [25]. Liu et al. (2024) constructed an industrial air pollution network among Chinese cities and verified, through ERGM, that the network’s evolution exhibits characteristics of reciprocity, connectivity, and transitivity and that pollution links are more prone to occur between cities with similar levels of economic development, green technology innovation capacity, and institutional environments [26]. Liu et al. (2025) utilized the ERGM to identify prominent preferential attachment structures in the evolution of global urban networks [27]. Taken together, these studies confirm that ERGM is an effective tool for examining the driving mechanisms of innovation network evolution. However, to the best of our knowledge, it has not yet been applied to the study of inter-organizational GTCIN.
2.2. The Driving Mechanism of Multi-Agent GTCIN
2.2.1. Network Structure
Preference attachment and transmission closure are important structural dependency mechanisms in GTCIN [28]. Preferential attachment is manifested in newly joined nodes following the principle of preferential selection, preferring to establish connections with nodes of high connectivity [29]. According to the network prestige theory, nodes with high reputation are usually at the core of the GTCIN, with rich innovation resources, technical knowledge, and talent reserves, and are connected to many partners [30]. On the one hand, cooperation with them can absorb and utilize the green technology innovation resources of the core subject, and on the other hand, it will also improve the reputation and legitimacy of other cooperative members, so as to have better conditions and capabilities to obtain external resources and policy support [31]. Therefore, core nodes are considered reliable partners, becoming the preferred cooperation targets of many innovation entities and relatively easily winning the trust of other organizations while establishing new connections and cooperative relationships. At the same time, the continuous interaction and diverse connections of these nodes with other innovation entities in the network will further increase their influence [32], gradually becoming the hub of knowledge flow and technology diffusion, leading the direction of technological cooperation in the GTCIN. Nevertheless, preferential attachment also brings certain risks, as core resources may be inclined towards a few high-reputation nodes, resulting in excessive centralization of network structure, which not only weakens the innovation capabilities of other innovation entities but also exacerbates the uneven development of the network.
Transitive closure means that if two nodes have a direct connection with a common node, there will be a positive connection tendency between the two nodes. An increase in the number of participants sharing common connections suggests a heightened likelihood of forming ties between previously unconnected individuals [33], thereby diversifying the cooperative relationships within the network. This mechanism reflects the characteristic of “friends of friends may become friends” in social networks [13]. The complexity and interdisciplinary nature of green technology require green innovation entities to establish a wide range of external connections to obtain diversified knowledge, technology, and resources [34,35]. The triadic closure structure of the GTCIN connects multiple sets of bilateral relationships, in which the common connectors act as “intermediaries” or “endorsers”, effectively lowering the trust threshold between potential partners, promoting the efficient flow of information and resources, broadening the channels for innovation entities to find partners, and providing a stable innovative interaction environment for green technology research and development [36]. On the other hand, the large number of closed triangle structures improves the connectivity of the GTCIN, enabling nodes to be interconnected through shorter paths, reducing redundancy and repeated technology development, and promoting the optimal allocation of green innovation resources. Accordingly, we proposed the following hypotheses:
H1a.
There is a preference attachment in the multi-agent GTCIN, and high-reputation nodes can form more cooperative relationships.
H1b.
The multi-agent GTCIN has a transmission closure effect that is conducive to establishing and maintaining stable cooperative relationships.
2.2.2. Network Entity Attributes
The green technology innovation is often accompanied by high-cost investments, market uncertainties, and the risk of failure. Generally, collaborative partners with green innovation advantages—particularly those equipped with political and technological resources—can provide more substantial resource support and facilitate technology spillovers.
State-owned attributes and regional location attributes are important aspects of the political resource advantages of innovation entities in the field of green technology innovation. State-owned organizations refer to innovators such as state-owned enterprises, public universities, and public research institutions, where property rights and control rights belong to the state. These entities typically enjoy more government support and policy inclinations, including R&D subsidies, tax benefits, and loan support [37,38]. Not only do they have priority in obtaining government procurement and infrastructure construction projects, but they also have extremely high participation and a voice in regulatory system protection, industry standard formulation, and policy planning [39,40]. This allows them to gain comprehensive policy information first, thereby seizing opportunities in strategic adjustment and resource reallocation to promote more complex and in-depth green innovation projects [41]. On the other hand, state-owned organizations, compared to non-state-owned organizations, place greater emphasis on basic research in green technology and have a stronger substantive innovation orientation when participating in R&D cooperation, thereby generating greater positive externalities. Cooperation with them can make up for the resource gap in green basic research and reduce the organization’s concerns about the loss of benefits caused by positive externalities [14,42,43]. Innovation entities located in provincial capital cities are geographically endowed with political resources. Provincial capital cities are often important bearers of national green development strategies and green policy pilots, as well as the core areas of industrial clusters. They usually have superior resource endowments, advanced innovation systems, and strong policy implementation capabilities [44]. Innovation entities in provincial capital cities find it relatively easy to obtain more green innovation cooperation opportunities and attract more partners [45].
From the perspective of technical resources, the green innovation capabilities and diversity of green knowledge bases of network actors are important attributes affecting the evolution of GTCIN. Green innovation capabilities determine the breadth and depth of the innovation entity’s green technology cooperation range, helping the organization effectively expand green technology cooperation relationships [46]. Innovation entities with great green innovation capabilities usually have a relatively solid research foundation and prior accumulation, expressing strong sensitivity and flexibility in strategic planning, risk response, and strategy adjustment for the development of complex green technologies, making them easily trusted by other entities seeking innovation cooperation and collaborative innovation. With the popularization of green technology and the multipolar development of networks, innovation entities have more and more partners to choose from. Cooperating with partners with high green innovation levels will face high cooperation and maintenance costs, and the disparity in capabilities will also exacerbate the imbalance in innovation cooperation. In comparison, innovation entities are more inclined to choose cooperation partners with relatively lower costs and more complementary technical fields to expand green technology resources.
In essence, green innovation largely stems from the re-combination of knowledge elements in different disciplines and fields [13]. The diversified technology investment and knowledge reserves of organizations in green technology can promote the collision and intersection of different technical paths and innovative ideas, driving the emergence of more efficient and innovative green technology solutions. Elisa and Martin (2005) pointed out that organizations with advanced knowledge bases are more frequently approached by other organizations to exchange knowledge [45]. Benedikt et al. (2016) found that diverse knowledge bases and technologies can have a greater impact on subsequent innovation [47]. Antony and Stephanie (2019) stated that the diversity traits of participants enable them to gain the most benefits from cooperation [48]. Despite this, it is worth emphasizing that in the early stages of the development of a GTCIN, participants have significant differences in knowledge backgrounds and each member in the network may face different knowledge and technical challenges. An overly diversified knowledge base may lead to communication difficulties and obstacles in resource integration, thereby restricting the collaborative innovation of innovation entities. Therefore, we propose the following hypotheses:
H2a.
The state-owned attributes and regional location attributes of innovation entities have a positive impact on the GTCIN process.
H2b.
The green innovation capabilities and green knowledge base diversity of innovation entities play an important role in the GTCIN, and their effects will show stage characteristics.
2.2.3. Proximity
The French proximity dynamics school established a multidimensional proximity framework from the perspectives of geography, technology, society, organization, and institution, which provides a theoretical basis for this paper to understand green technology cooperative innovation [22].
Geographical proximity reflects the degree of spatial closeness among innovating actors. In terms of the development stages of green technology, the complexity of green innovation has resulted in the failure to standardize and codify relevant technical knowledge [13], and the tacit knowledge involved has not been spread to a wide range of communities [36]. The knowledge required to develop green patents has a higher tendency to be transferred and co-produced in places with close geographical distances [49,50,51]. Geographic proximity facilitates face-to-face communication and offline visits between innovation entities, enhancing the transparency of information and helping innovation entities to obtain soft information beyond company financial reports and government annual reports [52,53]. This increases the likelihood of interaction between innovation entities, promoting the transfer and spillover of green knowledge [54], especially tacit and idiosyncratic knowledge [55].
Technological proximity refers to a high similarity in knowledge bases or technological composition among cooperating entities and reflects the mutual fit of different organizations in terms of technology, R&D direction, or professional skills [56]. Although the R&D of green technology within organizations requires the introduction of heterogeneous knowledge [35,57,58], mutual understanding between the collaborating parties is even more critical for the development of complex green technologies [59]. Technological proximity diminishes the cognitive gap between collaborators, alleviates communication obstacles, and, to a certain extent, bridges the cooperation barriers caused by technological differences. This facilitates the exchange, assimilation, and transformation of green knowledge, mitigates the challenges associated with the introduction and integration of external knowledge, and attracts more entities with complementary technologies to participate in network construction [60].
Social proximity is a trust relationship established by actors embedded in the social context based on past growth experiences and cooperation experiences [22]. Green technology innovation often involves complex technical issues and a long R&D cycle with a high degree of uncertainty and risk [14,61]. Accumulated trust in the early stages can mitigate friction within the cooperation process, strengthen interactions among entities, and diminish the likelihood of opportunistic behavior, thereby partially averting the “free-riding” phenomenon in cooperative endeavors [62,63]. Additionally, green technology innovation, with strong publicness and externalities, pursues sustainable development goals. Innovation entities embedded in social proximity often share similar behavioral patterns and core values, which helps to enhance the stability of cooperation and reduces the contractual risks owing to the uncertainty of green technology innovation and the transaction costs caused by conflicts of interest.
Organizational proximity represents the similarities among actors in terms of organizational structure, management models, and operational methods [64], suggesting that the incentive policies for knowledge creation and exchange within organizations are likely to be aligned. This alignment can effectively prevent cultural conflicts and foster efficient communication and collaboration between organizations [65]. Nonetheless, it is noteworthy that organizational proximity, due to the similarity of the environment, may suppress innovative activity and lead to the formation of closed network systems, which is detrimental to the acceptance and introduction of new knowledge and technologies and poses a challenge to the sustainable development of organizational green technology. Ciobanu, G., C. Ghinăraru and C. Teodor [66] have highlighted that public–private partnerships are a crucial avenue for disseminating eco-innovation. Melander and Arvidsson (2022) identified public–private cooperation as the predominant model in GTCIN [67].
Institutional proximity reflects the similarity between actors in terms of institutional frameworks, policy regulations, and behavioral norms. The special existence of double externalities leads to the orderly promotion of green innovation by most entities under the guidance of the government and is subject to institutional constraints such as environmental standards, emission restrictions, and resource protection policies. The cooperative entities will form highly consistent values and codes of conduct when operating under similar laws, regulations, and policy environments, which is beneficial to reduce the communication barriers caused by compliance issues and lower costs and complexity in the cooperation process, thereby enhancing the efficiency of green technology cooperation and innovation. Thus, we propose the following hypothesis:
H3.
Multi-dimensional proximity has a significant effect on the GTCIN, but the effect is heterogenous.
3. Research Methods and Data Sources
3.1. Construction of a Multi-Agent GTCIN
Patents, as a significant indicator of innovation at the micro-level, have proven to be a viable way to construct innovation networks using joint patent application data [21,68]. Compared to utility patents and design patents, invention patents are more original in their innovative nature, while those officially authorized by the authorities better reflect the quality of the patents. This study constructs a GTCIN based on disclosed green invention patent co-application data. The dataset spans the period from 2006 to 2021 and includes cooperative innovation activities involving enterprises, universities, research institutes, and other innovation organizations. To identify green patents, we adopted the Green Technology Patent Classification System issued by the China National Intellectual Property Administration (CNIPA) in 2023, which categorizes green technologies into 12 major technical domains—including fossil energy decarbonization, clean energy, and pollution control—and provides corresponding International Patent Classification (IPC) codes and reference keywords for each domain and its subfields. Using these IPC codes and reference keywords, we retrieved co-application data for green invention patents that meet the following criteria: (1) at least two applicants; (2) all applicants are located in China; and (3) the patent has been officially authorized. As a result, we obtained a total of approximately 364,500 records of green technology cooperation covering the years 2006–2021. Subsequently, Python 3.8.2 was used to split multiple applicants on the same patent into pairwise collaborations, eliminate individual connections, and construct an undirected cooperation matrix for the multi-agent GTCIN. Given the complexity of green technology, large-scale, unplanned, or accidental innovation cooperation may obscure the understanding of the evolutionary process of the multi-agent GTCIN. This study adopts the edge removal principle to remove low-weight edges (weight 1) to simplify the network. Subsequent social network analysis and ERGM analysis are based on the simplified networks.
3.2. Social Network Analysis Method
Social network analysis provides a systematic quantitative indicator for the analysis of GTCIN. This study analyzes the structural characteristics of the multi-agent GTCIN from two dimensions: overall network attributes and node centrality. The overall network attributes analyze the network structure, comprising all nodes and edges from a global perspective, considering aspects such as network scale, network density, weighted-average degree, average clustering coefficient, and average path length. Among them, the network size represents the total number of inventors in the entire network. Generally speaking, the larger the network scale, the more complex the network structure. The network density reflects the closeness of cooperative innovation connections, and the weighted-average degree is an important representation of node connection strength. The average clustering coefficient measures the degree of development of network clustering, and the average path length depicts the closeness between points in the network, with shorter lengths indicating closer connections. Node centrality examines the direct connections and interactions around the node, helping to understand the position and influence of individuals within the entire network. The above network analysis was completed with the help of Gephi 0.10.1 software.
3.3. Exponential Random Graph Model
ERGM was applied to explore the driving mechanisms of the multi-agent GTCIN. This model simulates the network formation process through the Monte Carlo Markov Chain Maximum Likelihood (MCMC MLE) method to assess the fit of the generated network to the real network. The fitting degree of the model is evaluated based on the Akaike Information Criterion (AIC) and Bayesian Information Criterion (BIC), with lower values expressing a better fit. The results of variable fitting are reflected by the significance of the t-test parameters. The model is highly inclusive of variable types, considering network structure variables, node attribute variables, and dyadic neighbor relationship variables simultaneously, and examines the dynamics of network formation and evolution from a multi-dimensional perspective. In this study, the network structural variables include edges, preferential attachment, and transitive closure, which capture the endogenous mechanisms of network formation. Node attribute variables reflect the characteristics of the innovation entities, like state-owned attributes, regional location attributes, green innovation capability, and green technology diversity. Binary neighbor relationship variables, such as geographic proximity, technical proximity, social proximity, organizational proximity, and institutional proximity, display relational closeness between nodes. The simulation process can be implemented using the ERGM function from the statnet package in R. The standard ERGM model is mainly aimed at binary networks, and the original undirected weighted multi-agent GTCIN needs to be binarized. Given the multitude of network entities and the sparse network structure in multi-agent GTCIN, where most innovation links between entities have low weights, the conventional approach in the literature to extracting the network backbone or core nodes may lose a significant amount of information. This study focuses directly on the simplified network, setting edges with innovation links to 1 and the others to 0. The model’s probability function is
where is the actual network, is the simulated network, is the network structural variables, is the estimated parameter of the configuration , denotes node attribute variables, is the fitting parameter of the attribute of the network , continuous variables are fitted by “nodecov”, and categorical variables are fitted by “nodematch”. represents binary neighbor relationships, is the estimated parameter of the binary neighbor relationship , “edgecov” is used for fitting (see Table 1), and is a normalization constant to ensure that the sum of the network structure probability values is between 0 and 1.

Table 1.
Variable setting of ERGM and its explanation.
Next, we explain the calculation methods for the variables mentioned above. The structural attributes mainly examine the preferential attachment structures and the transitive closure structure, which are represented by geometrically weighted degree distribution and geometrically weighted edge-sharing partners, respectively. The attributes of network entities are developed from four aspects: (i) State-owned attributes: organizations are divided into state-owned organizations and non-state-owned organizations based on the ownership and control rights of the organization [69], with state-owned enterprises, public universities, research institutions, and other state-owned organizations set to 1 and private enterprises, foreign enterprises, joint ventures, and other non-state-owned organizations set to 0. (ii) Regional location attribute: whether the organization is located in a provincial capital city is used as the criterion, if the regional location is a provincial capital city, it is set to 1, otherwise, it is set to 0. (iii) Green innovation capability: the number of patent authorizations of micro-entities in the field of green technology innovation, taking the natural logarithm. (iv) Green technology diversity: referring to De Noni, I., A. Ganzaroli and L. Orsi [70]. Noni’s research patents are classified based on the first four IPC classification numbers and measured using patents applied for from year t − 4 to t; the formula is shown in Equation (2).
where represents the number of green patents containing the first four IPC classification numbers k of innovation entity from year to and represents the total number of green patents of innovation entity from year to . StataSE 16 software is used for the calculation.
Binary relationship proximity is measured from the following aspects: (i) Geographic proximity: this reflects the degree of proximity of the innovation actor in spatial position. We use Baidu Maps to pick up the latitude and longitude coordinates of the city where the innovation entity is located and then combine with the Geo function of STATA software to calculate the spherical distance; the geographic proximity level is represented by its opposite number. (ii) Technical proximity: the adjusted cosine similarity of the number of patent authorizations encoded by the four-digit IPC code in the field of green technology is used (see formula (3)) [71]. (iii) Social proximity: referring to the degree of proximity between actors in terms of social relations, emotional ties, or personal connections, and is represented by the frequency of cooperation between the cooperating entities in the past period. (iv) Organizational proximity: the organizational forms of micro-entities include enterprises, universities, scientific research institutions, government agencies and groups, etc. If they belong to the same category, it is set to 1, otherwise it is 0. (v) Institutional proximity: organizations located in the same province have a high degree of consistency in policies and systems. If the organizations are located in the same province, it is set to 1, otherwise it is 0.
where and represent the number of patents of organization or in the kth category of invention patents; the indicator is calculated using StataSE 16 software.
4. Result and Analysis
4.1. Structural Characteristics of the Evolution of the Multi-Agent GTCIN
Table 2 presents the topological structure of the multi-agent GTCIN. The breadth and depth of the multi-agent GTCIN continued to expand, and the network structure gradually became more complex. The network size has gradually grown from only 54 nodes in 2006 to its peak in 2019, increasing by a factor of 23.27. Concurrently, the average degree of the network increased from 1.185 to 2.941 and the average weighted degree also showed a fluctuating upward trend, reaching a maximum value of 17.031 in 2019. In the last two years, this index has declined significantly, implying that the scalability of green technology cooperation has reached saturation, heralding the transition of the GTCIN from a rapid expansion period to a stable optimization period.
Table 2.
Analysis of topological structural characteristics.
Additionally, the network density decreased from 0.022 to 0.002, indicating a trend toward a sparser structure. The changing trajectories of network diameter and average path length showed an N-type characteristic, experiencing a multi-stage dynamic evolution of first increasing, then decreasing, and then increasing again. In the initial stage, a large number of new members joined and the relationship between nodes was weak and random, causing the network to become more scattered. As the core nodes gradually formed and their attractiveness increased, network resources became concentrated around these core nodes, enhancing network connectivity and reducing network diameter and path length, signifying a small-world characteristic that effectively improved the efficiency of the diffusion of information, knowledge, or resources in the network. As cooperation deepens and the network structure matures, some peripheral nodes may form new clusters, driving the network to expand again and ultimately increasing the network diameter. In addition, the gradual increase in the average clustering coefficient further confirmed that an increasing number of subgroups or cliques were forming in the GTCIN, exhibiting a highly grouped characteristic. These conclusions not only reveal the network’s diversity and complexity but also highlight the significant characteristics and dynamic evolution patterns of network structures at different stages. Analysis of topological structural characteristics of multi-agent GTCIN from 2006 to 2021.
4.2. Dynamic Evolution Feature Analysis
To more comprehensively reveal the evolutionary characteristics of the GTCIN, this study selected four important time nodes in 2006, 2011, 2016, and 2021 to visually analyze the GTCIN (see Figure 1). In the visualization, the size and color intensity of the nodes represent the distribution of degree centrality; that is, the larger and darker the node, the higher the number of green technology cooperation activities carried out by the innovation entity and the greater its degree centrality. The thickness of the lines indicates the strength of cooperation between innovation entities. In 2006, the GTCIN was small in scale, with a limited number of nodes, and the overall structure was highly sparse. During this period, Sinopec, as the core entity, led most of the innovation cooperation and played a key role in the green technology cooperation network. This is because Sinopec is one of China’s largest oil refining companies and has placed great emphasis on the research, development, and application of green technologies since its establishment, particularly accumulating rich technological advantages in pollution control and energy efficiency enhancement, giving it a central position at the early stage of the GTCIN.
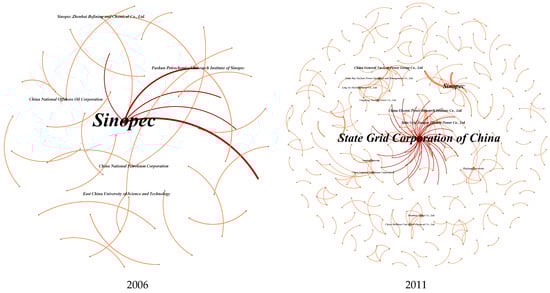
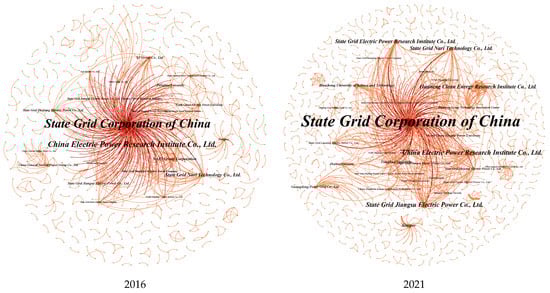
Figure 1.
Spatial evolution of multi-agent GTCIN.
By the year 2011, the network had expanded significantly, with more innovation entities joining; the network exhibited an expansion trend. Sinopec’s core position was gradually replaced by the State Grid Corporation of China and Sinopec was transformed into a secondary core node, which also marked the evolution of the GTCIN from a single-core to a dual-core structure. This shift was mainly due to the fact that the Chinese government began to deeply promote the transformation of energy production and consumption during this period and successively put forward energy strategies such as “China’s Sustainable Development Strategy” and “Energy Development Strategic Action Plan (2014–2020)”, advocating for reduced reliance on traditional fossil fuels and promoting the widespread application of renewable energy for the purpose of facilitating the use of renewable energy. This policy orientation made the power industry increasingly important in green innovation development, establishing the State Grid Corporation of China’s core role in the GTCIN.
In 2016, the structure of the GTCIN gradually became denser and more complex, and the core position of State Grid Corporation of China was consolidated, attracting more and more innovation entities to cooperate with it. These entities have further expanded their partner network through their connections with State Grid Corporation of China, reflecting the innovation entities’ preference for connecting with core nodes. Large-scale preferential connections will form triads and trigger a transmission closure effect, increasing the possibility of cooperation between innovation entities that have no direct connection but have common partners and thus enriching the green innovation collaborations among different types and fields of innovation entities. Simultaneously, a vast array of key nodes has emerged, including China Electric Power Research Institute, NARI Technology Co., Ltd., XJ Group Co., Ltd., Tsinghua University, North China Electric Power University, and others, suggesting that the GTCIN was moving towards a diversified direction.
By 2021, with the implementation of multiple environmental policies such as the “Energy Development ‘Thirteenth Five-Year’ Plan”, “Action Plan for Carbon Dioxide Peaking Before 2030”, “Low Carbon Development Plan (2016–2020)”, and “Energy Production and Consumption Revolution Strategy (2016–2030)”, the GTCIN exhibited a stronger outward expansion trend. Although the core position of key nodes such as State Grid Corporation of China and China Electric Power Research Institute still exists, the overall network structure gradually moves towards decentralization. The number of innovation entities has increased significantly, and the GTCIN has gradually expanded towards multiple core nodes. More and more small and medium-sized enterprises and scientific research institutions have begun to play an important role in the network, forming numerous small groups with state-owned enterprises from the power industry and well-known universities as core nodes. The network structure has developed a “core–periphery” feature and is moving towards decentralization again.
4.3. Dynamic Mechanism of GTCIN
4.3.1. Empirical Results
This paper applies an exponential random graph model to simulate and analyze the dynamic mechanisms of the evolution of the multi-agent GTCIN at different stages (see Table 3). For each selected year, three models were estimated. Model 1 examines the endogenous driving mechanisms of the multi-agent GTCIN, focusing on internal network structural effects. Model 2 tests the exogenous driving factors, such as organizational attributes and external environmental variables. Model 3 integrates both endogenous and exogenous factors to capture the multidimensional dynamics driving the network evolution. As we can see, the AIC and BIC values of Model 3 are lower than those of Model 1 and Model 2 at any stage of the evolution of the GTCIN and the Likelihood value is higher than that of the other two models. This means that the model considering both endogenous and exogenous driving forces is better than the single-driving-force model in terms of fitting effect and explanatory power and can more accurately reflect the real evolution process of the multi-agent GTCIN. Hence, the subsequent analysis primarily focuses on the findings derived from Model 3. The simulation results show that the estimated parameters of the edge effect are always negative, signifying that it costs a certain amount for innovation entities to establish and maintain green technology innovation cooperation. This indirectly reveals that the formation of green innovation cooperation is not a simple random event and may be constrained by multiple factors.
Table 3.
Fitting results of ERGM.
The estimated coefficients of geometric weighted degree distribution are 8.793, 7.657, 1.860, and 2.081, all of which passed the 1% significance test. This shows that innovation subjects tend to establish cooperative relationships with core nodes that already have many partnerships, fully reflecting the mechanism of preferential attachment. Hypothesis 1b is confirmed. The estimated coefficients of geometrically weighted edge-sharing partners are 1.165, 1.987, 6.354, and 5.057, respectively. This shows that the green technology cooperation relationship of innovation subjects will also be affected by the transmission closure mechanism, verifying hypothesis 1b. It is worth emphasizing that the effect of the preferential attachment mechanism decreases year by year, while the effect of the transmission closure mechanism increases upward. The fundamental reason for this is that in the exploratory stage of green technology development, innovation entities are more inclined to establish green innovation links with core nodes to obtain technology spillovers and knowledge spillovers. The continuous process of preference attachment will form many open triples that will serve as key carriers of trust and knowledge flow, accelerate the sharing and diffusion of information, and promote the formation of closer collaborative relationships among innovation entities, becoming increasingly important in the later stages of green industry evolution.
From the perspective of exogenous drivers, the attributes of network actors play varying roles at different stages of the evolution of green technology cooperative innovation networks. The state-owned attribute exerts a positive and significant effect on the evolution of green technology innovation networks, becoming statistically significant from 2011 onward, with estimated coefficients of 0.438, 0.537, and 0.615, all passing significance tests. The regional location attribute of innovation actors positively influences green technology cooperation, showing statistical significance starting from the later stages of technological development. The above findings confirm hypothesis 2a. Green innovation demonstrated a significant positive impact on network evolution in 2011 and 2016; however, by 2021, this effect began to shift toward a negative influence. The effect of green knowledge base diversity is just the opposite. Early challenges such as difficulties in technology integration and resource coordination led to poor communication and increased costs, exerting a negative impact on network evolution. As technical standards are standardized, innovation entities with diverse knowledge bases have greater flexibility in partner selection and green technology cooperation, which in turn plays a positive role in shaping and updating green technology innovation partnerships. Hypothesis 2b is supported.
Geographic proximity, technological proximity, and social proximity always have a significant positive effect. The estimated coefficients of geographical proximity are 0.161, 0.043, 0.035, and 0.029, and the estimated coefficients of social proximity are 0.063, 0.092, 0.113, and 0.090. The effect of technological proximity is the most prominent, with estimated coefficients of 1.111, 5.830, 5.188, and 5.279. All the above results have passed the statistical significance test. The role of institutional proximity in promoting the evolution of the GTCIN was not significant in the early stage of technology evolution but emerges in the middle stage and continues to increase. The probability of cooperation between innovation entities in the same province is 3.912 (e1.364) times, 4.928 (e1.595) times, and 5.458 (e1.697) times that of cross-provincial innovation in 2011, 2016, and 2021, respectively. The impact of organizational proximity on the GTCIN was not significant in the early and middle stages; it was not until 2021 that it demonstrated pronounced suppressive effects. In view of differences in business philosophy, management models, corporate culture, etc., green technology innovation entities have obvious differences in their perception and positioning regarding green technology, which can provide diverse views, technologies, and resources for green technology research and development. In contrast, innovation entities with higher organizational proximity limit the vitality of green innovation and are not conducive to the green technology innovation of organizations.
4.3.2. Goodness of Fit Test
Considering the length of the article, this paper takes 2021 as an example to evaluate the goodness-of-fit of Model 3, which incorporates both endogenous and exogenous motivational variables. Based on the estimated parameters of Model 3, a Monte Carlo simulation was conducted 1000 times to generate synthetic networks, and key structural features of the simulated networks were compared with those of the real network. The comparison focused on three primary network characteristics: degree distribution, edge-wise shared partners, and minimum geodesic distance.
As presented in Figure 2a–c, the black lines indicate the statistics of the observed network, while the boxplots and blue dots represent the confidence intervals and means of the simulated networks, respectively. The visual results indicate a high degree of consistency between the simulated and observed networks across all dimensions. The near-identical degree distributions suggest that the model accurately reproduces the probability of node connections. The good fit of the edge-wise shared partner distribution indicates that the model effectively captures local clustering and triadic closure structures within the network. The geodesic distance distribution presents that the model is capable of capturing the connectivity of the real network.
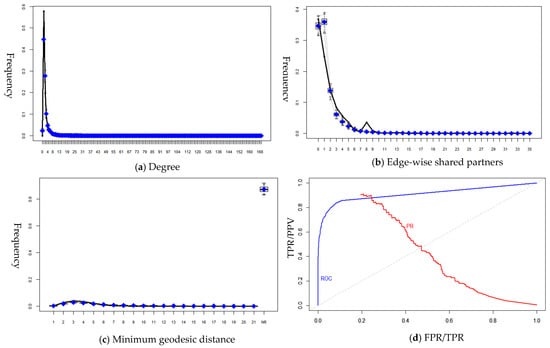
Figure 2.
Goodness-of-fit test.
Furthermore, an ROC curve was employed to evaluate the predictive performance of the model, as shown in Figure 2d. The x-axis represents the false positive rate (i.e., the proportion of edges predicted by the model that do not actually exist in the observed network), while the y-axis denotes the true positive rate (i.e., the proportion of ties that both exist in the observed network and are correctly predicted by the model). The ROC curve is positioned close to the upper-left corner, indicating that the model maintains a low false positive rate while exhibiting strong discriminative power, enabling it to accurately identify actual collaborative relationships within the real network. Overall, the model accurately simulates the structural characteristics of the real network and can capture the dynamic evolution mechanism of the network.
5. Discussion
5.1. Discussion of the Main Results
Distinguishing it from prior studies that focused on relatively macroscopic levels such as cities, provinces, and countries [72,73,74], this paper puts the spotlight on the micro-level innovation entities of a GTCIN. Through structural feature analysis and visualization analysis, we observe the roles and positions of different types of innovation entities in the cooperation process of a GTCIN, clarifying the decision-making logic of innovation entities and revealing the networking details of the GTCIN, thereby enabling readers to better understand the dynamic evolution of these networks.
During the observation period, the GTCIN, which involved multiple actors, continuously expanded in scale and innovation linkages became increasingly abundant; however, network density declined year by year. The network exhibited group characteristics, with state-owned organizations, particularly those in the power industry, and well-known universities serving as core nodes. These findings are highly consistent with the research results of Li, F., W. Liu and K. Bi [74] and Liu, W., Y. Song and K. Bi [75]. Additionally, we observed that the structure of the GTCIN evolved from single-core dominance to a multipolar development pattern, showing an evolutionary trend from a loose homogeneous distribution to core aggregation and then to edge diffusion. These insights contribute to a deeper understanding of the evolutionary process of a GTCIN and enrich our comprehension of the dynamic evolution patterns within these networks.
Unlike previous studies that focused solely on a single dimension of proximity-driven mechanisms, this paper extends the investigation of the driving forces behind GTCIN by employing exponential random graph models from a more systematic perspective. The findings indicate that the formation of such networks is influenced not only by endogenous factors related to network structural attributes but also by exogenous factors, including actor attributes and multidimensional proximities. Specifically, preferential attachment and transitive closure effects emerge as key endogenous mechanisms positively impacting the network’s evolution. Notably, these empirical results are consistent with the structural evolution patterns identified in Section 4. In the early stages of the network, innovation activities were primarily concentrated around a few core actors, such as Sinopec and the State Grid Corporation of China, exhibiting a clear “star-node-driven” structure. However, as the network evolved, particularly by 2016 and 2021, the prominence of triadic structures and the increasing involvement of diverse innovation entities indicated a shift toward more decentralized and collective forms of collaboration. Our empirical results characterize this transformation, indicating that over time the influence of preferential attachment gradually diminishes, while transitive closure becomes increasingly important. These findings corroborate Granovetter, M. [76] theoretical perspective on the crucial role of embeddedness and trust mechanisms in cooperative networks. It highlights the significance of trust, reputation, and long-term relationships in the process of green technology collaboration, thereby enriching the existing literature on the evolution of cooperation networks.
Second, our study reveals that actor attributes exhibit stage-specific effects during the formation and evolution of green technology cooperative networks, demonstrating that the evolution of such networks is not a spontaneous or homogeneous process but closely related to the characteristics of the participating innovation actors. Attributes such as state ownership and regional location begin to show significant positive effects from the mid-stage of network evolution, consistent with the findings of Li, Y., K. Qian, Z. Wang and A. Xu [23]. Furthermore, green innovation capability and the diversity of green knowledge bases exert important nonlinear influences on network evolution. Among them, green technology innovation capability follows a “promotion-then-inhibition” trajectory. When firms’ innovation capability is at a moderate level, they tend to enhance their technological capacity through collaboration; however, when innovation capability becomes too strong, firms may reduce their incentives for external cooperation due to robust internal R&D capabilities. In contrast, the diversity of green knowledge bases exhibits a “negative-then-positive” effect, reflecting that in the early cooperation phase, high heterogeneity in knowledge bases may increase communication and coordination costs, hindering the establishment of cooperative relationships. Once the network stabilizes and normative mechanisms improve, knowledge diversity becomes a vital driver for deepening cooperation and facilitating innovation diffusion. These findings provide empirical support for the structural characteristics and dynamic evolution of GTCIN described above, enriching our understanding of network formation mechanisms and evolutionary patterns and offering practical guidance for selecting actors and formulating cooperation strategies in green technology collaboration.
Finally, this study systematically identifies the distinct roles of geographic, technological, social, institutional, and organizational proximities in the evolution of a GTCIN, revealing that their impacts on green technology collaboration relationships exhibit stage-specific heterogeneity that is highly consistent with the views of Li, Y., K. Qian, Z. Wang and A. Xu [23]. This provides empirical support for the applicability of proximity theory in green technology innovation networks. Among them, geographic proximity, technological proximity, institutional proximity, and social proximity consistently demonstrate positive effects throughout the network evolution process, indicating that spatial closeness, technological similarity, and social trust mechanisms remain key ties for green technology cooperation. This finding confirms the critical role of proximity in collaborative innovation and aligns with the conclusions of most existing studies [72]. In contrast, organizational proximity shows a significant negative effect in the later stages of network evolution, suggesting that cooperation among highly similar organizations may lead to “cognitive redundancy” and “path dependence”, thereby limiting the heterogeneous knowledge exchange and novel recombination capabilities among innovation actors. This result supports the proximity paradox hypothesis, which posits that excessive organizational homogeneity suppresses the diversity and exploratory nature of innovation search, ultimately weakening the network system’s capacity for co-evolution. To sum up, our research expands the analytical framework for the driving mechanisms of green technology cooperation innovation, offering a more comprehensive perspective for understanding the formation and evolution of green technology cooperation networks. The findings provide practical guidance for policymakers in optimizing support policies for green collaborative innovation and guiding efficient resource allocation, as well as for enterprises in formulating cooperation strategies and enhancing green innovation capabilities.
5.2. Policy Implications
Based on the above conclusions, we have drawn some policy implications. It is essential to integrate the public and private sectors to jointly develop a diversified and inclusive innovation platform for the purpose of building a broader cooperation space and development opportunities for innovation entities. In the process of platform development, the demonstration and leading roles of industry-leading state-owned enterprises and top-tier universities should be fully leveraged, transforming the successful experiences of green technology frontrunners into actionable standards, establishing a systematic repository of green technology innovation case studies, and providing a replicable and scalable demonstration model for green technology innovation, thereby facilitating enterprise-level learning in green technologies. Moreover, efforts should be made to guide enterprises to “go global” in seeking cross-industry, cross-field, and cross-departmental collaborations and deeply integrating them into international organizations, industry alliances, and innovation networks for green technology research and development, aiming to expand the “circle of friends” for green technology cooperation and steadily advance the construction of green technology partnership relationships to build a wide and stable cooperation network.
Second, the government can actively promote deep collaboration among enterprises, universities, and research institutions with similar technological structures, R&D trajectories, or common application scenarios by establishing dedicated funding programs, technology matchmaking platforms, and collaborative R&D projects, facilitating the formation of innovation consortia and specialized collaborative networks anchored in technological relatedness, thereby enhancing the diffusion capacity of green technologies and improving the efficiency of joint R&D activities. Moreover, greater efforts should be directed toward building cross-regional coordination mechanisms to foster communication and collaboration among innovation actors across regions, reducing institutional disparities and policy inconsistencies that may hinder interregional cooperation and aiming to promote the more efficient flow and optimal allocation of green innovation resources across regions. Specific policy measures may include the harmonization of green technology evaluation standards and the implementation of joint interregional innovation funding programs.
Third, the government should construct a policy system that is compatible with green technology innovation cooperation. This involves implementing multi-dimensional measures—such as environmental regulations, organizational frameworks, and operational mechanisms—along with multi-level support including dedicated funding, tax incentives, and green finance. Moreover, the government should strengthen support for establishing joint laboratories, cooperative research centers, green industrial parks, and innovation bases. Create a green industrial ecosystem covering the entire life cycle of technology research and development, market promotion, and industrial application, aiming to promote the efficient transformation and wide application of green technology innovation results.
5.3. Limitations and Future Research
Despite the valuable contributions of this study, it also has limitations. First, although constructing green innovation networks using patent data is a common practice, not all green innovation cooperation can be explicitly reflected through patents. Future research could combine big data technology or model construction to analyze multidimensional GTCIN. Second, given the large scale of innovation entities in this paper, the standard exponential random graph model is used, which binarizes the weighted edges of the network and fails to consider the cooperation intensity among innovation entities. Future research could optimize the model by employing more advanced exponential random graph models for fitting. Lastly, our study mainly focuses on the nodes, edges, and structures of the network and their driving mechanisms for network evolution, without fully considering the impact of external environmental factors such as government policies and market fluctuations. Future research should incorporate these external factors to gain a more comprehensive understanding of the evolution of GTCIN.
6. Conclusions
This paper uses the data of joint green invention patent applications of Chinese innovation entities from 2006 to 2021 to construct a multi-agent GTCIN. Through social network analysis methods, the study delves into the topological structure and evolutionary characteristics of the multi-agent GTCIN and combines ERGM to analyze the driving mechanisms behind the network’s evolution. The main conclusions are as follows:
First, the innovation connection and network scale of the multi-agent GTCIN increased significantly, while the network density decreased year by year, with grouping features centered around state-owned enterprises in the power industry and renowned universities becoming increasingly prominent. The network structure has undergone an evolutionary process from a single-core dominance to a multipolar development, showing an evolutionary trend from a loose homogeneous distribution to core aggregation and then to edge diffusion.
Second, according to the fitting results of the ERGM, the formation and evolution of the multi-agent GTCIN is affected by both endogenous and exogenous driving mechanisms. Preferential attachment and the transitive closure effect are important endogenous driving mechanisms of multi-agent GTCIN, which have a significant positive impact on network evolution. Comparing the changes in the estimated coefficients of the two mechanisms, it is found that the preferential attachment effect is weakening year by year, while the transmission closure effect is continuously increasing. This is because in the evolution of the GTCIN, the star structure will gradually transform into triadic closure structures, meaning that transitive closure mechanisms play an increasingly important role in network evolution. To some extent, the evolution of multi-agent GTCIN is also the result of the trade-off among these effects.
Third, exogenous driving forces such as network entity attributes and binary proximity relationships have a phased impact on the evolution of multi-agent GTCIN. Among them, the network entity attributes begin to take effect in the middle stage of the evolution of the GTCIN, with state-owned attributes and regional location attributes presenting strong positive effects, green innovation capabilities demonstrating a significant “promoting first, then inhibiting” impact, and green knowledge base diversity exhibiting a reversed pattern, showing a suppressing effect in the early stages and a promoting effect in the later stages. Furthermore, we also find that geographic proximity, technological proximity, and social proximity played a significant role in promoting the entire evolution of the multi-agent GTCIN, among which technological proximity has the most prominent effect. Institutional proximity only plays a significant positive role in the middle and late stages of network evolution, while organizational proximity demonstrates pronounced inhibitory effects in the later stages of network evolution.
Author Contributions
Conceptualization, J.M. and L.W.; methodology, J.M. and J.H.; software, J.M. and J.H.; validation, J.M., L.W. and J.H.; formal analysis, J.M.; investigation, J.M.; resources, L.W.; data curation, J.M.; writing—original draft preparation, J.M.; writing—review and editing, J.M., L.W. and J.H.; visualization, J.M. and J.H.; supervision, L.W. and J.H. All authors have read and agreed to the published version of the manuscript.
Funding
This paper is supported by National Natural Science Foundation of China (NO. 42277493).
Data Availability Statement
The data presented in this study are available on reasonable request.
Conflicts of Interest
The authors declare no conflict of interest.
References
- Perruchas, F.; Consoli, D.; Barbieri, N. Specialisation, diversification and the ladder of green technology development. Res. Policy 2020, 49, 103992. [Google Scholar] [CrossRef]
- De Marchi, V. Environmental innovation and R&D cooperation: Empirical evidence from Spanish manufacturing firms. Res. Policy 2012, 41, 614–623. [Google Scholar]
- Berchicci, L. Towards an open R&D system: Internal R&D investment, external knowledge acquisition and innovative performance. Res. Policy 2013, 42, 117–127. [Google Scholar]
- Gui, Q.; Liu, C.; Du, D. Globalization of science and international scientific collaboration: A network perspective. Geoforum 2019, 105, 1–12. [Google Scholar] [CrossRef]
- Liu, Y.; Shao, X.; Tang, M.; Lan, H. Spatio-temporal evolution of green innovation network and its multidimensional proximity analysis: Empirical evidence from China. J. Clean. Prod. 2021, 283, 1–17. [Google Scholar] [CrossRef]
- Liang, Z.; Chen, J.; Jiang, D.; Sun, Y. Assessment of the spatial association network of green innovation: Role of energy resources in green recovery. Resour. Pol. 2022, 79, 103072. [Google Scholar] [CrossRef]
- Wang, X. Why do firms form R&D cooperation: A resource dependence perspective. Technol. Anal. Strateg. Manag. 2021, 33, 586–598. [Google Scholar]
- Wu, A.; Li, H. The impact of government subsidies on contract design of green technology R&D cooperation. Technol. Anal. Strateg. Manag. 2021, 34, 1263–1279. [Google Scholar]
- Ma, R.; Lin, B. Internet development, information availability, and Chinese enterprises’ cooperative green technology innovation. J. Environ. Manag. 2024, 367, 121972. [Google Scholar] [CrossRef]
- Xiang, X.; Liu, C.; Yang, M. Who is financing corporate green innovation? Int. Rev. Econ. Financ. 2022, 78, 321–337. [Google Scholar] [CrossRef]
- Orsatti, G.; Quatraro, F.; Scandura, A. Green technological diversification and regional recombinant capabilities: The role of technological novelty and academic inventors. Reg. Stud. 2023, 58, 120–134. [Google Scholar] [CrossRef]
- Květoň, V.; Horák, P. The effect of public R&D subsidies on firms’ competitiveness: Regional and sectoral specifics in emerging innovation systems. Appl. Geogr. 2018, 94, 119–129. [Google Scholar]
- Fusillo, F.; Quatraro, F.; Usai, S. Going green: The dynamics of green technological alliances. Econ. Innov. New Tech. 2020, 31, 362–386. [Google Scholar] [CrossRef]
- Nie, L.; Gong, H.; Zhao, D.; Lai, X.; Chang, M. Heterogeneous knowledge spillover channels in universities and green technology innovation in local firms: Stimulating quantity or quality? Front. Psychol. 2022, 13, 943665. [Google Scholar] [CrossRef]
- Song, M.; Guo, L.; Shen, J. Exponential Random Graph Model Perspective: Formation and Evolution of a Collaborative Innovation Network in China’s New Energy Vehicle Industry. Systems 2024, 12, 423. [Google Scholar] [CrossRef]
- Liang, X.; Liu, A.M.M. The evolution of government sponsored collaboration network and its impact on innovation: A bibliometric analysis in the Chinese solar PV sector. Res. Policy 2018, 47, 1295–1308. [Google Scholar] [CrossRef]
- Freeman, C. Networks of innovators: A synthesis of research issues. Res. Policy 1991, 20, 499–514. [Google Scholar] [CrossRef]
- Crossan, M.M. The Knowledge-Creating Company: How Japanese Companies Create the Dynamics of Innovation; Oxford University Press: Oxford, UK, 1996. [Google Scholar]
- Dong, S.; Ren, G.; Xue, Y.; Liu, K. Urban green innovation’s spatial association networks in china and their mechanisms. Sustain. Cities Soc. 2024, 93, 104536. [Google Scholar] [CrossRef]
- Yang, G.; Cheng, S.; Qin, Y.; Gui, Q. Analysis of the spatial association network structure of China’s green innovation efficiency. J. Asia Pac. Econ. 2024, 1–27. [Google Scholar] [CrossRef]
- Hu, F.; Mou, S.; Wei, S.; Qiu, L.; Hu, H.; Zhou, H. Research on the evolution of China’s photovoltaic technology innovation network from the perspective of patents. Energy Strategy Rev. 2024, 51, 101309. [Google Scholar] [CrossRef]
- Boschma, R. Proximity and Innovation: A Critical Assessment. Reg. Stud. 2005, 39, 61–74. [Google Scholar] [CrossRef]
- Li, Y.; Qian, K.; Wang, Z.; Xu, A. The evolution of China’s wind power industry innovation network from the perspective of multidimensional proximity. Technol. Anal. Strateg. Manag. 2024, 1–15. [Google Scholar] [CrossRef]
- Lusher, D.; Koskinen, J.; Robins, G. Exponential Random Graph Models for Social Networks: Theory, Methods, and Applications; Cambridge University Press: Cambridge, UK, 2013. [Google Scholar]
- Kim, J.Y.; Howard, M.; Cox Pahnke, E.; Boeker, W. Understanding network formation in strategy research: Exponential random graph models. Strateg. Manag. J. 2016, 37, 22–44. [Google Scholar]
- Liu, J.; Wang, R.; Tian, Y.; Zhang, M. The driving mechanisms of industrial air pollution spatial correlation networks: A case study of 168 Chinese cities. J. Clean. Prod. 2024, 470, 143255. [Google Scholar] [CrossRef]
- Liu, C.; Sun, S.; Piao, J.; Mao, W. Unveiling the dynamics and determinants of world city network: Insights from global airline data. Cities 2025, 157, 105613. [Google Scholar]
- Zhang, W.; Chong, Z.; Li, X.; Nie, G. Spatial patterns and determinant factors of population flow networks in China: Analysis on Tencent Location Big Data. Cities 2020, 99, 102640. [Google Scholar] [CrossRef]
- Song, H. Uncovering the Structural Underpinnings of Political Discussion Networks: Evidence From an Exponential Random Graph Model. J. Commun. 2015, 65, 146–169. [Google Scholar] [CrossRef]
- Gulati, R.; Gargiulo, M. Where do interorganizational networks come from? Am. J. Sociol. 1999, 104, 1439–1493. [Google Scholar] [CrossRef]
- Provan, K.G.; Fish, A.; Sydow, J. Interorganizational networks at the network level: A review of the empirical literature on whole networks. J. Manag. 2007, 33, 479–516. [Google Scholar] [CrossRef]
- Kobarg, S.; Stumpf-Wollersheim, J.; Welpe, I.M. More is not always better: Effects of collaboration breadth and depth on radical and incremental innovation performance at the project level. Res. Policy 2019, 48, 1–10. [Google Scholar] [CrossRef]
- Robins, G.; Pattison, P.; Wang, P. Closure, connectivity and degree distributions: Exponential random graph (p*) models for directed social networks. Soc. Netw. 2009, 31, 105–117. [Google Scholar] [CrossRef]
- Cova, C.; De Noni, I.; Ganzaroli, A. Scale and Geographical Scope of Environmental Technology Collaboration. A Patent-Based Comparative Analysis. Sci. Reg. 2023, 24, 378–399. [Google Scholar]
- Capone, F.; Innocenti, N.; Oliva, S.; Lazzeretti, L. The role of network structure and complexity for green inventions. Reg. Stud. 2024, 59, 1–15. [Google Scholar] [CrossRef]
- Ter Wal, A.L.J. The dynamics of the inventor network in German biotechnology: Geographic proximity versus triadic closure. J. Econ. Geogr. 2014, 14, 589–620. [Google Scholar] [CrossRef]
- Wang, K.; Jiang, W. State ownership and green innovation in China: The contingent roles of environmental and organizational factors. J. Clean. Prod. 2021, 314, 128029. [Google Scholar] [CrossRef]
- Tao, A.; Wang, C.; Zhang, S.; Kuai, P. Does enterprise digital transformation contribute to green innovation? Micro-level evidence from China. J. Environ. Manag. 2024, 370, 122609. [Google Scholar] [CrossRef] [PubMed]
- Wang, L.; Jin, J.L.; Banister, D. Resources, state ownership and innovation capability: Evidence from Chinese automakers. Creat. Innov. Manag. 2019, 28, 203–217. [Google Scholar] [CrossRef]
- Zhou, K.Z.; Gao, G.Y.; Zhao, H. State ownership and firm innovation in China: An integrated view of institutional and efficiency logics. Adm. Sci. Q. 2017, 62, 375–404. [Google Scholar] [CrossRef]
- Peng, X.; Liu, Y. Behind eco-innovation: Managerial environmental awareness and external resource acquisition. J. Clean. Prod. 2016, 139, 347–360. [Google Scholar] [CrossRef]
- Fernandes, C.I.; Ferreira, J.J.J.R.; Management, D. Knowledge spillovers: Cooperation between universities and KIBS. RD Manag. 2013, 43, 461–472. [Google Scholar] [CrossRef]
- Belderbos, R.; Carree, M.; Lokshin, B. Cooperative R&D and firm performance. Res. Policy 2004, 33, 1477–1492. [Google Scholar]
- Ferreira, J.J.M.; Fernandes, C.I.; Raposo, M.L. The Effects of Location on Firm Innovation Capacity. J. Knowl. Econ. 2017, 8, 77–96. [Google Scholar] [CrossRef]
- Elisa, G.; Martin, B. The micro-determinants of meso-level learning and innovation: Evidence from a Chilean wine cluster. Res. Policy 2005, 34, 47–68. [Google Scholar]
- Bai, Y.; Wang, J.; Jiao, J. A framework for determining the impacts of a multiple relationship network on green innovation. Sustain. Prod. Consum. 2021, 27, 471–484. [Google Scholar] [CrossRef]
- Benedikt, B.; Schmidt, T.S.; Stephan, S.; Hoffmann, V.H. Internal or external spillovers—Which kind of knowledge is more likely to flow within or across technologies. Res. Policy 2016, 45, 27–41. [Google Scholar]
- Antony, P.; Stephanie, G. Supplier involvement in eco-innovation: The co-development of electric, hybrid and fuel cell technologies within the Japanese automotive industry. J. Clean. Prod. 2019, 210, 1216–1228. [Google Scholar]
- De Fuentes, C.; Dutrénit, G. Geographic proximity and university–industry interaction: The case of Mexico. J. Technol. Transf. 2016, 41, 329–348. [Google Scholar] [CrossRef]
- Fleming, L.; King, C., III; Juda, A.I. Small worlds and regional innovation. Organ. Sci. 2007, 18, 938–954. [Google Scholar] [CrossRef]
- Tan, Y.; Zhu, Z. The effect of ESG rating events on corporate green innovation in China: The mediating role of financial constraints and managers’ environmental awareness. Technol. Soc. 2022, 68, 101906. [Google Scholar] [CrossRef]
- Cheng, Q.; Du, F.; Wang, X.; Wang, Y. Seeing is believing: Analysts’ corporate site visits. Rev. Acc. Stud. 2016, 21, 1245–1286. [Google Scholar] [CrossRef]
- Cheng, Q.; Du, F.; Wang, B.Y.; Wang, X. Do corporate site visits impact stock prices? Contemp. Account. Res. 2019, 36, 359–388. [Google Scholar] [CrossRef]
- Gagliardi, L.; Iammarino, S. Innovation in risky markets: Ownership and location advantages in the UK regions. J. Econ. Geogr. 2018, 18, 1177–1201. [Google Scholar] [CrossRef]
- Petruzzelli, A.M. Balancing knowledge exploration and exploitation within and across technological and geographical domains. Knowl. Manag. Res. Pract. 2014, 12, 123–132. [Google Scholar] [CrossRef]
- Shi, L.; Wang, L. Understanding university-industry collaboration from the perspective of proximity: Insights from a case study in China. Technol. Anal. Strateg. Manag. 2024, 36, 4380–4392. [Google Scholar] [CrossRef]
- Horbach, J.; Oltra, V.; Belin, J. Determinants and specificities of eco-innovations compared to other innovations—An econometric analysis for the French and German industry based on the community innovation survey. Ind. Innov. 2013, 20, 523–543. [Google Scholar] [CrossRef]
- Ghisetti, C.; Pontoni, F. Investigating policy and R&D effects on environmental innovation: A meta-analysis. Ecol. Econ. 2015, 118, 57–66. [Google Scholar]
- Alpaydın, U.A.R.; Fitjar, R.D. Proximity across the distant worlds of university–industry collaborations. Pap. Reg. Sci. 2021, 100, 689–712. [Google Scholar] [CrossRef]
- Garcia Martinez, M.; Zouaghi, F.; Sánchez García, M. Geographical and cognitive proximity effects on innovation performance: Which types of proximity for which types of innovation? Eur. Manag. Rev. 2024, 22, 291–317. [Google Scholar] [CrossRef]
- Wu, A. Collaborative eco-innovation and green knowledge acquisition: The role of specific investments in Chinese new energy vehicle industry. Bus. Strategy Environ. 2023, 32, 2245–2260. [Google Scholar] [CrossRef]
- Balland, P.-A. Proximity and the evolution of collaboration networks: Evidence from research and development projects within the global navigation satellite system (GNSS) industry. Reg. Stud. 2012, 46, 741–756. [Google Scholar] [CrossRef]
- Yang, B.; Li, X.; Kou, K. Research on the influence of network embeddedness on innovation performance: Evidence from China’s listed firms. J. Innov. Knowl. 2022, 7, 100210. [Google Scholar]
- Fitjar, R.D.; Huber, F.; Rodríguez-Pose, A. Not too close, not too far: Testing the Goldilocks principle of ‘optimal’ distance in innovation networks. Ind. Innov. 2016, 23, 465–487. [Google Scholar] [CrossRef]
- Broekel, T.; Hartog, M. Explaining the structure of inter-organizational networks using exponential random graph models. Ind. Innov. 2013, 20, 277–295. [Google Scholar] [CrossRef]
- Ciobanu, G.; Ghinăraru, C.; Teodor, C. Eco-innovation and the development of new new opportunities on SMEs. Calitatea 2018, 19, 154–159. [Google Scholar]
- Melander, L.; Arvidsson, A. Green innovation networks: A research agenda. J. Clean. Prod. 2022, 357, 131926. [Google Scholar] [CrossRef]
- Wang, X.; Qiu, L.; Hu, F.; Hu, H. Characteristics and influencing factors of the industry-university-research collaborative innovation network in China’s new energy vehicle industry. Energy Strategy Rev. 2024, 55, 101505. [Google Scholar] [CrossRef]
- De Noni, I.; Ganzaroli, A.; Orsi, L. The impact of intra-and inter-regional knowledge collaboration and technological variety on the knowledge productivity of European regions. Technol. Forecast. Soc. Change 2017, 117, 108–118. [Google Scholar] [CrossRef]
- Jaffe, A.B. Demand and supply influences in R&D intensity and productivity growth. Rev. Econ. Stat. 1988, 70, 431–437. [Google Scholar]
- Losacker, S. ‘License to green’: Regional patent licensing networks and green technology diffusion in China. Technol. Forecast. Soc. Change 2022, 175, 121336. [Google Scholar] [CrossRef]
- Li, Y.; Zhu, Z.; Guan, Y.; Kang, Y. Research on the structural features and influence mechanism of the green ICT transnational cooperation network. Econ. Anal. Pol. 2022, 75, 734–749. [Google Scholar] [CrossRef]
- Hu, W.; Liu, Y.; Li, Y.; Chen, D. Work together, walk forward: Unveiling collaborative innovation networks and mapping paths to breakthrough innovation in electric vehicles. J. Clean. Prod. 2024, 480, 144077. [Google Scholar] [CrossRef]
- Li, F.; Liu, W.; Bi, K. Exploring and visualizing spatial-temporal evolution of patent collaboration networks: A case of China’s intelligent manufacturing equipment industry. Technol. Soc. 2021, 64, 101483. [Google Scholar] [CrossRef]
- Liu, W.; Song, Y.; Bi, K. Exploring the patent collaboration network of China’s wind energy industry: A study based on patent data from CNIPA. Renew. Sustain. Energy Rev. 2021, 144, 110989. [Google Scholar] [CrossRef]
- Granovetter, M. Economic action and social structure: The problem of embeddedness. Am. J. Sociol. 1985, 91, 481–510. [Google Scholar] [CrossRef]


Disclaimer/Publisher’s Note: The statements, opinions and data contained in all publications are solely those of the individual author(s) and contributor(s) and not of MDPI and/or the editor(s). MDPI and/or the editor(s) disclaim responsibility for any injury to people or property resulting from any ideas, methods, instructions or products referred to in the content. |
© 2025 by the authors. Licensee MDPI, Basel, Switzerland. This article is an open access article distributed under the terms and conditions of the Creative Commons Attribution (CC BY) license (https://creativecommons.org/licenses/by/4.0/).