Article

Evolution Trends, Spatial Differentiation, and Convergence Characteristics of Urban Ecological Economic Resilience in China

1
School of Applied Economics, Guizhou University of Finance and Economics, Guiyang 550025, China
2
Collaborative Innovation Center for Green Finance and Ecological Environmental Protection, Guiyang 550025, China
3
Provincial Innovation Team for High-Quality Development of Regional Economy, Guizhou University of Finance and Economics, Guiyang 550025, China
4
Laboratory of Artificial Intelligence and Digital Finance, Guiyang 550025, China
*
Author to whom correspondence should be addressed.
These authors contributed equally to this work.
Systems 2025, 13(8), 666; https://doi.org/10.3390/systems13080666
Submission received: 10 April 2025 / Revised: 12 July 2025 / Accepted: 27 July 2025 / Published: 6 August 2025

Abstract

Achieving a win-win situation for both economy and ecology is crucial for promoting sustainable social development and shaping new advantages in high-quality developments. This article constructs an ecological economic resilience (EER) analysis framework by integrating both ecological and economic dimensions from a resilience perspective. Based on panel data from 290 cities in China, it explores the dynamic evolution characteristics, regional differences, and convergence trends of EER. The findings indicate that the EER has weakened nationwide and in the four major economic regions, overall tending towards stability. Significant disparities exist in EER, particularly pronounced in the northeast. There is σ convergence in the nation as well as in the northeast and east regions. Additionally, both absolute and conditional β convergence is evident nationwide and in all regions, with conditional convergence occurring at a faster pace. The research findings in this paper provide solid theoretical support for promoting regional coordinated development and constructing a new development paradigm.

1. Introduction

Since the initiation of the reform and opening-up policy, China has witnessed an unprecedented and remarkably rapid urbanization wave compared to global history. Between 1978 and 2020, the per capita disposable income of residents increased by 187 times. By 2025, the urbanization rate of the permanent population in China has reached a new high of 67%, achieving significant enhancements in both socio-economic development and the standard of living for residents. However, this rapid development has also been accompanied by a series of challenges, particularly the irreversible damage to ecosystems in certain regions due to improper development strategies. Therefore, the concept of “lucid waters and lush mountains are invaluable assets” becomes particularly significant. It profoundly reveals the intrinsic relationship between ecology and economy, emphasizing that the ecosystem itself is a form of economic resource and that protecting the ecological environment is developing productive forces. A good life not only relies on the sustained prosperity of the social economy but is also deeply rooted in a favorable ecological environment. Currently, China is confronted with multiple challenges, including increasingly strained resources, a fragile ecological environment, and the arduous task of transitioning towards green and low-carbon development. Notably, there is a lag in the construction of ecological infrastructure and insufficient intrinsic motivation for the comprehensive green transformation of economic and social development. These issues have emerged as significant bottlenecks hindering the sustainable development of the ecological economy. As China rapidly transforms its economy and society, advancing towards a new era characterized by greening, decarbonization, and high-quality development, urban development is in urgent need. It requires a profound understanding and adherence to the universal principles governing natural laws and the sustainable development of the economy and society. The National New-Type Urbanization Plan (2021–2035) points out that enhancing the ecological system services and self-maintenance capabilities of cities is a key measure to strengthen urban resilience and improve the quality of new urbanization. Given the increasingly prominent risk challenges faced by cities, constructing resilient urban systems necessitates a focus on the synergistic integration of ecological environment and economic development. This approach aims to enhance the resilience of ecological economies (EER), thereby improving the city’s capacity to withstand, adapt to, and recover from risks (Holling). To address this issue, the city, as a complex composite system, faces the core challenge of effectively countering urban risk shocks, flexibly adjusting adaptation strategies, and swiftly restoring normalcy. This challenge has become pivotal in breaking through current development bottlenecks and driving high-quality development, positioning itself at the forefront of contemporary research on urban resilience construction.
The concept of “resilience” can be traced back to the field of physics, and has subsequently been extended to multiple disciplines including psychology [1,2], ecology [3], and economics [4]. It is generally regarded as the comprehensive capability of a regional system or entity to resist, recover, adapt, and continuously renew itself in the face of various internal and external shocks and challenges [5,6]. In the study of urban resilience, the conceptual delineation presents a multifaceted perspective. Some research views urban resilience as a novel urban development and governance agenda, propelled by a top-down network of multi-sectoral actors, culminating in a global urban resilience complex [7]. Other studies define urban resilience by delineating its components across five dimensions—economic, social, environmental, natural, and governance—and their nine associated resilience capacities [8]. Alternatively, resilience assessment models are constructed based on four aspects, resistance, recovery, adaptation, and transformation, incorporating natural, economic, social, physical, and institutional dimensions [9]. These studies also recognize a gradual upward trend in the resilience indices of cities in Hebei Province [10]. Resilience studies conducted at the urban core unit level have yielded numerous beneficial explorations across the two dimensions of ecology and economy. For instance, it has investigated the spatiotemporal distribution characteristics of maximum ecological resilience [11] and the spatiotemporal evolution of urban economic resilience [4]. Additionally, it has examined the trends in economic resilience in response to extreme events such as hydro-meteorological disasters [12], seismic shocks [13], and viral outbreaks [14]. Despite the lack of a universal consensus on evaluation indicators and measurement methods within the field of resilience research, the academic community has made numerous fruitful explorations and attempts. For instance, Liang et al. (2023) constructed a comprehensive evaluation system for ecological space resilience based on the three fundamental characteristics of “resistance, adaptability, and recoverability” [6]. Yuan et al. (2023) conducted a quantitative analysis of the ecological economy in the Beijing–Tianjin–Hebei region, pointing out an upward trend in its resilience [15]. Scholars have also established regional ecological economic development evaluation indicator systems from four aspects, structure, function, ecological efficiency, and sustainable development [16], and widely applied various methods to empirically analyze economic resilience theories, such as data envelopment analysis, exploratory spatial data analysis [17], K-means [18], typical impact factor analysis, TOPSIS model [19], and coupling coordination model [20]. Simultaneously, the introduction of the entropy method, spatial econometrics [18], comprehensive evaluation method [21], and sensitivity algorithms [6] has provided robust support for studies on ecological resilience. The deepening of resilience research has led to a shift in related literature, moving beyond the confines of single-dimensional perspectives such as ecological or economic resilience. Instead, there is an increasing emphasis on interdisciplinary integration frameworks that focus on the holistic resilience of natural, social, and economic systems. This approach underscores the importance of balancing short-term well-being with long-term sustainable development. Certain scholars have shown particular interest in the significant variations and distinct characteristics of ecological economics across different regions, influenced by factors such as natural environment and economic conditions. They have conducted in-depth analyses using case studies of typical regions such as the Huai River Basin [17] and wetland areas within the Three Gorges Basin [22]. From a sustainable perspective, these scholars have also made valuable explorations by incorporating domains such as the digital economy [15] and tourism development [23] into the scope of ecological economics. Certain scholars have demonstrated a heightened level of interest in global socio-ecological systems, delving not only into the coupling and coordination of ecological economic systems [23,24] but also exploring the resilience and sustainability of socio-ecological systems in arid urban areas of northwest China, coastal Fujian, as well as coastal cities in Brazil and the Baja California region of Mexico. These explorations have provided theoretical support for enhancing the resilience of socio-ecological systems, examining aspects such as governance optimization, spatial disparities in landscape resilience, and system dependency [11,25,26]. Zeng et al. have emphasized that resilience and sustainability focus on the system’s progression towards an ideal developmental trajectory [27], with particular attention paid to whether there is a convergence in the resilience development trends of socio-ecological systems. Scholars have identified significant convergence in the socio-economic dynamics of Indonesia [28] and have also observed spatial convergence patterns in both urban economic and ecological resilience in Chinese cities [21,29].
Although research on the resilience of social-ecological systems has yielded certain results, it remains in its nascent stage. A review of the international academic community reveals that few scholars have integrated economic and ecological considerations, conducting cross-regional comparative analyses to elucidate the dynamic evolution, spatial disparities, and convergence trends of EER. EER serves as a critical metric for assessing the sustainable development capabilities of a nation or region. Leveraging the resilience advantages of ecological economics is essential for driving green and low-carbon transitions and achieving high-quality economic development. It is also pivotal for the rational utilization of natural resources, the protection of the ecological environment, and the smooth operation of economic activities. Moreover, China’s overall regional economic development strategy has entered a new phase of comprehensive advancement. The Proposal on Formulating the 14th Five-Year Plan for National Economic and Social Development and the Long-Range Objectives Through the Year 2035 of China clearly repositions the development of the western region, the revitalization of northeast China, the rise in central China, and the modernization of the eastern region, accelerating the formation of a new pattern of coordinated development among the four major economic regions. To achieve the goal of coordinated development between the national economy and ecological environmental protection, it is urgently necessary to understand the trends in the EER of these four regions, enhance the EER of cities, and strengthen regional resistance and recovery capabilities [30], which is of great significance for promoting sustainable regional development.
Based on the existing academic foundation, the innovative value of this paper is manifested in the following: (1) introducing a novel analytical framework—EER, which integrates both ecological and economic resilience dimensions, constructing a more systematic indicator system for EER based on the three core characteristics of “resistance, adaptability, and recovery.” (2) In terms of research content, based on the classification standards of China’s four major economic regions, the overall evolutionary trends and specific developmental disparities of EER in different regions were thoroughly studied, elucidating the differences and complexities of EER under various geographical contexts. (3) Convergence empirical analysis. The convergence characteristics of EER across the four major economic regions were analyzed using σ convergence, absolute β convergence, and conditional β convergence. The research approach involves measuring the level of EER in 290 prefecture-level cities in mainland China, employing kernel density estimation, the Dagum Gini coefficient, and spatial convergence models to analyze the dynamic evolution, regional disparities, and convergence trends of these cities and the four major economic regions from 2006 to 2023 in terms of EER. This study holds profound significance for enhancing cities’ capacity to withstand systemic risks and maintaining the environmental foundation necessary for socio-economic activities.
The remainder of this paper is structured as follows: Section 2 elaborates on the research design and methodology; Section 3 presents the empirical analysis results; Section 4 conducts a discussion; and Section 5 summarizes the main conclusions and proposes policy recommendations.

2. Research Design and Methodology

2.1. Evaluation Model for Ecological Economic Resilience

Presently, a unified evaluation model for EER has not yet been established; however, extant research has demonstrated a multidimensional exploration of urban EER. For instance, scholars such as Zhai et al. have transcended the traditional limitations of resilience studies focusing solely on either economic or ecological dimensions [31]. They have integrated institutional, cultural, and historical socio-economic elements into the conceptual framework of marine economic resilience. By constructing an evaluation system from the sub-dimensions of “resistance capability, adaptability, and evolutionary capacity,” they offer a novel perspective on understanding the complex dynamic mechanisms of marine economic resilience. In terms of research methodology, this study innovatively integrates remote sensing, text analysis, web crawling, and other emerging technologies to acquire primary data. This not only broadens the sources of marine economic data but also offers novel approaches to addressing the issues of lag and singularity inherent in traditional statistical data, significantly enhancing the timeliness and precision of research findings. Scholars such as Liang et al. have introduced the theory of evolutionary resilience into the optimization of Baiyangdian’s ecological space [6], breaking through the limitations of static resilience analysis in traditional ecological planning. They emphasize that ecological space resilience possesses three fundamental characteristics, resistance, adaptability, and recoverability, and provide quantitative measurements thereof, offering a quantified basis for related studies. As a crucial ecological barrier in north China, Baiyangdian faces multiple pressures including urban expansion and water resource scarcity. The application of resilience theory to the optimization of its ecological space provides significant theoretical references and practical guidance for the dynamic ecological governance of similar watersheds. Another study [26] has established an evaluation index system for regional eco-economic development, utilizing emergy analysis to assess the sustainable development of eco-economy in Anhui Province. The introduction of emergy analysis into regional eco-economic evaluation aligns with the academic forefront of sustainable development, offering an innovative ecological perspective as a complementary tool to traditional economic indicator analysis. However, the existing index evaluation systems still exhibit certain limitations. For example, at the data level, while new technologies have enriched the dimensions of research with abundant data, the quantification of factors such as culture and institutions may still be subject to subjectivity, necessitating further validation of their measurement validity. Additionally, the sufficiency of regional representativeness of primary data, as well as their generalizability across regions at varying development levels, remains a subject for further exploration. In terms of the comprehensiveness of indicators, the existing quantitative systems inadequately account for the complexity among human activities, economic development, and ecosystems, indicating a need for further optimization in indicator design. At the regional research scale, current studies predominantly focus on specific provinces or watersheds, lacking cross-regional comparisons or causal relationship validation. The theoretical applicability of these studies across varying spatial and temporal scales remains insufficient, necessitating more case studies and theoretical expansion for support.
In terms of indicator evaluation, the ecological environment resilience assessment system constructed by [30] only revolves around three dimensions, environmental pollutant generation, environmental pollution control, and ecological environment protection, which presents an issue of incomplete coverage. Although scholars such as Li and Wang and Zhai et al. have comprehensively characterized the resistance of ecological or economic resilience using indicators such as GDP, population density, and industrial pollutant emissions, measured adaptability with metrics like traffic accessibility and solid waste treatment rates, and reflected evolutionary recovery capabilities through regional innovation indices and per capita resource amounts, thereby constructing a relatively comprehensive evaluation system [16,21], a flaw exists in the ambiguity between lower-level indicators and upper-level logical categorizations. To address this, the study constructs an urban EER assessment model, encompassing three dimensions, resistance, adaptability, and recovery, incorporating 8 core indicators and 25 foundational indicators (see Table 1). Resistance capacity is measured from both social development and pollution emissions perspectives, ensuring regional development stability and pollution prevention. Adaptability is composed of economic intensity, environmental quality, environmental protection investment, and governance efficiency, emphasizing the economic and environmental adaptability to risks. Recovery capacity focuses on ecological restoration and innovation-driven development, providing environmental and technological support for urban recovery. Finally, the entropy method is employed to measure the EER of 290 cities and 4 major economic regions (northeast, eastern, central, western) (Among them, the eastern region includes 10 provinces: Beijing, Tianjin, Hebei, Shandong, Jiangsu, Zhejiang, Shanghai, Fujian, Guangdong, and Hainan; the central region includes 6 provinces: Shanxi, Anhui, Jiangxi, Henan, Hubei, and Hunan; the western region includes 12 provinces: Inner Mongolia, Guangxi, Chongqing, Sichuan, Guizhou, Yunnan, Tibet, Shaanxi, Gansu, Qinghai, Ningxia, and Xinjiang; and the northeastern region includes 3 provinces: Liaoning, Jilin, and Heilongjiang.) Data was sourced from China Urban Statistical Yearbook and China Urban Construction Database, with severely incomplete cities excluded through data cleaning, and individual missing values filled using interpolation methods. The sample spans from 2006 to 2023.

2.2. Research Methodology

Using the above-constructed EER evaluation system, the development of EER is analyzed through methods such as kernel density estimation, the Gini coefficient, and convergence tests. Based on the dynamic evolution, regional differences, and convergence trends, corresponding policy recommendations are proposed. The framework process is illustrated in Figure 1.

2.2.1. Kernel Density Estimation

The kernel density estimation, proposed by Rosenblatt and Emanuel Parzen, is a significant non-parametric test method used to depict the strength of EER through density curves [32]. The height and width of the curve’s peaks reveal the degree of clustering in EER. The number of peaks visually demonstrates the level of polarization. The distribution extensibility of the curve describes the distance between the cities with the strongest or weakest EER and other cities. The more severe the curve tailing, the higher the degree of non-equilibrium within the region. By longitudinally comparing the multi-period kernel density curves of the same region, one can identify the dynamic evolution of the region’s EER. By horizontally comparing the kernel density curve shapes of multiple regions, one can capture the differences in the trajectory of EER changes among different regions. The formula is as follows:
f y = 1 N h i = 1 N K Y i y h
where N represents the number of cities observed, Y i denotes the EER of the i-th city per year, y is the mean of EER, K stands for the kernel density function, and h represents the bandwidth. The Silverman rule is used to calculate the bandwidth of the kernel density curve for the corresponding region. Typically, the choice of different kernel density functions generally has little impact on estimation results, so this article selects the most common Gaussian kernel function for estimation.

2.2.2. Dagum Gini Coefficient

Traditional indicators such as the Theil Index and classical Gini coefficient strictly require non-overlapping groups, making it difficult to decompose them into indices with economic significance. Therefore, this article, based on Dagum’s proposed Gini coefficient, decomposes the overall difference in the sample into intra-regional differences, inter-regional differences, and superimposed densities [33], to reveal the degree and sources of regional disparities in EER at the city level in China. Dagum’s Gini coefficient can be expressed as Equation (2), where G represents the overall Gini coefficient, y j i ( y h r ) denotes the EER intensity of any city i ( r ) in region j ( h ) , n is the total number of cities, k is the number of regional divisions, and n j ( n h ) is the number of cities within region j ( h ) .
Rank regions are based on the mean of their EER, denoted by Y ¯ h Y ¯ j Y ¯ k and Y ¯ . Equations (3) and (4) represent the Gini coefficient G j j for region j and the contribution G w of within-region differences, respectively. Equations (5) and (6) denote the inter-regional Gini coefficient G j h between regions j and h, and the contribution G n b of the net super-variable gap between regions. Equation (7) represents the contribution G t of super-variable density, with the relationship among the three satisfying G = G w + G n b + G t where p j = n j / n , s j = n j / n j . D j h and D j h represents the relative impact on EER between regions j and h. The equations are as follows:
G = j = 1 k h = 1 k i = 1 n j r = 1 n h | y j i y h r | 2 n 2 Y ¯
G j j = 1 2 Y ¯ j i = 1 n j i = 1 n j | y j i y h r | n j 2
G w = j = 1 k G j j p j s j
G j h = i = 1 n j r = 1 n h | y j i y h r | n j n h ( Y ¯ j + Y ¯ h )
G n b = j = 2 k h = 1 j 1 G j h ( p j s h + p h s j ) D j h
G t = j = 2 k h = 1 j 1 G j h ( p j s h + p h s j ) ( 1 D j h )

2.2.3. Spatial Autocorrelation Test

(1) Global Moran’s I Test. The Moran’s Index was employed to test whether the spatial distribution of EER exhibits spatial autocorrelation, i.e., whether there is clustering of high or low values [34]. The specific formula is as follows:
I = n j = 1 n W i j ( x i x ¯ ) ( x j x ¯ ) i = 1 n j = 1 n W i j i = 1 n ( x i x ¯ ) 2
where x i and x j represent the EER indices of city i and j, respectively, W i j is the spatial weight matrix, and x ¯ is the mean of the EER indices for all cities in the specific region. The Moran’s Index (I) is constrained within the range [−1, 1]. When I > 0, it indicates a positive correlation in the EER among cities within the region; the larger the value of I, the more consistent the distribution of EER among cities. Conversely, if I < 0, it reveals a negative correlation in the EER among cities, and the larger the absolute value of I then the more significant the variability in EER among cities, suggesting a more dispersed spatial distribution. If I approaches 0, there is no significant correlation.
(2) Local Moran’s I Test. Relying solely on the global Moran’s I for analysis may lead to biases due to local variations in regions. To accurately capture regional spatial heterogeneity, local Moran’s I is added for further analysis [35]. The formula is as follows:
I i = ( x i x ¯ ) S 2 j i ω i j ( x i x ¯ )
where when I i > 0 it indicates that observations exhibit clustering phenomena spatially, forming “H-H clusters” or “L-L clusters”, reflecting the spatial agglomeration trend of cities with similar EER; and when I i < 0, it results in a “L-H” or “H-L” staggered distribution pattern, highlighting significant differences in EER among cities.

2.2.4. Convergence Test

The reduction in economic development disparities among different regions is referred to as economic growth convergence [36]. Significant progress has been made in convergence-related research on issues such as the carbon emission intensity in agriculture [37], total factor energy efficiency [38], and global per capita greenhouse gas emissions [39]. The EER of different regions may face pressure due to environmental degradation or may be enhanced with technological advancements. Therefore, employing convergence models to study the long-term evolution of EER in Chinese cities and the four major economic regions is highly aligned with the research focus. This study employs σ convergence and β convergence for analysis.
(1) σ convergence. Here, σ convergence refers to the decreasing trend of the dispersion in EER across regions over time. This study employs the σ coefficient to measure the σ convergence of EER. If the σ coefficient decreases over time, it indicates the existence of σ convergence in EER [40]. Specifically, as shown in Equation (10):
σ = i = 1 N j ( E E R i j E E R ¯ i j ) 2 / N j E E R ¯ i j
where E E R i j represents the EER of city i within region j, E E R ¯ i j represents the EER within region j, and N j represents the number of cities within region j.
(2) β Convergence. β convergence refers to the phenomenon where regions with weaker EER significantly reduce the gap with regions with stronger EER over time, eventually reaching the same steady-state level [41]. β convergence can be divided into absolute β convergence and conditional β convergence. Absolute β convergence implies that there is a tendency for convergence in EER across regions without considering various factors that significantly influence it. The absolute β convergence model is as follows:
ln ( E E R i , t + 1 E E R i t ) = α + β ln ( E E R i t ) + μ i + η t + ε i t
where E E R i , t + 1 represents the EER of the i-th city in the t + 1 period, E E R i t represents the EER of the i-th city in the t period, and ln ( E E R i , t + 1 E E R i t ) represents the growth rate of the EER of the i-th city in the t + 1 period. If the convergence coefficient β is negative, it indicates a convergence trend in the EER of the region; conversely, it indicates divergence, with the convergence speed denoted as ν = − ln ( 1 β ) /T. μ i , η t , and ε i t represent regional effects, temporal effects, and random disturbance terms, respectively.
Given the potential spatial correlation in EER, relevant spatial econometric models are introduced, and the spatial absolute beta convergence model is as follows:
ln ( E E R i , t + 1 E E R i t ) = α + β ln ( E E R i t ) + ρ j = 1 n ω i j ln ( E E R i , t + 1 E E R i t ) + μ i + η t + ε i t ( S A R )
ln ( E E R i , t + 1 E E R i t ) = α + β ln ( E E R i t ) + μ i + η t + ε i t , ε i t = λ j = 1 n ω i j ε i t + δ i t ( S E M )
ln ( E E R i , t + 1 E E R i t ) + β ln ( E E R i t ) + ρ j = 1 n ω i j ln ( E E R i , t + 1 E E R i t ) + γ ω i j ln ( E E R i t ) + μ i + η t + ε i t ( S D M )
where ρ represents the spatial lag coefficient, indicating the influence of the growth rate of EER in neighboring cities on the local city; λ is the spatial error coefficient, representing the spatial effect present in the random disturbance term; and γ is the spatial lag coefficient of the independent variable. After adding control variables ( δ X i , t + 1 ) to the right-hand side of the absolute β convergence model, it becomes a conditional β convergence model. Drawing from the studies of [42,43], the following five control variables are selected: Economic Development Level (LED), measured by the per capita regional gross product; Industrial Structure (IS), represented by the ratio of the secondary industry’s output to the gross domestic product; Urban Conservation Effort (UCE), measured by urban environmental sanitation expenditures; Urban Water Supply Scale (UWSS), indicated by the total urban water supply; and Information Technology Employment Rate (ITER), characterized by the proportion of employees in the information transmission, computer services, and software industry among the total employment. The VIF (Variance Inflation Factor) of the selected variables is significantly less than 7.5, indicating no redundant variables and all passing the multicollinearity test. Comprehensive construction of economic distance matrix and adjacency matrix is performed for testing, ultimately selecting the adjacency matrix as the spatial weight matrix for research [44].

3. Empirical Results Analysis

3.1. Analysis of the Evolutionary Patterns of Ecological Economic Resilience

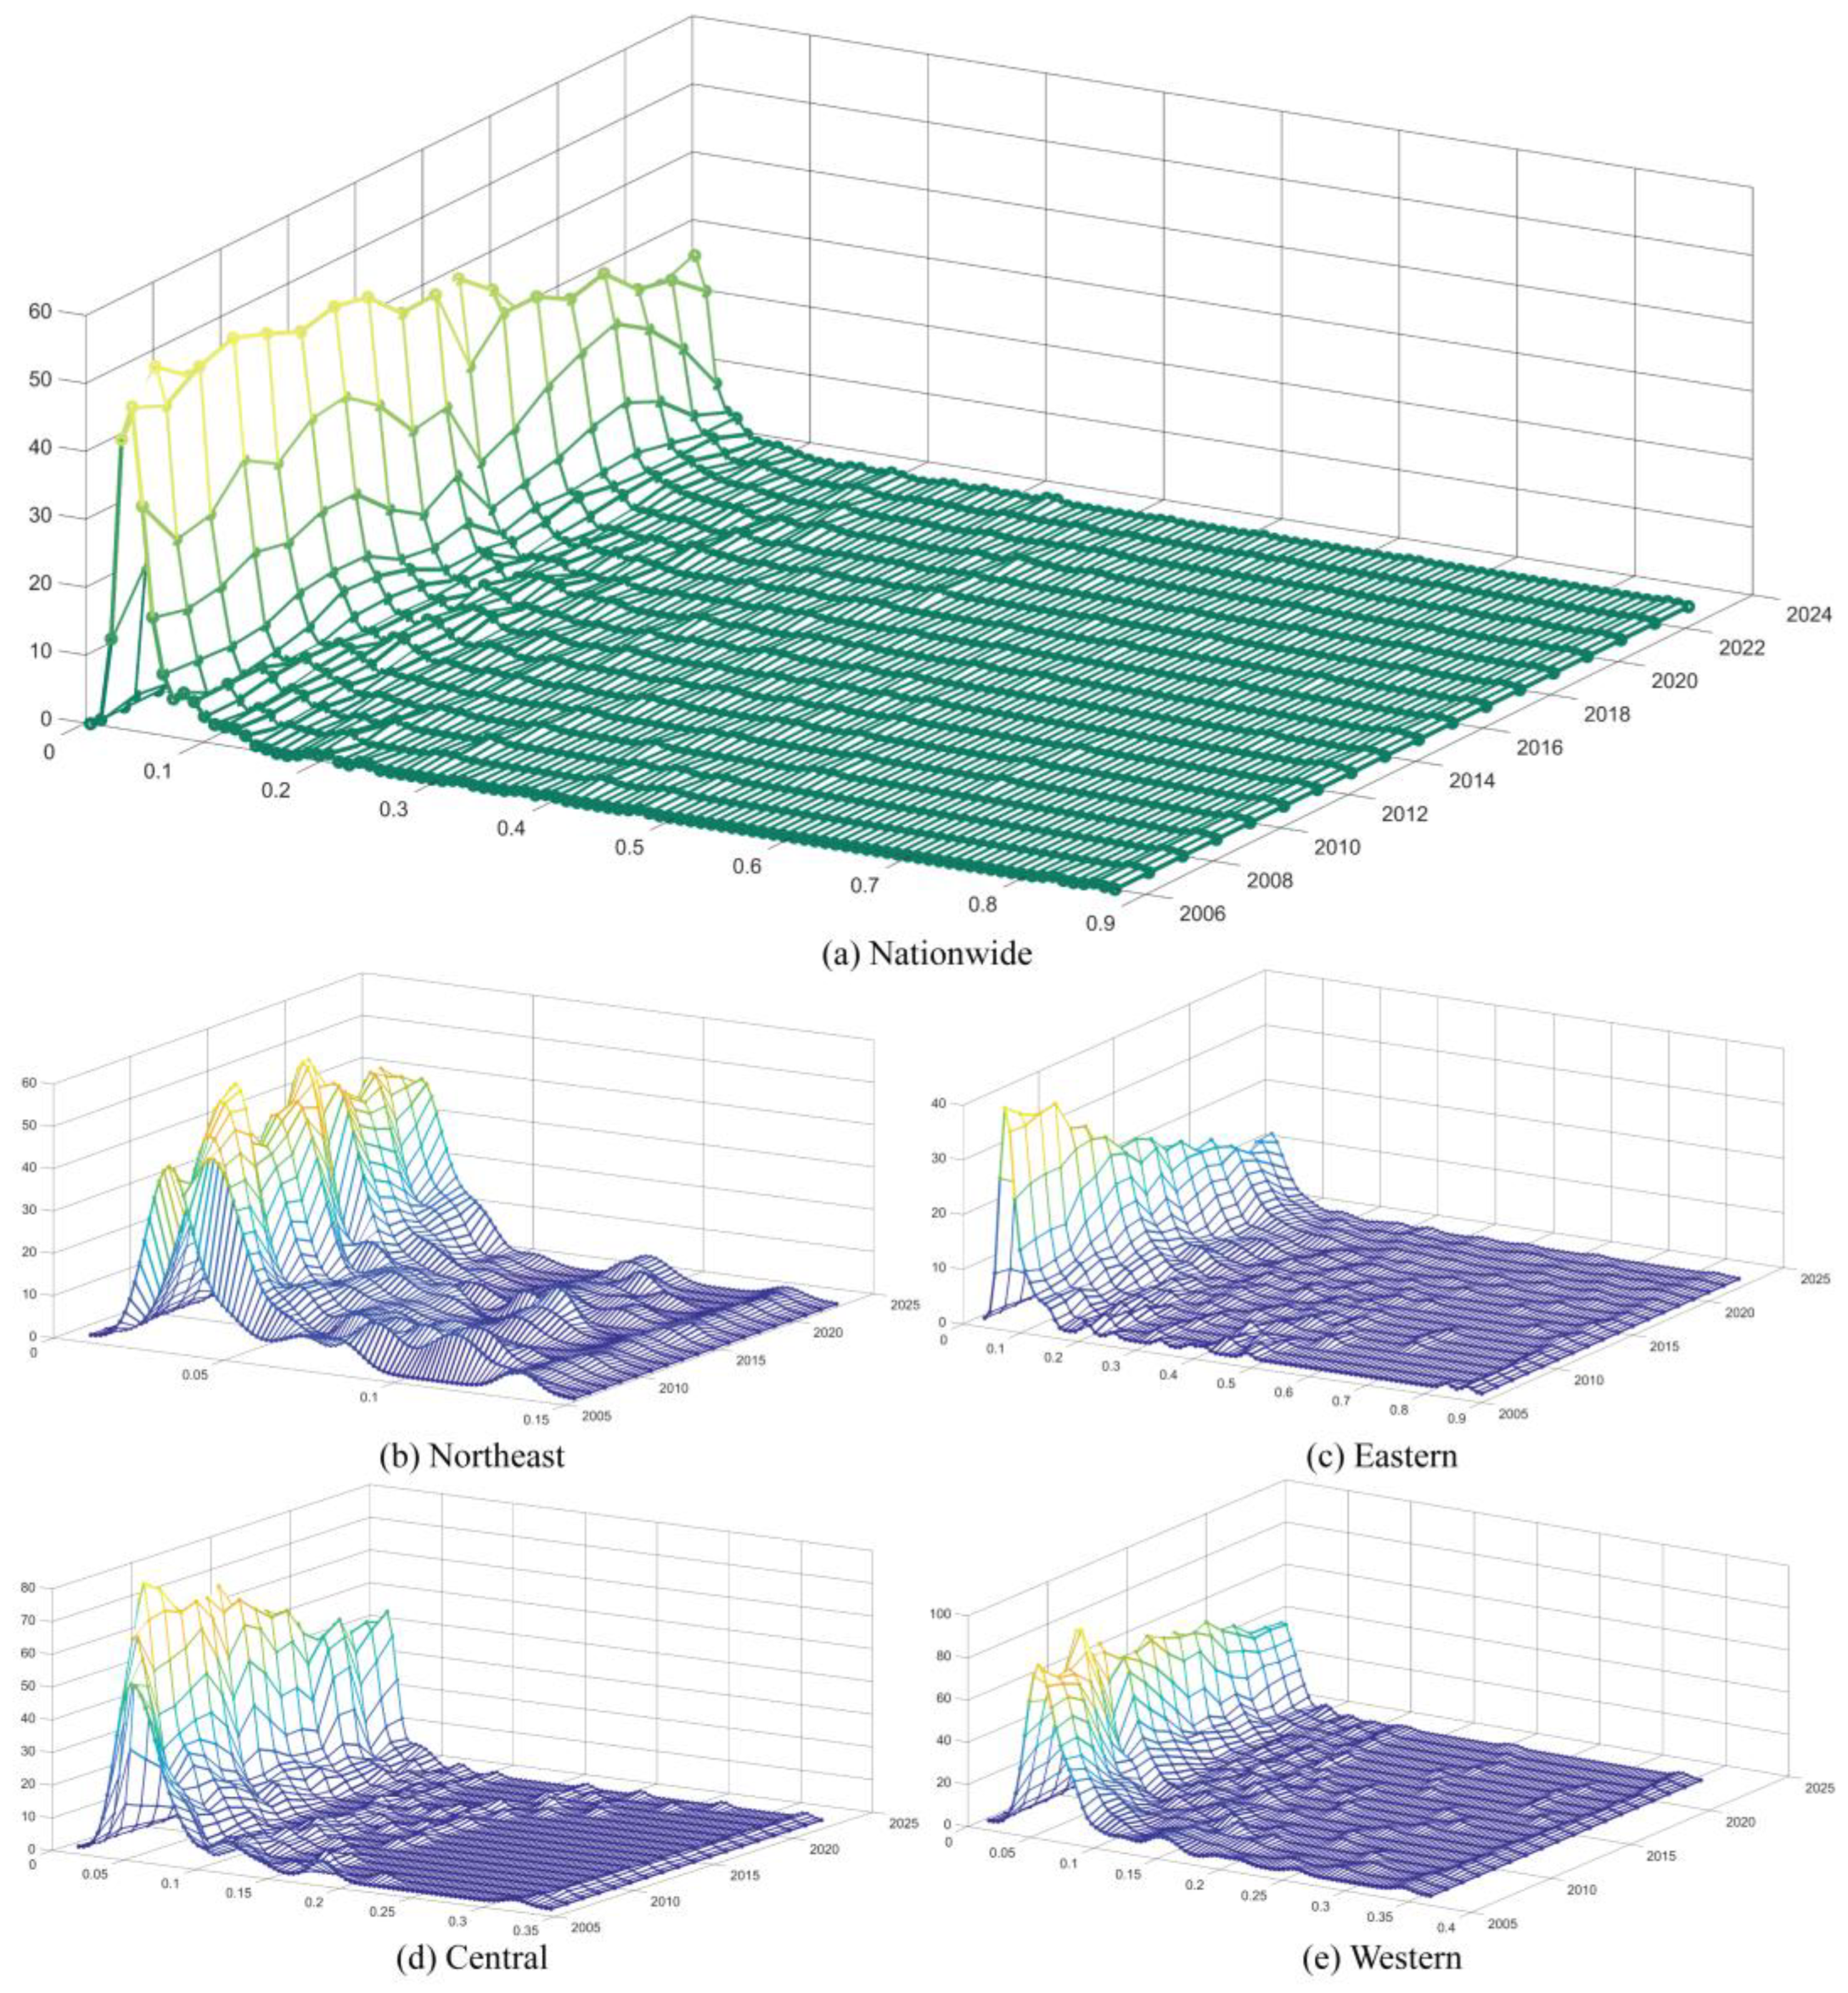
To describe the dynamic evolution of EER, kernel density estimation is employed to depict the density curve distribution characteristics of EER across the nation and four major economic regions, with a focus on attributes such as the distribution location of the kernel density curves, the main peak distribution pattern, the distribution extensiveness, and the number of peaks, as shown in Figure 2. The national bandwidth is 0.0032, while the bandwidths for the northeast, eastern, central, and western regions are 0.0066, 0.0009, 0.0034, and 0.0030, respectively.
Distribution location. The kernel density curve of national EER exhibits a leftward shift, indicating that the EER of most cities is on a downward trajectory. From the implementation of the 11th Five-Year Plan to 2023, rapid industrialization and urbanization, accompanied by swift economic growth, have led to excessive resource consumption and intensified environmental pollution due to traditional high energy-consuming and high-polluting production methods. Additionally, some local governments, in their pursuit of economic growth, have not fully implemented the concept of green development, giving insufficient attention to environmental protection, which further weakens EER. The kernel density curves of the four economic regions also show varying degrees of leftward shift, with the northeast region demonstrating the least significant shift. Overall, this indicates that China faces significant challenges in advancing towards green and sustainable development, with considerable difficulties still existing in the formulation and implementation of environmental protection policies.
Distribution pattern. The height of the principal peak in the national nuclear density curve has decreased while its width remains largely unchanged, indicating that the dispersion level of urban EER is stabilizing. The distribution curves for the eastern, central, and western regions exhibit a significant decline in height and a reduction in width, indicating a gradual narrowing of the absolute disparities in EER among cities within these regions. This phenomenon signifies an enhancement in the internal balance of eco-economic systems across these areas. The primary peak of the kernel density curve in the northeast has risen in height and expanded in width, indicating an overall positive trend in the development of its ecological economy.
Distributive extensibility. The distribution curves of EER across the nation and the four major economic regions all exhibit significant right-skewness, indicating that within each region some cities have notably higher resilience strengths compared to others. The kernel density distribution curves for the nation, as well as the eastern, central, and western regions, show significant stretching and convergence characteristics. These characteristics reflect a decreasing likelihood of extreme value fluctuations in these areas. And this suggests a growing stability in EER. Within the northeastern region, core cities such as Shenyang, Changchun, Harbin, and Dalian, leveraging their advantages in politics, economy, and transportation, have formed irreplaceable agglomeration effects. These cities exert a siphoning effect on surrounding areas, enabling them to maintain a consistently high level of resilience. In contrast, the majority of cities experience slow improvements in resilience, making it difficult to close the gap with the core cities. This disparity results in a weaker extensibility and convergence of the regional resilience curve.
Number of peaks. The national, northeast, and western regions exhibit bimodal nuclear density curves, indicating a pronounced polarization in EER. Notably, the distance between the two peaks is larger in the northeast region, suggesting significant spatial polarization within this area. In contrast, the eastern and central regions display unimodal characteristics with gradually decreasing peak values. This suggests that although unimodal characteristics remain prominent in these regions, strategies such as the “Coordinated Development of Beijing–Tianjin–Hebei,” “Integration of the Yangtze River Delta,” and the “Rise of Central China” have been instrumental in enhancing coordinated development between central cities and their surroundings. Consequently, the EER among cities is becoming more concentrated, with decreasing differentiation and an emerging trend toward convergence equilibrium.

3.2. Spatial Variation Analysis of Ecological Economic Resilience

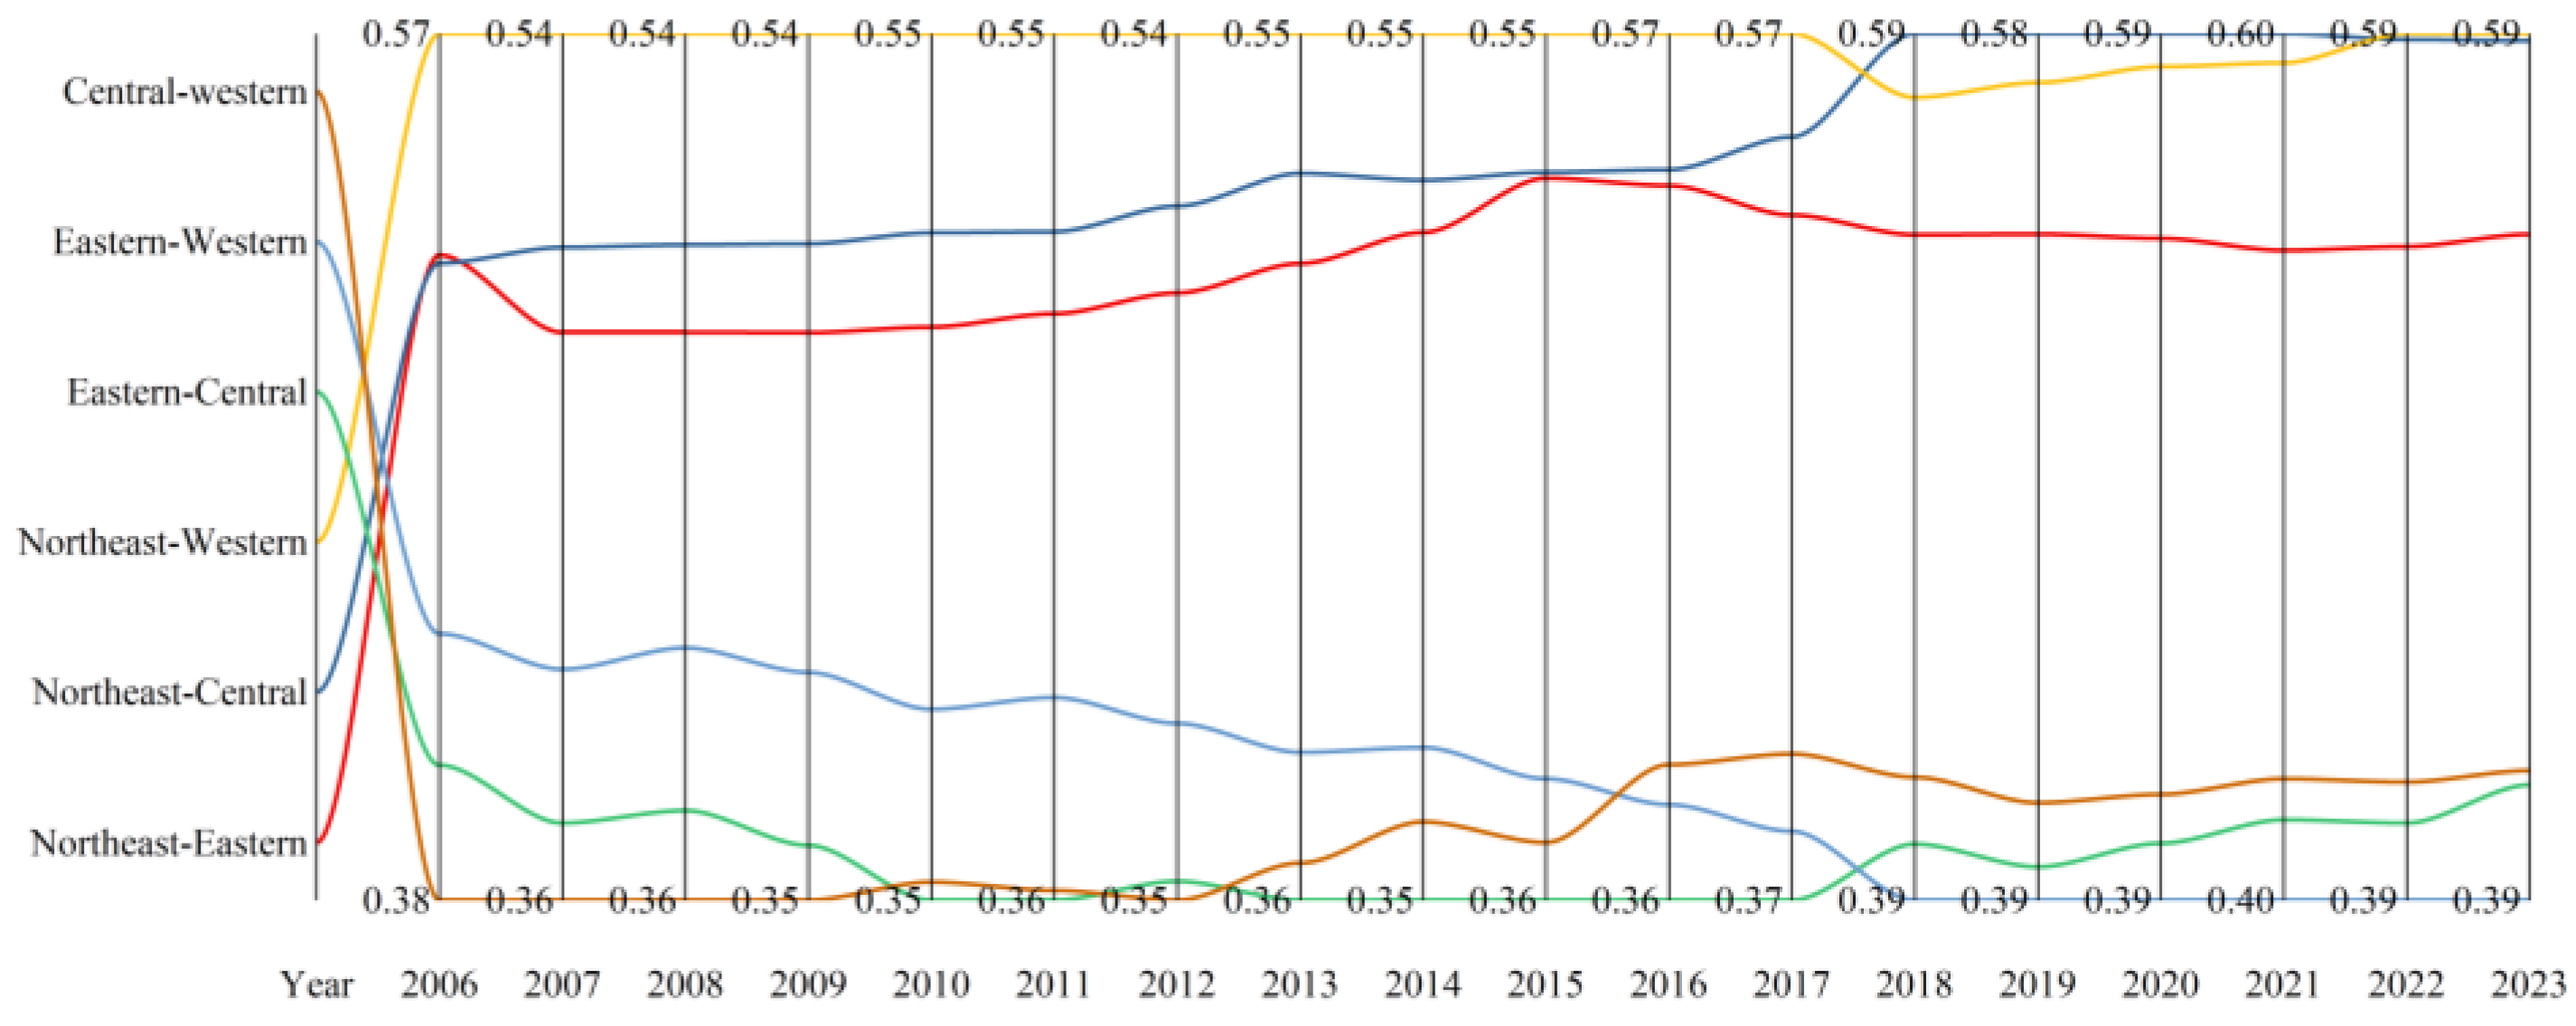
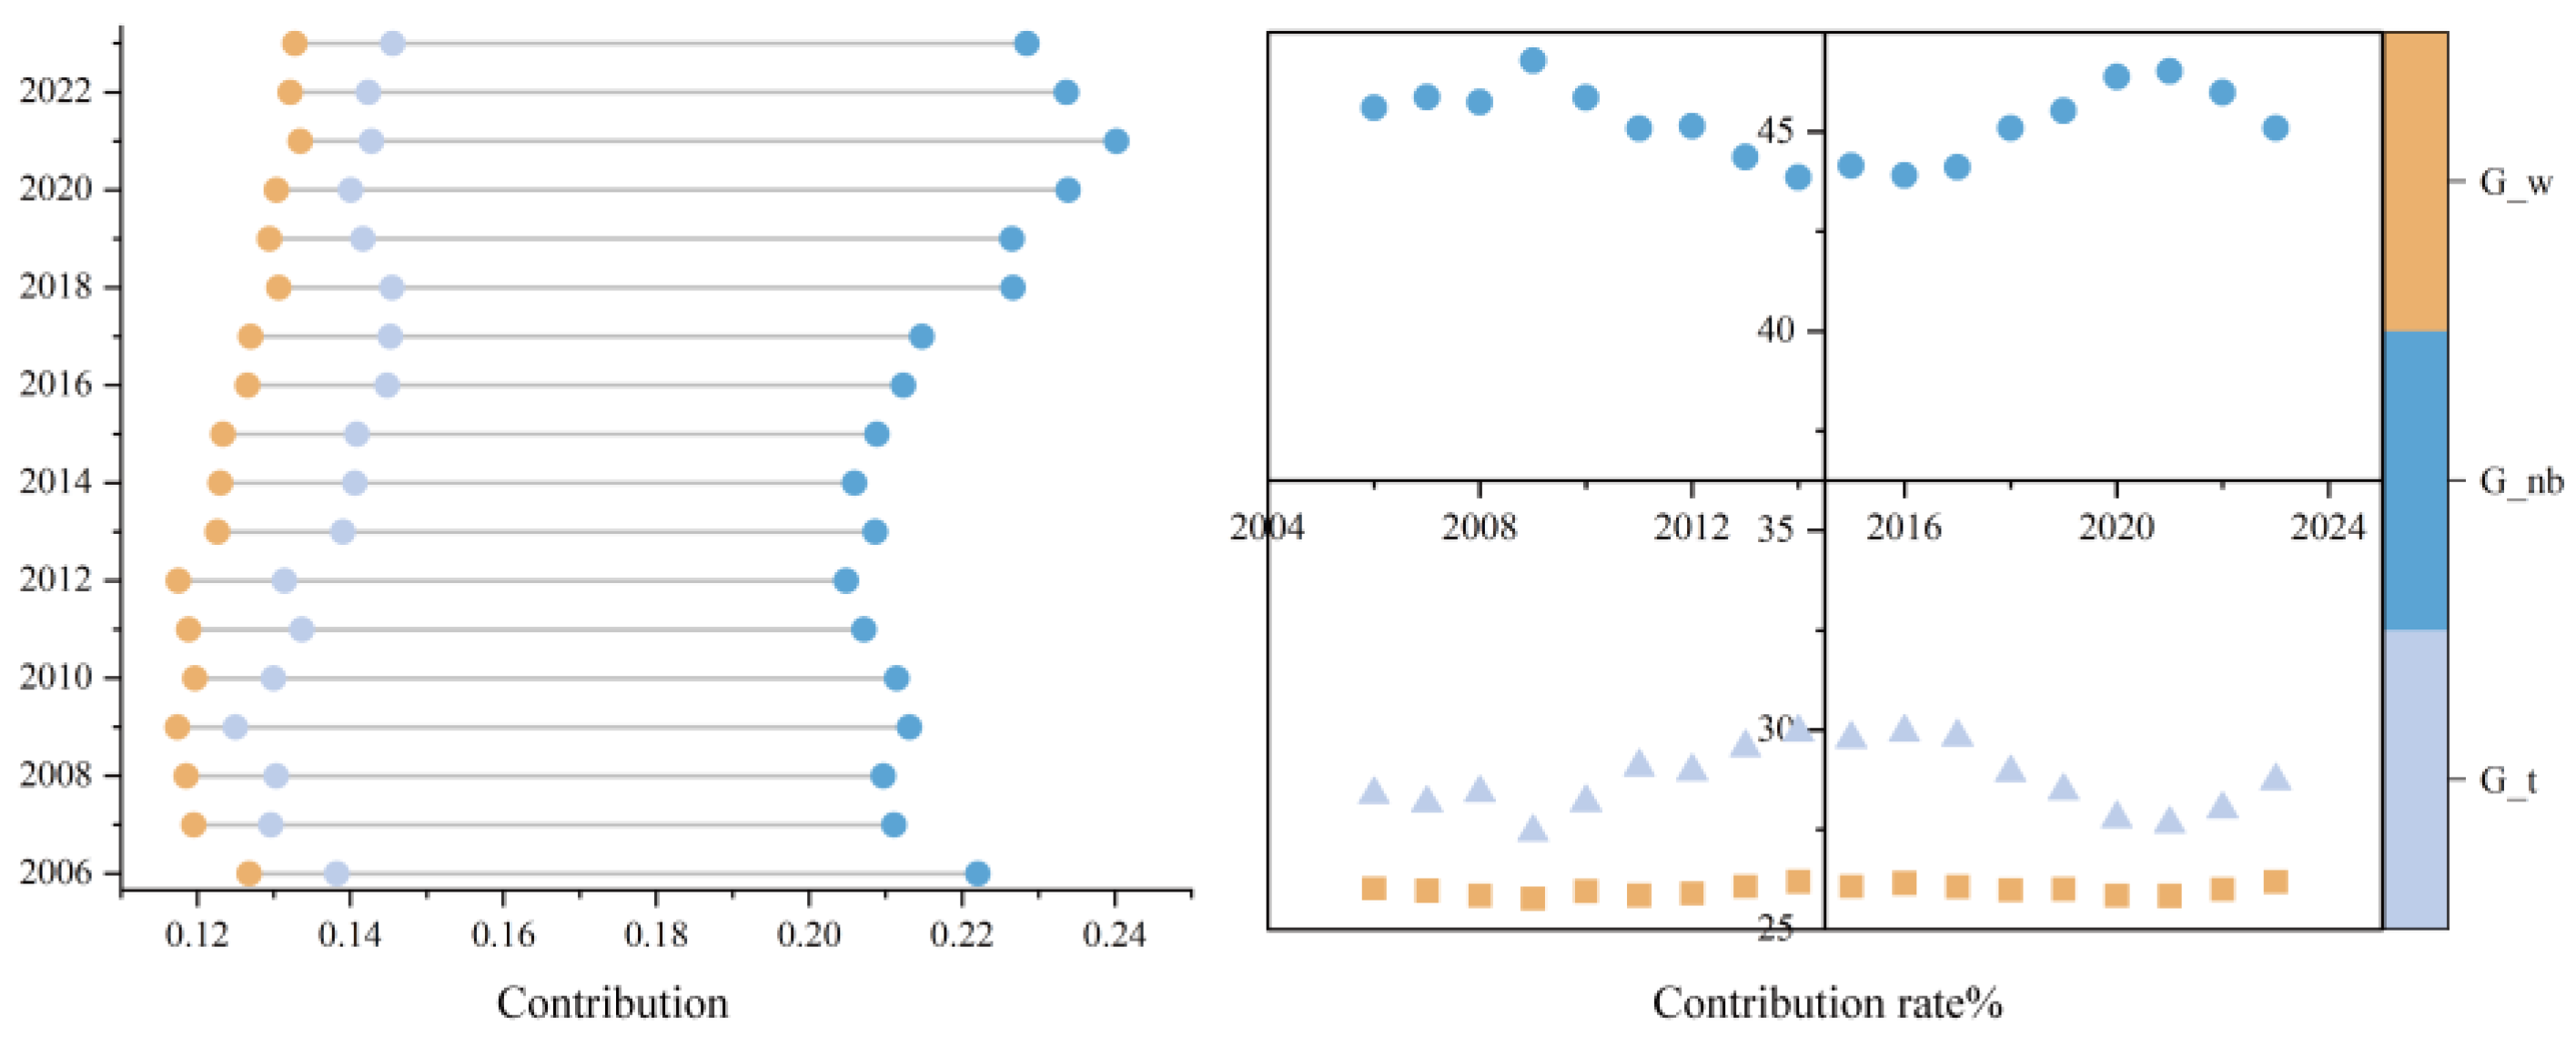
To delve deeply into the regional disparities in EER across 290 cities, this article employs the Dagum Gini coefficient to study the degree of difference and contribution rate in EER for the country as well as the four major economic regions. The results are illustrated in Figure 3, Figure 4 and Figure 5.

3.2.1. Overall Differences and Intra-Regional Differences

The intra-group differences are shown in Figure 3. From a holistic perspective, the global Gini coefficient for EER is relatively high, with an average of 0.48. During the period from 2006 to 2011, this coefficient showed a clear downward trend; however, it rapidly increased after 2012, and reached its peak in 2021, before gradually declining. This indicates that there was a significant spatial non-equilibrium characteristic of national EER throughout the study period. From the perspective of development stages, during the early phase, the nationwide implementation of energy conservation and emission reduction targets, coupled with regional coordination strategies such as the “Rise of Central China Strategy,” “Chengdu–Chongqing Urban–Rural Integration Comprehensive Reform Pilot Zone,” and “Hai Xi Economic Zone,” effectively narrowed spatial disparities in EER. After 2012, China entered a stage of economic transformation and upgrading, with regional development strategies tilting moderately towards eastern regions. The eastern region leveraged its advantages in technology, capital, and policy to prioritize new energy industries, digital economy sectors, and green finance; further bolstered by initiatives like the Belt and Road Initiative, Xiong’an New Area planning implementation, and upgrades to the Yangtze River Delta Ecological Green Integrated Development Demonstration Zone. These measures led to a concentration of policy resources in core areas within the east, reinforcing their unipolar advantage while exacerbating regional development gaps. Following the announcement of carbon peaking and carbon neutrality goals in 2020, policy orientation shifted from “leading green transformation in the east” to “coordinated decarbonization across all regions.” The central and western regions have gained momentum for green development through “West-to-East Power Transmission” and the construction of new energy bases, injecting vitality into the EER. Meanwhile, the eastern regions have transferred green technologies through “targeted assistance” to drive the development of less developed areas, leading to a marginal convergence in the imbalance of the national EER.
From a regional perspective, the intra-regional Gini coefficient in the northeast consistently ranks first, reflecting significant disparities in the region’s internal EER. This phenomenon primarily stems from differences in regional resource endowments, the inertia of industrial structures, and the divergence of ecological constraints. Specifically, cities such as Shenyang, Anshan, and Dalian, leveraging iron ore, coal resources, and port advantages, have developed heavy industries with a robust economic foundation. However, due to long-term reliance on energy-intensive industries like steel and chemicals, they bear a heavy ecological burden, exhibiting a characteristic of “strong economic resilience but weak ecological resilience.” Areas like the Changbai Mountains, Greater Khingan Mountains, and Yichun, with high forest coverage, serve as crucial ecological barriers. The priority given to ecological protection restricts economic development, manifesting as “strong ecological resilience but weak economic resilience.” The Songnen Plain and Liaohe Plain, as major commodity grain bases in China, have developed synergistic resilience in ecology and agriculture through large-scale farming and agricultural product processing industries. Cities such as Tongliao, Chifeng, Baicheng, and Chaoyang are constrained by natural conditions like drought and desertification, resulting in low agricultural productivity, fragile ecology, and a weak economic foundation, leading to consistently low levels of EER. The intra-regional disparities across the eastern, central, and western regions are relatively modest, all being smaller than the overall national disparity. Specifically, within the eastern region, the Gini coefficient initially exhibited a marked decline, followed by a trend of stability with minor fluctuations, culminating in the lowest value at the end of the period. In contrast, the intra-group Gini coefficient for the central region experienced significant fluctuations, first dropping to its nadir in 2011 and then rapidly rising by as much as 42.98%. The comprehensive implementation of the “Rise of the Central Region” strategy in 2006, which emphasized infrastructure connectivity, led to a gradual narrowing of the disparities in EER among various provinces and cities within the central region due to the widespread applicability of the policy. However, after 2011, the strategy shifted to a “point-driven-surface” approach, focusing on developing national central cities like Wuhan and Zhengzhou, as well as regional central cities such as Changsha, Hefei, and Nanchang. This adjustment once again widened the internal disparities in EER within the central region. The intrinsic differences in the western region have consistently remained at a moderate level, showing a pattern of minor fluctuations that trended slightly upward overall, though there was a slight decline in the later stages.

3.2.2. Inter-Regional Differences

Inter-regional difference trends are shown in Figure 4. Overall, the dynamic changes in the differences in EER across regions exhibit a trend of initially decreasing and subsequently increasing to varying degrees, all reaching their minima in 2012 before gradually increasing at a slow pace. In the early stages of the study, profound impacts from the concept of harmonious coexistence between humans and nature, as well as the sustainable development notion of deep integration between the economy and the ecological environment, led to a notable reduction in inter-regional disparities. During the mid-to-late stages of the study, however, the varying degrees of implementation of the green development concept significantly widened the gaps between regions. The most significant disparity is observed between the northeast and western regions, with a value as high as 0.56, which has consistently remained at a high level. At the beginning of the study, strategies such as “Great Development of the West” and “Revitalization of the Old Industrial Bases in Northeast China” were simultaneously implemented. The northeast region enhanced its economic resilience through technological upgrades in traditional industries and modernization of agriculture, while also optimizing its ecological foundation by leveraging areas with high forest coverage such as the Greater Khingan Range and Changbai Mountains. In contrast, the western region improved its EER through projects like “West-to-East Gas Transmission” and “Returning Farmland to Forest,” balancing ecological conservation with energy development. Both regions started from a low base and experienced synchronous improvements in their resilience levels, leading to a temporary narrowing of the gap. However, during the later stages of the study, economic resilience in the northeast declined due to stricter environmental standards and overcapacity issues. Transitioning resource-exhausted cities towards green manufacturing and ecotourism proved challenging, exacerbating conflicts between ecological conservation and economic development, thus hindering overall improvements in EER or even resulting in periodic setbacks. By comparison, the western region leveraged resources such as ecotourism, ethnic characteristics, and green energy to pursue differentiated development paths, achieving certain enhancements in resilience levels. This led to an expansion of the absolute gap between northeastern and western regions once again. Additionally, inherent differences in geographical environment and economic development between these two regions have contributed to maintaining a relatively high disparity in their respective resilience values. The disparity values between the northeast and other regions are consistently at elevated levels, whereas those among the eastern, central, and western regions exhibit relatively lower magnitudes. This observation aligns with the prior assertion regarding the most pronounced differentiation within the northeast region. The inter-regional disparity fluctuations between the central and western regions demonstrate a relatively moderate variation. Post-2021, the overall inter-regional disparities manifest a positive trend of contraction.

3.2.3. Sources of Variation and Their Contributions

The trend in the contribution rate of the sources of differences in EER is shown in Figure 5. According to the mean contribution rates, the values for G_w, G_{nb}, and G_t are 25.99%, 45.28%, and 28.73%, respectively. This indicates that the primary source of overall differences in EER is the net differences between regions, followed by hyper-variable density and within-region differences. Given the vast expanse of China, which spans multiple natural zones, the diversity in geographical and ecological environments within each region has shaped distinct economic development models, leading to significant inter-regional disparities. Hypervariable density reflects the disparities caused by the overlapping regions of different areas. Its value shows a subtle trend of first rising and then falling, revealing the instability of the unevenness of EER. From the temporal characteristics of the three types of difference sources, the fluctuation in the contribution rate of intra-regional differences is the most stable, highlighting the internal balance and self-regulating capabilities of regional ecological economic systems. In contrast, the net contribution rate of inter-regional differences exhibits significant fluctuations during the observation period and gradually increases, indicating that inter-regional differences are the main source of spatial disparities in EER. Therefore, narrowing the differences in EER among regions, with a focus on alleviating the disparities between the northeast and other areas, is crucial for enhancing the EER.

3.3. Convergence Pattern Analysis of Ecological Economic Resilience

The above indicates significant disparities in EER between the national and regional levels, with the future trajectory—whether it will deepen or gradually narrow—emerging as a critical issue to explore. To address this question, the convergence of EER is analyzed using σ convergence and β convergence.

3.3.1. Spatial Correlation Test

Prior to exploring the spatial convergence of EER in China, it is essential to conduct a spatial correlation test. This examination aims to uncover the spatial association characteristics and evolving trends among the EER of various regions. Based on the EER data of 290 prefecture-level cities in China, the global Moran’s I index for each year was calculated, and cluster and outlier analyses were conducted for the EER in 2006 and 2023, as illustrated in Figure 6.
During the observation period, the Moran’s Index test yielded a significantly positive result, with a mean value of 0.1578, indicating a significant spatial correlation in the EER among cities. This suggests an overall spatial clustering phenomenon, where cities exhibiting higher EER tend to be adjacent to other cities with similarly strong resilience, while cities with lower resilience are more likely to neighbor those with similarly weak resilience. From the perspective of the dynamic evolution of spatial correlation, the overall development trajectory has exhibited a fluctuating pattern of “strong–weak–strong.” In the initial phase of the study, the introduction of the “11th Five-Year Plan for National Environmental Protection Standards” by the Ministry of Ecology and Environment provided guidance for cities in the field of environmental protection, significantly promoting the standardization and normalization of environmental protection efforts. This development has notably enhanced the agglomeration effects of EER among cities. The Moran index began to decline from 2008, reaching its nadir by 2016. This significant shift can likely be attributed to the following two primary factors: on the one hand, China was inevitably affected by the global financial crisis, whose profound repercussions permeated various sectors of the domestic economy; on the other hand, the country also faced unprecedented natural disasters (such as ice storms and floods) in that year, posing another severe challenge. The interplay of these two challenges exerted unprecedented impacts on both the economy and the ecosystem. These compound effects not only exacerbated the vulnerability of the eco-economic system but also profoundly influenced the spatial distribution patterns of EER and the interrelationships among different regions. As the research progresses into its middle stage, challenges have arisen to the original eco-economic landscape due to regional economic development model transformations and differentiated growth patterns, leading to a decline in the spatial autocorrelation of EER. In recent years, driven by the deepening awareness of ecological civilization construction and the concept of green development, the Chinese government has, for the first time, explicitly proposed the strategic goal of building “resilient cities” in the 14th Five-Year Plan and the 2035 Long-Term Objectives, thereby promoting the deepening implementation of regional coordinated development. This shift has resulted in a transformation from weak to strong in the spatial correlation of EER.
Cluster and outlier analysis has categorized the regions of EER into the following five distinct classes: non-significant category, H-H cluster region, H-L cluster region, L-H cluster region, and L-L cluster region. The research findings indicate a significant concentration of H-H clustering areas in Guangdong and Jiangsu Provinces, with this trend extending further to Zhejiang Province by 2023. This encompasses numerous cities such as Guangzhou, Shenzhen, Foshan, Dongguan, Suzhou, Wuxi, Jinhua, Shaoxing, and Taizhou, with Tianjin and Tangshan also exhibiting H-H patterns. This phenomenon profoundly reveals the strong spatial agglomeration characteristics of these regions in terms of EER, indicating a notable cluster advantage in promoting the synergy between ecological balance and economic development. The underlying causes of their agglomeration phenomena stem from these cities’ identifying technological innovation as a core driving force. This has led to the deep advancement and continuous optimization of their innovation systems, thereby generating a significant agglomeration effect in technological innovation. Throughout this process a continuous emergence of new technologies, products, and emerging business models has significantly enhanced production efficiency and the effectiveness of resource optimization, greatly increasing the attractiveness of enterprises. This, in turn, has driven the constant influx of critical resources such as talent, capital, and information into these cities. Concurrently, under the leadership of technological innovation, innovation activities have been continuously deepened. This has led to profound adjustments and optimization of the industrial structure, as well as the establishment of a modern industrial system characterized by diversity and high added value. This system features a complete industrial chain and showcases a high degree of industrial agglomeration. It accelerates the transition of cities towards green and low-carbon development models, enhances the overall competitiveness of urban economies, and thereby provides solid and robust support for the strengthening and stabilization of urban EER. H-L clustering and L-H clustering exhibit a more dispersed spatial distribution. In contrast, although L-L clustering shows relatively uneven distribution, it does demonstrate a certain trend. This trend extends from Ordos City in Inner Mongolia in the north, through Dingxi City in Gansu Province in the west, to Guangyuan City in Sichuan Province in the south, and finally to Jincheng City in Shanxi Province in the east. These cities constitute the primary coverage area. Notably, regions that were previously classified as non-salient areas, such as Hami City in Xinjiang, and most cities in northeast China, transitioned to L-L clusters and a few H-L clusters by 2023. These areas are predominantly located in regions with harsh natural conditions, rendering their ecological environments relatively fragile. This characteristic imposes stringent limitations on the methods and intensity of resource development, adversely affecting the stability and diversity of agricultural production. Economically, these regions often excessively rely on resource-based industries or traditional agriculture, lacking high value-added industrial support. The singularity of their economic structure makes local economic development prone to stagnation or slow growth, making it difficult to effectively attract and retain talent. This further restricts the diversity of economic activities, thereby reinforcing the clustering trend of low-level agglomeration.

3.3.2. σ Convergence Test and Result Analysis

Figure 7 presents the σ convergence results of EER across 290 cities nationwide and within each region. On the whole, the coefficient of variation for EER exhibits significant fluctuations. Its dynamic trajectory initially declines and subsequently rises, resulting in a lower end-of-period value compared to the beginning-of-period value. This indicates that, over the observed period, the overall disparity in EER across the study regions has slightly diminished, suggesting the presence of σ convergence. From a regional perspective, σ convergence is observed in both the northeastern and eastern areas, with the latter exhibiting the most pronounced convergence. The northeastern region as a whole demonstrates a fluctuating downward trend, reaching cyclical lows in 2007, 2010, and 2014, followed by an upward trajectory. Nevertheless, even at the end of the observation period, the values remain below the initial levels. This phenomenon may be deeply rooted in the northeastern region’s long-standing economic structure being heavily reliant on resource-based industries and heavy chemical industries. Although national policies aimed at revitalizing the old industrial bases have, in the short term, positively stimulated economic growth, these measures may not have fundamentally addressed the region’s deep-seated issues. These issues include a single industrial structure and relatively delayed innovation capabilities. As the policy effects wane or external environments shift, the region’s economic resilience exhibits significant volatility, leading to abnormal fluctuations in the coefficient of variation for EER. The coefficient of variation in EER in the eastern region exhibits a fluctuating downward trend, with a decline of 16.25%, ranking highest among all regions. This reflects a strong σ convergence phenomenon within the eastern region, attributable to its primary development zones—the Bohai Rim, Yangtze River Delta, and Pearl River Delta economic hubs—which have implemented a comprehensive regional coordinated development strategy. This strategy not only enhances the overall competitiveness of the eastern region but also progressively narrows the disparities in EER among its constituent cities, leading to a convergence effect. The σ convergence coefficients of EER in both central and western regions have exhibited an upward trend, with the central region experiencing a 28.84% increase and the western region witnessing an even more significant surge of 49.50%. This clearly indicates that the EER in these two regions does not exhibit σ convergence characteristics, with the non-convergence trend in the western region being particularly pronounced. This phenomenon can be partly attributed to the large-scale infrastructure projects under the Western Development Strategy, such as railways, highways, reservoirs, and hydropower stations, which have caused irreparable environmental damage in mountainous or ecologically sensitive areas. These projects not only weaken the self-recovery capacity of regional ecosystems but also pose a long-term negative impact on EER. The western region spans a vast geographical area, encompassing numerous cities with vastly different natural environments, economic conditions, and social structures, such as Inner Mongolia, Xinjiang, and the southwestern regions. The significant variations in economic structures and ecosystems among these cities result in a high degree of dispersion in the coefficient of variation for the region. The overall lack of an effective regional coordination and integration mechanism makes it difficult for the central and western regions to form a unified path for enhancing EER, thereby hindering the emergence of σ convergence phenomena.

3.3.3. β Convergence Test and Result Analysis

Strictly adhering to the empirical model selection process, initially, a panel regression model is established, and the Lagrange Multiplier test is used to examine spatial autocorrelation. If spatial autocorrelation exists, at least one of the spatial lag model or the spatial error model is considered valid. Subsequently, a spatial Durbin model is constructed, and Wald tests and Likelihood Ratio tests are employed to determine whether it simplifies to a spatial autoregressive model or a spatial error model. Finally, the Hausman test significantly rejects the random effects hypothesis, confirming the use of a fixed effects model for analysis. The results of model suitability testing are shown in Figure 8.
(1) Absolute β convergence analysis. The absolute β convergence test results for the EER of the nation and the four major economic regions are shown in Table 2. The results indicate that, with regard to the convergence coefficient, the national and regional values are significantly negative at the 1% confidence level, signifying the presence of absolute β convergence characteristics across all regions. This suggests that, in the absence of other influencing factors on EER, the disparities in EER among regions will progressively diminish, leading to a state of convergence. This finding aligns with the overall trend of convergence observed in the σ convergence analysis. From a spatial perspective, the nation and various regions exhibit distinct spatial effects. The northeastern and central regions potentially experience negative spillover effects. In the eastern and western regions, the estimated results of the spatial autoregressive coefficient ρ are positive, indicating the presence of positive spatial spillover effects on EER among these regions. Specifically, the logarithmic growth rate of local EER positively influences the growth rates of EER in other regions. The spatial correlation facilitates mutual promotion among regions in terms of resilience growth, thereby fostering β convergence in EER. Additionally, the corresponding spatial lag term γ is significantly positive, reflecting the gradual enhancement of EER in other regions. In terms of convergence speed, the convergence rates of EER across the nation and various regions exhibit distinct variations. The northeastern region demonstrates the fastest convergence rate, which aligns with the observed reduction in internal regional disparities in EER during its dynamic evolution. This finding is consistent with the analysis in the σ convergence section, both indicating a significant trend towards convergence. Conversely, the convergence speed in the western region is the slowest, significantly lower than the national average, suggesting a high degree of imbalance in EER among cities within this region, thereby reducing the likelihood of convergence phenomena occurring.
(2) Conditional β convergence analysis. The conditional β convergence test of EER across the nation and various regions is conducted based on absolute β convergence, further considering factors such as regional LED, IS, UCE, UWSS, and ITER that influence EER. The results are shown in Table 3. After testing, a spatial Durbin model was adopted for each region. At the macro level, the convergence coefficient β is significantly negative at the 1% confidence level, indicating the existence of conditional β convergence. This means that, after incorporating control variables, the disparities in the national EER gradually diminish, showing a trend towards convergence at their respective steady-state levels. The convergence characteristics of various regions are consistent with the national level. Specifically, the β values for the four major economic regions are all significantly negative at the 1% statistical level, suggesting a favorable development trajectory for the EER in each region. In terms of convergence speed, the northeast region exhibited the most significant increase, reaching 0.0338, followed by the central, eastern, and western regions. Overall, conditional β convergence across these regions demonstrated a notably faster rate compared to absolute β convergence, indicating that the control variables exert a positive influence on the convergence development of China’s EER. This suggests that the selected variables are appropriately chosen and justified. From a spatial perspective, the spatial effect types across the nation, eastern regions, and western regions remain unchanged. Both γ and ρ exhibit positive values under different levels, demonstrating no deviation from the absolute β convergence component. The spatial correlation patterns in the northeastern and central regions shift from a Spatial Autoregressive Model (SAR) to a Spatial Durbin Model (SDM), with negative ρ values observed. This divergence from other regions indicates a negative spatial spillover effect. These two regions bear the critical responsibilities of black soil preservation and soil erosion control. Implementing policies that restrict resource exploitation, such as limiting high-energy-consuming industries and promoting afforestation, could potentially exacerbate resource supply pressures in surrounding areas. Additionally, core cities like Shenyang and Wuhan have limited radiation capabilities, failing to foster collaborative growth patterns in their vicinities. Instead, their own demands for industrial upgrading may lead to direct competition with surrounding areas in low-end industrial sectors, indirectly hindering the enhancement of their EER.
Additionally, compared to absolute β convergence analysis, the coefficient of determination in conditional β convergence analysis has significantly increased across various regions, indicating that after considering the influence of control variables, the model specification has been optimized, significantly enhancing its explanatory power for EER. From an economic perspective, there are significant differences in the influencing factors of EER among 290 cities nationwide and the 4 major economic regions. When examining the nation as a whole, LED, IS, UCE, UWSS, and ITER all passed the significance test and had a significantly positive impact on EER, meaning that these five factors all exhibit tendencies toward the convergence of EER to either high or low values. For different regions, the five control variables exhibit significant heterogeneity in their effects on EER. The UWSS and LED exert the most positive influence on enhancing EER. Water, as a core element supporting both ecological systems and economic activities, directly determines the regional ecological carrying capacity and economic risk-resistance capability. The core logic of its positive effect lies in ensuring the stability of the ecological system and the continuity of the economic system: on the one hand, sufficient water supply can maintain the integrity of natural ecological systems such as wetlands and rivers (e.g., climate regulation and environmental purification), thereby enhancing the system’s resilience to disturbances like droughts and pollution; on the other hand, it can effectively support the normal operation of industries, agriculture, and services. An expanded water supply scale can reduce the risk of production interruptions caused by water scarcity, thereby strengthening the economic system’s resistance to fluctuations. Additionally, an increase in economic development level will enhance the capacity for pollution control and ecological restoration, expand fiscal buffer space for responding to natural disasters and environmental emergencies, and thus provide stronger support for EER. The enhancement effect of UWSS is most pronounced in the eastern region. As a densely populated and industrialized area in China, the eastern region already faces significant contradictions between water resource supply and demand. Practical experience demonstrates that an improvement in water supply capacity in this region can more effectively alleviate bottlenecks in urban domestic water use, reduce the risks of industrial chain disruptions caused by water outages, and provide a more substantial safeguard for economic continuity compared to other regions. Consequently, the “marginal benefit” of water supply becomes more evident in this context. Notably, the IS exerts a slight positive promoting effect on the western regions, while demonstrating an inhibitory influence on other areas. The western regions primarily feature small-scale light industries with dispersed layouts, which result in lower levels of pollution diffusion. Additionally, these industries address local employment, augment fiscal revenue, and constitute one of the significant economic pillars. Consequently, under the premise of ensuring economic stability, they still exert a slight positive impact on EER. In contrast, the eastern, central, and northeastern regions, influenced by factors such as ecological carrying capacity, industrial transformation, and industrial aging, experience an inhibitory effect from related industries. The ITER can drive the green and efficient transformation of industries, while the UCE can enhance the governance level of urban aesthetics and public spaces. Both factors positively contribute to the EER, reinforcing the stability of regional resilience.

4. Discussion

This study exhibits certain similarities and differences with existing literature. Regarding the research subject, extant studies predominantly focus on urban resilience [10], ecological resilience [21], economic resilience [4], and socio-ecological resilience [45]. A growing number of investigations, however, are moving beyond the confines of resilience within a single dimension, increasingly emphasizing the systemic resilience between ecology and economy. Nevertheless, in-depth scholarly exploration of EER remains scarce. This paper innovatively integrates both ecological and economic dimensions to deeply explore the dynamic evolution characteristics of the overall resilience of the ecological-economic system, thereby more accurately revealing the dynamic developmental traits of EER. At the level of indicator evaluation, scholars predominantly focus on “resistance, adaptability, and recoverability,” constructing evaluation systems from aspects such as environmental pollution, economic characteristics, innovation indices, and resources [21,30,31]. In contrast, the research presented in this article is characterized by greater comprehensiveness and meticulousness. Based on a profound grasp of the core concept of resilience, this paper, by referencing and drawing upon existing literature, constructs an EER evaluation system that focuses on “resistance, adaptability, and recovery,” encompassing 25 detailed indicators. The study clearly defines these three dimensions to prevent issues such as unclear logical relationships between hierarchical indicators. At the research scale, certain resilience-related literature focuses on study areas such as watersheds, coastal regions, or smaller geographical extents [17,25,45]. In contrast, this study employs cities as the unit of analysis, further subdividing them into regions such as northeast, eastern, central, and western to comparatively investigate the spatial variation characteristics and convergence trends of EER across the nation and within each region. This integrated analytical perspective of both the whole and its parts facilitates a more comprehensive understanding of the spatial heterogeneity of EER in Chinese cities. In contrast to other resilience studies, this article adopts distinct methodologies. For instance, some studies utilize coupling coordination models and comprehensive evaluation methods, emphasizing the coordinated resilience development of economy, society, and environment. In this study, however, empirical analysis is conducted through kernel density estimation, Gini coefficient, and spatial convergence models, placing greater emphasis on the quantitative assessment, spatio-temporal evolution analysis, regional disparities, and the degree of influence of factors on EER. This approach offers a comprehensive perspective and set of methodologies, enabling a deeper understanding of the intrinsic mechanisms, spatio-temporal evolution patterns, and regional development characteristics of EER development, thereby providing a scientific basis for formulating targeted enhancement strategies. Finally, in terms of research conclusions, Reference [10] observed an upward trend in the resilience index of cities in the Beijing–Tianjin–Hebei region, with the resilience of cities in Hebei Province being lower than that of Beijing and Tianjin, and the level of urban facilities significantly enhancing resilience. In contrast, this study found a slight downward trend in EER, yet regional heterogeneity was relatively pronounced, and the selected influencing factors such as UWSS and LED positively contributed to EER. This indicates the high complexity of the urban eco-economic system, which warrants further exploration through more research.
Nonetheless, there are limitations in this study. One is the difficulty in data acquisition. Research in the field of EER is relatively new, lacking clear and unified criteria and framework definitions, with a broad and complex research scope and ambiguous accounting boundaries. Another limitation is the room for improvement in control variables. The driving factors are the combined result of multiple intertwined elements, requiring variable selection to cover multiple domains as much as possible. While the article has considered some key factors, it has not fully integrated specific contexts to explore and include other potentially significant factors. The breadth and depth of research areas need to be enhanced. Future studies can further focus on county-level or urban agglomeration perspectives, conducting more detailed quantitative analysis of EER. Moreover, integrating different disciplines to deepen the understanding of the essence of EER will provide richer and more forward-looking theoretical guidance for achieving green and resilient development of China’s economy and society.

5. Conclusions and Recommendations

This article employs the entropy method to calculate the EER index of 290 cities across the nation from 2006 to 2023. It utilizes kernel density estimation, Dagum’s Gini coefficient, and spatial convergence models to investigate the dynamic evolution characteristics, regional disparities, and convergence patterns of EER at both national and four major economic regional levels. The primary conclusions are as follows:
Firstly, from a dynamic evolution perspective, the kernel density curves of EER for both the nation and the four major economic regions exhibit a tendency to shift leftward. This indicates a decline in the resilience intensity of most cities to varying degrees. Such a decline reduces their capacity for recovery and adaptation in the face of external shocks and internal changes. The strength of EER across the nation is gradually stabilizing, with disparities among cities within the eastern, central, and western regions diminishing. Some cities in the northeastern region consistently demonstrate high resilience characteristics. A polarization phenomenon in EER has emerged in the nation, northeastern, and western regions. The spatial polarization is particularly pronounced in the northeastern region, while the eastern and central regions exhibit a unimodal trend.
Secondly, in terms of regional disparities, the Gini coefficient for national EER is high and demonstrates a robust growth trend overall. The intra-regional Gini coefficient in the northeast region consistently leads and exceeds the national level, indicating a particularly pronounced imbalance in internal EER. The dynamic changes in inter-regional disparities exhibit a pattern of first decreasing and then increasing, with the disparity between the eastern and western regions being the most significant. According to the contribution rate analysis, the overall disparity in EER is primarily due to the net disparity between regions. From the temporal characteristics of disparity sources, the net contribution rate of inter-regional differences has been gradually increasing. This indicates that inter-regional disparities are the main source of spatial differences in EER.
Thirdly, in terms of convergence patterns, the nation as a whole, the northeast, and the eastern regions exhibit σ convergence characteristics. The eastern region demonstrates strong σ convergence, whereas the central and western regions do not display such convergence. The nation and the four major economic zones all demonstrate significant absolute β convergence and conditional β convergence at the 1% confidence level, with positive spillover effects present. The convergence rates vary, with the northeast region showing a relatively faster convergence speed, while the western region exhibits the slowest convergence. Upon incorporating control variables, the influencing factors primarily exert positive spillover effects, facilitating the convergence of EER. The convergence speed within the conditional β convergence framework is enhanced, and the convergence trend becomes more pronounced.
Based on the aforementioned research findings and in conjunction with the actual developmental conditions of various regions, the following policy recommendations are proposed for respective areas:
Firstly, deepen the integration of technological innovation and ecological conservation in eastern regions. Leverage the pioneering advantages of the digital economy in areas such as the Yangtze River Delta and the Pearl River Delta. Integrate satellite remote sensing with ground sensor technology to construct an integrated “space–air–ground” ecological economic monitoring system. This system will enable millimeter-level identification of core areas such as industrial cluster pollution emissions and the protection of arable land from heavy metal contamination in soil. It will achieve real-time data transmission and intelligent analysis of ecological data per square kilometer. This will provide precise predictions for sudden destructive events and offer scientific support for rapid decision-making.
Secondly, promoting industrial transformation and ecological coordinated development in central China. It is proposed to establish innovation centers characterized by deep integration of industry, academia, and research in green transformation demonstration zones such as Wuhan and Changsha. These centers will leverage universities and research institutions including Wuhan University and Central South University to develop new steel smelting technologies, thereby advancing energy utilization towards low-carbon and circular models. Building on the successful practice of the “agriculture–photovoltaic complementarity” model in Zhoukou, Henan, this approach should be extended to major grain-producing areas in central China, such as the Jianghuai region in Anhui, and the Jianghan Plain in Hubei. Concurrently, photovoltaic agricultural science and technology demonstration parks should be established. These parks should integrate photovoltaic power generation, agricultural cultivation, agricultural product processing, and eco-tourism. They will form an integrated agricultural–tourism system that fosters a virtuous cycle of sustainable ecological and economic development.
Thirdly, deepen the coordinated enhancement of ecological protection and the cultivation of distinctive industries in western regions. It is recommended that in areas such as Gansu and Ningxia, where drip irrigation and sprinkler irrigation technologies are widely adopted, comprehensive integration of Internet of Things (IoT) sensing technologies should be implemented. Through the real-time monitoring of key parameters such as soil moisture and crop growth cycles, precise and automated regulation of irrigation operations can be achieved. This enhances water resource utilization efficiency and ensures the sustainability of agricultural ecosystems. It is suggested to establish standardized planting bases for rare medicinal herbs, concurrently developing advanced processing industrial parks, and constructing a green, end-to-end industrial chain for medicinal materials. This approach aims to convert resource advantages into industrial competitiveness while preserving ecological diversity. Leveraging Guizhou’s pioneering position in the big data industry, efforts should be made to upgrade western data centers into “carbon-neutral data valleys.” This will set a western model for the integrated development of digital economy and ecological protection.
Fourthly, promote the coordinated development of emerging industry cultivation and ecological protection upgrading in northeast China. In the cold-economy demonstration zones of Changchun and Harbin, virtual reality and augmented reality technologies can be introduced to develop immersive ice and snow experience projects. This will help construct an industrial cluster that spans from creative design and technological research to scene operation. Meanwhile, it is essential to enhance the protection of black soil in the Songnen Plain and Sanjiang Plain. It is also necessary to popularize precision farming with intelligent agricultural machinery and achieve intelligent and precise operations of straw mulching and no-till or minimum-till farming. For abandoned mining areas in cities such as Fuxin and Fushun, in addition to transforming them into photovoltaic power stations and industrial heritage parks, industrial theme amusement facilities can be created using obsolete equipment and industrial culture festivals can be held to attract tourists. This will drive the transformation of mining areas from mere ecological restoration to ecological economic development.

Author Contributions

Conceptualization, X.R. and B.Z.; methodology, X.R.; formal analysis, B.Z.; resources, B.Z.; data curation, X.R.; writing—original draft preparation, X.R.; writing—review and editing, R.D.; visualization, X.R.; supervision, R.D.; funding acquisition, R.D. All authors have read and agreed to the published version of the manuscript.

Funding

This research was funded by the National Natural Science Foundation of China (Grant No.: 72001053).

Data Availability Statement

The dataset is available on request from the authors. The raw data supporting the conclusions of this article will be made available by the authors on request.

Conflicts of Interest

The authors declare no conflicts of interest.

References

  1. Panzeri, A.; Bertamini, M.; Butter, S.; Levita, L.; Gibson-Miller, J.; Vidotto, G.; Bennett, K.M. Factors impacting resilience as a result of exposure to COVID-19: The ecological resilience model. PLoS ONE 2021, 16, e0256041. [Google Scholar] [CrossRef] [PubMed]
  2. Tao, J.; Wang, Z.; Li, J. The spatial effect of digital economy on public psychological resilience during the diffusive crisis. Front. Public Health 2023, 11, 1156367. [Google Scholar] [CrossRef]
  3. Baho, D.L.; Allen, C.R.; Garmestani, A.S.; Fried-Petersen, H.B.; Renes, S.E.; Gunderson, L.H.; Angeler, D.G. A quantitative framework for assessing ecological resilience. Ecol. Soc. A J. Integr. Sci. Resil. Sustain. 2017, 22, 17. [Google Scholar] [CrossRef]
  4. Song, G.; Tang, C.; Zhong, S.; Song, L. Multiscale study on differences in regional economic resilience in China. Environ. Dev. Sustain. 2023, 26, 29021–29055. [Google Scholar] [CrossRef]
  5. Hu, Y.; Zhou, H.Q.; Jin, X.M.; Shen, Y.F.; Yan, Y.Z. Assessing the Resilience of the Marine Economy: A Case Study of Southern China’s Marine Economy Circle. Front. Mar. Sci. 2022, 9, 912462. [Google Scholar] [CrossRef]
  6. Liang, X.; Gao, X.; Zhao, M.; Guo, Z.; Shen, W. Ecological space resilience assessment of Baiyangdian Basin from the perspective of evolutionary resilience. Front. Ecol. Evol. 2023, 11, 1200218. [Google Scholar] [CrossRef]
  7. Leitner, H.; Sheppard, E.; Webber, S. Globalizing urban resilience. Urban Geogr. 2018, 39, 1276–1284. [Google Scholar] [CrossRef]
  8. Datola, G. Implementing urban resilience in urban planning: A comprehensive framework for urban resilience evaluation. Sustain. Cities Soc. 2023, 98, 104821. [Google Scholar] [CrossRef]
  9. Ribeiro, P.J.G.; Gonçalves, L.A.P.J. Urban resilience: A conceptual framework. Sustain. Cities Soc. 2019, 50, 101625. [Google Scholar] [CrossRef]
  10. Sun, J.; Zhai, N.; Mu, H. Assessment of urban resilience and subsystem coupling coordination in the Beijing-Tianjin-Hebei urban agglomeration. Sustain. Cities Soc. 2024, 100, 105058. [Google Scholar] [CrossRef]
  11. Wang, J.; Wang, J.; Zhang, J. Spatial distribution characteristics of natural ecological resilience in China. J. Environ. Manag. 2023, 342, 118133. [Google Scholar] [CrossRef]
  12. Enerlan, G.P. An analysis on the economic resilience and vulnerability of local economies in the Philippines to hydrometeorological disasters. Int. J. Disaster Risk Reduct. 2023, 84, 103447. [Google Scholar] [CrossRef]
  13. Tao, Z.; Zheng, X.; Wang, X.; Han, L.; Huang, Y.; Li, J.; Tao, Z. Economic resilience in California against two earthquakes. Int. J. Disaster Risk Reduct. 2022, 76, 102993. [Google Scholar] [CrossRef]
  14. Watson, P.; Deller, S. Tourism and economic resilience. Tour. Econ. 2022, 28, 1193–1215. [Google Scholar] [CrossRef]
  15. Yuan, K.; Hu, B.; Li, X.; Niu, T.; Zhang, L. Exploration of coupling effects in the digital economy and eco-economic system resilience in urban areas: Case study of the Beijing-Tianjin-Hebei Urban Agglomeration. Sustainability 2023, 15, 7258. [Google Scholar] [CrossRef]
  16. Wang, C.; Zhang, Y.; Liu, C.; Hu, F.; Zhou, S.; Zhu, J. Emergy-based assessment and suggestions for sustainable development of regional ecological economy: A case study of Anhui province, China. Sustainability 2021, 13, 2988. [Google Scholar] [CrossRef]
  17. Zhang, C.; Wang, C.; Mao, G.; Wang, M.; Hsu, W.-L. An empirical study on the ecological economy of the Huai River in China. Water 2020, 12, 2162. [Google Scholar] [CrossRef]
  18. Lee, C.-C.; Yan, J.; Li, T. Ecological resilience of city clusters in the middle reaches of Yangtze river. J. Clean. Prod. 2024, 443, 141082. [Google Scholar] [CrossRef]
  19. Lu, X.; Zhu, J.; Zhou, M.; Zhang, Y. Is digital economy the driving force for improving the tourism economic resilience? Evidence from China. Environ. Dev. Sustain. 2024, 26, 1–38. [Google Scholar] [CrossRef]
  20. Tang, D.; Zhao, Z.; Li, J.; Boamah, V. Research on coupling coordination degree of digital finance and economic resilience in the Yangtze River Economic Belt. Nat. Hazards 2024, 120, 14279–14309. [Google Scholar] [CrossRef]
  21. Li, G.; Wang, L. Study of regional variations and convergence in ecological resilience of Chinese cities. Ecol. Indic. 2023, 154, 110667. [Google Scholar] [CrossRef]
  22. Sun, J.; Yuan, X.; Liu, G.; Ren, R. The evaluation of wetland reconstruction with nature-based solutions for eco-economic sustainable development. Ecol. Indic. 2024, 160, 111936. [Google Scholar] [CrossRef]
  23. Zhao, Y.; Wu, X. The spatiotemporal relationship between tourism eco-efficiency and economic resilience from coupling perspectives in China. Sustainability 2023, 15, 10039. [Google Scholar] [CrossRef]
  24. Li, W.; Yi, P.; Zhang, D.; Zhou, Y. Assessment of coordinated development between social economy and ecological environment: Case study of resource-based cities in Northeastern China. Sustain. Cities Soc. 2020, 59, 102208. [Google Scholar] [CrossRef]
  25. Valdez-Rojas, C.; Beas-Luna, R.; Lorda, J. Using a social-ecological systems perspective to identify context specific actions to build resilience in small scale fisheries in Mexico. Front. Mar. Sci. 2022, 9, 904859. [Google Scholar] [CrossRef]
  26. Oliveira, B.M.; Boumans, R.; Fath, B.D. Prototype of social-ecological system’s resilience analysis using a dynamic index. Ecol. Indic. 2022, 141, 109113. [Google Scholar] [CrossRef]
  27. Zeng, X.; Yu, Y.; Yang, S. Urban resilience for urban sustainability: Concepts, dimensions, and perspectives. Sustainability 2022, 14, 2481. [Google Scholar] [CrossRef]
  28. Miranti, R.C.; Mendez, C. Social and economic convergence across districts in indonesia: A spatial econometric approach. Bull. Indones. Econ. Stud. 2023, 59, 421–445. [Google Scholar] [CrossRef]
  29. Li, Y.; Xiao, Y. How environmental awareness affects the spatial convergence of urban economic resilience: Evidence from China. Front. Environ. Sci. 2023, 11, 1326701. [Google Scholar] [CrossRef]
  30. Sharma, N.; Tabandeh, A.; Gardoni, P. Regional resilience analysis: A multiscale approach to optimize the resilience of interdependent infrastructure. Comput.-Aided Civ. Infrastruct. Eng. 2020, 35, 1315–1330. [Google Scholar] [CrossRef]
  31. Zhai, X.; Sun, C.; Zou, W.; Hao, S. Spatiotemporal characteristic and evolution of China’s marine economic resilience. Ocean Coast. Manag. 2023, 238, 106562. [Google Scholar] [CrossRef]
  32. He, Y.; Fan, H.; Lei, X.; Wan, J. A runoff probability density prediction method based on B-spline quantile regression and kernel density estimation. Applied Mathematical Modelling. 2021, 93, 852–867. [Google Scholar] [CrossRef]
  33. Yang, Z.; Zhang, S.; Li, F. The spatio-temporal dynamic evolution and variability pattern of urban green resilience in China based on multi-criteria decision-making. Sustainable Cities and Society. 2024, 116, 105887. [Google Scholar] [CrossRef]
  34. Bai, L.; Liang, Y.; Shao, J.; Cheng, Y.; Zhou, Q.; Zhang, J. Moran’s index-based tensor decomposition for eddy current pulsed thermography sequence processing. IEEE Trans. Instrum. Meas. 2021, 70, 1–12. [Google Scholar] [CrossRef]
  35. Herrerias, M.J.; Ordoñez, J. New evidence on the role of regional clusters and convergence in China (1952–2008). China Econ. Rev. 2012, 23, 1120–1133. [Google Scholar] [CrossRef]
  36. Shen, C.; Li, C.; Si, Y. Spatio-temporal autocorrelation measures for nonstationary series: A new temporally detrended spatio-temporal Moran’s index. Phys. Lett. A 2016, 380, 106–116. [Google Scholar] [CrossRef]
  37. Cui, Y.; Khan, S.U.; Deng, Y.; Zhao, M. Spatiotemporal heterogeneity, convergence and its impact factors: Perspective of carbon emission intensity and carbon emission per capita considering carbon sink effect. Environ. Impact Assess. Rev. 2022, 92, 106699. [Google Scholar] [CrossRef]
  38. Fan, D.; Peng, B.; Wu, J.; Zhang, Z. The convergence of total-factor energy efficiency across Chinese cities: A distribution dynamics approach. Struct. Change Econ. Dyn. 2024, 69, 406–416. [Google Scholar] [CrossRef]
  39. Payne, J.E.; Lee, J.; Islam, M.T.; Nazlioglu, S. Stochastic convergence of per capita greenhouse gas emissions: New unit root tests with breaks and a factor structure. Energy Econ. 2022, 113, 106201. [Google Scholar] [CrossRef]
  40. Rong, Y.; Jia, J.; Ju, M.; Chen, C.; Zhou, Y.; Zhong, Y. Multi-perspective analysis of household carbon dioxide emissions from direct energy consumption by the methods of logarithmic mean divisia index and σ convergence in Central China. Sustainability 2021, 13, 9285. [Google Scholar] [CrossRef]
  41. Zhang, P.; Hao, Y. Rethinking China’s environmental target responsibility system: Province-level convergence analysis of pollutant emission intensities in China. J. Clean. Prod. 2020, 242, 118472. [Google Scholar] [CrossRef]
  42. Dun, S.; Xiao, L.; Long, D. Is the New Urbanization Beneficial to Improve the Ecological Civilization Quality in the Western Region? Inq. Into Econ. 2018, 7, 164–173. [Google Scholar]
  43. Min, W.; Jiuli, H. Is Campaign-Style Governance Effective? Civilized City Campaign and Urban Sanitation. J. World Econ. 2022, 45, 212–232. [Google Scholar] [CrossRef]
  44. Que, X.; Huang, J.; Ralph, J.; Zhang, J.; Prabhu, A.; Morrison, S.; Ma, X. Using adjacency matrix to explore remarkable associations in big and small mineral data. Geosci. Front. 2024, 15, 101823. [Google Scholar] [CrossRef]
  45. Su, J.; Wu, H.; Zhang, X. Research on the impact of sand and dust weather on the social-ecological system resilience based on the DPWSIR model—Taking the arid cities of Northwest China as an example. Ecol. Indic. 2024, 166, 112314. [Google Scholar] [CrossRef]
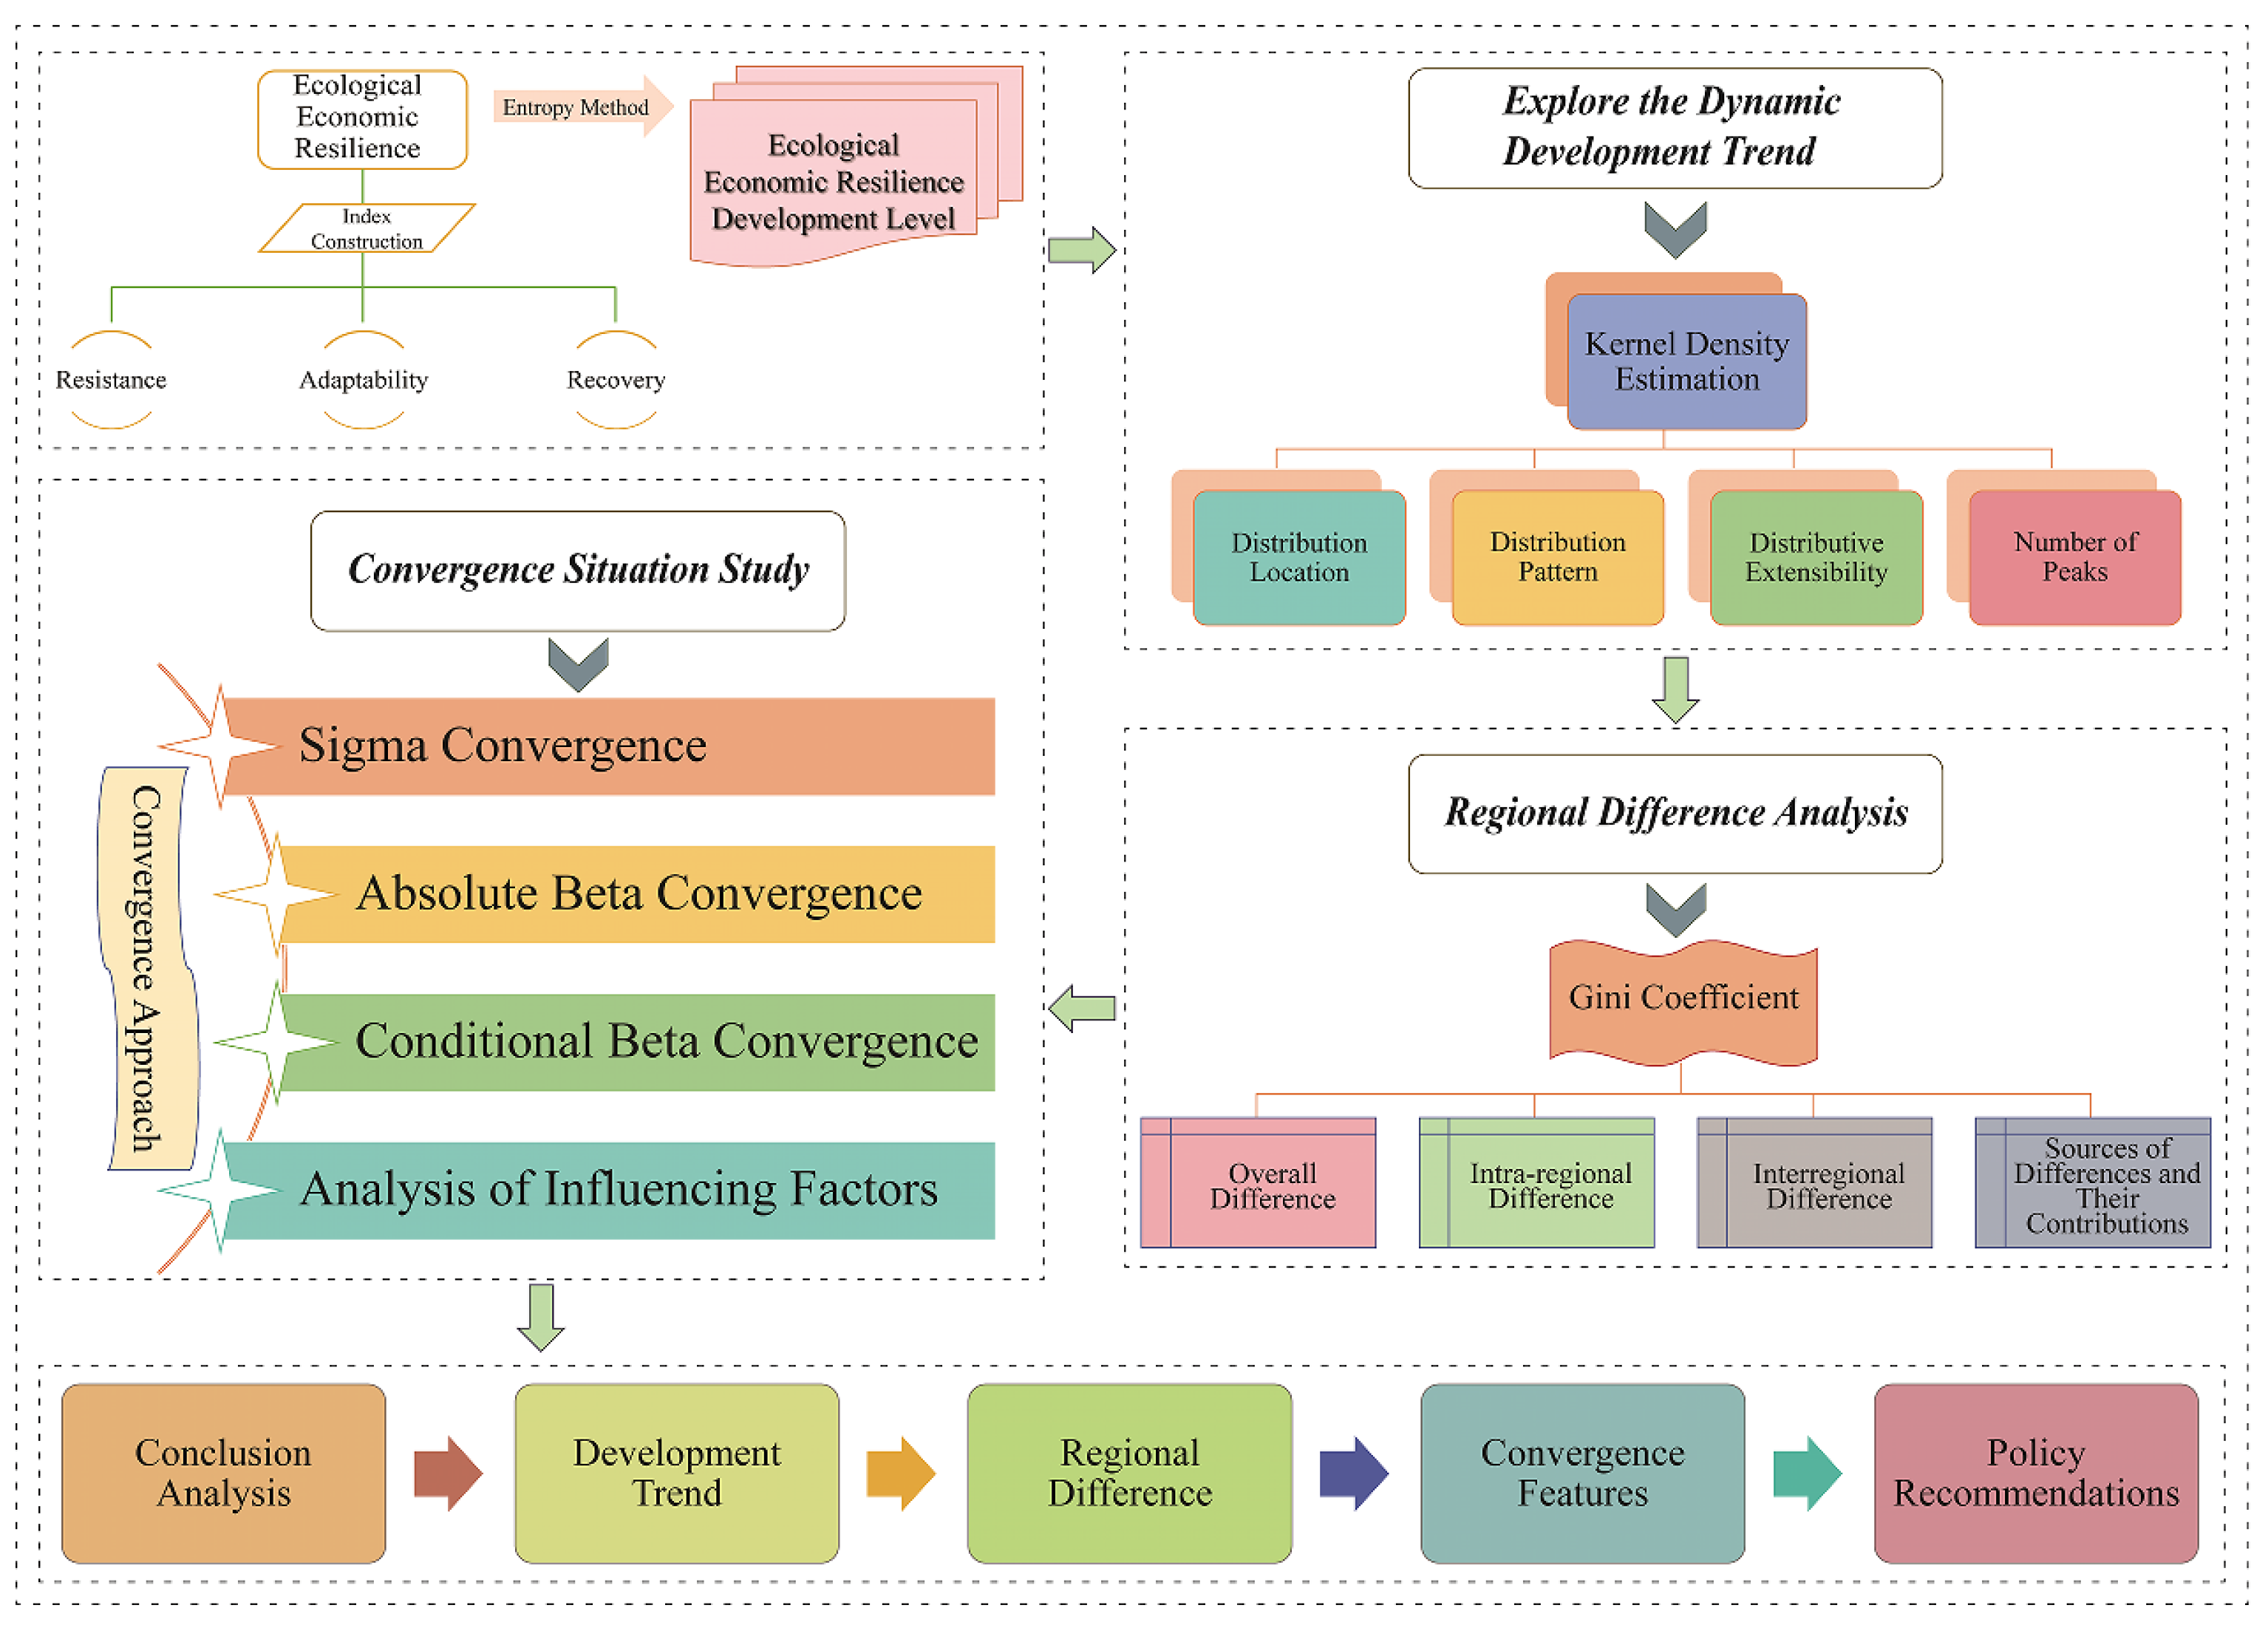
Figure 1. Flowchart of the EER framework.
Systems 13 00666 g001
Figure 2. Dynamic evolution of EER.
Systems 13 00666 g002
Figure 3. Variation in intra-group differences in EER.
Systems 13 00666 g003
Figure 4. Trends in regional differences in EER.
Systems 13 00666 g004
Figure 5. Sources and contribution rates of differences in EER.
Systems 13 00666 g005
Figure 6. Moran cluster analysis of EER.
Systems 13 00666 g006
Figure 7. EER σ convergence.
Systems 13 00666 g007
Figure 8. Model suitability test.
Systems 13 00666 g008
Table 1. Evaluation system for EER indicators.
Dimensional DesignationsNuclear FactorsFundamental Indicators
ResistanceSocial DevelopmentProportion of Land Area in Built-up Areas
Total Volume of Urban Water Supply
Population Density
Total Industrial Output Above Designated Size
Pollutant EmissionsIndustrial Wastewater Discharge (10,000 tons)
Industrial Sulfur Dioxide Emission (metric tons)
Industrial Smoke and Dust Emission (metric tons)
Industrial Nitrogen Oxides Emission (metric tons)
AdaptabilityEconomic StrengthPer Capita GDP
The Advanced Transformation of Industrial Structure (Proportion of the Added Value of the Tertiary Industry in GDP (%))
Local General Budgetary Revenue in Fiscal Affairs
Environmental Protection InvestmentUrban Construction and Maintenance Expenditure
Investment in Landscape Gardening
Investment in Cityscape and Sanitation
Investment in Sewerage and Waste Disposal
Governance EfficiencyComprehensive Utilization Rate (%) of General Industrial Solid Waste
Sanitary Treatment Rate (%) of Domestic Waste
Sewage Treatment Rate (%)
Environmental QualityPM2.5
recoverabilityInnovation-Driven DevelopmentThe Proportion of Education and Science Expenditures in Public Budget Expenditure
The Place-Occupying Ratio of Information Transmission, Computer Services, and Software Industry Practitioners in Total Employment
The Number of Granted Green Patents
Ecological RestorationPer Capita Road Area
Per Capita Green Space in Parks
Urban Green Space Coverage Rate in Built-up Areas
Table 2. Absolute β convergence in EER.
RegionNationwideNortheastEasternCentralWestern
ModelSDMSARSDMSARSDM
β −0.2509 ***
(0.0086)
−0.3420 ***
(0.0265)
−0.2649 ***
(0.0164)
−0.3252 ***
(0.0155)
−0.1751 ***
(0.0164)
γ 0.1251 ***
(0.0128)
0.0863 ***
(0.0233)
0.0369 *
(0.0215)
ρ   Or   λ 0.0478 **
(0.0195)
−0.1433 **
(0.0562)
0.0105
(0.0357)
−0.0550
(0.0401)
0.0396
(0.0293)
ν 0.01600.02330.01710.02190.0107
Time effectYesYesYesYesYes
Individual effectYesYesYesYesYes
R 2 0.10210.23300.06660.07060.0392
Note: Values in parentheses are standard deviations, * indicates significance at the 10% level, ** at the 5% level, and *** at the 1% level.
Table 3. Conditions for β convergence in EER.
RegionNationwideNortheastEasternCentralWestern
ModelSDMSDMSDMSDMSDM
β −0.3318 ***
(0.0092)
−0.4561 ***
(0.0290)
−0.3650 ***
(0.0167)
−0.4524 ***
(0.0176)
−0.2597 ***
(0.0172)
γ 0.1256 ***
(0.0154)
0.0730
(0.0676)
0.1229 ***
(0.0264)
0.0368 ***
(0.0408)
0.0145
(0.0257)
ρ   Or   λ 0.0394 **
(0.0196)
−0.0830
(0.0610)
0.0433
(0.0355)
−0.0709 *
(0.0429)
0.0320
(0.0295)
LED0.0661 ***
(0.0108)
0.1120 ***
(0.0351)
0.0537 ***
(0.0189)
0.1162 ***
(0.0235)
0.0449 **
(0.0186)
IS−0.0304 **
(0.0140)
−0.0315
(0.0342)
−0.0790 ***
(0.0287)
−0.0573
(0.0365)
0.0027
(0.0223)
UCE0.0116 ***
(0.0009)
0.0058 *
0.0033)
0.0118 ***
(0.0014)
0.0139 ***
(0.0016)
0.0129 ***
(0.0017)
UWSS0.0679 ***
(0.0049)
0.1288 ***
(0.0171)
0.1475 ***
(0.0113)
0.0911 ***
(0.0111)
0.0268 ***
(0.0070)
ITER0.0048 ***
(0.0007)
0.0034
(0.0025)
0.0014
(−0.0176)
0.0032 ***
(0.0011)
0.0120 ***
(0.0016)
ν 0.02240.03380.02520.03350.0167
Time effectYesYesYesYesYes
Individual effectYesYesYesYesYes
R 2 0.20490.26680.23040.35230.1577
Note: Values in parentheses are standard deviations, * indicates significance at the 10% level, ** at the 5% level, and *** at the 1% level.
Disclaimer/Publisher’s Note: The statements, opinions and data contained in all publications are solely those of the individual author(s) and contributor(s) and not of MDPI and/or the editor(s). MDPI and/or the editor(s) disclaim responsibility for any injury to people or property resulting from any ideas, methods, instructions or products referred to in the content.