1. Introduction
In this article, a methodical study was conducted that attempted to offer a strong and pertinent basis, focusing on the automation of logistical procedures that are most commonly used in supply chain management in Lithuania. This study highlighted three key supply chain management technologies: automated guided vehicles, robotic arms, and autonomous mobile robots. More research is still needed to fully comprehend how automation has affected logistics and how it has evolved. According to a previous assessment [
1], robotics and artificial intelligence (AI) have the potential to increase the operational efficiency of logistics while reducing errors, facilitating quicker and more reliable product delivery to customers. In addition to providing cloud solutions for tracking and monitoring these products, such logistical advancements would help manufacturers by making it simpler, faster, and potentially less expensive to transfer their goods to other markets [
2]. The aim of this article was to evaluate the conditions for increasing the level of automation in logistics processes using the example of Lithuanian companies. Over the past century, warehouse automation has experienced a remarkable transformation driven by the goal of operational efficiency, shifting consumer needs, and technology advancements. The invention of mechanical conveyor systems and forklifts in the early 20th century, which transformed material handling and storage procedures in warehouses, is where warehouse automation originated [
3].
With the introduction of barcode scanning technology and automated storage and retrieval systems (AS/RSs) in the mid-1900s, the development of computer technology opened the door for additional warehouse automation. These developments laid the groundwork for contemporary warehouse automation systems by enabling warehouses to enhance inventory management, maximize space usage, and boost throughput. More complex warehouse automation solutions, such as automated guided vehicles (AGVs), robotic palletizers, and conveyor systems with built-in sorting capabilities, were developed in the late 20th century as a result of developments in robotics, sensors, and control systems. Warehouses were able to increase automation, save on labor expenses, and boost operational efficiency thanks to these innovations.
This scientific study was conducted in four stages: (1) determination of the criteria; (2) selection of a multi-criteria method; (3) determination of the significance of the selected criteria; and (4) results.
The structure of this article comprises explaining the development of warehouse automation processes and the application of artificial intelligence, the analysis of key AI drivers and obstacles in AI-powered warehouse automation, and review of the Lithuanian logistics sector.
2. Development of Warehouse Automation Processes and Application of Artificial Intelligence
Warehouse automation has been significantly impacted by the emergence of Industry 4.0 technologies, which are defined by the application of digital technologies into manufacturing and logistical activities. Big data analytics, cloud computing, and the Internet of Things (IoT) are examples of Industry 4.0 technologies that have made warehouses more intelligent, networked, and adaptable to shifting market conditions [
4,
5]. The next stage of warehouse automation process development is the use of artificial intelligence (AI), which allows warehouses to become more autonomous, efficient, and flexible. Warehouses can automate complicated activities, make data-driven choices, and optimize operations in real time thanks to AI technologies including machine learning, computer vision, and natural language processing. Warehouses can estimate demand, improve inventory levels, and automate replenishment procedures by using machine learning algorithms to examine past data and find patterns and trends. Over time, these algorithms’ accuracy and efficacy increase as they continuously learn from fresh data. Warehouses can identify products, automate visual inspection chores, and precisely track inventory movements with the help of computer vision systems [
6]. Robotics and automation technologies driven by AI improve warehouse operations’ efficiency and adaptability, allowing warehouses to easily manage a variety of items, packaging types, and order profiles. Through chatbots, virtual assistants, and voice-enabled interfaces, natural language processing technologies allow warehouses to communicate with employees, clients, and suppliers. In warehouse operations, these technologies promote teamwork, expedite communication, and improve the user experience in general.
With its advanced tools and algorithms to optimize inventory levels, streamline operations, and boost overall productivity, AI is playing a crucial role in transforming inventory management methods in warehouses [
7]. Demand forecasting is one of the main uses of AI in inventory management. AI systems can precisely forecast future product demand by examining past sales data, industry trends, and outside variables like weather and economic indicators. With the help of these projections, warehouses may proactively modify inventory levels, eliminate stockouts, and streamline replenishment cycles, all of which enhance customer satisfaction and lower carrying costs.
3. Key AI Drivers in AI-Powered Warehouse Automation Processes
As the importance of e-commerce grows, supply chain responses are also changing in the form of solutions used in modern warehouses. With the tremendous growth of smartphones and smart gadgets, the retail business has undergone a disruptive change. Here, automation helps satisfy the needs of “e-retailers”, or internet retailers. In order to lower shipping costs and maintain their competitiveness in the online market, online retailers are currently implementing various types of automation in their warehouses to enhance product mobility for effective order fulfillment and storage and to lower the number of defective return pickups. Warehouse automation is now based on the application of robotics and other IT-supported technologies. Process automation and physical automation are the two main categories of warehouse automation. Process automation, sometimes referred to as system automation, is the digitization of manual procedures such as gathering inventory data and integrating that data with the company’s database or Enterprise Resourse Planning (ERP) system. The use of wireless barcode scanners and the barcoding ecosystem, which are utilized for tracking and entering item data, are examples of process automation. This information is subsequently disseminated and stored in the organization’s central database, where it can be utilized in all functional domains, including marketing, logistics, and manufacturing. Any type of mechanized technology or automation-related machinery is considered physical automation. It includes the employment of robotic devices and robots in the warehouse. When compared to process automation, the technologies employed in physical automation are far more costly to implement. Physical automation technologies include automated guided vehicles (AGVs), goods-to-person (G2P) technology, and autonomous mobile robots (AMRs). One aspect of process automation is barcode labeling. The use of printed paper, specialized scanners, and IT-based applications constitute the most fundamental level of automation. Barcode labeling is the least expensive and most straightforward of the several warehouse automation systems. After being barcode-labeled, the products are traced at several supply chain locations using scanners. Use of these labels facilitates accurate data and product entry into the system, which is used for warehouse management in particular [
8]. According to research, “59% of IT and operations personnel in manufacturing, retail, transportation, and wholesale market segments planned to expand process automation between 2017 and 2022” [
9]. Warehouse automation is the use of different IT-based technologies that make warehouse labor much more efficient and rapid so that more can be achieved with considerably less work. Every day, stores have to deal with more and more package deliveries and internet orders. E-retailers need automation to help them handle a lot of orders at cheap prices. Without automation, it is hard to make sure orders are delivered on time.
Thus, e-commerce companies can meet high logistics demands without incurring large maintenance costs by implementing automation in warehouses and distribution [
8]. E-retailers have a variety of technological choices to select from when it comes to warehouse management. Globally, e-commerce is expanding quickly, which is drastically altering the retail environment. Due to the evolving demands of their customers, manufacturers, distributors, retailers, and logistics service providers must adapt their backend fulfillment and warehousing operations in order to fulfill consumer orders. In addition to being a backend function, the warehouse is essential to supply chain management. Any problems with a warehouse’s operations might cause delays and have an effect on the company’s cash flow and customer satisfaction. Effective warehouse management can boost productivity, boost performance, and aid in the expansion of the business. Automation is therefore useful for enhancing warehouse management.
“There was not enough technology to perform the tasks of carrying and handling a wide array of various shapes when logistic and e-commerce companies first considered using robots to carry out their business practices” [
10]. E-commerce companies can profit from warehouse automation in a number of ways, including meeting faster fulfillment expectations and delivering orders quickly and nimbly to cut down on avoidable mistakes and operating expenses; cut down on overhead costs; lower the expenses for personnel, equipment, maintenance, and safety; and lower the expenses for energy use and storage space.
Process automation and physical automation are the two main categories of warehouse automation. Process automation, sometimes referred to as system automation, is the digitization of manual procedures such as gathering inventory data and integrating that data with the company’s database or ERP system. Process automation includes the use of wireless barcode scanners and the barcoding ecosystem, which are used to track and input item data [
11]. This information is subsequently disseminated and stored in the organization’s central database, where it can be utilized in all functional domains, including marketing, logistics, and manufacturing.
Any type of mechanized technology or automation-related machinery is considered physical automation. It includes the employment of robotic devices and robots in the warehouse. When compared to process automation, the technologies employed in physical automation are far more costly to implement. Physical automation technologies include automated guided vehicles (AGVs), goods-to-person (G2P) technology, and autonomous mobile robots (AMRs). A component of process automation is barcode labeling [
11]. It is the simplest degree of automation and includes the use of IT-based programs, certain scanners, and printed paper. Barcode labeling is the least expensive and most straightforward of the several warehouse automation systems. After being barcode-labeled, the products are traced at several supply chain locations using scanners.
The most recent trends use state-of-the-art technologies to enhance decision-making, streamline procedures, and adjust to changing warehouse conditions.
Edge computing reduces the requirement for data transfer to centralized servers by bringing processing power closer to the location of data production. Without requiring a continuous connection to the cloud, edge computing devices mounted on machinery like robots and sensors can process data locally in warehouse systems. This lowers data processing latency, allowing for quicker reaction times and increasing warehouse operations’ overall effectiveness [
12]. Warehouse systems can make choices in real time using the most recent data from sensors, cameras, and other IoT devices by processing data locally at the edge [
13].
4. Review of the Logistics Industry of Lithuania
Lithuania’s economy expanded quickly after joining the EU, which benefited the country’s logistics industry. Connecting the markets of Western Europe and Scandinavia with Russia and other CIS nations, Lithuania is a part of Europe’s transportation corridors. The Schengen area borders Poland and Latvia, facilitating the free movement of goods and people. Although the Port of Klaipėda is one of the few significant ice-free ports in the area and has grown to be a well-liked cruise port in the Baltic Sea, transportation is primarily handled by train and road. Lithuania also has four international airports. A sizeable portion of the nation’s GDP is generated by the steady and expanding transportation sector [
14]. The Lithuanian market has grown by 2.9% annually since 2000. Lithuania’s transportation revenue in 2023 ranked 13th in the world, although Slovakia’s revenue was higher. In this area, the top three nations were France, Italy, and Spain, who came in second, third, and fourth, respectively [
15]. According to the State Data Agency, the Lithuanian logistics industry saw a 10.3% rise in freight traffic in 2024 over the year before. When oil pipeline transportation is excluded, the amount of freight transported rose by 11% to 181.6 million tons. Road transport accounted for 75.9% of the total volume, providing the majority of transportation. Tractor-based transportation rose 14.5%, and 137.9 million tons of freight were handled. This suggests that road transportation is becoming more and more important to the nation’s logistics network. At the same time, there was a drop in rail transportation, with 25.7 million tons of freight handled, a 5.8% fall. Changes in logistics processes and the redirection of some freight to alternative modes of transportation could be the cause of this. The biggest percentage of services imported and exported (44.9% and 44.0%, respectively) were transportation services [
16]. The balance of road transport services had the biggest surplus (EUR 1.2 billion) during the reviewed period, while the balance of sea freight transport services had the greatest deficit (EUR 129.4 million).
Service exports to EU Member States increased by 8.2% year over year in the fourth quarter of 2024 and made up 73.3% of all service exports, a decrease of 2.1 percentage points across the entire service export structure. The largest portion of all service exports to Germany was made up of transportation services (62.2%) and other business services (10.7%) [
16]. A number of significant occurrences and developments occurred in Lithuania’s logistics industry during the first half of 2024 [
17]:
Growth in Road Freight Transport: Lithuanian road freight carriers saw an increase in cargo volumes in spite of economic difficulties. The first half of the year saw the transportation of almost 35 million tons of goods, demonstrating steady sector development.
Infrastructure Development: In order to enhance logistics flows and shorten travel times, road and rail infrastructure development projects persisted. The “Rail Baltica” project, which intends to link the Baltic States with Western Europe, received particular interest.
Technology Integration: In an effort to boost productivity and cut expenses, numerous logistics firms started putting new technologies into place, such as automated warehouses and intelligent transport management systems.
Effect of EU Sanctions: The logistics industry was significantly impacted by the EU sanctions imposed on Russia and Belarus, which complicated international transportation and decreased the flow of commodities. As a result, businesses had to look for new markets and routes.
Labor Market Issues: There was a labor scarcity in the transportation and logistics industry, particularly for skilled drivers and logistics experts. This prompted businesses to enhance working conditions and make training investments for their staff.
Sustainability Initiatives: To cut carbon emissions and switch to greener transportation options, several businesses began putting sustainability initiatives into place. This includes using alternate fuels and electric trucks.
These elements suggest that Lithuania’s logistics industry is still expanding and adjusting to shifting consumer demands and technology advancements. The logistics industry in Lithuania is actively looking for methods to lessen its impact on the environment and support sustainability objectives.
5. Research Methodology
Due to the changing market and customer needs, logistics service providers are adapting to technological changes that affect the quality of service and the productivity of the company. In order to achieve the automation of logistics processes, a study is required, which will be conducted in stages. In the first stage, preparations are made for the study by choosing a method. In the second stage, a survey and data processing are carried out. In the third stage, the results are summarized. The expert assessment provides an opportunity to process statistical material, assess the dependence of one criterion on another, and show their interaction [
18]. The automation of logistics processes is important for Lithuanian transport companies; therefore, one applied method does not fully reflect the results of the research. The arithmetic, geometric mean, weighted sums (SAW—Simple Additive Weighting), and expert ranking data evaluation and processing methods were selected for this study. SAW was chosen because Çalık [
19] indicated that when comparing multi-criteria methods, the SAW method allows for a more accurate assessment of the results. The concordance coefficient is used in the assessment of multi-criteria methods. If the value of the concordance coefficient is close to unity, then the expert assessments are consistent and the concordance of the expert assessments is considered sufficient. If the assessments differ significantly and the value is close to zero, then it is appropriate to conduct a re-assessment.
The geometric mean is calculated according to Formula (1).
where
—geometric mean,
—expert assessment of the relevant alternative,
—alternative coefficient,
n—number of alternatives,
j—alternative sequence number, and
i—expert serial number. The geometric mean is used to calculate variables that are presented as percentages or indices. Compared to other calculation methods, its advantage is that it is less sensitive to extreme values. But, the disadvantage is that when using calculations with larger numbers, the geometric mean is less weighted than, for example, the arithmetic mean.
The arithmetic mean method is performed by selecting the weights
for each criterion and calculating them according to Formula (2).
where
—arithmetic mean,
—alternative coefficient,
n—number of alternatives,
—expert assessment of the relevant alternative,
j—alternative sequence number, and
i—expert serial number.
The estimates of the weighted sum method are calculated by summing the normalized estimates of each alternative and multiplying by the weight of that alternative, or equal weights can be chosen using Formula (3) (
, where
n is the number of criteria).
where
—weighted sum,
—expert assessment of the relevant alternative,
—alternative coefficient,
n—number of alternatives,
j—alternative sequence number, and
i—expert serial number.
Multicriteria analysis methods are used to predict decisions. Such methods provide an opportunity to classify indicators according to expert opinion [
20]. The perception and assessment of criteria by different experts differ, which means that the weights of the obtained criteria and their priorities may differ [
21]. In order to ensure the quality and reliability of expert research, an expert group is formed, which consists of more than 2 but no more than 10 experts [
22,
23].
During the evaluation of expert ranking data, a table is created in which a group of experts
n quantitatively evaluates objects
m. Based on the multi-criteria evaluation method, the evaluations form a matrix of
n rows and
m columns and are presented in a table [
24]. The evaluation can be performed in units of indicators, fractions of units, percentages, or decimals. Expert ranking of indicators is suitable for calculating the concordance coefficient. According to Podvezko [
25], the average of the sums of ranks is calculated as follows:
where
Rij—
R rank,
m—number of benchmarks, and
n—number of experts. Concordance coefficient
W is calculated as follows:
where
S—sum of squares of the arithmetic mean,
n—number of experts, and
m—number of benchmarks.
The application of selected methods allows for easy comparison of selected criteria.
In order to obtain more accurate reliability of the result, it is possible to compare and correlate the results obtained by different methods. Therefore, polynomial methods for evaluating expert rating data were chosen. Polynomial choice models are used when there are three or more choice options. Regression analysis is used as a tool to study the relationship between two variables [
26]. The closer
R2 is to 1, the stronger the correlation between the variables under study.
6. Results and Discussion
This study was conducted in 2025 from April to May. Eight experts working in the field of logistics and teaching logistics processes participated in this study. All experts have a higher university education. The experts were given two questionnaires: in one, the evaluation criteria were written down and processed using the arithmetic, geometric mean, and SAW methods; in the other, the experts were asked to rank the criteria, and the ranking of expert indicators was applied for processing.
Using the geometric mean, arithmetic mean, and weighted sum (SAW—Simple Additive Weighting) methods, experts assessed the problem area separately in the questionnaire, indicating its importance from 1 (not at all important) to 8 (very important).
RVB1—Speeds up order fulfillment;
RVB2—Speeds up and makes delivery more flexible;
RVB3—Reduces errors;
RVB4—Reduces operating costs;
RVB5—Reduces overhead costs;
RVB6—Reduces the need for personnel;
RVB7—Reduces storage space costs;
RVB8—Reduces energy use.
Normalization was performed on the sum of the total estimates, but this did not affect the final result. The results are presented in
Table 1.
The use of advanced technologies in logistics processes improves decision-making and simplifies logistics procedures.
The analysis of the results of the evaluation of the automation criteria of the geometric (GV), arithmetic (AV), and weighted sum (SAW) methods is presented in
Table 2.
Summarizing the results of the expert assessment, we can distinguish the most important criteria that influence logistics cooperation and service quality during automation: reduces energy consumption and speeds up order fulfillment.
Experts were asked to identify the missing management technology measures in logistics processes, indicating their importance from 1 (not at all important) to 7 (very important).
PVT1—Collection and transfer of inventory data to ERP systems;
PVT2—Data integration into company databases;
PVT3—Digitization;
PVT4—Wireless barcode scanner ecosystems;
PVT5—Automated guided vehicles (AGVs);
PVT6—Goods-to-person (G2P) technology;
PVT7—Autonomous mobile robots (AMRs).
The results obtained are presented in
Table 3. Experts identified the missing automation tools in logistics processes, namely autonomous mobile robots (AMRs) and automated guided vehicles (AGVs).
The consistency of expert assessments, which affects the assessment results, is 0.168. The result shows that the opinions of experts are consistent.
Summarizing the expert assessments, it can be stated that automation in logistics processes is important and must be adapted to logistics processes and functions. In the second questionnaire, experts were asked to rank control technologies (automation) by indicating their importance from 1 (very important) to 8 (not at all important). That is, an attempt was made to present a different assessment prism than when applying the geometric mean, arithmetic, and weighted sum methods.
The distribution of expert ranks is presented in
Figure 1.
The distribution of the obtained criteria ranking data is presented in
Table 4.
Calculated (Equation (6)) concordance coefficient:
Automation (control technologies) is important in logistics collaboration processes. To obtain a random variable, the concordance coefficient is calculated (Equation (7)).
The
value is 51.25 higher than the critical value (14.0671). The result shows that the experts’ opinions are in agreement, and the average ranks indicate the general opinion of the experts [
27]. The minimum concordance value is calculated (Equation (8)).
The obtained result
Wmin = 0.2511 < 0.915 shows that the experts’ opinions are consistent. The importance indicators
Qj are calculated. The obtained results with the criteria and order of importance are presented in
Table 5.
Based on expert assessments and data, important automation (control technology) criteria in logistics cooperation processes are presented in the following order:
RVB8—Reduces energy use;
RVB1—Speeds up order fulfillment;
RVB3—Reduces errors;
RVB2—Speeds up and makes delivery more flexible;
RVB4—Reduces operating costs;
RVB5—Reduces overhead costs;
RVB6—Reduces the need for personnel;
RVB7—Reduces storage space costs.
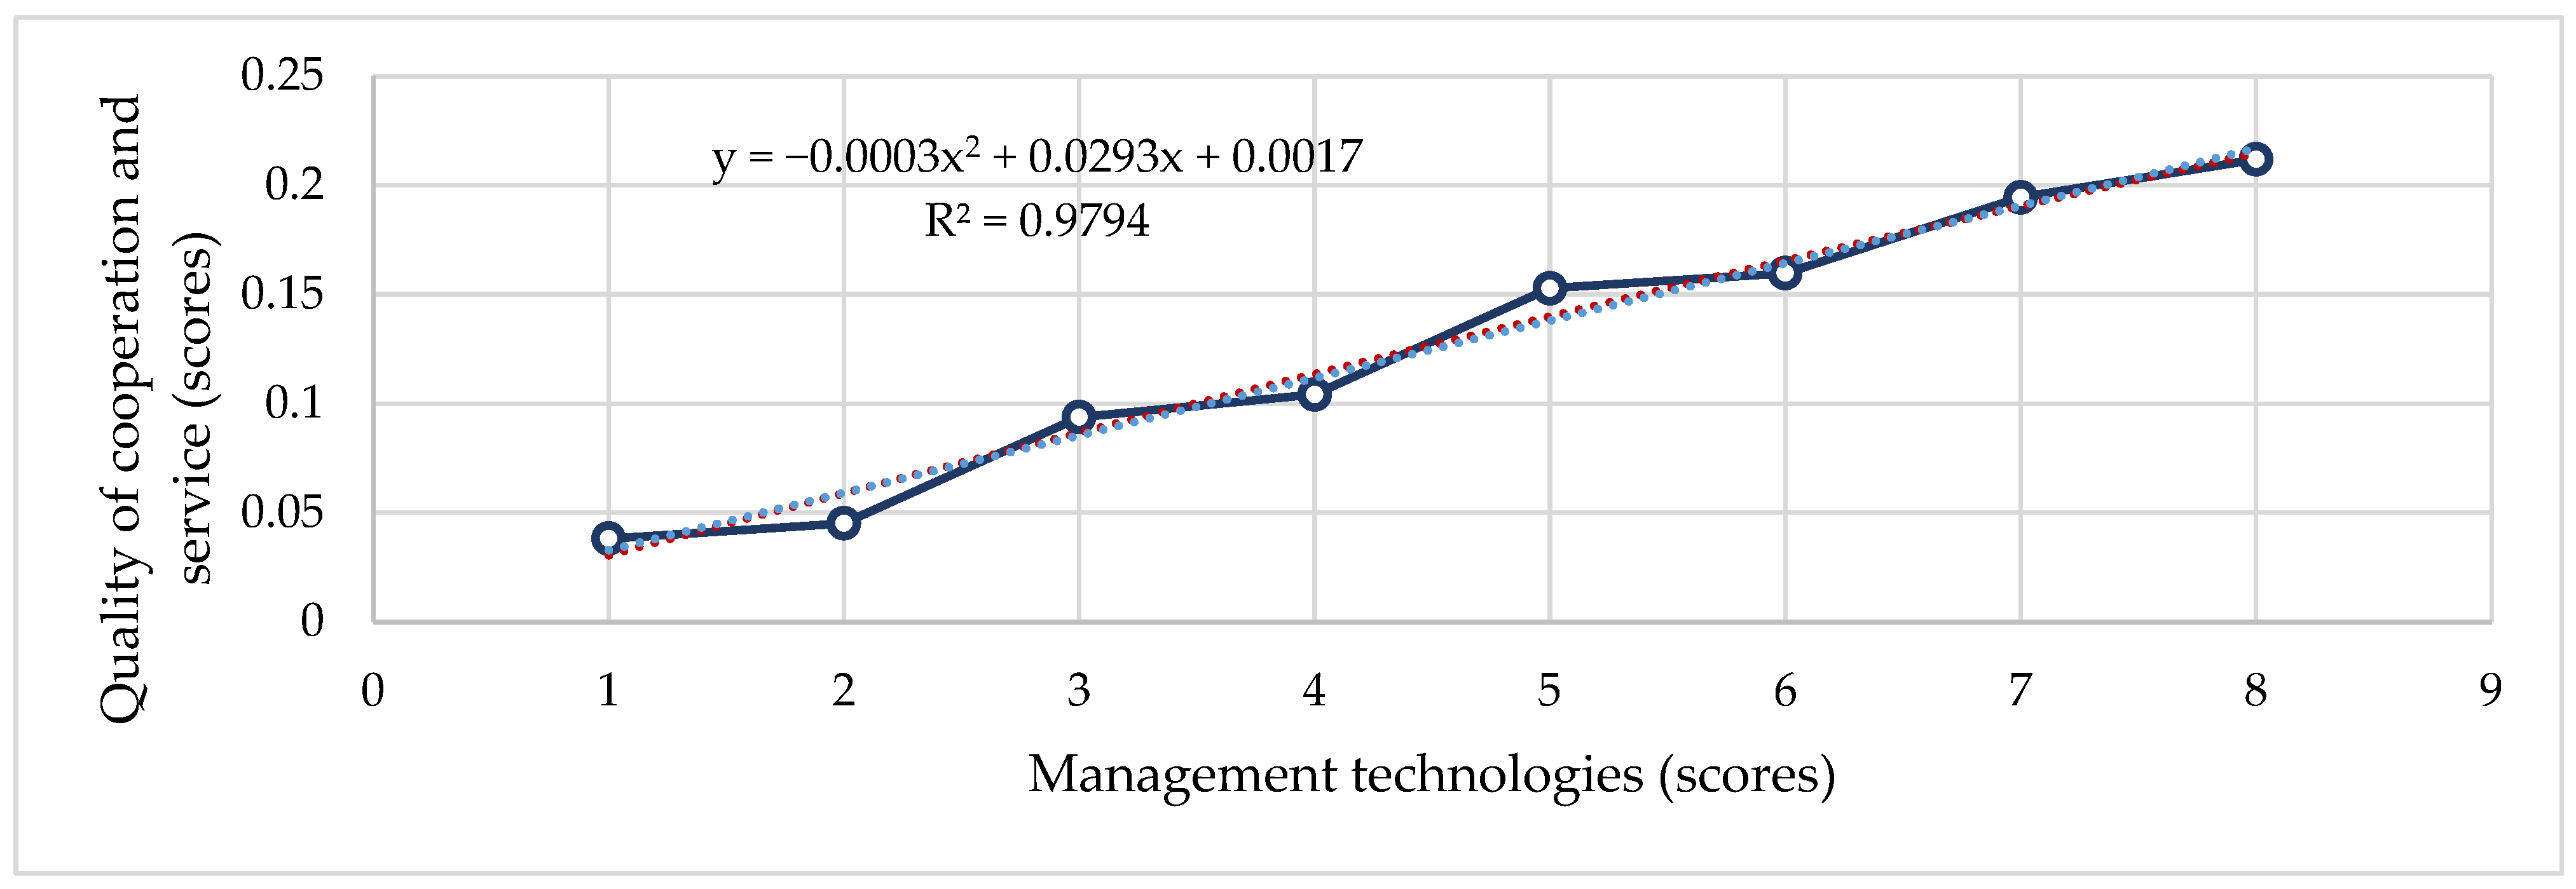
The impact of control technologies (automation) on logistical cooperation and quality of care is presented in
Figure 2.
The estimates of the second-order polynomial criteria show (
Figure 2) that the development of management technologies increases the quality of services. In this case, there is a strong correlation
R2 = 0.9794.
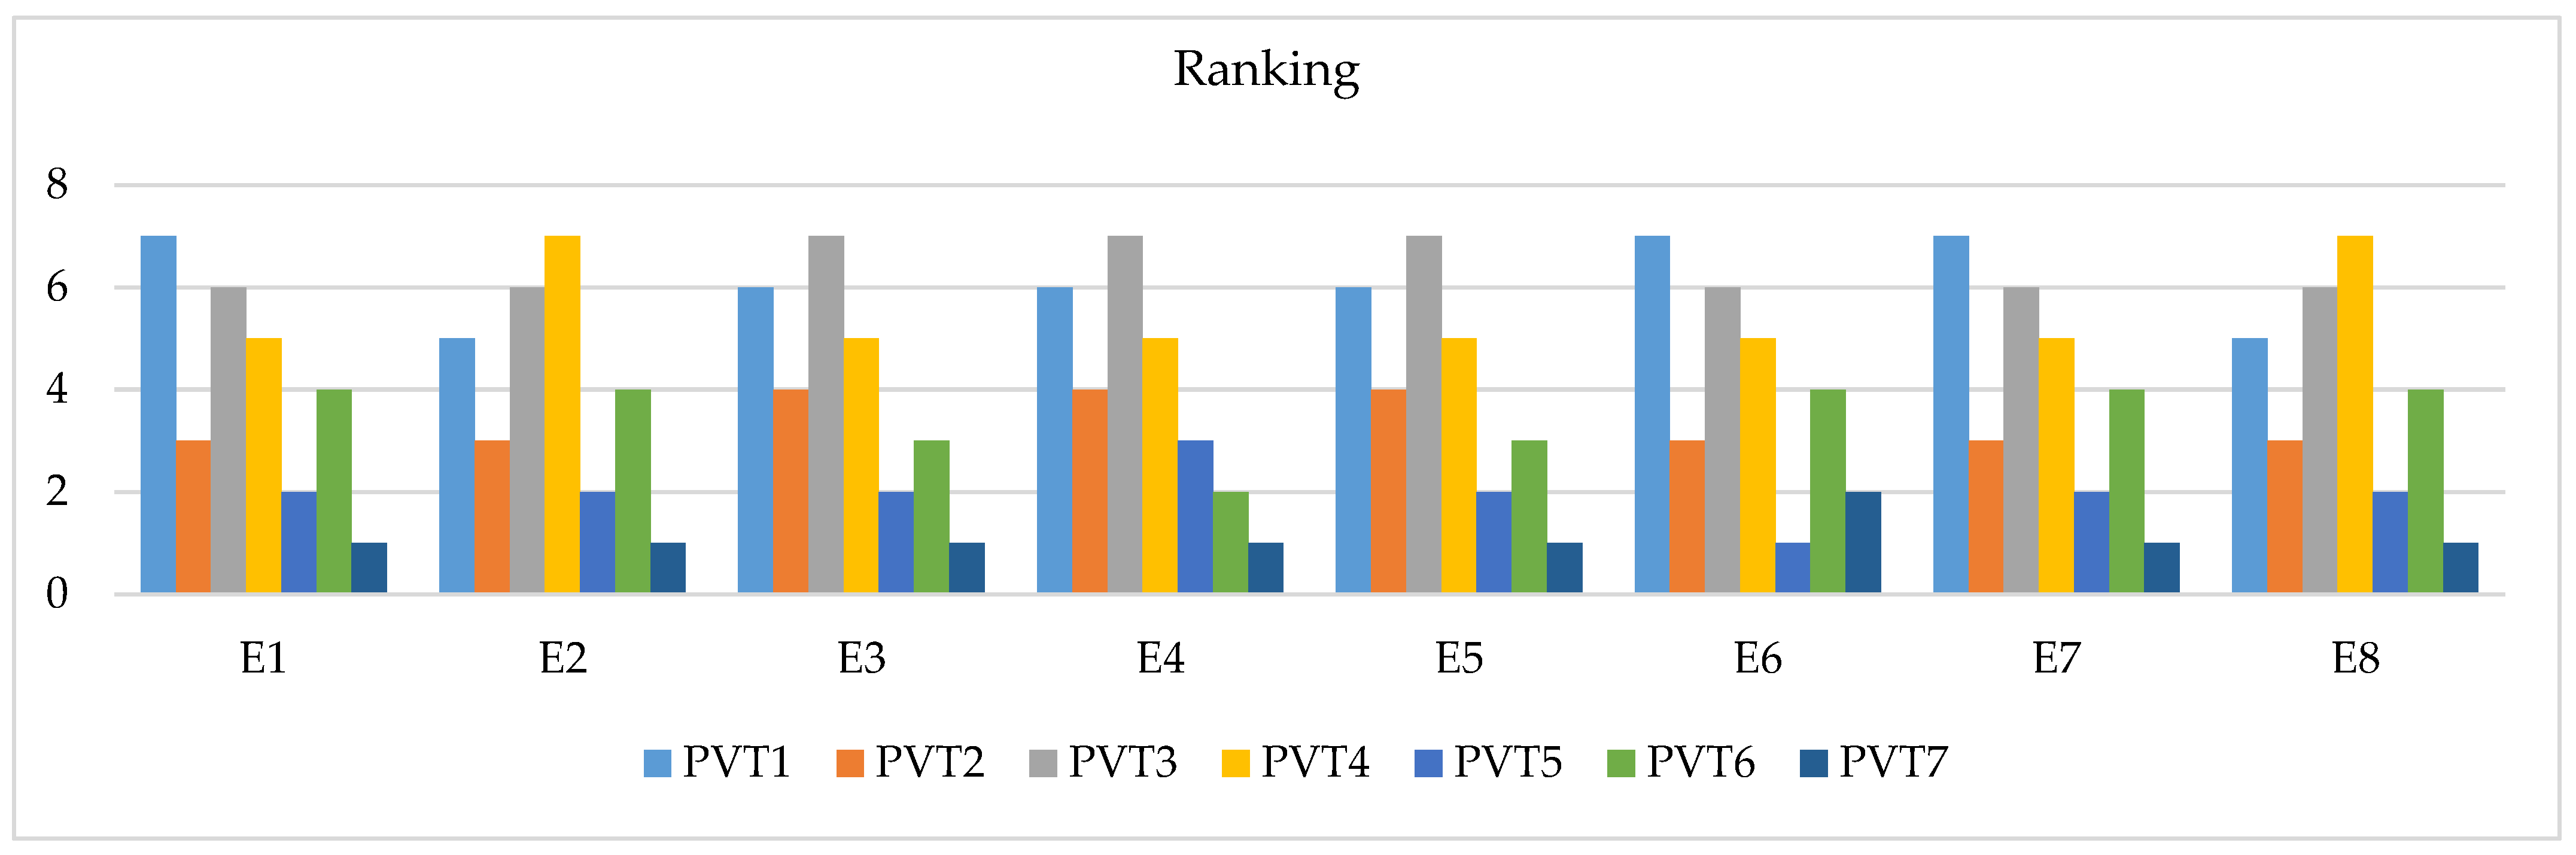
Experts were asked to rank, indicating in order of importance from 1 (very important) to 7 (not at all important), the criteria of management technology tools missing in logistics processes, which are most lacking when it comes to improving logistical cooperation and service quality. The distribution of the obtained expert ranks is presented in
Figure 3.
The distribution of the obtained criteria ranking data is presented in
Table 6.
Calculated (Equation (9)) concordance coefficient:
Automation (control technologies) is important in logistics collaboration processes. To obtain a random variable, the concordance coefficient is calculated (Equation (10)).
The
value is 43.39 higher than the critical value (12.5916). The result shows that the experts’ opinions are in agreement, and the average ranks indicate the general opinion of the experts [
22]. The minimum concordance value is calculated (Equation (11)).
The obtained result
Wmin = 0.2623 < 0.904 shows that the experts’ opinions are consistent. The importance indicators
Qj are calculated. The obtained results with the criteria and order of importance are presented in
Table 7.
Based on expert assessments and data, the criteria for the importance of the lack of management technologies in logistics cooperation processes are presented in the following order:
PVT7—Autonomous mobile robots (AMRs);
PVT5—Automated guided vehicles (AGVs);
PVT2—Data integration into company databases;
PVT6—Goods-to-person (G2P) technology;
PVT4—Wireless barcode scanner ecosystems;
PVT1—Collection and transfer of inventory data to ERP systems;
PVT3—Digitization.
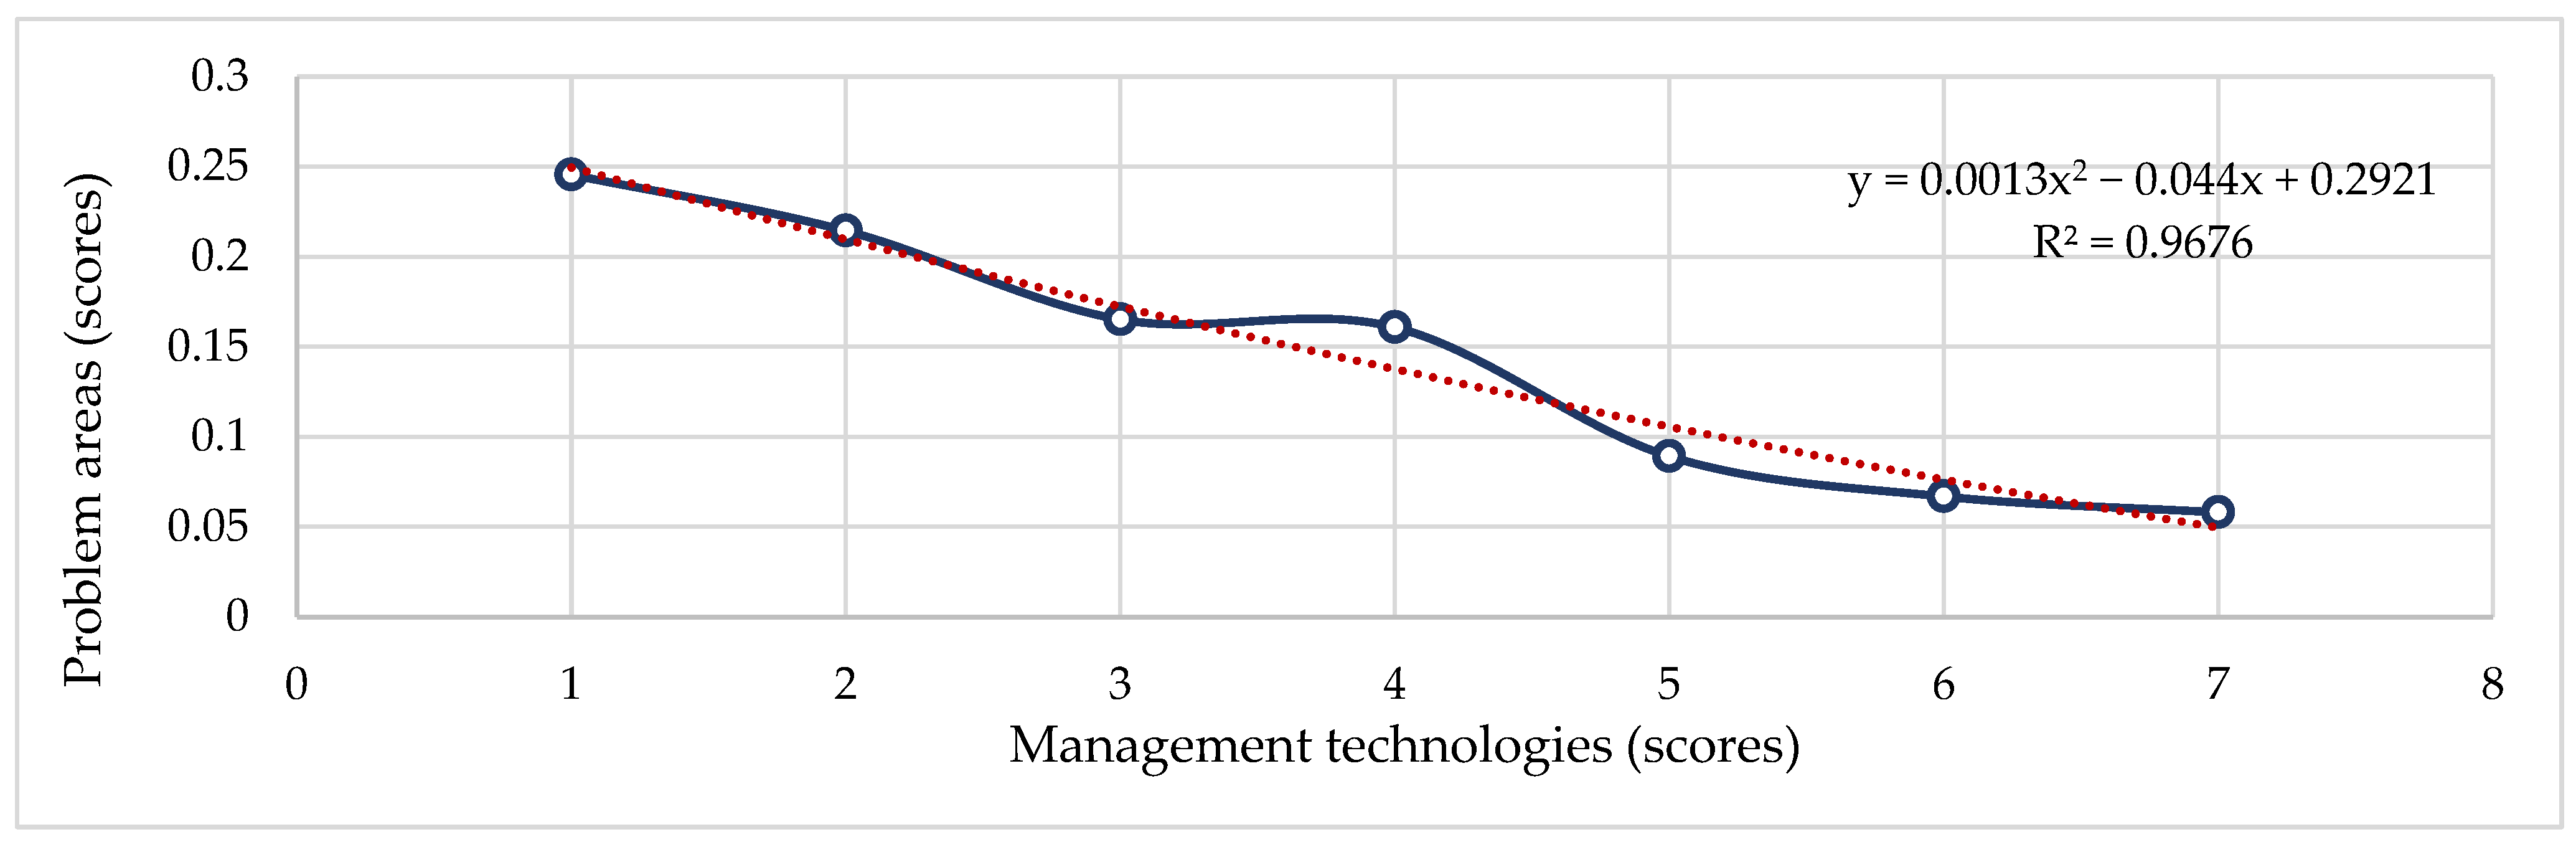
The impact of the development of control technologies (automation) on the solution of problem areas is presented in
Figure 4.
The estimates of the second-order polynomial criteria show (
Figure 4) that the development of control technologies reduces the occurrence of problems in logistics processes.
In summary, it can be stated that the automation of logistics processes (development of control technologies) can be performed by applying autonomous mobile robots (AMRs) and automatically guided vehicles (AGVs) and by performing data integration into company databases. In this case, there is a strong correlation, with R2 = 0.9676.
The results of the evaluation of the criteria for management technology tools missing in logistics processes were obtained using different methods and their comparison is presented in
Table 8.
Comparisons of the results obtained by different methods in
Table 8 and the arrangement of criteria confirm that the same result is obtained when calculating using different methods. This means that the automation criteria important for Lithuanian companies in the RVB logistics cooperation processes are arranged in the same way. The most important is the automation criterion that reduces energy consumption (RVB8). A comparison of the results of missing management technological tools obtained by different methods is presented in
Table 9.
The comparisons of the results of management technologies missing in logistics processes obtained by different methods in
Table 9 and the placement of criteria confirm that the same result is obtained when calculating using different methods. This means that the missing management technology tools important for Lithuanian companies are ordered in the same way. The most important is the PVT7 criterion, which is autonomous mobile robots (AMRs), which companies lack when improving logistics cooperation and ensuring service quality.
8. Conclusions
In recent years, the automation of logistic processes has experienced a remarkable transformation driven by the goal of operational efficiency, shifting consumer needs, and technology advancements.
As the importance of e-commerce grows, supply chain responses are also changing in the form of solutions used in modern warehouses. Warehouse automation has been significantly impacted by the emergence of Industry 4.0 technologies, which is defined by the use of digital technologies into manufacturing and logistical activities. Warehouse automation involves the use of various IT-based technologies that enable a warehouse to operate much more effectively and efficiently in order to achieve greater outcomes with significantly less efforts.
Lithuania’s logistics industry is still expanding and adjusting to shifting consumer demands and technology advancements. The logistics industry in Lithuania is actively looking for methods to lessen its impact on the environment and support sustainability objectives.
In this article, a methodical study was carried out in attempts to offer a strong and pertinent basis, focusing on the automation of logistical procedures that are used in supply chain management in Lithuania. This article has also analyzed information by collecting data from experts working in small and medium logistics and teaching logistics enterprises in Lithuania.
The novelty of this research is that experts have identified important criteria for determining the influence of automation processes (control technologies) that improve collaboration and service quality: reducing energy consumption (RVB8), accelerating order fulfillment (RVB1), and reducing errors (RVB3).
Also, experts have identified criteria for control technologies that are missing in logistics collaboration processes: autonomous mobile robots (AMRs) (PVT7), automatically guided vehicles (AGVs) (PVT5), and data integration into company databases (PVT2).
The research results showed that the automation of logistics processes (development of control technologies) can be conducted by integrating autonomous mobile robots (AMRs) and automatically guided vehicles (AGVs) and by performing data integration into company databases.
The comparisons of the research results obtained by different methods and the placement of criteria confirm that the same result is obtained when calculating using different methods. This means that the missing management technology tools important for Lithuanian companies are ordered in the same way. The most important is the PVT7 criterion, autonomous mobile robots (AMRs), which companies lack when improving logistics cooperation and ensuring service quality.
The implementation of these research results will help to practically increase the level of automation of logistics processes in Lithuanian companies.
It was found that the significances calculated by the different methods for the priorities of automation and missing control technologies corresponded to the same criteria. The most important are the energy-saving (RVB8) automation criterion and the PVT7 criterion, which is autonomous mobile robots (AMRs), which are missing for companies to improve logistics collaboration and ensure service quality.


