1. Introduction
UAM is set to transform urban transportation by alleviating congestion and improving mobility efficiency through the deployment of electric vertical takeoff and landing aircraft [
1]. As urban populations continue to grow and conventional transportation systems become increasingly strained, UAM offers a promising alternative to enhance accessibility and reduce travel times in metropolitan areas. Shon et al. [
2] demonstrated that UAM can provide economic and travel time advantages over conventional ground transportation, particularly in large cities experiencing severe congestion.
However, the successful deployment of a UAM network hinges on the optimal placement of vertiports, which serve as critical nodes for takeoff, landing, charging, and passenger transfers [
3]. The vertiport location planning is inherently complex, requiring a careful balance among construction costs, passenger accessibility, and network connectivity. Herniczek and German [
4] addressed this multifaceted challenge through a scalable optimization model that accounts for passenger demand, infrastructure constraints, and service delays across major U.S. cities. Recent research has further highlighted the importance of network structure and spatial connectivity in transport planning. Wang and Chen [
5] applied a multi-stage network analysis to the China Railway Express to evaluate logistical hub centrality and regional disparities, emphasizing the role of multimodal and resilient connectivity in large-scale infrastructure planning. While previous studies on facility location models have primarily focused on cost minimization or demand coverage maximization, they have largely neglected the importance of ensuring robust connectivity between critical nodes. A well-connected UAM vertiport network is essential for maintaining operational efficiency, reducing unnecessary detours, and enhancing system resilience. Lack of connectivity could lead to inefficient routing, increased operation costs, and decreased service reliability, making it imperative to adopt a connectivity-aware optimization strategy for seamless UAM integration into urban mobility networks.
Despite the increasing interest in UAM vertiport location decisions, several key challenges remain unaddressed. First, balancing cost efficiency and network-wide connectivity is a significant challenge, as existing models often fail to fully incorporate connectivity constraints in facility location problems (FLPs). Second, computational scalability poses a major hurdle, as exact optimization solvers such as CPLEX become impractical for large-scale UAM networks with over 100 candidate locations, necessitating the development of more efficient heuristic-based approaches. Third, many prior studies rely on synthetic demand models rather than real-world urban mobility data, limiting the accuracy and applicability of their findings. Finally, many existing heuristic approaches, including those based on a genetic algorithm (GA), often exhibit limited performance when applied to large-scale transportation networks, particularly under complex connectivity constraints that require feasible and well-structured network solutions. Addressing these challenges is essential for enabling a connected and operationally feasible UAM network that can be effectively deployed in real-world urban contexts.
To address the challenges of the UAM vertiport location problem, this study makes several key contributions. First, a novel connectivity-aware mathematical model is developed to find near-optimal vertiport locations while ensuring network connectivity under predefined distance constraints. Furthermore, a hybrid optimization framework is introduced, which integrates GA with an MST-based connectivity mechanism (i.e., a fundamental concept in graph theory that ensures connectivity with minimal total link cost) to generate connected and cost-effective vertiport configurations. In addition, a greedy initialization (GI) strategy is integrated into the proposed algorithm, enhancing convergence speed and solution quality. The proposed framework is validated through comprehensive numerical experiments on both synthetic fully connected networks (with 25, 50, 100, and 200 candidate vertiports) and a real-world case study in New York City (with 444 candidate locations extracted from public datasets). By incorporating connectivity constraints, scalable heuristics, and real-world case validation, this study contributes to both theoretical advancements and practical applications in large-scale UAM network planning.
The remaining part of this paper is structured as follows.
Section 2 reviews the literature on FLP, focusing on connectivity-constrained models and heuristic approaches relevant to UAM.
Section 3 presents the mathematical formulation of the UAM vertiport location problem, incorporating connectivity constraints to ensure that the selected network remains connected within the allowable flight range.
Section 4 introduces the hybrid GA framework, which incorporates MST-based connectivity verification and a GI strategy to accelerate convergence and improve solution quality.
Section 5 presents computational experiments on various synthetic networks and a real-world transportation network in New York City. The results show that the proposed algorithm consistently outperforms traditional heuristics and CPLEX.
Section 6 concludes by confirming the effectiveness and scalability of the proposed methodology and presents future research plans.
2. Literature Review
Conducting a comprehensive review of the relevant literature is essential for contextualizing the proposed connectivity-constrained vertiport location model within the broader domains of facility location theory and transportation network design. This section is structured to reflect the evolution of FLP research, beginning with foundational models and their classical formulations. It then highlights the emerging focus on connectivity-constrained facility siting in multimodal systems, underscoring the limitations of conventional approaches in capturing inter-facility network structures. Subsequently, metaheuristic optimization algorithms commonly employed for solving large-scale FLPs are examined, with particular attention to hybrid methods that balance exploration and exploitation in high-dimensional solution spaces. This review lays the groundwork for identifying a critical research gap, namely, the absence of scalable optimization frameworks that explicitly integrate network connectivity into UAM-focused FLP models.
2.1. The Facility Location Problems
The FLP is a core issue in transportation, logistics, and operations research. It involves determining optimal facility placements to minimize operational costs or maximize service coverage. Classical models such as the
p-median,
p-center, and hub location models focus primarily on cost minimization and demand satisfaction [
6,
7]. However, these models often overlook the role of network connectivity, which is essential in systems requiring coordination among multiple facilities. FLP has been applied across diverse domains, including supply chain network design, disaster response logistics, and urban service planning. Solution approaches range from exact algorithms, which offer precise optimization under structural constraints, to metaheuristic methods, including GA, which provide flexibility and scalability in solving large-scale and complex FLP variants [
8,
9]. Hwang et al. [
10] introduced an advanced metaheuristic approach that accounts for traffic congestion and environmental considerations, suggesting that the integration of traffic congestion effects into FLP improves network efficiency and sustainability. Some research has extended facility location models to include transportation dynamics. For example, Melkote and Daskin [
11] developed an integrated model that simultaneously addresses facility location and transportation network planning. Location-routing problems (LRPs), reviewed by Nagy and Salhi [
12], illustrate the interplay between facility locations and vehicle routing decisions. Drexl and Schneider [
13] surveyed extensions to LRP models, focusing on multi-objective formulations incorporating cost, service quality, and environmental performance. In a related domain, Bai et al. [
14] investigated a biorefinery supply chain model incorporating traffic congestion, highlighting how transport conditions and route-dependent costs influence facility location decisions iteratively in urban transportation networks. Overall, recent advancements in FLP research reflect a transition from cost-centric models to integrated frameworks that incorporate transportation dynamics, environmental impacts, equity, or demographic responsiveness across diverse application scenarios.
2.2. Connectivity-Constrained Facility Location
While FLPs have been extensively studied, most traditional models do not explicitly account for inter-facility connectivity, often assuming that facilities operate independently. However, in applications such as multimodal transportation, telecommunications, and UAM, maintaining robust connectivity between facilities is essential for ensuring operational resilience and efficiency. Melkote and Daskin [
11] introduced one of the earliest integrated models that jointly optimize facility location and transportation network design, showing that restructuring network topology can reduce costs more effectively than adding new facilities. To explicitly address connectivity, researchers have proposed robust facility network design models that ensure inter-facility linkage under uncertainty. For example, Bardossy and Raghavan [
15] developed a robust optimization model for the connected FLP, using a heuristic lower bound combination to efficiently generate high-quality solutions while maintaining network connectivity in uncertain environments.
Among the widely studied principles in transportation and infrastructure planning, enforcing network connectivity remains a fundamental modeling requirement for ensuring cost-effective and operationally feasible system design. For instance, Gewali et al. [
16] addressed spatially constrained facility-linked networks by introducing connectivity-preserving formulations applicable in geometrically restricted environments. Similarly, Peng et al. [
17] formulated a discrete group assembly problem with connectivity constraints, demonstrating that ensuring a spanning tree structure with bounded edge lengths can effectively minimize total travel distance and enhance network feasibility. These studies highlight the critical role of connectivity constraints in enabling efficient and realistic network optimization. Sun et al. [
18] proposed a robust network optimization framework that incorporates network connectivity as an explicit design consideration to enhance the resilience of supply chain systems under uncertainty, demonstrating improved solution quality and reduced sensitivity to disruptions. The importance of such integrated approaches has been broadly recognized in the facility location literature, as highlighted by Saldanha-da-Gama [
19]. Martens and Bley [
20] proved such problems to be NP-hard and proposed approximation algorithms ensuring basic network connectivity. Srivastava and Salapaka [
21] developed a joint model for facility and path optimization in both static and dynamic networks using entropy and control-based methods. Shishebori and Ghaderi [
22] addressed link disruptions through a robust optimization model solved by a hybrid metaheuristic. Güner and Sevkli [
23] applied discrete Particle Swarm Optimization (PSO) to facility location, showing strong performance against classical heuristics.
Despite notable progress in facility location modeling, connectivity is still frequently overlooked as a core structural constraint. This gap is particularly pronounced in UAM applications, where reliable inter-vertiport connectivity is essential for maintaining system coordination and operational feasibility. Existing models tend to prioritize reducing cost or maximizing service coverage, yet often lack explicit mechanisms to ensure a connected network structure. Bridging this gap requires integrated modeling approaches that jointly consider vertiport siting and connectivity constraints, enabling the design of coherent and resilient UAM networks.
2.3. Optimization Algorithms for Facility Location Problems
FLPs are well-known NP-hard combinatorial optimization problems, which arise in various domains such as logistics, supply chain design, and urban infrastructure planning. Due to their computational complexity, exact methods are often feasible for small-scale instances. As a result, metaheuristic algorithms have become the dominant approaches for tackling FLPs, for example, GAs, Simulated Annealing (SA), or PSO.
PSO and GAs remain popular approaches for solving uncapacitated and capacitated FLPs. Hybrid approaches that combine PSO with GA mechanisms have shown enhanced solution robustness and faster convergence compared to standard GA methods [
24]. For instance, discrete PSO with embedded local search has shown competitive results compared to evolutionary SA and GAs in solving benchmark FLP datasets [
25]. SA remains a useful standalone method, especially when computational time is a critical constraint. In nuclear engineering applications, a multistart SA achieved over 98%-time savings compared to PSO, while maintaining competitive solution quality [
26]. Furthermore, recent research emphasizes hybrid metaheuristics that combine the global exploration of PSO or GAs with the local intensification of SA. For instance, Yalaoui et al. [
27] developed a hybrid GA–PSO method for solving facility layout problems, demonstrating improved performance in both solution quality and computational efficiency. Similarly, Samuel and Rajan [
28] applied a GA–PSO hybrid framework to large-scale scheduling problems, reporting enhanced robustness and reduced convergence time compared to standalone algorithms. These studies highlight the potential of hybrid metaheuristics in balancing global search capability with local refinement for complex facility network design tasks.
Although significant advances have been made, most existing models still fail to inherently ensure network connectivity among facilities, particularly within the context of UAM or multimodal transportation infrastructure. To address this research gap, this study proposes an MST-GA hybrid approach that explicitly integrates an MST-based connectivity framework into the GA. Furthermore, a problem-specific GI strategy is incorporated to enhance solution feasibility and guide the search process toward structurally connected, high-quality solutions from the outset. This study offers an effective and scalable methodology for complex, real-world FLPs.
2.4. Research Contribution
While facility location optimization has been extensively studied, connectivity—a critical requirement for feasible and efficient UAM network design—is often overlooked. This study introduces a connectivity-constrained vertiport location model specifically tailored for UAM applications. The proposed model simultaneously achieves cost-effective vertiport siting and robust network connectivity, both of which are essential for ensuring the operational feasibility of UAM systems. Unlike traditional models, this framework incorporates explicit connectivity to maintain inter-vertiport links, improving system resilience. To solve this model effectively, we introduce a hybrid optimization algorithm combining GI with MST-based connectivity. This approach enhances convergence stability and ensures feasible, high-quality solutions. Extensive numerical experiments and a real-world case study have been conducted to validate the performance of the proposed algorithm. The results highlight that incorporating connectivity constraints into the FLPs substantially enhances infrastructure planning effectiveness in UAM networks. By embedding connectivity into the optimization process, the proposed model facilitates the development of spatially coherent and well-integrated vertiport layouts. This work lays a solid methodological foundation for future research and large-scale implementation of connectivity-aware vertiport location strategies in UAM systems.
3. Model Formulation
UAM has emerged as a promising solution for alleviating urban congestion and enhancing transportation efficiency. The successful deployment of UAM services hinges on the strategic siting of vertiports, which serve as critical nodes for vertical takeoff and landing operations. Unlike traditional FLPs, UAM vertiport planning must explicitly incorporate connectivity considerations by requiring that each selected vertiport is directly connected to at least one other selected vertiport, thereby ensuring the formation of a connected operational network. To formulate the UAM vertiport location problem, the system is modeled as an undirected graph , where denotes the set of nodes and represents the set of links between these nodes. The candidate vertiport locations and the demand points are defined, respectively, as a subset and , and the demand points must be assigned to one of the selected facilities . The distance between any two nodes and is denoted by , which represents the Euclidean distance between nodes and in a given network.
Due to battery range limitations and airspace regulations, the flight distance between any two selected vertiports must not exceed the maximum allowable range
, thereby ensuring operational feasibility. In real-world UAM operations, limited battery range makes inter-vertiport connectivity essential, as inadequate links can cause infeasible routes, detours, or mission failure, highlighting the practical need for range-aware network design and vertiport placement [
29,
30]. As a result, the selected vertiports must form a connected subgraph while minimizing total operational costs. To provide a clearer understanding of the network connectivity constraints in the proposed model, a conceptual diagram (
Figure 1) adapted from Peng et al. [
17] is presented to illustrate the virtual source, sink nodes, selected vertiports, and corresponding connectivity relationships.
The concept of connectivity described in Peng et al. [
17] is adapted in this study, where, if the shortest distance between two nodes in a given network is less than a certain value (i.e.,
in this study), they are considered to be connected to each other. In order to construct such a connected UAM vertiport network, we try to find the optimal locations of vertiports through a proposed model that maintains connectivity between the selected nodes through virtual flows as described in Peng et al. [
17]. For a more detailed explanation, a virtual network is presented in
Figure 1, and the candidate sites of vertiports are indicated by both black and gray circles on the plane in the figure. The black circles represent the nodes finally selected as the UAM vertiports among the facility candidate sites. In addition, there is a virtual source node at the top of the plane and a virtual sink node (represented by node number 1) at the bottom of the plane. Set
includes both the set of candidate vertiport locations
and the virtual sink node
. The number of facilities to be located is indicated by
, and it is assumed to be 5 in this figure.
To determine the final locations, the source node sends a flow of positive integer 1 to each node among the candidate sites on the plane where the vertiport is to be located (i.e., total
and the flow will be distributed on the selected nodes, each of which receives unit flow). The node selected as the vertiport sends the flow of size 1 received from the source node and any flows received from nearby vertiport nodes within a certain distance (i.e.,
in this study). Finally, the total amount of flows received from both the virtual source node and the previously connected nodes at the last selected location is sent to the virtual sink node, which is introduced to serve as an artificial aggregation point. As such, if the flow conservation is satisfied in all selected nodes and the total flow flowing into the virtual sink node is guaranteed to be the same as the initial total out-flow from the source node, a feasible solution can be found, where the selected vertiports form a spanning tree structure. Let
represent the subset of edges (i.e., flight routes) connecting the chosen vertiport locations. The connectivity constraints can be formulated as follows:
Formula (1) ensures that any two connected vertiports are within the maximum allowable flight distance
, thereby preventing infeasible or excessively long inter-vertiport routes. To further guarantee network connectivity while eliminating redundant links, the following formula can be constructed:
As noted by Peng et al. [
17], Formula (2) ensures that the number of edges does not exceed the number of selected nodes minus one, effectively avoiding cycle formations and supporting the construction of a sparse yet connected and cost-efficient network topology. The incorporation of these concepts ensures that the selected vertiports form a spatially cohesive and operationally viable network, thereby enhancing both the resilience and efficiency of the UAM transportation system.
Each demand node
, representing the passenger origin point, is associated with a demand quantity
. Due to the absence of reliable origin–destination (OD) flow data in current UAM scenarios, demand is approximated in a node-based form. Nonetheless, incorporating OD-based demand (e.g.,
) in future studies may yield more accurate modeling outcomes. The optimization task involves selecting exactly
vertiports from a subset
while ensuring network connectivity and minimizing total operational costs. For each demand node
and vertiport
, the Euclidean distance is denoted by
. Locating a vertiport at location
incurs a fixed cost
which includes both land acquisition and infrastructure development expenses. Additionally, the transportation cost is modeled as a function of distance, where
denotes the unit transportation cost per person per kilometer for traveling from his/her demand point to the assigned vertiport. The allocation of demand to vertiports is governed by the binary decision variable
, where
indicates that the demand node
is assigned to vertiport
, and
otherwise. Similarly, the binary decision variable
determines whether a vertiport is established at location
, where
if a vertiport is constructed and
otherwise. To ensure operational feasibility, the selected vertiports must satisfy network connectivity constraints and form a connected subgraph. A connectivity set
is defined for each vertiport
, containing all directly connected candidate vertiports within the maximum allowable flight range
. The connectivity between any two selected vertiports
is represented by the variable
, which denotes the size of directional flow from node
to node
on the plane in
Figure 1.
By integrating these components, the problem is formulated as a vertiport location decision model that minimizes the total cost, which includes passenger transportation costs incurred by traveling from demand points to assigned vertiports and vertiport construction costs at the selected nodes, and ensures connectivity among the selected UAM vertiports. This formulation provides a robust foundation for UAM infrastructure planning, ensuring both cost-effectiveness and operational feasibility in large-scale urban environments. Based on the defined parameters and decision variables, the complete model is expressed as follows:
The objective function (3) minimizes the total cost, comprising both passenger transportation costs and vertiport construction expenditures. The first term quantifies the cumulative access cost incurred by all passengers commuting from their origins to assigned vertiports, calculated as the product of unit transportation cost, demand, and travel distance. The second term represents the fixed infrastructure costs associated with constructing vertiports at the selected locations. Constraint (4) ensures that exactly
locations are selected for vertiports, thereby enforcing a predefined number of operational sites. The customer allocation constraints (5) guarantee that each demand node is assigned to exactly one vertiport, ensuring complete service coverage. Additionally, the assignment constraints (6) ensure that demand nodes can only be assigned to vertiports that have been selected, preventing allocations to non-existent infrastructure. The flow balance constraints (7) ensure that the total flow into a vertiport
equals the total flow out, maintaining flow conservation across the network. This guarantees that the connectivity between vertiports is preserved, and no flow is lost or generated unexpectedly. The network structure constraints (8) and (9) limit the number of connections between vertiports. Constraints (8) ensure non-negative virtual flow between vertiports, while constraints (9) restrict each vertiport to having at most
virtual inflows in
Figure 1. The end-point flow constraints (10) to (12) regulate the sink node. Constraints (10) ensure no incoming flow from the sink node, while constraints (11) restrict flow to the sink node to be either 0 or the total number of vertiports to be constructed. Constraint (12) ensures the sink node is not selected as a vertiport location. The feasible neighborhood constraint (13) includes the sink node
in the network but clarifies that it is excluded from a real candidate location set
. The neighborhood feasibility constraints (14) enforce distance limitations, ensuring that vertiports can only be connected if they are within the maximum operational distance
, reflecting maximum UAM travel distance. Finally, constraints (15) and (16) represent binary variables associated with vertiport location decisions
and demand allocation decisions
, respectively. This mathematical framework offers a rigorous and scalable approach to optimizing UAM vertiport placement, ensuring that the resulting network remains cost-efficient, connected, and thus operationally feasible. By jointly considering vertiport locations, demand allocation, and connectivity constraints, the model provides a systematic methodology for strategic UAM network planning, supporting long-term adaptability in urban mobility infrastructure development.
4. Proposed Algorithm
This section develops an algorithm to solve the proposed UAM vertiport location planning problem. The framework of the methodology in this section consists of three interlinked components: (1) application of the GA to find the near-optimal vertiport locations, (2) maintaining feasibility of the candidate solution set via a hybrid MST-GA framework, and (3) enhancing computational efficiency through a demand-aware GI strategy. This integrated approach is particularly well-suited for the UAM transportation network, where achieving connectivity and minimizing total system cost are critical within large-scale, high-complexity operational environments.
4.1. Hybrid MST-GA Framework for Connectivity-Constrained Problem
The GA, initially proposed by Holland [
31], is a population-based metaheuristic inspired by the mechanisms of natural selection and evolution. Due to its capacity for global search and adaptability, the GA has proven effective for solving large-scale combinatorial optimization problems that are otherwise intractable by classical methods. In particular, GA-based approaches have been widely applied in facility location and hub network design problems within transportation systems, including air logistics, where minimizing system-wide cost and improving spatial efficiency are critical [
32]. In this study, the GA is employed to find near-optimal locations of
vertiports while minimizing total system cost, which includes facility construction costs and demand-weighted transportation costs.
A feasible UAM network must satisfy two essential conditions: (i) connectivity, ensuring that all selected facilities form a connected subgraph, and (ii) flight distance constraints, restricting direct connections to a maximum allowable flight range
. To enforce these conditions, an MST is constructed over the selected facility nodes in the GA procedure; the MST-GA framework integrates GA with the MST concept to ensure all selected facilities form a connected subgraph. The workflow consists of the following steps: an initial population of candidate facility configurations is generated using GA, followed by MST construction to enforce connectivity constraints among selected facilities. An MST is computed over the selected facilities using Prim’s algorithm [
33], based on the pairwise Euclidean distances between them. This MST is used solely to validate the connectivity of the selected vertiports. A solution is accepted only if the resulting spanning tree satisfies the connectivity condition and all inter-vertiport links fall within the maximum allowable flight distance
as defined in Formula (1). If any edge in the constructed MST violates this constraint, the corresponding solution is deemed infeasible and excluded from the population during the GA procedure. This post-processing step ensures that the final configuration supports a connected and operationally viable UAM network without altering the evolutionary search dynamics. The detailed procedure for constructing the MST is illustrated in Algorithm 1.
| Algorithm 1. Prim’s Algorithm for MST Construction among Selected Facilities. |
| Input: Candidate facility coordinates |
| Output: Minimum Spanning Tree |
| 1: | Compute pairwise distance matrix: |
| | , , |
| 2: | Construct undirected graph where , and edge weights |
| 3: | Initialize MST , select an arbitrary start node and let visited node set |
| 4: | while do |
| 5: | Find edge with minimum such that |
| 6: | Add to |
| 7: | Include in |
| 8: | end while |
| 9: | return |
The overall procedure of the MST-GA is presented in Algorithm 2, consisting of initialization, fitness evaluation, tournament selection, crossover, mutation, and termination. This iterative process is repeated until a stopping criterion is met, such as a maximum number of generations or a plateau in fitness improvement. Through this evolutionary mechanism, the MST-GA iteratively refines feasible configurations toward an optimal set of facility locations under the predefined costs and demand conditions. To guarantee that the selected facilities form a connected network and a candidate solution is feasible, an MST-based connectivity check is applied in each generation.
| Algorithm 2. Hybrid MST-GA Framework for Facility Location Decision. |
| Input: Candidate location set , demand set , number of facilities to be built |
| Output: Near-optimal facility selection vector or “Not feasible” |
| 1: | Initialize population such that , |
| 2: | while stopping criterion not met do |
| 3: | for all do |
| 4: | Evaluate fitness: |
| 5: | end for |
| 6: | Select parents from via tournament selection |
| 7: | |
| 8: | for all pairs do |
| 9: | |
| 10: | |
| 11: | if then |
| 12: | Repair to ensure |
| 13: | end if |
| 14: | |
| 15: | |
| 16: | if then |
| 17: | Add to next generation |
| 18: | end if |
| 19: | end for |
| 20: | if then |
| 21: | return “Not feasible: No connected solution found” |
| 22: | end if |
| 23: | Replace population: |
| 24: | end while |
| 25: | return |
From a computational complexity standpoint, the MST-GA framework is composed of two principal modules: (i) fitness evaluation based on demand-weighted transportation costs and (ii) connectivity verification via MST construction. The total per-generation complexity of this framework can be formally expressed as , where denotes the population size, is the number of facilities to be constructed, and represents the number of demand points. The first term, , corresponds to the fitness evaluation process for all individuals in the population. Each candidate solution must compute the total transportation cost by summing the weighted distances from each demand point to its assigned facility, thus quantifying the overall service efficiency. The second term, , captures the computational burden introduced by the connectivity constraint. Specifically, for each candidate solution, an MST is constructed over the selected facility nodes using Prim’s algorithm to ensure that the selected network remains connected. Since this procedure requires the evaluation of all pairwise edge weights and incremental MST construction, it incurs a time complexity of per individual, repeated across all individuals in each generation. Although the MST verification introduces a quadratic overhead with respect to the number of selected facilities, the overall computational complexity remains tractable for moderate-scale instances. Moreover, both the fitness evaluation and MST construction are inherently parallelizable, making the framework well-suited for modern multi-core computing architectures. Consequently, the MST-GA demonstrates excellent scalability and computational efficiency in solving large-scale UAM vertiport location problems, where both spatial feasibility and network connectivity must be simultaneously addressed. By leveraging evolutionary operators and iterative refinement, the algorithm reliably converges toward facility configurations that are cost-effective, robust, and structurally connected.
4.2. MST-GA Combined with GI
One limitation of standard GA implementations is the reliance on random initialization, which often leads to poor-quality initial solutions, slower convergence, and increased computational effort. To overcome this issue, a GI strategy is introduced to generate high-quality initial solutions based on demand and cost considerations, thereby improving the overall performance of the GA. The greedy selection rule defines
as the set of already selected facilities and
as the set of remaining candidate facilities. The next facility
to be selected is determined iteratively by minimizing the incremental cost, as defined in Formula (17):
where
denotes the size of the demand at node
,
represents the distance from demand point
to the facility at node
, and
corresponds to the facility construction cost at node
. The GI algorithm operates as follows: (1) the first facility
is selected based on maximum demand coverage; (2) subsequent facilities are iteratively added by choosing
that minimizes the cost function; and (3) the process is terminated when
facilities have been selected. With a computational complexity of
, GI significantly accelerates convergence compared to purely random initialization. By pre-selecting high-quality solutions, the search space is effectively reduced, allowing the GA to focus on refining near-optimal configurations rather than exploring unpromising regions and significantly enhancing the convergence behavior of the MST-GA framework. The detailed steps of the GI procedure are outlined in Algorithm 3, where facilities are iteratively selected to minimize incremental cost, considering both the demand-weighted distance and facility construction cost.
| Algorithm 3. GI for Facility Selection. |
| Input: Demand set , candidate facility set , number of facilities , demand , construction cost , distance |
| Output: Initial facility subset with |
| 1: | Initialize , |
| 2: | Select first facility: |
| | |
| 3: | Add to ; update |
| 4: | while do |
| 5: | for all do |
| | |
| 6: | end for |
| 7: | |
| 8: | , |
| 9: | end while |
| 10: | return |
Building on the existing MST-GA framework, we enhance solution quality and convergence speed by incorporating a GI strategy that generates high-quality initial populations and guides the search process more effectively. The proposed methodology begins with a mixed initialization strategy, combining GI for cost-effective facility selection with conventional random initialization to maintain diversity in the solution pool. Once initialized, the GA iteratively applies selection, crossover, and mutation operators to evolve solutions toward cost minimization. A solution is considered feasible if a spanning tree can be formed among the selected vertiports using only links that do not exceed the maximum flight distance
. Any solution failing to meet these criteria is considered infeasible and discarded. This evolutionary process continues until a convergence criterion is satisfied, such as a maximum number of generations or a stabilization in fitness values. The complete procedure is summarized in Algorithm 4.
| Algorithm 4. The MST-GA combined with GI Approach. |
| Input: Demand set , facility set , distance matrix , demand vector , construction cost vector , population size , number of facilities , mutation rate , maximum generation |
| Output: Near-optimal facility selection vector or “Not feasible” |
| 1: | Initialize population where |
| | |
| 2: | |
| 3: | while do |
| 4: | for all do |
| 5: | |
| 6: | Evaluate fitness: |
| | |
| 7: | end for |
| 8: | |
| 9: | |
| 10: | for all pairs do |
| 11: | |
| 12: | |
| 13: | if then |
| 14: | |
| 15: | end if |
| 16: | |
| 17: | |
| 18: | if then |
| 19: | |
| 20: | else |
| 21: | Continue |
| 22: | end if |
| 23: | end for |
| 24: | if then |
| 25: | return “Not feasible: No connected solution found” |
| 26: | end if |
| 27: | |
| 28: | |
| 29: | end while |
| 30: | return |
The proposed approach combines GI-based high-quality initial populations, GA-driven iterative facility location optimization, and MST-based connectivity validation to form an integrated optimization pipeline. By jointly addressing cost efficiency, spatial feasibility, and solution quality, the model provides a robust and scalable solution for UAM vertiport placement in large-scale urban environments, ensuring connectivity. The total computational complexity of the framework can be expressed as , where is the number of greedy individuals, is the number of generations, is the population size, is the number of selected vertiports, is the number of candidate locations, and is the number of demand points.
5. Numerical Examples
To evaluate the solution quality and computational efficiency of the proposed algorithm, we conducted a series of numerical experiments on both synthetic and real-world datasets. The synthetic dataset consists of fully connected networks with various network sizes. These test instances were designed to assess the scalability and robustness of the proposed algorithm under different problem sizes. In addition, a real-world case study based on New York City was conducted, comprising 444 candidate vertiport locations obtained from publicly available GIS data. In this section, the results from the proposed algorithm (i.e., MST-GA combined with GI) were compared to those computed from MST-GA and benchmark solutions obtained from CPLEX (Version 12.10), a state-of-the-art commercial optimization solver. All heuristic algorithms were coded in MATLAB R2024a and executed on a computer equipped with an Intel i5-13500H 2.60 GHz CPU and 16.0 GB of RAM.
5.1. Test Cases
Each test network consists of
fully connected nodes, where
represents the total number of candidate vertiport locations in a given network. As the network is bidirectional, each pair of nodes is linked by a single undirected edge. For illustrative purposes,
Figure 2 presents small complete graphs, with
to
, and
, to conceptually demonstrate the structure of fully connected networks. The actual experiments were conducted on larger networks with
which were constructed under controlled conditions. The number of candidate nodes ranged from 25 to 200, with spatial coordinates randomly generated within square regions of increasing size: 20 × 20 for the 25-node network, 100 × 100 for both the 50-node and 100-node networks, and 200 × 200 for the 200-node network. In particular, the 50-node and 100-node networks were constructed based on the same spatial extent (100 × 100). This setting was not intended to directly analyze network density, but rather to increase the diversity of both point density and experiments across the four network configurations.
In each instance, the number of facilities to be selected was determined by the network size: for 25 nodes, for 50 nodes, for 100 nodes, and for 200 nodes. A maximum connection distance, denoted as , was applied to determine the feasibility of links between candidate nodes. Serving as a core connectivity constraint, directly shapes the feasible network topology. By systematically varying the value of , the study examines how different levels of connectivity influence algorithm feasibility, solution quality, and convergence behavior. Demand and facility construction cost were randomly drawn from a uniform distribution over , introducing controlled variability while ensuring comparability across scenarios. A fixed unit cost per passenger per kilometer () is assumed to be 3.5, which is obtained from the real-world New York City case study in the next section. These synthetic networks do not aim to replicate specific urban settings, but function as neutral benchmarks for validating the proposed model and algorithm. Practical applicability is further demonstrated through a real-world case study presented in the subsequent section.
The experiment evaluates three solution approaches for optimizing vertiport locations while ensuring network connectivity. The first approach, MST-GA, integrates an MST-based procedure into the conventional GA to ensure selected facilities form a connected network. The second approach, MST-GA combined with GI, further enhances MST-GA by introducing a GI strategy to improve solution quality and accelerate convergence speed. The third approach utilizes CPLEX to obtain optimal solutions and serves as a benchmark for assessing heuristic methods. All approaches were tested across different network scales and various maximum connectivity distances. The results are summarized in
Table 1, which reports the total cost—including transportation and facility construction costs—and the computation time for each test instance.
For small-scale instances
in
Table 1, CPLEX can obtain optimal solutions within a reasonable solution time. The proposed method, MST-GA combined with GI, achieves solution quality consistently equivalent to, and in several large-scale instances even better than, the best solutions obtained by CPLEX within an hour time limit. Specifically, in test cases with
and
, MST-GA combined with GI yields objective values up to 4% to 26% lower than those of CPLEX, reflecting its ability to effectively explore the solution space in complex settings. Furthermore, compared to the basic MST-GA, the greedy-enhanced version consistently obtains lower objective values across all tested instances. While both MST-based heuristics generate feasible and connected solutions, MST-GA combined with GI significantly improves solution stability and accelerates convergence speed by integrating a GI strategy. This confirms the effectiveness of the GI in enhancing both solution quality and computational runtime efficiency. The results clearly demonstrate the advantage of MST-GA combined with GI over both CPLEX and MST-GA, particularly in large-scale scenarios, making it a practical and scalable alternative to the exact method.
The solution time comparison further confirms the scalability of the proposed approach. For small and medium networks (), CPLEX terminated within the time limit, with computation times varying by problem complexity and . However, for all large-scale instances (), CPLEX consistently reached the 3600 s cap without convergence, due to the exponential complexity of the problem. In contrast, MST-GA combined with GI solved all instances, including the largest ones, in under 10 s while achieving better solutions. These results highlight the robustness, scalability, and practical effectiveness of the proposed method, confirming its suitability for solving large-scale FLPs with connectivity constraints.
To illustrate these findings visually,
Figure 3 presents a comparative analysis of objective values across different problem sizes and various distance thresholds (
). It clearly shows that MST-GA combined with GI consistently outperforms both MST-GA and CPLEX, particularly in large-scale instances
. As the problem size increases, the superiority of the proposed methodology becomes increasingly evident, as it consistently achieves lower objective values compared to the other methods. This improvement in cost efficiency highlights its strong scalability and robustness across all problem sizes. Moreover, the results indicate a general trend: as
increases, the objective value tends to decrease across all algorithms and problem sizes. This trend reflects the fact that a larger allowable connection distance provides more flexibility in facility location decisions and network connectivity, thereby enabling more cost-efficient solutions. This observation is particularly relevant for UAM network design, where
serves as a proxy for the maximum feasible inter-vertiport travel range under operational and planning constraints. In this study,
values were systematically varied from 5 km to 65 km to capture a wide range of practical scenarios, including both tightly clustered and more dispersed network configurations. While increasing
enhances network connectivity by allowing more distant inter-vertiport links, it simultaneously imposes greater demands on the energy capacity and operational coordination of UAM systems. Nevertheless, this increased flexibility can yield substantial cost savings by enabling more efficient passenger-to-vertiport assignments and reducing the total number of required facilities. Accordingly, practitioners must carefully balance technical feasibility with economic viability. This trade-off provides valuable insights for policymakers when determining whether to invest in advanced UAM technologies or to expand supporting ground infrastructure.
5.2. Case Study: UAM Vertiport Locations in New York City
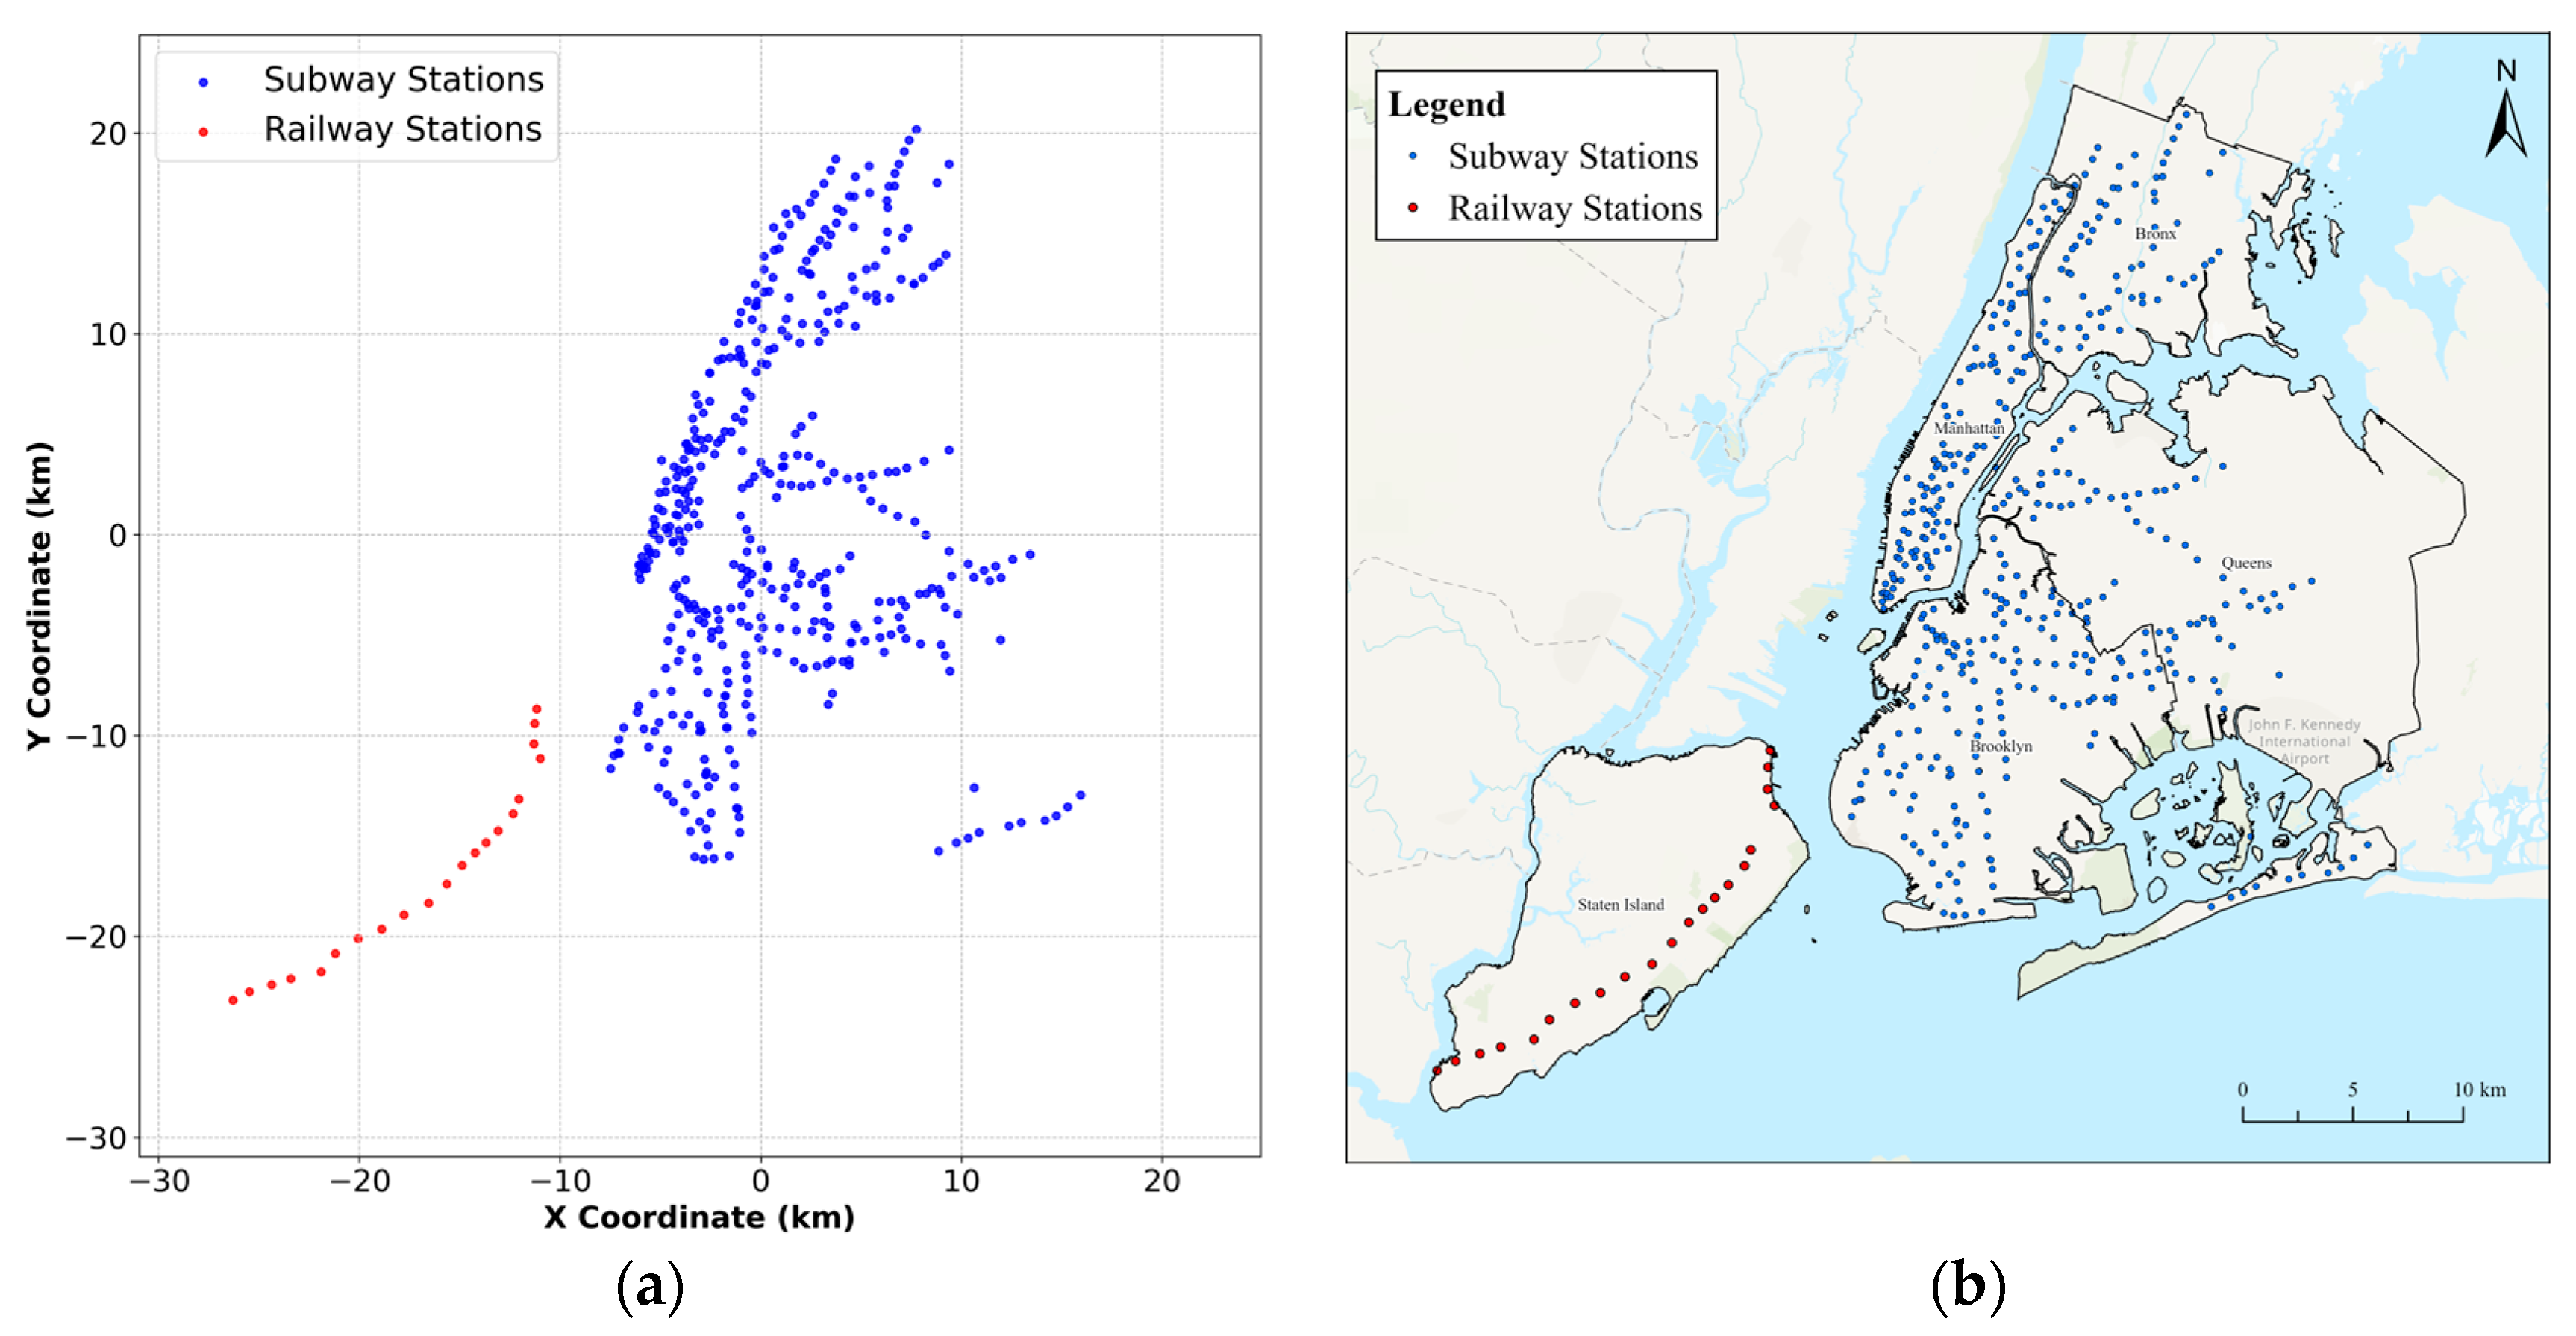
Following the validation of the proposed algorithm on the test networks, we extend our analysis to a real-world case study in New York City, where 444 candidate vertiport locations are considered for optimal facility placement. New York City comprises five boroughs: Manhattan, Brooklyn, Queens, the Bronx, and Staten Island. These candidate locations correspond to 423 subway stations across Manhattan, Brooklyn, Queens, and the Bronx, and 21 railway stations on Staten Island where subway service is not provided. In this study, key points within the public transportation network are chosen for candidate vertiport locations to facilitate intermodal transfer and improve overall accessibility. The proposed methodology in this study is general; candidate sites can be redefined or replaced with more context-specific locations such as tourist attractions (e.g., Times Square and the Statue of Liberty) or institutional landmarks (e.g., hospitals, museums, and universities), depending on policy goals, spatial constraints, or stakeholder priorities. Thus, the use of subway and railway stations is not an operational recommendation but rather a proxy to illustrate and evaluate the proposed algorithm under realistic demand conditions. The objective of this study is to determine a set of vertiport locations that minimizes total cost while maintaining connectivity, thereby ensuring efficient UAM operations within the urban environment.
Figure 4a presents the spatial distribution of subway and railway stations represented by blue and red circles, respectively. This figure depicts coordinate projections of 444 candidate locations used in spatial analysis, and their geographic locations were manually geocoded using Google Maps to create
Figure 4b. Borough boundaries in
Figure 4b are generated based on official New York City Planning datasets [
34]. To ensure the practical and robust deployment of vertiports, the model incorporates a set of carefully computed parameters. Specifically, the number of UAM vertiports to be constructed,
, is assumed to be 20, in line with prior optimization studies that identify
as effective for demand coverage and cost-performance trade-offs [
4,
35]. A maximum inter-facility distance of
km is adopted, consistent with established practices in vertiport network design to ensure adequate service coverage and maintain intra-network efficiency [
36,
37].
Total cost in this study includes two cost components: transportation costs incurred by users traveling to their assigned vertiports and vertiport construction costs. Transportation costs are calculated based on the amount of travel demand, travel distance from customer locations to their assigned vertiports, and unit transport cost per passenger per kilometer. In this study, all transit stations, including subway and railway stations, are treated simultaneously as demand points and candidate locations for UAM vertiport deployment. To estimate urban passenger demand for UAM in Manhattan, Brooklyn, Queens, and the Bronx, we utilized 2023 subway ridership data released by the Metropolitan Transportation Authority (MTA) [
38]. The dataset includes annual ridership figures for 423 subway stations with station-level data readily available. For Staten Island, total annual railway ridership data obtained from NYC Open Data [
39] was used to estimate station-level passenger demand via a spatial disaggregation approach using ArcGIS Pro 3.5 software. These values were directly used to represent demand at corresponding locations in the proposed model. Then, the estimated demand at all subway and railway stations, which serve as spatial proxies for the origins of ridership, is assigned to their nearest selected UAM vertiports based on the Euclidean distance. The resulting travel distances were used to compute the transportation costs. According to national travel behavior data, the average commuting distance per person in the United States ranges from 11 to 14 km per day, depending on region and income group [
40]. Meanwhile, estimates of daily commuting costs in New York City average around USD 41 per day [
41]. This implies a unit transport cost per passenger per kilometer of
, which is adopted in our model to reflect urban mobility conditions particularly in dense, high-cost areas like New York City.
The construction cost
for each candidate location
is given by Formula (18):
where
represents the fixed infrastructure cost,
denotes the unit land price (USD/m
2), and
is the required area
for a standard vertiport. This cost structure reflects mid-range construction benchmarks reported in empirical design studies [
42,
43]. The assumed footprint is consistent with regulatory guidelines for small- to medium-scale vertiports, including safety buffers and operational zones, as consolidated from FAA and EASA standards. Since the proposed model considers candidate locations across all five boroughs of New York City distinctly, the unit land price
is computed separately for each borough. Due to the absence of an official dataset detailing borough-level standard land values in New York City, the unit land price is derived from a combination of average land price estimates, residential and commercial property values, and general market trends, based on data from publicly accessible data platforms [
44,
45,
46]. The construction cost model here simplifies costs to fixed infrastructure and land acquisition. While borough-level land price variations are incorporated, finer-grained differences such as proximity to the city center or spatial concentration effects (e.g., via the Herfindahl–Hirschman Index) are not explicitly modeled. Other influential factors, including site-specific grid connection costs, complex airspace regulations, and community acceptance issues (e.g., noise or land use conflicts), may also significantly affect actual costs. These simplifications were adopted to ensure computational tractability, given the primary focus of this study on model and algorithm development. Nonetheless, future research should aim to incorporate more detailed spatial and economic cost factors to enhance planning realism.
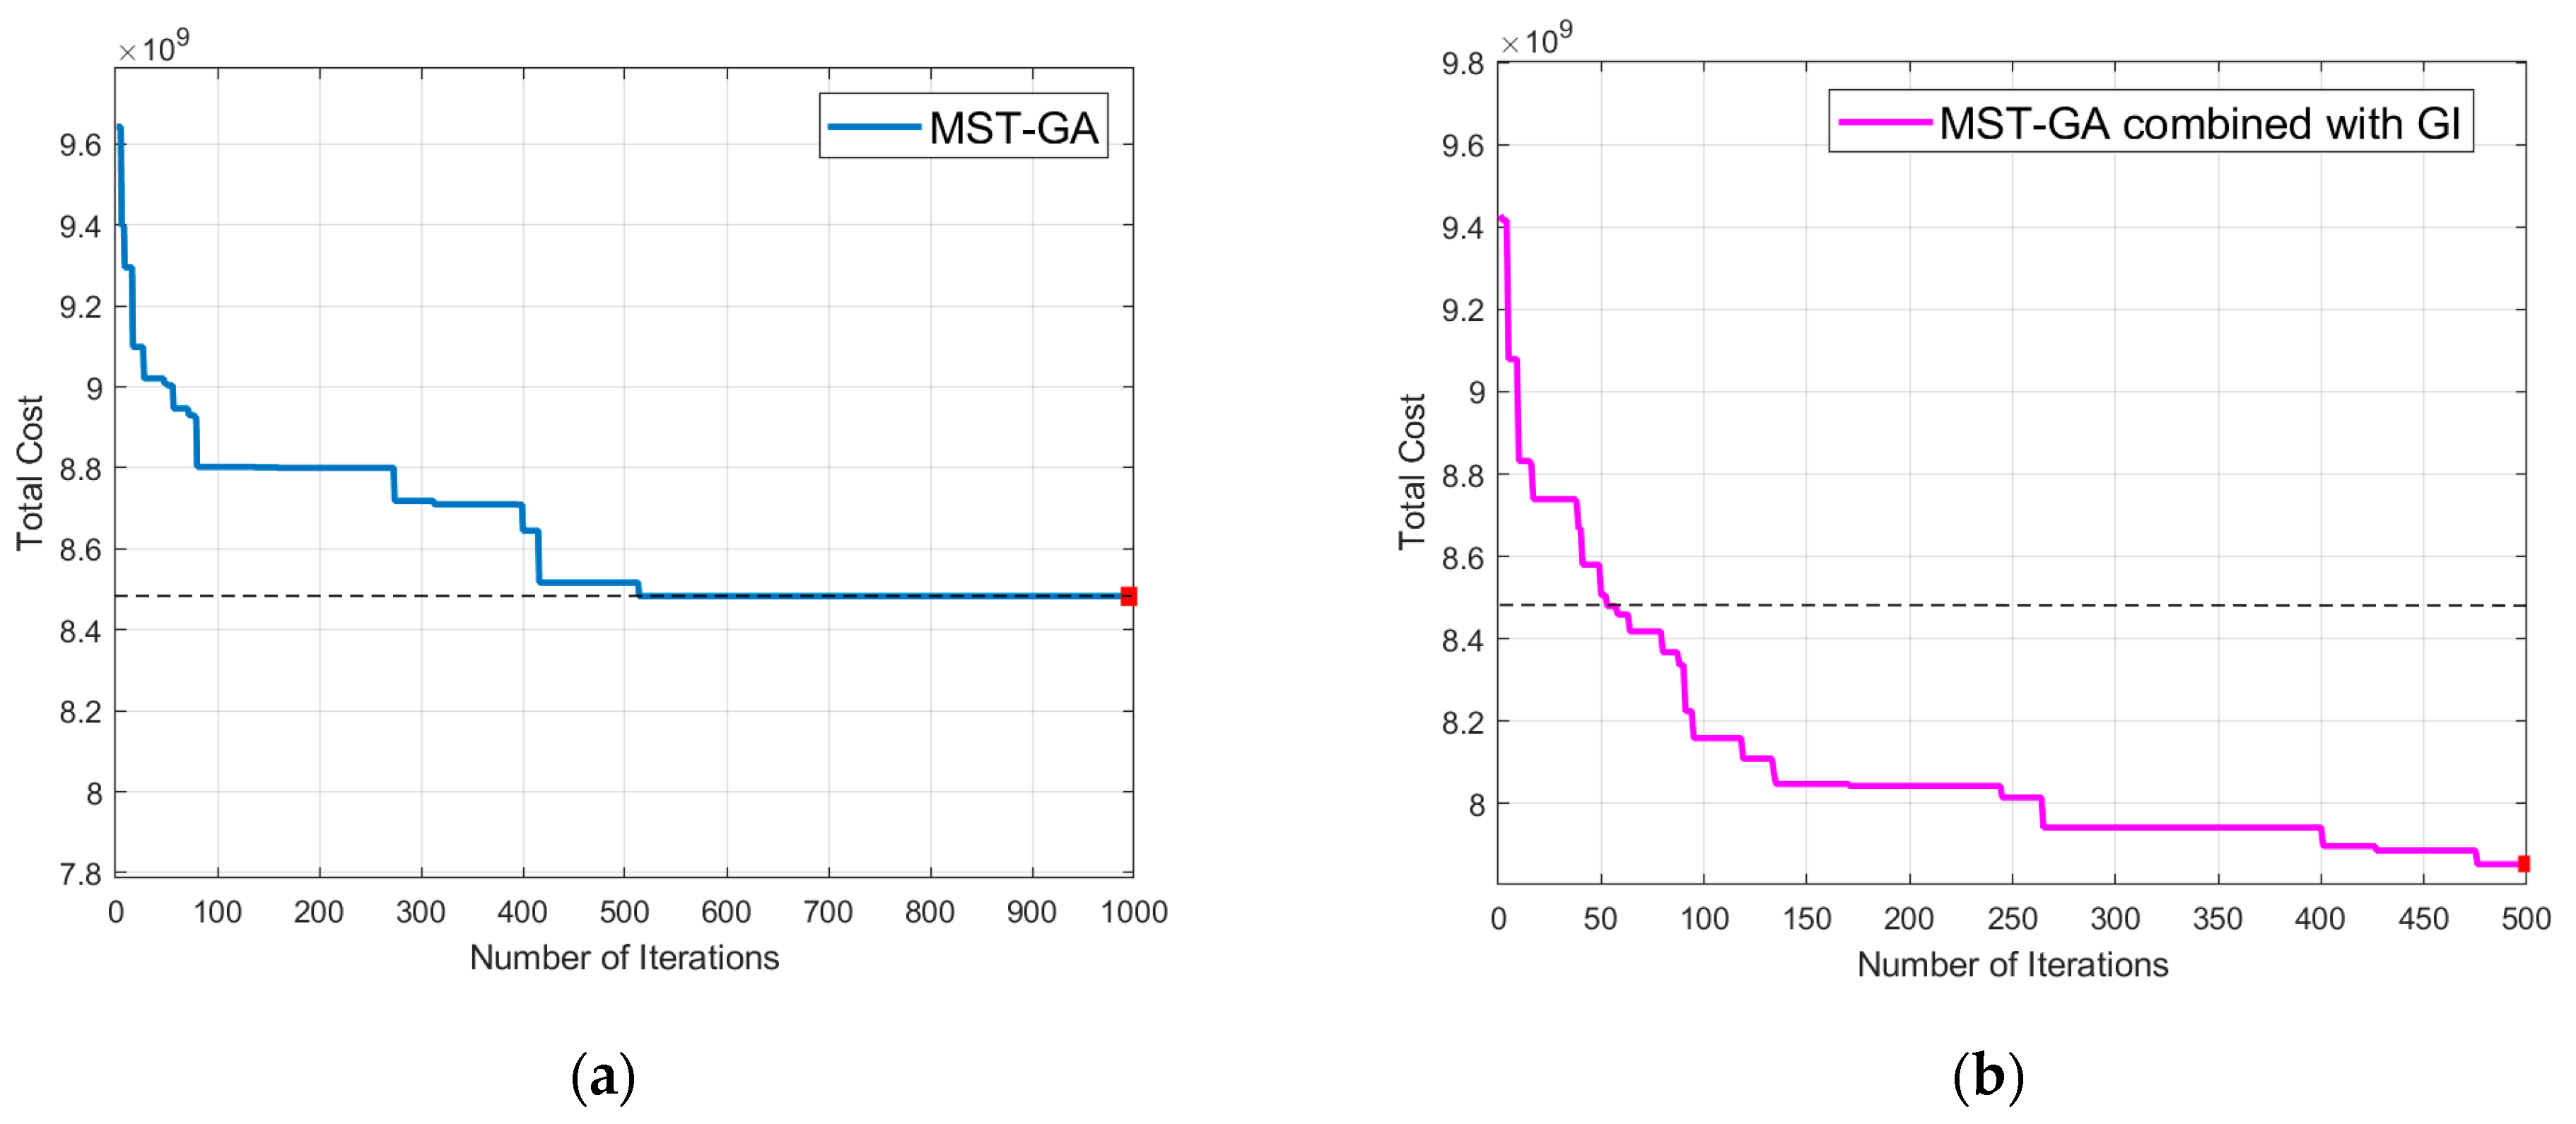
To solve the problem, two algorithms, including (i) MST-GA and (ii) MST-GA combined with GI, are coded in this case study, and the results are compared. The first experiment applied the MST-GA to identify the near-optimal subset of 20 vertiport locations across New York City. As shown in
Figure 5a, the selected sites represented by green squares form a connected network that satisfies the maximum flight distance constraint. The algorithm achieved a total cost of USD 8.48 × 10
9 and completed in 21.1 s. The cost convergence curve in
Figure 6a demonstrates a gradual decrease in total cost over 1000 iterations. The red marker in
Figure 6a indicates the result obtained at the 1000th iteration. For reference, the dashed line in the two subfigures in
Figure 6 denotes the total cost achieved by MST-GA at this final iteration. To enhance the performance of the algorithm, MST-GA combined with GI was evaluated under identical settings. As illustrated in
Figure 5b, this approach produced a similarly connected vertiport network while achieving a lower total cost of USD 7.85 × 10
9 and a significantly reduced computation time of 5.9 s. The convergence behavior shown in
Figure 6b confirms that the algorithm stabilizes within 500 iterations, and the result is marked with a red square. Compared to the MST-GA, this enhanced version, incorporating a greedy algorithm, exhibits faster convergence and better solution quality while maintaining network connectivity.
Figure 5c illustrates the placement of 20 UAM vertiports across New York City obtained from the MST-GA combined with GI. Each green square marks a selected vertiport location, positioned to ensure network connectivity and integration with subway and railway infrastructure. Note that urban passenger demand is represented by a heatmap derived from the public transit ridership data, which shows the effectiveness of the selected vertiport locations to cover the given UAM demand. By mapping the spatial layout of the proposed UAM network onto the actual urban landscape, the figure demonstrates the practical relevance of the proposed approach for large-scale vertiport planning in complex metropolitan settings.
A comparative summary of the two algorithms is presented in
Table 2, highlighting their respective performance in terms of total cost and computational time. Both methods successfully identified connected vertiport networks under the specified maximum flight distance constraint. However, the MST-GA combined with GI achieved a significantly lower total cost of 7.85 × 10
9, compared to 8.48 × 10
9 for the standard MST-GA, representing a reduction of approximately 7.4%. In terms of computational efficiency, the time required to reach the corresponding solution was 5.9 s for the MST-GA combined with GI, whereas the standard MST-GA required 21.1 s; this indicates a 72% reduction in computation time while generating better solution quality. These results confirm that the proposed MST-GA framework, especially when combined with a greedy algorithm, offers an effective and scalable solution for large-scale vertiport location planning. By explicitly incorporating inter-vertiport connectivity constraints, the model addresses a key operational risk: infeasible routing, excessive detours, or network fragmentation. In practice, limited battery range and the absence of reachable alternatives can disrupt service when adjacent vertiports are not within range. Ensuring sufficient connectivity is thus essential for feasible routing, flexible detours, and overall system reliability. Its ability to integrate real-world passenger demand data, enforce spatial and connectivity constraints, and deliver high-quality solutions with reduced computation time demonstrates its potential as a practical decision-support tool for UAM infrastructure design in complex urban environments.
6. Conclusions and Future Research
This study presents a hybrid mathematical framework for the UAM vertiport network planning, aiming to minimize total system cost while ensuring that the selected vertiport locations form a connected network. Unlike previous studies, this work explicitly incorporates connectivity constraints into the UAM vertiport location model, thereby avoiding network configurations that contain isolated nodes. The model balances passenger access cost, infrastructure investment, and network connectivity, which are essential for scalable and resilient UAM network design. To solve this problem efficiently, we propose a hybrid metaheuristic algorithm, referred to as MST-GA combined with GI, which integrates an MST-based connectivity mechanism into a GA. The MST component ensures structural feasibility by maintaining inter-vertiport links within a predefined distance, while the GI strategy generates high-quality initial solutions based on demand and cost. This combination enables efficient search space exploration and improves convergence toward feasible, high-performance solutions.
Extensive numerical experiments on synthetic networks (ranging from 25 to 200 candidate nodes) and a real-world case study in New York City demonstrate the superior performance of MST-GA combined with GI. Compared to the baseline MST-GA and CPLEX benchmarks, the proposed method consistently achieves a lower total cost, stronger feasibility, and significantly reduced runtime. From a computational perspective, MST-GA combined with GI demonstrates strong scalability and robustness. The suggested methodology ensures fast and stable convergence, even in large-scale or complex settings where traditional methods struggle. This study contributes methodologically by showing that integrating MST-based connectivity verification with a GA and a problem-specific GI strategy can substantially improve the efficiency and reliability of metaheuristics for solving large-scale, connectivity-constrained FLPs. Incorporating real-world subway and railway ridership data in the New York City case study further enhances the model’s practical relevance in guiding UAM infrastructure deployment strategies by capturing spatial demand heterogeneity and supporting demand-oriented planning.
While the proposed approach proves to be effective for vertiport planning in the various case studies, future research can extend this framework to enhance its applicability and robustness in complex urban environments. The proposed framework can be extended to address multi-period planning horizons, integration with various public transit systems, uncertainties in network availability, and precise demand estimation methods. First, integrating multi-period planning and network expansion mechanisms would enable phased vertiport deployment strategies aligned with long-term urban development goals. Second, integration with multimodal transportation systems and smart mobility platforms could ensure selected locations align with existing urban mobility patterns and further increase their relevance to holistic urban transport planning. Moreover, exploring alternative connectivity formulations, such as resilience-oriented design or stochastic inter-vertiport link reliability, may further strengthen the robustness of UAM network configurations under uncertainties. Lastly, given that not all public transit passengers are potential UAM users, due to factors such as fare sensitivity, travel purposes, and service expectations, future research should consider more representative demand estimation approaches, including adoption behavior models, stated preference surveys, or market-based forecasts. Integrating tourism mobility data, mobile device location traces, or smart card data in passenger flows could improve the model’s adaptability to evolving urban mobility patterns.


