
Development of an Employability Thinking Scale for Use with Young People in Training: Exploratory and Confirmatory Factor Analysis

 , ,
, ,  ,
,  , and
, and
Abstract
1. Introduction
2. Materials and Methods
2.1. Design and Participants
2.2. Instruments
2.3. Procedure
2.4. Data Analysis
3. Results
4. Discussion
5. Conclusions
Author Contributions
Funding
Institutional Review Board Statement
Data Availability Statement
Acknowledgments
Conflicts of Interest
References
- Karaca-Atik, A.; Meeuwisse, M.; Gorgievski, M.; Smeets, G. Uncovering important 21st-century skills for sustainable career development of social sciences graduates: A systematic review. Educ. Res. Rev. 2023, 39, 100528. [Google Scholar] [CrossRef]
- Spitzberg, B.H.; Cupach, W.R. Interpersonal skills. In The SAGE Handbook of Interpersonal Communication, 4th ed.; Knapp, M.L., Daly, J.A., Eds.; SAGE Publications: Thousand Oaks, CA, USA, 2011; pp. 481–524. [Google Scholar]
- Hastie, R.; Dawes, R.M. Rational Choice in an Uncertain World: The Psychology of Judgment and Decision Making, 2nd ed.; SAGE Publications: Thousand Oaks, CA, USA, 2010. [Google Scholar]
- Facione, P.A. Critical Thinking: What It Is and Why It Counts (2015 Update); Insight Assessment: San José, CA, USA, 2015. [Google Scholar]
- Rivas, S.F.; Saiz, C.; Ossa, C. Metacognitive strategies and development of critical thinking in higher education. Front. Psychol. 2022, 13, 913219. [Google Scholar] [CrossRef]
- Candy, P.C. Lifelong Learning and Information Literacy; White House Conference on School Libraries: Washington, DC, USA, 2002. [Google Scholar]
- Lazorak, O.; Belkina, O.; Yaroslavova, E. Changes in student autonomy via e-learning courses. Int. J. Emerg. Technol. Learn. (iJET) 2021, 16, 209–225. [Google Scholar] [CrossRef]
- Asefer, A.; Abidin, Z. Soft skills and graduates’ employability in the 21st century from employers’ perspectives: A review of literature. Int. J. Infrastruct. Res. Manag. 2021, 9, 44–59. Available online: https://iukl.edu.my/rmc/wp-content/uploads/sites/4/2022/02/5.-Al-Asefer_compressed.pdf (accessed on 20 April 2025).
- Gibb, A.A. In pursuit of a new ‘enterprise’ and ‘entrepreneurship’ paradigm for learning: Creative destruction, new values, new ways of doing things and new combinations of knowledge. Int. J. Manag. Rev. 2002, 4, 233–269. [Google Scholar] [CrossRef]
- Capacities Agenda for Europe Employment, Social Affairs and Inclusion: European Skills Agenda. 2020. Available online: https://employment-social-affairs.ec.europa.eu/policies-and-activities/skills-and-qualifications/european-skills-agenda_en?prefLang=es (accessed on 1 April 2025).
- Organic Law 3/2022, de 31 of March, on the Organisation and Integration of Vocational Training. Available online: https://www.boe.es/buscar/act.php?id=BOE-A-2022-5139 (accessed on 30 March 2025).
- Law 3/2015, of 30 March, Regulating the Exercise of Senior Positions in the General State Administration. Available online: https://www.boe.es/buscar/act.php?id=BOE-A-2015-3444 (accessed on 30 March 2025).
- González-Melgar, C.; Álvarez-Arregui, E.; Rodríguez-Díaz, F.J. Modelo de formación en competencias y empleabilidad: Una mirada desde los colectivos vulnerables. Rev. Educ. Inclusiva 2024, 17, 5–24. Available online: https://revistaeducacioninclusiva.es/index.php/REI/article/view/984 (accessed on 1 April 2025).
- Coetzee, M. Measuring student graduateness: Reliability and construct validity of the Graduate Skills and Attributes Scale. High. Educ. Res. Dev. 2014, 33, 887–902. [Google Scholar] [CrossRef]
- Harvey, L. Defining and measuring employability. Qual. High. Educ. 2001, 7, 97–109. [Google Scholar] [CrossRef]
- Yorke, M.; Knight, P.T. Embedding Employability into the Curriculum; Higher Education Academy: York, UK, 2004. [Google Scholar]
- Kock, N. Advanced mediating effects tests, multi-group analyses, and measurement model assessments in PLS-based SEM. Int. J. e-Collab. (IJeC) 2014, 10, 1–13. [Google Scholar] [CrossRef]
- Hu, L.T.; Bentler, P.M. Fit indices in covariance structure modeling: Sensitivity to underparameterized model misspecification. Psychol. Methods 1998, 3, 424–453. [Google Scholar] [CrossRef]
- Schmitt, T.A. Current methodological considerations in exploratory and confirmatory factor analysis. J. Psychoeduc. Assess. 2011, 29, 304–321. [Google Scholar] [CrossRef]
- Ferrando, P.J.; Lorenzo-Seva, U. A note on improving EAP trait estimation in oblique factor-analytic and item response theory models. Psicológica 2016, 37, 235–247. Available online: https://www.redalyc.org/articulo.oa?id=16946248007 (accessed on 1 April 2025).
- Gürbüz, S.; Joosen, M.C.; Kooij, D.T.; Bakker, A.B.; Van Der Klink, J.J.; Brouwers, E.P. Measuring sustainable employability: Psychometric properties of the capability set for work questionnaire. BMC Public Health 2022, 22, 1184. [Google Scholar] [CrossRef] [PubMed]
- Nasir, H.; Tan, C.S.; Pheh, K.S. The Executive Skills Questionnaire-Revised: Adaptation and psychometric properties in the working context of Malaysia. Int. J. Environ. Res. Public Health 2021, 18, 8978. [Google Scholar] [CrossRef]
- Rodrigues, R.I. Testing the psychometric properties of a short skills inventory for students looking for their first job. BMC Psychol. 2021, 9, 159. [Google Scholar] [CrossRef] [PubMed]
- Marsh, H.W.; Guo, J.; Dicke, T.; Parker, P.D.; Craven, R.G. Confirmatory factor analysis (CFA), exploratory structural equation modeling (ESEM), and set-ESEM: Optimal balance between goodness of fit and parsimony. Multivar. Behav. Res. 2020, 55, 102–119. [Google Scholar] [CrossRef] [PubMed]
- Bonett, D.G.; Wright, T.A. Cronbach’s alpha reliability: Interval estimation, hypothesis testing, and sample size planning. J. Organ. Behav. 2015, 36, 3–15. [Google Scholar] [CrossRef]
- Bennett, M.; Bentley, M. Three-Dimensional Thinking: A Theoretical Model to Enhance Students’ Employability through Problem-Solving. Int. J. Learn. High. Educ. 2021, 28, 189–199. [Google Scholar] [CrossRef]
- Makhsin, M.; Mokhtar, A.A. Soft skills through thinking intelligence to increase employability graduates. Aust. J. Basic Appl. Sci. 2015, 9, 12–18. [Google Scholar]
- Cunningham, W.A.; Preacher, K.J.; Banaji, M.R. Implicit attitude measures: Consistency, stability, and convergent validity. Psychol. Sci. 2001, 12, 163–170. [Google Scholar] [CrossRef]
- Morata-Ramírez, M.; Holgado-Tello, F.P.; Barbero-García, I.; Mendez, G. Análisis factorial confirmatorio: Recomendaciones sobre mínimos cuadrados no ponderados en función del error Tipo I de Ji-Cuadrado y RMSEA. Acción Psicológica 2015, 12, 79–90. [Google Scholar] [CrossRef]
- Pandey, P.; Srivastava, A. Role of Need for Achievement on Decision making and Life Orientation of Young Adults. Youth Voice J. 2022, 1–15. Available online: https://www.researchgate.net/publication/383269988 (accessed on 1 April 2025).
- Tao, V.Y.; Hong, Y.Y. When academic achievement is an obligation: Perspectives from social-oriented achievement motivation. J. Cross-Cult. Psychol. 2014, 45, 110–136. [Google Scholar] [CrossRef]
- Vendrell-Morancho, M.; Rodríguez-Mantilla, J.M.; Fernández-Díaz, M.J. Identificación de Perfiles de Pensamiento Crítico entre el Estudiantado Universitario Español: Un Análisis de Conglomerados con el Método K-Medias. Relieve 2024, 30, art.2. [Google Scholar] [CrossRef]

| M | SD | V | A | K | |
|---|---|---|---|---|---|
| 1. I can communicate my viewpoint clearly and fluently | 4.72 | 1.20 | 1.44 | −0.927 | 0.517 |
| 2. I find it easy to listen and understand what others are saying | 5.01 | 1.09 | 1.20 | −1.311 | 1.660 |
| 3. I find it easy to resolve conflict with other people | 4.45 | 1.21 | 1.47 | −0.677 | 0.099 |
| 4. I can use technology effectively to communicate with others | 5.29 | 1.05 | 1.10 | −1.849 | 3.623 |
| 5. It is easy for me to obtain cooperation and support from others when I work in a team | 4.55 | 1.22 | 1.50 | −0.779 | 0.189 |
| 6. I am capable of searching for more information to improve my understanding of an issue | 4.87 | 1.13 | 1.29 | −0.956 | 0.486 |
| 7. I can adapt my ideas and opinions by clearly presenting them to the people who listen to me | 4.74 | 1.14 | 1.30 | −0.837 | 0.312 |
| 8. I can make decisions both in my life and work so that they are simpler | 4.84 | 1.09 | 1.18 | −0.883 | 0.546 |
| 9. I get ahead of problems in order to creatively resolve them | 4.18 | 1.33 | 1.77 | −0.419 | −0.456 |
| 10. I make sure to perform all necessary tasks when I want to learn something | 4.77 | 1.24 | 1.54 | −0.856 | 0.038 |
| 11. I like to know the most recent news about the subjects that interest me | 4.33 | 1.43 | 2.05 | −0.640 | −0.455 |
| 12. I am interested in developing myself as a person and improving my skills | 5.30 | 1.07 | 1.15 | −1.817 | 3.341 |
| 13. I accept and take on challenging goals with enthusiasm | 4.53 | 1.24 | 1.56 | −0.697 | −0.068 |
| 14. It is easy for me to share my ideas and opinions to convince others | 4.55 | 1.21 | 1.47 | −0.759 | 0.281 |
| 15. I like to present my ideas through simple language | 4.78 | 1.15 | 1.33 | −0.954 | 0.698 |
| 16. It is easy for me to quickly memorise information | 4.16 | 1.42 | 2.03 | −0.481 | −0.581 |
| 17. I consider a wide array of alternatives before making a decision | 4.48 | 1.24 | 1.54 | −0.662 | 0.013 |
| 18. I normally set realistic goals | 4.64 | 1.20 | 1.44 | −0.837 | 0.290 |
| 19. I am capable of making a plan that considers the resources I need | 4.74 | 1.11 | 1.23 | −0.868 | 0.565 |
| 20. It is easy for me to meet deadlines | 4.58 | 1.34 | 1.80 | −0.805 | −0.108 |
| 21. I am capable of establishing ordered priorities to achieve a goal | 4.67 | 1.21 | 1.46 | −0.774 | 0.098 |
| 22. I accept responsibility for my decisions and actions | 5.04 | 1.09 | 1.20 | −1.193 | 1.095 |
| 23. I act in an ethical way in my day-to-day | 4.81 | 1.12 | 1.25 | −0.827 | 0.318 |
| 24. I promote responsible behaviour towards the community and environment | 4.68 | 1.20 | 1.45 | −0.754 | 0.047 |
| 25. It is easy for me to motivate my peers to reach their goals | 4.66 | 1.19 | 1.43 | −0.789 | 0.246 |
| 26. I can understand numerical information and draw conclusions | 4.37 | 1.27 | 1.63 | −0.576 | −0.272 |
| 27. I can organise information and relate it | 4.68 | 1.16 | 1.34 | −0.792 | 0.311 |
| 28. I can analyse information and data rationally | 4.63 | 1.14 | 1.32 | −0.714 | 0.144 |
| 29. I can provide accurate explanations for the information and data that is presented to me | 4.53 | 1.15 | 1.33 | −0.670 | 0.256 |
| F-1 | F-2 | F-3 | F-4 | Uniqueness | |
|---|---|---|---|---|---|
| I-22 | 0.913 | 0.380 | |||
| I-23 | 0.706 | 0.483 | |||
| I-18 | 0.700 | 0.564 | |||
| I-21 | 0.617 | 0.432 | |||
| I-19 | 0.572 | 0.464 | |||
| I-24 | 0.566 | 0.529 | |||
| I-17 | 0.555 | 0.598 | |||
| I-2 | 0.486 | 0.506 | |||
| I-20 | 0.483 | 0.557 | |||
| I-12 | 0.457 | 0.427 | |||
| I-6 | 0.421 | 0.547 | |||
| I-15 | 0.526 | 0.525 | |||
| I-1 | 0.855 | 0.396 | |||
| I-14 | 0.806 | 0.407 | |||
| I-7 | 0.712 | 0.369 | |||
| I-5 | 0.655 | 0.542 | |||
| I-8 | 0.553 | 0.467 | |||
| I-3 | 0.436 | 0.544 | |||
| I-11 | 0.925 | 0.376 | |||
| I-10 | 0.616 | 0.420 | |||
| I-13 | 0.538 | 0.413 | |||
| I-9 | 0.521 | 0.564 | |||
| I-25 | 0.425 | 0.587 | |||
| I-16 | 0.754 | 0.531 | |||
| I-26 | 0.685 | 0.390 | |||
| I-28 | 0.582 | 0.316 | |||
| I-27 | 0.568 | 0.323 | |||
| I-29 | 0.530 | 0.413 | |||
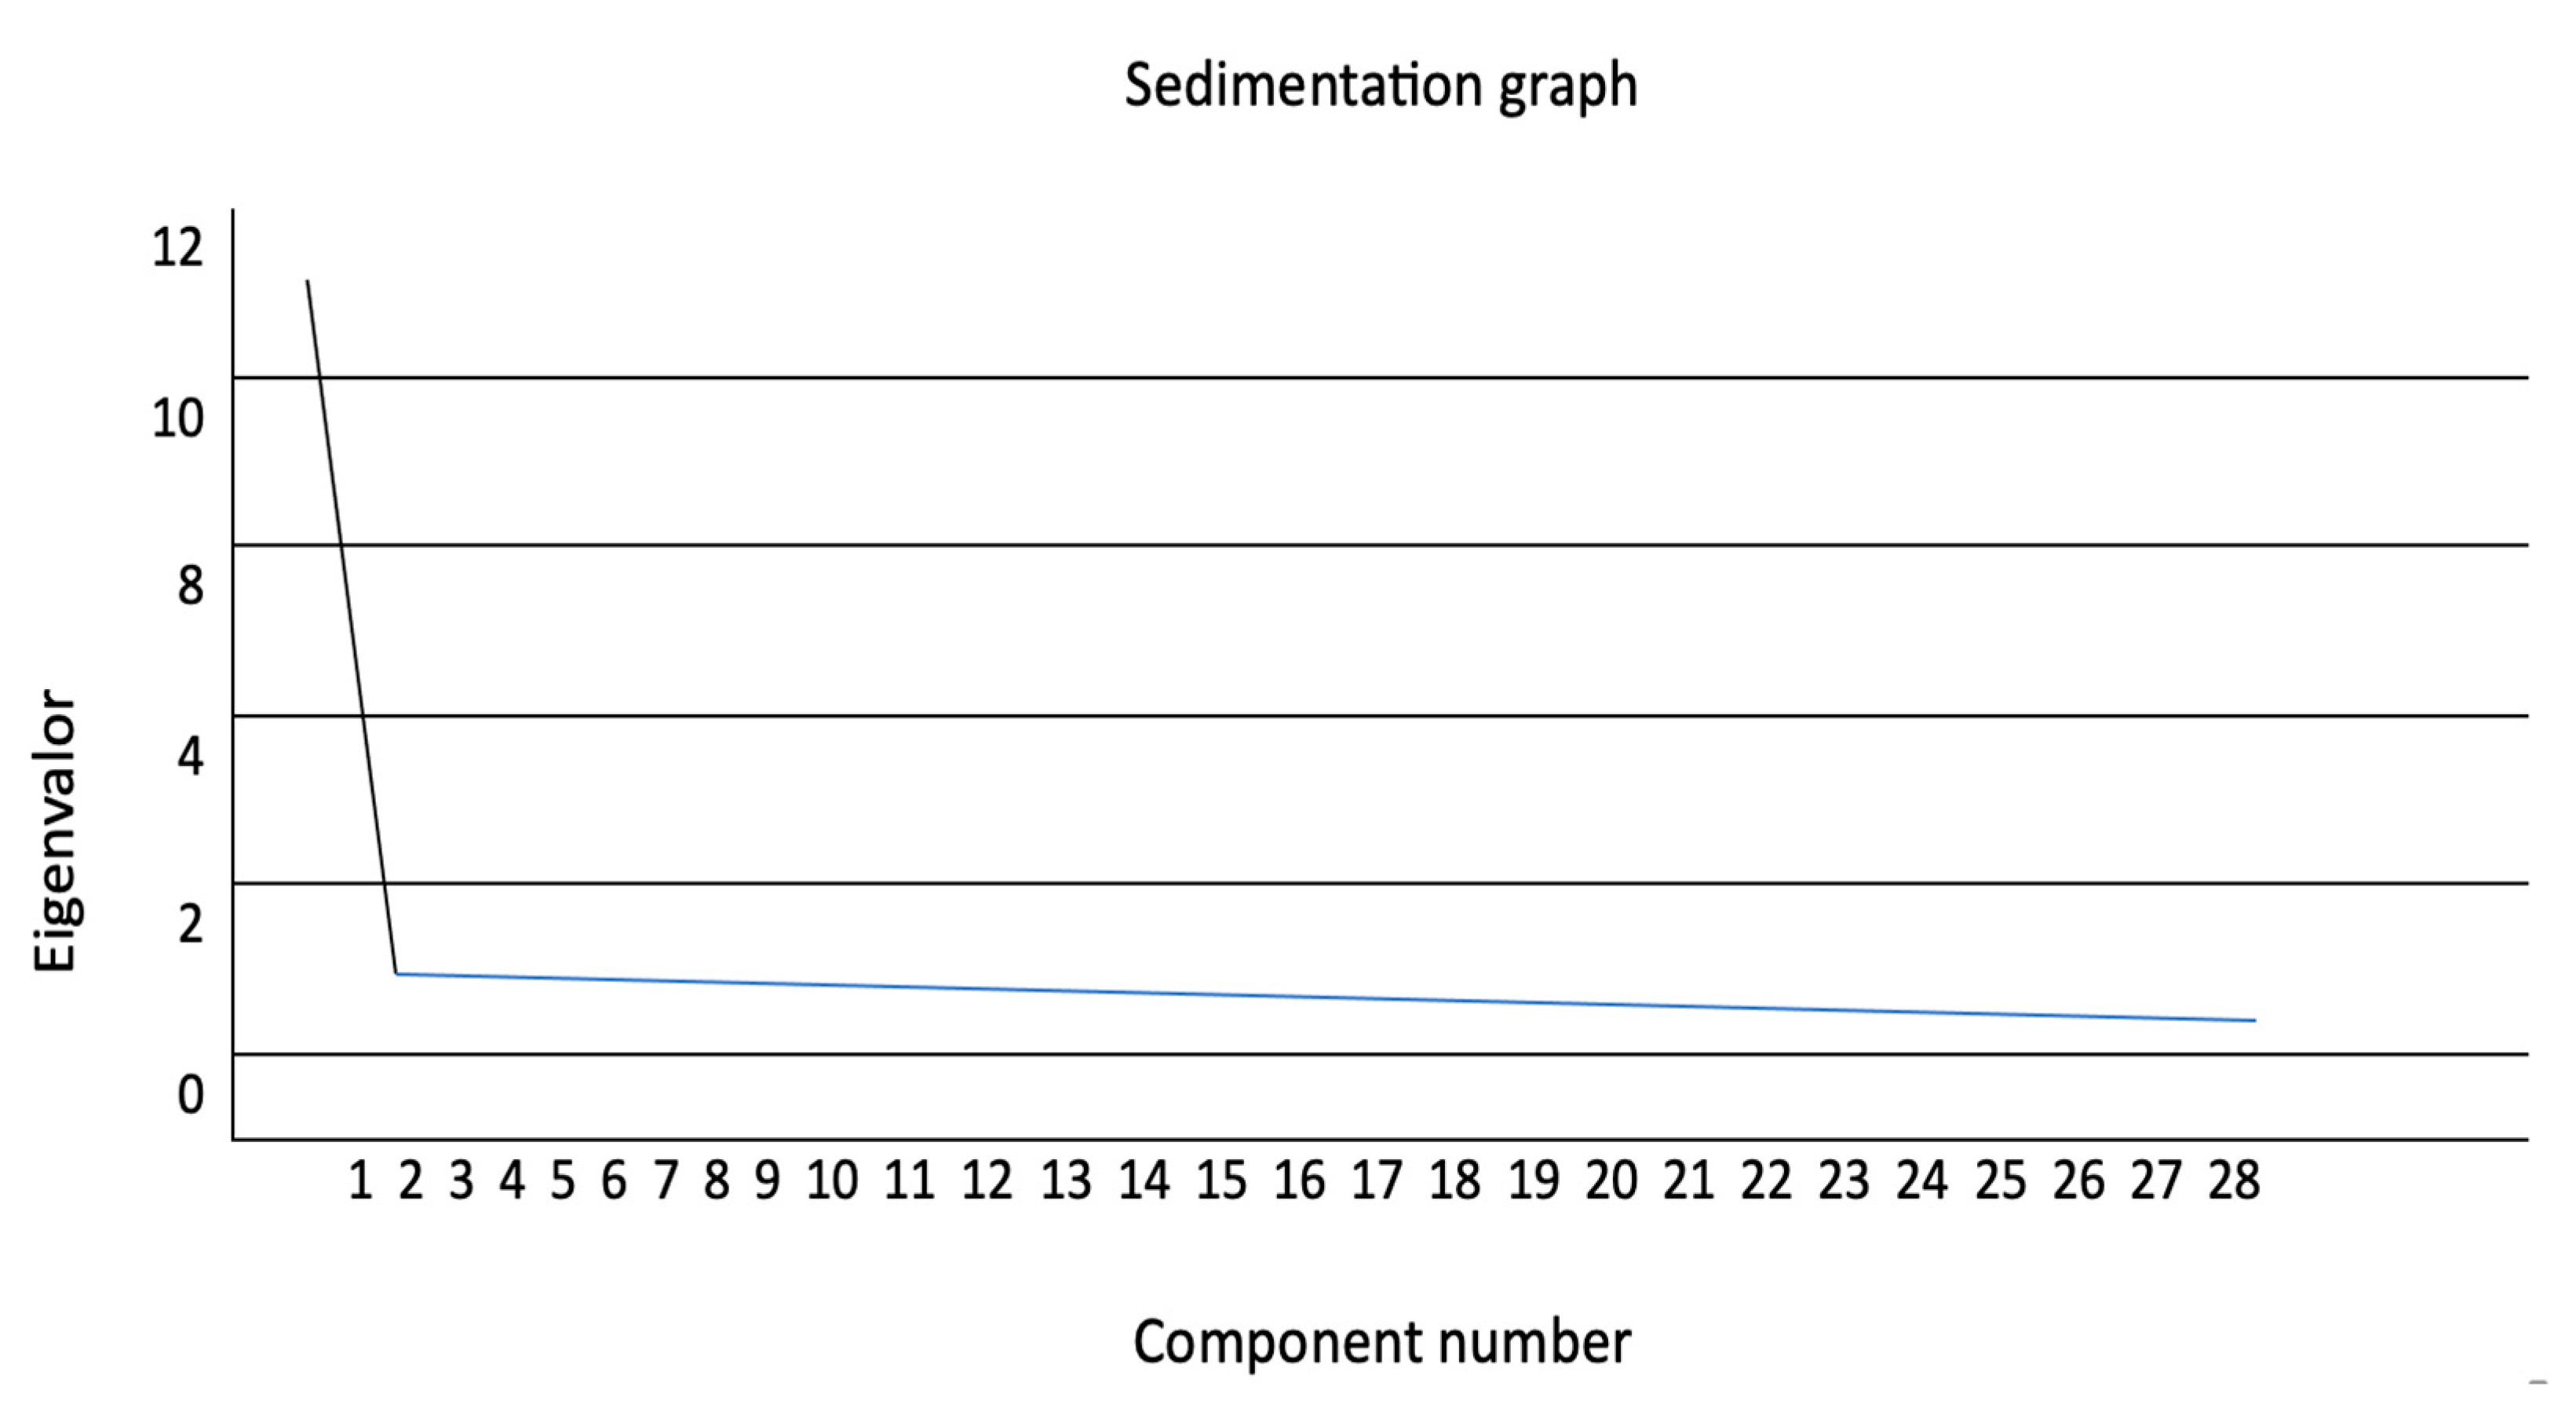
| Eigenvalues | 11.398 | 1.344 | 1.140 | 1.047 | - |
| % explained variance | 15.5% | 12.5% | 9.8% | 8.1% | 46.0% |
| Factorial determination index | 0.829 | 0.837 | 0.842 | 0.788 | - |
| Reliability | α = 0.873 ω = 0.875 | α = 0.836 ω = 0.839 | α = 0.750 ω = 0.754 | α = 0.825 ω = 0.828 | α = 0.940 ω = 0.943 |
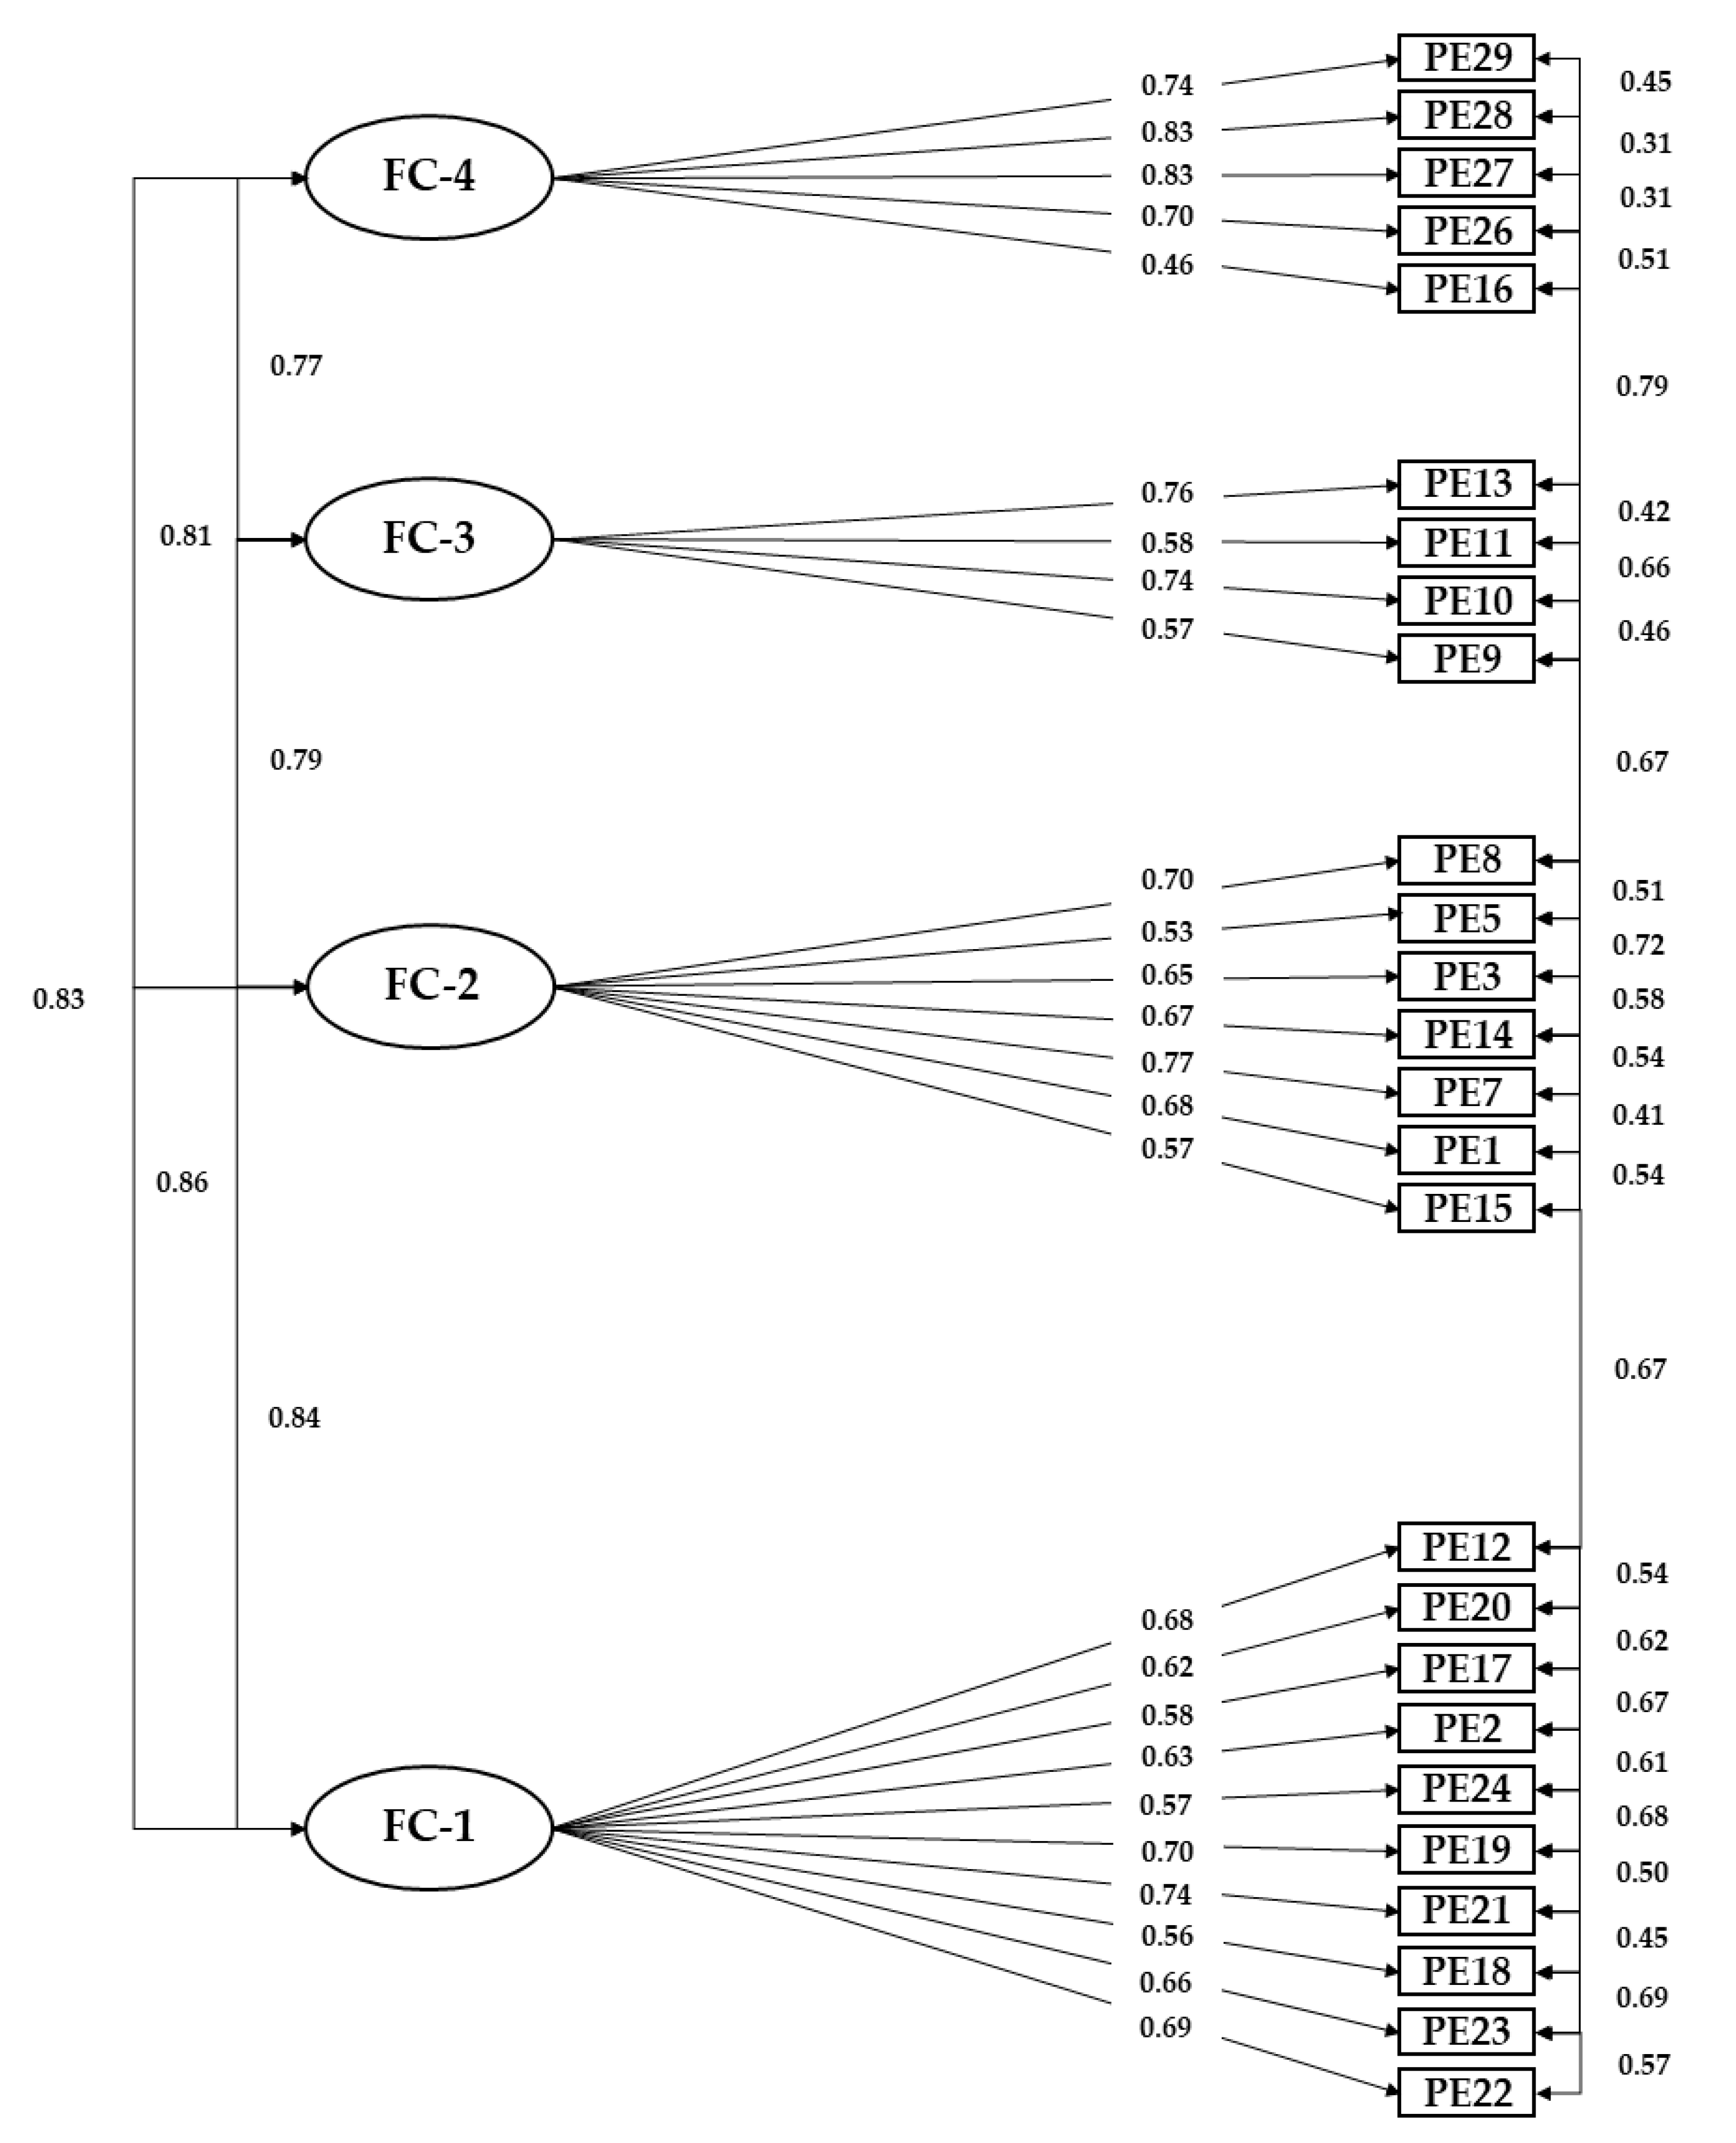
| Factor | Indicator | Estimate | Std. Error | z-Value | p | Lower CI | Upper CI | Std. Est. (All) |
|---|---|---|---|---|---|---|---|---|
| Factor 1 | I-22 | 0.757 | 0.032 | 23.399 | <0.001 | 0.693 | 0.820 | 0.689 |
| I-23 | 0.737 | 0.033 | 22.039 | <0.001 | 0.672 | 0.803 | 0.658 | |
| I-18 | 0.668 | 0.037 | 17.888 | <0.001 | 0.595 | 0.741 | 0.556 | |
| I-21 | 0.898 | 0.035 | 25.883 | <0.001 | 0.830 | 0.966 | 0.741 | |
| I-19 | 0.783 | 0.032 | 24.156 | <0.001 | 0.720 | 0.847 | 0.705 | |
| I-24 | 0.683 | 0.037 | 18.339 | <0.001 | 0.610 | 0.756 | 0.568 | |
| I-2 | 0.689 | 0.033 | 20.753 | <0.001 | 0.624 | 0.754 | 0.628 | |
| I-17 | 0.719 | 0.038 | 18.772 | <0.001 | 0.644 | 0.794 | 0.578 | |
| I-20 | 0.833 | 0.041 | 20.432 | <0.001 | 0.753 | 0.913 | 0.620 | |
| I-12 | 0.728 | 0.032 | 22.994 | <0.001 | 0.666 | 0.790 | 0.679 | |
| Factor 2 | I-15 | 0.661 | 0.036 | 18.310 | <0.001 | 0.590 | 0.731 | 0.573 |
| I-1 | 0.813 | 0.036 | 22.494 | <0.001 | 0.742 | 0.883 | 0.676 | |
| I-7 | 0.879 | 0.033 | 26.863 | <0.001 | 0.815 | 0.943 | 0.769 | |
| I-14 | 0.818 | 0.036 | 22.471 | <0.001 | 0.747 | 0.890 | 0.675 | |
| I-3 | 0.784 | 0.037 | 21.225 | <0.001 | 0.711 | 0.856 | 0.645 | |
| I-5 | 0.649 | 0.039 | 16.663 | <0.001 | 0.573 | 0.726 | 0.529 | |
| I-8 | 0.764 | 0.032 | 23.686 | <0.001 | 0.701 | 0.827 | 0.701 | |
| Factor 3 | I-9 | 0.760 | 0.042 | 17.892 | <0.001 | 0.677 | 0.843 | 0.571 |
| I-10 | 0.914 | 0.037 | 24.639 | <0.001 | 0.842 | 0.987 | 0.737 | |
| I-11 | 0.829 | 0.046 | 18.087 | <0.001 | 0.739 | 0.919 | 0.579 | |
| I-13 | 0.954 | 0.037 | 25.966 | <0.001 | 0.882 | 1.026 | 0.764 | |
| Factor 4 | I-16 | 0.655 | 0.046 | 14.276 | <0.001 | 0.565 | 0.745 | 0.460 |
| I-26 | 0.892 | 0.038 | 23.624 | <0.001 | 0.818 | 0.966 | 0.697 | |
| I-27 | 0.963 | 0.032 | 30.319 | <0.001 | 0.901 | 1.025 | 0.830 | |
| I-28 | 0.955 | 0.031 | 30.357 | <0.001 | 0.893 | 1.016 | 0.831 | |
| I-29 | 0.853 | 0.033 | 25.639 | <0.001 | 0.788 | 0.919 | 0.740 |
| Estimate | Std. Error | z-Value | p | Lower CI | Upper CI | Std. Est | |||
|---|---|---|---|---|---|---|---|---|---|
| Factor 1 | ↔ | Factor 2 | 0.836 | 0.016 | 53.111 | <0.001 | 0.805 | 0.867 | 0.836 |
| Factor 1 | ↔ | Factor 3 | 0.863 | 0.017 | 52.098 | <0.001 | 0.831 | 0.896 | 0.863 |
| Factor 1 | ↔ | Factor 4 | 0.832 | 0.015 | 54.674 | <0.001 | 0.802 | 0.861 | 0.832 |
| Factor 2 | ↔ | Factor 3 | 0.793 | 0.021 | 37.860 | <0.001 | 0.752 | 0.834 | 0.793 |
| Factor 2 | ↔ | Factor 4 | 0.810 | 0.017 | 46.992 | <0.001 | 0.776 | 0.844 | 0.810 |
| Factor 3 | ↔ | Factor 4 | 0.773 | 0.021 | 36.586 | <0.001 | 0.731 | 0.814 | 0.773 |
Disclaimer/Publisher’s Note: The statements, opinions and data contained in all publications are solely those of the individual author(s) and contributor(s) and not of MDPI and/or the editor(s). MDPI and/or the editor(s) disclaim responsibility for any injury to people or property resulting from any ideas, methods, instructions or products referred to in the content. |
© 2025 by the authors. Licensee MDPI, Basel, Switzerland. This article is an open access article distributed under the terms and conditions of the Creative Commons Attribution (CC BY) license (https://creativecommons.org/licenses/by/4.0/).
Share and Cite
Chacón-Cuberos, R.; Rodríguez-Sabiote, C.; Expósito-López, J.; Olmedo-Moreno, E.; Serrano-García, J.; Hortas-Aliaga, O. Development of an Employability Thinking Scale for Use with Young People in Training: Exploratory and Confirmatory Factor Analysis. Systems 2025, 13, 479. https://doi.org/10.3390/systems13060479
Chacón-Cuberos R, Rodríguez-Sabiote C, Expósito-López J, Olmedo-Moreno E, Serrano-García J, Hortas-Aliaga O. Development of an Employability Thinking Scale for Use with Young People in Training: Exploratory and Confirmatory Factor Analysis. Systems. 2025; 13(6):479. https://doi.org/10.3390/systems13060479
Chicago/Turabian StyleChacón-Cuberos, Ramón, Clemente Rodríguez-Sabiote, Jorge Expósito-López, Eva Olmedo-Moreno, Jennifer Serrano-García, and Olga Hortas-Aliaga. 2025. "Development of an Employability Thinking Scale for Use with Young People in Training: Exploratory and Confirmatory Factor Analysis" Systems 13, no. 6: 479. https://doi.org/10.3390/systems13060479
APA StyleChacón-Cuberos, R., Rodríguez-Sabiote, C., Expósito-López, J., Olmedo-Moreno, E., Serrano-García, J., & Hortas-Aliaga, O. (2025). Development of an Employability Thinking Scale for Use with Young People in Training: Exploratory and Confirmatory Factor Analysis. Systems, 13(6), 479. https://doi.org/10.3390/systems13060479