Article

Evolution Model of Emergency Material Supply Chain Stress Based on Stochastic Petri Nets—A Case Study of Emergency Medical Material Supply Chains in China

1
School of Management, Beijing Institute of Technology, Beijing 100081, China
2
Institute of National Security and Development Studies, Beijing Institute of Technology, Beijing 100081, China
*
Author to whom correspondence should be addressed.
Systems 2025, 13(6), 423; https://doi.org/10.3390/systems13060423
Submission received: 29 April 2025 / Revised: 30 May 2025 / Accepted: 30 May 2025 / Published: 1 June 2025
(This article belongs to the Special Issue Systems Methodology in Sustainable Supply Chain Resilience)

Abstract

:
In this study, we conceptualize the demands imposed on emergency supply chains during extraordinary emergency events as “stress” and develop a scenario-based stress evolution (SE) analytical approach in emergency mobilization decision-making. First, we characterize emergency supply chain stress by uncertainty, abruptness, urgency, massiveness of scale, and latency. Leveraging lifecycle theory and aligning it with the event’s natural lifecycle progression, we construct a dual-cycle model—the emergency event-stress dual-cycle curve model—to intuitively conceptualize the SE process. Second, taking China’s emergency medical supply chain as an illustrative example, we employ set theory to achieve a structured representation of emergency supply chain stress evolution (ESCSE). Third, we propose a novel ESCSE modeling methodology based on stochastic Petri nets and establish both an ESCSE model and a corresponding isomorphic Markov chain model. To address parameter uncertainties inherent in the modeling process, the fuzzy theory is integrated for parameter optimization, enabling realistic simulation of emergency supply chain stress evolution dynamics. Finally, the SE of the ibuprofen supply chain in Beijing during the COVID-19 pandemic is presented as a case study to demonstrate the working principle of the model. The results indicate that the ESCSE model effectively simulates the SE process, identifies critical states, and triggers actions. It also reveals the evolution trends of key scenario elements, thereby assisting decision-makers in deploying more targeted mobilization strategies in dynamic and changing environments.

1. Introduction

In recent years, many countries have faced serious challenges in emergency supply and crisis management. These challenges stem from large-scale and unconventional emergencies, including global health crises such as COVID-19 and monkeypox, as well as natural disasters like the Australian bushfires and the Türkiye–Syria earthquake. Emergency supplies serve as essential material guarantees throughout the entire emergency response process, playing a critical role in safeguarding the lives of rescue workers and the general public during such crises.
The physical reserves and production capacity reserves of emergency materials belong to stock reserves, which can only solve the resource supply problems in the early stages of extraordinary emergencies. In the event of large-scale disruptions, the demand for certain emergency materials increases in a stepwise and exponential manner [1]. The existing social stockpiles fall far short of meeting this massive demand [2], necessitating the need to ensure supply through emergency production. A review of past emergency responses consistently shows that the volume of emergency supplies produced through emergency manufacturing significantly exceeds that obtained from stockpiles. This highlights the crucial importance of emergency production as the primary source of supply during unconventional emergencies.
Under normal circumstances, enterprises adjust their production scales based on market demand and typically refrain from expanding output blindly. However, when an emergency event occurs, firms may be mobilized to revise production plans, resulting in increased output. As the foundational unit of modern production systems, the supply chain plays a critical role in enabling sustained and stable supply. Only by leveraging supply chain structures can emergency production be effectively scaled up to meet surging demand promptly.
Recent extraordinary emergencies have shown that unpredictable disruptions in emergency material supply chains can lead to severe supply–demand imbalances. These events have exposed both the vulnerability of such supply chains and the weaknesses in coordinated scheduling mechanisms. Therefore, this study takes the supply chain of emergency materials as the research object, paying particular attention to the supply and demand balance of emergency materials under extraordinary emergencies.
Current research on emergency supply chains primarily focuses on four key areas: supply chain risk management [3,4,5], supply chain design [6,7,8,9,10], supply chain optimization [11,12,13,14,15,16], and supply chain performance evaluation [17,18,19,20,21,22].
Studies on supply chain risk management center around risk identification and risk assessment. Risk identification involves detecting all potential risk points that may affect the operation of enterprises and the supply chain, including internal risks such as equipment failures and production accidents, as well as external risks like natural disasters, cyberattacks, and transportation incidents. Risk assessment typically evaluates risks based on their probability of occurrence and severity of impact, which information is used to prioritize risk management efforts. Commonly adopted methods include Bayesian analysis, bow-tie analysis, probability/severity matrices, event tree analysis (ETA), failure mode and effects analysis (FMEA), hazard and operability studies (HAZOP), and Ishikawa cause-and-effect diagrams [3]. In the domain of supply chain design, researchers construct supply chain networks using mathematical tools under constraints such as time [6,8,10], humanitarian behavior [8], cost [7,10], and disruption scenarios [9]. Research on supply chain optimization typically focuses on specific problems and defines optimization objectives to develop quantitative models. The research on supply chain design and optimization is basically interrelated. Based on the analysis of real influencing factors, the optimization objectives are centered around time [11,13], cost [12,15], reliability [14,16], path selection [13], etc., and mathematical models are designed and developed. Researchers often consider the uncertainty of parameters in the modeling process and establish robust optimization models for a solution. Research on supply chain performance evaluation mainly emphasizes the identification of influencing factors and the analysis of their effects on overall performance [17,18,19,20,21,22].
Although these research areas have become relatively mature, they all focus on specific segments or aspects of the emergency supply chain, and a holistic analysis of supply–demand imbalances across the entire lifecycle of an emergency event is lacking. Research on supply chain risk management and performance evaluation tends to emphasize the identification of risk points, the probability of disruptions, and the identification and performance of influencing factors. However, in practice, decision-makers often have limited capacity to predict low-probability but high-impact events. Regardless of the source of disruption, the critical issue lies in understanding and managing the consequences. Regardless of the cause of a disruption, its impact does not depend on the cause, and the mitigation measures adopted are typically similar across scenarios [3].
Studies on supply chain design and optimization often abstract key constraints and define optimization objectives, which provide valuable direction for improving supply chain performance. Nevertheless, due to the limitations of mathematical modeling methods, such approaches frequently rely on simplified assumptions, making it difficult to exhaust the factors that need to be considered. Consequently, these models may not adequately account for the full range of factors influencing supply chain dynamics during emergency events. Research on supply chain performance evaluation also has the same problem of not fitting the actual complex system environment of emergencies.
In the international context, the term humanitarian supply chain is often used in a manner similar to emergency supply chain [12,14], as both focus on rapid response and efficient distribution of critical materials during disruptive events to mitigate disaster impacts and ensure that basic needs are met. The methodologies applied in studying both systems are largely similar, and some studies even treat them as interchangeable. However, other research distinguishes between the two, primarily based on decision-making complexity: emergency supply chains are government-led, whereas humanitarian supply chains involve multi-stakeholder coordination among governments, businesses, and civil society organizations [23]. This study specifically addresses the supply of emergency materials during extreme and unconventional emergencies. As noted earlier, in such scenarios, emergency supplies are primarily sourced through urgent production. Therefore, the focus of this research is on emergency supply chains, in contrast to humanitarian supply chains, which often rely on broader mobilization efforts such as social donations.
Building upon the above analysis, this study conceptualizes the demand within emergency supply chains as a form of “stress”. Adopting a scenario-based response framework, we examine the evolution of this stress throughout the entire lifecycle of an emergency event. This approach enables a more macro-level analysis of the emergency supply chain system. The primary objective of this research is to analyze the trend and law of the evolution of stress in emergency supply chains and to propose robust methods for accurately identifying its causes and influencing factors. We contend that this perspective is of substantial significance for enhancing emergency capacity building, strengthening mobilization capabilities, and quickly responding to the challenges brought by emergencies.
The remainder of this paper is organized as follows. Section 2 presents a comprehensive literature review. Section 3 constitutes the theoretical core of this study, where we propose a novel concept of stress in emergency supply chains, analyze its sources and characteristics, and construct an emergency event-stress dual-cycle curve model based on lifecycle theory. Section 4 introduces a method for structuring the evolution process of emergency material supply chain pressure proposed using set theory, with a detailed application and analysis based on China’s emergency medical supply chain. In Section 5, we propose a new ESCSE (emergency supply chain stress evolution) modeling method· based on stochastic Petri nets. We develop both the ESCSE model and a corresponding isomorphic Markov chain model. To address inherent parameter uncertainty in the modeling process, we incorporate fuzzy theory to optimize parameters and enable realistic simulation of stress evolution dynamics. Section 6 demonstrates the application of the proposed model using the case of the ibuprofen supply chain in Beijing. Finally, Section 7 summarizes the conclusions and outlines potential directions for future research.

2. Literature Review

2.1. Research on Supply Chain Pressure

At present, there is no universally accepted definition of “supply chain stress”. Existing research reveals two primary interpretations of the concept. The first interpretation draws on the psychological concept of “stress”, defining supply chain stress as a form of pressure or heightened awareness induced by external environmental changes, which compels supply chain management to adapt [24,25,26]. The second interpretation is adapted from the idea of stress testing in the financial sector, treating supply chain stress testing as a tool for risk assessment; under this view, supply chain stress is considered a collection of factors that may lead to disruptions or disorder within the supply chain [4,5,6,7,8,9,10].
Studies aligned with the first interpretation are mainly related to issues of corporate competitiveness. For instance, Zhu Qinghua et al. [24] identified the key drivers of green supply chain management pressure/dynamics among Chinese manufacturing enterprises through survey analysis, offering theoretical guidance for the early-stage adoption of green supply chain practices domestically. Qu Ying et al. [25] used statistical methods to rank the influencing factors of green supply chain management, pinpointing the strengths and weaknesses in implementing green strategies within China’s manufacturing sector. Similarly, Huang Wei et al. [26], based on survey data from 1268 Chinese enterprises, found that supply chain stress under globalization pressures promoted the entry of foreign enterprises into domestic supply chains, thereby enhancing corporate motivation to fulfill social responsibility.
The second interpretation draws inspiration from the idea of stress testing in the financial sector and applies it to the domain of supply chain risk management. Stress testing, originally developed as a quantitative risk assessment technique for extreme events in the financial sector, assesses the impact of macroeconomic shocks on the entire economic system by simulating extreme market scenarios and examining the robustness of key financial variables. Scholars have adapted this core idea to analyze how changes in external or internal conditions affect supply chain operations, thereby advancing the study of stress testing within supply chains.
In related theoretical studies, several scholars have explored supply chain risk management from the perspective of stress testing. Yao Weixin et al. [27] proposed a stress-testing approach for extreme supply chain risks by analyzing the unique risk transmission mechanisms within supply chains. Furthermore, Yao Weixin et al. [28] conceptualized stress testing as a proactive measure and positioned the design and construction of resilient supply chains as essential responses to extreme events. They highlighted the necessity of resilience and outlined key design principles. Specifically, they proposed core strategies for enhancing supply chain resilience, including improving responsiveness, increasing flexibility, maintaining appropriate inventory buffers, establishing a multi-layered defense structure, adopting multi-sourcing, and implementing demand postponement. Cannella et al. [29] conceptualized supply chain stress testing as the simulation of sudden and severe demand fluctuations and assessed how collaborative practices and smoothing replenishment rules could mitigate the bullwhip effect, stabilize inventories, and enhance both supply chain performance and customer service levels. Lan Luo [30,31] proposed a predictive global sensitivity analysis approach to construct a quantitative tool for supply chain stress testing. By establishing a multi-tier supply chain network linear programming model, this method simulates scenarios involving node disruptions caused by emergency events. Ivanov and Dolgui [32] advocated for the systematic review and stress testing of supply chain resilience, proposing the use of digital supply chain twins as a tool for conducting comprehensive stress tests. Building on this foundation, Ivanov [33] moved beyond the traditional focus on “recovery capability” and introduced a new framework centered on “adaptive survivability”, further elaborating on the feasibility of applying digital twins for supply chain stress testing and resilience analysis.
In addition, on 18 April 2022, the SAIC Motor Corporation conducted stress testing on its vehicle, parts, and logistics enterprises, focusing on supply chain security, logistics assurance, and closed-loop production management. This initiative aimed to validate the enterprises’ readiness for the resumption of operations under COVID-19 disruptions, identify strengths and weaknesses, and provide support for the gradual recovery of production capacity [34].
Among the aforementioned studies, research related to the first interpretation primarily relies on survey data and expert consultations, making the findings subject to a certain degree of subjectivity due to limitations in sample size. Research aligned with the second interpretation has effectively demonstrated, from both theoretical and practical perspectives, the applicability of stress-testing concepts within the field of supply chain risk management. However, fundamental aspects such as the basic theories of stress, its evolutionary patterns, and transmission mechanisms have yet to be systematically explored. Consequently, the theoretical foundation and implementation frameworks for supply chain stress testing still require long-term, comprehensive research.
This study focuses on the emergency supply chain under the context of extraordinary emergency events, where extreme disruptions lead to significant supply–demand imbalances. In this regard, we revisit the original meaning of “stress” as defined in the field of physics and conceptualize the demand borne by the emergency supply chain as a form of stress. A detailed discussion of this conceptualization is provided in Section 3.2.

2.2. Supply Chains for Emergency Medical Supplies

Research on emergency medical supply chains remains relatively limited. Existing studies can largely be categorized into two streams: (1) research focusing on the management of emergency medical supply chains and (2) decision-support studies for emergency medical supply responses from a supply chain perspective.
In the field of emergency medical supply chain management, a common methodological approach is the construction of mathematical models for problem analysis. Many researchers leverage the SEIR epidemiological model and its variants to investigate issues such as equilibrium optimization [35], resource allocation [29,36], stockpiling strategies [37], and demand forecasting [35,38]. For example, Sun et al. [35] integrated a three-tier emergency medical supply chain model with embedded resilience features and the SEIR model, developing a bi-objective mixed-integer programming model aimed at minimizing expected total supply chain costs while maximizing demand fulfillment rates. Their study explored supply chain network design that balances cost efficiency with resilience. Paul et al. [38] coupled a generalized infectious disease spread model (SEITRS) with a multi-tiered supply chain model to build an integrated system dynamics model. Using representative datasets from the 2013–2014 U.S. H1N1 influenza pandemic, they analyzed how pharmaceutical shortages impact key epidemic parameters, revealing that drug supply chains significantly affect epidemic dynamics.
Similarly, Büyüktahtakın et al. [36] embedded logistics considerations within a spatially explicit SEIR model, proposing an epidemic–logistics hybrid optimization framework that simultaneously addresses the spatial spread of infectious diseases and emergency resource allocation, thereby suggesting optimal intervention strategies. Queiroz et al. [39] systematically analyzed the impacts of epidemics on supply chains, applying optimization techniques and SEIR-based models to study both conventional resource allocation and pandemic-specific medical supply distribution, and proposed a framework for operations and supply chain management during the COVID-19 pandemic. Paul et al. [40], focusing on pharmaceutical supply chain management under conditions of deep uncertainty, found that proactive ordering and tier reduction strategies can significantly mitigate epidemic impacts, based on an extended shortage model integrated with their previous work [38]. Liu and Zhang [41] combined an SEIR-based demand prediction mechanism with a hybrid 0–1 integer programming logistics system to propose a dynamic resource allocation model, addressing transportation decisions across hospitals, distribution centers, and pharmaceutical manufacturers through the stages of forecasting, planning, execution, and adjustment. Huo et al. [37] considered both temporal and spatial dimensions in modeling demand fluctuations for masks induced by epidemic spread, proposing strategies for establishing and rotating emergency stockpiles of medical supplies.
Research specifically addressing decision support for emergency medical supply responses from a supply chain perspective is relatively sparse. The existing literature focuses on areas such as information collection during public health emergencies [42], decision-support system development [43], and supply chain decision-making under psychological biases [44]. Anparasan et al. [42] highlighted that developing countries often lack robust decision-support capabilities for infectious disease outbreaks and compiled detailed time-series datasets from the cholera outbreak following the 2010 Haiti earthquake to aid the development of descriptive and prescriptive models. Govindan et al. [43] proposed a fuzzy inference system (FIS)-based decision-support framework that uses physicians’ knowledge to classify individuals by infection status, aiming to better manage medical supply chain demand and thus curb the spread of viruses. Shi et al. [44] investigated how overconfidence and other psychological biases among emergency decision-makers impact supply chain operations, offering insights into the linkage between cognitive biases and medical resource allocation strategies, thereby supporting governmental emergency response planning. Song Y. et al. [45] proposed a modeling and analysis approach for emergency scenario evolution systems based on Generalized Stochastic Petri Nets (GSPNs), aiming to enhance scenario-based response decision-making capabilities in emergency management.
Notably, most existing studies address isolated problems—such as resource allocation [29,36], stockpiling [37], and demand forecasting [35,38]—without accounting for the complex and interdependent nature of challenges that public health emergencies pose to emergency medical supply chains. Unlike natural disasters, accidents, or social security incidents, public health emergencies caused by epidemic outbreaks have distinct characteristics: unpredictable cycles and scales; compound transmission, where supply chain disruptions are entangled with virus spread through human mobility; and simultaneous breakdowns of supply, demand, and logistics infrastructures [46].
A retrospective analysis of emergency supply challenges during the COVID-19 pandemic reveals that surging demand for medical supplies quickly overwhelmed existing supply capacities. Public fear—amplified by media reports and social contagion—triggered speculative demand characterized by panic buying and hoarding. This behavior reflects a self-feedback loop in which perceived scarcity drives excessive consumer response, further exacerbating actual shortages and disrupting supply chain stability. Public fear and media influence led to panic buying and hoarding behaviors, further inflating demand. Opportunistic profiteering exacerbated resource imbalances and drove up prices, highlighting inefficiencies in resource allocation. These realities underscore the need for governments to engage in comprehensive emergency mobilization efforts encompassing potential demand assessments [47], rapid capacity expansions [48,49], efficient resource allocation [50], and media control strategies [51]. Thus, to enhance the responsiveness and resilience of emergency medical supply chains, it is critical to address overarching strategic issues through a more integrated and macro-level decision-making framework.

3. Fundamental Theories of Stress Evolution in Emergency Supply Chains

3.1. Distinction Between Traditional Commercial and Emergency Supply Chains

Traditional commercial supply chains are essentially functional network structures that deliver products to consumers—from raw material procurement to the production of intermediate and final goods—with the ultimate goal of generating profit under normal operating conditions. Emergency supply chains, in contrast, are transformed from regular supply chains and operate under crisis conditions. They are state-driven and focus on national economic infrastructure to maximize time efficiency and minimize disaster losses. These chains include government-led planning, management, and control, forming a virtual dynamic supply chain alliance. Essentially, they represent the supernormal supply of emergency materials. This results in significant differences between the two types of supply chains, which can be summarized in the following aspects.
  • Level of risk
The context of emergency supply chains is typically linked to sudden, unforeseen events. These events are characterized by randomness and high destructiveness, and when they affect any part of the supply chain, they often lead to disruptions or varying degrees of fluctuations. For example, Hurricane Katrina in 2005 severely damaged transportation infrastructure, energy facilities, and communication systems across the U.S. Gulf Coast [52]. The initial natural disaster was compounded by secondary effects—including widespread flooding, the collapse of local healthcare systems, and outbreaks of waterborne diseases—all of which significantly disrupted emergency supply chain operations. Such compound risks amplify uncertainty and response complexity in emergency supply chains. In contrast, traditional commercial supply chains typically operate under relatively stable conditions, where companies at each node forecast market demand and develop corresponding production and ordering plans.
2.
Demand characteristics
Traditional commercial supply chains operate in stable environments, where demand is forecastable based on historical trends, allowing for planned production and procurement. In contrast, emergency supply chains face abrupt shifts in demand. Items that are ordinary commodities under normal conditions may become critical resources once a crisis emerges. Consequently, demand can surge unpredictably(as shown in Figure 1), accompanied by high uncertainty, urgency, and a lack of discernible patterns. These characteristics impose substantial challenges on emergency supply chains in terms of responsiveness and coordination.
3.
Objectives
Traditional commercial supply chains primarily aim to maximize economic profit. In contrast, emergency supply chains focus on meeting urgent demand efficiently, reflecting weak economic orientation. Their core objective is the rapid delivery of critical supplies within limited timeframes. This is evident in several ways: First, governments regulate prices to prevent inflation during crises. Second, authorities may initiate emergency production protocols, supported by incentives such as “supply first, payment later” or post-crisis subsidies. Third, participating firms often align their actions with corporate social responsibility, adjusting production from profit-driven goals to utility maximization under emergency conditions.
4.
Regulatory mechanisms
Traditional commercial supply chains operate under market-driven frameworks, where firms independently make production and sales decisions, and resource allocation is guided by competition, autonomy, and pre-established agreements.
In contrast, emergency supply chains are primarily directed by state authorities and function as mechanisms for resource allocation and production mobilization within a regulated economic coordination framework. In addition to commercial actors, the government plays a central role in coordinating the supply of critical goods. Depending on the nature and scale of the emergency, supply chain operations may involve joint efforts by multiple public sector agencies—including, but not limited to, emergency management departments, transportation authorities, healthcare institutions, and energy regulators. In the case of large-scale disasters, national armed forces, reserve troops, and civil defense organizations may be rapidly deployed to participate in emergency mobilization, thereby ensuring the efficient operation and responsiveness of the emergency supply chain.
5.
Inventory strategies
Commercial supply chains adopt lean inventory models to reduce costs and improve efficiency. In contrast, emergency supply chains operate within a far more volatile and uncertain external environment, where internal supply network structures are highly susceptible to disruption or distortion during crisis events. As a result, material reserves emerge as a critical component and one of the primary sources for emergency supply provisioning.
Under such conditions, material reserves are not only indispensable but also sized strategically. Maintaining an appropriate level of safety stock becomes a critical buffer to absorb supply–demand shocks, mitigate lead-time uncertainties, and ensure continuity of relief operations. The scale of these reserves must be calibrated based on risk exposure, response time requirements, and supply chain criticality to balance cost and preparedness.
6.
Stages
Traditional commercial supply chains are primarily driven by economic interests, with a core focus on production and sales activities. These supply chains typically operate in stable environments and do not exhibit pronounced cyclical fluctuations. In contrast, the emergency supply chain operates across distinct temporal phases that correspond to the evolution of crisis events. Specifically, the supply chain is often segmented into three phases—pre-incident, during-incident, and post-incident—based on the timing of the emergency event. This tripartite classification is consistent with widely accepted frameworks in modern emergency management and supports more effective planning and resource allocation across distinct response phases.
7.
Delivery cycle
In traditional commercial supply chains, the operating environment tends to be stable, allowing for clearly defined and predictable delivery cycles. In contrast, emergency supply chains are typically activated in response to sudden-onset events and are primarily coordinated by government authorities. Within this context, supply chain actors operate under a task-oriented framework, where timeliness of emergency material delivery takes precedence over adherence to fixed delivery schedules. As a result, emergency supply chains lack standardized delivery cycles and must remain highly responsive and flexible in their operations.

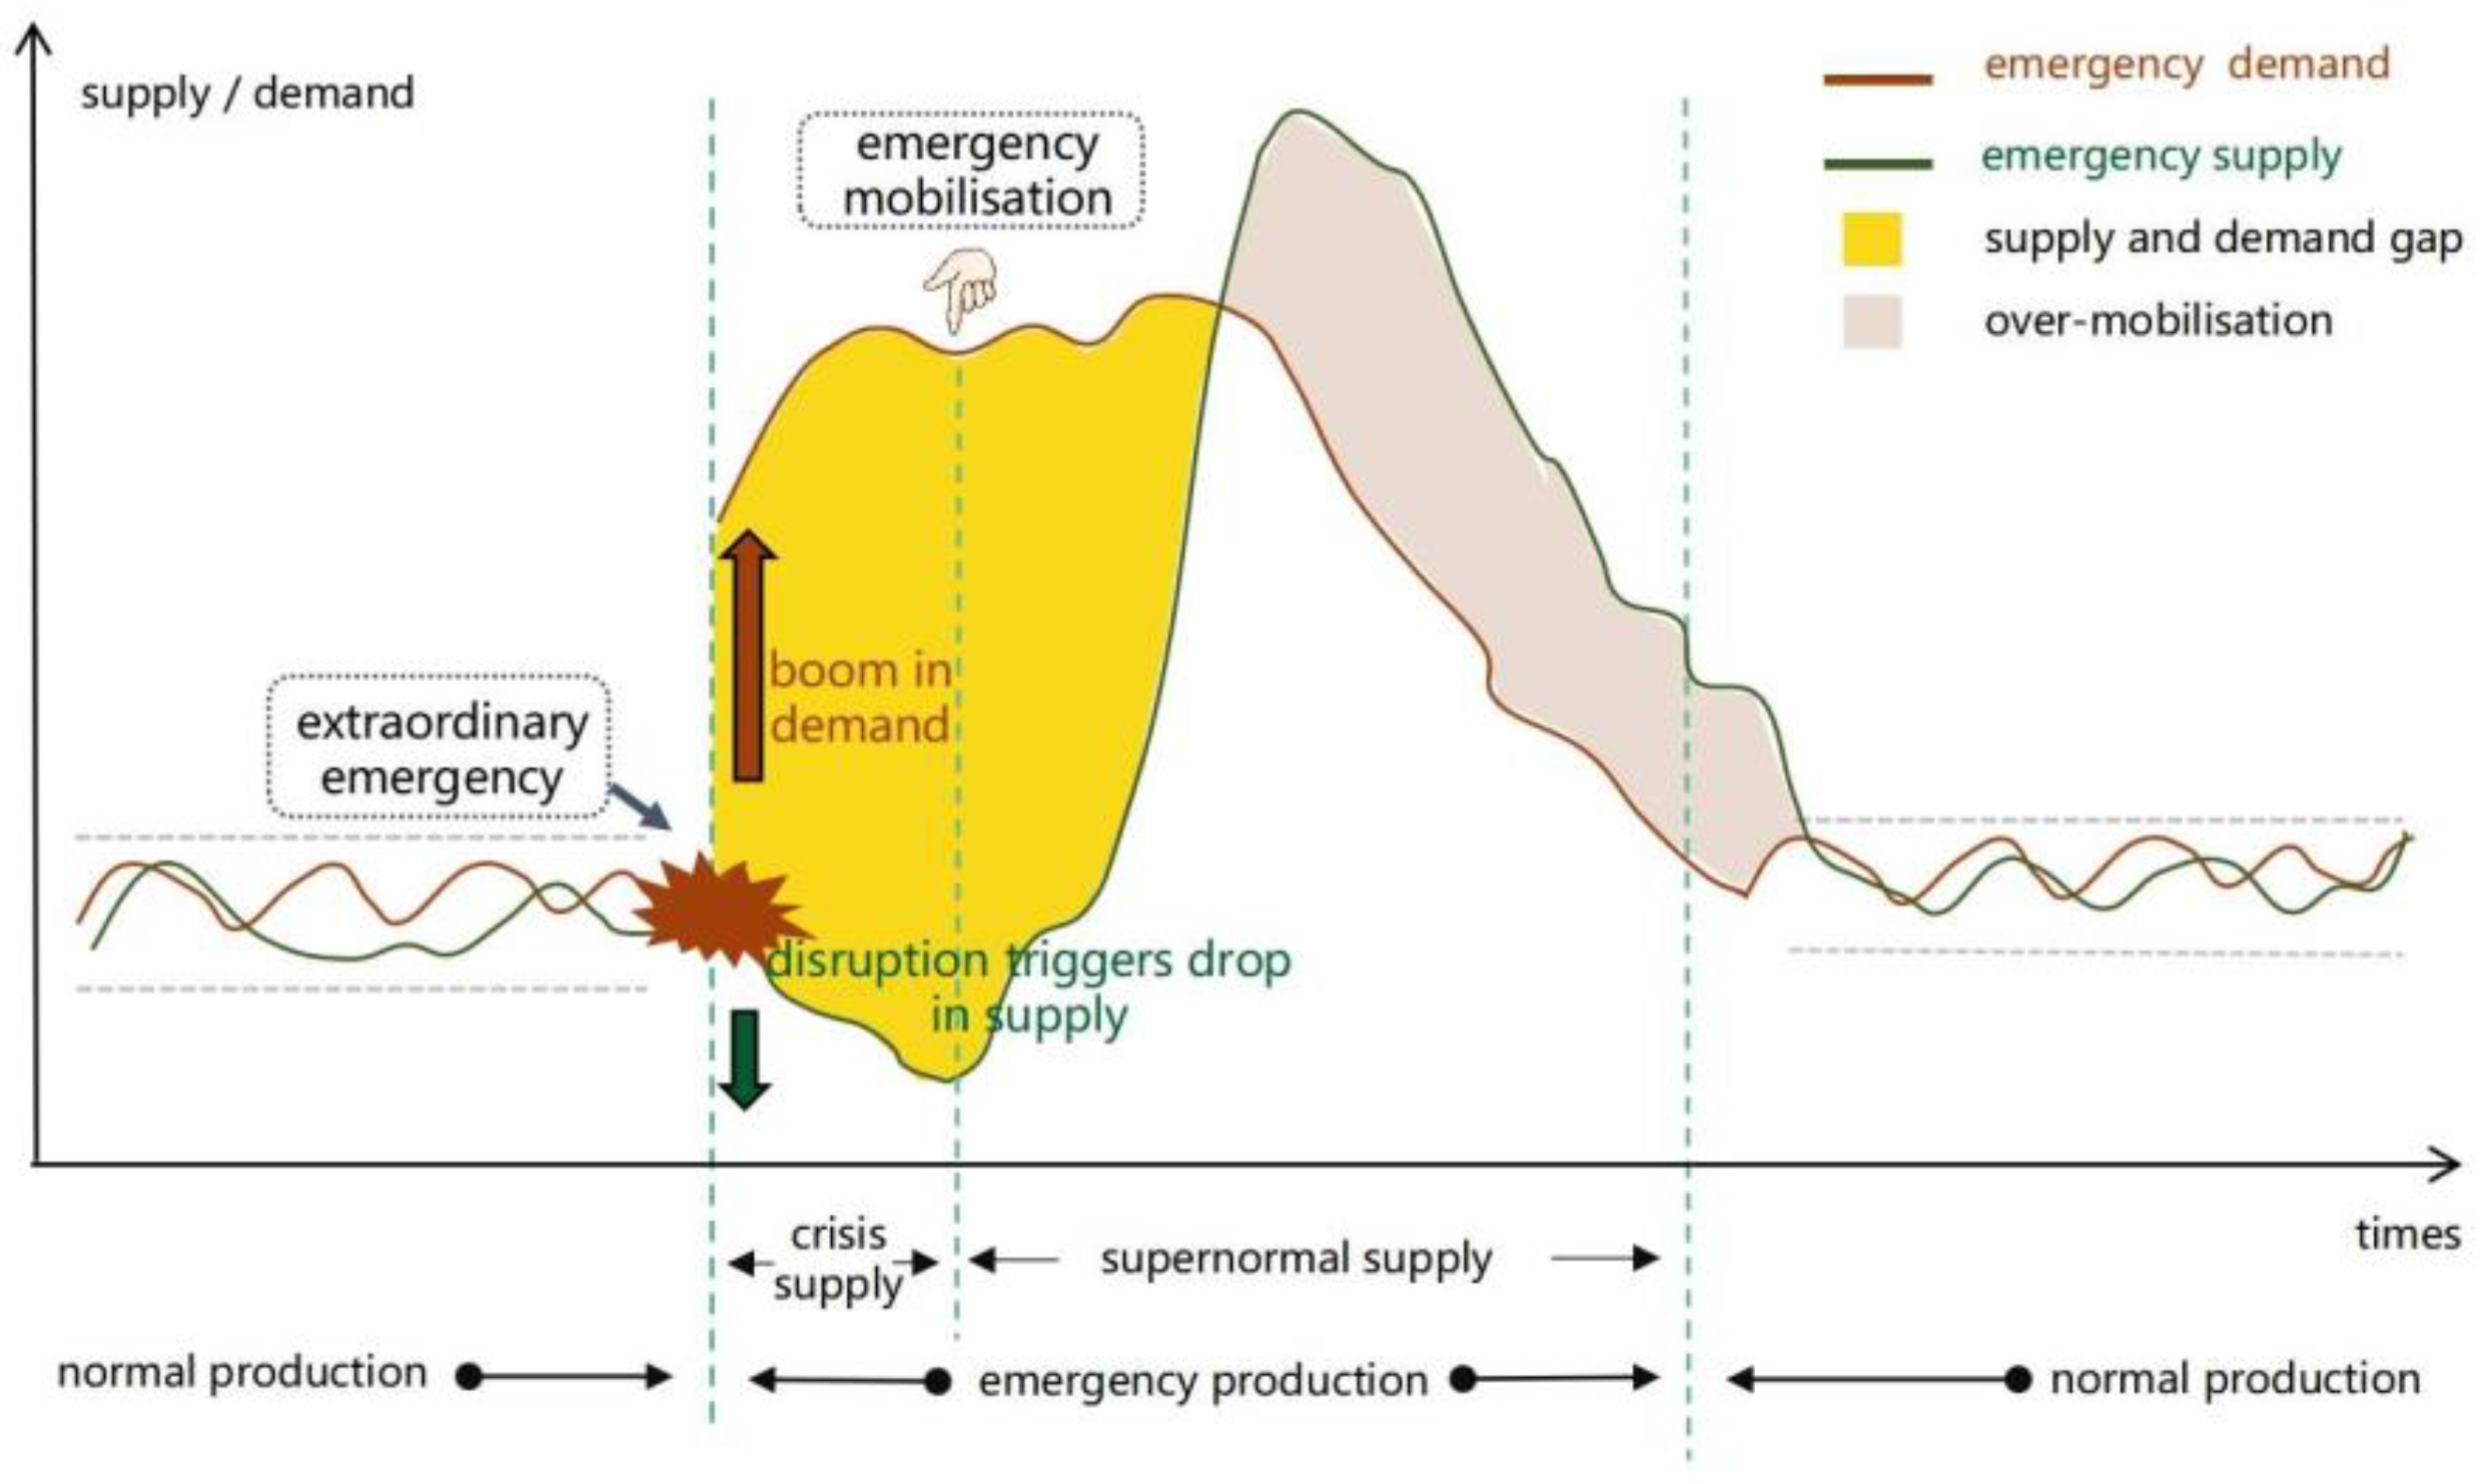
3.2. The Concept of Emergency Supply Chain Stress (ESCS)

Although the explicit introduction of the concept of stress in management studies lacks a documented origin, its conceptual roots can be traced back to the late 19th century, during the latter phase of the Industrial Revolution. In Frederick Taylor’s theory of scientific management, the term “stress” was not directly employed; however, the imposition of time quotas and standardized procedures effectively created a model of efficiency-driven pressure, reflecting an early form of operational stress.
In the 1930s, the Hawthorne experiments conducted by Elton Mayo and his team unveiled a nonlinear relationship between the physical work environment and psychological stress, which subsequently laid the theoretical foundation for the development of role stress models. Beginning in the mid-20th century, with the rise of organizational behavior and human resource management as distinct research domains, scholars began to explicitly examine stress within managerial frameworks. Within this context, stress has been broadly conceptualized as the physiological or psychological responses elicited by changes in workplace conditions or organizational factors. These responses may exert either beneficial or detrimental effects on employees’ mental and physical health.
Contemporary research in this field predominantly focuses on three key dimensions: identifying sources of stress, defining performance-related stress thresholds, and designing effective intervention strategies. These areas form the core of stress-related inquiry in management, reflecting the interdisciplinary integration of psychological theory within organizational contexts.
While the concept of stress has been addressed within the field of management, its application has largely been confined to organizational behavior and human resource management, where it primarily draws upon theoretical and empirical developments from psychology and medicine. This study posits that the notion of “load-bearing limits” in physics offers a conceptually robust framework for analyzing emergency material supply under sudden-onset events. Fundamentally, such scenarios involve abrupt changes in external conditions—most notably, surges in emergency material demand—which exert pressure on the emergency supply chain. This type of systemic response to fluctuating demand conditions closely parallels the definition of stress in the physical sciences, where external forces induce strain on a structure or system.
Building upon the above insights, this study critically examines and integrates conceptualizations of stress across multiple disciplines and introduces the concept of stress into the context of emergency material supply chains. In this framework, emergency supply chain stress (ESCS) is defined as the level of demand exerted on the supply chain during the onset of an emergency event. Notably, this type of demand differs fundamentally from that in traditional commercial supply chains, which are typically governed by market mechanisms and driven by the goal of profit maximization. Instead, it refers specifically to demand arising under a regulated economic framework, where the timeliness of supply is the primary objective in responding to emergencies.

3.3. Sources and Characteristics of Stress in Emergency Supply Chains

3.3.1. Underlying and Direct Sources of Stress

This study posits that the fundamental source of stress within emergency supply chains lies in the urgent production demands triggered by crisis scenarios. These demands exert direct pressure on the emergency supply chain, compelling it to unlock latent capacity and convert this potential into extraordinary supply capabilities. Its direct sources can be grouped into three categories:
First, external pressure from government authorities. When unconventional emergencies occur, existing reserves and routine production capacities are often insufficient to meet the sharply increasing demand for medical and emergency supplies. In response, governments initiate emergency production, exerting pressure on the emergency supply chain through administrative mandates during crises and economic incentives or regulations in normal times. The degree of stress varies across mobilized entities, corresponding to differing intensities of government mobilization.
Second, external pressure from the general public. Social pressure on emergency supply chains is exerted via non-governmental organizations, individual citizens, and media groups. These actors disseminate information regarding supply needs and shortages, thereby intensifying public scrutiny and applying pressure on government response mechanisms, resource allocation strategies, risk communication, and the performance of enterprises in fulfilling their social responsibility during emergencies.
Third, internal pressure from enterprises responsible for emergency supply. In normal circumstances, these enterprises operate within the national economy with profit as their primary objective while also bearing social responsibilities. With the growing emphasis on corporate social responsibility (CSR), many enterprises increasingly view emergency response as part of their civic duty. When crises occur, CSR acts as an internal driver, prompting enterprises to impose pressure on themselves to mobilize resources and fulfill emergency obligations.

3.3.2. Characteristics of Stress in the Emergency Supplies Supply Chain

1.
Uncertainty and suddenness
The formation and operation of emergency supply chains are fundamentally driven by internal supply–demand dynamics, wherein supply is closely guided by demand in a continuously evolving process. Stress arises from urgent, crisis-induced needs, making its emergence sudden and uncertain.
A striking example is the catastrophic flooding of the Yangtze River Basin in the summer of 1998—the most severe since 1954—which also triggered record-breaking floods in the Nenjiang and Songhua River basins. The disaster caused extensive damage to agriculture and industry across the affected regions, posing serious threats to lives and property. In response, China’s National Economic Mobilization Office launched a dedicated mobilization campaign to establish field hospitals aimed at supporting epidemic prevention and medical services for flood relief forces and disaster-affected civilians. The operation unfolded in three distinct phases:
  • Preparation phase (24 days): Information was gathered to assess the scope of needs, and a comprehensive mobilization plan was developed.
  • Implementation phase (15 days): Establishment of an interim command structure; integration of mobilized personnel from different units into field medical support teams; deployment of transport units to deliver essential items to the front line, such as containers, field rations, medicines, and fuel.
  • Recovery phase (4 days): Inventory of mobilized resources; dismantling, transport, and return of equipment; operational summary and return of personnel to their units.
The operation resulted in the establishment of fully functional field hospitals, which conducted over 10,000 on-site consultations, providing timely and efficient medical support to both frontline personnel and local residents.
2.
Timeliness
In sudden disasters, time is the most critical factor. The availability of emergency supplies directly determines the effectiveness of response operations. Stress in emergency supply chains is thus highly time-sensitive. For example, the widely recognized “golden 72 h” post-disaster period is crucial for rescue. Globally, rescue efforts within this window have proven most effective. However, during the 2008 Wenchuan earthquake, China’s tent stockpile was exhausted within 48 h. This sudden shortfall underscored the urgent need for emergency production to supplement depleted reserves and ensure adequate shelter provision for the disaster-stricken areas.
3.
Huge volume
The operating environment of emergency supply chains is complex. When extreme shocks overlap across different scenarios, demand for certain supplies can surge dramatically, resulting in significant stress on the emergency supply chain, manifested by overwhelming volumes. For instance, in early 2020, the outbreak of COVID-19 led to an explosive demand for face masks. However, China’s face masks faced severe shortages due to insufficient routine stockpiles, technological constraints, and delayed production recovery during the Spring Festival period.
4.
Latency
Following the onset of an emergency event, there is often a delay in information transmission. The acquisition and dissemination of emergency supply–demand information tend to lag, and the inherent uncertainty of such events further amplifies this lag. As a result, it becomes difficult to determine real-time demand accurately, leading to a time-lagged manifestation of ESCS.

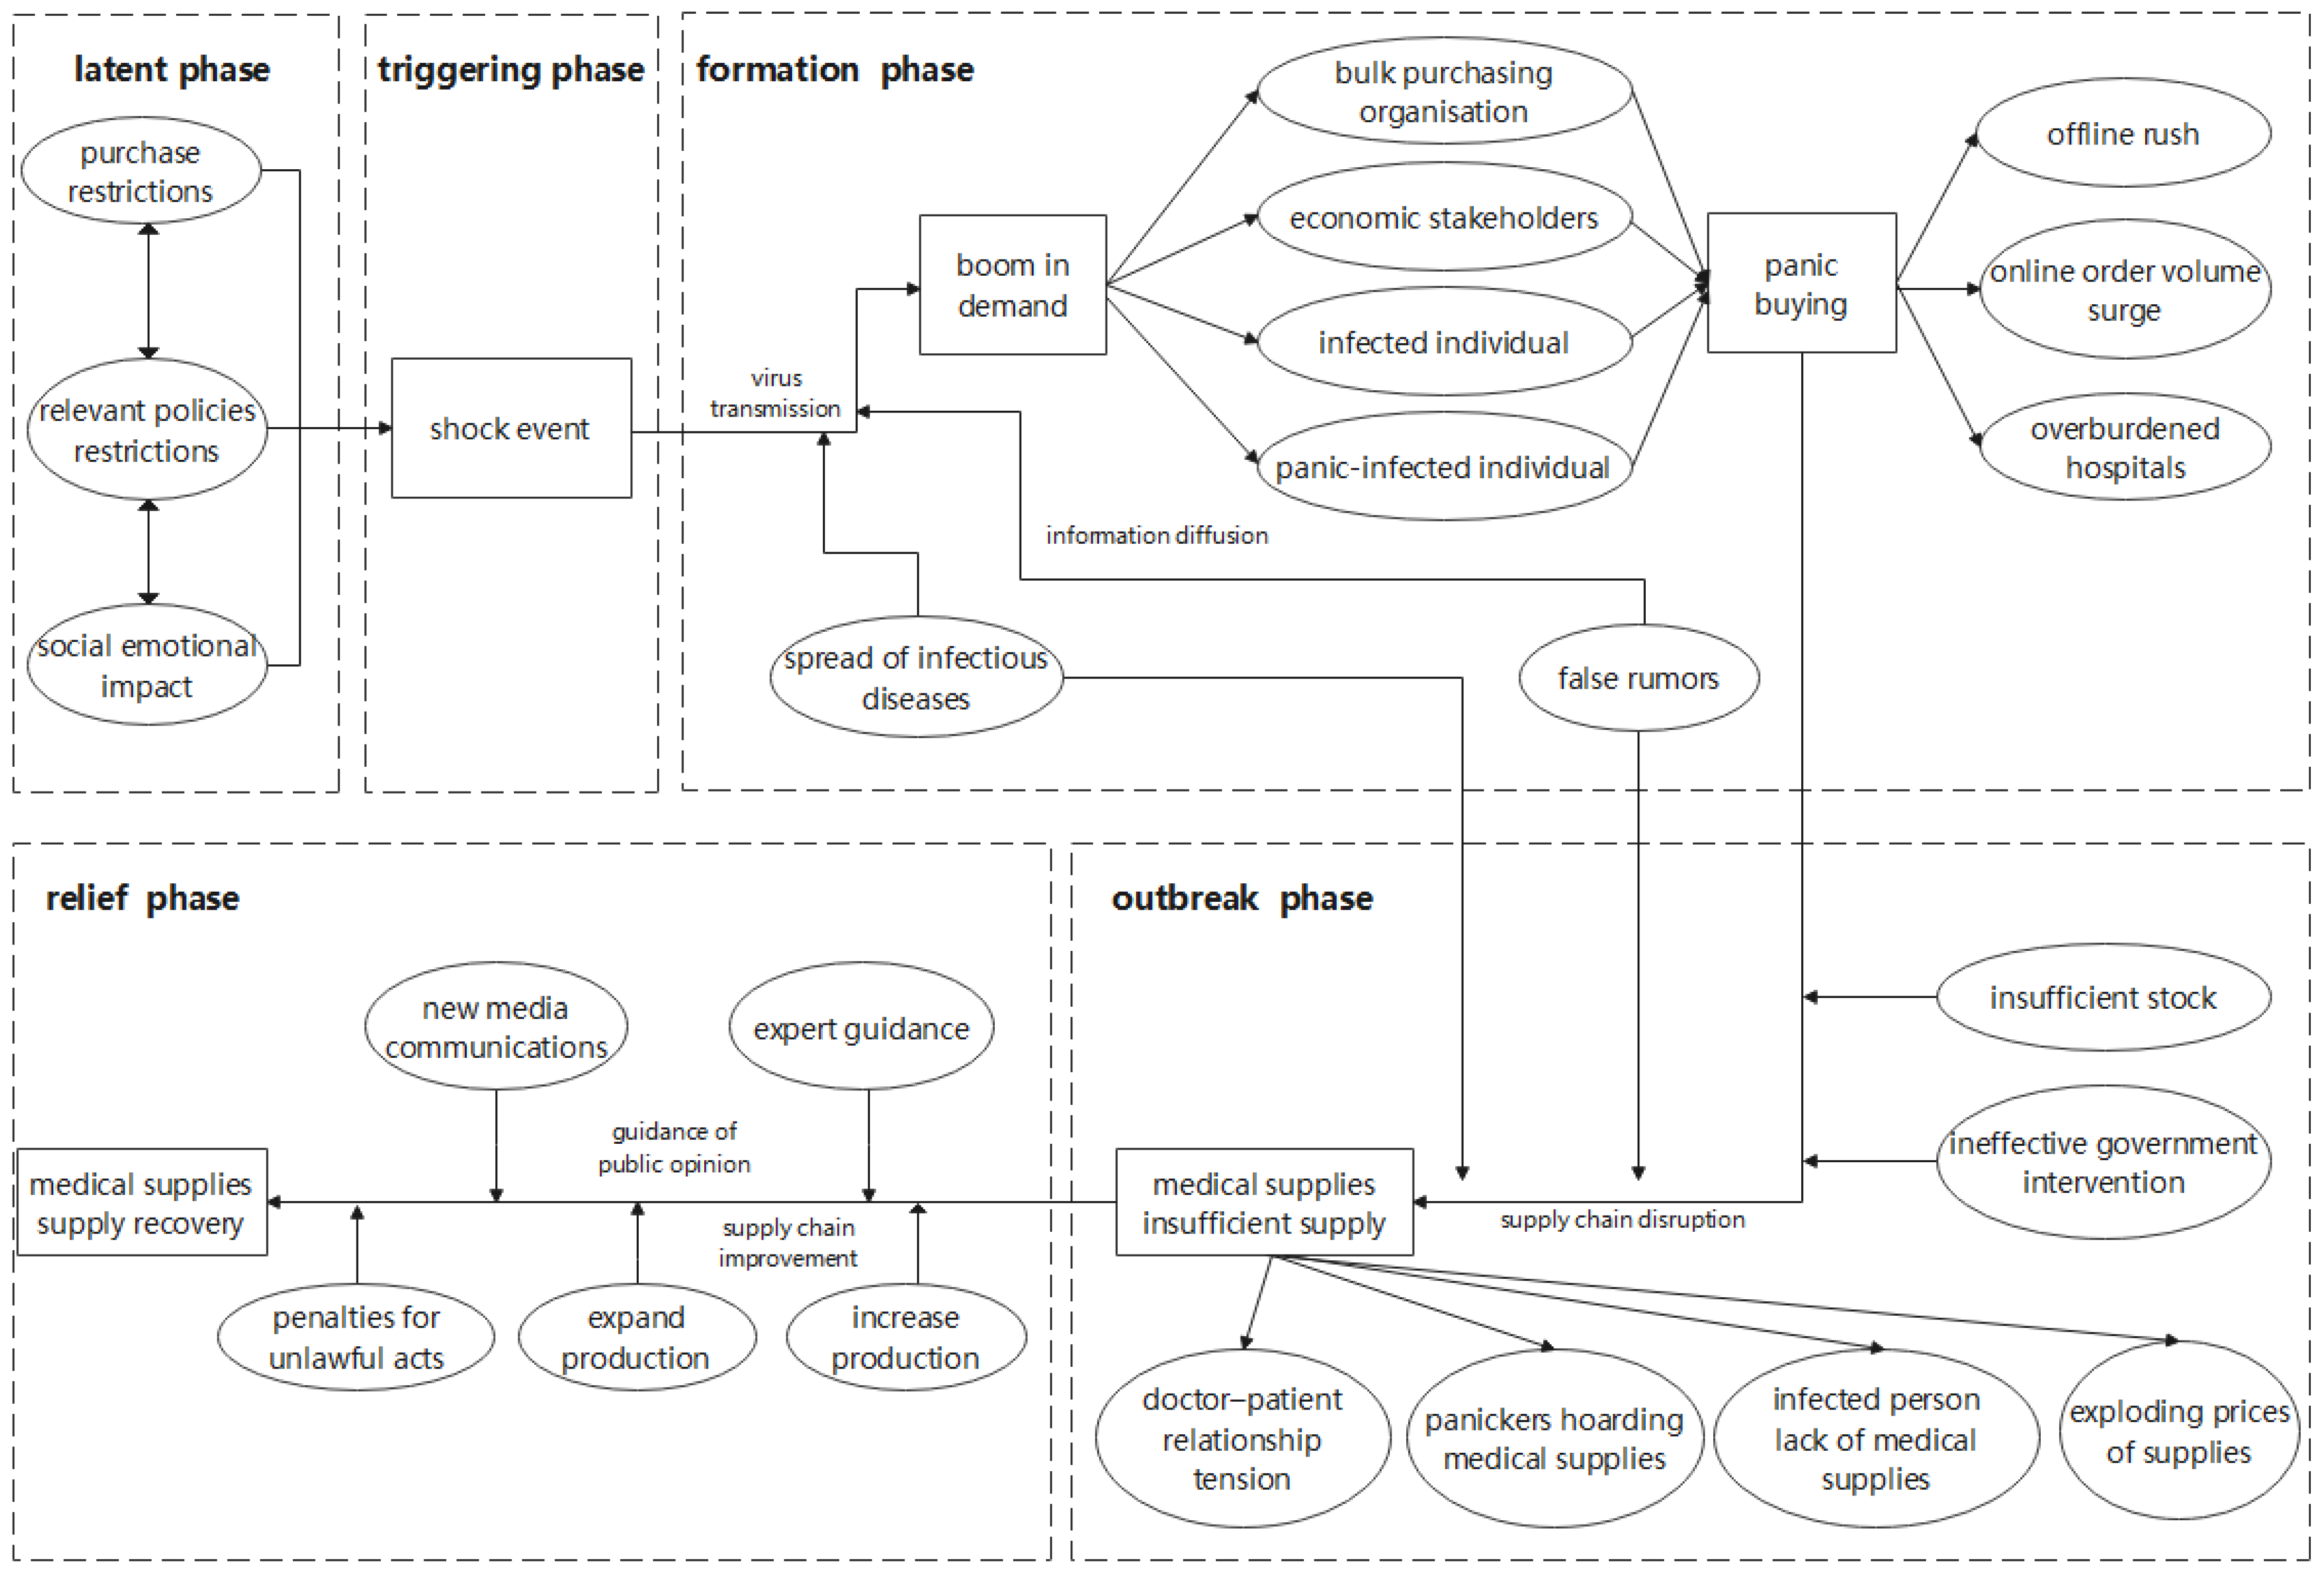
3.4. Causes and Evolutionary Mechanisms of ESCS

3.4.1. Causal Analysis of ESCS

The core driver of emergency supply chain operations is the dynamic interplay between supply and demand. Rather than operating as a static system, the emergency supply chain continuously adjusts to close supply–demand gaps, functioning as a complex and adaptive system. Specific shocks or compound disruptions can simultaneously impact both the demand and supply sides, with stress propagating along the supply chain through successive tiers as a result of imbalances in supply and demand( shown as Figure 2). Both internal and external shocks to the emergency supply chain generate new constraints for the system. For example, earthquakes may damage production facilities, disrupt transport through road destruction, and impair communication across nodes. Moreover, earthquakes may trigger secondary disasters such as landslides or mudflows, which intensify ESCS.

3.4.2. Mechanisms of Stress Evolution in Emergency Supply Chains

Mechanisms refer to the internal functioning of system elements and the rules governing their interactions to fulfill specific functions under certain conditions. In emergency supply chains, stress evolution reflects pressure fluctuations before and after emergency events. In current research, scholars often divide the traditional lifecycle of an emergency event into five phases: latency, indication, development, decline, and extinction [53].
This section builds upon the research on traditional event evolution mechanisms, analyzing the stress evolution mechanisms from a lifecycle perspective. Based on ESCS characteristics and the roles of emergency actors, this paper defines five phases: latency, triggering, formation, outbreak, and relief. Emergencies evolve through a multi-stage lifecycle, with each stage exhibiting distinct characteristics and varying levels of impact. The stress on emergency supply chains—from the triggering to the relief—persists throughout the entire lifecycle. Therefore, it is necessary to analyze these two aspects in conjunction, as illustrated in Figure 3.
In Figure 3, the dashed line represents the evolution cycle of ESCS, while the solid line represents the lifecycle of an emergency event. Before point A, the stress intensity is equal to the regular demand level within the supply chain and fluctuates due to market adjustments. Between points A and B, the supply chain experiences a shock, triggering the onset of stress, which gradually increases. The triggering period here is relatively short, possibly lasting several hours or days, corresponding to the warning phase of the emergency event. The further point A shifts to the right, the longer the latent period of stress, indicating more obvious signs of the event. As time progresses, the event transitions from the warning phase to the development phase. Point C represents the moment of an extreme shock, which causes a sudden surge in demand and a corresponding jump in stress intensity to point E. Point C and point E are located at the same time coordinate to emphasize the suddenness and hugeness of the shock event, e.g., an earthquake, which can cause massive damage in minutes or even seconds, resulting in an immediate and dramatic increase in supply chain stress. At this point, there is a significant supply–demand gap for emergency supplies, requiring immediate mobilization of emergency reserves and the organization of emergency production efforts. Point D marks the intersection between the intensity of the threat and the stress intensity. The stress intensity at point E exceeds that at point D due to the amplification effects of three direct sources of pressure—government agencies, the general public, and the enterprises responsible for emergency supply. These pressures may cause the stress intensity to exceed the actual demand for emergency supplies at that moment. Point F indicates that emergency mobilization efforts are beginning to work to reduce the gap between supply and demand and reduce the intensity of the pressure by providing extraordinary supply capacity. It is noteworthy that point F represents the actual peak of stress intensity. This is because stress can only be mitigated through the enhancement of supply capacity via mobilization efforts, which are inherently delayed relative to the onset of the emergency event. Consequently, even after point E—where the event occurs—the stress intensity continues to rise until the mobilization strategies begin to take effect at point F. At this point, the emergency supply chain stress transitions into the de-escalation phase. As stress is alleviated, the intensity of the event’s threat gradually decreases, and the event enters the decline phase, ultimately moving toward extinction.

4. Structured Description of the Evolution of Emergency Medical Supply Chain Stress (EMSCS)

The evolution of supply chain stress constitutes a complex system characterized by a multi-attribute set structure. Given that emergency supply chain stress evolves within the highly uncertain context of extraordinary emergencies, single-indicator approaches are often insufficient for capturing its dynamics in quantitative research. To address this limitation, this study adopts a scenario–response analytical framework. Through multi-case analysis, we extract both internal and external attributes of extraordinary emergencies, integrating theoretical insights with practical relevance. Set theory is employed to enable a structured representation of the evolutionary process of emergency supply chain stress, allowing for a clearer understanding of the interrelations and mechanisms among these attributes.
Although the generalized structure of emergency supply chains may vary across different categories of materials, the methodological approach to structured description remains consistent. To demonstrate the applicability of this method, this study focuses on the case of China’s emergency medical supply chain, providing a detailed methodological application and analysis.

4.1. Multiple Case Studies

To enhance the generalizability and continuity of the research findings, a multi-case study approach—one that permits cross-case comparisons—should be adopted. This methodology involves the use of multiple data collection techniques across different entities (such as individuals, groups, or organizations) to investigate a given phenomenon within its natural context [54]. Applying a multi-case study to analyze and structurally characterize the attributes of emergency events provides valuable insights into the evolutionary patterns of emergency medical supply chains. This approach contributes significantly to a deeper and more systematic understanding of how such supply chains respond and adapt under stress [55].

4.2. Case Selection

To ensure the generalizability of the conclusions, it is essential to select cases that encompass diverse types of emergency event, as well as multiple instances of the same category of extraordinary public health emergencies. This allows for both within-case analysis and cross-case comparative analysis, thereby enhancing the robustness and applicability of the research findings.

4.3. Case Analysis and Processing

The principles guiding the analysis and processing of cases are as follows:
  • Information is screened and organized around the core themes of event progression, the evolution of emergency supply chain stress, and the formulation of emergency response decisions.
  • Collected data are categorized and analyzed accordingly, followed by a systematic consolidation of the findings.

4.4. Case Analysis Findings

The ultimate goal of examining the evolution of stress within emergency medical supply chains is to enhance the prevention, response, and mitigation of the adverse impacts caused by unconventional public health emergencies. Through multiple case analyses, it has been identified that the evolution of such stress is influenced by a wide array of interrelated attributes and demonstrates significant extensibility across events.
The roles played by different attributes vary throughout the progression of an emergency. To better capture the structural logic underpinning this complexity, this study categorizes the identified attributes and proposes a generalized structured framework for stress evolution in emergency medical supply chains as follows:
Stress Evolution in Emergency Medical Supply Chains = {{Evolution Type (ET)}, {Key Attributes (KA)}, {Secondary Attributes (SA)}, {Environment Attributes (EA)}, {Hazard Assessment Attributes (HA)}}; it is defined as follows:
ET = gradual or radical;
KA = {KA1, KA2, KA3, ..., KAm}. The elements in the key attributes are the key factors in the evolutionary process that sway the degree of stress evolution;
SA = {SA1, SA2, SA3, ..., SAn}. Elements in the dependent attributes have an influence on the evolution of stress and the creation of hazards, assisting the key attributes in portraying the event;
EA = {EA1, EA2, EA3, ..., EAk}. Elements in environmental attributes are those that shape the development and evolution of events by influencing key and subordinate attributes;
HA = {HA1, HA2, HA3, ..., HAj}, Elements in the Hazard Assessment Attributes refer to the attributes used to estimate the hazards caused by evolution,
where m, n, k, j ∈ N.
To construct a generalized and structured representation of the stress evolution within emergency medical supply chains, this study systematically reviewed and validated key information drawn from several major public health emergencies. These include the emergencies in the supply chain for masks and thermometers during the 2003 SARS outbreak, the disinfectant supply chain during the 2009 H1N1 influenza outbreak, the mask supply chain at the onset of the COVID-19 pandemic in late 2019, and the antipyretic and analgesic drug supply chain during the normalized phase of the COVID-19 pandemic in late 2022.
This paper focuses on two representative cases to illustrate the process of event presentation, chronological analysis, and structured description of stress evolution: the mask supply chain during the initial outbreak of COVID-19 in late 2019 and the ibuprofen supply chain during the normalized response phase of the pandemic in late 2022.
  • Stress Evolution of the Mask Supply Chain During the Initial COVID-19 Outbreak in China (Late 2019)
Event introduction: The COVID-19 outbreak on 27 December 2019 marked the most rapidly spreading, widely affecting, and difficult-to-control public health emergency in China since the founding of the People’s Republic. Given that masks serve both as personal protective equipment and as a source control measure, demand surged dramatically in a short period. The stress evolution of the mask supply chain during this period thus serves as a representative case for studying the dynamics of emergency medical supply chains under extreme conditions.
Event overview: The stress evolution of the mask supply chain in early 2020 spanned over two months and is categorized as a gradual-type emergency. The evolution was primarily driven by the outbreak of COVID-19, the skyrocketing demand for masks, government interventions, and fluctuations in supply. Key influencing factors included the rate of virus transmission, the speed of information dissemination, the volume of mask demand, the intensity of emergency mobilization, and the supply capacity. The progression of stress evolution could be gauged by indicators such as the spatial spread of the virus, the proliferation of rumors, and the implementation of emergency mobilization. Meanwhile, the supply–demand balance, price fluctuations, and public sentiment served as evaluative metrics for the impact of supply chain stress.
Structured description of events: Mask Supply Chain Stress Evolution (2020) = {{gradual}, {COVID-19 outbreak, surging mask demand (healthcare relief organizations, COVID-19 virus-infected, economically motivated stakeholders, uninfected individuals seeking protection), government intervention, mask supply}, {virus transmission rate, information dissemination speed, mask demand volume, emergency mobilization intensity, mask supply volume}, {pandemic spread, rumor proliferation, emergency mobilization practices (guiding the resumption and expansion of production, official information disclosure and expert science communication, crackdowns on counterfeit masks and price gouging), regional public mask-wearing mandates }, {supply–demand relationship, mask prices, social opinion}}.
2.
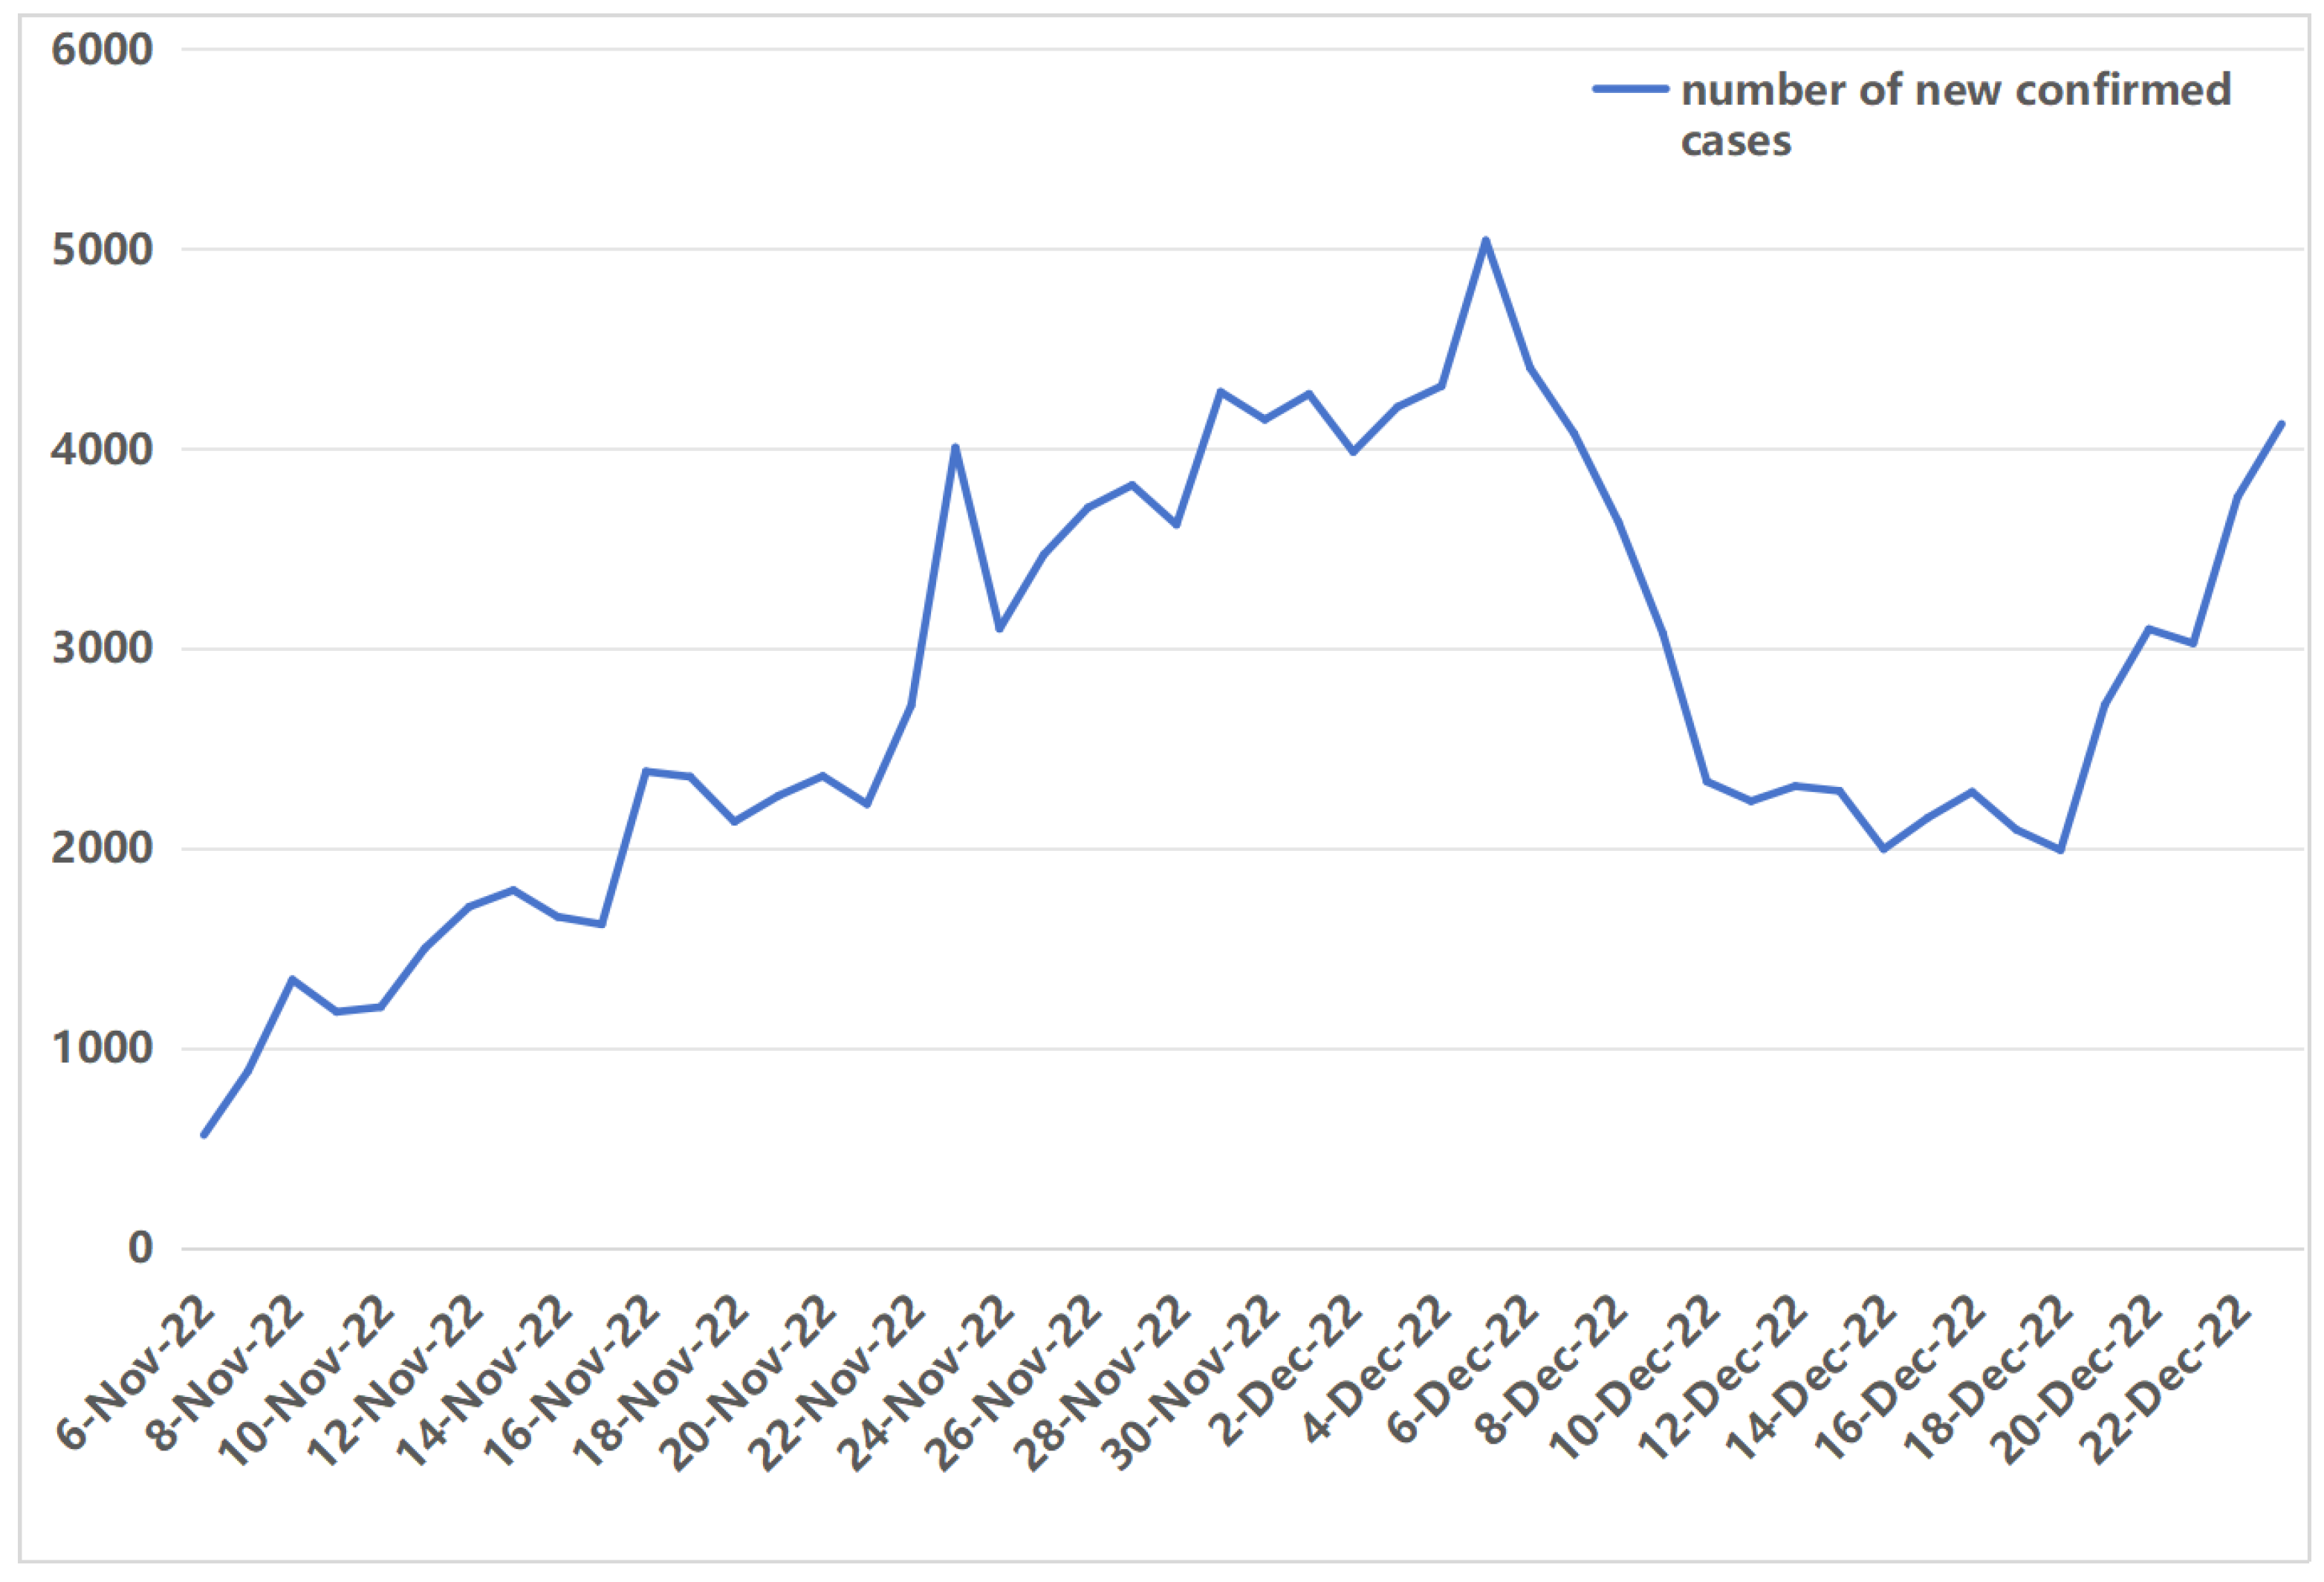
Stress Evolution of the Ibuprofen Supply Chain Following the Normalization of COVID-19 Control Measures in China (Late 2022)
Event introduction: On 11 November 2022, China’s Joint Prevention and Control Mechanism of the State Council announced 20 new measures to further optimize COVID-19 control, signaling a proactive and adaptive shift in public health policy both domestically and internationally. Subsequently, on December 7, a follow-up set of targeted adjustments, commonly referred to as the “New Ten Measures”, was released to further ease restrictions [28]. These policy relaxations led to a rapid increase in population mobility. Coupled with the high transmissibility of the Omicron variant, this triggered a surge in demand for antipyretic and analgesic medications, and the ibuprofen supply chain emerged as a representative case of stress evolution in emergency medical supply systems.
Event overview: The stress evolution of the ibuprofen supply chain lasted nearly two months and is classified as a gradual-type event. Key drivers included policy changes in epidemic prevention and control, a sharp increase in ibuprofen demand, government interventions, and supply fluctuations. The pace of virus transmission, speed of information dissemination, volume of demand, mobilization efforts, and production capacity collectively influenced the dynamics of stress development. The spread of infection, dissemination of misinformation, and implementation of emergency response measures were critical indicators for tracking the evolution process. Meanwhile, supply–demand imbalances, drug price surges, and shifts in public sentiment served as key metrics for assessing the consequences of supply chain stress.
Structured description of events: Ibuprofen Supply Chain Stress Evolution (Late 2022) = {{gradual}, {epidemic control policy adjustments, surging ibuprofen demand (large enterprises and institutions, individuals infected with Omicron, economically motivated stakeholders, panic-infected), government intervention, ibuprofen supply}, {virus transmission rate, information dissemination speed, ibuprofen demand volume, emergency mobilization intensity, ibuprofen supply volume}, {infection spread, rumor proliferation, emergency response implementation (supply chain stabilization and expansion, expert-led rumor clarification and positive public guidance, crackdowns on hoarding, penalties for price gouging)}, {supply–demand dynamics, ibuprofen pricing, public sentiment}}.
A comprehensive structural framework for the stress evolution of emergency medical supply networks during major public health emergencies can be developed by analyzing exemplary cases. This framework, which is constructed as follows, encapsulates the essential elements and dynamics of such crises:
Emergency Medical Supply Chain Stress Evolution = {{gradual}, {triggering events, demand surge (bulk procurement organizations, infected individuals, profit-oriented stakeholders, panic-driven consumers), government intervention, supply}, {virus transmission speed, information dissemination rate, demand volume, emergency mobilization intensity, supply volume}, {event progression, rumor proliferation, emergency response implementation (capacity expansion, public opinion management, enforcement against illegal practices)}}, {supply–demand dynamics, pricing, public sentiment}}.
To facilitate a more comprehensive analysis of the formation, escalation, and dissipation of supply chain stress and to reveal the underlying patterns governing its evolution, this study integrates the concept of the emergency supply chain stress lifecycle. Based on this, a systematic diagram of the stress evolution process in emergency medical supply chains is developed and illustrated in Figure 4.

5. Stochastic Petri Net Model Construction for Stress Evolution of Emergency Medical Supply Chain

Through the structured analysis of stress evolution in emergency medical supply chains, this evolution can be viewed as a complex system involving numerous components characterized by stochastic behavior and dynamic interactions. Petri nets are particularly well-suited for modeling and analyzing such complex systems, as they offer a graphical framework that integrates data flow, control flow, and state transitions. In a Petri net, transitions represent the changes between different system states, while places denote these states before and after the transitions.
Therefore, this study employs the Petri net methodology proposed by Carl Adam Petri in 1962 to model the stress evolution in emergency medical supply chains. This approach enables a clear simulation of the system’s dynamic processes and current state, thereby facilitating both system evaluation and the identification of improvement strategies [56].
We begin by using a stochastic Petri net to mathematically characterize the system. Building on the isomorphism between the reachability graph of the Petri net and the state space of a Markov chain, we then analyze the interrelationships among key components involved in the stress evolution process.
A stochastic Petri net is typically represented by a six-tuple, denoted as S P N = ( P , T ; F , W , M , λ ) , where
  • P = P 1 , P 2 , P n ( n > 0 ) is a finite set of places;
  • T = ( t 1 , t 2 , , t m ) is a finite set of transitions;
  • F P × T T × P is a set of directed arcs from places to transitions;
  • W : F N + ( N + = 1 , 2 , 3 , ) denotes the arc weight function;
  • M : F 1 , 2 , 3 , represents the set of markings;
λ = λ 1 , λ 2 , , λ k is the set of average firing rates associated with the transitions. The modeling process proceeds as follows:
Step 1: SNP Modelling.
Based on the evolution process of emergency medical supply chain stress propagation illustrated in Figure 4, a corresponding stochastic Petri net (SPN) model is developed following the steps described above, as shown in Figure 5. The model in Figure 5 consists of 23 places and 15 transitions.
In Figure 5, the specific definitions of each place and transition within the model are detailed in Table 1.
Step 2: Generation of the Reachability Graph.
Based on the SPN model shown in Figure 5 and the transition firing rules, the initial marking of the stochastic Petri net is defined as M1 = (1,1,1,0,0,0,0,0,0,0,0,0,0,0,0,0,0,0,0,0,0,0,0), indicating that one token is initially placed in each of the places P1, P2, and P3. By analyzing the enabled transitions under this marking, different subsequent markings (states) of the SPN can be derived. The full set of reachable markings, denoted as [M0>, is listed as follows:
M2 = (0,0,0,1,0,0,0,0,0,0,0,0,0,0,0,0,0,0,0,0,0,0,0); M3 = (0,0,0,0,1,1,0,0,0,0,0,0,0,0,0,0,0,0,0,0,0,0,0); M4 = (0,0,0,0,0,1,1,0,0,0,0,0,0,0,0,0,0,0,0,0,0,0,0); M5 = (0,0,0,0,1,0,0,1,0,0,0,0,0,0,0,0,0,0,0,0,0,0,0); M6 = (0,0,0,0,0,0,1,1,0,0,0,0,0,0,0,0,0,0,0,0,0,0,0); M7 = (0,0,0,0,0,0,0,0,1,1,1,1,0,0,0,0,0,0,0,0,0,0,0); M8 = (0,0,0,0,0,0,0,0,0,1,1,1,1,0,0,0,0,0,0,0,0,0,0); M9 = (0,0,0,0,0,0,0,0,1,0,0,0,0,1,0,0,0,0,0,0,0,0,0); M10 = (0,0,0,0,0,0,0,0,0,0,0,0,1,1,0,0,0,0,0,0,0,0,0); M11 = (0,0,0,0,0,0,0,0,0,0,0,0,0,0,1,0,0,0,0,0,0,0,0); M12 = (0,0,0,0,0,0,0,0,0,0,0,0,0,0,0,1,0,0,0,0,0,0,0); M13 = (0,0,0,0,0,0,0,0,0,0,0,0,0,0,0,0,1,1,1,0,0,0,0); M14 = (0,0,0,0,0,0,0,0,0,0,0,0,0,0,0,0,0,1,1,1,0,0,0); M15 = (0,0,0,0,0,0,0,0,0,0,0,0,0,0,0,0,1,0,1,0,1,0,0); M16 = (0,0,0,0,0,0,0,0,0,0,0,0,0,0,0,0,1,1,0,0,0,1,0); M17 = (0,0,0,0,0,0,0,0,0,0,0,0,0,0,0,0,0,0,1,1,1,0,0); M18 = (0,0,0,0,0,0,0,0,0,0,0,0,0,0,0,0,0,1,0,1,0,1,0); M19 = (0,0,0,0,0,0,0,0,0,0,0,0,0,0,0,0,1,0,0,0,1,1,0); M20 = (0,0,0,0,0,0,0,0,0,0,0,0,0,0,0,0,0,0,0,1,1,1,0); M21 = (0,0,0,0,0,0,0,0,0,0,0,0,0,0,0,0,0,0,0,0,0,0,1).
In a time-continuous SNP, a random delay exists between the moment a transition becomes enabled and the moment it fires. This delay can be modeled as a continuous random variable, x, which follows an exponential distribution. The average firing rates of transitions t1, t2, ..., t15 are denoted by λ1, λ2, ..., λ15. By representing the transitions between different markings using directed arcs, a continuous-time Markov chain (CTMC) structurally isomorphic to the SPN model can be derived, as illustrated in Figure 6.
Step 3: Solve for the Probability of Stability.
Let P(Mi), i {1, 2, ..., 21} denote the steady-state probability of marking Mi in the equilibrium state of the corresponding Markov chain, which also represents the probability of Mi in the steady-state of the SPN model. The following system of equations can thus be established:
λ 1 P M 1 = λ 15 P M 21 λ 2 P M 2 = λ 1 P M 1 λ 3 P M 3 + λ 4 P M 3 = λ 2 P M 2 λ 4 P M 4 = λ 3 P M 3 λ 3 P M 5 = λ 4 P M 3 λ 5 P M 6 = λ 3 P M 5 + λ 4 P M 4 λ 6 P M 7 + λ 7 P M 7 = λ 5 P M 6 λ 7 P M 8 = λ 6 P M 7 λ 6 P M 9 = λ 7 P M 7 λ 8 P M 10 = λ 6 P M 9 + λ 7 P M 8 λ 9 P M 11 = λ 8 P M 10 λ 10 P M 12 = λ 9 P M 11 λ 11 P M 13 + λ 12 P M 13 + λ 13 P M 13 = λ 10 P M 12 λ 12 P M 14 + λ 13 P M 14 = λ 11 P M 13 λ 11 P M 15 + λ 13 P M 15 = λ 12 P M 13 λ 11 P M 16 + λ 12 P M 16 = λ 13 P M 13 λ 13 P M 17 = λ 12 P M 14 + λ 11 P M 15 λ 12 P M 18 = λ 13 P M 14 + λ 11 P M 16 λ 11 P M 19 = λ 13 P M 15 + λ 12 P M 16 λ 14 P M 20 = λ 13 P M 17 + λ 12 P M 18 + λ 11 P M 19 λ 15 P M 21 = λ 14 P M 20 i = 1 21 P M i = 1
Although the evolution of supply chain stress involves a certain degree of fuzziness and uncertainty, such uncertainties typically concentrate around a single focal point ( λ i point), rather than being distributed across multiple points simultaneously. Therefore, triangular fuzzy numbers are introduced to represent the fuzzification of the transition firing rate, λ i . Let λ ˜ = λ 1 ˜ , λ 2 ˜ , , λ 15 ˜ denote the fuzzy set of transition firing rates, where λ i ˜ = a i , b i , c i satisfies that 0 < a i b i c i is a fuzzy number and μ λ i ( x ) : R [ 0 , 1 ] is the triangular membership function of λ i , defined as follows:
μ λ i x = x a i b i a i , a i x b i c i x c i b i , b i x c i 0 ,   others
The α -level cut set of λ i ˜ is denoted as(shown as Figure 7)
A α i = a i + ( b i a i ) α , c i ( c i b i ) α
The α -level cut set of the quadratic operations of fuzzy numbers X and Y can be expressed as
Set X ( α ) = [ X d ( α ) , X u ( α ) ] , Y ( α ) = [ Y d ( α ) , Y u ( α ) ] , α [ 0 , 1 ]
X ( α ) + Y ( α ) = [ X d ( α ) + Y d ( α ) , X u ( α ) + Y u ( α ) ] ; X ( α ) Y ( α ) = [ X d ( α ) Y u ( α ) , X u ( α ) Y d ( α ) ] ; X ( α ) Y ( α ) = [ X d ( α ) Y d ( α ) , X u ( α ) Y u ( α ) ] ; X ( α ) / Y ( α ) = [ X d ( α ) / Y u ( α ) , X u ( α ) / Y d ( α ) ] i f 0 [ Y d ( α ) , Y u ( α ) ]
Following the algebraic operations of fuzzy numbers described above, the system of Equation (1) is solved to obtain the steady-state probability distribution. The defuzzification is then performed using the centroid method to derive the precise reliability value, representing the likelihood of the emergency medical supply chain being in each steady state during its pressure evolution. Based on this steady-state probability distribution, the decision-making processes at various stages of the pressure evolution can be optimized, thereby mitigating the adverse impacts of major public health emergencies. This analysis provides valuable theoretical guidance for improving the efficiency of emergency decision-making in such events.

6. Evolutionary Simulation Analysis of Supply Chain Stress

6.1. A Case Study of Ibuprofen in Beijing During the COVID-19 Pandemic

This study simulates the evolution of supply chain stress by using the ibuprofen supply chain in Beijing during the COVID-19 pandemic as a representative example. In the post-29 April 2020 phase, when China entered a stage of normalized epidemic prevention and control, the ibuprofen supply chain—serving as a prototypical emergency medical supply chain—underwent a nationwide wave of stress evolution at the end of 2022.
On 11 November 2022, the Standing Committee of the Political Bureau of the CPC Central Committee introduced twenty optimization measures, including the removal of the “close contact” classification, signaling a major policy shift in COVID-19 control. From 4 December 2022 to 20 January 2023, Baidu search data showed a sharp spike in interest in “ibuprofen”, reflecting soaring public demand. In response, Beijing implemented ten targeted measures on 7 December to ensure access to essential medications. This led to widespread panic buying, pharmacy and online shortages, rising hospital visits, and increased drug prices. On 8 December, at the 23rd National Conference on Respiratory Diseases, Academician Zhong Nanshan called for a rational public response to the Omicron variant, emphasizing its reduced pathogenicity despite high transmissibility. Increased human mobility has led to a significant increase in the number of infections, and official published data are shown in Figure 8 and Figure 9.
On 14 December, the Ministry of Industry and Information Technology (MIIT) launched an emergency initiative to ensure the production and supply of critical medical materials. A task force was established to mobilize local joint prevention and control mechanisms, accelerate pharmaceutical production, and compile a whitelist of key manufacturers. Major online pharmacies were directed to urgently develop digital platforms for medication access. On that day alone, 14 major manufacturers produced 28.25 million boxes of adult ibuprofen, while Beijing reported a cumulative allocation of 4.7 million tablets and 1.5 million bags (granules) of ibuprofen since December 11.
On 16 December, the MIIT expanded efforts to boost production by mobilizing pharmaceutical companies in Shanxi, Sichuan, Jiangsu, and Hubei to support Beijing’s medical supply demands. In parallel, platforms such as Ali Health and JD Health were tasked with piloting targeted drug distribution systems in Shijiazhuang and Tianjin for home-based COVID-19 patients. The China National Machinery and Equipment Tendering Center was commissioned to solicit internet platforms capable of delivering urgently needed medications with precision. The Ministry of Transport urgently coordinated logistics support from China Post, SF Express, and other carriers. Regulatory authorities intensified oversight of major pharmaceutical wholesalers, cracking down on price gouging and hoarding. The National Administration of Traditional Chinese Medicine issued home-use guidelines to promote rational medication use and alleviate pressure on healthcare facilities.
On 18 December, the Joint Prevention and Control Mechanism of the State Council issued a “Daily Dispatch Plan for the Production and Supply of Medical Materials”, implementing a whitelist system and designating key suppliers. Special commissioners were dispatched to ibuprofen raw-material manufacturers, covering over 80% of domestic production capacity. The Ministry of Commerce accelerated the redirection of antipyretic drug exports to the domestic market, while the MIIT facilitated the conversion of Shandong Xinhua Pharmaceutical’s export production lines to domestic supply.
On 20 December, the State Administration for Market Regulation announced the second batch of typical law enforcement cases related to the pandemic, reporting 307 investigations and 92 concluded cases involving illegal pricing, with fines totaling CNY 2.581 million. The National Medical Products Administration also held a press conference to address concerns regarding ibuprofen production and registration.
By 21 December, the number of manufacturers of ibuprofen (for adult use) had increased to 64, with key enterprises reaching a daily output capacity of 81 million tablets. Between December 14 and 22, national media intensively covered the supply chain efforts, publishing over 80 original reports and more than 200,000 reposts across major websites and social media platforms.
On 29 December, the combined daily output of ibuprofen and paracetamol—two key antipyretic and analgesic drugs—reached 201 million tablets, a 4.1-fold increase compared to December 16. That evening, China Central Television (CCTV) aired a segment titled “Multi-Agency Efforts to Secure Medical Supply Chains”, while the Xinhua News Agency released two in-depth reports with a combined readership exceeding one million views. Additional coverage was released the same night by Economic Daily, People’s Daily Online, The Paper, and other major outlets.
On 6 January 2023, due to overtime production by several enterprises, the combined daily output of ibuprofen and paracetamol reached 285 million tablets, surpassing their approved capacity.
By 15 January, the MIIT confirmed that, based on a comprehensive analysis of production, supply, inventory, and demand data, the supply of these two critical medications had stabilized and was considered sufficient to meet national needs.

6.2. Scenario Analysis and Discussion

In this scenario analysis, the average transition rates (λ1, ..., λ15) were parameterized concerning the evolution of ibuprofen supply chain stress at the end of 2022, as discussed in the previous section. Since the onset of the COVID-19 pandemic in late 2019, the ibuprofen supply chain stress latency phase has been longer, largely due to lockdown measures, public fear, and purchasing restrictions. Consequently, the average implementation rate for the first transition, λ1, was set to 100.
Based on the previous section’s discussion on the implementation of China’s “20 Measures” and Beijing’s localized “10 Measures” for epidemic prevention and control, the surge in media coverage surrounding ibuprofen, and mobilization efforts by national government agencies to coordinate its supply, combined with fluctuations in Baidu Search Index data for the keyword “ibuprofen”, the average implementation rates of transitions t2, ..., t13 were assumed to be λ2 = 0.5, λ3 = 1, λ4 = 1, λ5 = 22, λ6 = 4, λ7 = 1, λ8 = 3, λ9 = 6, λ10 = 4, λ11 = 9, λ12 = 3, λ13 = 2, λ14 = 5, and λ15 = 11, respectively.
Considering the inherent uncertainties associated with the activation of transitions during the evolution of emergency medical supply chain stress—though such activations generally converge around a specific inflection point (denoted as Point λi)—a triangular fuzzy number approach was adopted. Specifically, a ±15% fuzzification was applied to parameters λ1, …, λ15, thereby generating a fuzzy set of transition activation rates: λ ˜ = λ 1 ˜ , λ 2 ˜ , , λ 15 ˜ .
According to the arithmetic rules of fuzzy numbers, variable α is defined over the interval (0, 1) with an increment of 0.1. Equation System (1) was then solved under these conditions, and the resulting computational outcomes are presented in Appendix Table A1 and Table A2.
Scenario analysis enables the exploration of different evolutionary states, and in this paper we carry out scenario simulation analyses by varying the average implementation rate of variations related to the chain reaction of shock events, drug procurement, and emergency mobilization.

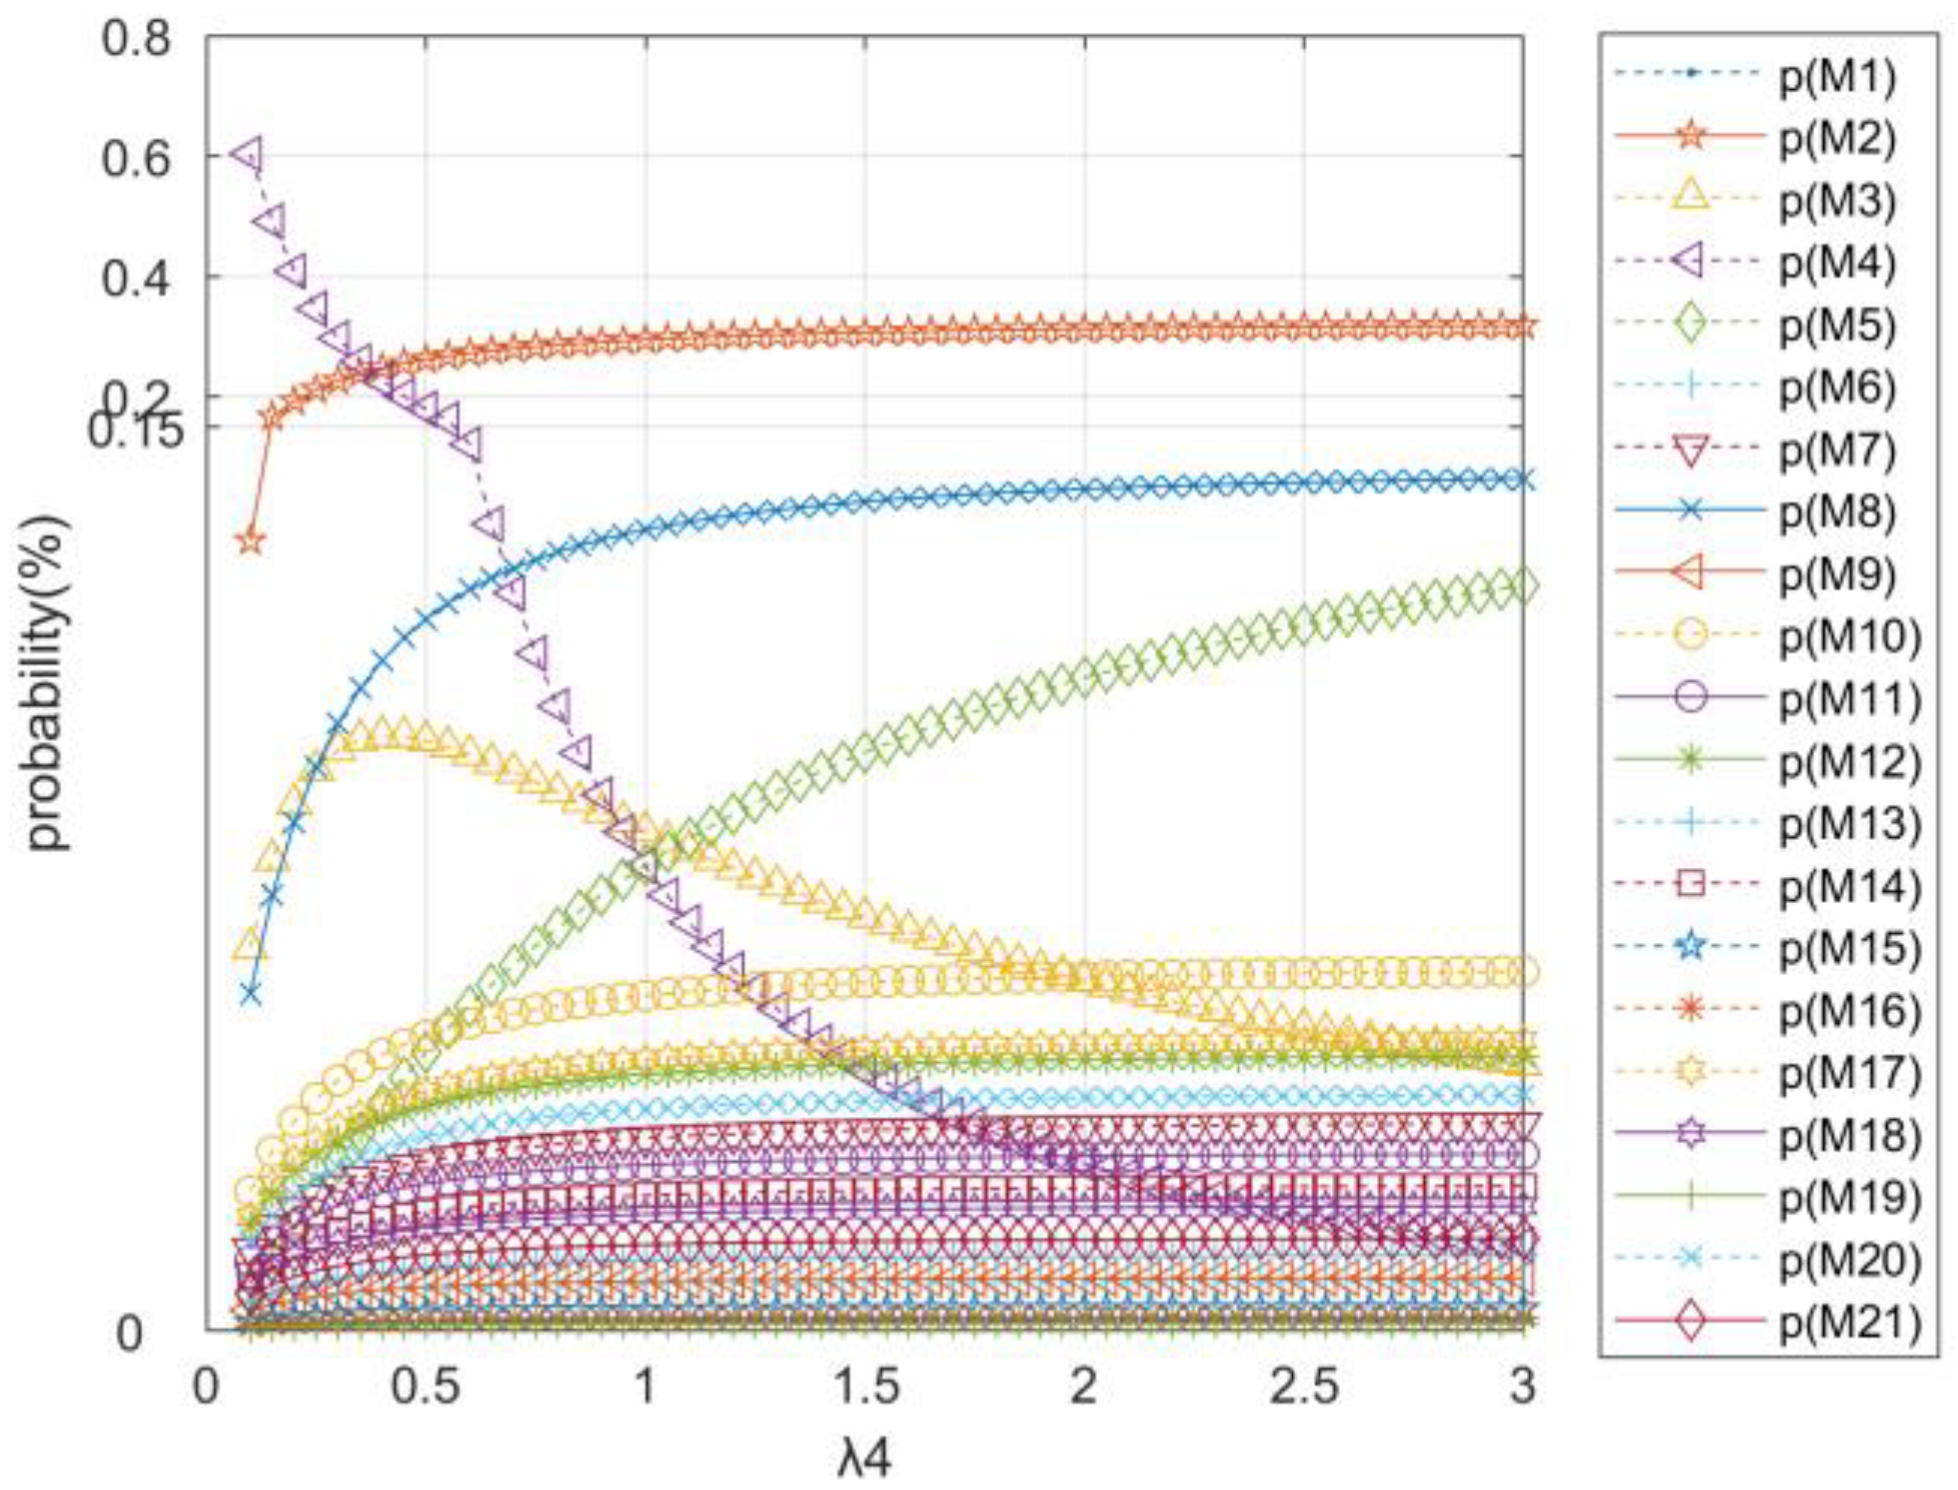
6.2.1. Scenario 1: Variations in the Cascade of Shock Events (λ2: Chain Reaction, λ3: Virus Transmission, λ4: Information Dissemination)

Assuming all other rates (λ1, λ3, λ4, …, λ15) remain constant, the average transition rate λ2 is gradually increased from 0.1 to 3. The resulting equilibrium states of the supply chain evolution are illustrated in Figure 10. Similarly, holding λ1, λ2, λ4, …, λ15 constant while increasing λ3 from 0.1 to 3 yields the results shown in Figure 11. When λ1, λ2, λ3, λ5, …, λ15 are fixed and λ4 is varied over the same range, the corresponding evolution outcomes are presented in Figure 12.
The probability convergence trends shown in Figure 10, Figure 11 and Figure 12 suggest that as the average transition rates λ2, λ3, and λ4 increase from 0.1 to 3, the probability of a sharp rise in public demand for ibuprofen, p(M8), also increases. This pattern reflects how policy adjustments, increased population mobility, and the spread of misinformation can trigger rapid chain reactions in emergency supply chains.
Interestingly, an inverse dynamic can be observed between the probability of virus transmission, p(M4), and rumor propagation, p(M5). In the latent phase of supply chain stress, the occurrence of a triggering shock event can rapidly activate and convert latent stress into stress, where the virus spread and public sentiment tend to influence each other in opposite directions.
To mitigate supply chain stress during major public health emergencies, it is essential for governments to strengthen emergency response mechanisms and enhance the design and implementation of contingency plans. Rapid response capabilities are critical to alleviating pressure across the supply chain. During the stress formation phase, timely and accurate dissemination of epidemic-related information—particularly in the early stages—is key. Controlling misinformation and managing public sentiment effectively can help reduce social panic and slow the development of supply chain stress.

6.2.2. Scenario 2: Variations in Pharmaceutical Procurement (λ6: Bulk Purchasing, λ7: Panic Buying)

Assuming that all other parameters (λ1, …, λ5, λ7, …, λ15) remain constant, the average transition rate λ6 is incrementally increased from 1 to 20. The corresponding equilibrium outcomes of the system’s evolution are shown in Figure 13. Similarly, holding λ1, …, λ6, λ8, …, λ15 constant, increasing λ7 from 1 to 20 yields the results depicted in Figure 14.
As illustrated by the convergence trends in Figure 13 and Figure 14, when the average transition rates λ6 and λ7 rise from 1 to 20, the probability of a surge in ibuprofen demand across society, p(M₈), increases. Concurrently, the probability of retail disorder, p(M₉), decreases in the case of increased bulk purchasing but increases when panic buying intensifies. These findings indicate that during the pressure formation phase of the emergency medical supply chain, large-scale procurement by enterprises and panic buying by the public can both contribute to a supply–demand imbalance, resulting in widespread drug shortages.
Notably, once bulk procurement surpasses a critical threshold, it becomes a major source of supply chain pressure. To alleviate such pressure, government authorities should consider implementing bulk procurement control mechanisms. These measures could prioritize pharmaceutical supply to healthcare institutions while temporarily restricting non-medical entities from engaging in large-scale purchasing during periods of heightened drug scarcity. This would allow a greater proportion of the pharmaceutical supply to flow into the retail sector, ensuring that individuals with mild symptoms have timely access to medications, ultimately reducing the progression of mild cases into severe ones and helping to contain the overall spread of the epidemic.

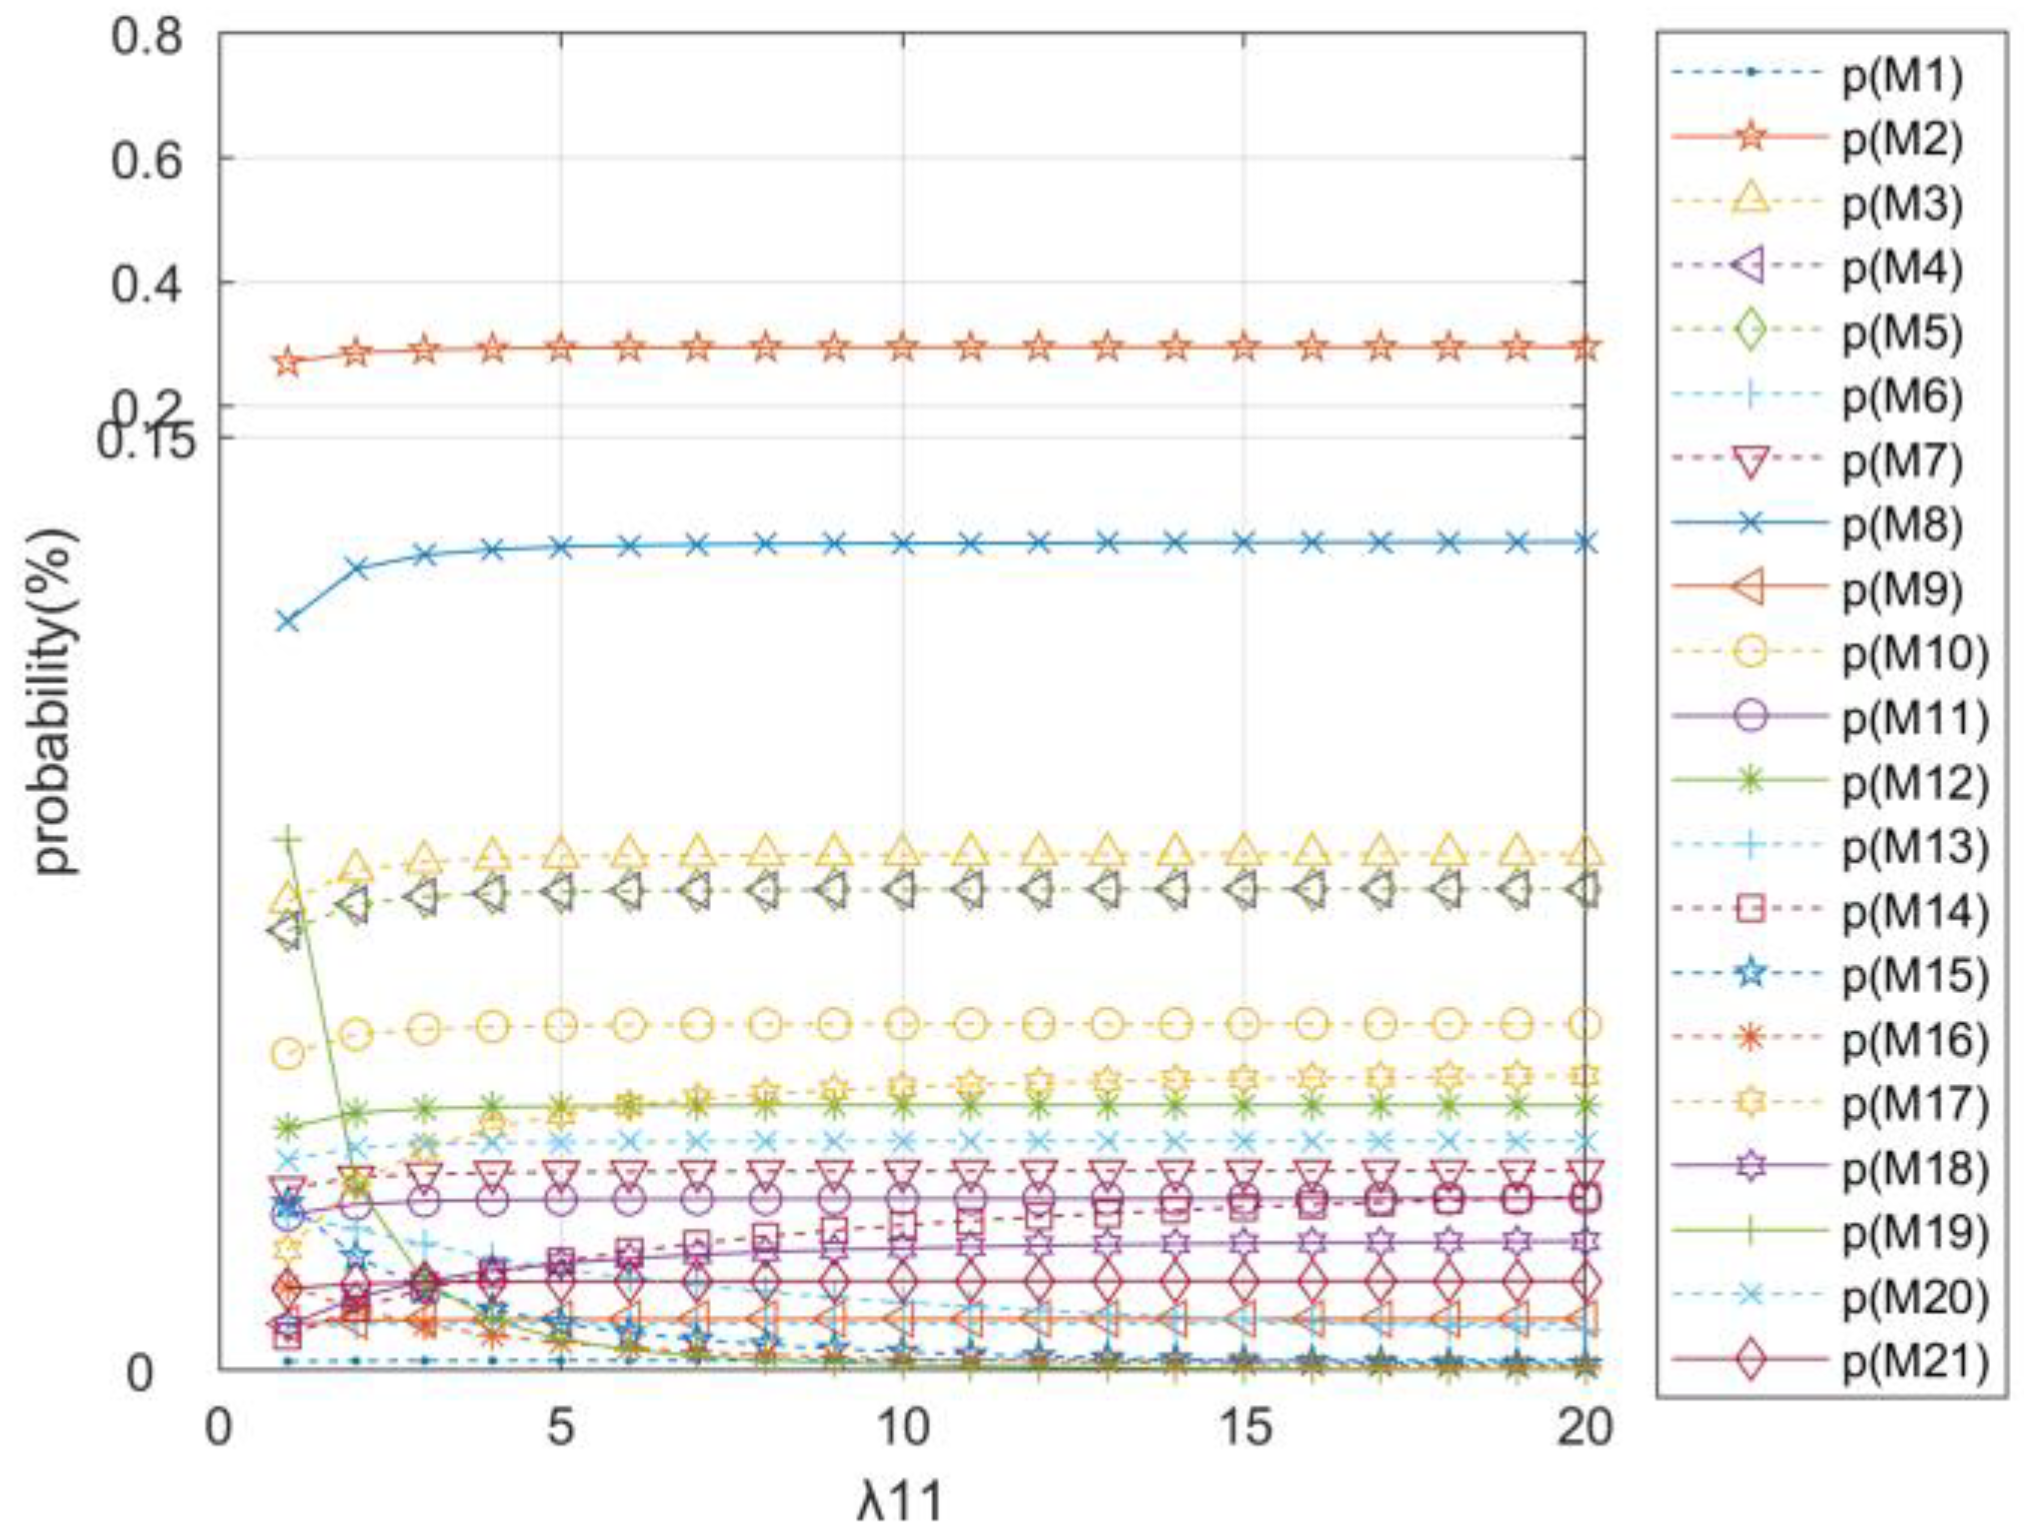
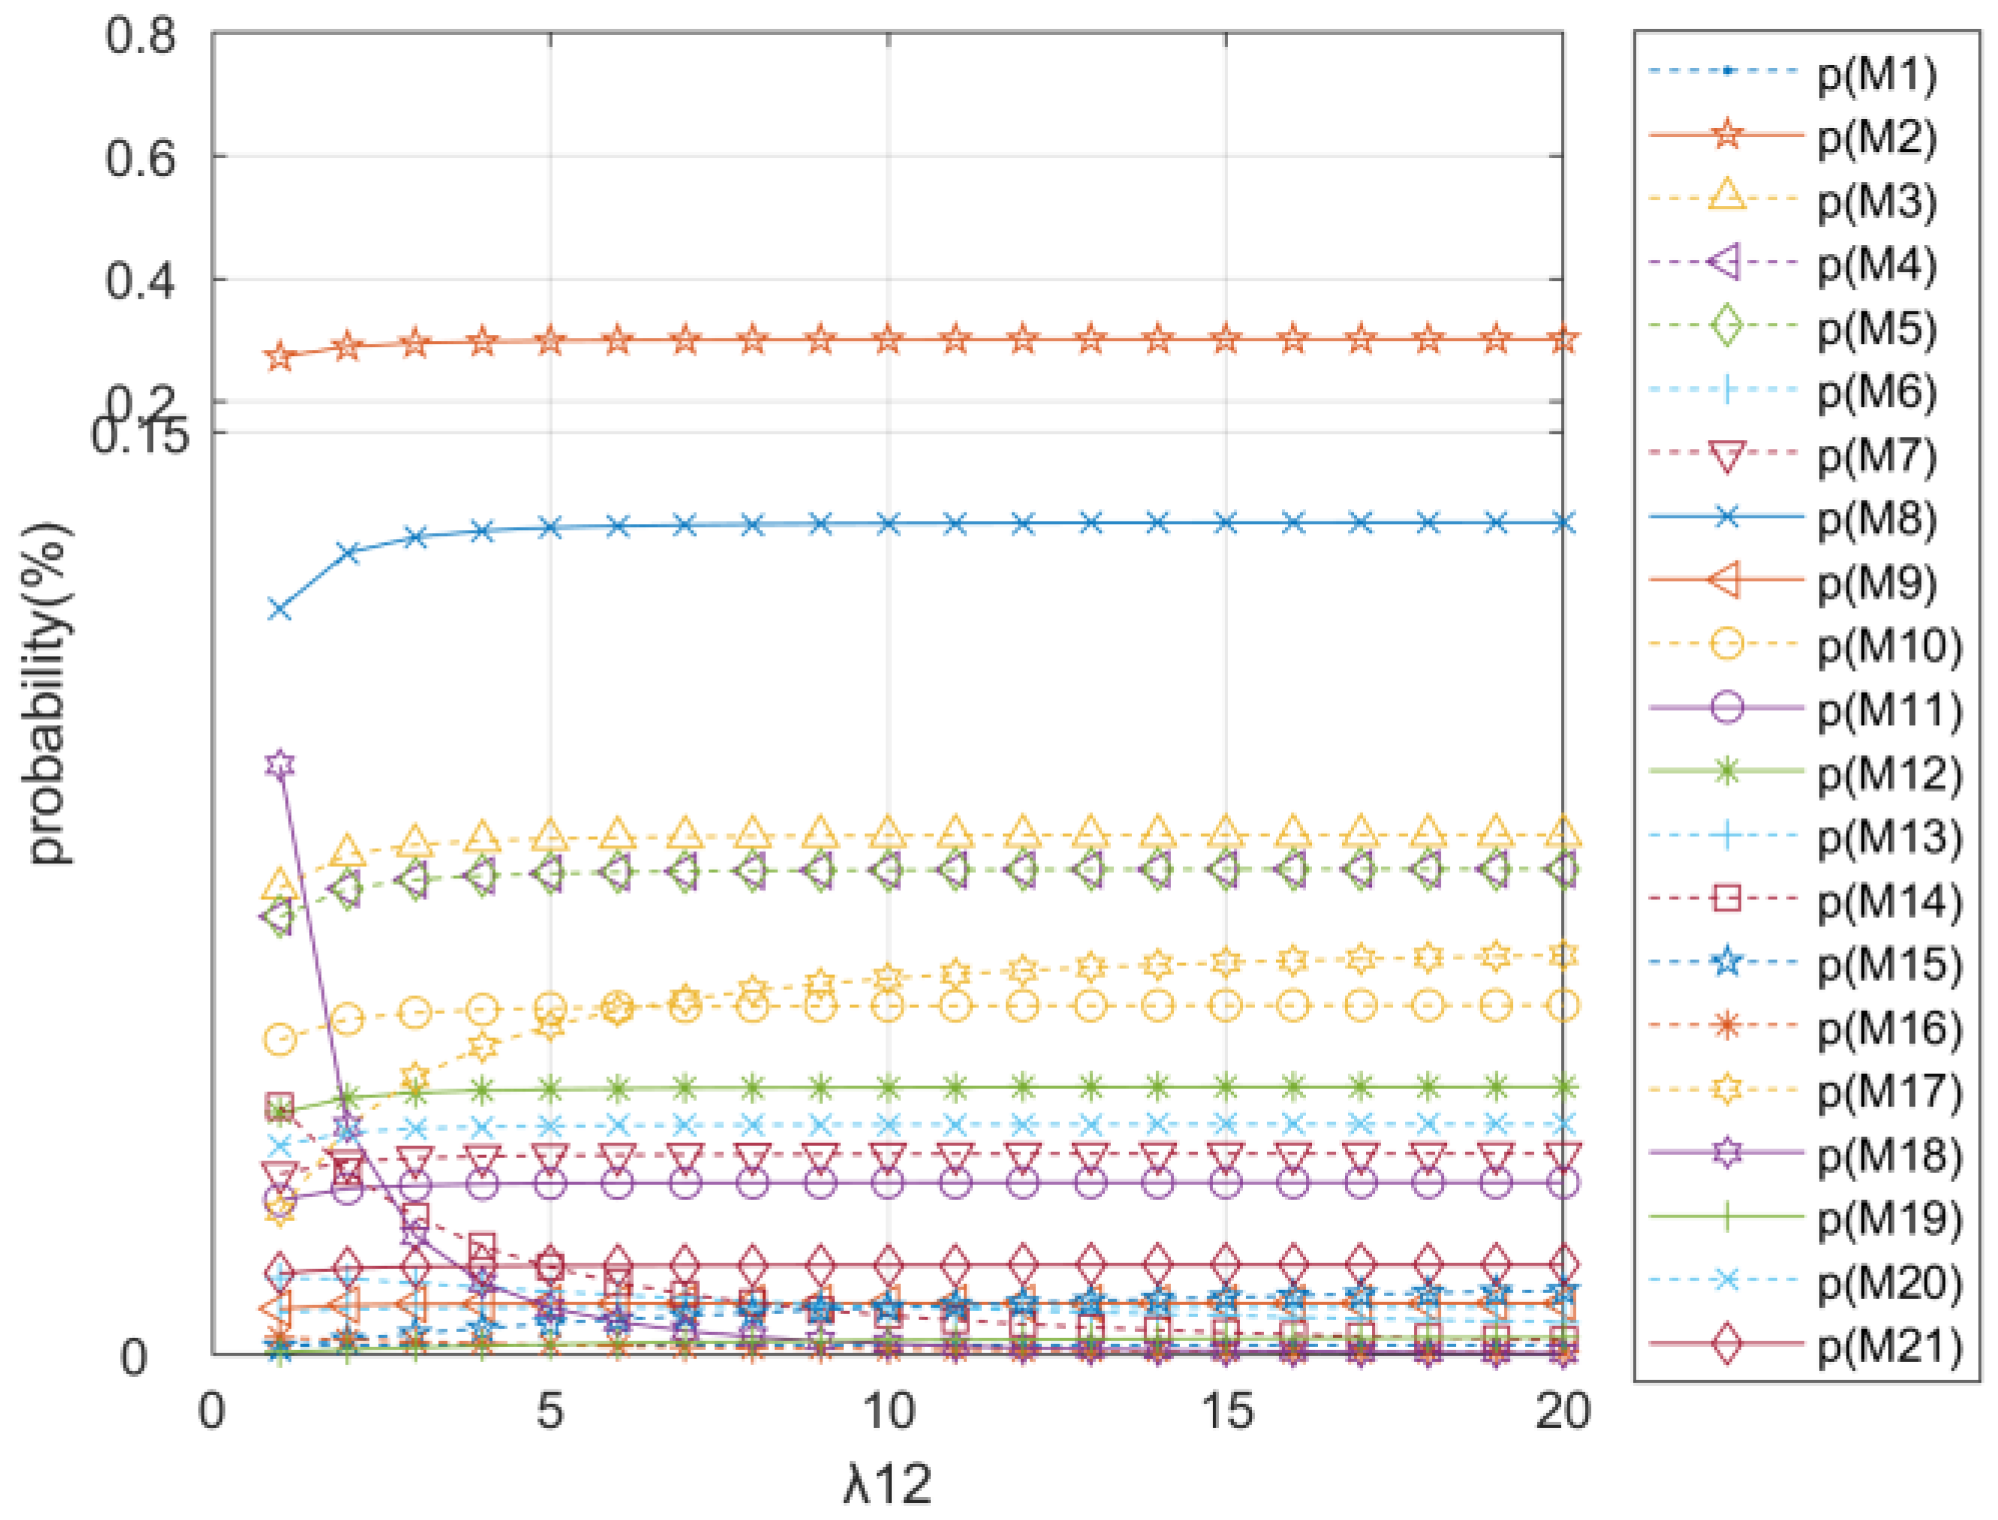
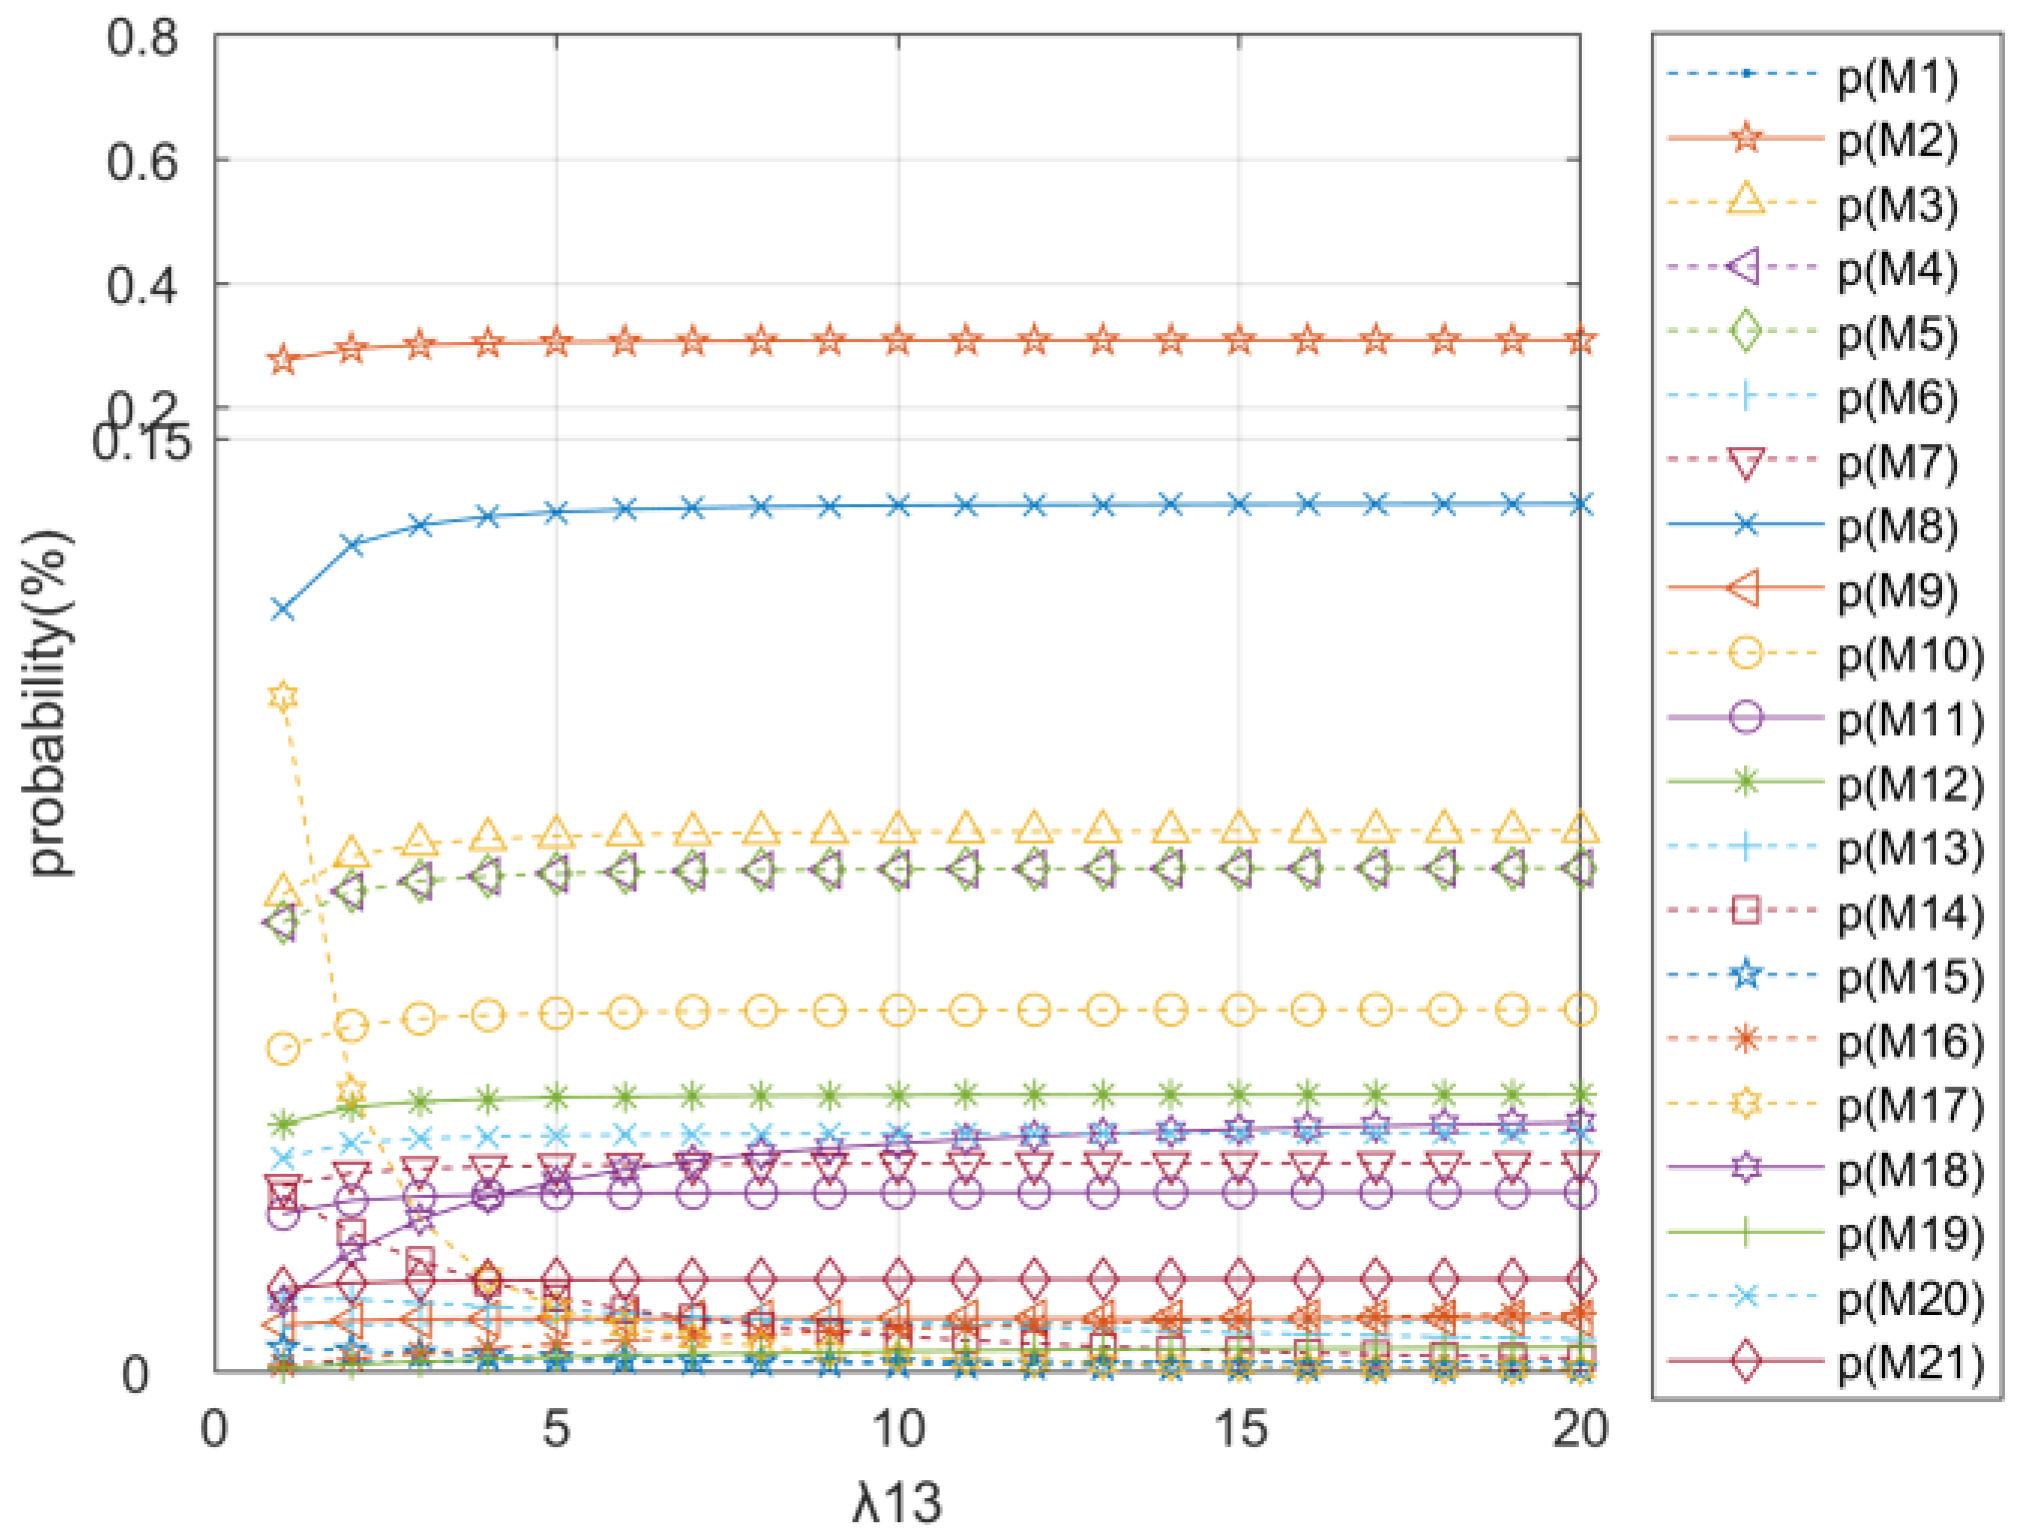
6.2.3. Scenario 3: Variations in Emergency Mobilization Measures (λ₁₁: Public Opinion Management, λ12: Capacity Expansion, λ₁₃: Enforcement Against Malpractice)

Assuming all other parameters (λ1, …, λ10, λ12, …, λ15) remain constant, the average transition rate λ11 is increased from 1 to 20. The resulting evolutionary equilibrium outcomes are shown in Figure 15. Similarly, when λ1, …, λ11, λ13, λ14, λ15 are held constant and λ12 is increased from 1 to 20, the corresponding results are displayed in Figure 16. Finally, increasing λ13 from 1 to 20 while keeping λ1, …, λ12, λ14, λ15 constant yields the outcomes presented in Figure 17.
As demonstrated by the convergence trends in Figure 15, Figure 16 and Figure 17, increasing the implementation rates of emergency mobilization parameters—namely, public opinion guidance (λ11), capacity expansion (λ12), and law enforcement against hoarding and price gouging (λ13)—from 1 to 20 consistently enhances the probability of a stable supply–demand equilibrium, p(M20). This suggests that these emergency response efforts—such as positive media guidance, supply chain reinforcement, and strict punishment of opportunistic behaviors—play equally critical roles in relieving pressure during the peak phases of a medical supply chain crisis.
To accelerate the mitigation of supply chain stress, it is imperative for government authorities to proactively promote expert-led dissemination of authoritative and reassuring information, organize rapid production shifts and capacity expansions across the medical supply sector, and intensify regulatory oversight of the pharmaceutical market. Through a three-pronged strategy—effective public communication, robust supply chain mobilization, and stringent legal enforcement—societies can stabilize drug prices, curb irrational demand, and facilitate a new equilibrium in the supply and demand of essential medical resources.

7. Conclusions

This study introduces a novel concept—emergency supply chain stress—and systematically explores its sources and characteristics. Anchored in lifecycle theory, the evolution of such stress is categorized into five distinct stages: the latent stage, the triggering stage, the formation stage, the outbreak stage, and the mitigation stage. Using the emergency medical supply chain as a representative case, the study provides a structured description of the stress evolution system, identifying and clarifying the interactions between internal and external factors throughout the evolutionary process.
Building on this foundation, a stochastic Petri net model is developed to mathematically capture the dynamics of emergency supply chain stress. The model integrates key contextual elements of China’s infectious disease transmission patterns, emergency medical supply and demand dynamics, resource allocation decisions, and emergency mobilization mechanisms.
This research offers a new analytical lens for studying issues related to emergency supply chains and provides a foundation for further model development. With an improved understanding of stress evolution in emergency supply chains, future research can focus on developing stress-testing tools to better evaluate the performance of such systems, design mobilization strategies, and test their effectiveness. These efforts can contribute to the formulation of more robust emergency response plans and enhance preparedness for large-scale, unconventional emergencies. Further studies may also explore supply chain resilience and system security to strengthen the overall capacity of emergency supply chain systems.
Nevertheless, this study has certain limitations. As the introduction of the “stress” concept into emergency supply chains represents a novel approach, further validation using a broader range of emergency material categories is required. Additionally, emerging mobilization strategies may arise in future emergency scenarios, necessitating continuous model refinement and expansion through the application of text-driven modeling techniques.

Author Contributions

Conceptualization, Q.C. and J.Z.; Data curation, Q.C.; Formal analysis, Q.C.; Funding acquisition, J.Z.; Investigation, Q.C.; Methodology, Q.C.; Project administration, J.Z.; Resources, Q.C.; Software, Q.C.; Supervision, J.Z.; Validation, Q.C.; Visualization, Q.C.; Writing—original draft, Q.C.; Writing—review and editing, Q.C. All authors have read and agreed to the published version of the manuscript.

Funding

This work was supported by the Ministry of Industry and Information Technology Major Policy Research project [grant number: BIT-RDC-202327441002]; the Beijing Municipal Social Science Foundation project [grant number: 20JCC067]; and the China Academy of Engineering’s Strategic Research and Advisory Project [grant number: 2022-HY-06].

Data Availability Statement

Data are contained within the article. The original contributions presented in the study are included in the article material; further inquiries can be directed to the corresponding author.

Conflicts of Interest

The authors declare no conflicts of interest.

Appendix A

Appendix A.1

Table A1. Trust intervals for the α -intercept set (M1M11).
× 10 5 α P(M1)P(M2)P(M3)P(M4)P(M5)P(M6)P(M7)P(M8)P(M9)P(M10)P(M11)
0.0(235.8584,87.5716)(22493.1599,36584)(12063.6626,4533.0167)(6706.4268,8757.3139)(6706.4268,8757.3139)(1026.787,497.121)(3227.9898,3181.0986)(15845.4139,10755.0996)(885.4026,775.8071)(6499.0482,4638.6265)(2995.095,2527.1955)
0.1(227.9529,94.4511)(23685.1996,36264.5756)(11611.9613,4850.1261)(6858.2789,8690.2773)(6858.2789,8690.2773)(991.5507,517.16)(3221.1286,3178.8058)(15460.9858,10915.2034)(871.6118,775.8367)(6349.8524,4685.0654)(2946.0796,2533.2933)
0.2(220.0964,101.3925)(24812.7007,35913.5074)(11170.4851,5172.3337)(7003.1877,8620.7319)(7003.1877,8620.7319)(957.5587,537.6951)(3214.7401,3177.0338)(15095.1063,11082.3295)(859.0667,776.1883)(6207.7882,4735.5944)(2900.8499,2540.4848)
0.3(212.2889,108.3949)(25878.3875,35529.5474)(10738.7064,5499.7688)(7141.5113,8548.5002)(7141.5113,8548.5002)(924.74,558.7493)(3208.8254,3175.7726)(14746.7092,11256.8697)(847.6899,776.8984)(6072.6156,4790.3185)(2859.1761,2548.875)
0.4(204.5304,115.4571)(26884.8298,35111.4084)(10316.141,5832.5719)(7273.5878,8473.3998)(7273.5878,8473.3998)(893.0287,580.3465)(3203.3848,3175.0137)(14414.8066,11439.2299)(837.4085,778.0043)(5944.104,4849.3494)(2820.8435,2558.571)
0.5(196.8212,122.5782)(27834.455,34657.7594)(9902.3438,6170.896)(7399.7367,8395.2436)(7399.7367,8395.2436)(862.3635,602.5122)(3198.4177,3174.7494)(14098.4819,11629.8321)(828.1545,779.544)(5822.0316,4912.8054)(2785.6509,2569.6825)
0.6(189.1618,129.7573)(28729.5594,34167.2215)(9496.9061,6514.907)(7520.261,8313.8391)(7520.261,8313.8391)(832.6878,625.2735)(3193.9235,3174.9735)(13796.883,11829.1166)(819.8634,781.5567)(5706.1856,4980.8119)(2753.4095,2582.3224)
0.7(181.5526,136.9932)(29572.318,33638.3627)(9099.4517,6864.7851)(7635.4482,8228.9874)(7635.4482,8228.9874)(803.9489,648.6591)(3189.9016,3175.6808)(13509.217,12037.544)(812.4749,784.0828)(5596.3617,5053.5016)(2723.942,2596.6068)
0.8(173.9943,144.2852)(30364.7942,33069.6936)(8709.6344,7220.7258)(7745.5719,8140.4836)(7745.5719,8140.4836)(776.0976,672.6997)(3186.3512,3176.867)(13234.7442,12255.5985)(805.9315,787.1639)(5492.3643,5131.0145)(2697.081,2612.6561)
0.9(166.4875,151.6321)(31108.9482,32459.6614)(8327.1354,7582.9412)(7850.8932,8048.115)(7850.8932,8048.115)(749.0883,697.4278)(3183.2722,3178.529)(12972.7736,12483.7901)(800.1791,790.8434)(5394.0059,5213.498)(2672.6682,2630.595)
1.0(159.0332,159.0332)(31806.645,31806.645)(7951.6612,7951.6612)(7951.6612,7951.6612)(7951.6612,7951.6612)(722.8783,722.8783)(3180.6645,3180.6645)(12722.658,12722.658)(795.1661,795.1661)(5301.1075,5301.1075)(2650.5537,2650.5537)

Appendix A.2

Table A2. Trust intervals for the α -intercept set (M12M21).
× 10 5 α P(M12)P(M13)P(M14)P(M15)P(M16)P(M17)P(M18)P(M19)P(M20)P(M21)
0.0(5346.0122,3187.2822)(1164.5871,1185.554)(3086.4129,1420.8372)(535.7226,170.0035)(346.6699,91.2507)(3367.4648,5653.7667)(1329.5791,2552.9494)(4.8279,244.9379)(5882.971,1488.6412)(835.9127,2039.2535)
0.1(5177.1046,3244.7538)(1156.3173,1178.6735)(2959.2829,1467.9963)(508.3719,180.8783)(327.6993,98.9013)(3467.2662,5535.2927)(1386.6374,2492.215)(18.1221,234.4345)(5557.3493,1621.2368)(896.258,1982.3344)
0.2(5015.9108,3306.6099)(1149.4653,1172.0858)(2837.7025,1518.2564)(482.1728,192.3811)(309.5066,106.9889)(3569.6937,5416.1204)(1444.5812,2430.9125)(31.2813,223.7308)(5245.0685,1761.2364)(956.8477,1924.6836)
0.3(4862.1812,3372.9772)(1143.9419,1165.8401)(2721.4946,1571.7167)(457.0882,204.5339)(292.069,115.5285)(3674.552,5296.4542)(1503.3354,2369.1389)(44.3094,212.8369)(4945.7263,1908.9003)(1017.6466,1866.378)
0.4(4715.6745,3443.9888)(1139.6627,1159.9859)(2610.488,1628.4803)(433.0821,217.3594)(275.364,124.5358)(3781.6517,5176.4936)(1562.8263,2306.9882)(57.2094,201.7621)(4658.9291,2064.4964)(1078.6179,1807.4916)
0.5(4576.1579,3519.7837)(1136.5486,1154.5735)(2504.5163,1688.6542)(410.1197,230.8808)(259.3698,134.0266)(3890.8082,5056.4337)(1622.9803,2244.552)(69.9831,190.5151)(4384.2925,2228.3008)(1139.7228,1748.0956)
0.6(4443.4066,3600.5075)(1134.5244,1149.6535)(2403.4183,1752.3495)(388.1668,245.1225)(244.0649,144.0175)(4001.8406,4936.4651)(1683.724,2181.9191)(82.6313,179.104)(4121.4406,2400.5972)(1200.9208,1688.2581)
0.7(4317.2036,3686.312)(1133.5188,1145.2778)(2307.0379,1819.6814)(367.1904,260.1095)(229.4283,154.5252)(4114.5709,4816.7746)(1744.984,2119.1761)(95.154,167.5361)(3870.0062,2581.6776)(1262.169,1628.0443)
0.8(4197.3397,3777.3559)(1133.4643,1141.4992)(2215.2238,1890.7693)(347.1586,275.8676)(215.4395,165.5672)(4228.8229,4697.5456)(1806.6863,2056.4071)(107.5501,155.8179)(3629.6307,2771.842)(1323.4229,1567.5168)
0.9(4083.6134,3873.8046)(1134.2958,1138.3719)(2127.8294,1965.7371)(328.0402,292.4236)(202.0784,177.1611)(4344.4214,4578.9586)(1868.7561,1993.6942)(119.8176,143.9555)(3399.9641,2971.3988)(1384.6352,1506.7353)
1.0(3975.8306,3975.8306)(1135.9516,1135.9516)(2044.7129,2044.7129)(309.805,309.805)(189.3253,189.3253)(4461.1918,4461.1918)(1931.1177,1931.1177)(131.954,131.954)(3180.6645,3180.6645)(1445.7566,1445.7566)

References

  1. Khaswaneh, A.; Nagarur, N. Production Planning and Emergency Inventory for Demand Surge in Health Supply Chains for Pandemics like COVID-19. Ind. Syst. Eng. Rev. 2021, 9, 32–46. [Google Scholar] [CrossRef]
  2. Bhaskar, S.; Tan, J.; Bogers, M.L.A.M.; Minssen, T.; Badaruddin, H.; Israeli-Korn, S.; Chesbrough, H. At the Epicenter of COVID-19–the Tragic Failure of the Global Supply Chain for Medical Supplies. Front. Public Health 2020, 8, 562882. [Google Scholar] [CrossRef] [PubMed]
  3. Khojasteh, Y.; Xu, H.; Zolfaghari, S. (Eds.) Supply Chain Risk Mitigation: Strategies, Methods and Applications; International Series in Operations Research & Management Science; Springer International Publishing: Cham, Switzerland, 2022; Volume 332, ISBN 978-3-031-09182-7. [Google Scholar]
  4. Krause, T.A.; Tse, Y. Risk Management and Firm Value: Recent Theory and Evidence. Int. J. Account. Inf. Manag. 2016, 24, 56–81. [Google Scholar] [CrossRef]
  5. Bracci, E.; Tallaki, M.; Gobbo, G.; Papi, L. Risk Management in the Public Sector: A Structured Literature Review. Int. J. Public Sect. Manag. 2021, 34, 205–223. [Google Scholar] [CrossRef]
  6. Charles, A.; Lauras, M.; Van Wassenhove, L.N.; Dupont, L. Designing an Efficient Humanitarian Supply Network. J. Oper. Manag. 2016, 47–48, 58–70. [Google Scholar] [CrossRef]
  7. Noham, R.; Tzur, M. Designing Humanitarian Supply Chains by Incorporating Actual Post-Disaster Decisions. Eur. J. Oper. Res. 2018, 265, 1064–1077. [Google Scholar] [CrossRef]
  8. Wang, Z.; Zhang, J. Agent-Based Evaluation of Humanitarian Relief Goods Supply Capability. Int. J. Disaster Risk Reduct. 2019, 36, 101105. [Google Scholar] [CrossRef]
  9. Diabat, A.; Jabbarzadeh, A.; Khosrojerdi, A. A Perishable Product Supply Chain Network Design Problem with Reliability and Disruption Considerations. Int. J. Prod. Econ. 2019, 212, 125–138. [Google Scholar] [CrossRef]
  10. Fahimnia, B.; Jabbarzadeh, A.; Ghavamifar, A.; Bell, M. Supply Chain Design for Efficient and Effective Blood Supply in Disasters. Int. J. Prod. Econ. 2017, 183, 700–709. [Google Scholar] [CrossRef]
  11. Rahmani, D.; Zandi, A.; Peyghaleh, E.; Siamakmanesh, N. A Robust Model for a Humanitarian Relief Network with Backup Covering under Disruptions: A Real World Application. Int. J. Disaster Risk Reduct. 2018, 28, 56–68. [Google Scholar] [CrossRef]
  12. Zokaee, S.; Bozorgi-Amiri, A.; Sadjadi, S.J. A Robust Optimization Model for Humanitarian Relief Chain Design under Uncertainty. Appl. Math. Model. 2016, 40, 7996–8016. [Google Scholar] [CrossRef]
  13. Mansoori, S.; Bozorgi-Amiri, A.; Pishvaee, M.S. A Robust Multi-Objective Humanitarian Relief Chain Network Design for Earthquake Response, with Evacuation Assumption under Uncertainties. Neural Comput. Appl. 2020, 32, 2183–2203. [Google Scholar] [CrossRef]
  14. Zhang, J.; Wang, Z.; Ren, F. Optimization of Humanitarian Relief Supply Chain Reliability: A Case Study of the Ya’an Earthquake. Ann. Oper. Res. 2019, 283, 1551–1572. [Google Scholar] [CrossRef]
  15. Dubey, R.; Gunasekaran, A.; Bryde, D.J.; Dwivedi, Y.K.; Papadopoulos, T. Blockchain Technology for Enhancing Swift-Trust, Collaboration and Resilience within a Humanitarian Supply Chain Setting. Int. J. Prod. Res. 2020, 58, 3381–3398. [Google Scholar] [CrossRef]
  16. Song, J.M.; Chen, W.; Lei, L. Supply Chain Flexibility and Operations Optimisation under Demand Uncertainty: A Case in Disaster Relief. Int. J. Prod. Res. 2018, 56, 3699–3713. [Google Scholar] [CrossRef]
  17. Singh, R.K.; Gupta, A.; Gunasekaran, A. Analysing the Interaction of Factors for Resilient Humanitarian Supply Chain. Int. J. Prod. Res. 2018, 56, 6809–6827. [Google Scholar] [CrossRef]
  18. Maghsoudi, A.; Zailani, S.; Ramayah, T.; Pazirandeh, A. Coordination of Efforts in Disaster Relief Supply Chains: The Moderating Role of Resource Scarcity and Redundancy. Int. J. Logist. Res. Appl. 2018, 21, 407–430. [Google Scholar] [CrossRef]
  19. Kunz, N.; Gold, S. Sustainable Humanitarian Supply Chain Management—Exploring New Theory. Int. J. Logist. Res. Appl. 2017, 20, 85–104. [Google Scholar] [CrossRef]
  20. Altay, N.; Gunasekaran, A.; Dubey, R.; Childe, S.J. Agility and Resilience as Antecedents of Supply Chain Performance under Moderating Effects of Organizational Culture within the Humanitarian Setting: A Dynamic Capability View. Prod. Plan. Control 2018, 29, 1158–1174. [Google Scholar] [CrossRef]
  21. Chen, F.; Liu, S.; Appolloni, A. Horizontal Coordination of I-LNGOs in the Humanitarian Supply Chain: An Evolutionary Game Approach. Sustainability 2020, 12, 5953. [Google Scholar] [CrossRef]
  22. Izadikhah, M.; Azadi, M.; Kahi, V.S.; Saen, R.F. Developing a New Chance Constrained NDEA Model to Measure the Performance of Humanitarian Supply Chains. Int. J. Prod. Res. 2019, 57, 662–682. [Google Scholar] [CrossRef]
  23. Dubey, R. Design and Management of Humanitarian Supply Chains: Challenges, Solutions, and Frameworks. Ann. Oper. Res. 2022, 319, 1–14. [Google Scholar] [CrossRef] [PubMed]
  24. Zhu, Q.; Geng, Y. Study on Factors of Green Supply Chain Management among Chinese Manufacturers. Chin. J. Manag. Sci. 2004, 12, 81–85. [Google Scholar]
  25. Qu, Y.; Zhu, Q.; Wu, C. An Empirical Study on Drivers/Pressures Affecting GSCM Implementation. Forecasting 2007, 26, 1–6. [Google Scholar]
  26. Huang, W.; Chen, Z. Foreign Entry, Supply Chain Pressure and CSR in China. J. Manag. World 2015, 2, 91–100+132. [Google Scholar] [CrossRef]
  27. Yao, W.X.; You, J.M. A Probe into the Method of Controlling the Extreme Risk of Supply Chain Based on Pressure Testing. Econ. Surv. 2010, 5, 86–90. [Google Scholar] [CrossRef]
  28. Yao, W.X.; Chen, Q. The Treatment after Supply Chain Stress Test from the Perspective of Resilience. Sci. Technol. Manag. Res. 2015, 35, 193–197. [Google Scholar]
  29. Cannella, S.; Ciancimino, E. On the Bullwhip Avoidance Phase: Supply Chain Collaboration and Order Smoothing. Int. J. Prod. Res. 2010, 48, 6739–6776. [Google Scholar] [CrossRef]
  30. Luo, L. Supply Chain Stress. Ph.D. Thesis, Washington State University, Pullman, WA, USA, 2019. [Google Scholar]
  31. Luo, L.; Munson, C.L. Developing a Supply Chain Stress Test. In Supply Chain Risk Mitigation: Strategies, Methods and Applications; Khojasteh, Y., Xu, H., Zolfaghari, S., Eds.; Springer International Publishing: Cham, Switzerland, 2022; pp. 61–80. ISBN 978-3-031-09183-4. [Google Scholar]
  32. Ivanov, D.; Dolgui, A. Stress Testing Supply Chains and Creating Viable Ecosystems. Oper. Manag. Res. 2022, 15, 475–486. [Google Scholar] [CrossRef]
  33. Ivanov, D. Intelligent Digital Twin (iDT) for Supply Chain Stress-Testing, Resilience, and Viability. Int. J. Prod. Econ. 2023, 263, 108938. [Google Scholar] [CrossRef]
  34. Shen, W.M. SAIC resumed work and production pressure testing the first complete car off the production line. People’s Daily 2022-04-20(004). Available online: https://paper.people.com.cn/rmrb/html/2022-04/20/nw.D110000renmrb_20220420_5-04.htm (accessed on 29 May 2025).
  35. Sun, Y.; Liu, H.P.; Yan, R.; Zhang, Q. Equilibrium Optimization of the Supply Chain of Emergency Medical Supplies Based on Resilience and Social Welfare. Chin. J. Manag. Sci. 2023, 31, 132–141. [Google Scholar]
  36. Büyüktahtakın, İ.E.; des-Bordes, E.; Kıbış, E.Y. A New Epidemics–Logistics Model: Insights into Controlling the Ebola Virus Disease in West Africa. Eur. J. Oper. Res. 2018, 265, 1046–1063. [Google Scholar] [CrossRef]
  37. Huo, J.Z.; Zhang, J.W.; Xu, S.Y. Analysis of Strategic Reserve and Rotation Policy of Emergency Medical Supplies: Taking Masks as an Exampl. Shanghai Manag. Sci. 2023, 45, 43–49. [Google Scholar]
  38. Paul, S.; Venkateswaran, J. Impact of Drug Supply Chain on the Dynamics of Infectious Diseases. Syst. Dyn. Rev. 2017, 33, 280–310. [Google Scholar] [CrossRef]
  39. Queiroz, M.M.; Ivanov, D.; Dolgui, A.; Fosso Wamba, S. Impacts of Epidemic Outbreaks on Supply Chains: Mapping a Research Agenda amid the COVID-19 Pandemic through a Structured Literature Review. Ann Oper Res 2022, 319, 1159–1196. [Google Scholar] [CrossRef]
  40. Paul, S.; Venkateswaran, J. Designing Robust Policies under Deep Uncertainty for Mitigating Epidemics. Comput. Ind. Eng. 2020, 140, 106221. [Google Scholar] [CrossRef]
  41. Liu, M.; Zhang, D. A Dynamic Logistics Model for Medical Resources Allocation in an Epidemic Control with Demand Forecast Updating. J. Oper. Res. Soc. 2016, 67, 841–852. [Google Scholar] [CrossRef]
  42. Anparasan, A.A.; Lejeune, M.A. Data Laboratory for Supply Chain Response Models during Epidemic Outbreaks. Ann. Oper. Res. 2018, 270, 53–64. [Google Scholar] [CrossRef]
  43. Govindan, K.; Mina, H.; Alavi, B. A Decision Support System for Demand Management in Healthcare Supply Chains Considering the Epidemic Outbreaks: A Case Study of Coronavirus Disease 2019 (COVID-19). Transp. Res. Part E Logist. Transp. Rev. 2020, 138, 101967. [Google Scholar] [CrossRef]
  44. Shi, W.Q.; He, J.; Wang, M.Y. System dynamics model of emergency medical materials supply chain considering decision maker’s overconfidence bias. J. Saf. Environ. 2023, 23, 1545–1555. [Google Scholar] [CrossRef]
  45. Song, Y.; Xu, H.; Fang, D.; Sang, X. Modelling and Analysis of Emergency Scenario Evolution System Based on Generalized Stochastic Petri Net. Systems 2025, 13, 107. [Google Scholar] [CrossRef]
  46. Ivanov, D. Predicting the Impacts of Epidemic Outbreaks on Global Supply Chains: A Simulation-Based Analysis on the Coronavirus Outbreak (COVID-19/SARS-CoV-2) Case. Transp. Res. Part E Logist. Transp. Rev. 2020, 136, 101922. [Google Scholar] [CrossRef] [PubMed]
  47. Zhang, M.; She, L.; Geng, B. Research on the Similarity of the Structured Emergency Events Based on Scenario. Chin. J. Manag. Sci. 2017, 25, 151–159. [Google Scholar]
  48. Gong, L.; Zhang, J.; Li, B. Research on Post-Disaster Emergency Material’s Mobilization Production Considering Raw Material Supply. Xitong Gongcheng Lilun Yu Shijian/Syst. Eng. Theory Pract. 2018, 38, 2600–2610. [Google Scholar]
  49. Ling-jun, G.; Ji-hai, Z. Multi-Objective Emergency Production Assignment Model Based on NSGA-II. Oper. Res. Manag. Sci. 2019, 28, 7. [Google Scholar]
  50. Gong, L.; Zhang, J. System-Dynamics-Based Emergency Transportation Strategy Analysis for Oil Products. Xitong Gongcheng Lilun Yu Shijian/Syst. Eng. Theory Pract. 2017, 37, 2256–2267. [Google Scholar]
  51. Liu, M.P. Research on Mechanism Construction of Collaborative Governance of Online Public Opinion on Major Emergencies. Truth Seek. 2022, 64–76, 111. [Google Scholar]
  52. Daniels, R.; Kettl, D.; Kunreuther, H. On Risk and Disaster: Lessons from Hurricane Katrina; University of Pennsylvania Press: Philadelphia, PA, USA, 2006; ISBN 978-0-8122-1959-3. [Google Scholar]
  53. Jie, G.; Licheng, Y.; Zixu, S. Crisis Management Based on Science and Technology Perspective and Double-Cycle Theory. Sci. Technol. Prog. Policy 2020, 37, 8–13. [Google Scholar]
  54. Benbasat, I.; Goldstein, D.K.; Mead, M. The Case Research Strategy in Studies of Information Systems. MIS Q. 1987, 11, 369–386. [Google Scholar] [CrossRef]
  55. Guo, C.; Song, Y. A New Stochastic Petri Net Modeling Approach for the Evolution of Online Public Opinion on Emergencies: Based on Four Real-Life Cases. Systems 2024, 12, 333. [Google Scholar] [CrossRef]
  56. Lin, C. Stochastic Petri Nets and System Performance Evaluation; Tsinghua University Press: Beijing, China, 2005. (In Chinese) [Google Scholar]
Figure 1. Supply and demand diagram for the supply chain of emergency supplies in the event of a supernormal emergency.
Systems 13 00423 g001
Figure 2. Schematic diagram of stress generation.
Systems 13 00423 g002
Figure 3. Emergency event-stress dual-cycle curve model.
Systems 13 00423 g003
Figure 4. Systematic map of stress evolution process in the emergency medical supplies supply chain.
Systems 13 00423 g004
Figure 5. SPN model for stress evolution in the supply chain of emergency medical supply.
Systems 13 00423 g005
Figure 6. Markov chain isomorphic to the SNP model.
Systems 13 00423 g006
Figure 7. The α -level cut set of a fuzzy number.
Systems 13 00423 g007
Figure 8. Number of new confirmed cases nationwide.
Systems 13 00423 g008
Figure 9. Trends in the number and rate of positive nucleic acid tests for novel coronaviruses in the national reporting population.
Systems 13 00423 g009
Figure 10. Equilibrium results of SCSE under λ2 variations.
Systems 13 00423 g010
Figure 11. Equilibrium results of SCSE under λ3 variations.
Systems 13 00423 g011
Figure 12. Equilibrium results of SCSE under λ4 variations.
Systems 13 00423 g012
Figure 13. Equilibrium results of SCSE under λ6 variations.
Systems 13 00423 g013
Figure 14. Equilibrium results of SCSE under λ7 variations.
Systems 13 00423 g014
Figure 15. Equilibrium results of SCSE under λ11 variations.
Systems 13 00423 g015
Figure 16. Equilibrium results of SCSE under λ12 variations.
Systems 13 00423 g016
Figure 17. Equilibrium results of SCSE under λ13 variations.
Systems 13 00423 g017
Table 1. Definition of symbols in the SPN model of stress evolution in the supply chain of emergency medical supplies.
PlaceAttribute StateTransitionMeaning of Change
P1Purchase restrictionst1Environmental developments
P2Related policy restrictionst2A series of chain reactions
P3Socio-emotional impactt3Spread of viruses
P4Shock eventst4Information dissemination
P5Increased turnovert5Demand surge
P6Misinformation generationt6Bulk purchasing
P7Spread of infectious diseasest7People rush to buy
P8Spread of rumorst8Imbalance between supply and demand
P9Bulk purchasing organizationst9Government intervention
P10Economic stakeholderst10Emergency mobilization
P11People infected with the virust11Public opinion control
P12Panic infectedt12Capacity enhancement
P13Large customer order generationt13Punishment of unruly behavior
P14Retail disordert14Supply and demand docking
P15Insufficient supplyt15Supply and demand balancing
P16Setting up a special team
P17Experts to dispel rumors and provide positive guidance
P18Replenish and fix the chain (stabilize production, reach production, change production, increase production, and expand production)
P19Investigating and dealing with typical hoarding and sales shyness
P20Demand for hoarding subsides
P21Increase in supply
P22Prices stabilize
P23Sufficient supply
Disclaimer/Publisher’s Note: The statements, opinions and data contained in all publications are solely those of the individual author(s) and contributor(s) and not of MDPI and/or the editor(s). MDPI and/or the editor(s) disclaim responsibility for any injury to people or property resulting from any ideas, methods, instructions or products referred to in the content.

