Article

The Digital Economy and Sustainable Development Goals: A Predictive Analysis of the Interconnection Between Digitalization and Sustainability in EU Countries

by
Anca Antoaneta Vărzaru
Department of Economics, Accounting and International Business, Faculty of Economics and Business Administration, University of Craiova, 13 A.I. Cuza Street, 200585 Craiova, Romania
Systems 2025, 13(6), 398; https://doi.org/10.3390/systems13060398
Submission received: 7 April 2025 / Revised: 20 May 2025 / Accepted: 20 May 2025 / Published: 22 May 2025
(This article belongs to the Special Issue Sustainable Business Models and Digital Transformation)

Abstract

:
The accelerating pace of digital transformation has positioned the digital economy as a key driver in advancing the Sustainable Development Goals (SDGs). However, the mechanisms through which digitalization influences sustainability remain underexplored. This study examines the extent to which digital progress, captured through the Digital Economy and Society Index (DESI), impacts sustainable development outcomes across EU member states, measured by the Sustainable Development Goals Index (SDGi). Utilizing data spanning the period 2017–2022, the analysis applies a multi-method approach—combining exploratory factor analysis, multiple regression, artificial neural networks, and predictive modeling—to identify structural relationships and forecast future trends. The findings reveal strong linkages between human capital development, digital technology integration, and SDG performance, while also highlighting significant heterogeneity among EU countries. Forecasts indicate that digitalization is likely to accelerate in the coming years. Still, its contribution to sustainability will depend on the degree to which policy frameworks succeed in fostering inclusive and context-sensitive digital transitions. By integrating empirical precision with predictive insight, this study offers a robust framework for aligning digital transformation with long-term sustainability objectives in a diverse European context.

1. Introduction

The modern world faces a profound paradox: while technological progress advances at unprecedented speeds, social inequalities and ecological threats grow alarmingly, creating an increasingly fragmented global landscape. Extreme poverty continues to affect millions, even as accelerating climate change transforms entire ecosystems, with devastating consequences for vulnerable communities [1]. Within this contradictory context, the digital economy has become a focal point in discussions about sustainable development, offering promises of progress and new challenges for global coordination. The transformative role of digitalization in advancing the SDGs is increasingly recognized in academic literature [2,3], yet the concrete mechanisms through which this potential can be realized remain hotly debated.
This study aims to investigate the direct impact of digitalization, measured by the Digital Economy and Society Index (DESI), on the Sustainable Development Goals (SDGs) performance across EU member states, unlike prior approaches that examined only indirect correlations [4,5,6,7,8]. Utilizing a robust methodological framework, we employ exploratory factor analysis to identify latent structures within DESI dimensions, followed by regression modeling to quantify their influence on SDG Index (SDGi) scores. To forecast future trends, we apply predictive techniques such as Artificial Neural Networks (ANN), ARIMA models, and expert smooth modeling. Our analysis leverages the latest DESI and SDGi datasets, covering all EU member states. The results reveal significant positive correlations between DESI components (particularly human capital and digital technology integration) and SDGi performance, highlighting the potential of digitalization to accelerate progress toward sustainability goals when aligned with targeted policies.
Our work addresses a critical gap in the literature. As Del Río Castro et al. [9] emphasize, current research lacks robust analytical frameworks to assess the digital economy’s contribution to sustainable development precisely. Few studies integrate multiple perspectives or leverage extensive datasets to capture the complexity of this relationship. Our study helps bridge key knowledge gaps by tackling these methodological shortcomings, providing a solid empirical foundation for evidence-based policymaking in sustainable digitalization.
Beyond identifying methodological gaps, this study contributes to the literature by offering a novel integrative framework that not only quantifies the relationship between digitalization and sustainability but also models its future trajectory using complementary predictive tools. In contrast to prior research, which often treats digital and sustainable transformations as parallel or indirectly connected processes, this article provides empirical evidence and theoretical insights into their dynamic interdependence within the EU context. By systematically incorporating both DESI and SDGi indicators into an advanced analytical architecture, this study advances existing knowledge in three key ways: it demonstrates the primacy of human capital in mediating digital impact, it highlights the limited direct effect of digital infrastructure absent broader ecosystem readiness, and it introduces predictive modeling as a strategic foresight tool for policymaking. These contributions are grounded in and extend the emerging body of work at the intersection of digital transformation and sustainable development, responding directly to calls from scholars such as Del Río Castro et al. [9] for more integrative, multidimensional analyses of this nexus.
The originality of this research lies in several complementary dimensions. First, it adopts a holistic view of the digital economy, examining technological aspects and social, institutional, and governance factors. Second, it integrates diverse analytical methods to deliver a nuanced understanding of the phenomenon. Third, it focuses specifically on the European context, offering a comparative analysis across EU member states to inform decision-making at the community level. These innovations ensure the study’s relevance, both theoretically and practically, advancing scholarly knowledge and equipping policymakers with actionable tools.
The paper’s structure reflects this comprehensive approach. The introduction outlines the research framework and its significance. The subsequent literature review explores key themes in the digital economy, sustainability, and their intersections, culminating in well-grounded research hypotheses. The materials and methods section details our innovative methodology, emphasizing the data sources, analyzed variables, and applied statistical techniques. Results are presented systematically, highlighting identified patterns and relationships. The discussion contextualizes these findings within existing literature and explores their theoretical and practical implications while suggesting future research directions. Finally, the conclusion synthesizes the key insights.

2. Literature Review and Hypotheses Development

2.1. Sustainable Development Goals

The concept of sustainable development centers on intergenerational equity, emphasizing the need to optimize consumption to meet present needs without compromising future generations’ ability to meet their own needs [10,11,12,13]. As Brusseau [14] compellingly argues, this integrated vision requires carefully balancing three fundamental dimensions—environmental, economic, and social—which function as a complex, interdependent system where environmental protection cannot be separated from poverty alleviation or economic opportunity creation. The core challenge of this approach, as Hamilton and Clemens [15] emphasize, lies precisely in finding that optimal equilibrium where economic growth coexists with responsible natural resource management [16], demanding public policies that internalize the costs of environmental degradation [17].
The 2015 adoption of Agenda 2030 by all 193 UN member states [18] marked a turning point in global sustainability efforts, significantly stimulating research and technological innovation [19]. Grounded in an integrated vision by Costanza et al. [20], Pradhan et al. [21], and Weststrate et al. [22], the 17 SDGs represent more than a reference framework—they constitute an ethical compass reconciling apparent contradictions between economic progress and environmental protection, offering a coherent action plan for collaboration between states, private sector and civil society. While critics, such as Madurai Elavarasan et al. [23] and Schuelke-Leech [24], question the ambitious scope of this approach, this does not diminish its crucial role in coordinating global efforts, particularly against systemic challenges like the climate crisis and forced migration [25], which demand integrated solutions and transnational cooperation.
The SDG framework reflects a profound understanding of global interdependencies, where progress in one sector creates opportunities in others. This strategic architecture, thoroughly analyzed by Mazzi and Floridi [26], underscores the need for dynamic implementation and monitoring mechanisms, as evidenced by Xu et al. [27] and Huan et al. [28] through cyclical reporting processes that ensure ongoing accountability. The crucial role of data in this process, emphasized by Chopra et al. [29] and Gupta et al. [30], reveals a contemporary paradox: while technologies offer unprecedented data collection and analysis capabilities, data literacy remains a significant barrier in transforming information into practical policies, and available statistical data still requires consolidation [1]. Thus, the SDGs represent not just target sets, but an ongoing learning and adaptation process, as demonstrated by Chenary et al. [16], inviting each country to devise creative implementation paths that reflect its cultural and developmental specificities, thereby transforming this global framework into a dynamic governance tool [31].
Recent global developments have added new layers of complexity to the implementation of the 2030 Agenda. The Sustainable Development Goals Report 2024 highlights that, despite early progress, mounting geopolitical, economic, and environmental crises are reversing favorable trends across many SDG targets [1,11,17,25]. The fluctuating engagement of key global actors has further amplified this uncertainty. For instance, the United States’ withdrawal from the Paris Agreement (2016–2020), its subsequent re-entry, and the announcement in 2025 of a new withdrawal have introduced considerable volatility into the global climate governance architecture. Moreover, the uneven commitments of other major economies—including China, India, and Russia—have indirect yet significant implications for SDG progress within the European Union, despite its internal consistency in pursuing the goals [13,19,25]. The war in Ukraine has further reshaped sustainability priorities across Europe, triggering a regional energy crisis that forced several EU member states to temporarily recalibrate or postpone aspects of their environmental and social development agendas [11,12,25]. These developments underscore that progress toward the SDGs does not occur in isolation, and that digitalization alone, however accelerated, cannot compensate for the broader disruptions affecting global sustainability efforts

2.2. Digital Economy

The digital economy can significantly advance sustainability through multiple mechanisms with evident environmental impacts. Digitalization is transforming production and consumption patterns, shifting from linear to more efficient circular models. Emerging technologies, such as IoT and big data analytics, enable more efficient management of finite natural resources, demonstrating that technological progress and environmental sustainability are not mutually exclusive but rather mutually reinforcing. Strategically integrating digital technologies into sustainability agendas represents a unique opportunity to reconcile economic progress with environmental protection while building more resilient societies and inclusive economies. Skvarciany et al. [32] demonstrate that the digital economy constitutes a complex system of structural transformations where technological progress catalyzes economic efficiency and environmental sustainability. This dual functionality primarily manifests through digitalization’s capacity to facilitate transitions from linear to circular economic models, where technologies such as IoT and big data analytics become strategic tools for optimizing resource and energy flows [33,34].
Recent studies documenting the concrete environmental impacts of digitalization reveal the depth of this transformation. Research by Chen [35] and Ma et al. [34] demonstrates the mechanisms through which digital solutions reduce ecological footprints, whether by optimizing industrial processes or replacing physical activities with virtual alternatives. Moreover, as Skvarciany et al. [32] observe, digitalization creates a virtuous cycle of environmental awareness, where democratized access to information on pollution and resource consumption stimulates more responsible citizen behaviors, from adopting renewable energy to reducing water waste.
However, as Attaran [36] and Maran et al. [37] caution, authentic digital transformation requires far more than passive technology adoption. Alojail and Khan [38] emphasize the systemic nature of this transition, demanding a fundamental reconceptualization of organizational models and value flows. This perspective aligns with the findings of Melovic et al. [39] and Hanelt et al. [40], who identify complex, interdependent factors—ranging from stakeholder alignment to digital risk management—that determine implementation success. Du et al. [41] further highlight the need for adaptive support frameworks that are responsive to the dynamics of the digital environment.
On the socioeconomic front, Elmassah and Hassanein’s [42] research reveals the transformative impact of digitalization on social structures, demonstrating how ICT becomes crucial for improving the quality of life. While Mitrovic [43] underscores the undeniable role of ICT in global economic growth, the actual digital economy extends beyond this instrumental dimension. Skvarciany et al.’s [32] DESI analysis reveals that multidimensional digitalization approaches, encompassing technical infrastructure, human capital, and digital public services, provide nuanced insights into how technology influences economic competitiveness and social cohesion. This integrated perspective becomes essential for formulating public policies that address the complexities of the contemporary digital economy.

2.3. Relationships Between Digitalization and Sustainability

The relationship between digitalization and sustainability reveals remarkable conceptual complexity, reflected in the ongoing academic debate about how to define digitalization itself, as Vial [44] observes. This terminological ambiguity is not a sign of inconsistency but instead mirrors the phenomenon’s dynamic, multidimensional nature, which, as Ionescu-Feleaga et al. [45] argue, transcends mere technological adoption to profoundly reconfigure social, economic, and political relationships, becoming a deep sociotechnical force reshaping human interactions. While technology shapes social structures, social practices continually reinvent technological applications, creating a complex ecosystem that redefines the human condition in the digital age [46].
Digitalization’s transformative impact on sustainability is most visible in education, where, as Shiroishi et al. [47] and Gejendhiran et al. [48] demonstrate, digital technologies not only reshape learning environments but also redesign the very architecture of knowledge. However, as Hopster [49] and Munawar et al. [50] caution, these innovations succeed not through isolated technical performance but through our ability to harmoniously embed them within existing social ecologies, balancing algorithmic efficiency with social sustainability. The actual test of these solutions lies not in their raw capabilities but in how we integrate them into lived social realities—a perspective reinforced by Park et al. [51] and Ghobakhloo et al. [52], who advocate integrative implementation frameworks and by Munawar et al. [50] and Mourtzis et al. [53], who analyze concrete sectoral applications.
Prior research, including Esses et al. [54], confirms significant correlations between digitalization and sustainable development performance, showing how digital progress often accompanies measurable improvements in sustainability policy implementation. This convergence reflects the evolution of technology, from early “smart city” concepts [55] to sophisticated AI-driven solutions addressing contemporary sustainability challenges [56]. While AI-based technologies may accelerate SDG progress, as Joia and Kuhl [57] and Wang and Siau [58] suggest, Truby [59] reminds us that balanced approaches must account for technology’s social impact, ensuring innovation serves equitable outcomes.
As Sarkis and Ibrahim [60] and Han et al. [61] emphasize, digital technologies’ true potential lies not in their mere existence but in how they embed within socioeconomic structures, transforming from technical tools into catalysts of systemic change. This vision aligns with Bican and Brem [62] and Lian et al. [63], who identify digitalization as pivotal for addressing climate crises and social inequalities. However, radical transformations of business models are required to support the full achievement of the SDGs.
Xu et al. [64] offer nuanced insights, meticulously analyzing how digitalization strengthens socioeconomic resilience. Their work frames digitalization not as an end goal but as a flexible instrument for sustainability—one that, when thoughtfully integrated, enables both resource optimization and systemic innovation.
Recent comparative studies reveal intriguing regional patterns. In Italy, Camodeca and Almici’s [65] research demonstrates strong positive correlations between digital adoption and SDG progress, particularly in e-governance and digital economy innovations benefiting education, healthcare, and renewable energy. However, Burinskienė and Seržantė [66] highlight persistent gaps in the integration of advanced technology within rural Europe.
Jovanovic et al. [67] offer a pan-European perspective by comparing the Digital Economy Index (DESI) with EU sustainability indicators. Their findings reveal a paradox: while digital advancement significantly boosts the economic and social dimensions of sustainability, environmental metrics often decline due to rising energy consumption and e-waste, underscoring the need for policies that mitigate ecological trade-offs.
Herman’s [68] study on digital entrepreneurship’s impact on SDGs identifies positive but uneven effects across the EU, with Nordic Europe outperforming Eastern Europe. When mapped through SDG scoring, such regional disparities do not merely enable cross-national comparison—they become strategic tools for identifying priority intervention zones [69] and tailoring place-sensitive policies [28]. SDG indicators thus serve as comprehensive progress measures, offering integrated snapshots of sustainable development trajectories [69,70].
Building on these insights—and heeding Chenary et al.’s [16] call for decentralized approaches that bridge digital divides—we formulate our core research hypothesis:
Hypothesis 1 (H1).
Components of the DESI, including connectivity (C), human capital (HC), Integration of Digital Technology (IDT), and digital public services (DPS), have a significant influence on the SDGi performance of EU member states.
This hypothesis rests on the premise that balanced digital development—spanning technical infrastructure, human competencies, and public services—creates optimal conditions for sustainability progress. It reflects the vision that strategically integrating digital tools into sustainability agendas uniquely reconciles economic advancement with environmental stewardship.

2.4. Predictive Models Assessing Digitalization’s Impact on EU Sustainability

When examining predictive models that assess the impact of digitalization on sustainability across Europe, we encounter a dynamic and adaptive approach, mirrored in the United Nations’ established monitoring mechanisms [71]. This framework transforms the SDGs from static indicators into flexible tools for adaptive governance, as convincingly demonstrated by Xu et al. [27] and Huan et al. [28]. The process’s inherent complexity—requiring not just sustained political commitment but also the capacity to evolve alongside shifting realities—comes into sharp focus in Asadikia et al.’s [31] work, which underscores the iterative nature of sustainability: a continuous learning process that demands strategic recalibration [16].
At the heart of any effective predictive model lies data quality and relevance—a critical factor emphasized by Chopra et al. [29]. Successful SDG implementation demands more than just access to information; it requires robust, timely, and qualitatively sound datasets. However, researchers consistently highlight persistent challenges around data consolidation and analytical literacy among decision-makers—a gap further exacerbated by the need for tight collaboration between data producers and users, which Gupta et al. [30] identify as vital for maintaining methodological coherence. Adopting innovative technologies for data collection, processing, and interpretation in this context becomes non-negotiable, particularly as Chopra et al. [1] warn that inaccurate or delayed information risks derailing implementation efforts, rendering them disjointed or counterproductive.
Despite measurable progress, the literature continues to reveal significant gaps in developing analytical frameworks capable of adequately assessing the sustainability impact of digitalization, as Del Río Castro et al. [9] illustrate. This methodological shortfall necessitates sophisticated predictive approaches that capture the complex relationship between digital economies and SDG performance. Our study responds by deploying two complementary predictive models: ARIMA frameworks for time-series analysis and historical trend forecasting, alongside expert smooth modeling—an adaptive technique blending observational data with domain expertise to generate more robust projections.
Building on these considerations and recognizing the need to pinpoint causal relationships between digital advancement and sustainability performance, we propose our second research hypothesis:
Hypothesis 2 (H2).
DESI has a significantly positive influence on the Sustainable Development Goal performance of EU member states—a relationship that advanced predictive techniques, such as ARIMA and expert smooth modeling, can accurately model and forecast.
This hypothesis posits that DESI component trajectories (connectivity, human capital, tech integration, and digital public services) can serve as leading indicators for SDG progress, ultimately providing policymakers with an actionable analytical framework for proactive, sustainability-driven digitalization strategies.
Figure 1 illustrates the conceptual model based on the two hypotheses.

3. Materials and Methods

3.1. Research Design

This study’s framework tackles the complex relationship between digital development and sustainable progress across EU member states through a rigorous empirical approach. By examining the dimensions of the DESI in conjunction with SDGi performance, we address a critical gap in the literature and provide fresh insights into how digital transformation can accelerate sustainability [72].
The theoretical foundation is built upon DESI’s established role as a comprehensive digital economy assessment tool, as confirmed by numerous studies [73,74,75]. Since its 2014 launch, the index has evolved to capture four key dimensions of digital maturity [32], creating a robust analytical framework. Meanwhile, the SDGI, based on UN reporting [72], serves as a performance benchmark, demonstrating how digital technologies can advance crucial areas such as poverty reduction and environmental protection.
The analysis explicitly focuses on the 2017–2022 period, reflecting the most recent and consistent data available for both DESI and SDGi indicators across EU member states.
Our methodology blends advanced quantitative analysis with contextual qualitative observations, moving beyond statistical correlations to uncover underlying mechanisms. This hybrid approach transforms DESI from a measurement tool into a strategic platform [76], offering policymakers actionable insights for aligning digital strategies with sustainability goals. These elements establish a solid foundation for analyzing the nexus between Europe’s digital economy and sustainability.
Figure 2 presents a structured overview of the research design, capturing the logical progression from data selection to the application of analytical and predictive techniques.

3.2. Selected Variables

The data selected for this analysis originates from two fundamental sources that capture, on the one hand, the digital evolution of European societies and, on the other, progress toward achieving SDGs. SDGi, developed by the Bertelsmann Stiftung Foundation in collaboration with the Sustainable Development Solutions Network (SDSN), provides a comprehensive measure of how thriving countries implement the 2030 Agenda [77,78]. This tool, which covers approximately 80% of UN member states with populations exceeding one million, standardizes performance on a scale of 1 to 100. This approach enables an absolute assessment of each country’s standing and highlights the gaps in achieving the ideal sustainable scenario.
DESI serves as an analytical framework for evaluating the digital maturity of EU member states [79]. Its four core dimensions offer an integrative view of digital transformation. As van Laar et al. emphasize [80], the human capital dimension reflects the essential skills required for active participation in a digital society. At the same time, connectivity, assessed through fixed and mobile infrastructure [81], highlights regional disparities that necessitate targeted policy interventions.
The private sector’s role in digital transformation becomes evident in the integration of digital technologies, where adopting advanced solutions, including artificial intelligence [82], is a key indicator of innovation capacity. At the same time, digital public services, examined in terms of citizen and business access to electronic administrative platforms [83], provide insight into institutional transformation. This combination of indicators, drawn from official sources and widely recognized academic reports, establishes a robust database for analyzing the interconnections between digitalization and sustainability across Europe.
Table 1 presents the variables selected for this research.
Table 2 presents the variables’ descriptive statistics

3.3. Methods

The selection of data and analytical methods in this study is driven by the need to capture the complex relationship between the digital economy and sustainable development in the most comprehensive manner possible. The carefully calibrated methodological approach seeks to overcome the limitations of previous studies by integrating multiple advanced analytical techniques, each offering a distinct perspective on this multidimensional issue.
Exploratory factor analysis serves as the first pillar of this investigation, providing a robust means of identifying latent structures within the complex set of DESI and SDGI indicators. This method relies on decomposing the correlation matrix between variables (1):
X = L F +
X —observed variables;
L —factor loadings matrix;
F —latent factors;
—errors.
By reducing data dimensionality, this approach uncovers fundamental patterns [87] underlying digitalization and sustainability indicators.
Regression analysis constitutes the second pillar of this approach, represented by Equation (2).
Y = β 0 + β 1 X 1 + β 2 X 2 + + β n X n +
Y —dependent variable;
X 1 , X 2 , , X n —independent variables;
β 0 —intercept
β 1 , β 2 , , β n —the regression coefficients;
—errors.
This technique quantifies the specific relationships between each digitalization component and progress toward sustainable development while controlling for the effects of other relevant variables [85].
Artificial neural networks (ANNs) follow a different approach and can be expressed as follows (3):
Y = f ( w i x i + b )
Y —output;
x i —inputs;
w i —weights;
b —bias;
f —activation function.
These adaptive models, inspired by the functioning of biological neural systems, prove particularly effective in capturing nonlinear relationships and complex interactions [85,87] between DESI and SDGI variables. Within this research framework, ANNs enable the modeling of how different combinations of digital factors can lead to similar sustainability outcomes (equifinality) or how the same digital component may yield different effects depending on the national context (path dependency).
The ARIMA (Auto Regressive Integrated Moving Average) models, expressed as follows (4), add a temporal dimension to the analysis [88,89]:
1 i = 1 p φ i L i ( 1 L ) d X t = 1 + i = 1 q θ i L i ε t
X t —data series;
L —lag operator;
φ i —parameters of the autoregressive part of the model;
θ i —parameters of the moving average part;
ε t —error.
Applying these models to historical DESI and SDGI time series helps identify trends and seasonal patterns in the evolution of digitalization and sustainability, enabling short- and medium-term forecasts regarding the impact of digital transformation on SDG performance.
Brown’s smoothing expert modeling refines the approach by integrating observational data with expert knowledge in a formalized framework [88,89]. This model is defined as follows (5)–(7):
S t = α y t + ( 1 α ) ( S t 1 + b t 1 )
b t = β ( S t S t 1 ) + ( 1 β ) b t 1
F t + m = S t + m b t
y t —the observed value at time t;
S t —the smoothed value for the level at time t;
b t —the estimated trend at time t;
α—the smoothing parameter for the level;
β—the smoothing parameter for the trend;
F t + m —the forecasted value for m steps ahead of time t.
This method integrates qualitative insights and contextual knowledge into the modeling process, thereby enhancing the interpretability and relevance of the decision-making process.
In the final stage of the empirical analysis, a cluster analysis was conducted using Ward’s method, which aims to minimize the variance within each cluster while maximizing the variance between them. The clusters were constructed based on the following formula using the squared Euclidean distance between observations (8):
Δ A , B = i A B x i m A B 2 i A x i m A 2 i B x i m B 2 = n A n B n A + n B | | m A m B | | 2
m j —the center of cluster j,
n j —number of points in cluster j,
x i —the vector of observed values for observation i, belonging to either cluster A or B,
Δ—merging cost of combining the clusters A and B,
i—cases.
This approach allowed for the grouping of EU countries into structurally coherent clusters based on their performance in both digitalization dimensions (DESI components) and sustainable development (SDGi), providing a clearer view of intra-European heterogeneity.
The selection of these methods reflects a deep understanding of the complexity of the studied phenomenon and the necessity of addressing it from multiple perspectives. Each technique contributes uniquely: factor analysis uncovers latent structures, regression quantifies specific relationships, neural networks capture nonlinearities, ARIMA models introduce a temporal perspective, and expert smoothing ensures contextual relevance. Together, they form a robust analytical framework capable of addressing complex research questions with scientific rigor while remaining attuned to the practical nuances of sustainable digitalization in the European context.

4. Results

4.1. Latent Structure Exploration Through Factor Analysis

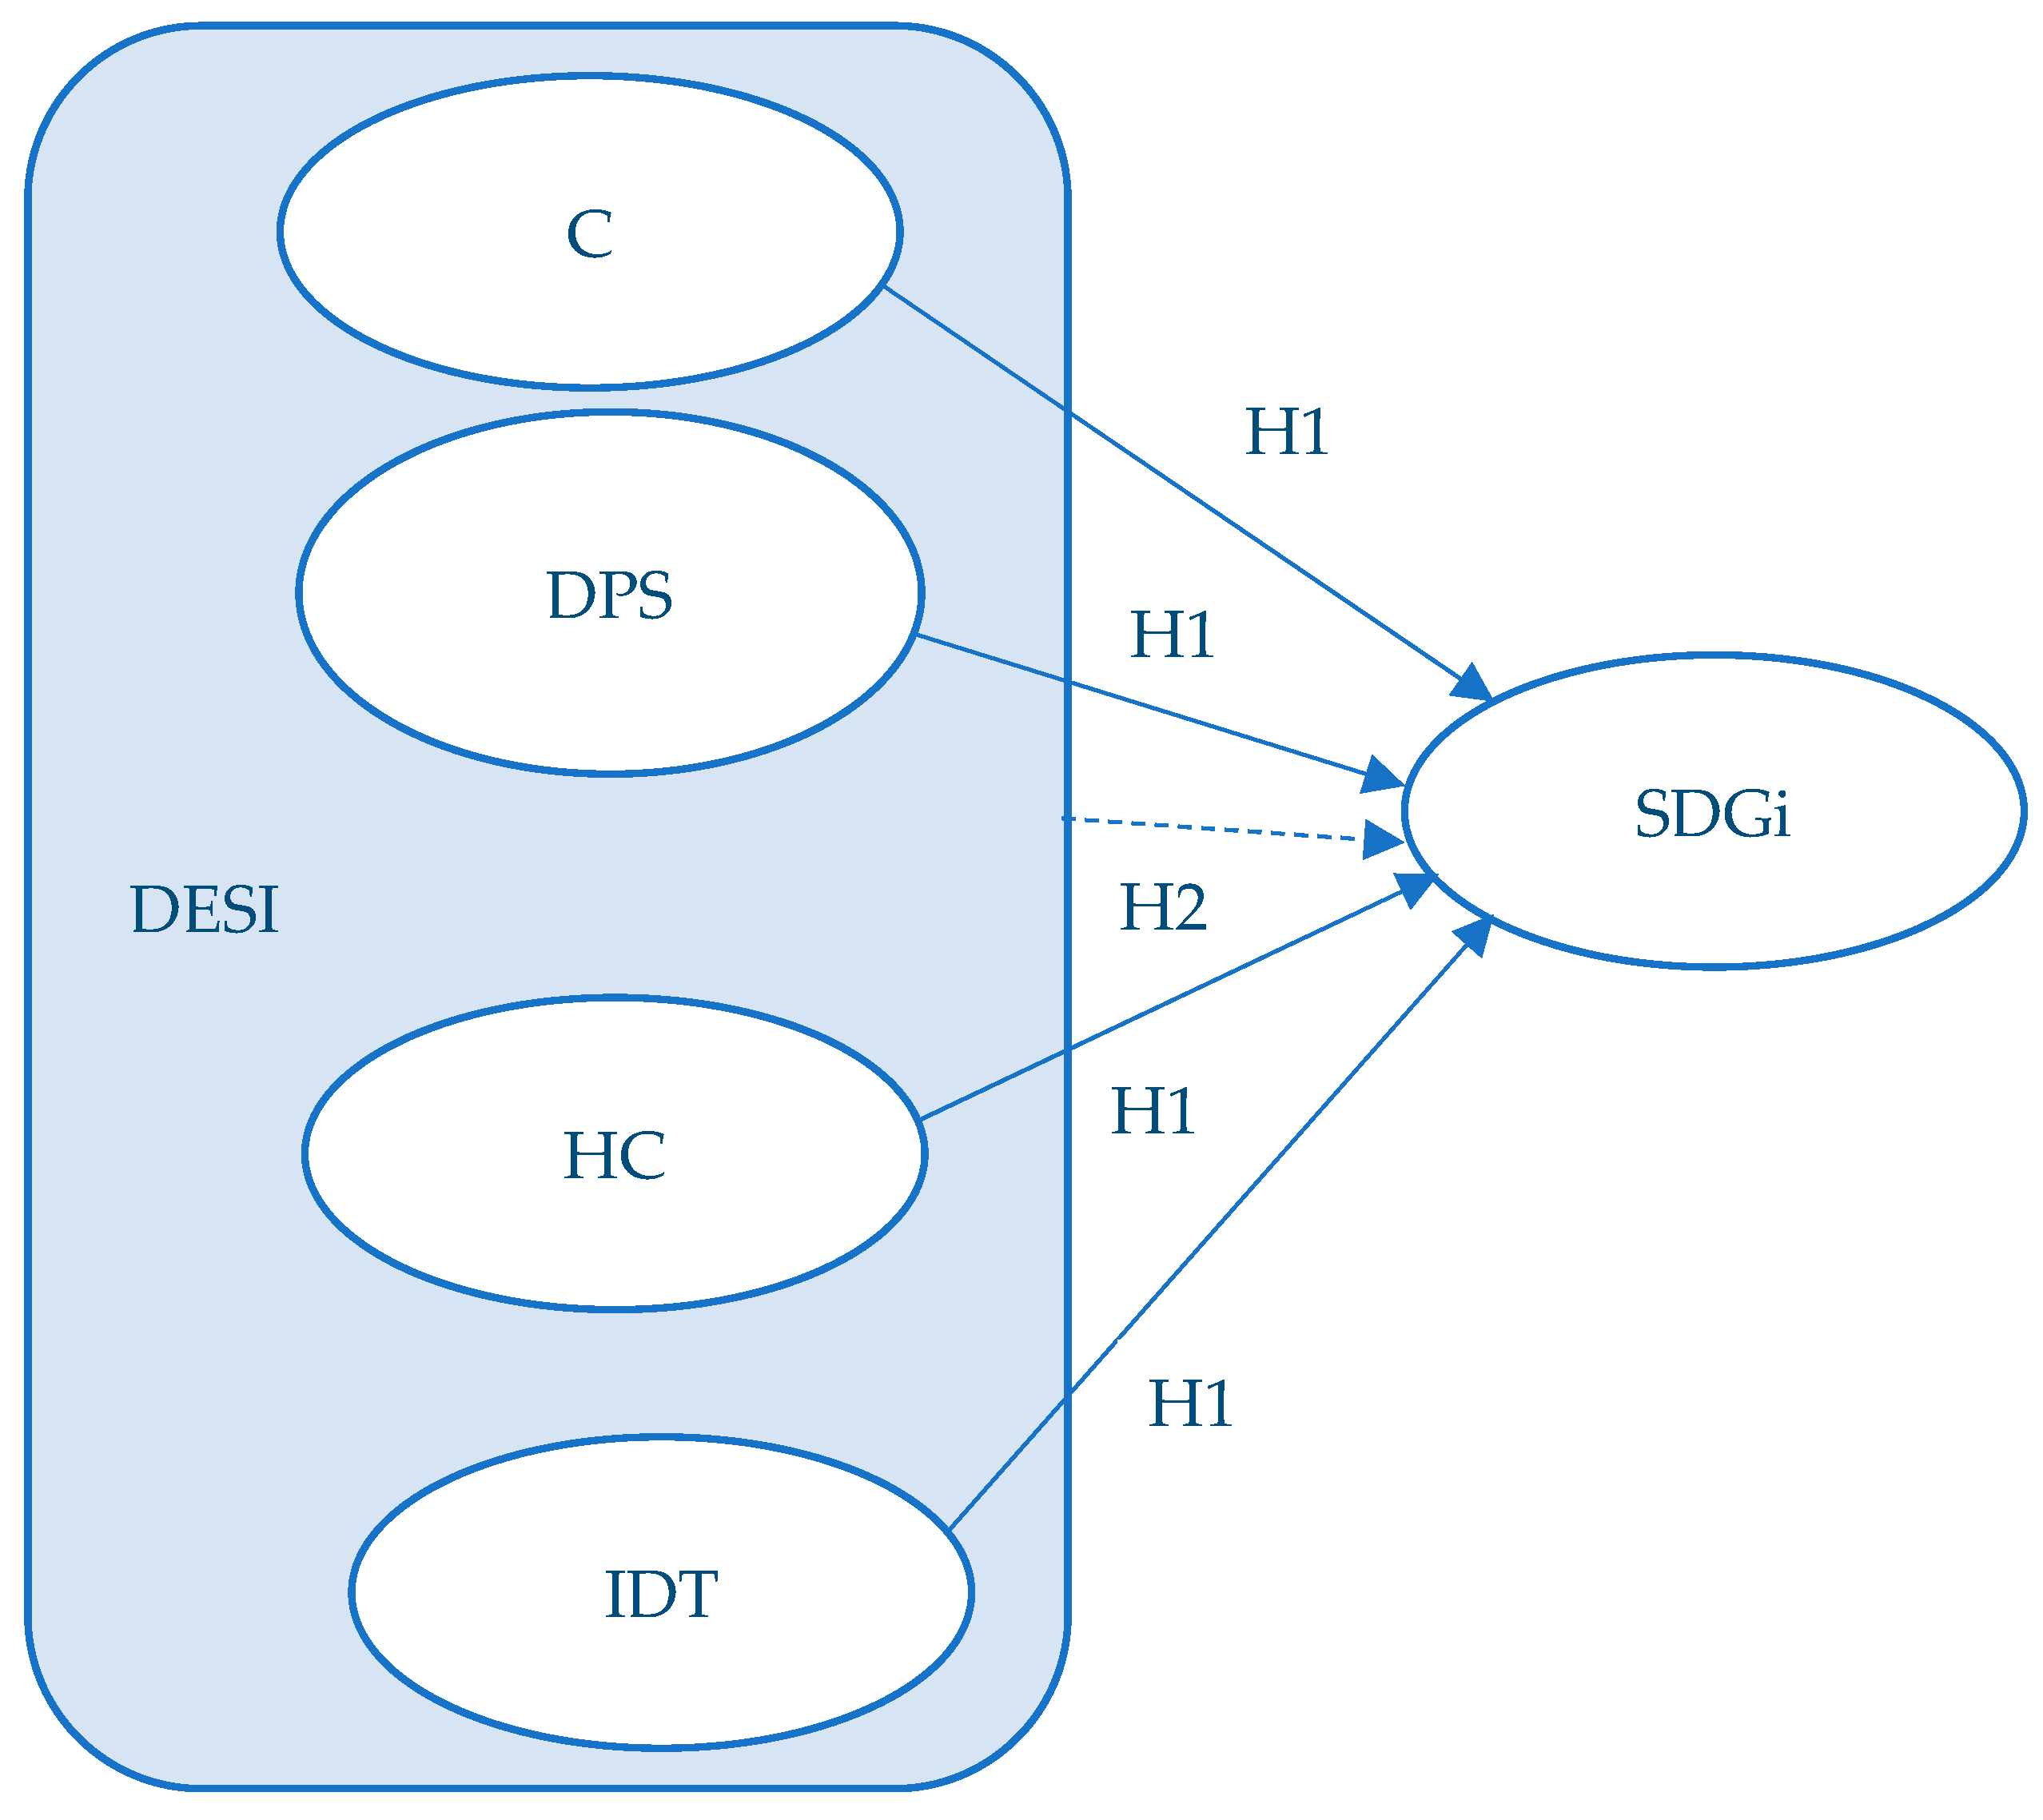
Testing hypothesis H1 required a multifaceted approach, integrating exploratory factor analysis, regression techniques, and artificial neural networks to identify linear and nonlinear relationships among the variables.
The exploratory factor analysis applied to our dataset reveals a compelling latent structure, suggesting the existence of a dominant common factor that accounts for a significant proportion of observed variance. The Kaiser-Meyer-Olkin (KMO) test, with a value of 0.791, confirms the adequacy of the sample for this analysis. In contrast, Bartlett’s test, which is significant at p < 0.001, rejects the null hypothesis of an identity matrix, indicating that there are sufficient correlations among variables to justify the use of factor analysis. The initial correlation matrix highlights significant relationships between DESI components and the SDGi index, with coefficients ranging from moderate to vigorous. Among these, HC and Integration of IDT exhibit the strongest correlations with SDGi, at 0.667 and 0.615, respectively. DPS displays a moderate correlation with SDGi (0.510), whereas C shows the weakest correlation (0.317), indicating potential disparities in how different aspects of digitalization impact sustainability (Table 3).
The analysis of commonalities reveals that the extracted factor adequately represents the variables, with values ranging from 0.315 for Connectivity to 0.836 for Integration of Digital Technology (Table 4).
These results suggest that the common factor most strongly explains IDT, whereas Connectivity exhibits a higher specific component, likely due to the varying nature of digital infrastructure across countries. The final factor matrix confirms this interpretation, showing high factor loadings for all variables on the first factor. IDT records the highest loading (0.914), followed by HC (0.875) and DPS (0.856). In contrast, SDGi (0.664) and C (0.561) exhibit moderately strong yet significant loadings. This model highlights the close relationship between digital development, specifically in terms of technological integration, human capital, and digital public services, and performance in achieving sustainable development objectives at the EU member state level.
Explaining the total variance further reinforces the presence of a single dominant factor, accounting for 61.8% of the total variation. This remarkable proportion affirms the strong interconnection between digitalization dimensions and sustainability performance (Table 5).
The remaining eigenvalues fall below the conventional threshold of 1, suggesting that the data structure is predominantly shaped by this single factor, with minimal contributions from potential secondary factors.
Overall, the factor analysis findings support the notion that digitalization, conceptualized as a multidimensional construct, exhibits a strong structural relationship with sustainability. The fact that a single factor explains such a significant share of variance suggests an underlying mechanism linking these seemingly distinct domains—potentially a combination of institutional capacity, innovation culture, and social cohesion. These insights provide a robust foundation for further investigations into the causal relationships among these variables.

4.2. Regression Analysis of Digitalization’s Impact on Sustainability

The multiple linear regression analysis applied to our study variables provides valuable insights into the relationships between digital economy components and progress toward the SDGs. The resulting model, with an adjusted R2 of 0.453, explains approximately 45% of the variation in SDGi scores, a substantial proportion that confirms the relevance of digital factors in understanding sustainability dynamics at the national level. The F-test associated with the model, significant at p < 0.001, indicates that the included predictors explain the variation in the dependent variable better than those without them (Table 6).
Standardized coefficients (Beta) offer a nuanced perspective on the relative contributions of each predictor. Human Capital (HC) emerges as the strongest determinant of SDGi performance (β = 0.534, p < 0.001), suggesting that investments in digital skills and education constitute the most effective pathway through which digitalization can enhance sustainability. This result underscores the crucial role of the human factor in the digital transformation equation, where the availability of suitable competencies enables the adoption of sustainable practices across various sectors.
The integration of Digital Technology (IDT) also exhibits a significant positive influence (β = 0.242, p = 0.030), albeit to a lesser extent. This indicates that the degree to which digital solutions are implemented in the private sector contributes to improved sustainability performance. This outcome likely reflects how digitalization fosters resource efficiency and sustainable innovation in business environments.
By contrast, the results for Connectivity (C) and Digital Public Services (DPS) are unexpected, as both variables prove statistically insignificant (p > 0.05). This result suggests that merely having digital infrastructure or online public services in place is insufficient to generate measurable improvements in achieving the SDGs. A combination of infrastructure, skills, and practical applications appears necessary for digitalization to unlock its full transformative potential.
These findings emphasize the importance of differentiated approaches in sustainable digitalization policies. They suggest that investments in digital education and professional training, along with incentives for technology adoption in the private sector, may be more effective pathways toward sustainability than simply expanding digital infrastructure or public online services.

4.3. Neural Network Analysis of Digitalization’s Impact on Sustainability

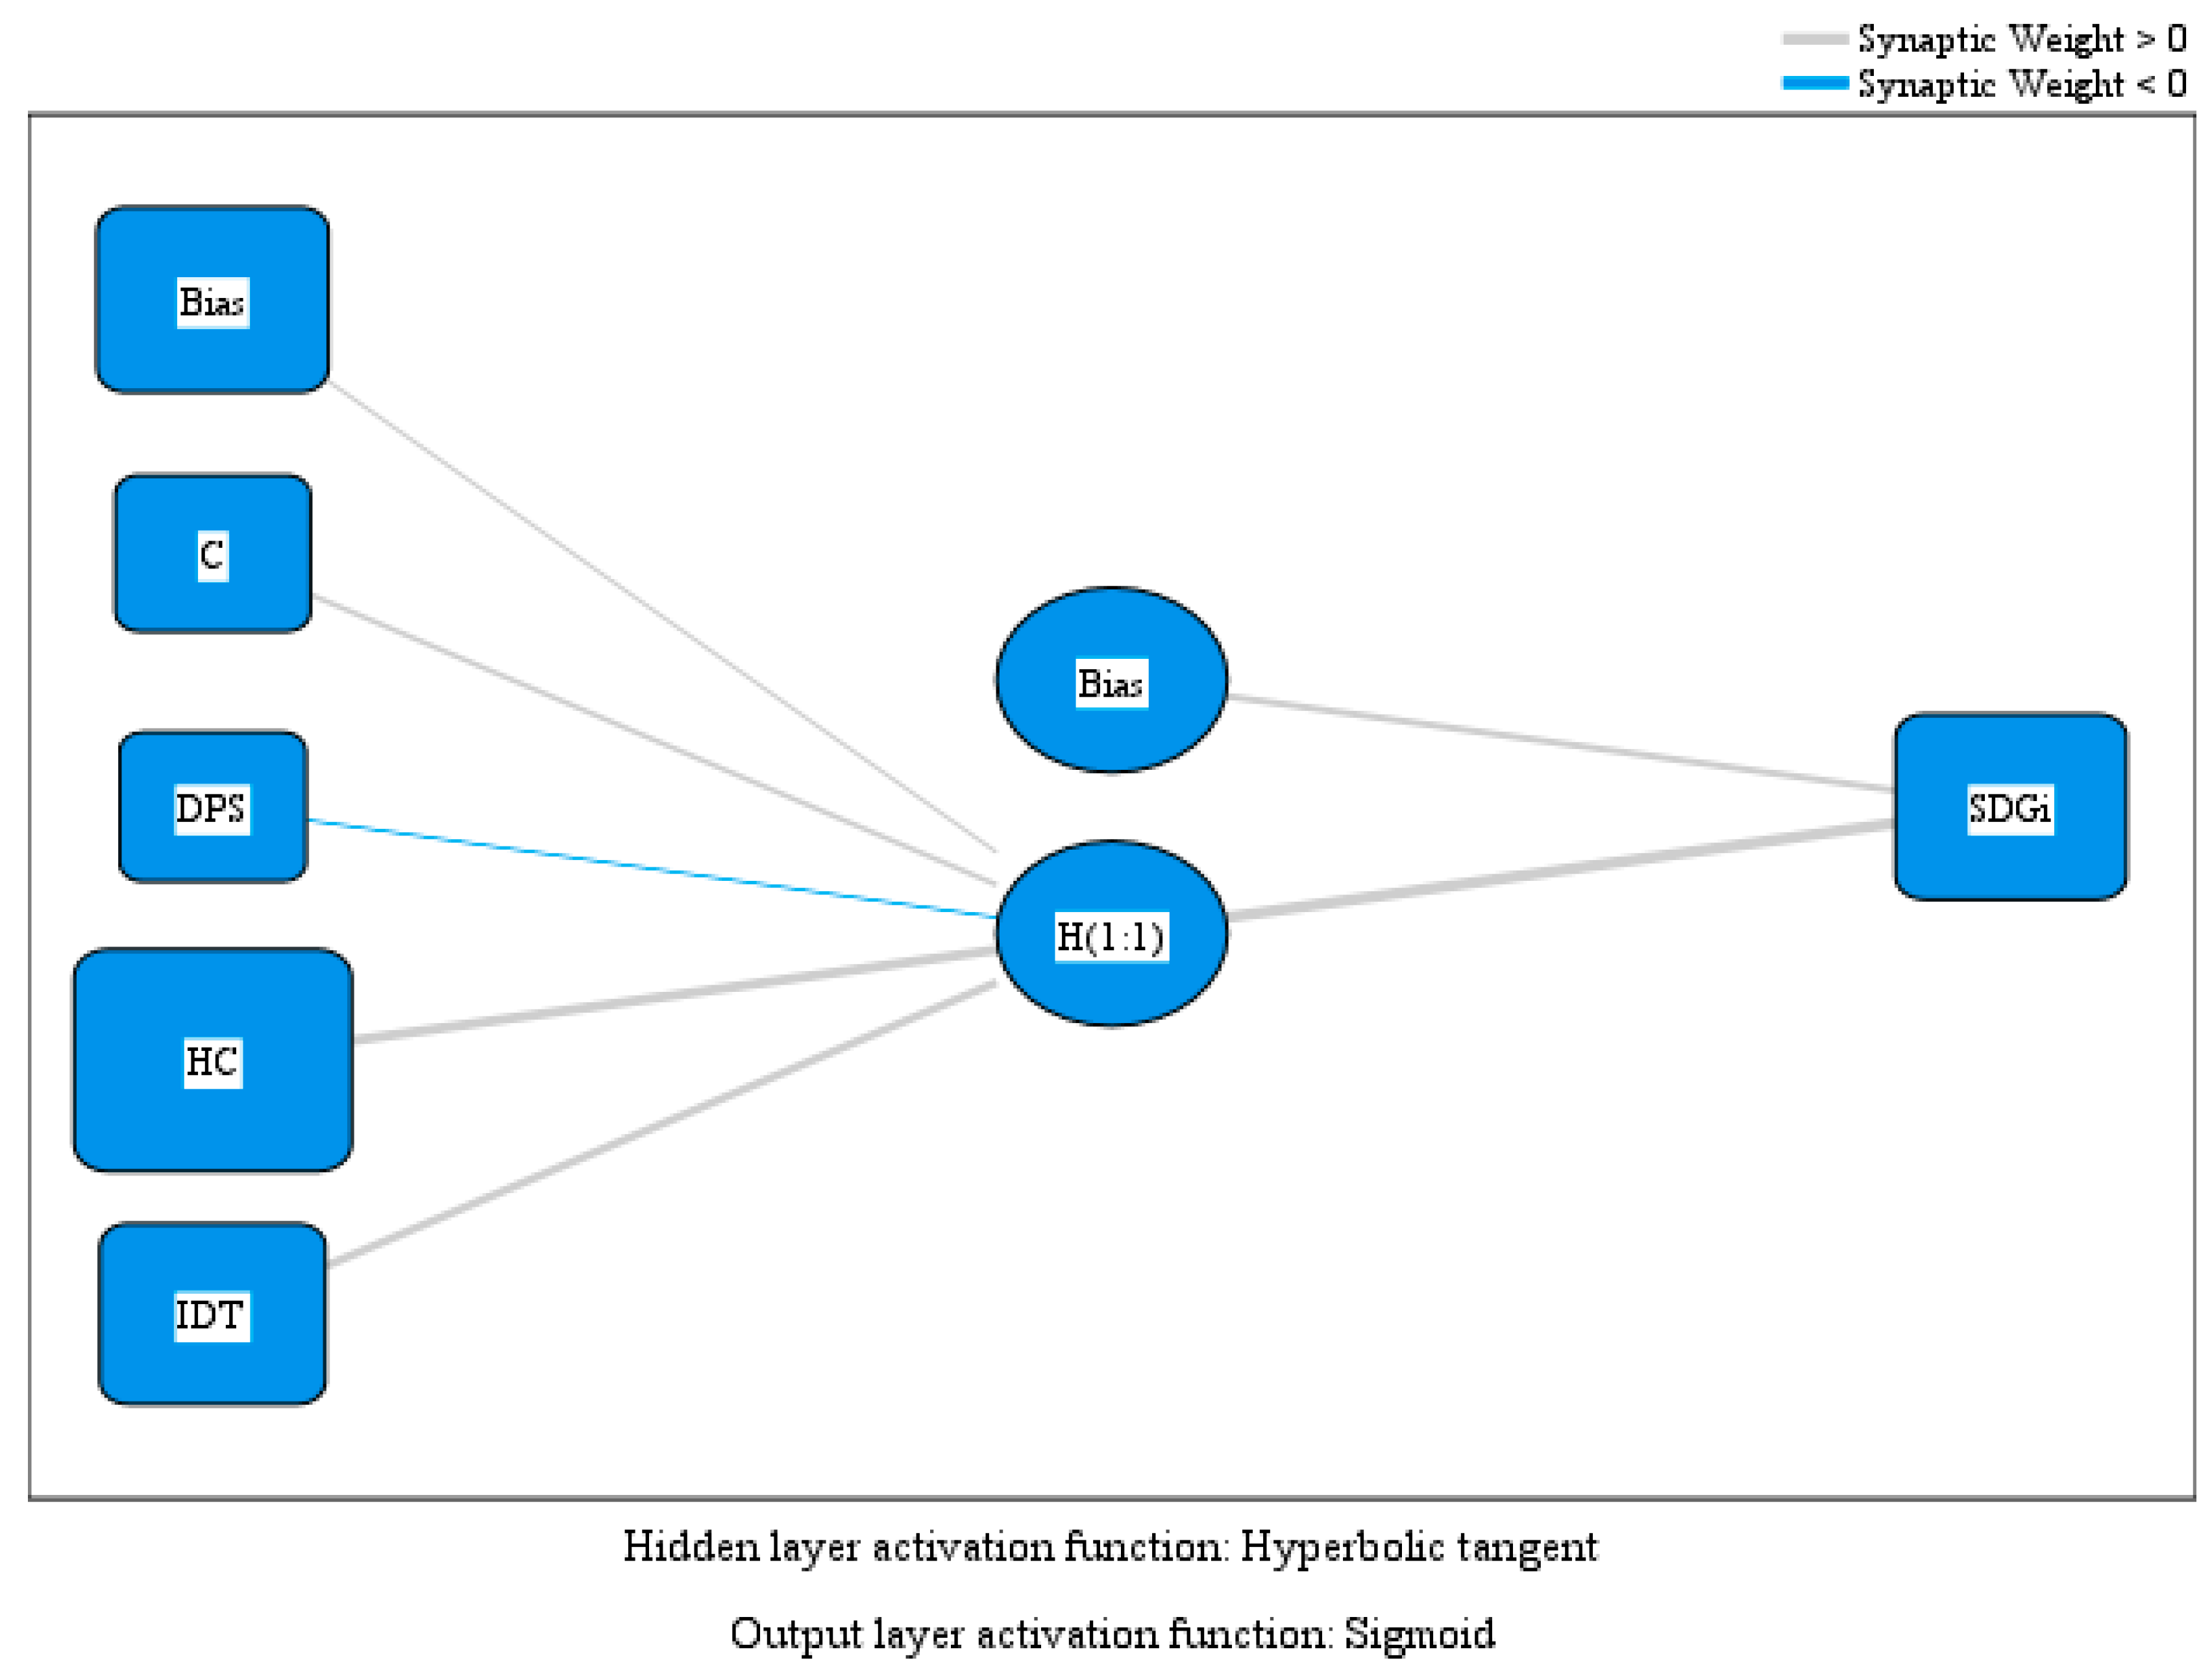
The artificial neural network analysis provides a more nuanced perspective on the intricate relationships between digitalization components and their impact on achieving the SDGs. It essentially confirms the results obtained through traditional statistical methods while uncovering additional dimensions of these relationships. Figure 3 illustrates the relationships within the ANN model, while Table 7 presents the estimated model parameters.
The network structure, with a single hidden layer, reveals a relatively simple yet highly effective architecture in capturing the nonlinearities within the data. The coefficients in the hidden layer highlight that Human Capital (HC) holds the most significant weight (0.898), followed by Digital Technology Integration (DTI) at 0.364, while DPS contributes negligibly (−0.014). This model once again highlights the central role of human factors in the equation of sustainable digitalization, suggesting that digital competencies serve as the primary lever through which technology can drive progress toward the SDGs.
An analysis of the importance of independent variables provides a clear hierarchy of factor contributions: HC dominates with a normalized significance of 100%, followed by DTI (43.7%), C (11.1%), and DPS (1.6%). This distribution reveals that, while all DESI components carry some relevance, their influence on sustainability varies significantly. The minimal contribution of DPS may indicate either an underdeveloped digital public services sector across most EU countries or a need to rethink how these services are designed to support sustainable development objectives more effectively.
The output layer parameters, featuring a bias of 0.274 and a weight of 1.166 for the hidden neuron, indicate that the network has learned to integrate information from the hidden layer in a way that maximizes correlation with the target variable. The positive intercept reflects the baseline level of the SDGi, which remains unexplained by the predictor variables included in the model.
Overall, this neural analysis complements and reinforces the conclusions drawn from factor and regression analyses. It further enhances the ability to model nonlinear relationships that traditional methods might struggle to detect, confirming the validity of hypothesis H1. It particularly emphasizes the critical role of investments in human capital as the primary driver of sustainable digital transformation, while suggesting that other digitalization components, although relevant, exert a more limited impact at the current stage of development among EU member states.

4.4. Predictive Modeling of Sustainability and Digitalization Trends

Testing hypothesis H2 required predictive models to estimate the evolution of SDGi based on past trends and anticipated changes in DESI. We apply exponential smoothing within the Brown model (independent variable: time; dependent variable: SDGi) to forecast the development of SDGi using historical data. The exponential smoothing analysis using the Brown model on the SDGi reveals a subtle yet consistent trend of improving sustainability performance across Europe. The model, characterized by a remarkably high alpha coefficient for level and trend (0.958, p = 0.002 < 0.005), indicates a strong dependence on recent values within the time series, reflecting a stable and predictable trajectory for the SDGi during the analyzed period.
Model fit statistics present an intriguing picture: while the conventional R2 is notably high (0.933), indicating a firm fit to historical data, the stationary R2 remains close to zero (0.007), suggesting that the SDGi time series is dominated by a trend component with relatively little stationary variability (Table 8). This result confirms the progressive, incremental nature of improvements in achieving SDGs across the European Union.
The forecasting errors (RMSE of 0.213, MAPE of 0.211%) demonstrate the model’s remarkable accuracy in fitting historical data. At the same time, the negative Normalized BIC value (−2.792) indicates a well-balanced trade-off between model complexity and fit quality. The absence of outliers and residual autocorrelation signals, as indicated by an insignificant Ljung-Box test, suggests that the model effectively captures the fundamental patterns within the time series.
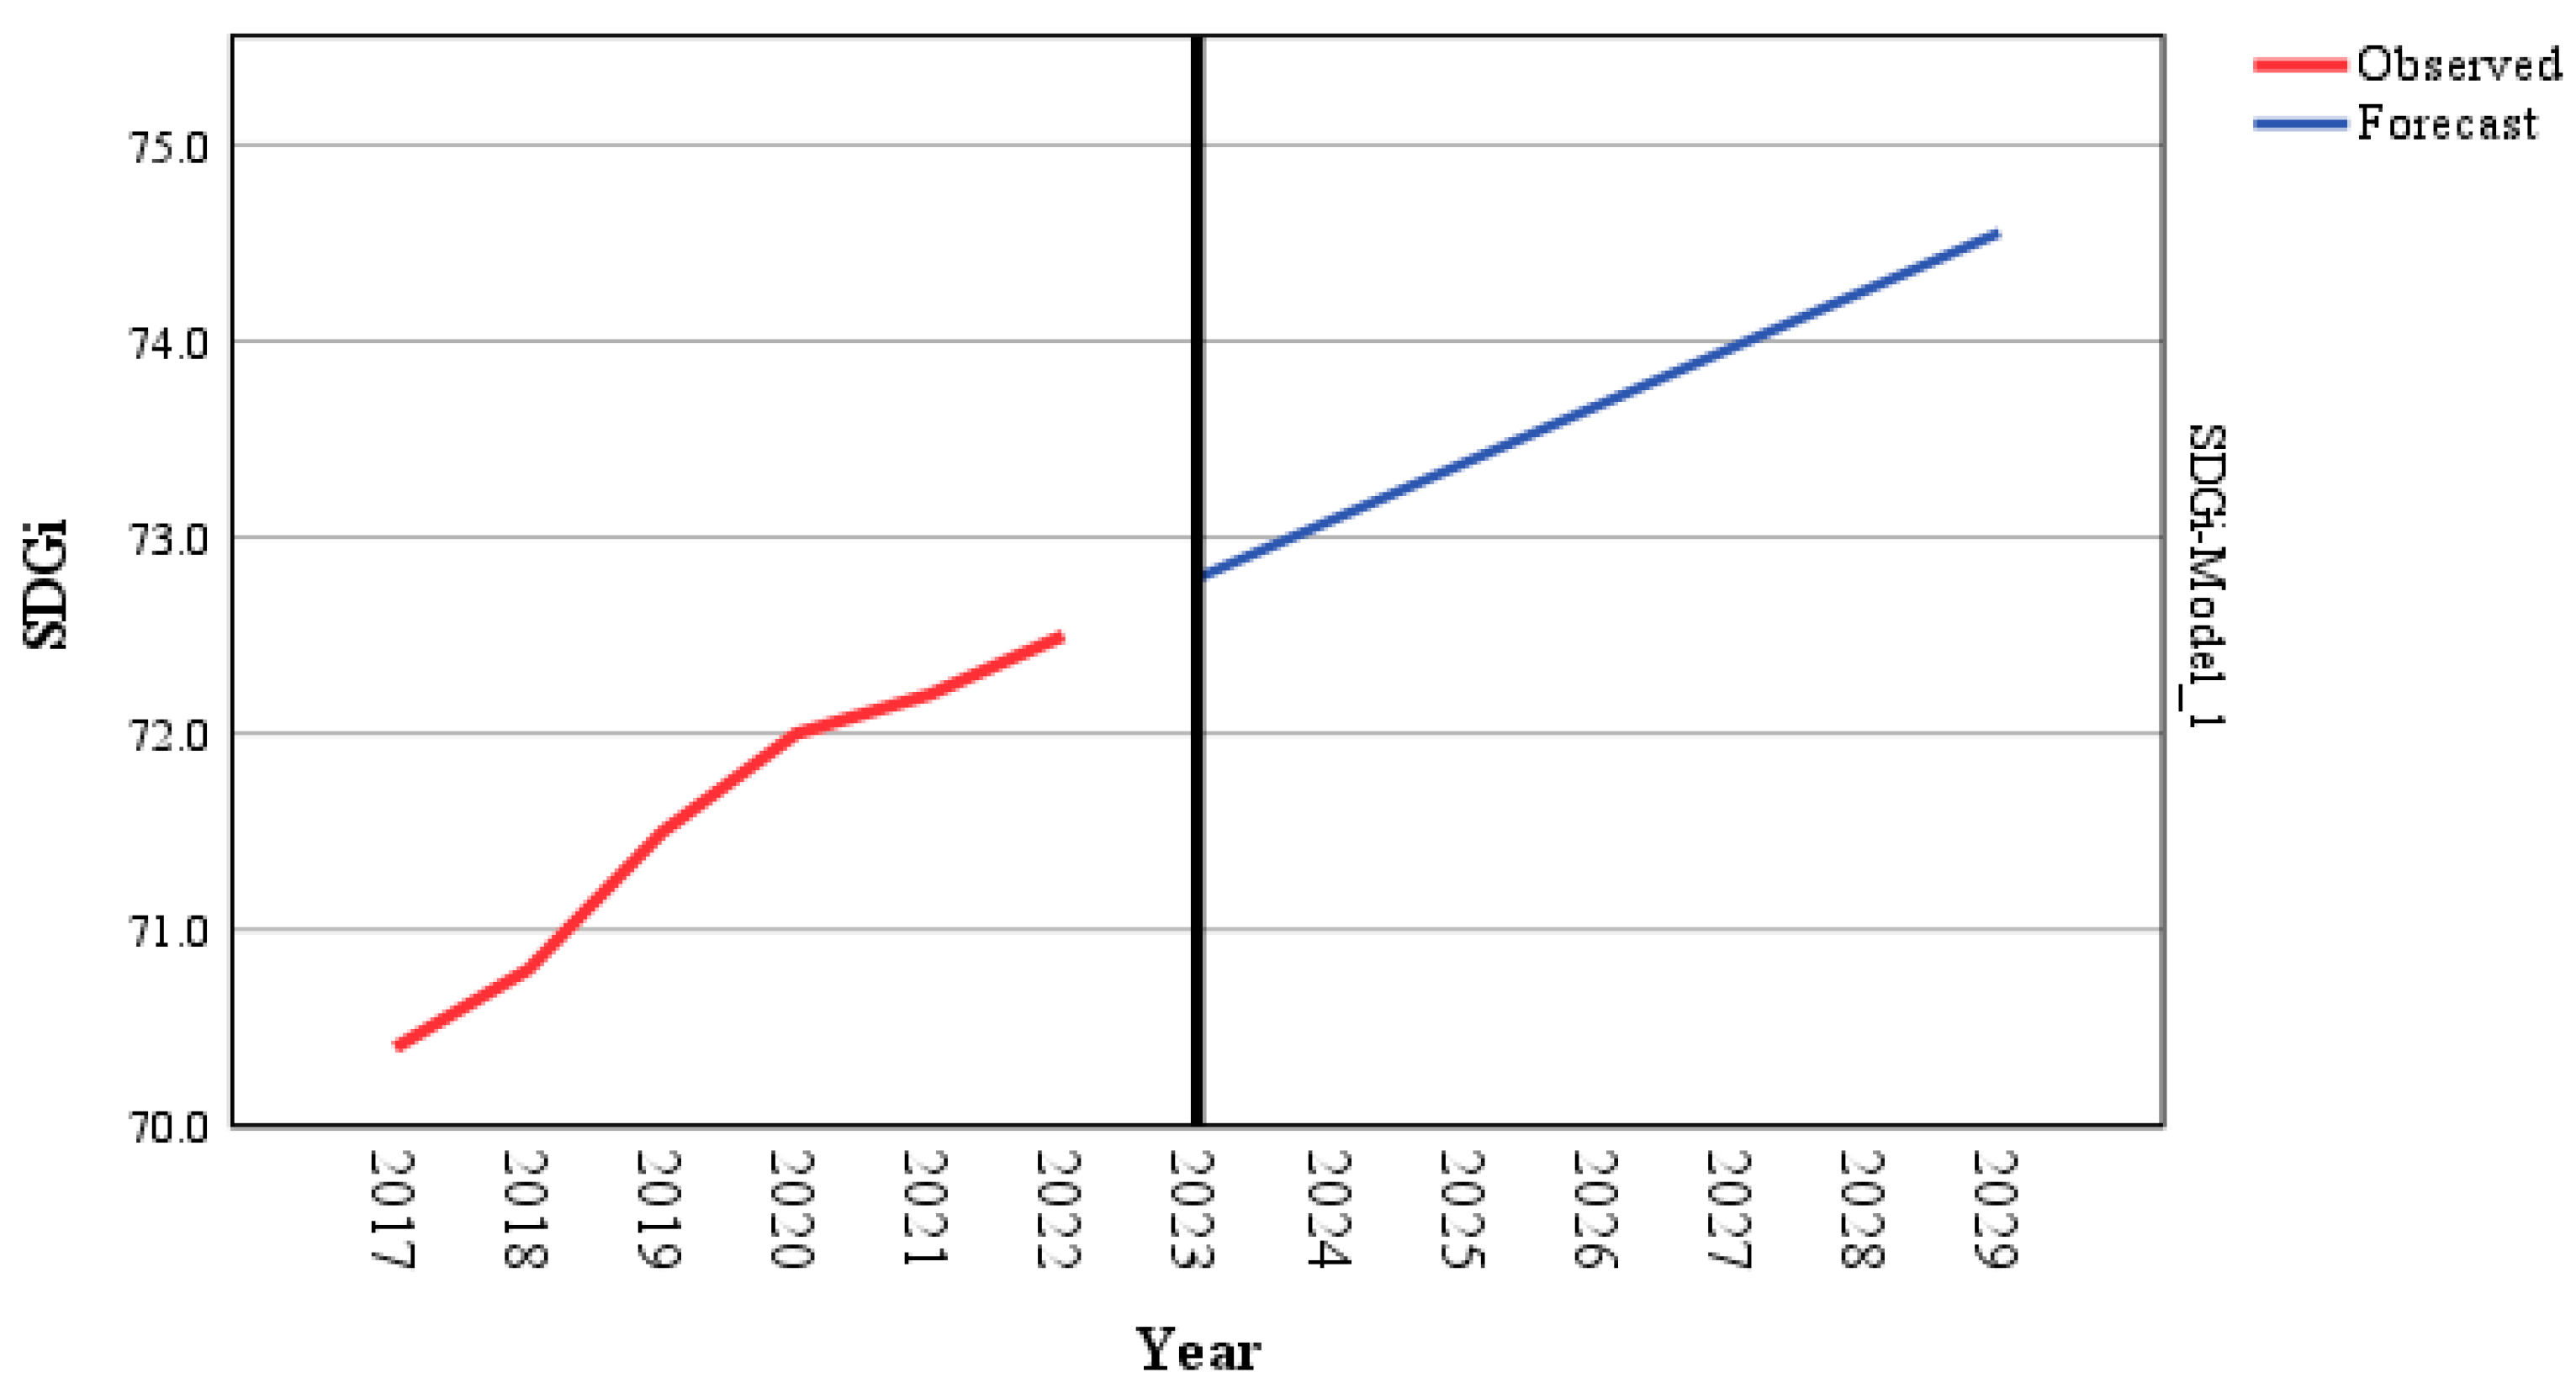
The model’s medium-term projections (2023–2029) depict a moderate linear increase in SDGi (Figure 4), with estimated values rising from 72.8 in 2023 to 74.6 in 2029 (Table A1 in the Appendix A).
This analysis provides valuable temporal insights into the trajectory of sustainability in the EU, complementing other analytical approaches. The steady yet modest upward trend reflects the coordinated efforts of member states to achieve the SDGs while highlighting the necessity of more ambitious interventions to accelerate progress. The model suggests that, in the absence of significant structural shifts in sustainability policies, the EU will continue to experience incremental improvements, which may not be sufficient to trigger substantial qualitative leaps in sustainability performance.
An advanced ARIMA-based approach was employed to forecast DESI trends in national economies, with DESI as the dependent variable and time as the independent variable. Table 9 presents the ARIMA model fit statistics.
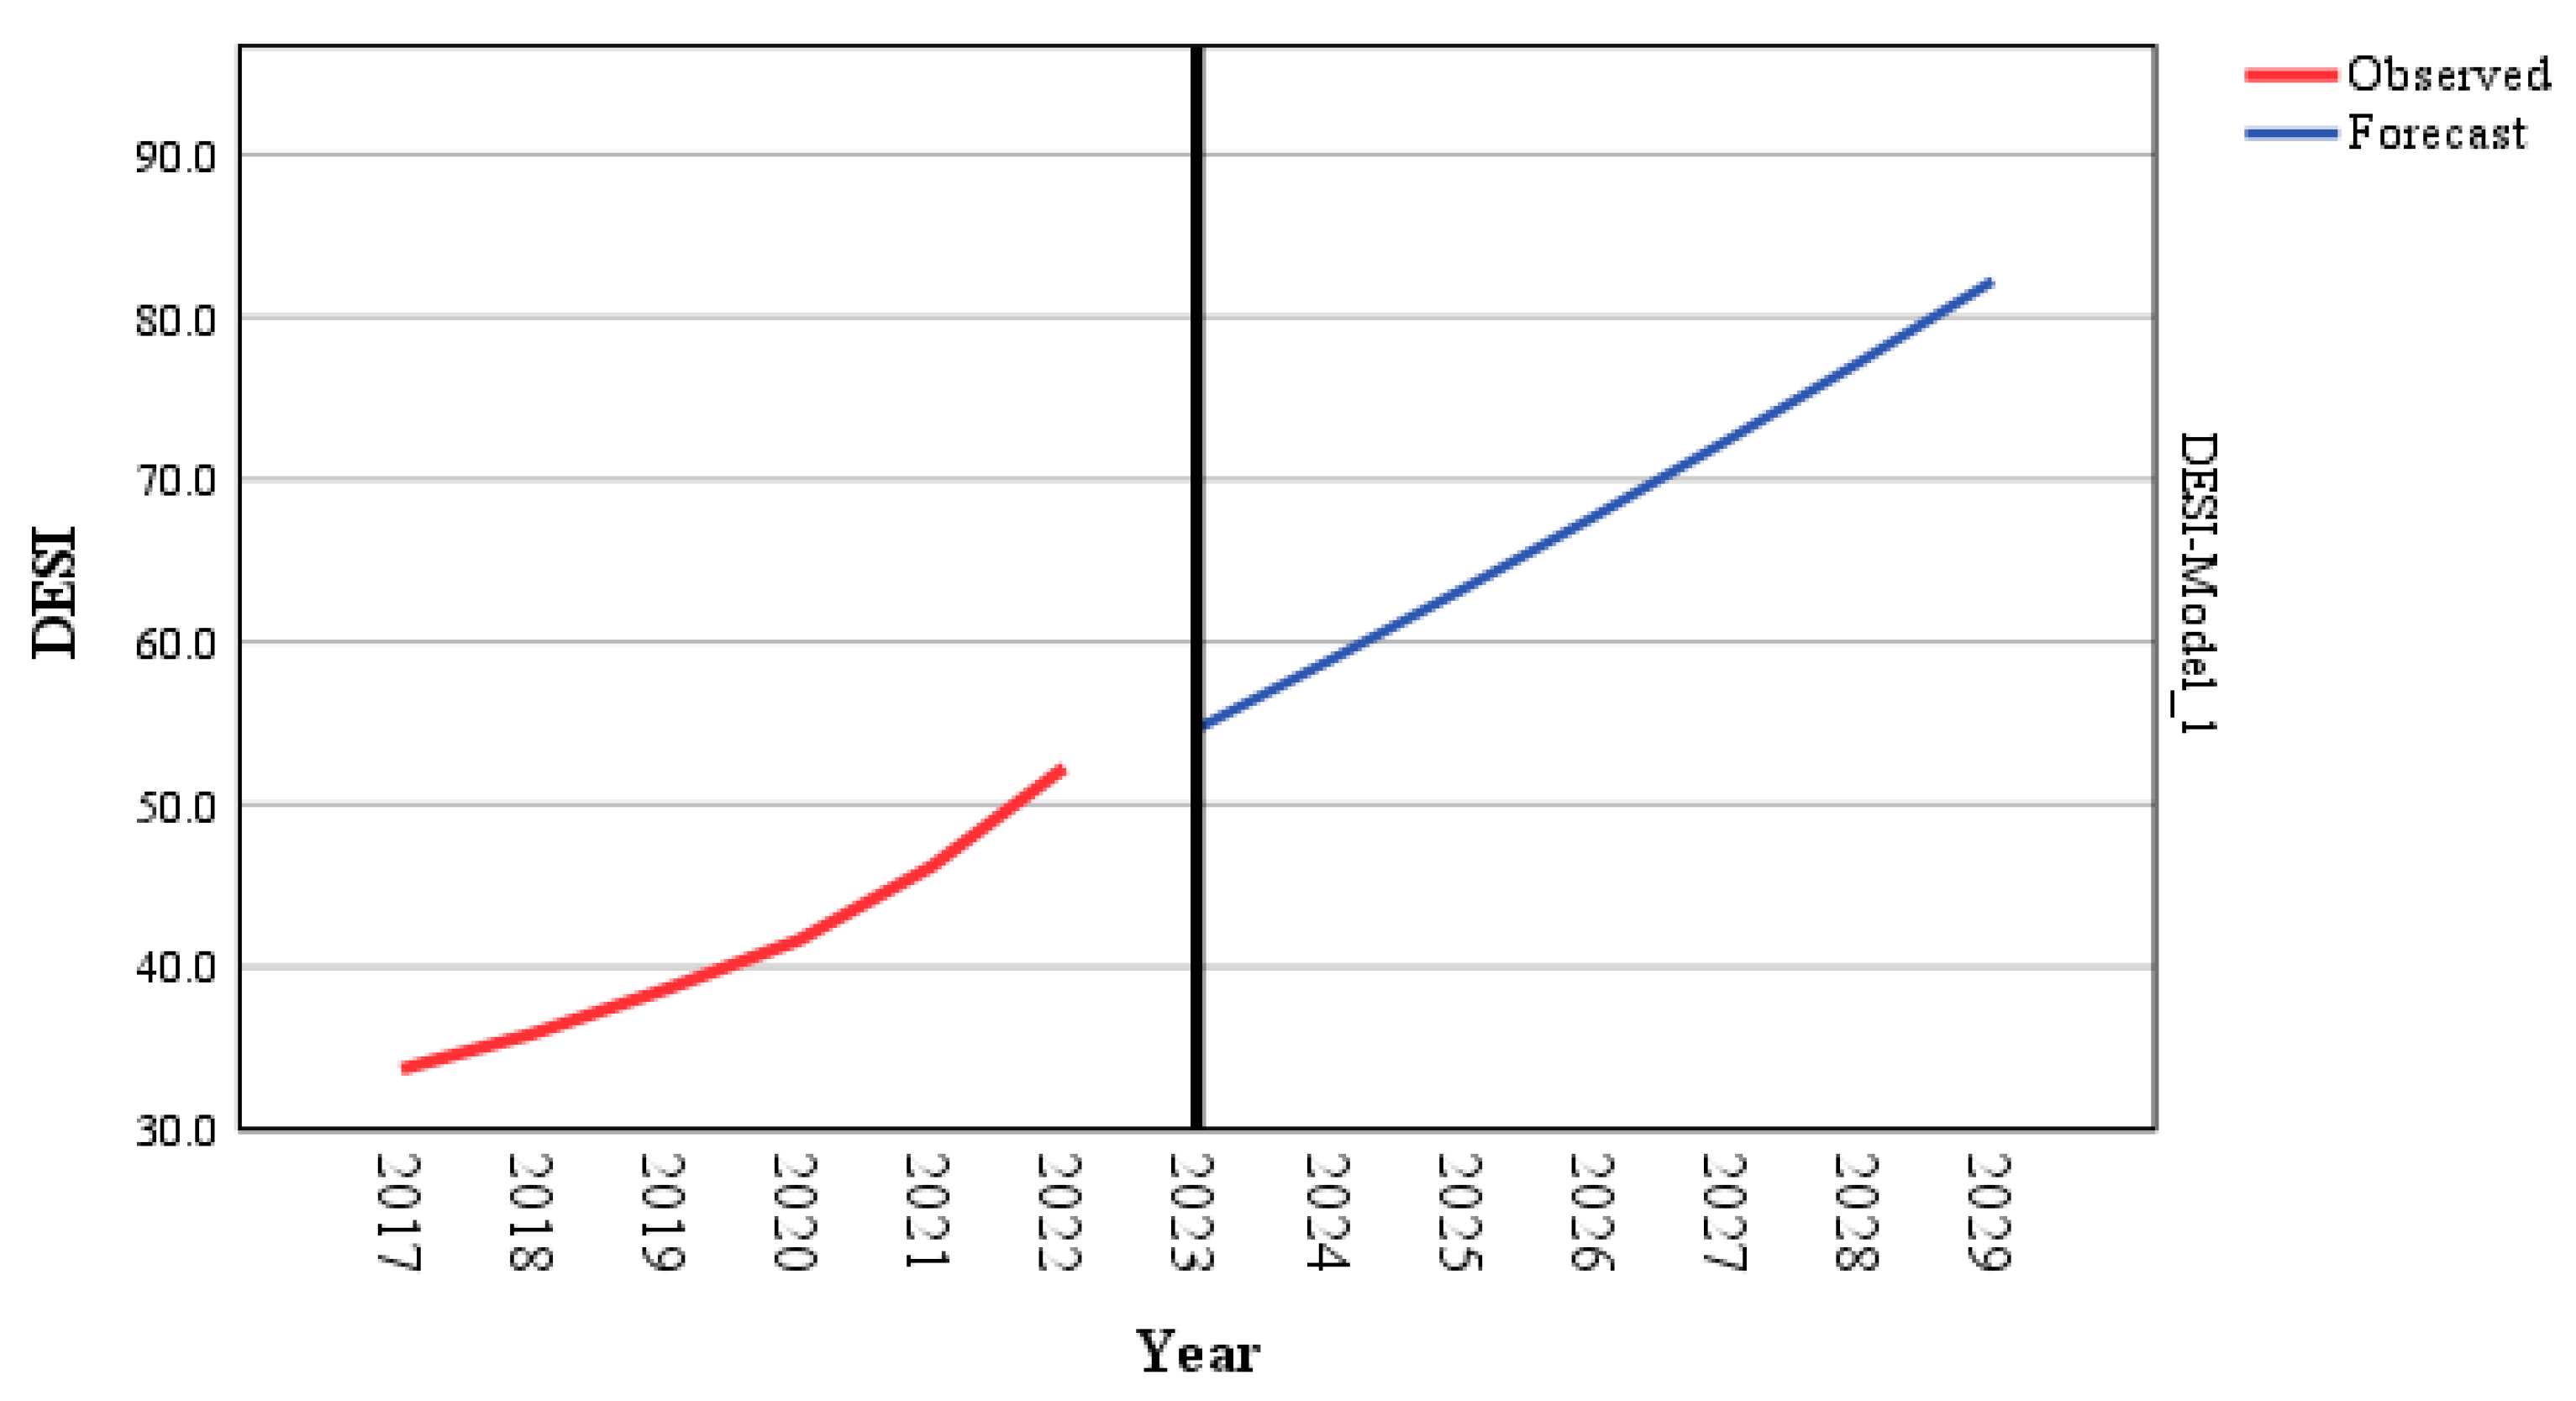
The ARIMA analysis of the DESI within the European context reveals a distinct evolutionary dynamic that contrasts with the more linear trends observed in the SDGi. The identified ARIMA (0,0,0) model, featuring an impressive stationary R2 of 0.974, suggests an exceptionally predictable time series where the square root transformation has optimized data stabilization. This remarkable stability likely reflects Europe-wide efforts to standardize and harmonize digitalization policies, driving this transformative process’s clear and consistent trajectory.
The model parameters, with a significantly negative constant (−557.173) and a strong linear trend (0.279 per year), describe an accelerating upward trajectory for digitalization in Europe. This exponential growth, evident in medium-term projections, illustrates the sustained momentum of digital transformation, which appears to be intensifying year after year. The adjustment statistics, including a low MAPE of 2.102% and a Normalized BIC of 1.062, confirm the model’s high accuracy in capturing historical data patterns.
Forecasts for the 2023–2029 period outline a future where the European digital economy is expected to achieve unprecedented growth (Figure 5), with DESI values projected to rise from 54.7 in 2023 to 82.2 in 2029 (Table A1 in the Appendix A).
If realized, this rapid ascent would signal a profound transformation of European societies while raising critical questions about whether this technological progress can automatically translate into equivalent sustainability improvements, as suggested by the more modest SDGi modeling outcomes.
The ARIMA model describes a rapidly expanding European digital economy, advancing at a pace that likely exceeds other development dimensions. This discrepancy invites more profound reflection on better synchronizing digital and sustainable transformations to ensure a harmonious convergence toward the Agenda 2030 objectives. The results suggest that while digitalization is advancing rapidly, its impact on sustainability remains partially decoupled, requiring more targeted policy interventions to convert technological potential into tangible sustainable development outcomes.
An advanced ARIMA-based approach was employed to investigate the relationship between SDGi and DESI, with SDGi as the dependent variable and DESI as the independent variable. Table 10 presents the ARIMA model fit statistics.
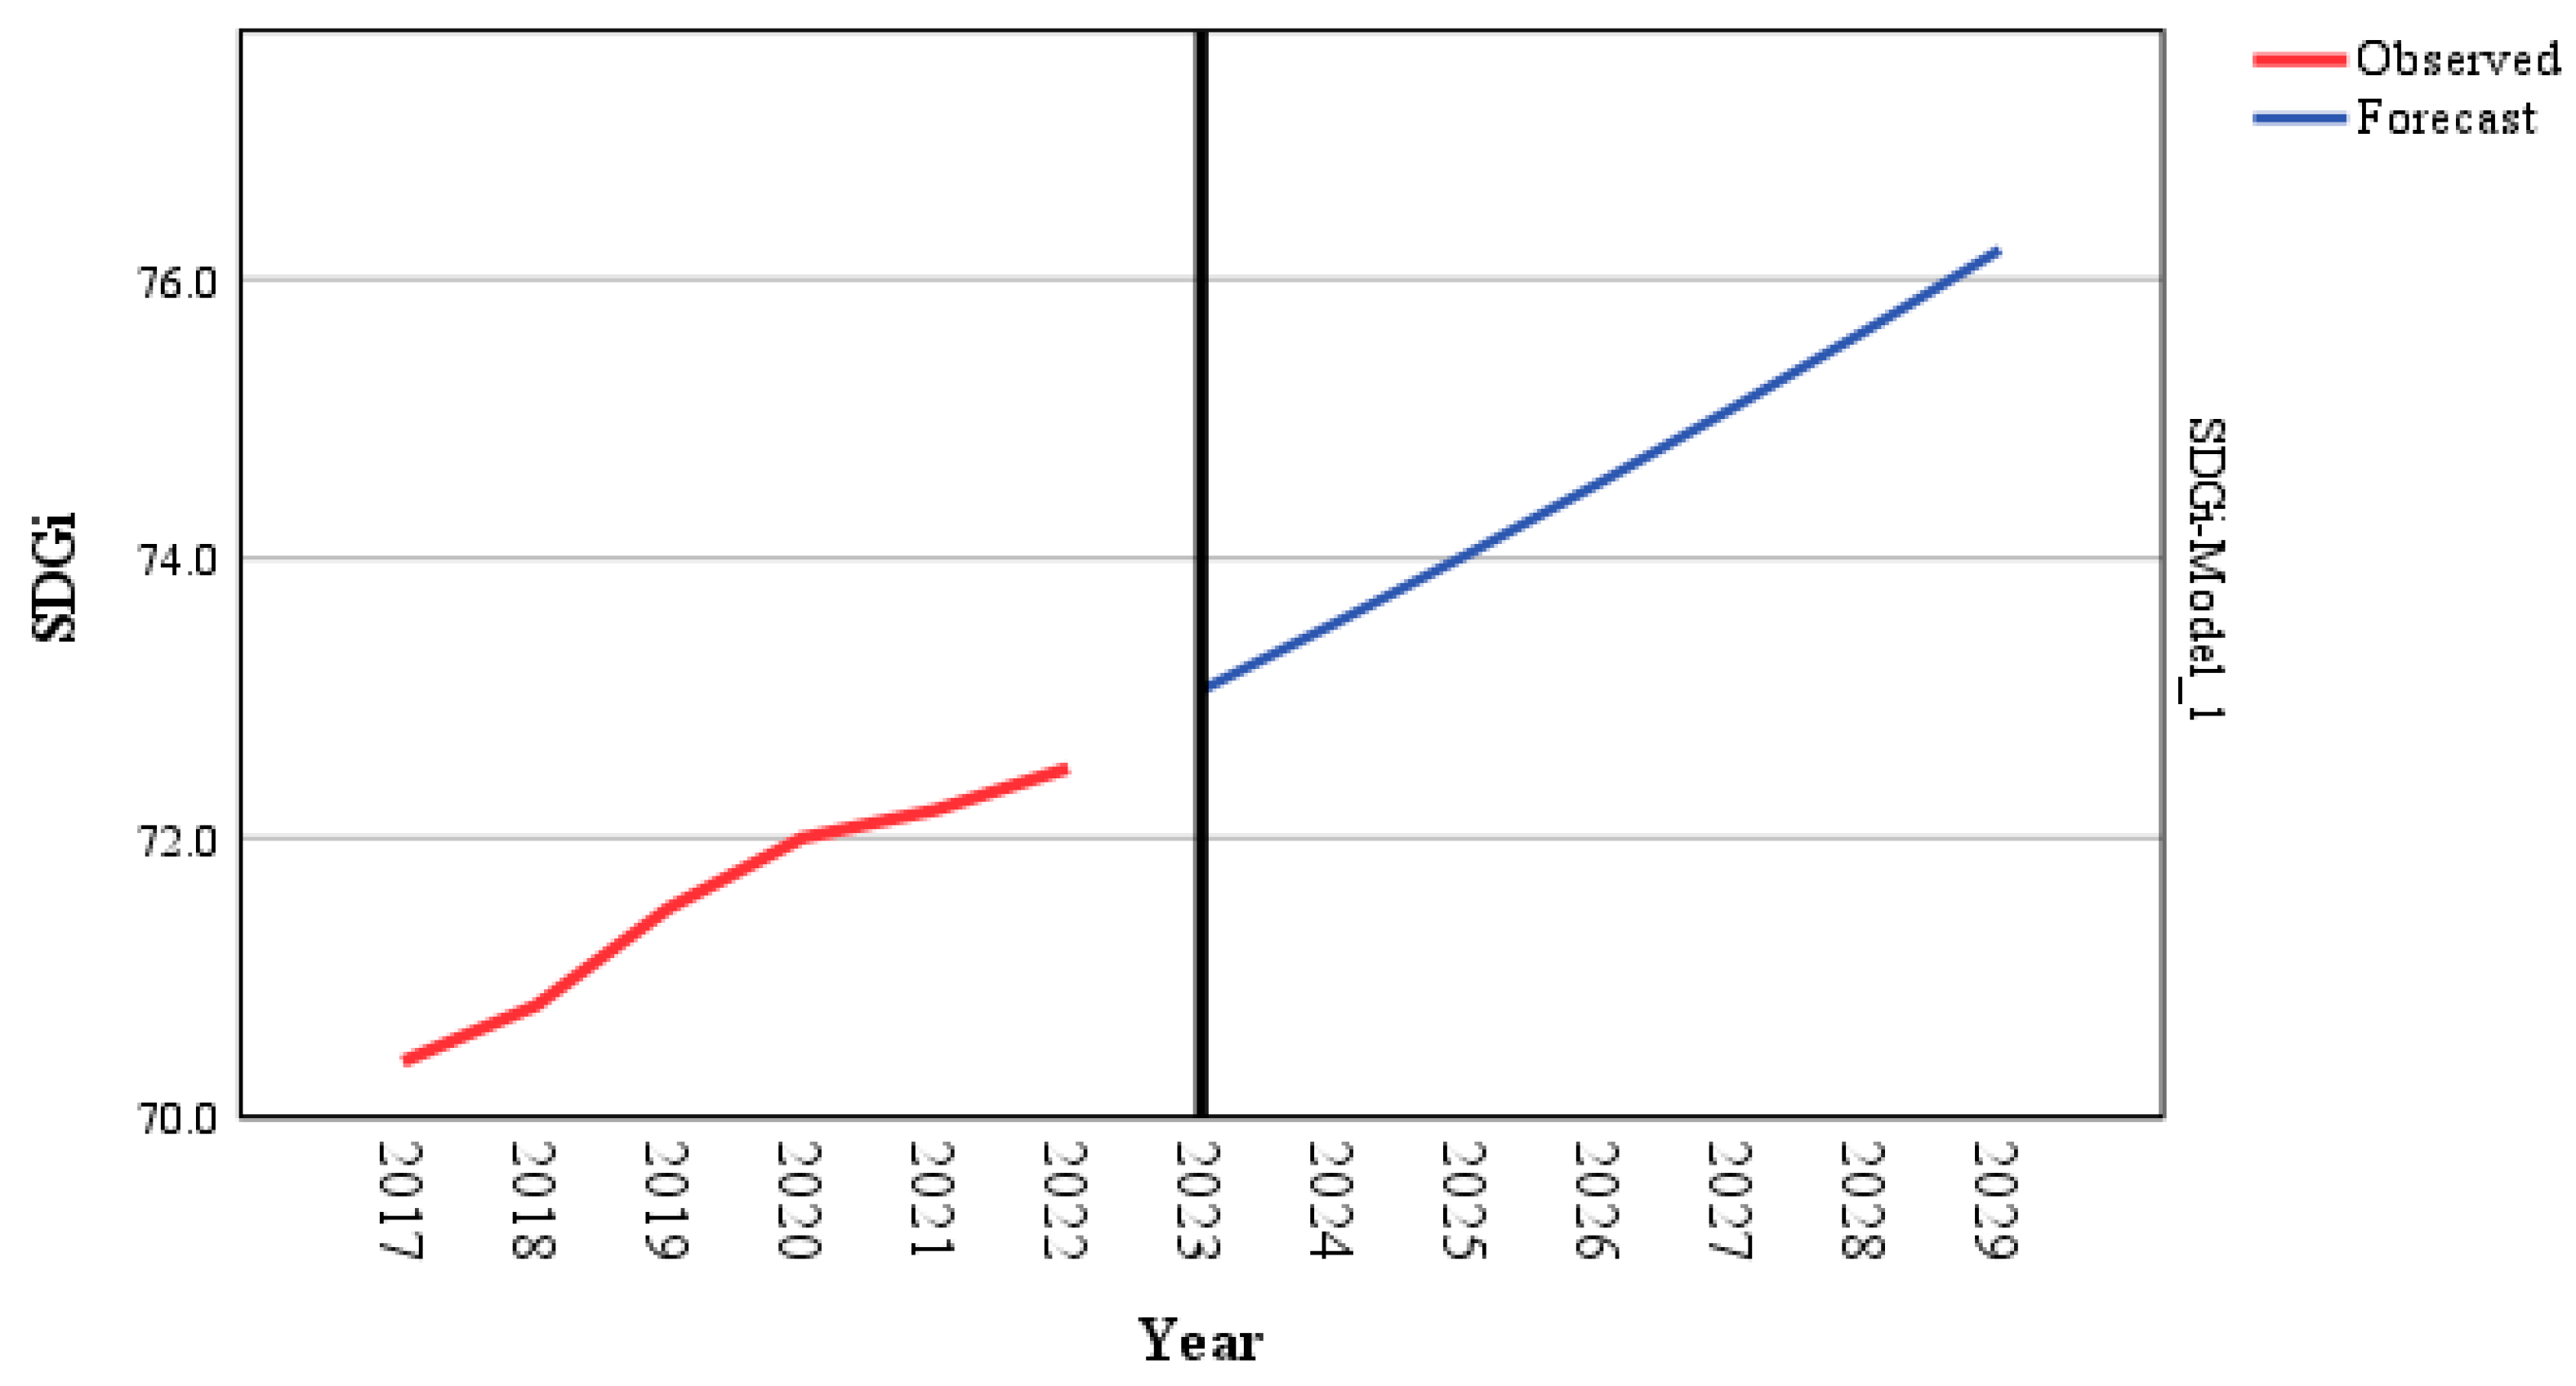
The ARIMA analysis of the relationship between the DESI and the SDGi offers valuable insights into how these dimensions evolve within the European context. The identified model, featuring a surprisingly simple ARIMA (0,0,0) specification, suggests that the relationship between these variables can be captured through a fundamental linear equation without significant autoregressive or moving average components. However, this structural simplicity conceals a more complex narrative about the nature of digital transformations and sustainable progress.
The key model parameter, a coefficient of 0.007 for DESI (significant at p = 0.006), reveals a positive but unexpectedly modest relationship between digital development and SDG performance. Combined with a relatively large constant (8.185), this result suggests that while digitalization contributes to sustainability improvements, its direct impact appears smaller than anticipated, with most SDGi variation explained by other unmodeled factors.
The adjustment statistics, including an R2 of 0.873 and an MAPE of just 0.348%, confirm the model’s high precision in describing the relationship between the two variables. The relatively narrow confidence intervals (UCL and LCL) surrounding the forecasts suggest strong reliability in medium-term estimates.
Forecasts for the 2023–2029 period depict a steady yet slow SDGi progress (Figure 6), with estimated values rising from 73.1 to 76.2 (Table A1 in the Appendix A).
This incremental growth of approximately 0.5 points per year reflects the relatively slow pace of sustainability improvements influenced by digital economy trends. The nearly parallel confidence intervals across the forecast horizon indicate remarkable stability in this relationship, with no significant signs of acceleration or deceleration.
These findings confirm that digitalization is an essential factor in the sustainability equation, validating hypothesis H2. This analysis highlights the need for policy approaches that extend beyond merely promoting technology, advocating for integrated strategies that fully harness digitalization’s transformative potential for sustainability.
Figure 7 illustrates the dendrogram resulting from the hierarchical cluster analysis applied to the dataset of 27 EU member states. This visual representation captures the structural proximity between countries in terms of their performance across the SDGi, DESI and the four dimensions of DESI. The underlying data used for this analysis are detailed in Table A2 in the Appendix A, where each country’s position is presented across key indicators, including human capital, connectivity, digital public services, and integration of digital technologies.
The dendrogram reveals four clearly distinguishable clusters, each reflecting different levels of digital maturity and sustainability engagement. The analysis reveals distinct groupings of EU countries, each reflecting unique patterns in their digital and sustainable development trajectories.
One cluster brings together nations hovering near the EU average in digital performance and sustainability metrics. These countries—neither frontrunners nor laggards—exhibit a measured, balanced approach. Their strength lies in relatively robust human capital and digital public services, though the adoption of advanced technologies remains uneven. For them, sustainability seems less a disruptive leap than a gradual climb, with digital tools serving as steady, if incremental, enablers.
A second cluster, concentrated in Eastern and Southeastern Europe, faces more systemic challenges. Here, digital infrastructure gaps and underinvestment in skills create a dual drag, limiting both technological progress and sustainable outcomes. The disparity is stark enough to signal a policy imperative: without targeted support in connectivity and education, these regions risk being left behind, not just digitally but in their ability to meet broader societal goals.
By contrast, a third cluster—the Nordic states and the Netherlands—exemplifies what happens when digital and sustainability agendas align seamlessly. Their success is not accidental; it is built on high-quality infrastructure, inclusive governance, and a workforce equipped to harness innovation for the public good. In these countries, digitalization is not an end in itself but a means to amplify environmental and social progress.
A fourth, more eclectic group shows flashes of excellence—strong digital public services, pockets of cutting-edge innovation—yet lacks consistency. Some members, like Estonia, punch above their weight in e-governance, while others grapple with uneven adoption. Their trajectories suggest potential, though realizing it will demand sharper policy focus.
This landscape illustrates just how deeply heterogeneous the EU remains in its digital and sustainable trajectories. Regional histories, institutional capacities, and economic structures continue to shape national pathways. This diversity signals the need for flexible and tailored policy frameworks, approaches that respond to where each country stands, what its immediate challenges are, and how it can most effectively harness digitalization in the service of sustainability. Rather than a uniform strategy, the EU needs an architecture of solidarity that recognizes differences while enabling progress.

5. Discussion

This study aimed to unravel the complex mechanisms through which digital economy components, measured by the DESI, influence progress toward the SDGs within the European Union. Two hypotheses were tested: DESI components significantly and positively impact the performance of EU member states in achieving the SDGs (H1), and the relationship between DESI and sustainability progress can be accurately modeled and predicted using advanced forecasting techniques (H2).
The findings strongly support H1, revealing a significant relationship between DESI components and the performance of EU member states in meeting the SDGs, as measured by the SDGi. Exploratory factor analysis identified a dominant common factor, explaining 61.8% of the data variation, which highlights the deep interconnection between digitalization and sustainability. Among DESI components, Human Capital (HC) and Integration of Digital Technologies (IDT) exhibited the strongest correlations with SDGi (0.667 and 0.615, respectively), confirming earlier findings by [65], which identified a similar relationship at the local level. However, this study extends those insights to the EU level, offering a broader perspective on the structural mechanisms linking digitalization to sustainability.
Regression analysis further demonstrated that HC is the strongest predictor of SDGi (β = 0.534, p < 0.001), followed by IDT (β = 0.242, p = 0.030). These results align with the work of Imran et al. [2], who highlighted the heterogeneous impact of DESI components on the SDGs. By contrast, Connectivity (C) and Digital Public Services (DPS) did not significantly influence the results, suggesting that merely having digital infrastructure or online public services is insufficient to drive measurable sustainability progress. This nuance reinforces the observations of Chen et al. [4] and Lin et al. [90], who emphasized the risk of regional disparities and the need for complementary policies to bridge the digital divide.
The research findings also support H2. The ARIMA model applied to the DESI-SDGi relationship identified a positive but modest trend (coefficient of 0.007, p = 0.006), indicating that digitalization contributes to sustainability improvements, albeit with a limited direct impact. This result aligns with the conclusions of Moreno et al. [91] and Chauhan et al. [92], who emphasized the need for a balanced approach to maximize the benefits of digitalization within the context of the SDGs.
Medium-term forecasts (2023–2029) using the Brown model for SDGi and the ARIMA model for DESI indicate a steady yet slow increase in SDGi (from 72.8 in 2023 to 74.6 in 2029), while DESI is expected to grow at a much faster pace (from 54.7 in 2023 to 82.2 in 2029). This gap suggests that digital progress does not automatically translate into equivalent sustainability improvements, reinforcing the need for integrated policies, as highlighted by Mondejar et al. [93].
The empirical results obtained in this study align with and extend prior findings on the relationship between digitalization and sustainable development. Yet, they also uncover nuances that merit further theoretical consideration. The benchmark results, particularly the dominant role of human capital in predicting SDG performance, resonate with the conclusions drawn by Imran et al. [2], who emphasize digital competencies as central to translating technological infrastructure into measurable progress. However, our study goes further by quantifying the marginal impact of each DESI component using both linear regression and neural networks, thereby offering a more granular perspective on impact mechanisms. The limited influence of connectivity and digital public services contrasts with earlier assumptions in Banhidi et al. [5], suggesting that infrastructure alone may not drive sustainable outcomes without concurrent human capital development. These findings collectively suggest that the closed relationship between digital and sustainable transformations is more conditional and path-dependent than previously conceptualized, highlighting the need for adaptive and context-sensitive policy approaches.
Although digitalization has surely sped up several sectors of sustainable development, new data highlight the rising environmental costs linked with this change. The 2024 Trade and Development Report issued by UNCTAD [94] highlights that rising digital intensity, particularly in advanced economies, is contributing to a surge in energy demand, often outpacing improvements in efficiency and renewable integration. Similarly, the Global E-Waste Monitor 2024 reveals a dramatic increase in electronic waste generation across the EU, much of which remains improperly managed or uncollected [95]. These findings reinforce the paradox identified by Jovanovic et al. [67], wherein digital technologies enhance social and economic dimensions of sustainability while undermining environmental indicators. This duality points to the urgent need for a recalibration of digital strategies to include circular economy principles, life-cycle assessments, and stricter regulatory frameworks aimed at mitigating ecological externalities. A genuinely sustainable digital transition must therefore internalize environmental costs and promote innovation not only in technological capability but also in governance and resource stewardship.
While the aggregated results offer valuable insights into the general relationship between digitalization and sustainability across the EU, cluster analysis reveals that this relationship is not uniform. Significant heterogeneity exists among member states in terms of both the structure of their digital economies and the maturity of their sustainability initiatives. For instance, countries in Northern and Western Europe tend to exhibit higher performance across all DESI dimensions, particularly in human capital and digital public services, which in turn translates into more consistent SDGi outcomes. In contrast, several Southern and Eastern European states, despite recent improvements, continue to face structural constraints that limit the transformative potential of digitalization. This divergence suggests that the interplay between digital progress and sustainable development is deeply embedded in national contexts, shaped by historical, institutional, and policy-specific factors. Recognizing this heterogeneity is essential for formulating differentiated, place-sensitive strategies that can bridge existing gaps and ensure a more balanced progression toward the SDGs across the EU.
In conclusion, the study’s findings support the argument that digitalization, primarily through human capital and technological innovation, can be a crucial catalyst for achieving the SDGs in the EU countries [62,96,97,98,99,100,101]. However, they also emphasize the importance of strategic alignment between digital transformation objectives and sustainability goals, as argued by Lian et al. [63]. The research suggests that investments in digital education and the adoption of technology in the private sector are more effective than simply expanding infrastructure. These conclusions provide a foundation for public policies that promote an integrative approach to sustainable digitalization, aligning with the recommendations of the United Nations [71].

5.1. Theoretical Implications

Digital technologies have a significant influence on the economy and sustainability, generating both benefits and challenges that require careful management. The digital competence of employees and citizens plays a pivotal role in how digital technologies are integrated and leveraged in the economy. A workforce with strong digital skills drives innovation and productivity, enabling companies to adapt swiftly to technology-driven business models. Moreover, widespread internet access and robust digital infrastructure significantly shape how households and businesses adopt digital solutions, directly impacting economic efficiency and quality of life. For digitalization to make a meaningful contribution to sustainable development, public policies must prioritize digital education and ensure the availability of accessible, high-performance infrastructure.
The study’s findings reveal a strong correlation between digital transformation goals and the SDGs, demonstrating how this strategic alignment amplifies long-term sustainability outcomes for organizations. Far from a mere coincidence of interests, this synergy reflects a paradigm shift in the role of business in society, where technological performance and social responsibility are increasingly inseparable.

5.2. Practical Implications

This study encourages a re-examination of digitalization and sustainability not as parallel or inherently convergent processes, but as interwoven trajectories whose alignment depends on how digital advancements are shaped, directed, and integrated into broader societal goals. While technological innovation holds considerable promise for accelerating sustainable development, it also carries risks of exacerbating inequalities, intensifying environmental pressures, or creating new forms of exclusion if not strategically governed.
The findings affirm that predictive techniques such as ARIMA and exponential smoothing can effectively model the evolving relationship between digital progress and SDG performance across EU member states, but also suggest that these forecasts are contingent upon the quality of institutional frameworks and social readiness. Above all, the evidence points to human capital—embodied in education, digital competencies, and a culture of innovation—as the true catalyst for transformation. Infrastructure alone cannot generate sustainable outcomes unless individuals and communities are empowered to translate digital tools into solutions for real-world challenges, from climate action to equitable access to essential services.
At the same time, the study highlights a less-discussed reality: digital progress does not automatically translate into sustainable progress. Without vigilance, we risk creating an increasingly digitalized economy that continues to overconsume resources or leaves certain social groups behind. This calls for innovative public policies beyond promoting technology—policies that actively steer innovation toward clear sustainability objectives. For example, vocational training programs could integrate modules on circular economies or energy efficiency, while business incentives might prioritize digital solutions directly aligned with the SDGs.
The gap between rapid digitalization and sluggish sustainability gains also signals a need for collaboration. Governments, the private sector, and civil society must collaborate to ensure that digital tools are deployed where they can have the most significant impact. Thus, this study serves as both an analysis and a wake-up call: digitalization can be a powerful ally of sustainability, but only if pursued with clear intent, empathy, and a deep commitment to the future.

6. Conclusions

This study set out to examine the relationship between digitalization and sustainable development within the European Union, guided by two central hypotheses: that the components of the Digital Economy and Society Index (DESI) significantly influence SDG performance across member states, and that this relationship can be accurately modeled and forecasted using advanced predictive techniques. The findings presented throughout the analysis provide empirical support for both hypotheses. The first is validated through factor and regression analyses, which highlight human capital and the integration of digital technology as key determinants of sustainability outcomes. The second is confirmed by the predictive modeling results, which illustrate both the projected acceleration of digitalization and the more modest pace of sustainability gains, revealing a measurable—yet uneven—interdependence between the two trajectories.
These results offer a nuanced understanding of the opportunities and limitations associated with digital transformation as a vehicle for achieving the Sustainable Development Goals. On one hand, the research affirms that investments in digital skills and education are indispensable; without the strategic integration of human capital, technological infrastructure alone cannot generate inclusive or lasting progress. On the other hand, the analysis reveals a persistent disconnect: the rapid pace of digital advancement does not automatically translate into transformative sustainability outcomes. This observed lag between rapid technological advancement and more modest sustainability gains can be attributed to a complex interplay of systemic, institutional, and geopolitical factors. While digital tools have proliferated at an unprecedented pace, their potential to drive structural change remains unevenly realized due to fragmented policy implementation, disparities in institutional capacity, and insufficient integration into broader social and environmental strategies.
Moreover, external shocks such as the war in Ukraine have diverted public resources and policy attention toward immediate security and economic concerns, often at the expense of long-term sustainability objectives. Similarly, shifting global dynamics, including the recalibration of U.S. trade and climate policies, have introduced uncertainty into international cooperation mechanisms essential for coordinated progress toward the SDGs. These broader disruptions highlight the vulnerability of sustainability agendas to geopolitical instability and reinforce the need for resilient, context-sensitive digital strategies that remain anchored in social equity and environmental responsibility, even amid global volatility.
Achieving a truly sustainable digital future demands an integrated and context-sensitive approach—one that harmonizes technological progress with educational reform, responsive governance, and cultural awareness. The effectiveness of digitalization must ultimately be measured not by the proliferation of tools or infrastructure, but by their capacity to improve the lived realities of individuals and communities. In this sense, digital transformation should not be an end in itself, but rather a means to advance a more inclusive, just, and ecologically viable society. The real challenge lies not in perfecting the technology, but in refining the human systems through which it operates.

Limitations and Further Research

While this study offers valuable insights into the relationship between digitalization and sustainability, we must acknowledge the inherent limitations of predictive analysis. Our models, though robust, rely on historical data and assumptions that cannot fully anticipate the fluid dynamics of an ever-changing future. Geopolitical shifts, economic crises, or unforeseen technological breakthroughs could rapidly reshape the landscape we have analyzed. Such uncertainty does not invalidate the findings but reminds us that forecasts are navigational guides rather than fixed destinations.
Another limitation arises from the restricted availability of consistent data, as both DESI and SDGi indicators have only been systematically published for all EU member states during the 2017–2022 period. Consequently, the forecasting models necessarily begin in 2023, which may constrain the temporal scope and long-term interpretability of the projections.
One more limitation lies in the focus on aggregate national indicators, which, while relevant, may obscure significant regional or sectoral disparities. Digitalization and sustainability are disparate; urban smart cities may prosper while rural regions fall behind. A detailed investigation to elucidate these complexities will benefit future models.
These limitations do not diminish the study’s contributions but open pathways for a richer understanding. They frame sustainable digitalization not as a fixed formula, but as a dynamic process that requires constant adaptation. As recent years have shown, the future remains partly opaque—yet even imperfect models can shed enough light to navigate it with greater wisdom.
While this study focuses on DESI as the primary metric for assessing digital progress, future research could benefit from integrating additional indicators that capture other dimensions of digital transformation. The Digital Adoption Index, developed by the World Bank, and the Digital Transformation Index, used in industry-specific contexts, offer complementary insights that could enrich comparative analyses. As Elmassah and Hassanein [42] suggest, these indices may provide a more nuanced understanding of how different economies internalize and operationalize digital tools in support of sustainable development objectives. Expanding the scope of digitalization metrics would not only enhance the robustness of empirical findings but also support the development of more tailored, context-sensitive policy recommendations.
Future research should consider expanding the current model to include indicators linked to the negative externalities of digitalization, such as energy consumption, rebound effects, and e-waste generation, to provide a more comprehensive evaluation of the sustainability impact of the digital transformation.
Further research could also explore how emerging technologies—from blockchain to generative AI—might redefine the equation between digitalization and the SDGs. While this study focused on DESI components, future work may examine how new technological paradigms alter this relationship.
Another valuable direction for further investigation involves examining the underlying causal mechanisms that contribute to the decoupling of digital progress from sustainability outcomes. The aim is to identify the contextual factors and policy conditions that enable digital acceleration to more effectively support the long-term achievement of the Sustainable Development Goals.

Funding

This research received no external funding.

Data Availability Statement

Conflicts of Interest

The author declares no conflicts of interest.

Abbreviations

The following abbreviations are used in this manuscript:
SDGsSustainable Development Goals
SDGiSustainable Development Goals index
DESIDigital Economy and Society Index
CConnectivity
DPSDigital Public Services
HCHuman Capital
IDTIntegration of Digital Technology
ANNArtificial Neural Networks

Appendix A

Table A1. Historical and future trends.
YearSDGiDESIForecast of SDGi Using the Brown Model Depending on TimeForecast of the DESI ARIMA Model Depending on TimeForecast of SDGi Using the ARIMA Model Depending on DESI
201770.433.7---
201870.835.9---
201971.538.6---
202072.041.7---
202172.246.2---
202272.552.3---
2023--72.854.773.1
2024--73.158.973.5
2025--73.463.274
2026--73.767.774.5
2027--7472.475.1
2028--74.377.275.6
2029--74.682.276.2
Source: author’s design using SPSS v.27.0.
Table A2. Cluster distribution.
CountrySDGiCDPSHCIDTDESI
Czechia73.452.764.545.633.849.1
Portugal70.751.667.945.937.650.8
Austria77.156.572.151.039.254.7
Slovenia73.659.969.544.339.853.4
France73.664.267.449.931.953.3
Germany75.167.363.445.035.852.9
Cyprus62.058.857.541.835.348.4
Italy71.661.258.536.640.749.3
Belgium72.039.864.848.748.050.3
Croatia72.148.153.651.836.747.5
Cluster A means72.1456.0063.9146.0437.9050.96
Poland72.746.555.837.022.940.5
Slovakia70.149.852.044.127.843.4
Hungary68.657.657.438.421.643.8
Bulgaria61.650.751.932.615.537.7
Greece66.749.639.440.126.638.9
Romania63.255.221.030.915.230.6
Cluster B means67.1451.5846.2537.2121.6039.16
Finland81.360.587.471.459.169.6
Sweden79.660.382.462.056.265.2
Denmark79.577.183.159.258.069.3
Netherlands71.670.184.263.152.167.4
Cluster C means78.067.084.363.956.367.9
Ireland71.261.583.562.643.362.7
Luxembourg68.259.383.457.835.058.9
Malta68.853.085.856.648.160.9
Spain70.969.783.551.338.560.8
Latvia69.950.178.844.125.849.7
Lithuania67.149.481.842.537.252.7
Estonia70.844.491.253.936.556.5
Cluster D means69.5555.3583.9952.7037.7857.45
EU means71.2256.4868.2048.4536.9852.53
Source: author’s design using SPSS v.27.0.

References

  1. Chopra, M.; Singh, S.K.; Gupta, A.; Aggarwal, K.; Gupta, B.B.; Colace, F. Analysis & Prognosis of Sustainable Development Goals Using Big Data-Based Approach During COVID-19 Pandemic. Sustain. Technol. Entrep. 2022, 1, 100012. [Google Scholar] [CrossRef]
  2. Imran, M.; Liu, X.; Wang, R.; Saud, S.; Zhao, Y.; Khan, M.J. The Influence of Digital Economy and Society Index on Sustainable Development Indicators: The Case of European Union. Sustainability 2022, 14, 11130. [Google Scholar] [CrossRef]
  3. Bocean, C.G. A Longitudinal Analysis of the Impact of Digital Technologies on Sustainable Food Production and Consumption in the European Union. Foods 2024, 13, 1281. [Google Scholar] [CrossRef]
  4. Chen, T.S.; Chou, Y.S.; Chen, T.C. Mining User Movement Behavior Patterns in a Mobile Service Environment. IEEE Trans. Syst. Man Cybern. Part A 2011, 42, 87–101. [Google Scholar] [CrossRef]
  5. Banhidi, Z.; Dobos, I.; Nemeslaki, A. What the Overall Digital Economic and Society Index Reveals: A Statistical Analysis of the DESI EU28 Dimensions. Reg. Stat. 2020, 10, 42–62. [Google Scholar] [CrossRef]
  6. Laitsou, E.; Kargas, A.; Varoutas, D. Digital Competitiveness in the European Union Era: The Greek Case. Economies 2020, 8, 85. [Google Scholar] [CrossRef]
  7. Corejova, T.; Chinoracky, R. Assessing the Potential for Digital Transformation. Sustainability 2021, 13, 11040. [Google Scholar] [CrossRef]
  8. Jiao, S.; Sun, Q. Digital Economic Development and Its Impact on Economic Growth in China: Research Based on the Perspective of Sustainability. Sustainability 2021, 13, 10245. [Google Scholar] [CrossRef]
  9. Del Río Castro, G.; González Fernández, M.C.; Uruburu Colsa, Á. Unleashing the Convergence Amid Digitalization and Sustainability Towards Pursuing the Sustainable Development Goals (SDGs): A Holistic Review. J. Clean. Prod. 2021, 280, 122204. [Google Scholar] [CrossRef]
  10. Keeble, B.R. The Brundtland Report: ‘Our Common Future’. Med. War 1988, 4, 17–25. [Google Scholar] [CrossRef]
  11. Brohman, M.K.; Dawson, G.S.; Desouza, K.C. (Eds.) Digitalization and Sustainability: Advancing Digital Value; Edward Elgar Publishing: London, UK, 2023. [Google Scholar]
  12. Oruganti, S.K. Digital Transformation and Sustainability of Business; Routledge Taylor & Francis Group: Oxfordshire, UK, 2025. [Google Scholar]
  13. Kasinathan, P.; Pugazhendhi, R.; Elavarasan, R.M.; Ramachandaramurthy, V.K.; Ramanathan, V.; Subramanian, S.; Kumar, S.; Nandhagopal, K.; Raghavan, R.R.V.; Rangasamy, S.; et al. Realization of Sustainable Development Goals with Disruptive Technologies by Integrating Industry 5.0, Society 5.0, Smart Cities and Villages. Sustainability 2022, 14, 15258. [Google Scholar] [CrossRef]
  14. Brusseau, M.L. Sustainable Development and Other Solutions to Pollution and Global Change. In Environmental and Pollution Science; Elsevier: Amsterdam, The Netherlands, 2019; pp. 585–603. [Google Scholar]
  15. Hamilton, K.; Clemens, M. Genuine Savings Rates in Developing Countries. World Bank Econ. Rev. 1999, 13, 333–356. [Google Scholar] [CrossRef]
  16. Chenary, K.; Pirian Kalat, O.; Sharifi, A. Forecasting Sustainable Development Goals Scores by 2030 Using Machine Learning Models. Sustain. Dev. 2024, 32, 6520–6538. [Google Scholar] [CrossRef]
  17. Elavarasan, R.M.; Pugazhendhi, R.; Shafiullah, G.M.; Kumar, N.M.; Arif, M.T.; Jamal, T.; Chopra, S.S.; Dyduch, J. Impacts of COVID-19 on Sustainable Development Goals and Effective Approaches to Maneuver Them in the Post-Pandemic Environment. Environ. Sci. Pollut. Res. 2022, 29, 33957–33987. [Google Scholar] [CrossRef]
  18. Schmidt-Traub, G.; Kroll, C.; Teksoz, K.; Durand-Delacre, D.; Sachs, J.D. National Baselines for the Sustainable Development Goals Assessed in the SDG Index and Dashboards. Nat. Geosci. 2017, 10, 547–555. [Google Scholar] [CrossRef]
  19. Singh, A.; Kanaujia, A.; Singh, V.K.; Vinuesa, R. Artificial Intelligence for Sustainable Development Goals: Bibliometric Patterns and Concept Evolution Trajectories. Sustain. Dev. 2023, 32, 724–754. [Google Scholar] [CrossRef]
  20. Costanza, R.; Daly, L.; Fioramonti, L.; Giovannini, E.; Kubiszewski, I.; Mortensen, L.F.; Pickett, K.E.; Ragnarsdottir, K.V.; De Vogli, R.; Wilkinson, R. Modelling and Measuring Sustainable Well-being in Connection with the UN Sustainable Development Goals. Ecol. Econ. 2016, 130, 350–355. [Google Scholar] [CrossRef]
  21. Pradhan, P.; Costa, L.; Rybski, D.; Lucht, W.; Kropp, J.P. A Systematic Study of Sustainable Development Goal (SDG) Interactions. Earth’s Future 2017, 5, 1169–1179. [Google Scholar] [CrossRef]
  22. Weststrate, J.; Dijkstra, G.; Eshuis, J.; Gianoli, A.; Rusca, M. The Sustainable Development Goal on Water and Sanitation: Learning from the Millennium Development Goals. Soc. Indic. Res. 2019, 143, 795–810. [Google Scholar] [CrossRef]
  23. Madurai Elavarasan, R.; Pugazhendhi, R.; Jamal, T.; Dyduch, J.; Arif, M.T.; Manoj Kumar, N.; Shafiullah, G.; Chopra, S.S.; Nadarajah, M. Envisioning the UN Sustainable Development Goals (SDGs) through the Lens of Energy Sustainability (SDG 7) in the Post-COVID-19 World. Appl. Energy 2021, 292, 116665. [Google Scholar] [CrossRef]
  24. Schuelke-Leech, B.-A. Disruptive Technologies for a Green New Deal. Curr. Opin. Environ. Sci. Health 2021, 21, 100245. [Google Scholar] [CrossRef]
  25. Akkaya, B.; Apostu, S.A.; Hysa, E.; Panait, M. (Eds.) Digitalization, Sustainable Development, and Industry 5.0: An Organizational Model for Twin Transitions; Emerald Publishing Limited: Leeds, UK, 2023. [Google Scholar]
  26. Mazzi, F.; Floridi, L. Introduction: Understanding the Ethics of Artificial Intelligence for the Sustainable Development Goals. In The Ethics of Artificial Intelligence for the Sustainable Development Goals; Springer: Cham, Switzerland, 2023; Volume 152, pp. 3–7. [Google Scholar] [CrossRef]
  27. Xu, Z.; Chau, S.N.; Chen, X.; Zhang, J.; Li, Y.; Dietz, T.; Wang, J.; Winkler, J.A.; Fan, F.; Huang, B.; et al. Assessing Progress towards Sustainable Development over Space and Time. Nature 2020, 577, 74–78. [Google Scholar] [CrossRef]
  28. Huan, Y.; Liang, T.; Li, H.; Zhang, C. A Systematic Method for Assessing Progress of Achieving Sustainable Development Goals: A Case Study of 15 Countries. Sci. Total Environ. 2021, 752, 141875. [Google Scholar] [CrossRef]
  29. Chopra, M.; Singh, S.K.; Aggarwal, K.; Gupta, A. Predicting Catastrophic Events Using Machine Learning Models for Natural Language Processing. In Data Mining Approaches for Big Data and Sentiment Analysis in Social Media; Gupta, B., Perakovic, D., Abd El-Latif, A., Gupta, D., Eds.; IGI Global: Hershey, PA, USA, 2022; pp. 223–243. [Google Scholar] [CrossRef]
  30. Gupta, A.; Bansal, A.; Mamgain, K.; Gupta, A. An Exploratory Analysis on the Unfold of Fake News During COVID-19 Pandemic. In Smart Systems: Innovations in Computing; Somani, A.K., Mundra, A., Doss, R., Bhattacharya, S., Eds.; Smart Innovation, Systems and Technologies; Springer: Singapore, 2022; Volume 235. [Google Scholar] [CrossRef]
  31. Asadikia, A.; Rajabifard, A.; Kalantari, M. Systematic Prioritisation of SDGs: Machine Learning Approach. World Dev. 2021, 140, 105269. [Google Scholar] [CrossRef]
  32. Skvarciany, V.; Lapinskaite, I.; Stasytyte, V. Efficiency of Digital Economy in the Context of Sustainable Development: DEA-Tobit Approach. Prague Econ. Pap. 2023, 32, 129–158. [Google Scholar] [CrossRef]
  33. Li, Y.; Yang, X.; Ran, Q.; Wu, H.; Irfan, M.; Ahmad, M. Energy Structure, Digital Economy, and Carbon Emissions: Evidence from China. Environ. Sci. Pollut. Res. 2021, 28, 64606–64629. [Google Scholar] [CrossRef]
  34. Ma, Q.; Tariq, M.; Mahmood, H.; Khan, Z. The Nexus Between Digital Economy and Carbon Dioxide Emissions in China: The Moderating Role of Investments in Research and Development. Technol. Soc. 2022, 68, 101910. [Google Scholar] [CrossRef]
  35. Chen, L. How CO2 Emissions Respond to Changes in Government Size and Level of Digitalization? Evidence from the BRICS Countries. Environ. Sci. Pollut. Res. 2022, 29, 457–467. [Google Scholar] [CrossRef]
  36. Attaran, M. Digital technology enablers and their implications for supply chain management. Supply Chain. Forum Int. J. 2020, 21, 158–172. [Google Scholar] [CrossRef]
  37. Maran, T.K.; Liegl, S.; Davila, A.; Moder, S.; Kraus, S.; Mahto, R.V. Who fits into the digital workplace? Mapping digital self-efficacy and agility onto psychological traits. Technol. Forecast. Soc. Chang. 2022, 175, 121352. [Google Scholar] [CrossRef]
  38. Alojail, M.; Khan, S.B. Impact of Digital Transformation toward Sustainable Development. Sustainability 2023, 15, 14697. [Google Scholar] [CrossRef]
  39. Melovic, B.; Jocovic, M.; Dabic, M.; Vulic, T.B.; Dudic, B. The impact of digital transformation and digital marketing on the brand promotion, positioning and electronic business in Montenegro. Technol. Soc. 2020, 63, 101425. [Google Scholar] [CrossRef]
  40. Hanelt, A.; Bohnsack, R.; Marz, D.; Antunes Marante, C. A systematic review of the literature on digital transformation: Insights and implications for strategy and organizational change. J. Manag. Stud. 2021, 58, 1159–1197. [Google Scholar] [CrossRef]
  41. Du, J.; Shen, Z.; Song, M.; Zhang, L. Nexus between digital transformation and energy technology innovation: An empirical test of A-share listed enterprises. Energy Econ. 2023, 120, 106572. [Google Scholar] [CrossRef]
  42. Elmassah, S.; Hassanein, E.A. Digitalization and Subjective Well-being in Europe. Digit. Policy Regul. Gov. 2022, 24, 52–73. [Google Scholar] [CrossRef]
  43. Mitrovic, D. Measuring the Efficiency of Digital Convergence. Econ. Lett. 2020, 188, 108982. [Google Scholar] [CrossRef]
  44. Vial, G. Understanding Digital Transformation: A Review and a Research Agenda. J. Strateg. Inf. Syst. 2019, 28, 118–144. [Google Scholar] [CrossRef]
  45. Ionescu-Feleaga, L.; Ionescu, B.-S.; Stoica, O.C. The Link Between Digitization and the Sustainable Development in European Union Countries. Electronics 2023, 12, 961. [Google Scholar] [CrossRef]
  46. Levin, I.; Mamlok, D. Culture and Society in the Digital Age. Information 2021, 12, 68. [Google Scholar] [CrossRef]
  47. Shiroishi, Y.; Uchiyama, K.; Suzuki, N. Society 5.0: For Human Security and Well-Being. Computer 2018, 51, 91–95. [Google Scholar] [CrossRef]
  48. Gejendhiran, S.; Anicia, S.A.; Vignesh, S.; Kalaimani, M. Disruptive Technologies—A Promising Key for Sustainable Future Education. Procedia Comput. Sci. 2020, 172, 843–847. [Google Scholar] [CrossRef]
  49. Hopster, J. What Are Socially Disruptive Technologies? Technol. Soc. 2021, 67, 101750. [Google Scholar] [CrossRef]
  50. Munawar, H.S.; Mojtahedi, M.; Hammad, A.W.A.; Kouzani, A.; Mahmud, M.A.P. Disruptive Technologies as a Solution for Disaster Risk Management: A Review. Sci. Total Environ. 2022, 806, 151351. [Google Scholar] [CrossRef]
  51. Park, W.Y.; Shah, N.; Shiraishi, K.; Vine, E. Improving Energy Performance Metrics to Maximize the Benefits of Disruptive Technologies. Energy Res. Soc. Sci. 2022, 89, 102678. [Google Scholar] [CrossRef]
  52. Ghobakhloo, M.; Iranmanesh, M.; Mubarak, M.F.; Mubarak, M.; Rejeb, A.; Nilashi, M. Identifying industry 5.0 contributions to sustainable development: A strategy roadmap for delivering sustainability values. Sustain. Prod. Consum. 2022, 33, 716–737. [Google Scholar] [CrossRef]
  53. Mourtzis, D.; Angelopoulos, J.; Panopoulos, N. A Literature Review of the Challenges and Opportunities of the Transition from Industry 4.0 to Society 5.0. Energies 2022, 15, 6276. [Google Scholar] [CrossRef]
  54. Esses, D.; Csete, M.S.; Németh, B. Sustainability and Digital Transformation in the Visegrad Group of Central European Countries. Sustainability 2021, 13, 5833. [Google Scholar] [CrossRef]
  55. Sharifi, A.; Allam, Z.; Feizizadeh, B.; Ghamari, H. Three Decades of Research on Smart Cities: Mapping Knowledge Structure and Trends. Sustainability 2021, 13, 7140. [Google Scholar] [CrossRef]
  56. Leal Filho, W.; Ribeiro, P.C.C.; Mazutti, J.; Salvia, A.L.; Marcolin, C.B.; Borsatto, J.M.L.S.; Sharifi, A.; Sierra, J.; Luetz, J.; Pretorius, R.; et al. Using Artificial Intelligence to Implement the UN Sustainable Development Goals at Higher Education Institutions. Int. J. Sustain. Dev. World Ecol. 2024, 31, 726–745. [Google Scholar] [CrossRef]
  57. Joia, L.A.; Kuhl, A. Smart City for Development: A Conceptual Model for Developing Countries. In Proceedings of the International Conference on Social Implications of Computers in Developing Countries; Springer: Cham, Switzerland, 2019; pp. 203–214. [Google Scholar] [CrossRef]
  58. Wang, W.; Siau, K. Artificial Intelligence, Machine Learning, Automation, Robotics, Future of Work and Future of Humanity: A Review and Research Agenda. J. Database Manag. 2019, 30, 61–78. [Google Scholar] [CrossRef]
  59. Truby, J. Governing Artificial Intelligence to Benefit the UN Sustainable Development Goals. Sustain. Dev. 2020, 28, 946–959. [Google Scholar] [CrossRef]
  60. Sarkis, J.; Ibrahim, S. Building knowledge beyond our experience: Integrating sustainable development goals into IJPR’s research future. Int. J. Prod. Res. 2022, 60, 7301–7318. [Google Scholar] [CrossRef]
  61. Han, Z.; Yang, Y.; Wang, W.; Zhou, L.; Gadekallu, T.R.; Alazab, M.; Gope, P.; Su, C. RSSI Map-Based Trajectory Design for UGV Against Malicious Radio Source: A Reinforcement Learning Approach. IEEE Trans. Intell. Transp. Syst. 2022, 24, 4641–4650. [Google Scholar] [CrossRef]
  62. Bican, P.M.; Brem, A. Digital business model, digital transformation, digital entrepreneurship: Is there a sustainable “digital”? Sustainability 2020, 12, 5239. [Google Scholar] [CrossRef]
  63. Lian, Z.; Zeng, Q.; Wang, W.; Gadekallu, T.R.; Su, C. Blockchain-Based Two-Stage Federated Learning With Non-IID Data in IoMT System. IEEE Trans. Comput. Soc. Syst. 2022, 10, 1701–1710. [Google Scholar] [CrossRef]
  64. Xu, J.; She, S.; Liu, W. Role of Digitalization in Environment, Social and Governance, and Sustainability: Review-Based Study for Implications. Front. Psychol. 2022, 13, 961057. [Google Scholar] [CrossRef]
  65. Camodeca, R.; Almici, A. Digital Transformation and Convergence Toward the 2030 Agenda’s Sustainability Development Goals: Evidence from Italian Listed Firms. Sustainability 2021, 13, 11831. [Google Scholar] [CrossRef]
  66. Burinskienė, A.; Seržantė, M. Digitalisation as the Indicator of the Evidence of Sustainability in the European Union. Sustainability 2022, 14, 8371. [Google Scholar] [CrossRef]
  67. Jovanovic, M.; Rakicevic, J.; Jaksic, M.L.; Petkovic, J.; Marinkovic, S. Composite Indices in Technology Management: A Critical Approach. In Emerging Trends in the Development and Application of Composite Indicators; IGI Global: Hershey, PA, USA, 2017; pp. 38–71. [Google Scholar] [CrossRef]
  68. Herman, E. The Interplay Between Digital Entrepreneurship and Sustainable Development in the Context of the EU Digital Economy: A Multivariate Analysis. Mathematics 2022, 10, 1682. [Google Scholar] [CrossRef]
  69. Biggeri, M.; Clark, D.A.; Ferrannini, A.; Mauro, V. Tracking the SDGs in an ‘Integrated’ Manner: A Proposal for a New Index to Capture Synergies and Trade-Offs between and within Goals. World Dev. 2019, 122, 628–647. [Google Scholar] [CrossRef]
  70. Sachs, J.D.; Lafortune, G.; Fuller, G. The SDGs and the UN Summit of the Future. Sustainable Development Report 2024; SDSN: Paris, France; Dublin University Press: Dublin, Ireland, 2024. [Google Scholar] [CrossRef]
  71. United Nations. Transforming Our World: The 2030 Agenda for Sustainable Development: A/RES/71/1; United Nations: New York, NY, USA, 2015. [Google Scholar]
  72. United Nations. Digital Economy Report 2021; UNCTAD: Geneva, Switzerland, 2021. [Google Scholar]
  73. Rakicevic, J.; Rakicevic, A.; Poledica, A. Logical Clustering Approach for Analysing Digital Economy and Society Performance of Countries. In Proceedings of the 11th Conference of the European Society for Fuzzy Logic and Technology (EUSFLAT 2019); Atlantis Press: Paris, France, 2019; pp. 550–557. [Google Scholar] [CrossRef]
  74. Stavytskyy, A.; Kharlamova, G.; Stoica, E.A. The Analysis of the Digital Economy and Society Index in the EU. Balt. J. Eur. Stud. 2019, 9, 245–261. [Google Scholar] [CrossRef]
  75. Başol, Ö.; Yalçin, E.C. How Does the Digital Economy and Society Index (DESI) Affect Labor Market Indicators in EU Countries? Hum. Syst. Manag. 2021, 40, 503–512. [Google Scholar] [CrossRef]
  76. Liu, T. Digital Policy in European Countries from the Perspective of the Digital Economy and Society Index. Policy Internet 2021, 14, 202–218. [Google Scholar] [CrossRef]
  77. Diaz-Sarachaga, J.M.; Jato-Espino, D.; Castro-Fresno, D. Is the Sustainable Development Goals (SDG) Index an Adequate Framework to Measure the Progress of the 2030 Agenda? Sustain. Dev. 2018, 26, 663–671. [Google Scholar] [CrossRef]
  78. Sustainable Development Solutions Network. Sustainable Development Report 2024; SDSN: New York, NY, USA, 2025; Available online: https://dashboards.sdgindex.org (accessed on 2 March 2025).
  79. European Commission. The Digital Economy and Society Index (DESI). Available online: https://digital-strategy.ec.europa.eu/en/policies/desi (accessed on 2 March 2025).
  80. van Laar, E.; van Deursen, A.J.A.M.; van Dijk, J.A.G.M.; de Haan, J. The Relation Between 21st-Century Skills and Digital Skills: A Systematic Literature Review. Comput. Hum. Behav. 2017, 72, 577–588. [Google Scholar] [CrossRef]
  81. Prieger, J.E. The Broadband Digital Divide and the Economic Benefits of Mobile Broadband for Rural Areas. Telecommun. Policy 2013, 37, 483–502. [Google Scholar] [CrossRef]
  82. Calp, M.H. The Role of Artificial Intelligence Within the Scope of Digital Transformation in Enterprises. In Digital Business Strategies in Blockchain Ecosystems; IGI Global: Hershey, PA, USA, 2020; pp. 122–146. [Google Scholar] [CrossRef]
  83. Ferracane, M.F.; Kren, J.; Marel, E. Do Data Policy Restrictions Impact the Productivity Performance of Firms and Industries? Rev. Int. Econ. 2020, 28, 676–722. [Google Scholar] [CrossRef]
  84. European Commission. DESI 2022 Composite Index. Available online: https://digital-decade-desi.digital-strategy.ec.europa.eu/datasets/desi-2022/charts/desi-composite?indicator=desi_sliders&breakdownGroup=desi&period=2022&unit=pc_desi_sliders (accessed on 2 March 2025).
  85. Landau, S.; Everitt, B.S. A Handbook of Statistical Analyses Using SPSS; Chapman and Hall/CRC: Boca Raton, FL, USA, 2003. [Google Scholar]
  86. Lafortune, G.; Fuller, G. Europe Sustainable Development Report 2025: SDG Priorities for the New EU Leadership. Paris: SDSN and Dublin: Dublin University Press. Available online: https://eu-dashboards.sdgindex.org/static/downloads/esdr_2025_online_database.xlsx (accessed on 2 March 2025).
  87. Russell, S.; Norvig, P. Artificial Intelligence: A Modern Approach, 3rd ed.; Pearson Educatio: Richmond, VIC, Australia, 2010. [Google Scholar]
  88. Palma, W. Time Series Analysis; John Wiley & Sons: Hoboken, NJ, USA, 2016. [Google Scholar]
  89. Franses, P.H.; van Dijk, D.; Opschoor, A. Time Series Models for Business and Economic Forecasting, 2nd ed.; Cambridge University Press: Cambridge, UK, 2014. [Google Scholar]
  90. Lin, J.; Yu, Z.; Wei, Y.D.; Wang, M. Internet Access, Spillover and Regional Development in China. Sustainability 2017, 9, 946. [Google Scholar] [CrossRef]
  91. Moreno, M.; Richard, C.M.; Wright, M.; Fiona, C. Opportunities for redistributed manufacturing and digital intelligence as enablers of a circular economy. Int. J. Sustain. Eng. 2019, 12, 77–94. [Google Scholar] [CrossRef]
  92. Chauhan, C.; Parida, V.; Dhir, A. Linking Circular Economy and Digitalisation Technologies: A Systematic Literature Review of Past Achievements and Future Promises. Technol. Forecast. Soc. Change 2022, 177, 121508. [Google Scholar] [CrossRef]
  93. Mondejar, M.E.; Avtar, R.; Diaz, H.L.B.; Dubey, R.K.; Esteban, J.; Gomez-Morales, A.; Hallam, B.; Mbungu, N.T.; Okolo, C.C.; Prasad, K.A.; et al. Digitalization to Achieve Sustainable Development Goals: Steps Towards a Smart Green Planet. Sci. Total Environ. 2021, 794, 148539. [Google Scholar] [CrossRef]
  94. UNCTAD. Trade and Development Report 2024: Rethinking Development in the Age of Discontent; United Nations Conference on Trade and Development: Geneva, Switzerland, 2024; Available online: https://unctad.org/system/files/official-document/tdr2024_en.pdf (accessed on 15 May 2025).
  95. Forti, V.; Baldé, C.P.; Kuehr, R.; Bel, G. The Global E-Waste Monitor 2024: National and Regional E-Waste Statistics and Trends; United Nations Institute for Training and Research (UNITAR): Bonn, Germany; International Telecommunication Union (ITU): Geneva, Switzerland; United Nations University (UNU): Rotterdam, The Netherlands, 2024; Available online: https://ewastemonitor.info/wp-content/uploads/2024/12/GEM_2024_EN_11_NOV-web.pdf (accessed on 15 May 2025).
  96. von der Leyen, U. A Union That Strives for More: My Agenda for Europe; European Commission: Brussels, Belgium, 2019. [Google Scholar]
  97. Kraus, S.; Jones, P.; Kailer, N.; Weinmann, A.; Chaparro-Banegas, N.; Roig-Tierno, N. Digital transformation: An overview of the current state of the art of research. Sage Open 2021, 11, 21582440211. [Google Scholar] [CrossRef]
  98. Rowan, N.J.; Casey, O. Empower Eco Multi-Actor HUB: A Triple Helix “Academia-Industry-Authority” Approach to Creating and Sharing Potentially Disruptive Tools for Addressing Novel and Emerging New Green Deal Opportunities under a United Nations’ Sustainable Development Goals Framework. Curr. Opin. Environ. Sci. Health 2021, 21, 100254. [Google Scholar] [CrossRef]
  99. Huang, S.; Wang, B.; Li, X.; Zheng, P.; Mourtzis, D.; Wang, L. Industry 5.0 and Society 5.0—Comparison, complementation and co-evolution. J. Manuf. Syst. 2022, 64, 424–428. [Google Scholar] [CrossRef]
  100. Rosârio, A.T.; Dias, J.C. Sustainability and the Digital transition: A literature review. Sustainability 2022, 14, 4072. [Google Scholar] [CrossRef]
  101. Sharifi, A.; Allam, Z.; Elias, S.; Khavarian-Garmsir, A.R. Smart Cities and Sustainable Development Goals (SDGs): A Systematic Literature Review of Co-Benefits and Trade-Offs. Cities 2024, 146, 104659. [Google Scholar] [CrossRef]
Figure 1. Conceptual model. Source: developed by the author.
Systems 13 00398 g001
Figure 2. Research design. Source: developed by the author.
Systems 13 00398 g002
Figure 3. ANN model. Source: authors’ design using SPSS v.27 (IBM Corporation, Armonk, NY, USA).
Systems 13 00398 g003
Figure 4. SDGi forecasting depending on time using the Brown model. Source: author’s design using SPSS v.27.
Systems 13 00398 g004
Figure 5. DESI forecasting depending on time using the ARIMA model. Source: author’s design using SPSS v.27 (IBM Corporation, Armonk, NY, USA).
Systems 13 00398 g005
Figure 6. SDGi forecasting depending on DESI using the ARIMA model. Source: author’s design using SPSS v.27 (IBM Corporation, Armonk, NY, USA).
Systems 13 00398 g006
Figure 7. Dendrogram. Source: author’s design using SPSS v.27 (IBM Corporation, Armonk, NY, USA).
Systems 13 00398 g007
Table 1. Research variables.
VariableDatasetMeasuresReferences
SDGiSustainable Development Goals index weighted index[84]
DESIDigital Economy and Society Index weighted score (0 to 100)[85]
CConnectivityweighted score (0 to 100)[85]
DPSDigital Public Servicesweighted score (0 to 100)[85]
HCHuman Capitalweighted score (0 to 100)[85]
IDTIntegration of Digital Technologyweighted score (0 to 100)[85]
Source: developed by the author based on Lafortune et al. [86] and European Commission [84].
Table 2. Descriptive statistics.
NMinMaxMeanStd. DeviationSkewnessKurtosis
SDGi16256.681.770.2385.3323−0.0460.033
C16212.777.137.61812.82110.6590.144
DPS1627.491.257.30216.7453−0.4770.180
HC16227.571.445.6519.41800.361−0.310
IDT16210.159.129.49710.40300.4210.018
DESI16219.469.642.51510.58400.214−0.253
Source: author’s design using SPSS v.27.0 (IBM Corporation, Armonk, NY, USA).
Table 3. Correlation Matrix, KMO and Bartlett’s Test.
SDGiCDPSHCIDT
CorrelationSDGi1.0000.3170.5100.6670.615
C0.3171.0000.5880.3790.559
DPS0.5100.5881.0000.7590.749
HC0.6670.3790.7591.0000.798
IDT0.6150.5590.7490.7981.000
Sig. (1-tailed)SDGi 0.0000.0000.0000.000
C0.000 0.0000.0000.000
DPS0.0000.000 0.0000.000
HC0.0000.0000.000 0.000
IDT0.0000.0000.0000.000
Kaiser-Meyer-Olkin Measure of Sampling Adequacy.0.791
Bartlett’s Test of SphericityApprox. Chi-Square508.356
df10
Sig.0.000
Source: author’s design using SPSS v.27.0 (IBM Corporation, Armonk, NY, USA).
Table 4. Communalities and factor matrix.
InitialExtractionFactor 1
SDGi0.4670.4410.664
C0.4330.3150.561
DPS0.6930.7320.856
HC0.7580.7660.875
IDT0.7310.8360.914
Source: author’s design using SPSS v.27.0 (IBM Corporation, Armonk, NY, USA).
Table 5. Total variance explained.
FactorInitial EigenvaluesExtraction Sums of Squared Loadings
Total% of VarianceCumulative %Total% of VarianceCumulative %
13.41668.31968.3193.09061.80261.802
20.76115.22183.540
30.4368.71892.258
40.2354.70896.966
50.1523.034100.000
Source: author’s design using SPSS v.27.0 (IBM Corporation, Armonk, NY, USA).
Table 6. Linear regression model.
Model Summary
ModelRR SquareAdjusted R SquareStd. Error of the Estimate
10.683 a0.4670.4533.9441
ANOVA
ModelSum of SquaresdfMean SquareFSig.
1Regression2135.5994533.90034.3220.000
Residual2442.26115715.556
Total4577.860161
Coefficients
ModelUnstandardized CoefficientsStandardized CoefficientstSig.
BStd. ErrorBeta
1(Constant)53.9891.781 30.3200.000
C0.0160.0320.0380.4860.628
DPS−0.0320.033−0.100−0.9500.344
HC0.3030.0630.5344.8320.000
IDT0.1240.0570.2422.1920.030
a. Dependent Variable: SDG; B. Predictors: (Constant), C, DPS, HC, IDT. Source: author’s design using SPSS v.27.0 (IBM Corporation, Armonk, NY, USA).
Table 7. Parameter estimates.
Parameter Estimates
Hidden Layer 1Output LayerImportanceNormalized Importance
H(1:1)FW
Input Layer(Bias)0.061
C0.098 0.07111.1%
DPS−0.014 0.0101.6%
HC0.898 0.640100.0%
IDT0.364 0.27943.7%
Hidden Layer 1(Bias) 0.274
H (1:1) 1.166
Source: authors’ design using SPSS v.27 (IBM Corporation, Armonk, NY, USA).
Table 8. Brown model fit measures.
Fit StatisticMeanMinMax
Stationary R-squared0.3780.3780.378
R-squared0.9860.9860.986
RMSE0.2630.2630.263
MAPE0.2900.2900.290
MaxAPE1.0311.0311.031
MAE0.2020.2020.202
MaxAE0.6960.6960.696
Normalized BIC−2.491−2.491−2.491
Source: author’s design using SPSS v.27 (IBM Corporation, Armonk, NY, USA).
Table 9. ARIMA model (for DESI) fit measures.
Fit StatisticMean
Stationary R-squared0.974
R-squared0.973
RMSE1.262
MAPE2.102
MaxAPE3.178
MAE0.889
MaxAE1.656
Normalized BIC1.062
Source: author’s design using SPSS v.27 (IBM Corporation, Armonk, NY, USA).
Table 10. ARIMA model (for SDGi) fit measures.
Fit StatisticMean
Stationary R-squared0.873
R-squared0.873
RMSE0.329
MAPE0.348
MaxAPE0.563
MAE0.249
MaxAE0.406
Normalized BIC1.625
Source: author’s design using SPSS v.27 (IBM Corporation, Armonk, NY, USA).
Disclaimer/Publisher’s Note: The statements, opinions and data contained in all publications are solely those of the individual author(s) and contributor(s) and not of MDPI and/or the editor(s). MDPI and/or the editor(s) disclaim responsibility for any injury to people or property resulting from any ideas, methods, instructions or products referred to in the content.

