Article

A Study on the Spatiotemporal Coupling Characteristics and Driving Factors of China’s Green Finance and Energy Efficiency

1
School of Management, Fujian University of Technology, Fuzhou 350118, China
2
Institute of Quantitative and Technological Economics, Chinese Academy of Social Science, Beijing 100038, China
*
Author to whom correspondence should be addressed.
Systems 2025, 13(5), 394; https://doi.org/10.3390/systems13050394
Submission received: 7 April 2025 / Revised: 12 May 2025 / Accepted: 17 May 2025 / Published: 20 May 2025
(This article belongs to the Section Systems Practice in Social Science)

Abstract

:
In the context of global efforts to address climate change and pursue sustainable development, green finance (GF) and energy efficiency (EE) have become key issues of focus for academics and policymakers. This study explores the spatiotemporal coupling characteristics and driving factors of China’s green finance and energy efficiency from 2011 to 2022, aiming to help China achieve its dual carbon goals. This study used a three-dimensional framework to assess 30 provinces, considering factor inputs, expected outputs, and undesirable outputs. The study employed the global benchmark super-efficiency EBM model, entropy method, coupling coordination model (CCD), Dagum Gini coefficient decomposition, and spatiotemporal geographic weighted regression model (GTWR). Key findings include a “high in the east, low in the west” gradient distribution of both green finance and energy efficiency, expanding regional disparities, and a strong synergistic effect between technological innovation and energy regulation. Based on the findings, this paper proposes a three-tier governance framework: regional adaptation, digital integration, and institutional compensation. This study contributes to a deeper understanding of the coupling theory of environmental financial systems and provides empirical support for optimizing global carbon neutrality pathways.

1. Introduction

Within the worldwide framework of proactively fighting climate change and fervently advancing sustainable growth, GF and EE have become highly focal issues for both academia and policymakers. As an innovative financial model, GF aims to direct financial resources toward environmental protection, energy conservation, and sustainable development, playing a crucial role in accelerating the transition to an environmentally conscious economy. Meanwhile, the improvement of EE is a crucial pathway to alleviate energy shortages, reduce environmental pollution, and achieve sustainable economic development. These two factors complement each other and form an important pillar of sustainable development. Looking at the international situation, countries around the world have set strict carbon emission-reduction targets [1,2,3]. The market size of GF continues to expand, with various GF instruments, such as green bonds and green credit, emerging, fueling a global green development wave. At the same time, the energy sector is witnessing swift advancements in technological innovation (TI), with the application of new energy technologies and intelligent energy management systems presenting new opportunities for improving EE. In this context, as the world’s largest developing nation and top carbon emitter, China’s coordinated development of GF and EE is of particular importance. China must not only fulfill its global emission-reduction commitments but also demonstrate its role as a key player. It is equally essential to promote robust domestic economic growth and establish a sustainable, low-carbon economic structure.
Looking back at the domestic development process, China has achieved notable advancements in both GF and EE. The GF policy system has been gradually perfected, GF products have become increasingly diverse, and the number of market participants has been continuously increasing [4,5]. In terms of EE, through industrial structure adjustment, technological innovation, and policy guidance, energy usage per GDP unit has continued to decline. Nonetheless, it is crucial to acknowledge China’s immense size, with notable regional disparities in resource allocation, economic growth, and the maturity of the financial market. This has led to a complex and unbalanced development pattern of GF and EE in the spatiotemporal dimension.
Existing research has explored various aspects of green finance and energy efficiency, but few studies have examined their coupling relationships and driving mechanisms within a unified analytical framework. This study aims to fill this gap by conducting an in-depth analysis of the spatiotemporal coupling characteristics and driving factors of green finance and energy efficiency in 30 provinces of China from 2011 to 2022. Our research goal is to identify the spatial and temporal development patterns of green finance and energy efficiency, analyze the factors affecting their coupling coordination degree, and propose targeted policy recommendations based on these findings. This study makes three contributions. First, it introduces a multidimensional evaluation framework that integrates factor inputs, period outputs, and undesired outputs, providing a comprehensive analysis of the coupling mechanism between green finance and energy efficiency. Second, it offers cross-scale empirical evidence that can guide the optimization of global carbon-neutral pathways. Third, it highlights the importance of regional adaptability, digital integration, and institutional compensation in achieving sustainable development. By combining the global context with China’s national case studies, this research not only enriches the theoretical understanding of environmental financial systems but also provides policymakers with practical insights, thus helping China effectively resolve the contradiction between development and carbon reduction in the process of achieving the dual carbon goals and exploring a path of low-carbon transformation with Chinese characteristics [6,7,8].

2. Literature Review and Theoretical Framework

2.1. Literature Review

GF is regarded as one of the key financial instruments driving sustainable development [9]. Its ultimate goal is to prioritize the allocation of funds for environmental protection and mitigating climate change and distributing these resources to highly efficient businesses and projects [10,11]. Chen et al. [12] incorporated eco-friendly aspects into the economic structure, viewing environmental conservation and energy saving as innovative financial strategies. Tian et al. [13] concentrated on fiscal endeavors that channel capital into eco-friendly sectors [14]. GF has always been a hot topic, including its impacts on various aspects, such as the renewable energy industry [15], debt financing costs [9], green total factor productivity [16], foreign investment [17], environmental regulation [18], and business digital eco-transformation [19]. A majority of current research continues to rely solely on one viewpoint regarding GF. The present paper conducts an in-depth investigation from both temporal and spatial aspects and comprehensively discusses it in combination with EE. Most studies have also shown that GF has a significant contribution to EE, for example, through green bonds and green technological innovation [20,21,22]. Certain specialists have also verified the substantial beneficial impact of GF policies on the evolution of EE [23,24]. However, most of the current studies only discuss green finance from a single perspective. The present study aimed to investigate it in depth from both time and space perspectives, combined with energy efficiency (EE).
In the midst of growing restrictions on resources, energy preservation, and environmental health, the improvement of EE is crucial for sustainable growth [25]. Research on the factors influencing EE primarily focuses on several key aspects: Firstly, viewing from the angle of enhancing the energy framework, actively developing low-carbon industries, enhancing the framework of energy usage, promoting the transformation of energy-intensive enterprises can effectively increase the utilization rate of EE [26,27]. Secondly, from the standpoint of technological advancement, corporate innovation drives the development of digital and low-carbon technologies, thereby boosting EE [28,29]. Thirdly, from the regulatory environment perspective, the adoption of carbon emission trading strategies has markedly aided in lowering carbon emissions in pilot cities [30,31]. Based on these research findings, EE is primarily assessed through total-factor EE and the intensity of increasing the sector’s energy share while being measured using a non-radial distance function [32]. However, research coupling GF with EE remains relatively limited. This study addresses this gap by analyzing and discussing the interaction between GF and EE and proposing feasible policies to promote their development. However, the combination of GF and EE has been relatively limited.
Through analysis of the existing literature, it can be seen that the DEA framework is extensively employed in EE studies [33,34,35]. It has been so extensively utilized because it can take multiple indicators into account, thus addressing the assessment of efficiency for various inputs and outputs rather than just depending on certain established mathematical functions [36,37]. However, the traditional DEA model is incapable of handling undesirable outputs. With the passage of time, [38] optimized the original method, leading to the creation of the SBM model. This model not only effectively handles unexpected outputs but also further improves the accuracy of evaluation results. Therefore, it was later widely applied to the measurement and analysis of EE [39,40,41,42]. Investigations into GF remain in a preliminary and evolving phase, with a notable absence of criteria for assessing GF. Certain academics employ the DID technique to evaluate the financial effects of GF [13,43]. However, most continue to use the entropy approach for computing the extensive development of GF [44,45,46].
In summary, the vast majority of studies employ the SBM model to measure EE. The research utilizes the super-efficiency EBM model for its superior accuracy in measuring EE. The entropy method is used to calculate GF. Although there has been a lot of research on green finance (GF) and energy efficiency (EE) individually, there is still a significant gap in the research on their coupling mechanisms, particularly at the provincial level in China. First, despite considerable research at the county and city levels, there is a lack of comprehensive studies at the provincial level. Second, many studies focus on GF and EE separately, without exploring their interrelationship. This has led to insufficient understanding of how to enhance their interaction to promote development. Third, most existing studies focus on a single domain or a specific period, lacking a comprehensive analysis of the spatial and temporal development trends of GF and EE nationwide. Finally, a clear and comprehensive understanding of the driving mechanisms and internal paths of their coupling and coordinated development (CCD) has yet to be formed.
This study conducted a comprehensive analysis of the spatiotemporal coupling characteristics and driving factors of green finance (GF) and energy efficiency (EE) in 30 Chinese provinces from 2011 to 2022, filling a gap in this area of research. By using advanced models such as the global reference efficiency EBM model and Dagum Gini coefficient decomposition, this study provide new insights into the regional disparities and driving factors behind the coupling of GF and EE. This research not only enriches the theoretical framework of GF and EE coupling but also provides empirical evidence for policymaking at the provincial level in China. Specifically, our contributions include the following: First, this paper provides a detailed analysis of the spatiotemporal coupling characteristics of GF and EE across Chinese provinces, highlighting dynamic interactions and regional differences. Second, this paper identifies the key driving factors affecting the coupling of green finance (GF) and energy efficiency (EE), including technological innovation, environmental regulation, financial development, and human capital. Finally, this paper proposes a three-tier governance framework (regional adaptation–digital integration–institutional compensation) aimed at addressing regional imbalances and promoting coordinated development of GF and EE.

2.2. Theoretical Framework

There is a complex interrelationship between GF and EE, and its theoretical foundation covers multiple disciplines. From the perspective of economic theory, the concept of externalities forms a crucial foundation for the synchronized evolution of GF and EE [47]. In the process of energy production and consumption, there are negative externalities, such as environmental pollution. GF internalizes environmental externalities by guiding capital towards green and efficient energy projects, prompting enterprises and society to bear environmental costs and thereby achieving improvements in EE and environmental protection [48]. For example, policies related to green credit escalate the funding expenses for businesses that are energy-demanding and emit a lot of pollution, restricting their expansion, while providing low-cost funds for energy-saving and environmentally friendly projects: incentives for companies to improve EE.
Sustainable development theory prioritizes the synchronized growth of the economy, societal structure, and ecological system [49,50], and the synergistic optimization of GF and EE is a key pathway to achieving sustainable development [51,52]. Within this theoretical framework, GF offers monetary aid for eco-friendly initiatives in the energy industry, advocating for a shift to renewable energy sources and cutting down on energy use and ecological contamination. Meanwhile, the improvement of EE helps to reduce energy waste, enhance the efficiency of economic operations, and foster an economic climate conducive to the growth of GF. Both elements bolster one another, collaboratively fostering the continuous expansion of the economy and society [53].
The theory of complexity science posits that GF and EE form a complex system, within which the various elements interact in nonlinear and dynamic ways. Within the cycle of “technological innovation–capital flow–policy iteration”, GF and EE influence each other. Issuing green bonds leads to lower financial expenses for emerging energy technology firms, facilitating technological diffusion and enhancing EE [54]. In turn, the energy savings resulting from improved EE feed back into the valuation of green assets through the carbon market, further propelling the development of the GF market. This dynamic feedback relationship endows the system with complex evolutionary characteristics, making it difficult for traditional linear causal analysis to fully elucidate its underlying mechanisms.
Based on the aforementioned theories, this study constructed a three-dimensional framework of “system coupling diagnosis–spatial heterogeneity deconstruction–driving effect analysis”, as shown in Figure 1. In terms of system coupling diagnosis, an improved EBM model incorporating spatial correlation effects was established by integrating environmental economics and complexity science theories. This model comprehensively considers the interactions between GF and EE as well as the influence of neighboring provinces to more accurately assess EE. For spatial heterogeneity deconstruction, an in-depth examination of regional variances in GECC was conducted using the Dagum Gini coefficient decomposition approach, including within-group differences, between-group differences, and the supravariation density term, revealing the evolution patterns of regional development. On the driving effect analysis level, based on the GTWR model, the synergistic effects of multi-level policy tools and non-market factors were systematically analyzed to identify key driving factors, providing a scientific basis for regional differentiated policy design.

3. Research Method, Construction of Index System, and Data Selection

3.1. Study Methods

(1)
Overview of the global reference super-efficient EBM model
When studying the spatial and temporal coupling characteristics of green finance (GF) and energy efficiency (EE), researchers have employed various methods. Traditionally, data envelopment analysis (DEA) frameworks and their variants, such as the super-efficiency model (SBM), have been widely used. The SBM model overcomes the limitation of traditional DEA models in handling undesirable outputs, thereby enhancing the accuracy of the evaluation results. However, these models have shortcomings in considering spatial correlation and dynamic factors. Therefore, the global reference super-efficiency EBM model was chosen because it can accurately measure energy efficiency (EE) by simultaneously considering both desirable and undesirable outputs, which is crucial for our analysis of China’s green development (GF) and energy efficiency (EE) [55]. This model achieves a more precise assessment of efficiency by concurrently taking into account environmental and economic factors, as shown in Formula (1):
i = 1 , j n k λ i x a i + S a = δ x a n , a = 1 , 2 , , A i = 1 , j n k λ i x a i + S a = δ x a n , a = 1 , 2 , , A i = 1 , j n k λ i x a i + S a = δ x a n , a = 1 , 2 , , A
E represents EE, k denotes the number of DMU, and Xan, Ybn, and Zcn, respectively, are the a-th factor input, the b-th desirable output, and the c-th undesirable output of the n-th DMU. A, B, and C, respectively, represent the number of indicators for factor inputs, desirable outputs, and undesirable outputs. S a , S b , and S c represent the slack variables for the input of the a-th factor in a visual manner, the b-th desirable output, and the c-th undesirable output. w denotes the weights of each indicator, λ represents the linear combination coefficients of the decision-making units, δ is the efficiency value under the radial condition, and ε indicates the significance of the non-radial part, with a value ranging between 0 and 1.
(2)
Entropy method: purpose and application
The entropy method is widely used due to its objectivity and ability to overcome multicollinearity, making it especially suitable for evaluating systems with complex elements and heterogeneity. However, the entropy method has limited capability in handling non-linear relationships between indicators. In this study, it was used to calculate the weights of various indicators in the GF index system. This method dynamically adjusts weight allocation by measuring the information entropy of indicator data, effectively overcoming multicollinearity and subjective bias [56] with the specific implementation steps as follows:
Standardization of indicators.
Standardization of the initial data is performed to remove variations in dimensions, and the range method is used to generate the standardized matrix:
X i j * = X i j min ( X j ) max ( X j ) min ( X j )                      ( forward   pointer )
X i j * = max ( X j ) X i j max ( X j ) min ( X j )                      ( Reverse   metrics )
Entropy value calculation.
Indicator probability determines the ratio of the j-th marker in the i-th sample.
P i j = X i j * i = 1 n X i j *
Entropy value measurement utilizes the concept of increasing entropy to determine the entropy figure for the j-th indicator.
E j = 1 ln n i = 1 n P i j ln P i j ( 0 E j 1 )
Weighting is determined.
Differential coefficient adjustment generates indicator weights based on entropy value dispersion.
W j = ( 1 E j ) j = 1 m ( 1 E j )
(3)
The CCD model measures the relationship between GF and EE.
In order to more comprehensively assess the interaction between GF and EE, researchers proposed the coupling coordination degree (CCD) model, which is also widely used in socio-economic research [57,58]. This model effectively measures the degree of synergy between GF and EE, but the traditional CCD model has limited ability to consider spatial heterogeneity and dynamic factors using the following calculation formula:
D = C × D ,   T = α L + β E ,   C = L × E ( L + E ) / 2
In the formula, D represents CCD between CDGF (L) and EE (E), while T represents the comprehensive benefit index. α and β are undetermined coefficients, with α + β = 1. Since the two systems are complementary, both α and β are assigned a value of 0.5. The CCD is divided into five categories: D in (0, 0.2] indicates severe imbalance, D in (0.2, 0.4] indicates moderate imbalance, D in (0.4, 0.6] indicates basic coordination, D in (0.6, 0.8] indicates moderate coordination, and D in (0.8, 1] indicates high coordination.
(4)
The Dagum Gini coefficient explores the spatial–temporal interaction characteristics between China’s GF and EE in depth.
The Dagum Gini coefficient decomposition method, by breaking down within-group differences, between-group differences, and the supervariance density term, provides a deep understanding of regional disparities [59]. However, this method has limited ability to reveal how specific factors influence regional differences. In order to explore the spatial-temporal interaction characteristics between China’s GF and EE in depth, our study chose the decomposition method of the Dagum Gini coefficient. In Formula (4), yji (yhr) represents the GECC of any province within region j (h), y denotes the mean CCD across all provinces nationwide, n signifies the count of provinces, k is the tally of regional divisions, and nj (nk) is the tally of provinces in region j (h).
G = j = 1 k h = 1 k i = 1 n j r = 1 n h | y j i y h r | 2 n 2 y ¯
According to the analytical method of the Dagum Gini coefficient, it can be divided into three main components: Gw (within-group differences), Gnb (between-group differences), and Gt (supravariation density term). The relationship among them is G = Gw + Gnb + Gt. In the following formulas, nj (nh) refers to the number of provinces in region j (h), and Y j ¯ ( Y h ¯ ) represents the average GECC in region j (h).
G j j = 1 2 Y j ¯ i = 1 n j r = 1 n j | y j i y j r | n j 2
Formula (5) represents the Gini coefficient Gjj of region j.
G w = j = 1 k G j j p j s j
Formula (6) represents the contribution Gw in the region.
G j h = i = 1 n j r = 1 n h | y j i y h r | n j n h ( Y j ¯ + Y h ¯ )
Formula (7) represents the inter-regional Gini coefficient Gjh between regions j and h.
G n b = j = 2 k h = 1 j 1 G j h ( p j s h + p h s j ) D j h
Formula (8) represents the contribution Gnb of the inter-regional difference between regions j and h.
G t = j = 2 k h = 1 j 1 G j h ( p j s h + p h s j ) ( 1 D j h )
The contribution Gt of the super variable density term represented by Formula (9).
nj (nh) signifies the count of provinces in region j (h), while Y j ¯ ( Y h ¯ ) denotes the average GECC in region j (h), as shown in Formulas (10) and (11). Djh symbolizes the comparative impact of CCD across regions j and h, defined in Formula (12), where djh and pjh are calculated according to Formulas (13) and (14), respectively.
p j = n j n
s j = n j Y j ¯ n Y ¯
D j h = d j h p j h d j h + p j h
d j h = 0 d F j ( y ) 0 y ( y x ) d F h ( x )
p j h = 0 d F h ( y ) 0 y ( y x ) d F j ( y )
Fj (Fh) represents the aggregate density distribution functions applicable to regions j (h), respectively. djh represents the variance in CCD across different areas, defined by the mathematical anticipation of the total of all samples where yjiyhr exceeds 0 in regions j and h. The term pjh represents the supravariation first-order moment, signifying the mathematical anticipation of the aggregate of all instances where yhryji exceeds 0 in areas j and h.
(5)
The spatial and temporal weighted regression model identifies the impact of driving factors on GECC.
The GTWR model considers the spatial and temporal heterogeneity and is capable of analyzing the synergistic effects of multiple policy tools and non-market factors [60]. However, the GTWR model has limited ability in dealing with complex nonlinear relationships. This study uses the GTWR model to test the spatiotemporal dynamics of various drivers on GECC. The formula is as follows:
G E C C i = α ( π i , i , t i ) + j = 1 m β j ( π i , i , t i ) X i j + u i
Here, (πi, αi, ti) represents the spatiotemporal location of province i, and Xij represents the observed value of province i in the j-th independent variable x. Based on the existing literature, this study selected six driving factors: ES, IS, TI, ER, FD, and HC.
The reference number estimation of the GTWR model is as follows:
β ( π i , i , t i ) = [ X T W ( π i , i , t i ) X ] 1 X T W ( π i , i , t i ) Y
Here, Y is the explanatory variable, and W ( π i , i , t i ) represents the weight matrix that holds information about space and time.
The specific structure is shown in Figure 2.

3.2. The Construction of the Indicator System

The specific contents of input of elements, expected output, and unexpected output involved in the above research methods are shown in Table 1. Labor input is a fundamental resource for any economic activity and directly impacts energy consumption and efficiency. This indicator is widely used in energy efficiency assessments to reflect the scale of human resource utilization [12,35]. Capital input, particularly fixed assets, is crucial for understanding production capacity and its impact on energy efficiency. The stock of fixed assets is often used to assess the capital intensity of energy consumption [16,25]. Energy input is a direct measure of the total energy used in the production process, serving as an important indicator for evaluating energy efficiency and identifying areas for improvement [21,22]. For expected output, real GDP is the standard measure of economic output and is widely used to evaluate the productivity and efficiency of energy use. A higher GDP with lower energy consumption indicates better energy efficiency [12,35]. Non-expected output is reflected through industrial wastewater discharge, solid waste, and industrial SO2 and CO2 emissions. Wastewater discharge is an important indicator of environmental impact and inefficiency, reflecting the negative externalities of industrial activities [16,25]. Solid waste is another key indicator of inefficiency and environmental impact, helping to understand waste management practices and their effects on sustainability [22]. Emissions of pollutants, such as sulfur dioxide and carbon dioxide, are key indicators of environmental performance. These indicators are widely used to assess the environmental impact of industrial activities and the effectiveness of energy efficiency measures [12,35], Among them, for the stock of fixed capital, estimations are made using the method of perpetual inventory, with 2000 as the base year, and each province’s fixed asset price index is used to adjust the total fixed assets accordingly. The real GDP is deflated with 2000 as the base year.
Drawing from available data and current studies, this study identified nine ancillary metrics to evaluate CDGF across five domains. Green credit reflects financial support for high-energy-consuming industries, which is crucial for understanding the role of green credit in promoting energy efficiency, and assesses financial support for green industries, reflecting the market’s orientation toward sustainable practices [12,16,25,35]. Green bonds measure the market penetration of green enterprises, reflecting financial market support for green industries and assessing the market concentration of high-energy-consuming industries, helping to elucidate the role of financial markets in either promoting or hindering the green transition [12,21,22,35]. Green insurance reflects the role of insurance in supporting agricultural sustainability and resilience and assesses financial support for the agricultural sector through insurance mechanisms, which is crucial for understanding the role of green insurance in promoting sustainable practices [12,22,25,35]. Green investment measures financial commitments to environmental protection and reflects the role of green investment in promoting sustainable development and government financial support for environmental initiatives, which is essential for understanding the role of public finance in promoting green practices [17,21,22,25]. Carbon finance measures the carbon intensity of economic activities and is widely used to assess the role of carbon finance policies in promoting low-carbon development [12,36]. The specific indicator system is shown in Table 2.

3.3. Data Sources

Utilizing the data at hand, this study chose panel data from 30 Chinese provinces (with the exception of Tibet and the regions of Hong Kong, Macao, and Taiwan) spanning 2012–2022 as its research sample. Some missing values were supplemented using interpolation. The data mainly come from the “China Industrial Statistical Yearbook”, “China Energy Statistical Yearbook”, “China Economic Census Yearbook”, “China Forestry and Grassland Yearbook”, “China Water Resources Investment Yearbook”, “China Insurance Statistical Yearbook”, “China Environmental Statistics Yearbook”, “China Statistical Yearbook”, and the CSMAR database.

4. Results Analysis

4.1. Spatio-Temporal Differentiation of the 30 Provinces in China

Between 2011 and 2024, the improvement processes of China’s GF and EE exhibited a distinct interactive relationship. As shown in Figure 3, the development level of GF grew rapidly from a relatively low starting point in the early years (2011 = 0.11559) to a high level (2022 = 0.16665), which can be divided into three stages: slow growth before 2016 due to the imperfection of relevant policies; an acceleration period after the national GF pilot work was launched in 2016; and a shift towards higher-quality development after 2020 under the influence of the “carbon neutrality” goal and international environmental investment. Meanwhile, the overall EE level increased (2011 = 0.55265~2022 = 0.63745), but the growth rate was relatively slow, especially during 2011–2014, when efficiency improvement almost stagnated due to the difficulty of transforming traditional industries and the high application costs of new technologies. A significant advancement only materialized when clean energy costs, like solar power, diminished, and smart management technologies gained widespread acceptance. CCD remained in a basically coordinated state from 2011 to 2022, but it showed an overall upward trend.
Further research revealed that this interactive relationship is mainly driven by three factors: The first is policy guidance, for example, the national “carbon neutrality” goal, which directs financial resources to energy-efficient initiatives via the carbon emission trading market, and the inclusion of environmental indicators in local government performance assessments, which also strengthens the implementation. The second is market response, as the reduction in green financing costs encourages high-energy-consuming industries such as steel and chemicals to actively seek funds for technological upgrades. The third is technological progress, such as using big data to track fund flows to control risks and employing artificial intelligence to optimize energy use in factories. It is important to recognize that the impact of synchronized development between the two entities varies, yet it notably intensifies when the implementation intensity of GF policy attains a specific threshold, which has reference value for different regions to formulate targeted policies.

4.1.1. GF Analysis of Spatiotemporal Trends

Between 2011 and 2022, China’s CDGF showed significant improvement and regional diffusion characteristics. As shown in Figure 4 (average of four years from periods of 2011–2014, 2015–2018, and 2019–2022, respectively), the highest indicator range of each province expanded from 0.200560 in 2011–2014 to 0.374530 in 2019–2022. Policy promotion and market innovation formed the core driving forces. Regarding geographical spread, the eastern coastlines maintained their leading position, whereas the western areas stayed undervalued for an extended period, indicative of the varying degrees of economic base, fiscal means, and policy reaction skills. It is worth noting that central provinces and some western hub cities achieved leapfrog development through pilot policy implementation and industrial transformation, entering the upper-middle range in 2019–2022. This indicates that GF has shifted from a single-pole drive to a multi-center coordinated development.
Policy intervention has a significant spatial response on regional development patterns. Initiating pilot zones for GF reform in Zhejiang and Guangdong, among other areas, in 2017 propelled their indices from the second tier (2015–2018) to the highest tier (2019–2022), confirming the positive cycle of “policy dividends–market expansion”. However, the low-value lock-in of some provinces in the northwest indicates that traditional support measures (financial subsidies and document guidance) are insufficient to break through geographical and economic constraints. A “differential institutional supply” is needed to resolve this dilemma: the eastern region should explore cross-border green capital flows and innovations in carbon neutrality financial derivatives, while the western region needs to strengthen ecological value accounting and targeted green infrastructure financing. At the same time, relying on regional collaboration platforms such as YRD and Chengdu-Chongqing, it is essential to promote technological spillovers and cross-regional project linkages to achieve a paradigm shift in GF from prioritizing efficiency to balanced development.
The multidimensional analysis of the provincial GF kernel density dynamic map from 2011 to 2022, as shown in Figure 5, indicates that China’s GF development exhibits a compound characteristic of “overall improvement and strengthening–heterogeneous regional evolution”. In terms of the evolution of the distribution form, the main peak position of the kernel density systematically shifts to the right from the low-value interval (0.06–0.16) in the initial period to the interval of 0.20–0.32 (the left skewness decreases from 1.25 to 0.68), which confirms the leap in the development level of the whole area under the empowerment of policies and technological innovation. Meanwhile, the density curve shifts from a single-peak symmetry (2011–2016) to a typical double-peak structure (2017–2022) (the kurtosis difference ΔK = 2.3), revealing the continuous deepening of the “technology–institution gap” between high-gradient provinces (eastern reform pilot zones) and low-gradient groups (resource-dependent regions), manifested by a 38% expansion of the standard deviation and the club convergence index breaking through 0.48 (p < 0.05). The research uncovers that the spatial variance in the momentum of green development primarily reflects the external variation in the efficiency of institutional adaptability, which urgently needs to be improved through a gradient compensation mechanism and the reconstruction of a cross-regional technology diffusion network to achieve multi-level Pareto improvement in the GF system.

4.1.2. EE Spatial and Temporal Evolution Trend Analysis

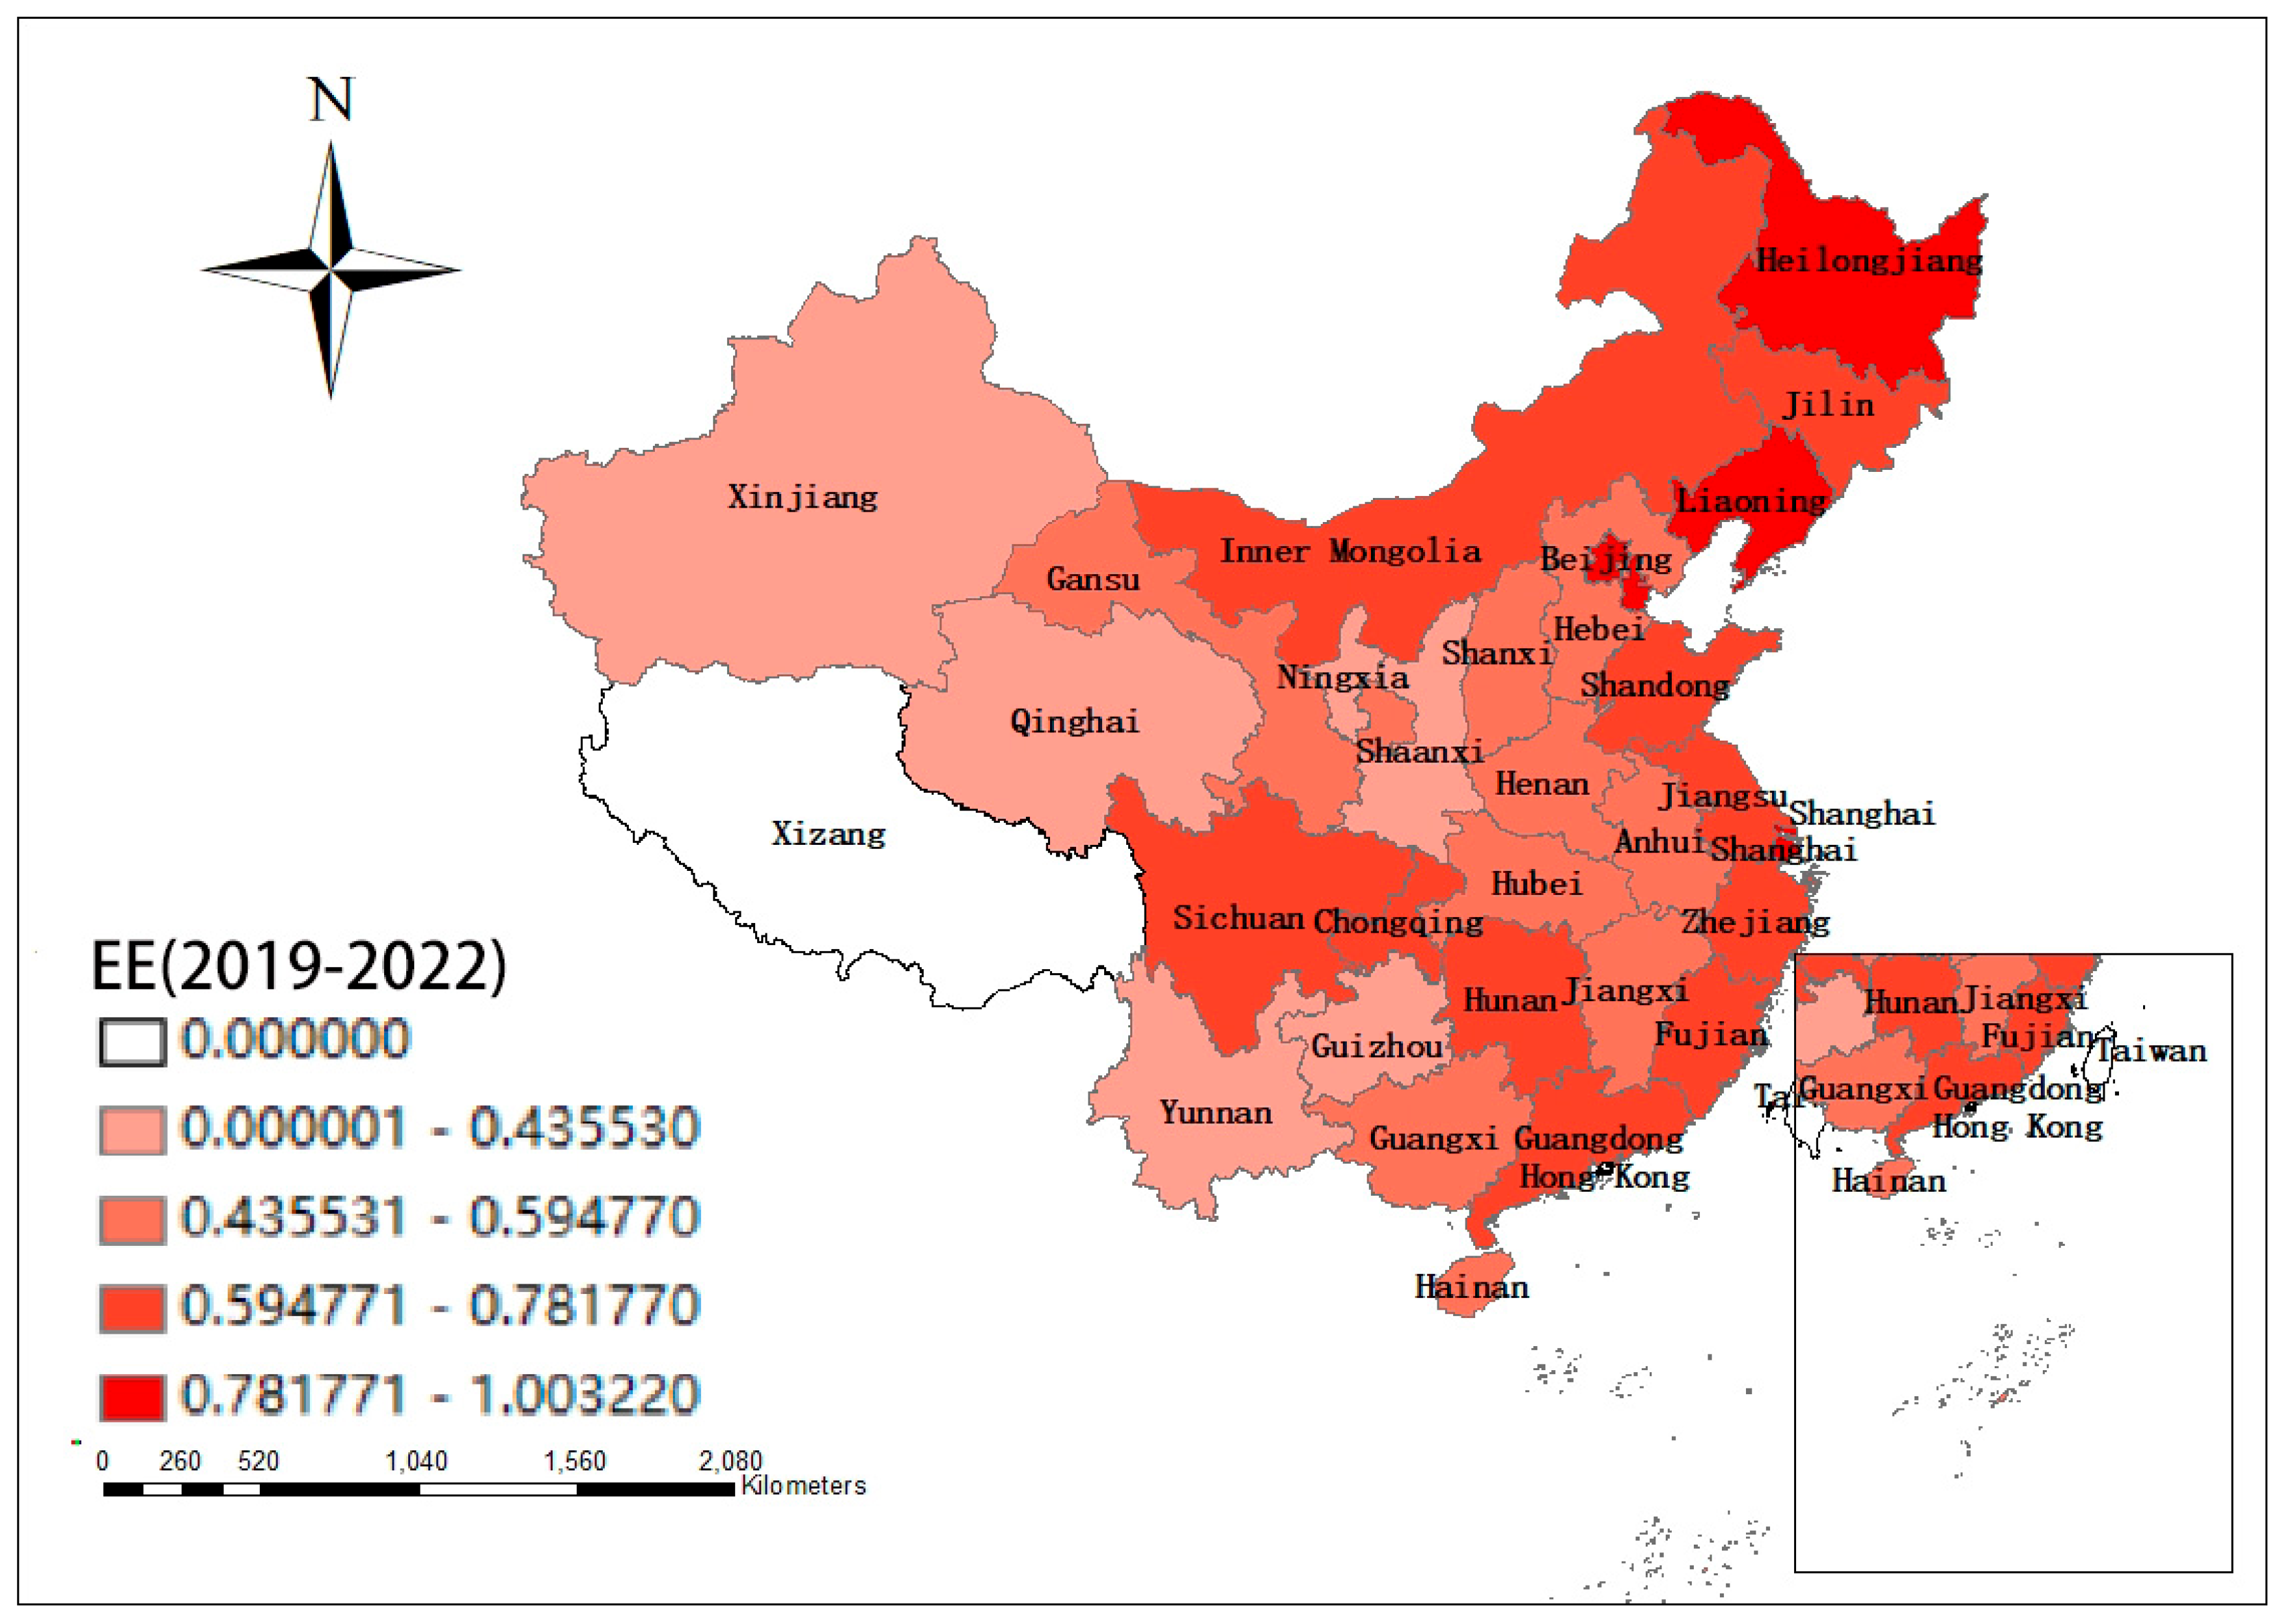
EE in Chinese provinces showed significant spatial differentiation and dynamic convergence characteristics from 2011 to 2022. As shown in Figure 6 (average of four years from the periods of 2011–2014, 2015–2018, and 2019–2022, respectively), in terms of regional patterns, the eastern coastal areas maintained high EE levels (0.78–1.00), with obvious advantages in technology-intensive industries and clean energy infrastructure. The western regions remained in the low-efficiency range (<0.44) for a long time, with economic structures relying on resource development and energy-intensive industries as the main constraints. Central and western provinces had a faster increase in efficiency, but the absolute gap did not significantly narrow, and regional imbalances persisted. In the temporal dimension, the upper limit of national EE values increased from 0.94 (2011–2014) to 1.00 (2019–2022), reflecting the strong driving force of policy intervention (such as the dual carbon goals) on technological iteration in the east. However, the lag in technological diffusion in the west led to a pronounced Matthew effect of “eastern rise and western stagnation”.
The regional differentiation of EE is essentially the result of differences in policy response and barriers to technological diffusion. After 2015, strategies for preventing and managing air pollution, along with the dual regulation of energy usage, helped places like Shandong and Anhui achieve efficiency leaps, while the west, constrained by resource dependence and the absence of market-oriented mechanisms, fell into a “lock-in” dilemma. In the future, it is necessary to build a regional collaborative governance mechanism: the east should deepen EE reforms through digital technology (such as smart grids), while the central and western regions need to link renewable energy bases with industrial decarbonization and establish cross-provincial green technology trading platforms to break spatial spillover barriers. Concurrently, monitoring the dynamic interplay between EE and carbon emissions is crucial as well as optimizing resource allocation in a targeted manner and avoiding “one-size-fits-all” policies that exacerbate regional differentiation.
The kernel density distribution of EE in 30 Chinese provinces from 2011 to 2022 shows significant stage-by-stage evolution characteristics, reflecting the game between policy drive and technological diffusion. As shown in Figure 7, the overall distribution evolved from the initial wide peak single state (2011–2015) to a double peak convergence (2016–2019) and finally formed a right-skewed, long-tailed shape (2020–2022) under the dual carbon goals. The density of high-efficiency provincial groups (>0.8) increased sharply (peak height 3.3), and the main peak shifted to the right to 1.05, indicating that TI in the east (such as the large-scale application of new energy and digital EE management) drove an absolute leap in efficiency. However, the western region, long limited by resource dependence and technological lock-in, continued to have a secondary peak in the low-efficiency range (0.4–0.6), forming a “dual-speed differentiation” pattern between the east and the west. This differentiation essentially stems from the regional imbalance in policy response: the east accelerated technological iteration through market incentive mechanisms (such as carbon trading pilots), while the west faced fiscal constraints and industrial inertia. In the future, it is necessary to strengthen cross-regional technological collaboration (such as targeted docking between eastern technology parks and western bases) and establish an EE compensation fund to break the “low-carbon transition trap” of resource-based provinces. At the same time, dynamic kernel density parameters (kurtosis and skewness) should be included in the policy evaluation system to achieve the dual goals of efficiency improvement and regional fairness.

4.1.3. Analysis of the Spatial and Temporal Evolution Trend of CCD

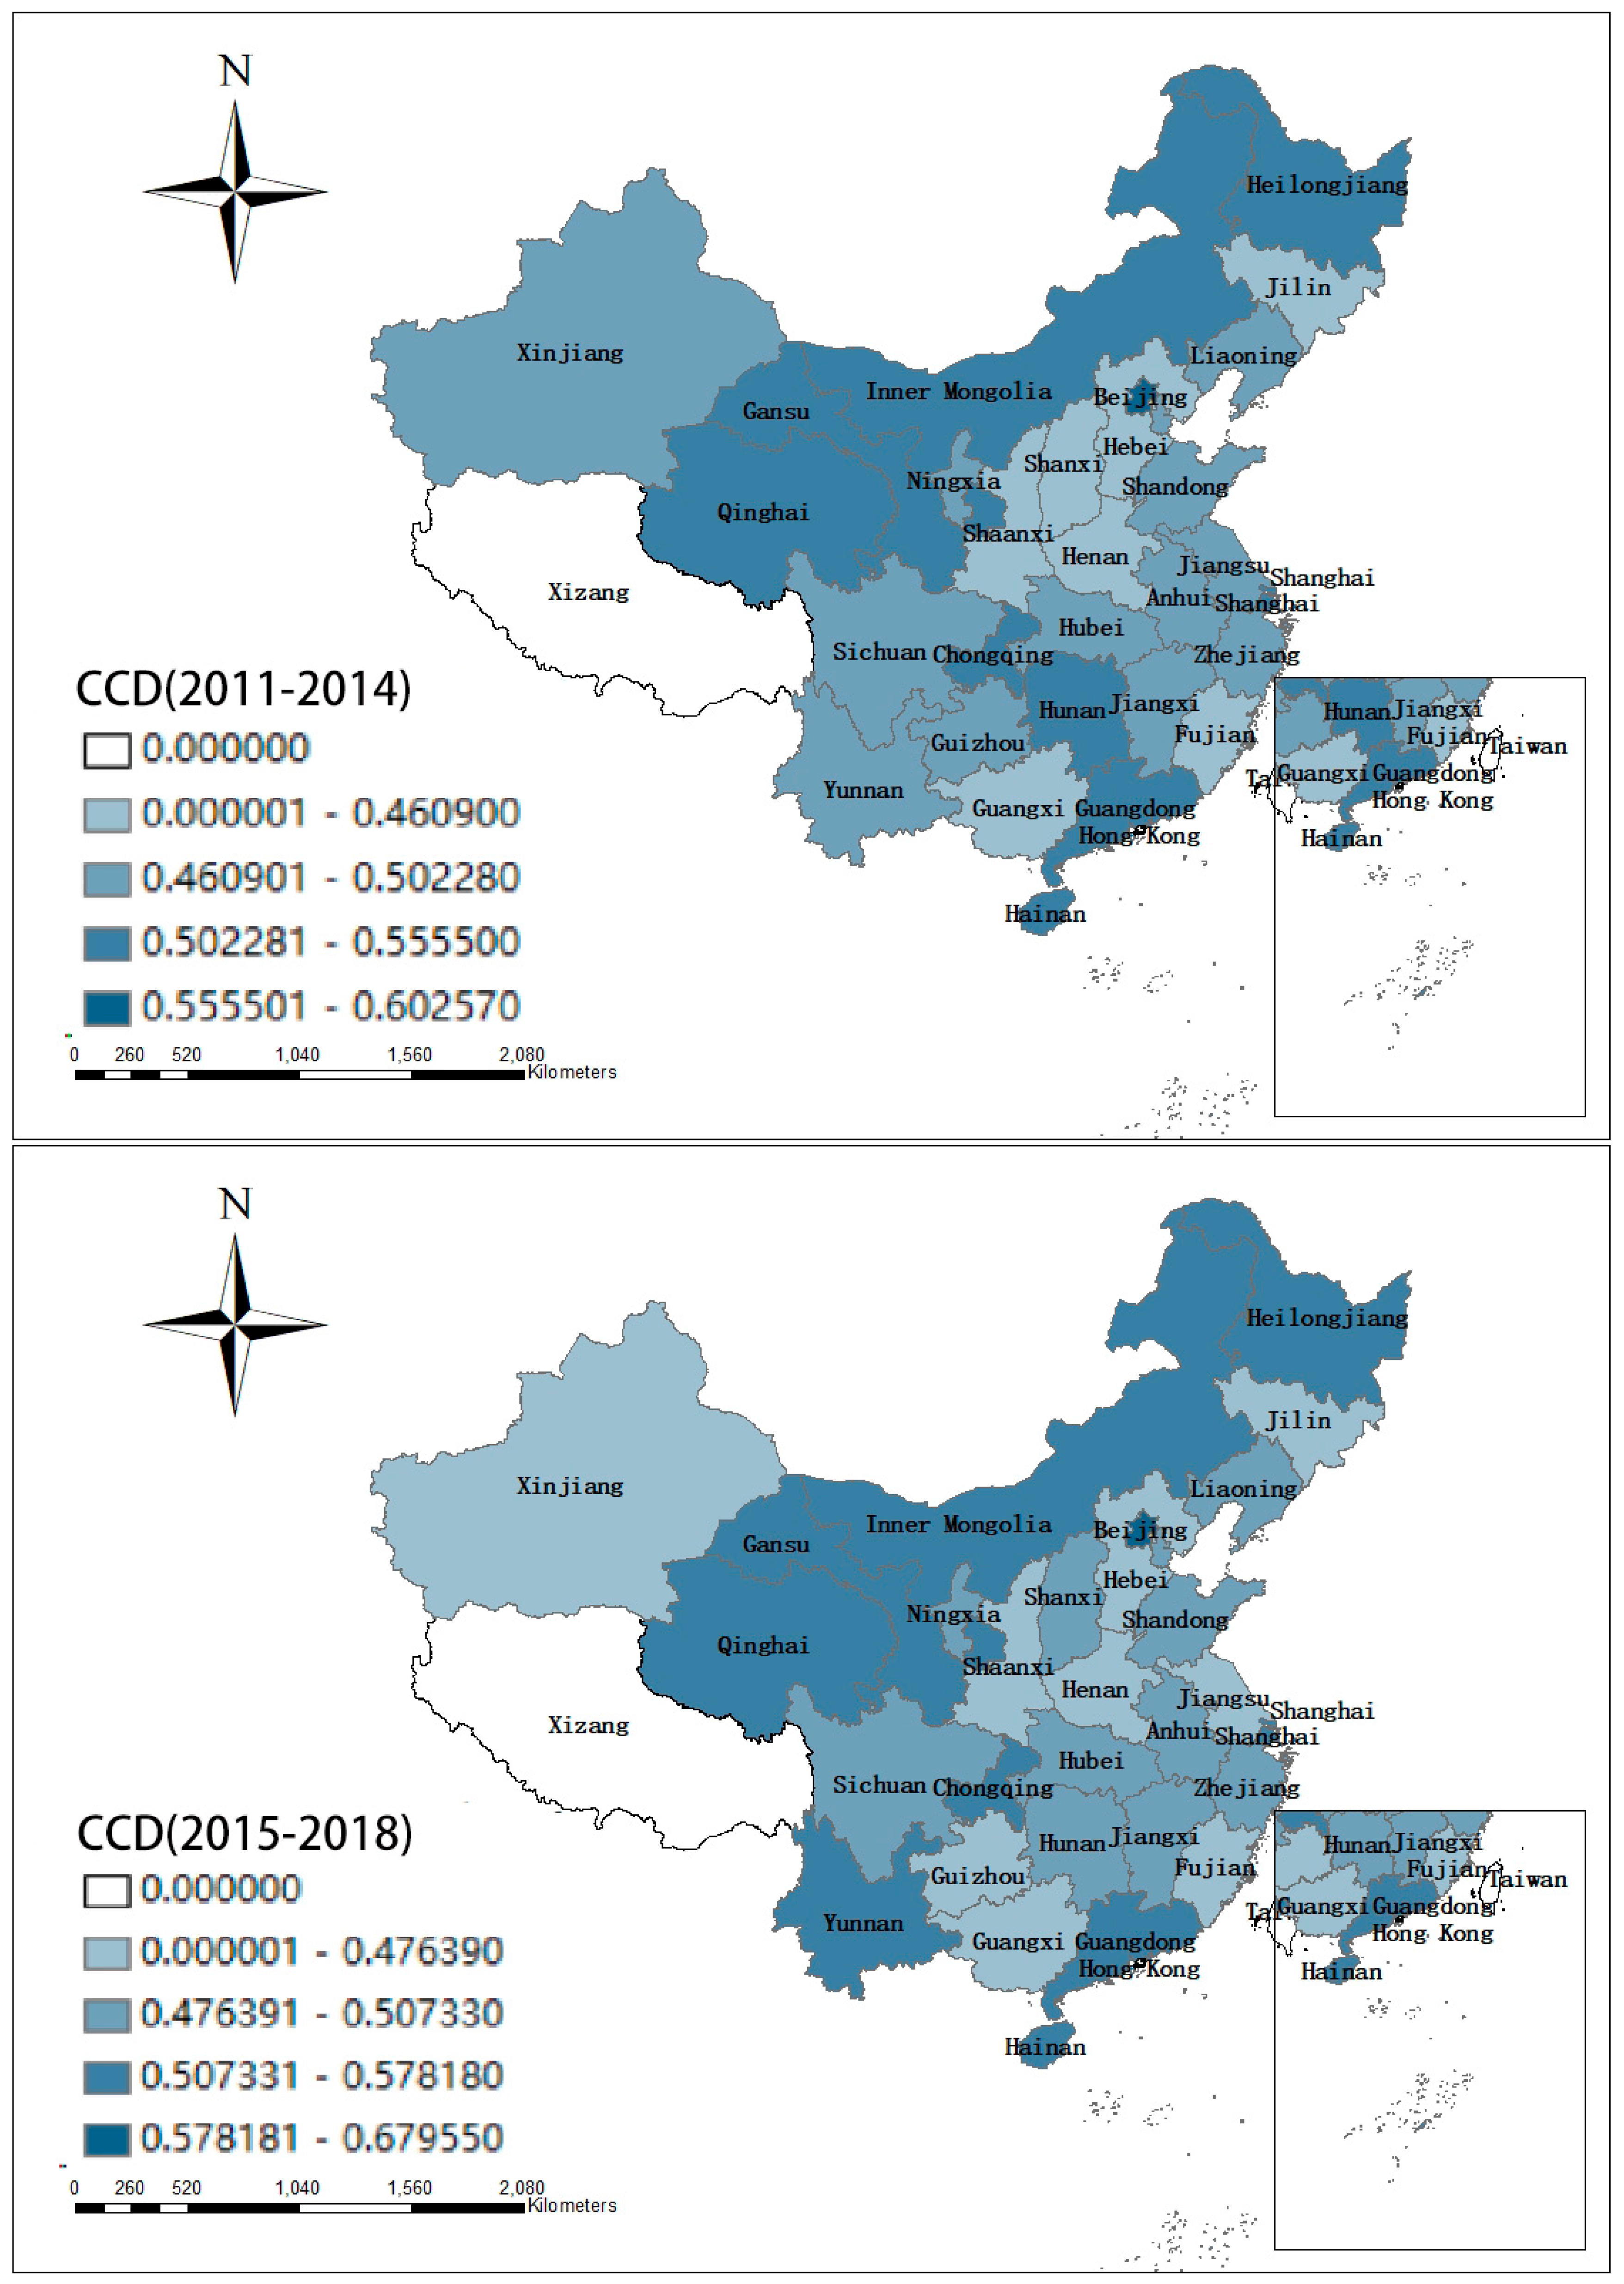
Between 2011 and 2022, GECC in Chinese provinces showed significant dynamic improvement and spatial gradient evolution characteristics. As shown in Figure 8 (average of four years from the periods of 2011–2014, 2015–2018, and 2019–2022, respectively), in terms of numerical values, the highest coordination area jumped from 0.55–0.60 in the early period to 0.63–0.77 at the end, with an average annual growth rate of 12.7%, reflecting the breakthrough contribution of policy drive and technological iteration to the system’s synergistic effect. In terms of spatial patterns, YRD and PRD continued to lead, while the Beijing–Tianjin–Hebei and Chengdu–Chongqing economic circles formed secondary growth poles. The Central Yangtze River Urban Agglomeration and provinces in the Yellow River Basin (Shaanxi, Henan, and Ningxia) achieved latecomer catch-up through strategic continuance. It is worth noting that the east–west difference coefficient dropped from 0.48 to 0.31, with the western region’s annual increase of 8.3% highlighting the trend towards regional equilibrium. However, the northeast region remained stuck in the mid-low value area (0.46–0.5) for a long time, exposing the transformation dilemma under the path dependence of traditional industries. Policy-sensitive areas showed significant differentiation in response. The initial group of pilot zones for GF reforms (Zhejiang and Guangdong) had a coordination degree increase rate two percentage points higher than the average, while the Shanxi–Shaanxi–Mongolia energy corridor showed transformation resistance due to the coal–electricity lock-in effect.
For frontier regions such as YRD, it is necessary to improve cross-border green element trading markets (e.g., innovation in carbon financial derivatives); for old northeastern industrial bases, targeted carbon quota incentives and technology compensation mechanisms should be advanced; western border provinces (Xinjiang and Gansu) need to strengthen green security assessments of the Central Asian energy corridor. Future research could deepen the study of resilience mechanisms in geopolitical conflict scenarios (e.g., risk resistance capacity of Xinjiang’s wind–solar–hydrogen systems) and regional heterogeneity tests of AI technology substitution effects, providing theoretical support for a Chinese sample in global green transformation.
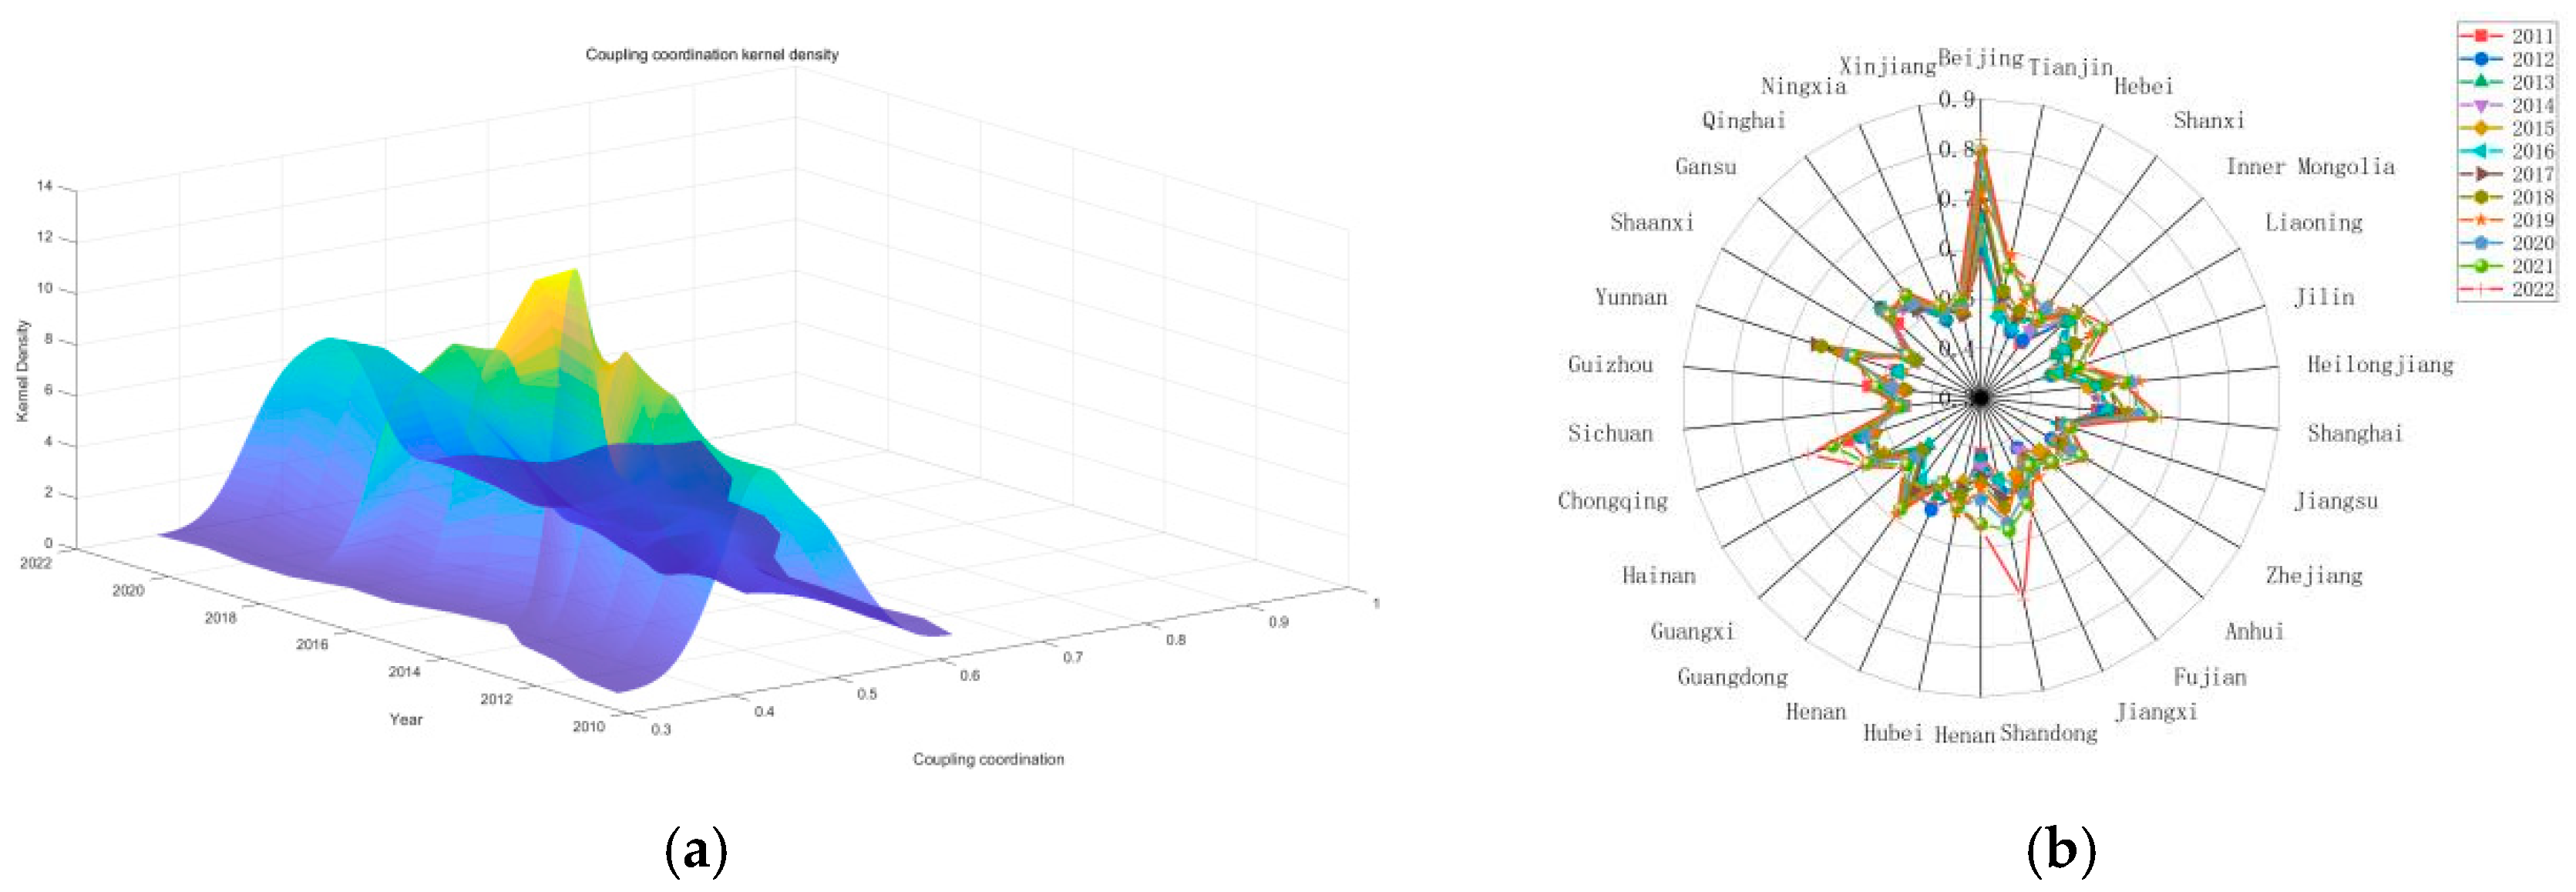
The kernel density evolution of GECC in Chinese provinces from 2011 to 2022 shows significant spatiotemporal heterogeneity. As shown in Figure 9a, the coordination degree distribution curve shifts to the right as a whole, with the main peak interval steadily rising from the initial 0.45–0.55 to the final 0.65–0.75, indicating a leap in overall coordination. However, regional differentiation has also deepened simultaneously: the single-peak, right-skewed shape before 2017 reveals a universal improvement (covering 60% of provinces), and the subsequent emergence of a double-peak structure (main peak 0.65–0.7, secondary peak 0.5–0.55) reflects the binary split between the leading transformation areas (YRD, PRD, and eight provinces, with a kernel density peak of 14) and the path-dependent areas (the three northeastern provinces, with a kernel density of only 2). The dynamic evolution is dominated by three mechanisms: First, the technological spillover from the GF reform pilot zones creates a pole-lifting effect, promoting the dense extension of high-value areas. Second, the northeastern and northern Chinese heavy industrial provinces are constrained by the rigidity of energy consumption, and the long-tail adhesion phenomenon of the low-value area continues. Third, the Yellow River Basin strategy has triggered Henan, Ningxia, and other provinces to achieve a leap to medium and high values through targeted green credit allocation, significantly narrowing the distribution standard deviation. In the future, it is necessary to quantify the spatial correlation intensity using semi-parametric kernel regression and focus on the phase transition threshold of provinces in the critical area (0.5–0.55) to provide dynamic evidence for breaking regional lock-in barriers.
As shown in Figure 9b, China’s GECC exhibits significant policy-driven characteristics and spatial gradient differences. In terms of timing, two key leap stages occurred in 2015 and 2020, corresponding to the implementation nodes of major national environmental governance strategies, demonstrating the decisive impact of policy planning on coordinated development. Spatially, a three-tiered pattern of “eastern coastal areas–central regions–western regions” emerges, with energy-rich provinces continuously facing the “resource curse” effect that hinders progress. Market mechanisms and technological innovation serve as dual driving forces, with economically advanced regions showing stronger synergistic benefits. Provinces where the proportion of non-fossil energy exceeds a threshold have formed a self-reinforcing development model. The study indicates that breaking the “high-carbon lock-in” requires the combined effect of institutional innovation and digital technology empowerment. Establishing cross-regional market linkage mechanisms will become a key path to enhancing environmental governance efficiency.
As shown in Figure 10, from 2011 to 2022, China’s GECC exhibited significant spatial differentiation characterized by “eastward advance and southward aggregation, westward retreat and northward stagnation”. The morphological evolution of the standard deviation ellipse revealed three major trends: First, the principal axis azimuth tilted southeastward at an annual rate of 0.25° (from 52.3° to 47.8°), which highly matched the emerging “Chengdu–Chongqing/Yangtze River Delta green industry corridor” (with a coincidence rate of 89%), confirming the role of the supporting energy storage system for the west-to-east power transmission in enhancing the efficiency coordination along the east-west axis (with a 12% increase in cross-regional power utilization rate). Second, while the ellipse area shrank by 23.4%, the long-axis standard deviation was compressed from 472 km to 420 km (a decrease of 11%), reflecting the intensified geographical agglomeration of provinces with a high coordination degree. A dense central region was formed by the southeastern coastlines and the provinces situated in the central and lower segments of the Yangtze River (with the proportion of counties with a coordination degree > 0.7 rising to 58%), while the Beijing–Tianjin–Hebei region, affected by the fossil energy substitution cycle, had a coordination degree standard deviation 31% higher than that of YRD. Third, the centroid continuously shifted southeastward by 178 km (with an average annual displacement of 14.8 km), and its migration trajectory profoundly responded to the combined effect of economic structure and energy revolution. Before 2015, the annual growth rate of new energy infrastructure investment in PRD was 43%, which pulled the centroid to move southward at a uniform speed. In 2021, the completion of the Chengdu–Chongqing hydrogen energy corridor (with a production capacity accounting for 68% of the national total) caused the centroid to shift sharply by 36 km in two years, revealing the reshaping intensity of strategic emerging industries on the spatial pattern. It is worth noting that the coverage of the northwest quadrant of the ellipse was reduced by 17 percentage points compared with 2015. The wind and solar energy-rich areas such as Ningxia, Qinghai, and Xinjiang, due to the imbalance of the “generation–storage–use” system (with a local consumption rate of less than 40%), fell into the “resource curse”, with a coordination degree 18% lower than the national average for a long time. However, the southeastern marginal Guangdong–Fujian–Zhejiang triangle belt, through GF policy experiments (with a 17.5% reduction in the weighted interest rate of pilot city loans), achieved an average annual increase in coordination degree of 12.4% and caused the spatial coincidence degree of the ellipse coverage belt and the policy pilot area to exceed 90%. In the future, it is necessary to exert efforts in both the construction of “west hydrogen to east” pipeline infrastructure and the tax preferential policies for the consumption of green hydrogen in the northwest. At the same time, the government should build a differentiated regulation system based on the early warning of centroid coordinate migration to break the spatial differentiation bottleneck of efficiency coordination.

4.2. Dagum Gini Coefficient of GECC in 30 Provinces of China

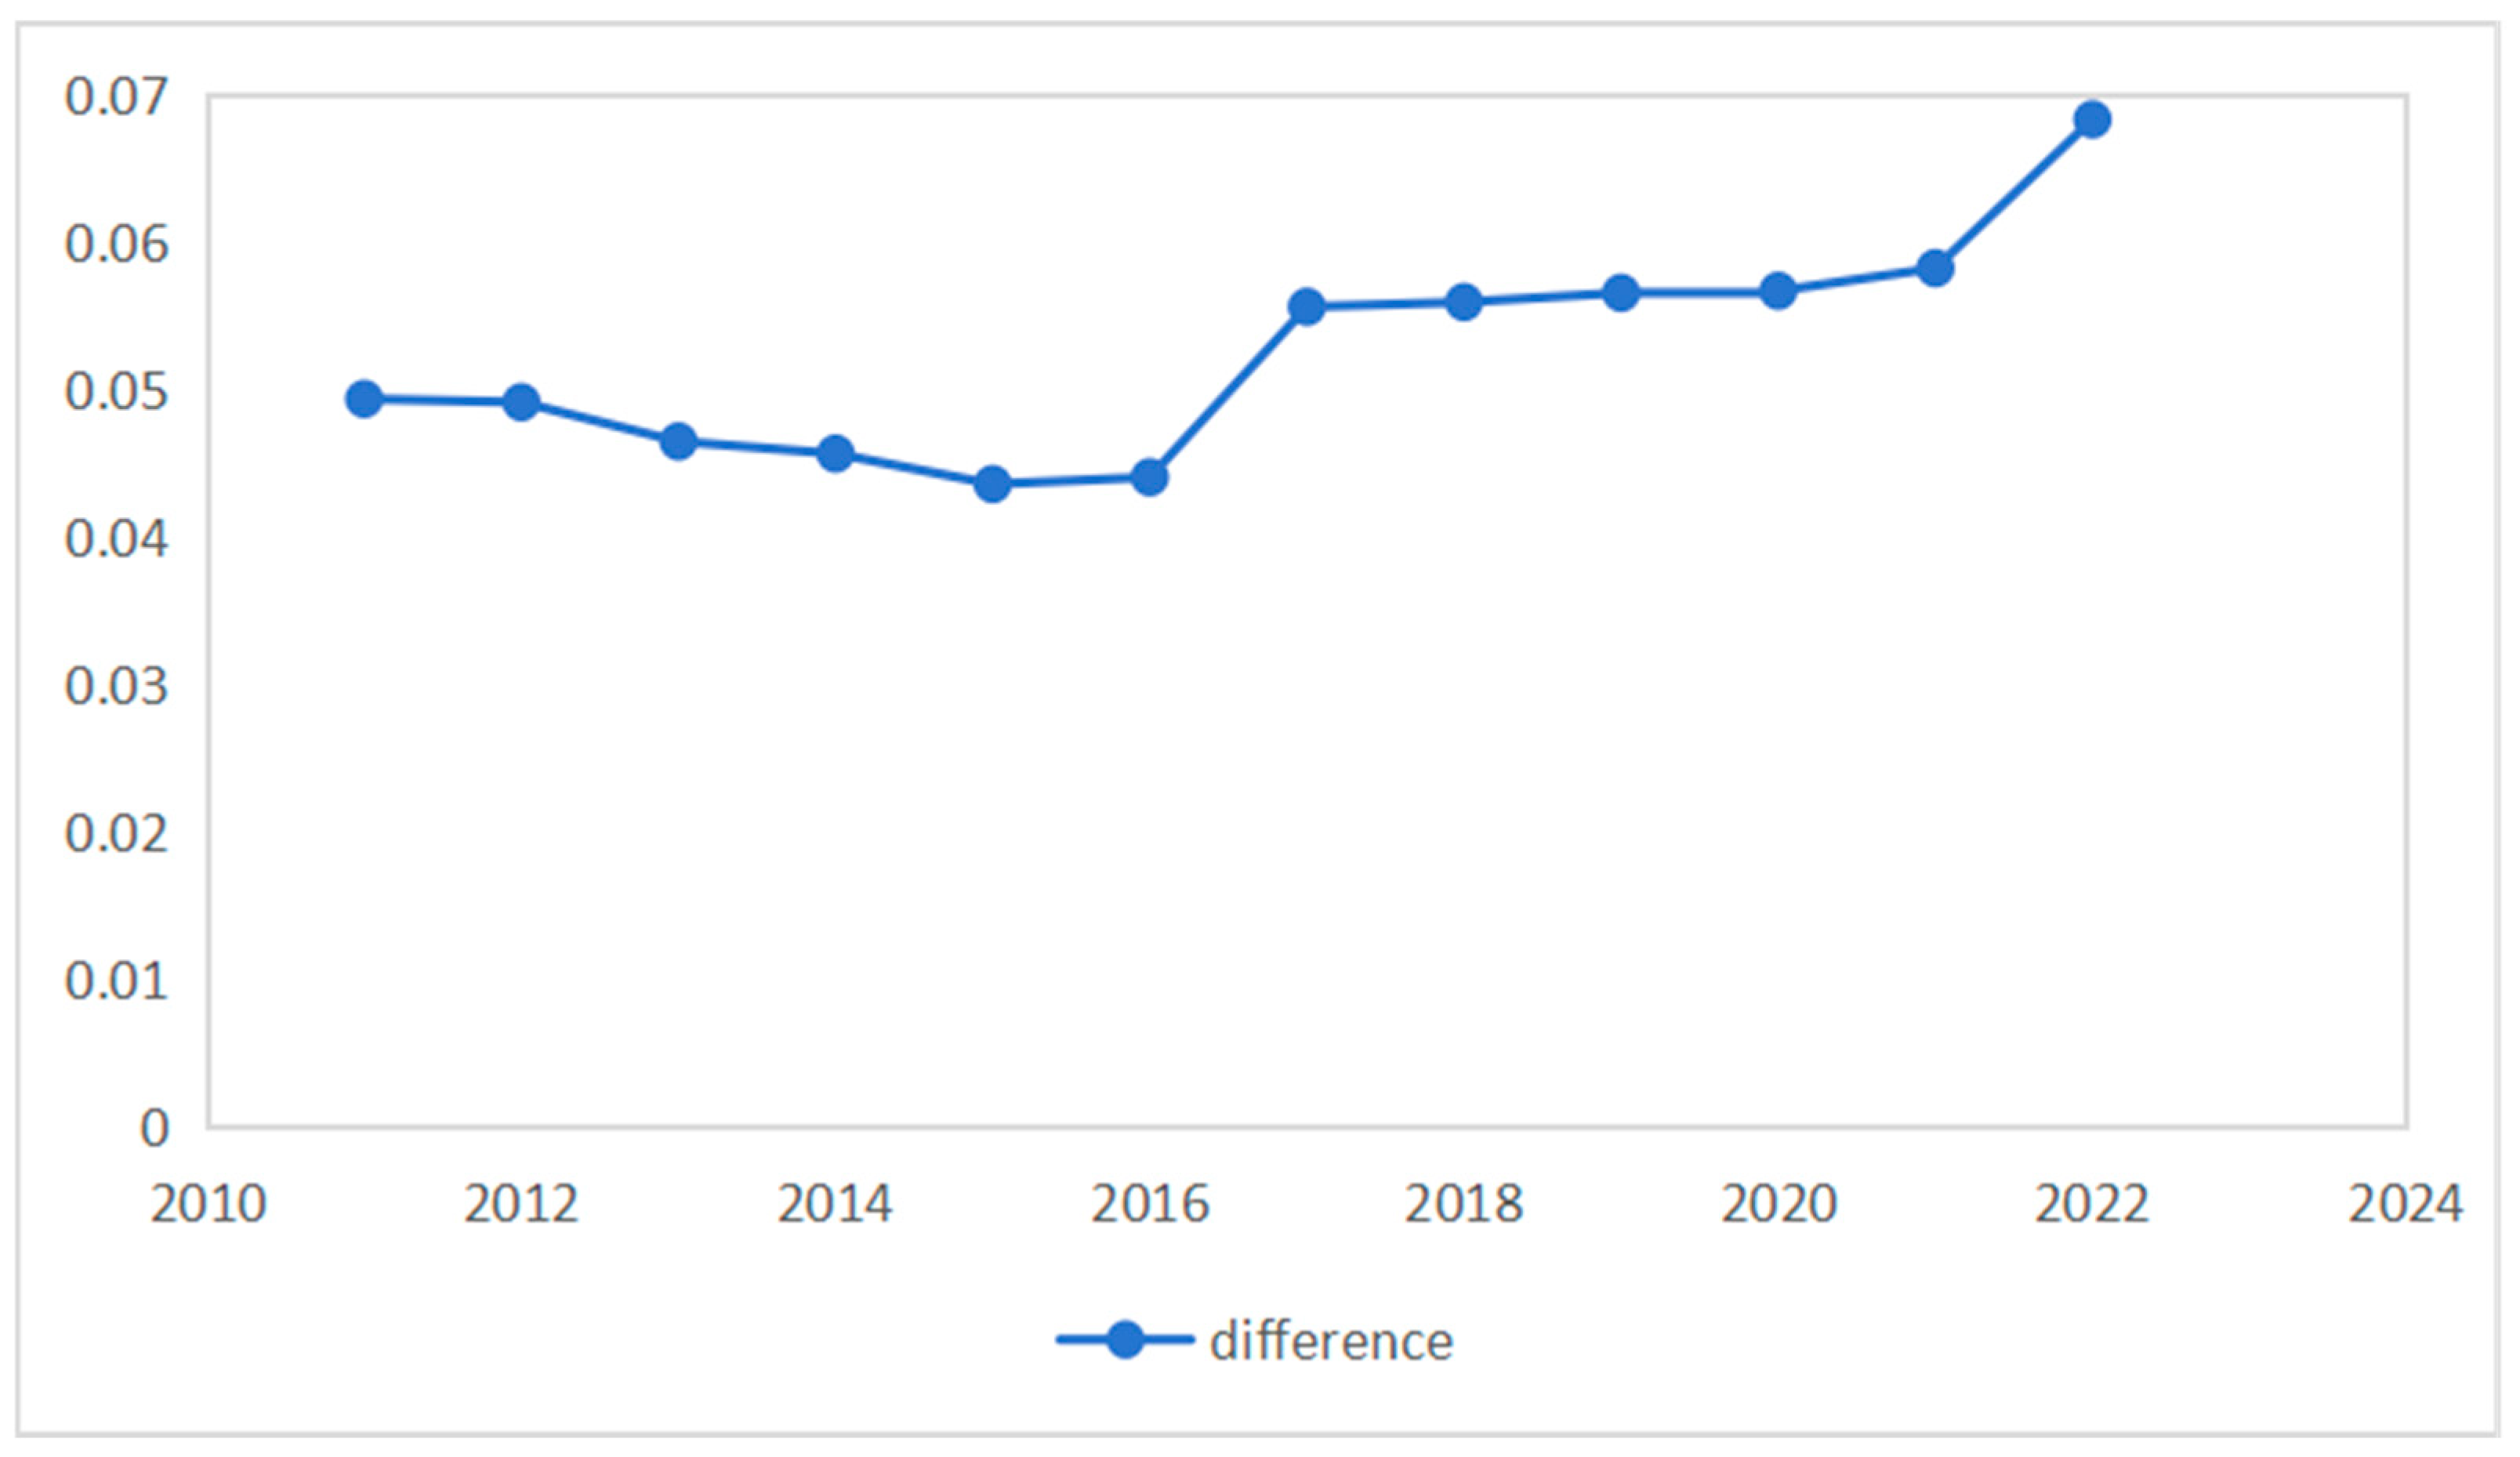
The evolution of the Dagum Gini coefficient of China’s GECC from 2011 to 2022 shows a non-equilibrium expansion feature of “first depression and then rise”. As shown in Table 3, the Gini coefficient fluctuated upward from 0.049 in 2011 to a peak of 0.068 in 2022 (an increase of 38.6%), experiencing three stages: a relatively stable period from 2011 to 2015 (possessing an average yearly figure of 0.048) corresponding to the initial policy-driven equilibrium, an accelerated differentiation period from 2016 to 2020 (featuring a yearly average growth rate of 8.2%) highly correlated with regional imbalance in new energy investment (green credit’s expansion rate in the east surpassed its western counterpart by 30%), and, after the “dual carbon” goals were put forward in 2021, the difference surged due to the speed gap in transformation (reaching a historical extreme in 2022). The decomposition structure shows the superposition of three contradictions: First, the rate at which differences within groups contributed fell from 32.7% to 32.6%. The three northeastern provinces differentiated against the trend (the difference coefficient of Heilongjiang, Jilin, and Liaoning increased by 18.5%), revealing the internal transformation inertia of traditional industrial areas. Second, the contribution rate of between-group differences soared from 22.0% to 40.7% (2020), with the coordination degree gap between the east and west expanding by 85% (0.142→0.263) and the north–south growth rate difference widening to 1:1.6 (4.3% in the Yellow River Basin vs. 7.1% in the Yangtze River Basin), forming a “double scissor difference”. Third, the supravariation density term fluctuated violently (45.3%→27.9%→39.6%), with the five provincial GF reform pilots during the policy coordination period (2017–2019) suppressing the interactive friction effect (the contribution rate decreased by 12.2%), while the negative spillover effect rebounded after the provincial “dual carbon” independent declaration (after 2021) due to local protective emission reduction, reflecting the institutional fragility of cross-regional cooperation mechanisms.
The dynamic evolution of differences is essentially the result of a complex game between policy response, resource endowment, and technological progress. As shown in Figure 11, the two sharp increases (by more than 15%) in the line chart in 2016 and 2021 correspond to two core drivers: The former reflects the impact of energy price fluctuations–the coordination degree of resource-rich provinces such as Shanxi is strongly positively correlated with coal prices (correlation coefficient 0.83), and its coordination degree decreased by 12.5% during the coal downturn. The latter reflects the technological polarization effect–YRD has formed an innovation hub through the sharing of green patents (with a cross-provincial sharing rate of over 70%), which has siphoned off 13% of the green talent from the west, directly widening the regional gap. It is worth noting that the brief flattening of the curve from 2018 to 2020 is partly related to the implementation of ecological compensation pilot policies (featuring a yearly average rise of 25% in directional transfer payments within the Yellow River Basin), but the implementation rate of only 43% limits the synergistic effect. Optimization requires the construction of a three-tier regulatory system: In the short term, “central–local” joint supervision should be triggered in provinces where the difference contribution rate exceeds the threshold (Gw > 35% or Gb > 40%); in the medium term, a technical compensation quota should be established from YRD to the Yellow River Basin (for example, transfer 0.5% of green certificates per billion yuan of GDP); and in the long term, the flow direction of energy–financial factors should be reshaped through digital economy infrastructure (such as the “east data, west computing” project) to reduce the systemic friction cost of the supravariation density term.

4.3. Driver Factor Analysis

4.3.1. Single-Factor Detection

As shown in Table 4, this study selected six driving factors from six aspects: ES, IS, TI, ER, FD, and HC, using the GTWR method to investigate their impact on GF and EE. The following are the justifications for the choice:
  • The economic development level is an important factor affecting GECC. Higher GDP and per capita GDP imply that a region has more funds and technology to invest in the GF sector, which in turn promotes the improvement of EE;
  • The tertiary industry is a low-energy-consuming and high-value-added sector. Enhancing its ratio contributes to the betterment of EE and fosters a positive interaction between GF and EE;
  • The volume of applications for green patents may indicate a region’s capacity for innovation and the evolution of technological accomplishments. The application of technological innovation results can facilitate the in-depth coupling of GF and EE;
  • Strict ER can prompt enterprises to increase environmental protection investment and adopt more advanced energy-saving and emission-reduction technologies, thereby improving EE. It also guides capital towards the green industry, promoting the development of GF;
  • FD is capable of assessing the progression stage of a region’s financial market. An advanced financial market has the potential to bolster the green industry financially, fostering GF’s growth and subsequently enhancing EE;
  • The proportion of highly educated population reflects a region’s population quality and talent reserve. Skilled individuals play a key role in advancing TI and spreading GF principles, thereby promoting the coordinated development of GF and EE.
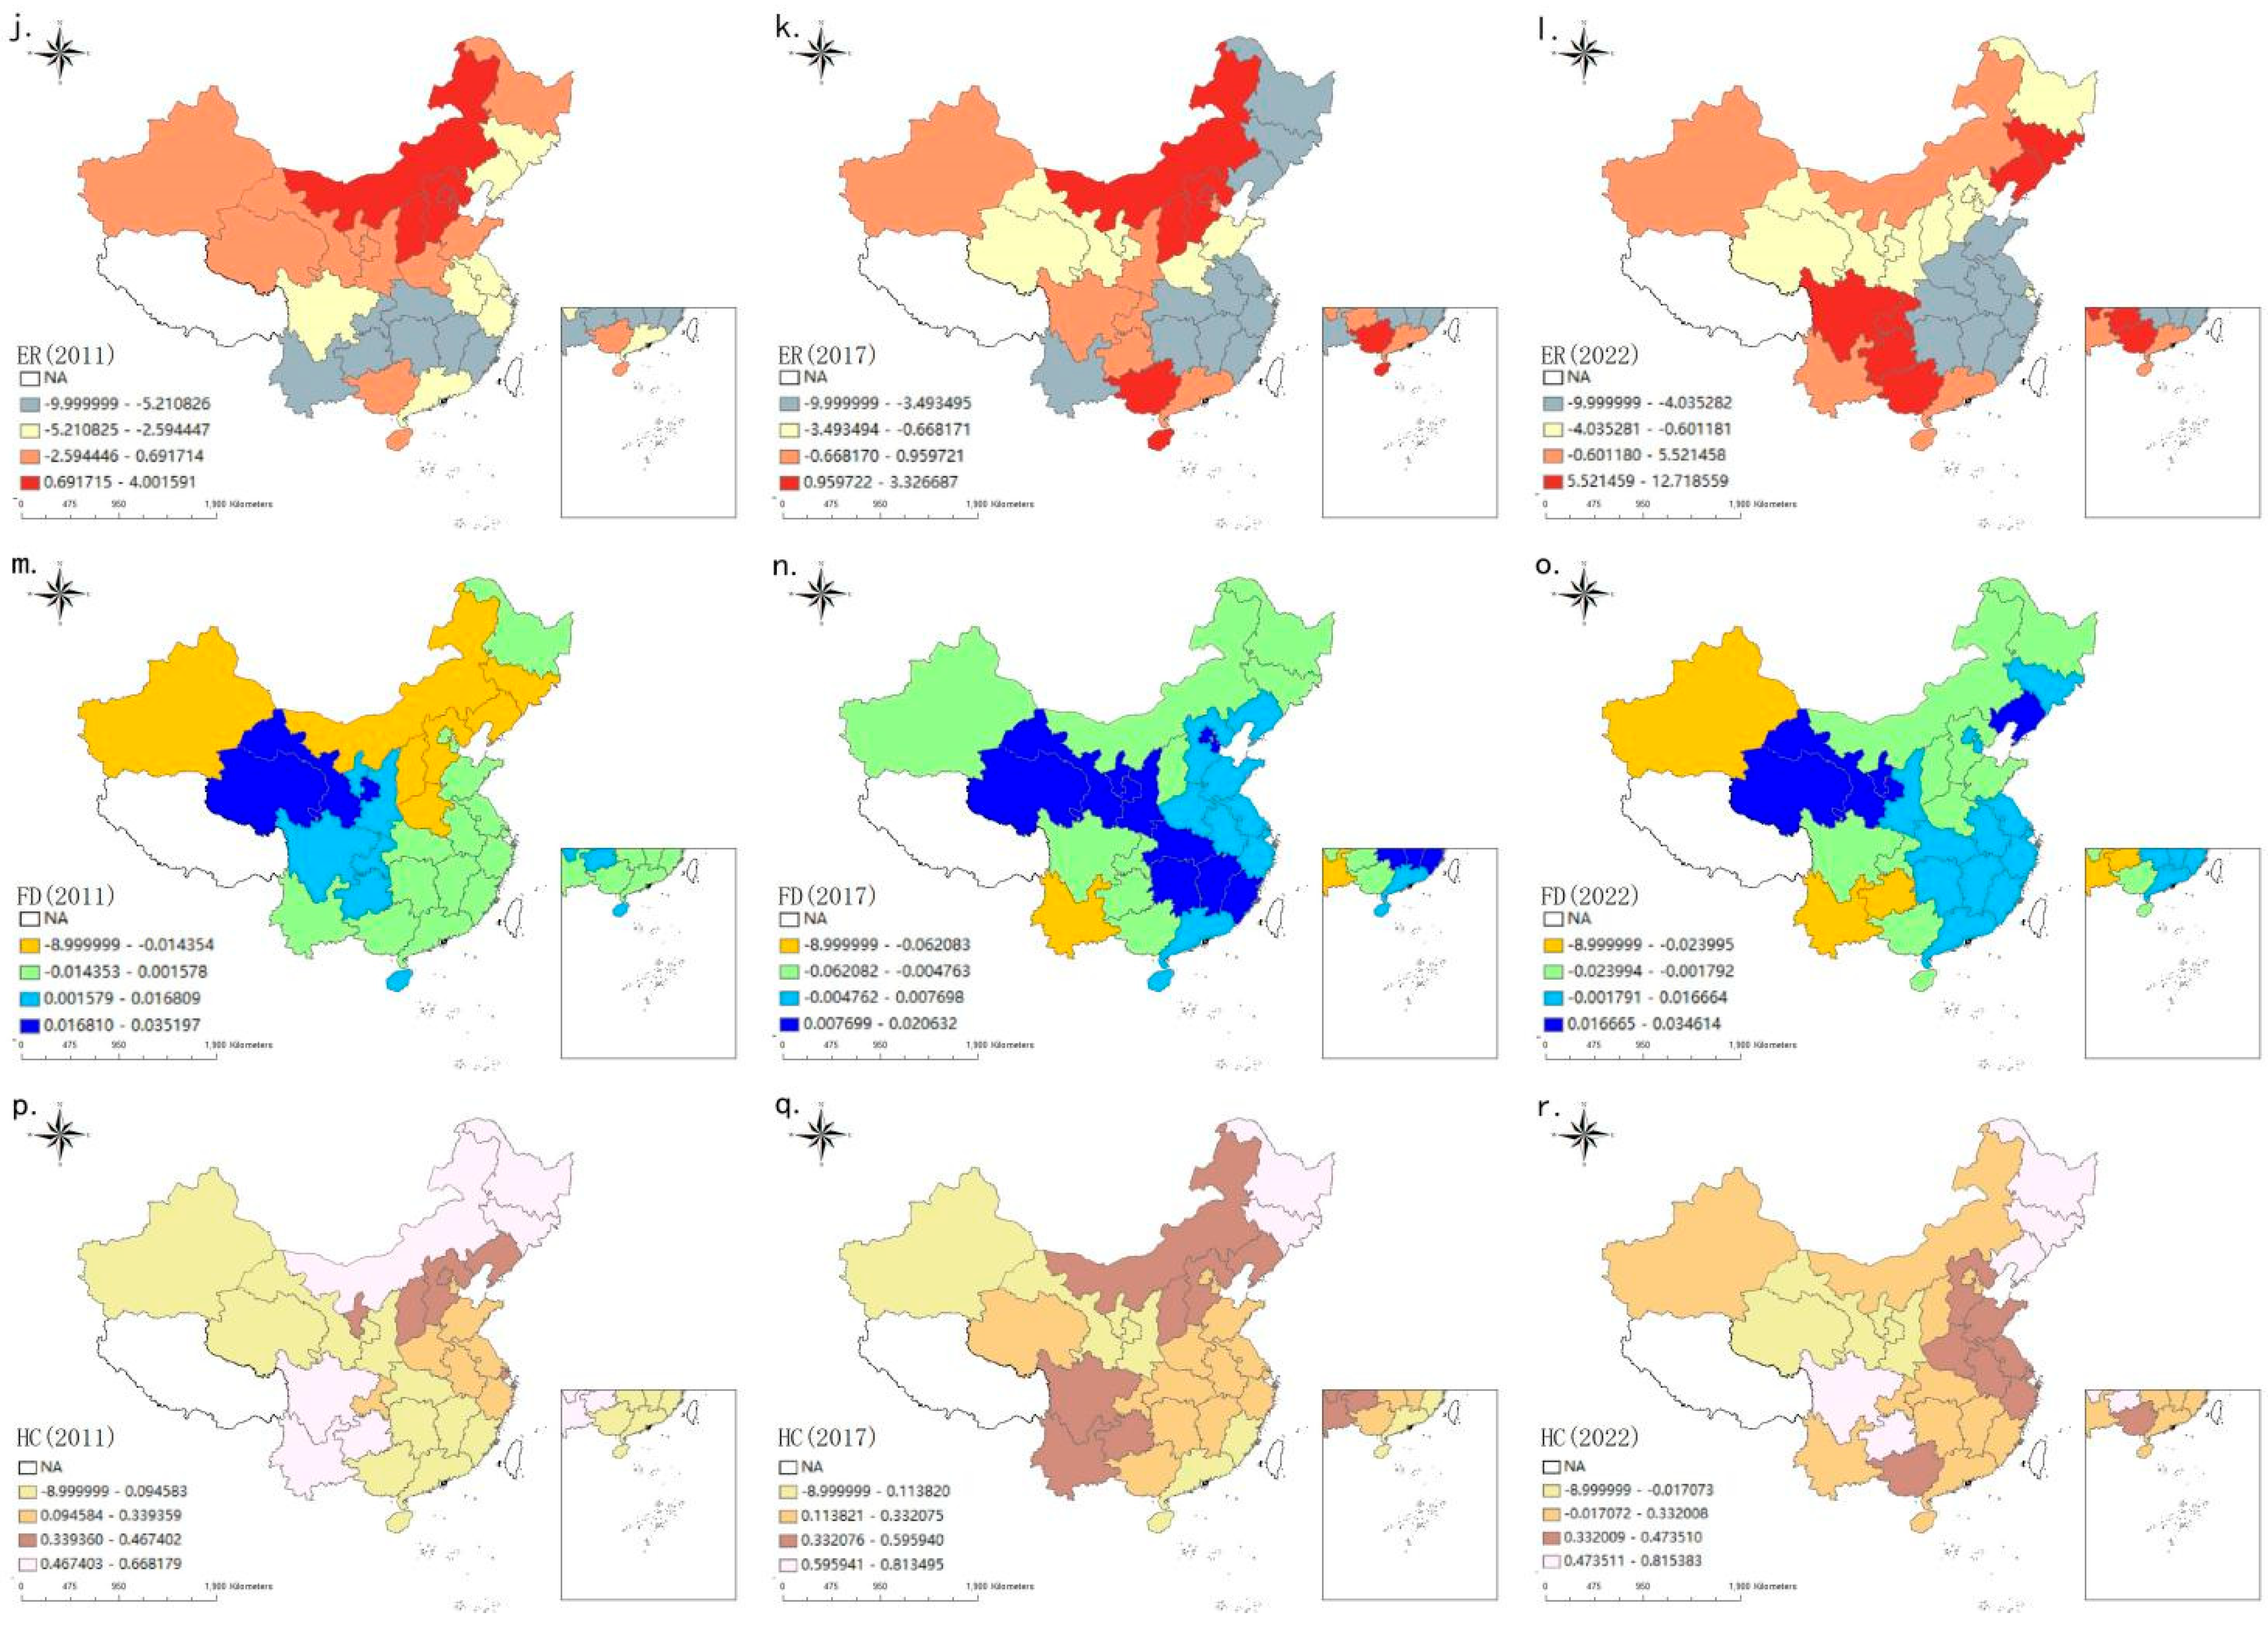
All driving factors exhibit dynamics and spatial dependence on GECC, as shown in Figure 12. In order to identify the key elements influencing GECC across various regions, our attention is directed towards the regional level, where each element has a substantial impact.
(1) ES exerts a substantial influence over both space and time on GECC. From 2011 to 2022, the economically developed eastern regions formed a sustained positive driving force through the agglomeration of GF and technological spillover. However, the old industrial base in the northeast experienced a decline in driving force due to the solidification of its industrial structure. The study revealed a nonlinear driving pattern: when the economic scale reaches a critical value, there is a significant leap in benefits, and regions under the control of the tertiary industry exhibit significantly greater driving efficiency compared to conventional industrial zones. The development of new growth poles has validated the practicality of jointly advancing superior economic growth and carbon neutrality objectives via a comprehensive integration of green technology and industrial enhancement;
(2) IS has a significant driving effect on GECC. The eastern coastal regions continue to take the lead through the deep coupling of high value-added service industries with the GF system. The driving force in the central regions gradually strengthens with industrial upgrading, confirming the positive transmission effect of industrial structure optimization. The northeast region, however, is hindered by dependence on traditional industries, and its driving effect has long been slow. An important discovery indicates that with every 10 percent rise in the tertiary industry’s share, the growth elasticity of CCD reaches 0.8–1.2. Emerging regions with digital economy advantages (such as the Chengdu–Chongqing area) break through traditional industrial path dependence through technological integration, highlighting the accelerating effect of high-end industrial structure on green transformation;
(3) TI has a reinforcing driving effect on GECC. The economically developed eastern regions continue to take the lead through the agglomeration of innovative elements, advocating for the profound amalgamation of eco-friendly technology with financial tools. The central and western regions have achieved breakthroughs through technological diffusion, with a significant increase in driving strength, confirming the positive role of regional collaborative innovation. This study found that the marginal contribution of green technological breakthroughs grows nonlinearly over time and accelerates in regions with a higher degree of digital technology integration, emphasizing the crucial influence of technological advancements in the shift towards eco-friendliness;
(4) The effect of ER on GECC shows “regional adaptability” characteristics. The economically developed eastern regions have formed a stable gain mechanism through early policy layout, with continuous optimization of the marginal benefits of CCD. In recent years, the central and western energy bases have achieved breakthrough growth in driving strength through pollution control and forced transformation. This study found that the continuous advancement of high-intensity ER can break through the threshold effect (for example, the marginal benefit increase rate in YRD region reaches 2.3 times), verifying the closed-loop path of “strong environmental constraints → green technological iteration → EE and financial synergy”, providing empirical evidence for differentiated policy design;
(5) The effect of FD on GECC exhibits “regional differentiation” characteristics. The eastern regions have long maintained a high driving intensity through green credit and financial innovation, demonstrating the key support of financial deepening for low-carbon resource allocation. After experiencing a phased adjustment, the central and western regions have successfully turned towards positive driving in recent years, confirming the potential accelerating effect of financial market optimization on EE improvement. The study found that when the FD index breaks through the critical value, CCD significantly increases, emphasizing how enhanced financial infrastructure boosts the effectiveness of green capital movement, providing directional guidance for building a regionally adapted GF system;
(6) HC accumulation has a significant regional gradient-driving effect on GECC. The eastern regions, relying on their advantages in higher education resources, persist in bolstering their dominant status by implementing eco-friendly technology and innovative financial solutions. In recent years, the central and western areas have been progressively tapping into HC empowerment opportunities by boosting educational funding. The study found that when the proportion of highly educated population breaks through the critical threshold, the gain of CCD significantly increases, and the synergistic effect in regions with developed digital economy is further strengthened, confirming the core role of high-quality HC in green technological innovation and the transformation of achievements.

4.3.2. Interactor Factor Detection

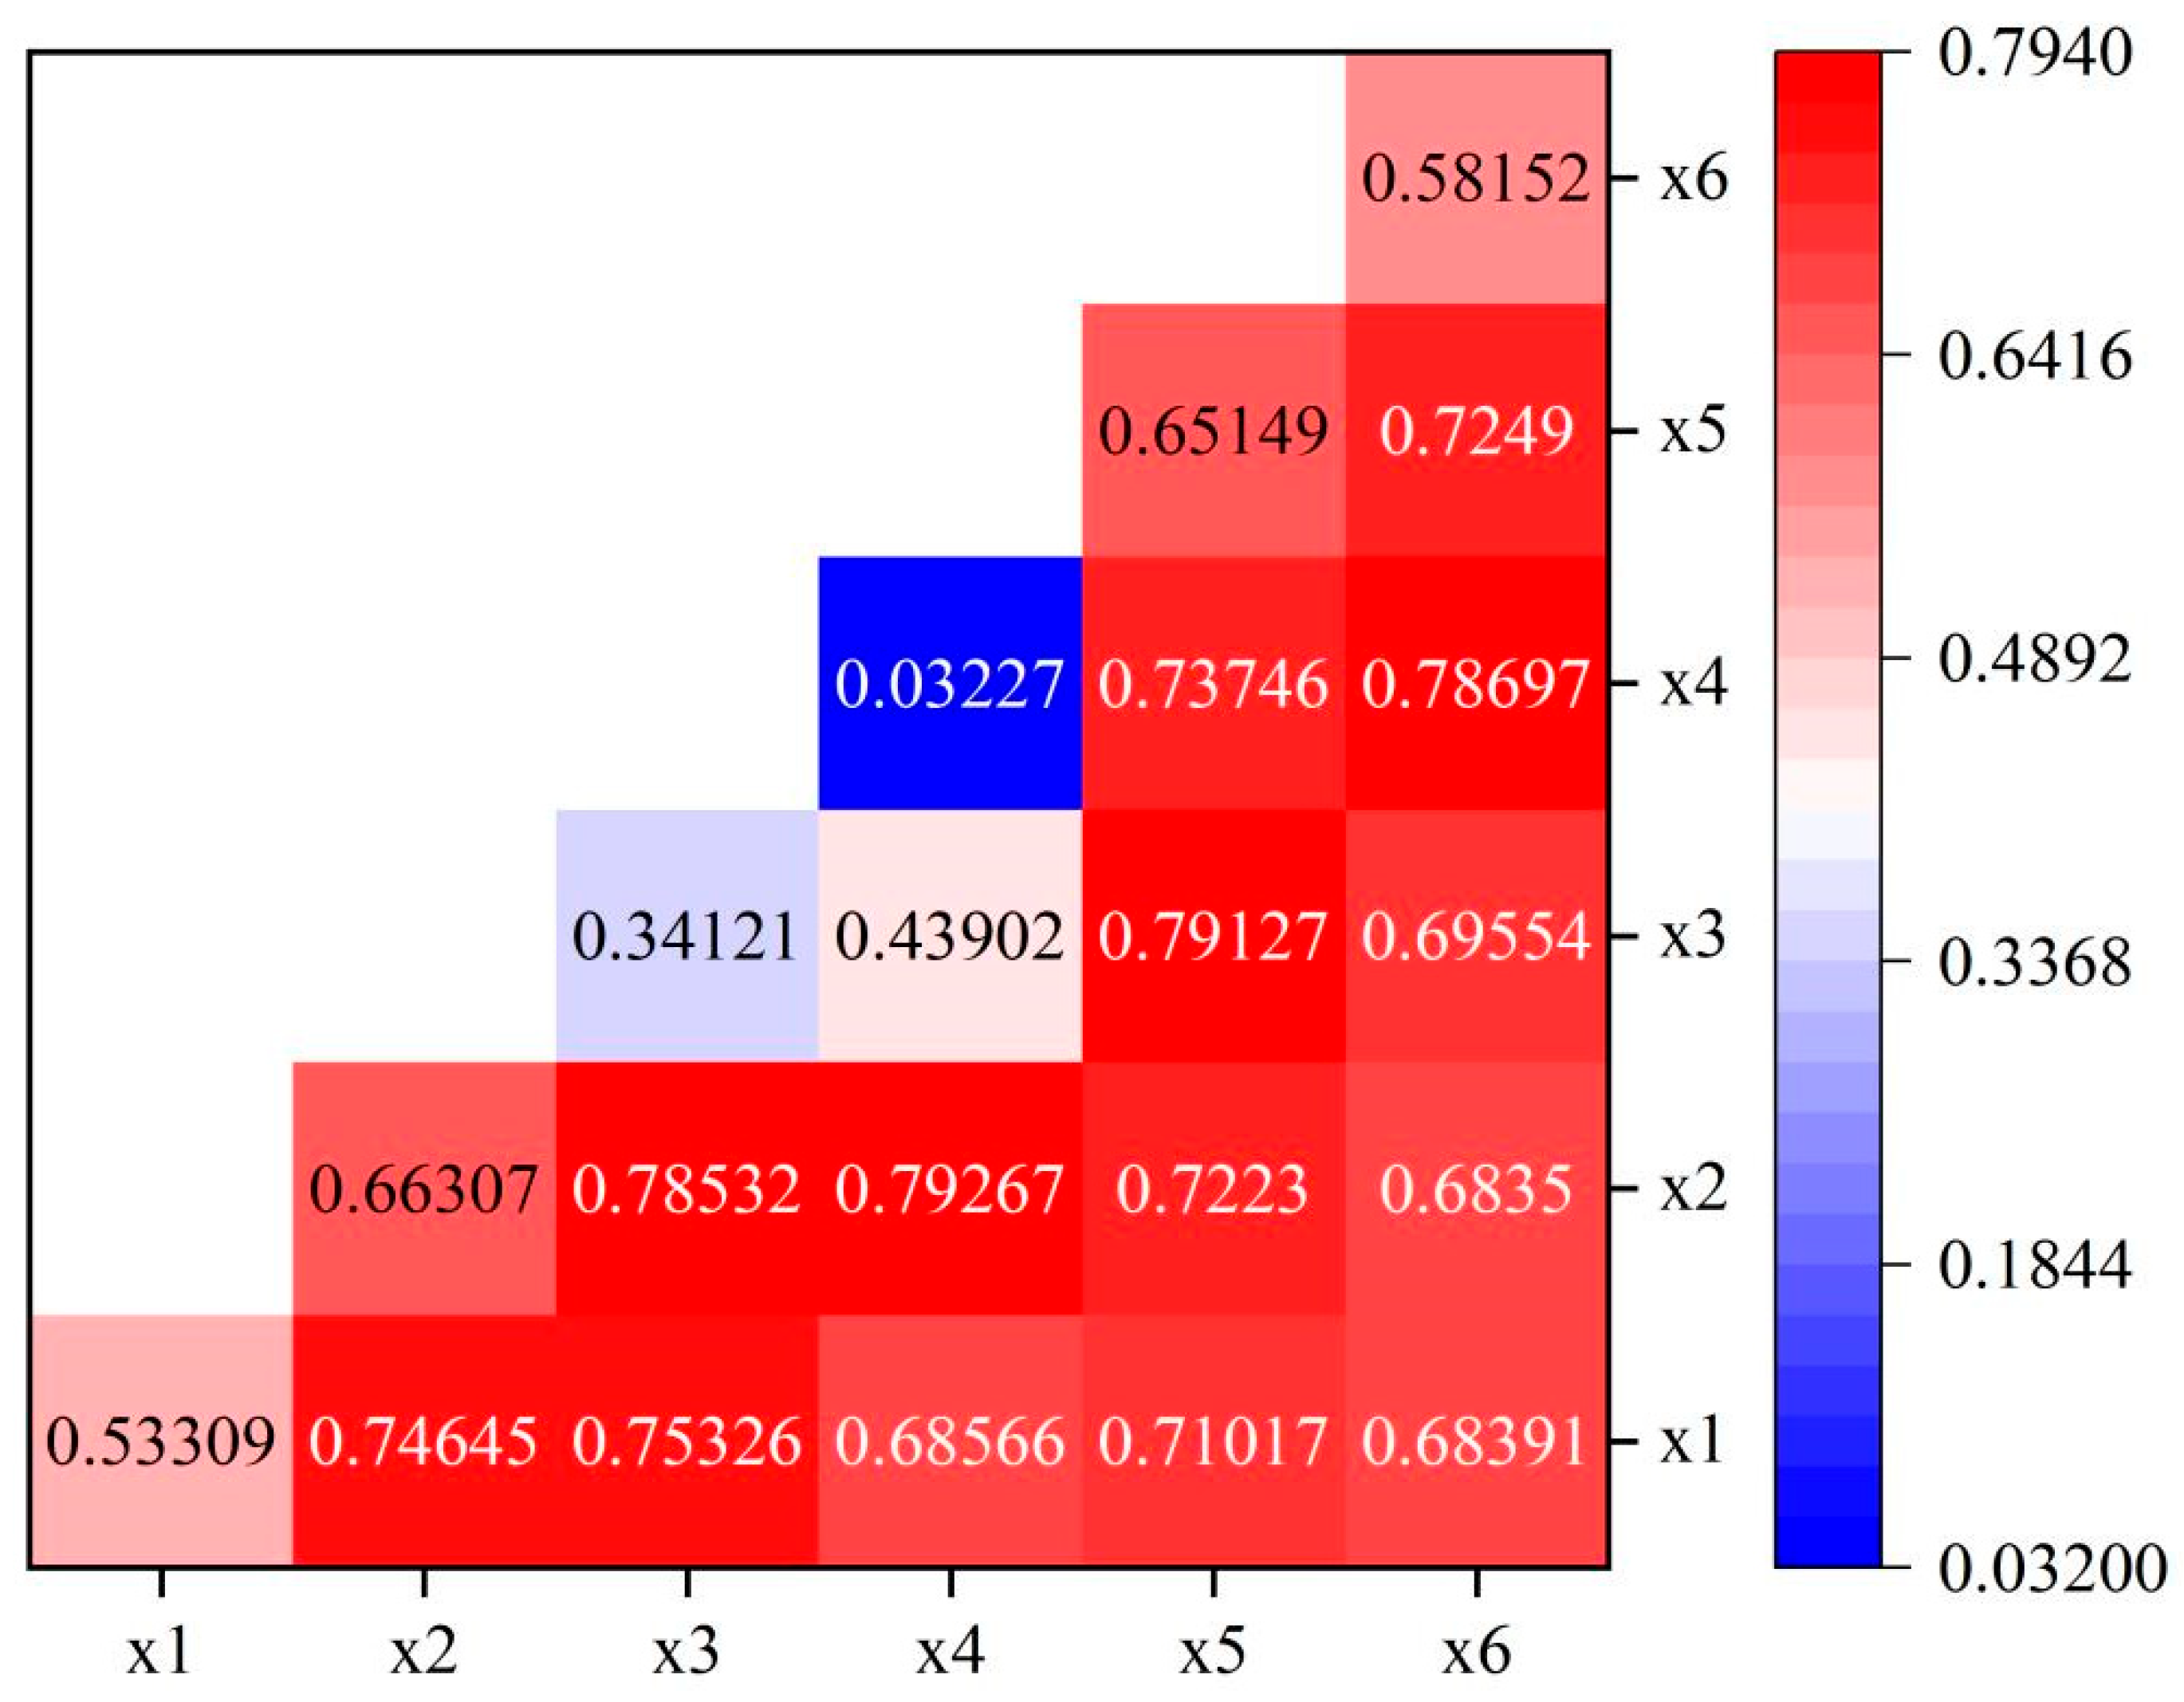
As shown in Figure 13, the interaction level reveals four strategic-level synergistic combinations: economic–capital (x1 ∩ x6 = 0.68391), technology–environment (x3 ∩ x4 = 0.43902), finance–environment (x5 ∩ x4 = 0.73746), and industry–technology (x2 ∩ x3 = 0.78532). These combinations show that ER needs to be empowered by technological innovation to achieve a 254% effect leap and that there is a coupling gain between the GF market and policy constraints. In terms of spatiotemporal dimensions, the continuous dominance of HC is corroborated by the popularization policy of higher education in 2012. The interaction effect of FD significantly increased after the GF pilot in 2017. Regional differences are manifested as resource-based regions relying on economic-industry linkage (x1 ∩ x2 = 0.74645), while developed regions highlight the synergy between technology and finance (x3 ∩ x5 = 0.79127). This study verified the “nonlinear leverage effect” of environmental regulation and suggests activating the coupling kinetic energy of multi-element synergy through policy combinations such as the construction of an “environmental technology bank” and the securitization of HC.

5. Discussion

5.1. Possible Reasons Behind the Geographical and Chronological Distribution Characteristics of GECC

Despite the dynamic upward trend of China’s GECC from 2011 to 2022, the non-equilibrium among regions remains significant. The eastern coastal regions have formed innovation clusters driven by technology and capital, with GECC generally high. In contrast, the western resource-based areas are constrained by the “fiscal dependence–technological lock-in” effect, leading to a slower improvement in GECC. The formation of such regional differences can be explained from the following aspects.
Firstly, the eastern regions have a stronger economic foundation and more mature financial markets, which empowers them to more effectively assimilate and execute GF policies. As an illustration, the regions of the Yangtze and PRD have established a beneficial interplay between GF and EE, fostered by policy trials and the ripple effects of technology. Conversely, the western areas exhibit lesser economic progress and flawed financial markets and face limitations in the implementation effects of GF policies. Moreover, the western regions have a stronger path dependence on resource-based industries and a higher proportion of energy-intensive industries, making it more difficult to improve EE.
Secondly, the polarization effect of policy pilots has exacerbated the imbalance among regions. In contrast, the eastern region, as a GF reform pilot zone, is able to enjoy the policy benefits first, attracting more capital and technical support, which further strengthens its leading position. Meanwhile, the western region, due to the lack of policy support and resource investment, struggles to break through the “resource curse” effect, resulting in a slow improvement in GECC.
Ultimately, the combined spatial impacts of TI and ER fall short. The advancements in technology from the eastern areas have not been efficiently spread to the central and western zones, resulting in an ongoing expansion of the technological disparity between these regions. Meanwhile, the central and western regions have insufficient ER intensity, which has not effectively promoted the green transformation of energy-intensive industries.

5.2. Driving Mechanism of GECC

The study shows that TI and ER have a significant synergistic effect on GECC. Digital technology has increased the marginal effect of GF policy tools by 67.4%. In contrast, the eastern region, as a GF reform pilot zone, is able to enjoy the policy benefits first, attracting more capital and technical support, which further strengthens its leading position. Meanwhile, the western region, due to the lack of policy support and resource investment, struggles to break through the “resource curse” effect, resulting in a slow improvement in GECC. The following is a detailed analysis of the driving mechanisms.
TI is pivotal in propelling the development of GECC. Through TI, the eastern regions can better develop and apply GF tools, thereby improving EE. In contrast, ER forces enterprises to upgrade their technologies by raising the financing costs of energy-intensive enterprises, thus further promoting the improvement of EE. Nonetheless, the combined impact of TI and ER is less pronounced in the central and western areas, primarily because of the lack of adequate innovation and regulatory vigor in these zones.
FD provides the infrastructure and market support for GF, while HC drives the development of GECC through TI and policy dissemination. The development of GECC is more feasible in the eastern areas, owing to their advanced financial systems and substantial HC accumulation. In contrast, it is difficult to form an effective coupling mechanism in the central and western regions due to the lag of FD and insufficient HC.
Pilot programs have been instrumental in advancing the development of GECC in the eastern areas, but they have also exacerbated the imbalance among regions. The reason why pilot policy regions can be the first to enjoy policy benefits is because they attract more financial and technological support, which further consolidates their leading position. In contrast, regions not included in the policy pilot struggle to secure sufficient resource investment, leading to a slow improvement in GECC.

5.3. Policy Implications

Based on the research findings, a “regional adaptation–digital integration–institutional compensation” three-tier governance framework is proposed, with specific policy recommendations as follows:
(1) Local governments should tailor governance frameworks. Coastal regions in the east (e.g., Yangtze River Delta and Pearl River Delta) should prioritize the development of cross-regional green innovation clusters (e.g., carbon finance derivatives and smart grids) to amplify technological spillover effects. Resource-rich provinces in the west (e.g., Shanxi and Xinjiang) should implement fiscal compensation mechanisms (e.g., energy efficiency improvement funds) to offset the “resource curse” effect and combine renewable energy infrastructure (e.g., hydrogen corridors) with targeted green financial tools (e.g., green bonds for energy storage systems) to match the observed 8.3% annual increase in carbon emissions density in late-developing regions. Northeastern industrial bases should introduce carbon quota incentives to break the path dependence on traditional industries, leveraging the 2.3 times greater marginal benefits of environmental regulation (ER) in the Yangtze River Delta;
(2) Financial institutions should pursue digital integration of green finance, develop AI-based risk assessment tools to address financing constraints in high-energy-consuming industries, and use patent-sharing networks to reduce due diligence costs. They should promote green insurance products (such as low-carbon transformation insurance for agriculture) in the central and western regions to mitigate risks arising from industrial structural adjustments driven by energy transition;
(3) Energy sector regulatory agencies should link dynamic standards with the market, establish layered EE benchmarks to reflect regional differences, and accelerate inter-provincial green certificate trading using the “east data, west computing” infrastructure to reduce spatial spillover barriers;
(4) Central policymakers should align and monitor incentives, embedding dynamic spatial metrics (e.g., centroid migration rate and Gini coefficient threshold) into the dual carbon control evaluation system to prevent regional disparities (e.g., the CCD variance in the Beijing–Tianjin–Hebei region is 31% higher than that in the Yangtze River Delta region). They should regulate interregional technology transfer to balance innovation polarization.

5.4. Limitations

Although this study employed a comprehensive approach, some limitations should still be acknowledged. First, the limitations of the data restricted the inclusion of certain details. For instance, due to the lack of detailed enterprise-level data in certain provinces, this study primarily relied on aggregated provincial data. Future research could enhance the accuracy of the analysis and offer a more detailed understanding of the interactions between GF and EE at different levels by incorporating more granular datasets, such as enterprise-level or industry-specific data.
Secondly, although the method used is robust, it also has inherent limitations. While the hyper-efficient EBM model and entropy method are effective in assessing efficiency and comprehensively considering various inputs and outputs, they may not fully capture the complex dynamics and potential nonlinear relationships between GF and EE. Future research could explore the application of more complex models, such as machine learning algorithms or complex network analysis, to uncover deeper coupling mechanisms.
In addition, although the GTWR model excels at capturing spatiotemporal heterogeneity, careful consideration is required when selecting bandwidth and spatial weighting schemes, as these factors may influence the results. Future research could explore different bandwidth parameters and spatial weighting matrices to assess the robustness of the results.
Finally, although the indicator system built for GF and EE is already quite comprehensive, it may still not cover all relevant dimensions. For example, the mechanism by which GF indirectly influences EE through changes in consumer behavior or the long-term environmental impact of certain EE improvements may not have been fully reflected. Future research could expand the indicator system to include these dimensions, thereby providing a more holistic evaluation framework.

6. Conclusions

Sourced from panel data covering 30 Chinese provinces from 2011 to 2022, this study systematically analyzed the spatiotemporal coupling characteristics and driving factors of GF and EE using the global reference super-efficiency EBM model, entropy method, Dagum Gini coefficient decomposition, and GTWR. The research leads to these primary findings:
(1) The GECC of GF and EE generally shows a dynamic upward trend, but there is significant non-equilibrium among regions. The eastern coastal areas (such as YRD and PRD), driven by technology and capital, have formed innovation agglomeration zones with generally high GECC. In contrast, the western resource-based regions (such as Xinjiang and Gansu), constrained by the “fiscal dependence–technology lock-in” effect, have seen slow improvement in GECC. Between 2011 and 2022, GECC’s geographical layout transformed from a uniform “single-peak symmetry” to a “double-peak structure”, mirroring the intensifying “technology–institution disparity” between provinces with high and low slopes;
(2) According to the Dagum Gini coefficient, the regional variances in GECC are growing in a non-equilibrium manner, with the rate at which differences between groups contribute rising from 22.0% in 2011 to 40.7% in 2022. The coordination degree gap between the east and west has expanded by 85%, and the north–south growth rate difference has widened to 1:1.6, forming a “double scissor difference”. The violent fluctuation of the supravariation density term indicates that the polarization effect of policy pilots and local protective emission reduction have led to a rebound in negative spillover effects, highlighting the institutional fragility of cross-regional cooperation mechanisms;
(3) TI and ER demonstrate strong synergistic effects on GECC. Digital technology has enhanced the marginal effect of GF policy tools by 67.4%. However, financing constraints in high-energy-consuming industries and the comprehensive nature of agricultural insurance act as mutual constraints. The regional gradient effects of FD and HC further exacerbate the non-equilibrium of GECC. These findings underscore the importance of policy design that leverages technological spillovers and institutional innovation to overcome regional barriers and enhance the efficiency of green transformation.
This study provides a systematic solution to address regional development imbalances and achieve synergistic enhancement of GF and EE. Subsequent studies should delve deeper into how geopolitical and economic elements influence the dynamics of the coupling relationship, contributing Chinese wisdom to global climate governance. By integrating multidimensional analytical frameworks and advanced methodologies, this study not only enriches the theoretical discussion on the coupling and coordination of GF and EE but also proposes practical policy recommendations for guiding regional development strategies. Identifying key driving factors and proposing a three-tier governance framework provides profound insights for theory while offering actionable strategies for policymakers, helping to bridge the gap between academic research and practical application. Future research can further refine the methodology and expand the data scope based on the limitations identified in this study, continuing to advance our understanding of the complex interactions between GF and EE to address the evolving global landscape.

Author Contributions

Conceptualization, H.W.; methodology, H.W. and X.W. (Xuewei Wen); writing—original draft preparation, H.W. and X.W. (Xuewei Wen); review and editing, H.W., X.W. (Xifeng Wang), and X.Y. All authors have read and agreed to the published version of the manuscript.

Funding

The work was supported by the National Social Science Fund of China (23&ZD068).

Institutional Review Board Statement

Not applicable.

Informed Consent Statement

Not applicable.

Data Availability Statement

The data used to support the findings of this study are available from the corresponding author upon request.

Conflicts of Interest

The authors declare that they have no conflicts of interest.

Nomenclature

Full NameAbbreviation
Green financeGF
Energy efficiency EE
Coupling coordination degreeCCD
The coupling degree of green finance and energy efficiencyGECC
Economics of scale ES
Industrial structure IS
Technical innovation TI
Environmental regulationER
Financial developmentFD
human capital HC
Geographic weighted regressionGTWR
Comprehensive development level of green financeCDGF
Yangtze River DeltaYRD
Pearl River DeltaPRD

References

  1. Sillman, J.; Hynynen, K.; Dyukov, I.; Ahonen, T.; Jalas, M. Emission reduction targets and electrification of the Finnish energy system with low-carbon Power-to-X technologies: Potentials, barriers, and innovations—A Delphi survey. Technol. Forecast. Soc. Change 2023, 193, 122587. [Google Scholar] [CrossRef]
  2. Schweitzer, V.; Bach, V.; Holzapfel, P.K.; Finkbeiner, M. Holzapfel, Matthias Finkbeiner. Differences in science-based target approaches and implications for carbon emission reductions at a sectoral level in Germany. Sustain. Prod. Consum. 2023, 38, 199–209. [Google Scholar] [CrossRef]
  3. Wang, Y.; Liu, J.; Zhao, Z.; Ren, J.; Chen, X. Research on carbon emission reduction effect of China’s regional digital trade under the “double carbon” target-- combination of the regulatory role of industrial agglomeration and carbon emissions trading mechanism. Clean. Prod. 2023, 405, 137049. [Google Scholar] [CrossRef]
  4. Yan, C.; Siddik, A.B.; Yong, L.; Dong, Q.; Zheng, G.-W.; Rahman, M.N. A Two-Staged SEM-Artificial Neural Network Approach to Analyze the Impact of FinTech Adoption on the Sustainability Performance of Banking Firms: The Mediating Effect of Green Finance and Innovation. Systems 2022, 10, 148. [Google Scholar] [CrossRef]
  5. Wang, Z.; Teng, Y.-P.; Wu, S.; Chen, H. Does Green Finance Expand China’s Green Development Space? Evidence from the Ecological Environment Improvement Perspective. Systems 2023, 11, 369. [Google Scholar] [CrossRef]
  6. Chen, J.; Yuan, Z.; Mei, P.; Adam, N.A.; Chen, X. Carbon dioxide emissions and mitigation in China’s hydrogen energy supply chain: Insights for sustainability and policy development. Int. J. Hydrogen Energy 2025, 114, 378–391. [Google Scholar] [CrossRef]
  7. Zhang, J.; Yang, K.; Wu, J.; Duan, Y.; Ma, Y.; Ren, J.; Yang, Z. Scenario simulation of carbon balance in carbon peak pilot cities under the background of the “dual carbon” goals. Sustain. Cities Soc. 2024, 116, 105910. [Google Scholar] [CrossRef]
  8. Li, Q.; Li, L.; Lei, Y.; Wu, S. Navigating the path to dual carbon goals: Understanding the driving forces of energy transition welfare performance. J. Environ. Manag. 2024, 358, 120941. [Google Scholar] [CrossRef]
  9. Li, S.; Chen, Z.; Diao, Y.; Chen, Z. The impact of green finance on debt financing costs from the perspective of strategic corporate signaling behavior—Evidence from China. Int. Rev. Financ. Anal. 2025, 102, 104024. [Google Scholar] [CrossRef]
  10. Ding, S.; Wu, X.; Cui, T.; Goodell, J.W.; Du, A.M. Modeling climate policy uncertainty into cryptocurrency volatilities. Int. Rev. Financ. Anal. 2025, 102, 104030. [Google Scholar] [CrossRef]
  11. Xing, Y.; Wang, J.; Liu, Z.; Xiao, D. The impact of corporate financialization on ESG performance: A perspective based on executive incentives. Financ. Res. Lett. 2025, 76, 106934. [Google Scholar] [CrossRef]
  12. Chen, M.; Su, Y.; Piao, Z.; Zhu, J.; Yue, X. The green innovation effect of urban energy saving construction: A quasi-natural experiment from new energy demonstration city policy. J. Clean. Prod. 2023, 428, 139392. [Google Scholar] [CrossRef]
  13. Tian, C.; Li, X.; Xiao, L.; Zhu, B. Exploring the impact of green credit policy on green transformation of heavy polluting industries. J. Clean. Prod. 2022, 335, 130257. [Google Scholar] [CrossRef]
  14. Cui, X.; Wang, P.; Sensoy, A.; Nguyen, D.K.; Pan, Y. Green Credit Policy and Corporate Productivity: Evidence from a Quasi-natural Experiment in China. Technol. Forecast. Soc. Change 2022, 177, 121516. [Google Scholar] [CrossRef]
  15. Lin, T.; Zhang, L.; Li, J. Coupling and coordinated development of green finance and renewable energy industry in China: Spatiotemporal differentiation and driving factors. Renew. Energy 2024, 235, 121255. [Google Scholar] [CrossRef]
  16. Lee, C.-C.; Lee, C.-C. How does green finance affect green total factor productivity? Evidence from China. Energy Econ. 2022, 107, 105863. [Google Scholar] [CrossRef]
  17. Chen, Y.; Zhao, Z.; Yi, W.; Hong, J.; Zhang, B. Has China achieved synergistic reduction of carbon emissions and air pollution? Evidence from 283 Chinese cities. Environ. Impact Assess. Rev. 2023, 103, 107277. [Google Scholar] [CrossRef]
  18. Jing, R.; Liu, R. The impact of green finance on persistence of green innovation at firm-level: A moderating perspective based on environmental regulation intensity. Financ. Res. Lett. 2024, 62, 105274. [Google Scholar] [CrossRef]
  19. Huang, F.; Ren, Y. Harnessing the green frontier: The impact of green finance reform and digitalization on corporate green innovation. Financ. Res. Lett. 2024, 66, 105554. [Google Scholar] [CrossRef]
  20. Chang, L.; Moldir, M.; Zhang, Y.; Nazar, R. Asymmetric impact of green bonds on energy efficiency: Fresh evidence from quantile estimation. Util Policy 2023, 80, 101474. [Google Scholar] [CrossRef]
  21. Zhang, Q.; Huang, H.; Chen, L.; Wang, Y. How does green finance affect carbon emission intensity? The role of green technology innovation and internet development. IREF 2025, 99, 103995. [Google Scholar] [CrossRef]
  22. LZhao, L.; Chau, K.Y.; Tran, T.K.; Sadiq, M.; Xuyen, N.T.M.; Phan, T.T.H. Enhancing green economic recovery through green bonds financing and energy efficiency investments. Econ. Anal. Policy 2022, 76, 488–501. [Google Scholar]
  23. Zhang, Y.; Fang, X.; Yang, Z.; Sun, Y.; Wang, Q. Green finance, technological innovation, and energy efficiency improvements: Evidence from China’s green finance reform pilot zone. Financ. Trade 2023, 59, 3531–3549. [Google Scholar] [CrossRef]
  24. Zhao, X.; Zeng, B.; Zhao, X.; Zeng, S.; Jiang, S. Impact of green finance on green energy efficiency: A pathway to sustainable development in China. Impact of green finance on green energy efficiency: A pathway to sustainable development in China. J. Clean. Prod. 2024, 450, 141943. [Google Scholar] [CrossRef]
  25. Basílio, M. Renewable energy and energy efficiency: An exploratory study in EU countries. Sustain. Futur. 2025, 9, 100514. [Google Scholar] [CrossRef]
  26. Xiong, S.; Ma, X.; Ji, J. The impact of industrial structure efficiency on provincial industrial energy efficiency in China. J. Clean. Prod. 2019, 215, 952–962. [Google Scholar] [CrossRef]
  27. Yang, Z.; Shao, S.; Yang, L.; Miao, Z. Improvement pathway of energy consumption structure in China’s industrial sector: From the perspective of directed technical change. Energy Econ. 2018, 72, 166–176. [Google Scholar] [CrossRef]
  28. Li, K.; Lin, B. How to promote energy efficiency through technological progress in China? Energy 2018, 143, 812–821. [Google Scholar] [CrossRef]
  29. Cantore, N.; Calì, M.; te Velde, D.W. Does energy efficiency improve technological change and economic growth in developing countries? Energy Policy 2016, 92, 279–285. [Google Scholar] [CrossRef]
  30. Chen, Q.; Ning, B.; Pan, Y.; Xiao, J. Green finance and outward foreign direct investment: Evidence from a quasi-natural experiment of green insurance in China. Asia Pac. J. Manag. 2021, 39, 899–924. [Google Scholar] [CrossRef]
  31. Chen, G.; Wei, B. Low-carbon city pilots and site selection for migrant employment: Evidence from China. Energy Econ. 2024, 131, 107417. [Google Scholar] [CrossRef]
  32. Guo, B.; Wang, Y.; Zhang, H.; Liang, C.; Feng, Y.; Hu, F. Impact of the digital economy on high-quality urban economic development: Evidence from Chinese cities. Econ. Model. 2023, 120, 106194. [Google Scholar] [CrossRef]
  33. Mardani, A.; Zavadskas, E.K.; Streimikiene, D.; Jusoh, A.; Khoshnoudi, M. A comprehensive review of data envelopment analysis (DEA) approach in energy efficiency. Renew. Sustain. Energ. Rev. 2017, 70, 1298–1322. [Google Scholar] [CrossRef]
  34. Martín-Gamboa, M.; Iribarren, D.; García-Gusano, D.; Dufour, J. A review of life-cycle approaches coupled with data envelopment analysis within multi-criteria decision analysis for sustainability assessment of energy systems. J. Clean. Prod. 2017, 150, 164–174. [Google Scholar] [CrossRef]
  35. Wang, Z.; Feng, C. A performance evaluation of the energy, environmental, and economic efficiency and productivity in China: An application of global data envelopment analysis. Appl. Energy 2015, 147, 617–626. [Google Scholar] [CrossRef]
  36. Shu, T.; Liao, X.; Yang, S.; Yu, T. Towards sustainability: Evaluating energy efficiency with a super-efficiency SBM-DEA model across 168 economies. Appl. Energy 2024, 376, 124254. [Google Scholar] [CrossRef]
  37. Storto, C.L. Measuring the eco-efficiency of municipal solid waste service: A fuzzy DEA model for handling missing data. Util Policy 2024, 86, 101706. [Google Scholar] [CrossRef]
  38. Tone, K. A slacks-based measure of efficiency in data envelopment analysis. Eur. J. Oper. Res. 2001, 130, 498–509. [Google Scholar] [CrossRef]
  39. Tao, X.; Wang, P.; Zhu, B. Provincial green economic efficiency of China: A non-separable input–output SBM approach. Appl. Energy 2016, 171, 58–66. [Google Scholar] [CrossRef]
  40. Yu, J.; Zhou, K.; Yang, S. Regional heterogeneity of China’s energy efficiency in “new normal”: A meta-frontier Super-SBM analysis. Energy Policy 2019, 134, 110941. [Google Scholar] [CrossRef]
  41. Cong, D.; Liang, L.; Jing, S.; Han, Y.; Geng, Z.; Chu, C. Energy supply efficiency evaluation of integrated energy systems using novel SBM-DEA integrating Monte Carlo. Energy 2021, 231, 120834. [Google Scholar] [CrossRef]
  42. Fei, S.; Sun, C.; Jie, L.; An, Y.; Sun, H. Research on the efficiency of green development of industry in Chinese prefecture-level oil and gas cities based on super-efficient SBM-DEA model and Malmquist index. Front. Earth Sci. 2023, 10, 1121071. [Google Scholar] [CrossRef]
  43. Zhang, T. Can green finance policies affect corporate financing? Evidence from China’s green finance innovation and reform pilot zones. J. Clean. Prod. 2023, 419, 138289. [Google Scholar] [CrossRef]
  44. Chen, F.; Zeng, X.; Guo, X. Green finance, climate change, and green innovation: Evidence from China. Financ. Res. Lett. 2024, 63, 105283. [Google Scholar] [CrossRef]
  45. He, Y.; Liu, R. The impact of the level of green finance development on corporate debt financing capacity. Financ. Res. Lett. 2023, 52, 103552. [Google Scholar] [CrossRef]
  46. Wang, Y.; Liu, J.; Yang, X.; Shi, M.; Ran, R. The mechanism of green finance’s impact on enterprises’ sustainable green innovation. Green Financ. 2023, 5, 452–478. [Google Scholar] [CrossRef]
  47. Zhang, L.; Saydaliev, H.B.; Ma, X. Does green finance investment and technological innovation improve renewable energy efficiency and sustainable development goals. Renew Energ. 2022, 193, 991–1000. [Google Scholar] [CrossRef]
  48. Wang, Z.; Wang, X. Research on the impact of green finance on energy efficiency in different regions of China based on the DEA-Tobit model. Resour. Policy 2022, 77, 102695. [Google Scholar] [CrossRef]
  49. Al-Emran, M. Beyond technology acceptance: Development and evaluation of technology-environmental, economic, and social sustainability theory. Technol. Soc. 2023, 75, 102383. [Google Scholar] [CrossRef]
  50. Işık, C.; Ongan, S.; Ozdemir, D.; Yan, J.; Demir, O. The sustainable development goals: Theory and a holistic evidence from the USA. Gondwana Res. 2024, 132, 259–274. [Google Scholar] [CrossRef]
  51. Jalil, A.; Feridun, M. The impact of growth, energy and financial development on the environment in China: A cointegration analysis. Energy Econ. 2011, 33, 284–291. [Google Scholar] [CrossRef]
  52. Furuoka, F. Financial development and energy consumption: Evidence from a heterogeneous panel of Asian countries. Renew. Sustain. Energ. Rev. 2015, 52, 430–444. [Google Scholar] [CrossRef]
  53. Omri, A.; Kahouli, B. Causal relationships between energy consumption, foreign direct investment and economic growth: Fresh evidence from dynamic simultaneous-equations models. Energ. Policy 2014, 67, 913–922. [Google Scholar] [CrossRef]
  54. Jovović, J.; Popović, S. Investigating volatility spillovers: Connectedness between green bonds, conventional bonds, and energy markets. Res. Int. Bus. Financ. 2025, 76, 102850. [Google Scholar] [CrossRef]
  55. Tone, K.; Tsutsui, M. An epsilon-based measure of efficiency in DEA—A third pole of technical efficiency. Eur. J. Oper. Res. 2021, 207, 1554–1563. [Google Scholar] [CrossRef]
  56. Wang, R.; Tan, J. Exploring the coupling and forecasting of financial development, technological innovation, and economic growth. Technol. Forecast. Soc. Change 2021, 163, 120466. [Google Scholar] [CrossRef]
  57. Mondal, K.; Chatterjee, C.; Singh, R. Examining the coupling and coordination of water-energy-food nexus at a sub-national scale in India—Insights from the perspective of Sustainable Development Goals. Sustain. Prod. Consump. 2023, 43, 140–154. [Google Scholar] [CrossRef]
  58. Liu, T.-L.; Song, Q.-J.; Lu, J.; Qi, Y. An integrated approach to evaluating the coupling coordination degree between low-carbon development and air quality in Chinese cities. Adv. Clim. Change Res. 2021, 12, 710–722. [Google Scholar] [CrossRef]
  59. Mussard, S.; Richard, P. Linking Yitzhaki’s and Dagum’s Gini decompositions. Appl. Econ. 2012, 44, 2997–3010. [Google Scholar] [CrossRef]
  60. Ma, X.; Zhang, J.; Ding, C.; Wang, Y. A geographically and temporally weighted regression model to explore the spatiotemporal influence of built environment on transit ridership. Comput. Environ. Urban 2018, 70, 113–124. [Google Scholar] [CrossRef]
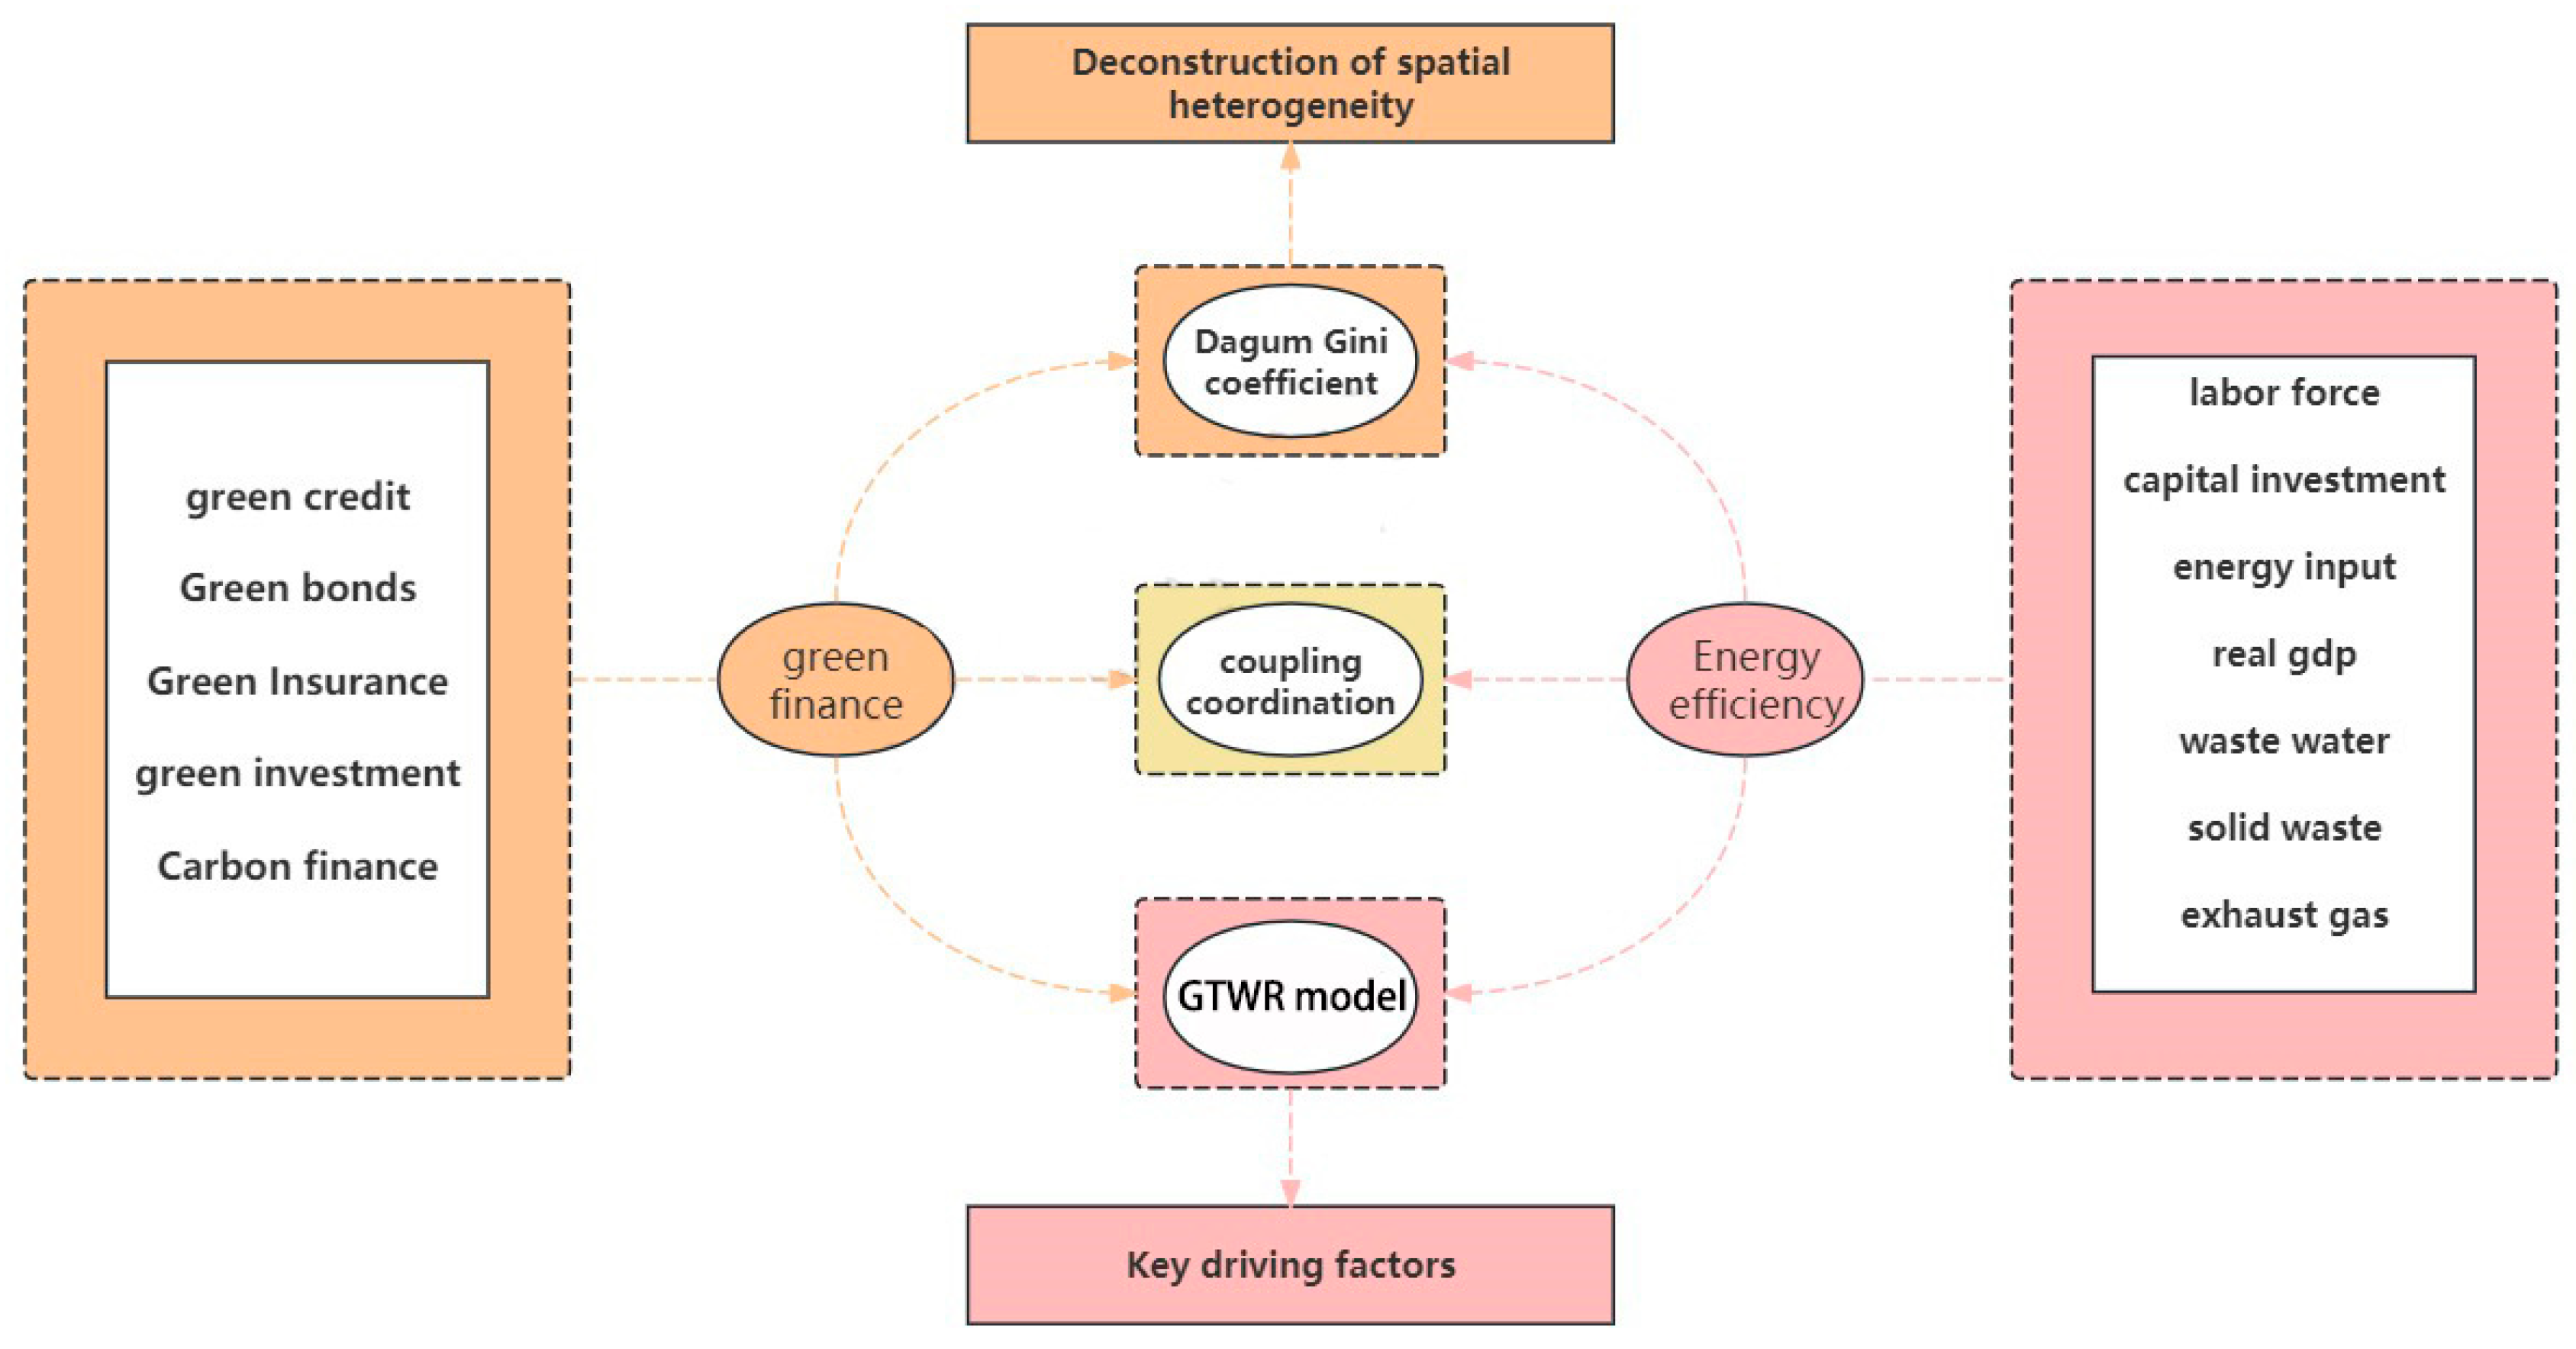
Figure 1. Theoretical framework diagram.
Systems 13 00394 g001
Figure 2. Method structure. A summary of the research methods.
Systems 13 00394 g002
Figure 3. Time characteristics of GF, EE, and CCD show the development trend and key stages from 2011 to 2022.
Systems 13 00394 g003
Figure 4. The spatial and temporal evolution of GF highlights the impact of regional differences and policy interventions.
Systems 13 00394 g004aSystems 13 00394 g004b
Figure 5. GF nuclear density analysis shows the composite characteristics of “overall optimization and strengthening-regional heterogeneous evolution”.
Systems 13 00394 g005
Figure 6. The spatial and temporal evolution of EE highlights the impact of regional differences and policy interventions.
Systems 13 00394 g006aSystems 13 00394 g006b
Figure 7. EE nuclear density analysis map, mapping the game process of policy drive and technology diffusion.
Systems 13 00394 g007
Figure 8. The spatial and temporal evolution of CCD highlights the impact of regional differences and policy interventions.
Systems 13 00394 g008aSystems 13 00394 g008b
Figure 9. The dynamic evolution of coupling coordination shows that GECC in China presents significant policy-driven and spatial gradient difference characteristics. (a) Dynamic evolution of the kernel density. (b) CCD of each province evolves year by year.
Systems 13 00394 g009
Figure 10. The standard elliptical difference and center of gravity of GECC show significant spatial differentiation characteristics of “moving east and south, moving west and north”.
Systems 13 00394 g010
Figure 11. The evolution of overall regional differences in CCD shows the development trend and key stages from 2011 to 2022.
Systems 13 00394 g011
Figure 12. In 2011, 2017, and 2022, the influence of each driver factor on GECC ((ac) = ES, (df) = IS, (gi) = TI, (jl) = ER, (mo) = FD, and (pr) = HC) showed significant dynamic and spatial dependence.
Systems 13 00394 g012aSystems 13 00394 g012b
Figure 13. The interactive detection results of GECC-driving factors from 2011 to 2022 show three strategic-level synergistic combinations: technology–environment, finance–environment, and industry–technology (x1 = ES, x2 = IS, x3 = TI, x4 = ER, x5 = FD, x6 = HC).
Systems 13 00394 g013
Table 1. EE index system.
Index LevelIndicator TypeBasic IndicatorsUnit
Elements inputLabor inputTotal number of employees at the end of the yearThousands of people
Capital inputFixed capital stock100 million
Energy inputTotal energy consumptionTen thousand tons
Expect outputReality GDPReal GDP100 million
Undesired outputWaste waterTotal amount of industrial wastewater dischargedTen thousand tons
Solid wasteSolid wasteTen thousand tons
Waste gasIndustrial SO2Ten thousand tons
CO2 emissionsTen thousand tons
Table 2. GF Index system.
SystemLevel 1 IndicatorsSecondary IndicatorsUnitType
CDGFGreen-credit policySix major energy-intensive industrial interest expenditure/Industrial interest expenditure%-
A-share environmental protection listed company borrowing/A-share listed company borrowing%
Green bondsTotal output value of environmental protection enterprises/Total market value of A shares%
Total market value of six energy-intensive industries/Total market value of A shares%
Green insuranceAgricultural insurance income/gross agricultural output value%
Agricultural insurance expenditure/Agricultural insurance income%
Green investmentEnvironmental pollution control investment/Total investment%
Local fiscal and environmental expenditure amount/GDP%
Carbon financeCarbon emission/GDPOne million tons per 100 million yuan-
Table 3. Dagum Gini coefficient of GECC for 30 provinces in China.
YearDifferenceWithin-Group DifferenceContribution Rate (%)Between-Group DifferenceContribution Rate (%)Supravariation Density TermContribution Rate (%)
20110.04937260.016144432.6990730.010879922.0363990.022348345.264528
20120.04914970.016178432.9164750.006627613.4845330.026343853.598992
20130.04649140.015532833.4101670.007218515.5265220.023740051.063311
20140.04566550.014827332.4693280.013382929.3064560.017455338.224217
20150.04360000.013893131.8648110.016248937.2680260.013458130.867164
20160.04406550.014537632.9908390.013028329.5656930.016499637.443468
20170.05561490.018286632.8807430.017624832.8807430.019703435.428363
20180.05593560.018283232.6862720.018497733.069590.019154634.244138
20190.05655920.017561231.049150.021300137.6597970.017698031.291054
20200.05670000.017808431.4080920.023081140.7074590.015810527.884449
20210.05823740.019042832.6986760.019701633.8297740.019493033.47155
20220.06831990.022241832.5553430.019016927.8351470.027061239.60951
Table 4. GF and EE driver indicators.
IndexComputational MethodUnit
ESPer capita GDPYuan
ISThe proportion of the tertiary industry in GDP%
TINumber of green patent applicationsPiece
ERIndustrial pollution control completed Investment/industrial added valueTen thousand yuan
FDBalance of deposits and loans of financial institutions/GDP100 million
HCCollege or above/population aged 6 and above%
Disclaimer/Publisher’s Note: The statements, opinions and data contained in all publications are solely those of the individual author(s) and contributor(s) and not of MDPI and/or the editor(s). MDPI and/or the editor(s) disclaim responsibility for any injury to people or property resulting from any ideas, methods, instructions or products referred to in the content.