Abstract
The current research presents an extension of the Pit-Stop Manufacturing framework. It addresses the challenges of managing complexity and uncertainty in the production ramp-up phase of manufacturing systems, bridging the gap in existing approaches that lack comprehensive, quantitative, and system-level solutions. This research integrates state-of-the-art methodologies, utilising such metrics as Overall Equipment Effectiveness and Effective Throughput Loss to enhance ramp-up management. The developed framework is represented by a conceptual model, which is translated into a digital product combining multiple artefacts for comprehensive ramp-up research, namely a digital twin of the production system, a Custom Experiment Manager for multiple simulation runs, and a Graph Solver that uses the stochastic dynamic programming approach to address the decision-making issues during the production system ramp-up evolution. This work provides a robust decision-support tool to optimise production transitions under dynamic conditions by combining stochastic dynamic programming and discrete event simulation. The framework enables manufacturers to model, simulate, and optimise system evolution, reducing throughput losses, improving equipment efficiency, and enhancing decision-making precision. This paper demonstrates the framework’s potential to streamline ramp-up processes and boost competitiveness in volatile manufacturing environments.
1. Introduction
European manufacturing industries are experiencing profound transformations driven by digital transformation, globalisation, and sustainability [1,2]. These trends bring challenges, including managing complexity and uncertainty, addressing supply chain disruptions, and ensuring efficient resource utilisation and quality control [3,4,5]. To address these issues, solutions must focus on transparency and predictability to reduce complexity, provide resilience to safeguard supply chains, and create sustainable practices to optimise resource management and maintain quality [6].
A pivotal aspect of adapting to these transformations is navigating the ramp-up phase, the critical bridge to full-scale production. Swiftly transitioning through the ramp-up phase with minimal losses requires a robust management strategy that addresses complexity and uncertainty and ensures timely and effective decision-making [7,8].
The ramp-up phase is particularly challenging due to the inherent complexity of production environments and the stochastic nature of manufacturing systems [3,8]. Therefore, effective management requires transitioning production systems from complexity to transparency and uncertainty to predictability. Decision-making in the ramp-up process is divided into two key phases: the pre-decision state, where a decision is formulated but not yet implemented (e.g., purchasing new equipment), and the post-decision state, which begins once the decision is executed (e.g., the equipment is operational). The time required for implementation contributes to immediate costs, impacts the Effective Throughput Loss [4], and affects the Overall Equipment Efficiency (OEE) [9,10]. Furthermore, due to stochastic variability, actions do not always lead to the desired outcomes, underscoring the need for advanced tools to optimise ramp-up processes.
Indeed, to ensure successful ramp-up management, production managers must make informed decisions based on a clear representation of the production system. Accurately modelling production states and transitions enables managers to evaluate, predict, and optimise their actions, minimising productivity disruptions. The solution must address these challenges effectively, making smart goals and reaching them, efficiently minimising losses, and proactively anticipating issues [11].
Existing research on production ramp-up management predominantly employs qualitative methods [5,12], focusing on isolated aspects such as workforce training [13] and equipment configuration and installation [7,14]. This approach lacks the quantitative rigour to evaluate and optimise system-level changes, particularly in complex and stochastic production environments [3,8]. Consequently, there is a significant gap in methodologies that integrate system-level considerations in a proactive, quantitative, transparent, and predictable manner. Addressing this gap requires developing comprehensive frameworks that combine dynamic programming, discrete event simulation, and system-level modelling to provide actionable insights and optimised strategies for effective ramp-up management.
In the current study, the decision graph remained relatively small due to the well-defined and narrowly scoped nature of the problem. However, this is not always the case. In more complex scenarios, the decision graph or tree can become significantly larger as a result of an increased number of possible actions, options, and decision states. While one might argue that this complexity could be managed through careful graph design and structural optimisation, large decision graphs still lead to substantially longer simulation times. In time-sensitive production environments, such delays can negatively impact overall efficiency. To address this challenge, future research should focus on methods to accelerate the estimation of system state characteristics based on selected actions. One promising direction is the use of machine learning to approximate simulation outcomes, thereby reducing computational effort while supporting timely and informed decision-making.
The Pit-Stop Manufacturing (PSM) paradigm offers a dynamic and adaptive framework for overcoming ramp-up challenges in modern manufacturing [5]. A specialised tool is being developed to enhance this paradigm in a Pit-Stop Manufacturing Extended (PSME) framework to facilitate numerical evaluation of the production system’s evolution. This tool employs a dynamic programming approach to solve the decision graph of possible production states and uses discrete event simulation to account for stochastic variability. By integrating these methodologies, the tool provides actionable insights and optimised strategies, enabling companies to transition smoothly from ramp-up to steady-state production while addressing the complexities of modern manufacturing environments.
This work presents the development of methods and tools that extend the PSM paradigm. Section 2 discusses related work, followed by Section 3, which outlines the core methods and tools. Section 4 introduces the developed framework, which is then applied to a use case in Section 5. Finally, Section 6 provides the study’s conclusions.
2. Related Works
The production ramp-up phase has been widely studied in the literature, with researchers addressing its challenges, proposing frameworks, and exploring new paradigms to improve decision-making and system performance. The following works provide an in-depth understanding of the complexity and critical factors influencing production ramp-up, from planning and quality control to managing uncertainty and system flexibility.
Glock and Grosse (2015) [15] qualitatively examined decision support models for production ramp-up, highlighting their importance in achieving production goals by efficiently transitioning from product development to full-scale production. They categorise ramp-up challenges into planning problems, capacity investment, worker assignment, inventory management, workflow organisation, and unique characteristics, including uncertainty, learning effects, and interruptions. The review emphasises the importance of addressing these interdependencies through mathematical optimisation and simulation models. The review highlights the issues of the complexity and uncertainty of the ramp-up and its modelling. The authors also identify gaps in the literature, particularly the lack of integrated models considering multiple ramp-up characteristics, and advocate for comprehensive approaches to improve decision-making during this complex phase.
Another qualitative study focused on the interviewing methods rather than a pure literature review, by Schmitt et al. (2018) [12], explored future directions for ramp-up management, emphasising the importance of Industrie 4.0 and agility concepts. The study highlights the potential of real-time data, intelligent systems, and additive manufacturing to enhance decision-making, reduce ramp-up times, and enable more agile and flexible processes. Agility concepts like iterative prototyping aim to minimise risk and improve customer integration during ramp-up. The authors also discuss the evolving role of human operators, emphasising the need for advanced technical skills and collaboration with autonomous systems as digitalisation transforms traditional ramp-up models. This work underscores the importance of adapting ramp-up strategies to global trends, enabling faster transitions from development to stable production while maintaining competitiveness in dynamic markets.
Another important work by Kukulies and Schmitt (2017) [8] regarding ramp-up considers ramp-up issues, complexity, and uncertainty through the product’s design. Specifically, they propose a methodology integrating design verification planning with uncertainty modelling using the ESReDA framework and Dempster–Shafer theory. This approach quantifies uncertainties in functional product characteristics, facilitating targeted verification activities to mitigate risks. The authors highlight that traditional design verification methods lack decision support for selecting critical product features. Their methodology enhances decision-making, reduces unplanned engineering changes, and improves ramp-up stability by modelling various uncertainties. This quantitative framework bridges gaps in existing approaches, offering robust planning tools for ramp-up challenges, and can be an essential addition to the holistic approach in ramp-up uncertainty management.
Basse et al. (2014) [3] further addressed the management of instabilities in the ramp-up phase which arise from system complexity caused by interdisciplinarity, interdependencies, and dynamic conditions. This work considers the production ramp-up from the system’s point of view rather than only product design. The authors propose four solution principles to reduce complexity and enhance decision-making: model designing to map and analyse system interactions, closed-loop control combined with heuristics to manage disturbances, tolerancing to create flexible solution spaces, and pattern building with self-optimisation to identify regularities and enable adaptive responses. These approaches aim to proactively stabilise ramp-up processes, minimising delays and improving production effectiveness by facilitating systematic and informed decisions in complex manufacturing systems. This work provides an essential design for ramp-up uncertainty management and decision-making.
Doltsinis et al. (2013) [7] proposed a ramp-up performance measurement framework that addresses production ramp-up challenges, a phase often dominated by trial-and-error decision-making and inefficiencies. The authors highlight the limitations of existing approaches, such as those of Terwiesch and Bohn (2001) [13] and Fjällström et al. (2009) [16], which emphasise knowledge capture but fail to provide comprehensive frameworks for performance measurement. The proposed metrics instead collectively form a ramp-up index to track progress, support decision-making, and reduce ramp-up time in conditions of multidimensional and interdisciplinary complexity. This approach emphasises early-stage evaluation when conventional metrics, like production volume, are insufficient, offering practical feedback for guiding ramp-up strategies.
At this stage, as the standard production metric shows itself to be inefficient in the ramp-up phase, it is worth mentioning the paper of Colledani et al. (2018) [4] that integrates one of the most vital issues during the ramp-up: production quality. Specifically, the authors extended the focus of the ramp-up optimisation on quality with a framework for production volume ramp-up metrics. Providing tools for managing quality variability and reducing unexpected losses, they introduce effective throughput and its loss as performance measures. Moreover, their work emphasises proactively anticipating disruptions during the design phase and implementing continuous improvement strategies to stabilise ramp-up processes.
Focusing on quality control, Ngo et al. (2020) [17] demonstrated how artificial intelligence can improve process quality during ramp-up. The authors emphasise the critical role of achieving quality targets in minimising rework, costs, and delays during ramp-up. Using an adaptive model based on artificial neural networks, they iteratively optimise quality-relevant process parameters, such as gear manufacturing variables, to reduce errors like sum rotation deviation. The model integrates simulation-based training and sequential quadratic programming for parameter optimisation, showcasing its effectiveness in improving quality metrics. This work addresses ramp-up challenges, such as limited data availability and system instability, providing a data-driven framework to achieve faster stabilisation and enhanced quality outcomes during the ramp-up phase.
In their work, Fleischer et al. (2005) [9] explored the importance of other vital performance metrics of the system evaluation during ramp-up, namely OEE, and proposed a simulation-based approach to model it. Ramp-up often faces challenges like process instability, delays, and inefficiencies, which impact manufacturing performance. The authors propose a simulation-based approach to model the key components of OEE: availability, performance, and quality. This method identifies bottlenecks, predicts system behaviour, and evaluates improvement strategies. Manufacturers can address equipment setup times, defect rates, and process variability by simulating real-world scenarios, ensuring a smoother transition to full-scale production. The study demonstrates how focusing on OEE during ramp-up minimises delays and costs while improving equipment utilisation and process stability. The proposed framework offers decision-makers practical tools to accelerate ramp-up, reduce inefficiencies, and ensure more reliable manufacturing systems, bridging the gap between planning and real-world application.
One of the most critical issues with ramping up the product and the system is the lack of material. Therefore, Melnychuk et al. (2022) [6] addressed the challenge of production system layout and its role in ramp-up stability under conditions of material scarcity, which significantly disrupts the production system. This topic is critical to production ramp-up, where such shortages and uncertainties are common, and system flexibility can play a crucial role in stabilising processes and reducing delays, ultimately ensuring a smoother transition to full production capacity. Using a discrete event simulation model, the authors analyse different flexibility levels, such as flow-shop, job-shop, and flexible job-shop, and introduce routing and operational flexibility to adapt production under uncertain conditions. The authors highlight a gap in prior research: material shortages are often studied in supply chain contexts without considering intralogistics or flexibility levels. Their findings show that flexible job shops outperform rigid systems by dynamically resequencing operations and utilising multi-purpose stations to reduce make-span delays caused by material unavailability. This work provides valuable insights into optimising assembly systems in the face of increasing supply chain uncertainties.
Finally, Tolio and Magnanini (2019) [5] introduced the paradigm of PSM, a concept directly relevant to dynamic ramp-up phases. The paradigm emphasises agility and mutability to adapt manufacturing systems to dynamic conditions and disruptions. This approach directly relates to the ramp-up phase, where systems must transition quickly to stable operations despite limited data and high variability. The authors highlight the importance of proactive and reactive strategies during ramp-up, including modular system design for flexibility and model-based control to manage uncertainties. These strategies enable manufacturing systems to prioritise critical actions, minimise variability, and accelerate stabilisation after changes. By integrating real-time data with predictive models, PSM offers tools to address the uncertainties inherent in ramp-up, ensuring a smoother transition to full production capacity while maintaining competitiveness. This framework underscores the critical role of adaptive control and proactive planning in managing the complexities of ramp-up effectively.
A summary of the related papers is given below in Table 1.

Table 1.
Related papers summary. The Harvey balls indicate fulfillment of the criteria.
Despite significant advancements, existing studies often focus on specific aspects of ramp-up, such as uncertainty management, complexity considerations, or production quality. While quantitative approaches exist, they are typically applied in isolated domains rather than forming a comprehensive, integrated framework that simultaneously addresses uncertainty, complexity, and production quality in a dynamic manufacturing environment. Furthermore, while quantitative models are increasingly present, their integration into real-world decision-support frameworks remains fragmented, limiting their practical effectiveness. This study addresses these gaps by developing the PSME framework, which unifies simulation-based experimentation and decision-support tools to optimise ramp-up processes effectively.
3. Methods and Tools
3.1. Pit-Stop Manufacturing
The PSME concept is built around the PSM paradigm [5]. The aim of moving forward with this concept is to create practical methods and tools for production management to handle the complexity and uncertainty of the production ramp-up efficiently, effectively, and proactively. The concept is provided in Figure 1.
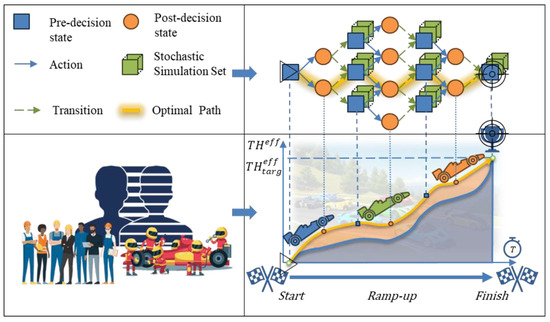
Figure 1.
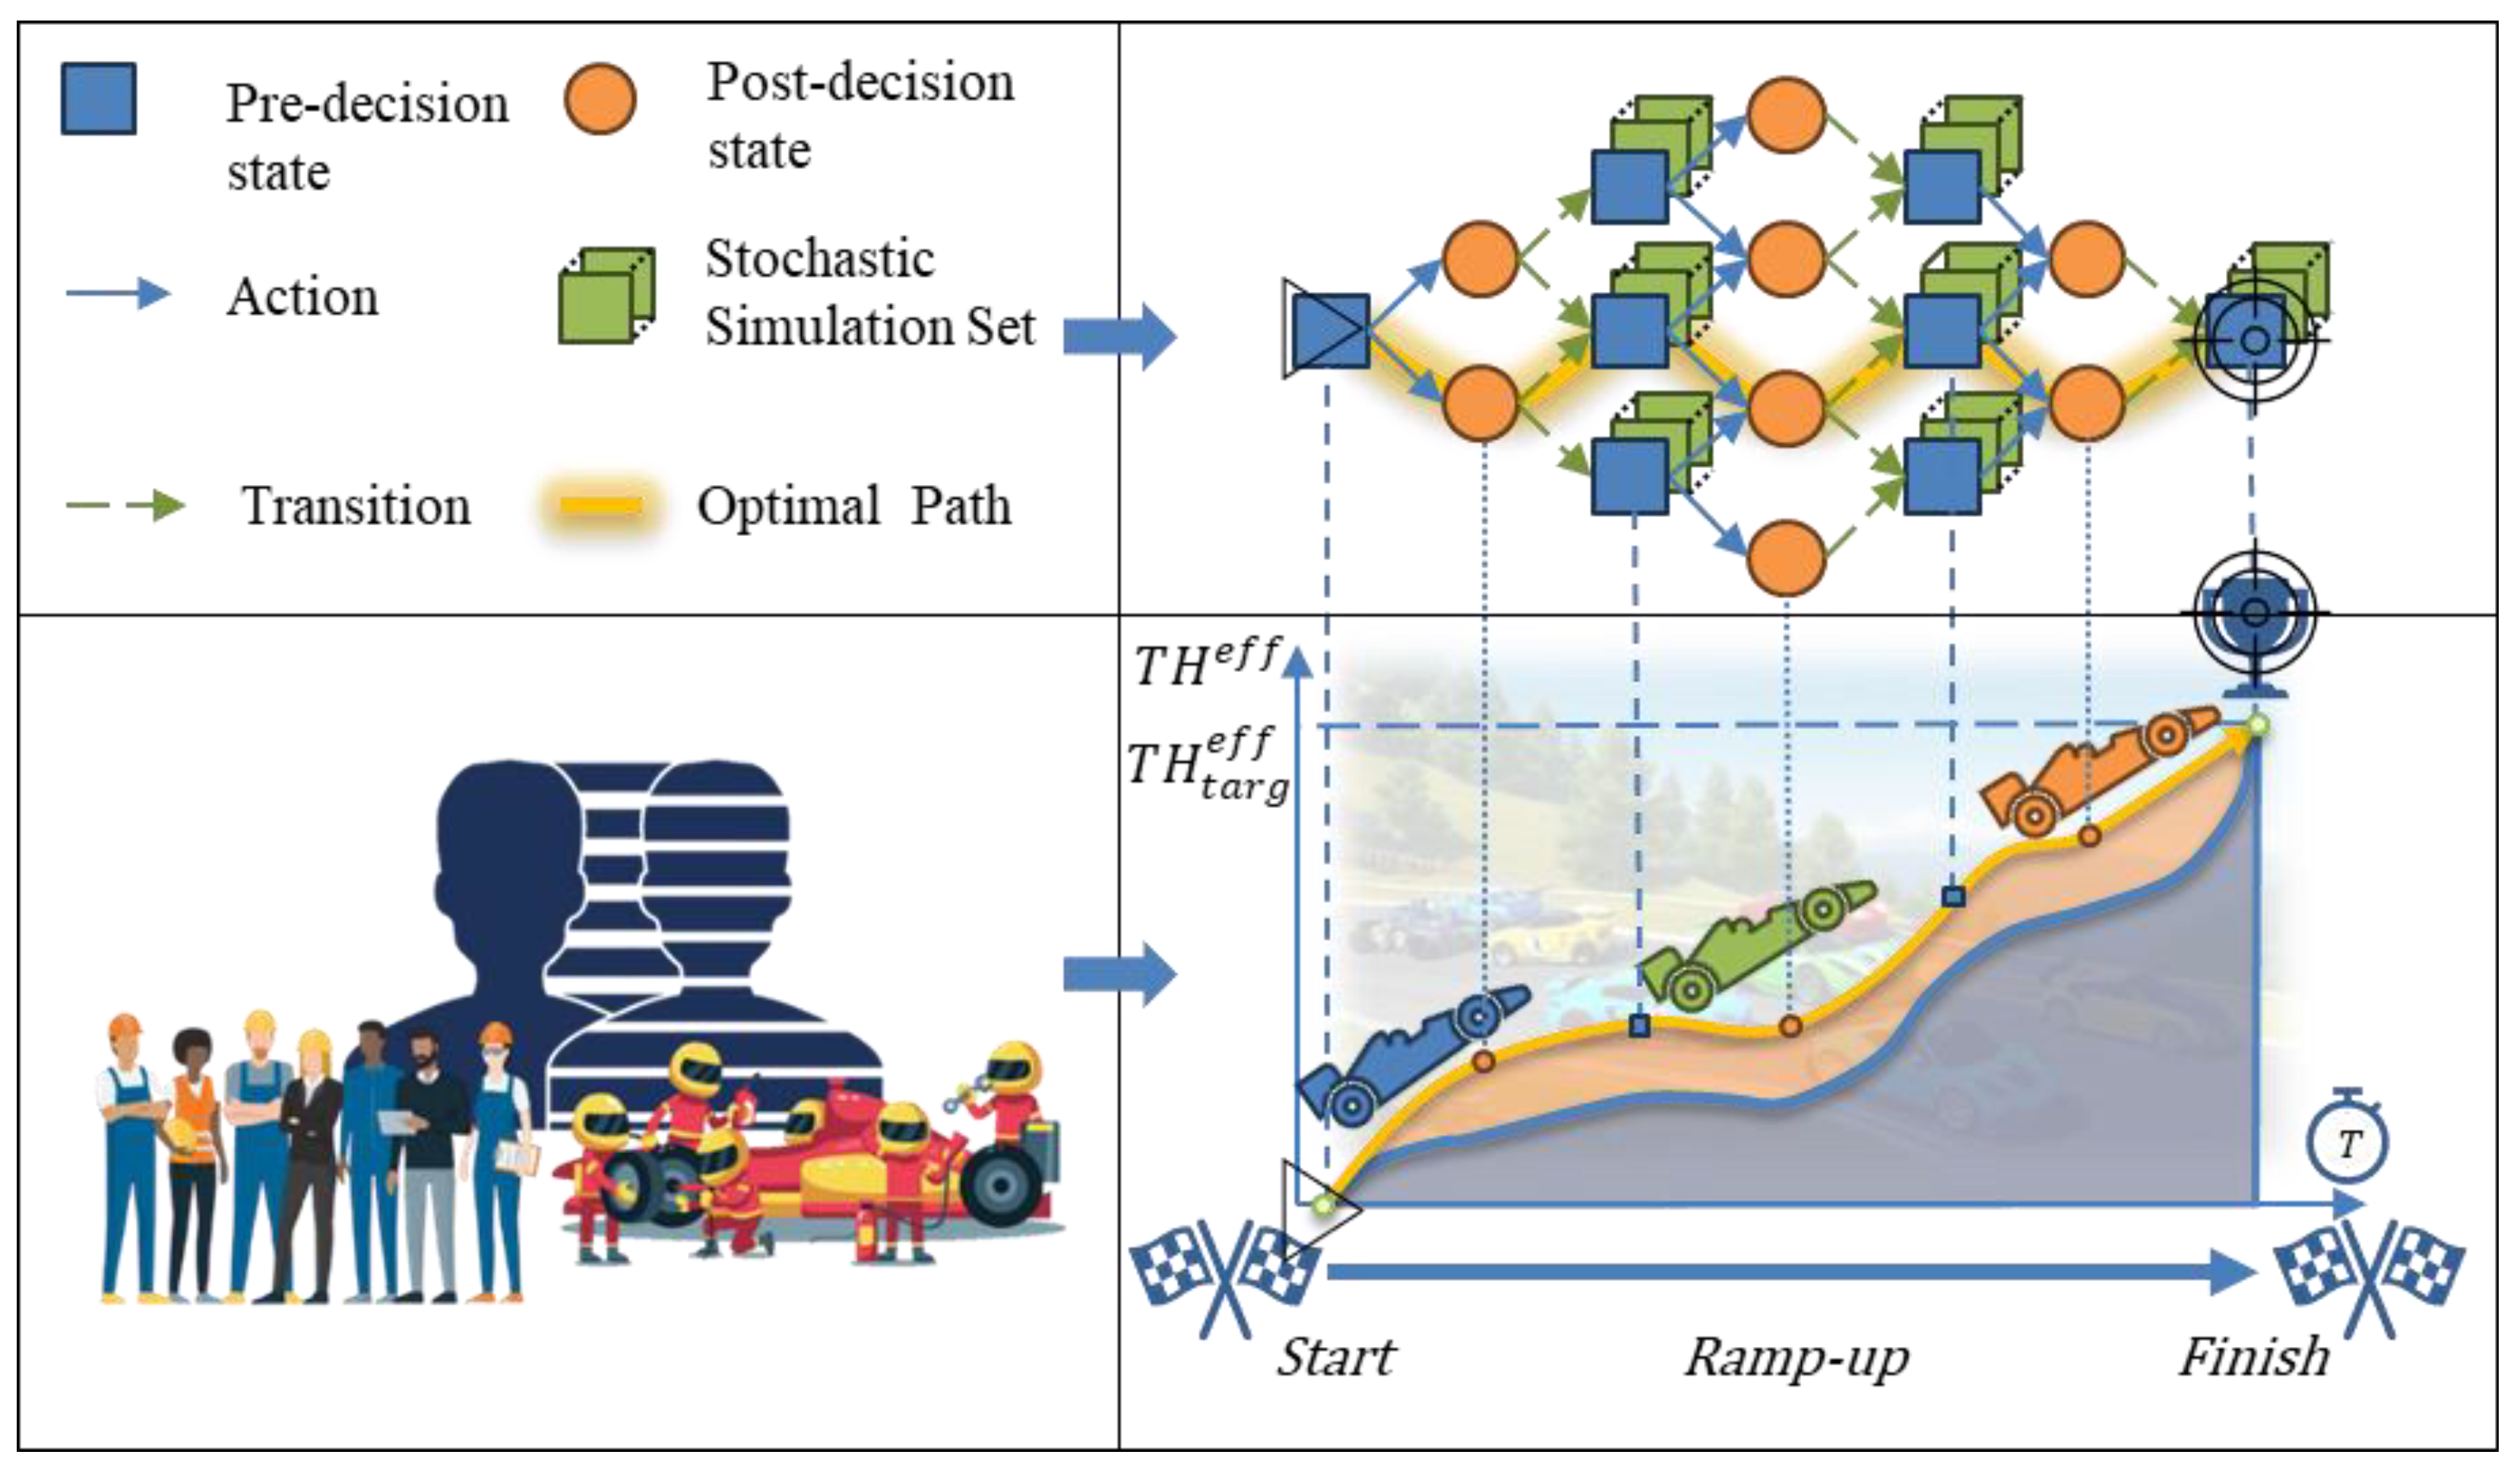
PSME—production transformation into a race with a decision support graph. The authors compiled the images used in this figure from various sources. The original sources are unknown.
In Figure 1, the top part represents the decision graph. The decision graph is the network of the production states, pre- and post-decision, where the optimal path, which includes the minimum cost of the proposed actions and transitions, starts at the planning moment and leads to the state where the production goals are achieved.
The transition of the physical production to the DT of the ramping-up production system is represented in the bottom left part of the figure. Therefore, in the bottom right section, the cars represent the market competitors who pass over the pit stops, represented by the decision states.
The PSME approach in this work aims to show that the same logic of the racing cars can be applied in the production ramp-up, as the race is won at the pit stops. This means that overcoming competitors in the market is possible effectively by reaching production goals and overcoming the production ramp-up. Selecting the correct actions at the decision states or pit stops, saving valuable resources, and avoiding losses make ramp-up efficient. Analysing and planning those decisions in the aggregated form of a decision graph or a decision tree (Section 3.2) makes this approach proactive. The conceptual model (Section 3.5) is a vital part of the tool as it describes the state of the production system and its internal dynamics. It is used to build the discreet event simulation that serves as a core of the DT of the use case production, following the DT pipeline of Göppert [18].
General notations regarding SDP (Section 3.3) and state transitions (Section 3.4) follow the developments by Goodson et al. [19]. However, in the present work, the decision graph consists of the pre-decision states, represented by the blue squares, and the post-decision states, represented by the orange circles. The continuous arrow represents the actions that the user can take. Afterwards, the transition, which is subjected to stochasticity and marked with the dashed arrow, brings the production system from the post-decision state to the next decision state, where another decision can be made again. Another element in the notation is the green squares representing the stochastic simulation set. This set of experiments is designed to estimate the uncertainty in the decision graph and to choose the optimal path.
3.2. Decision Graph Structure
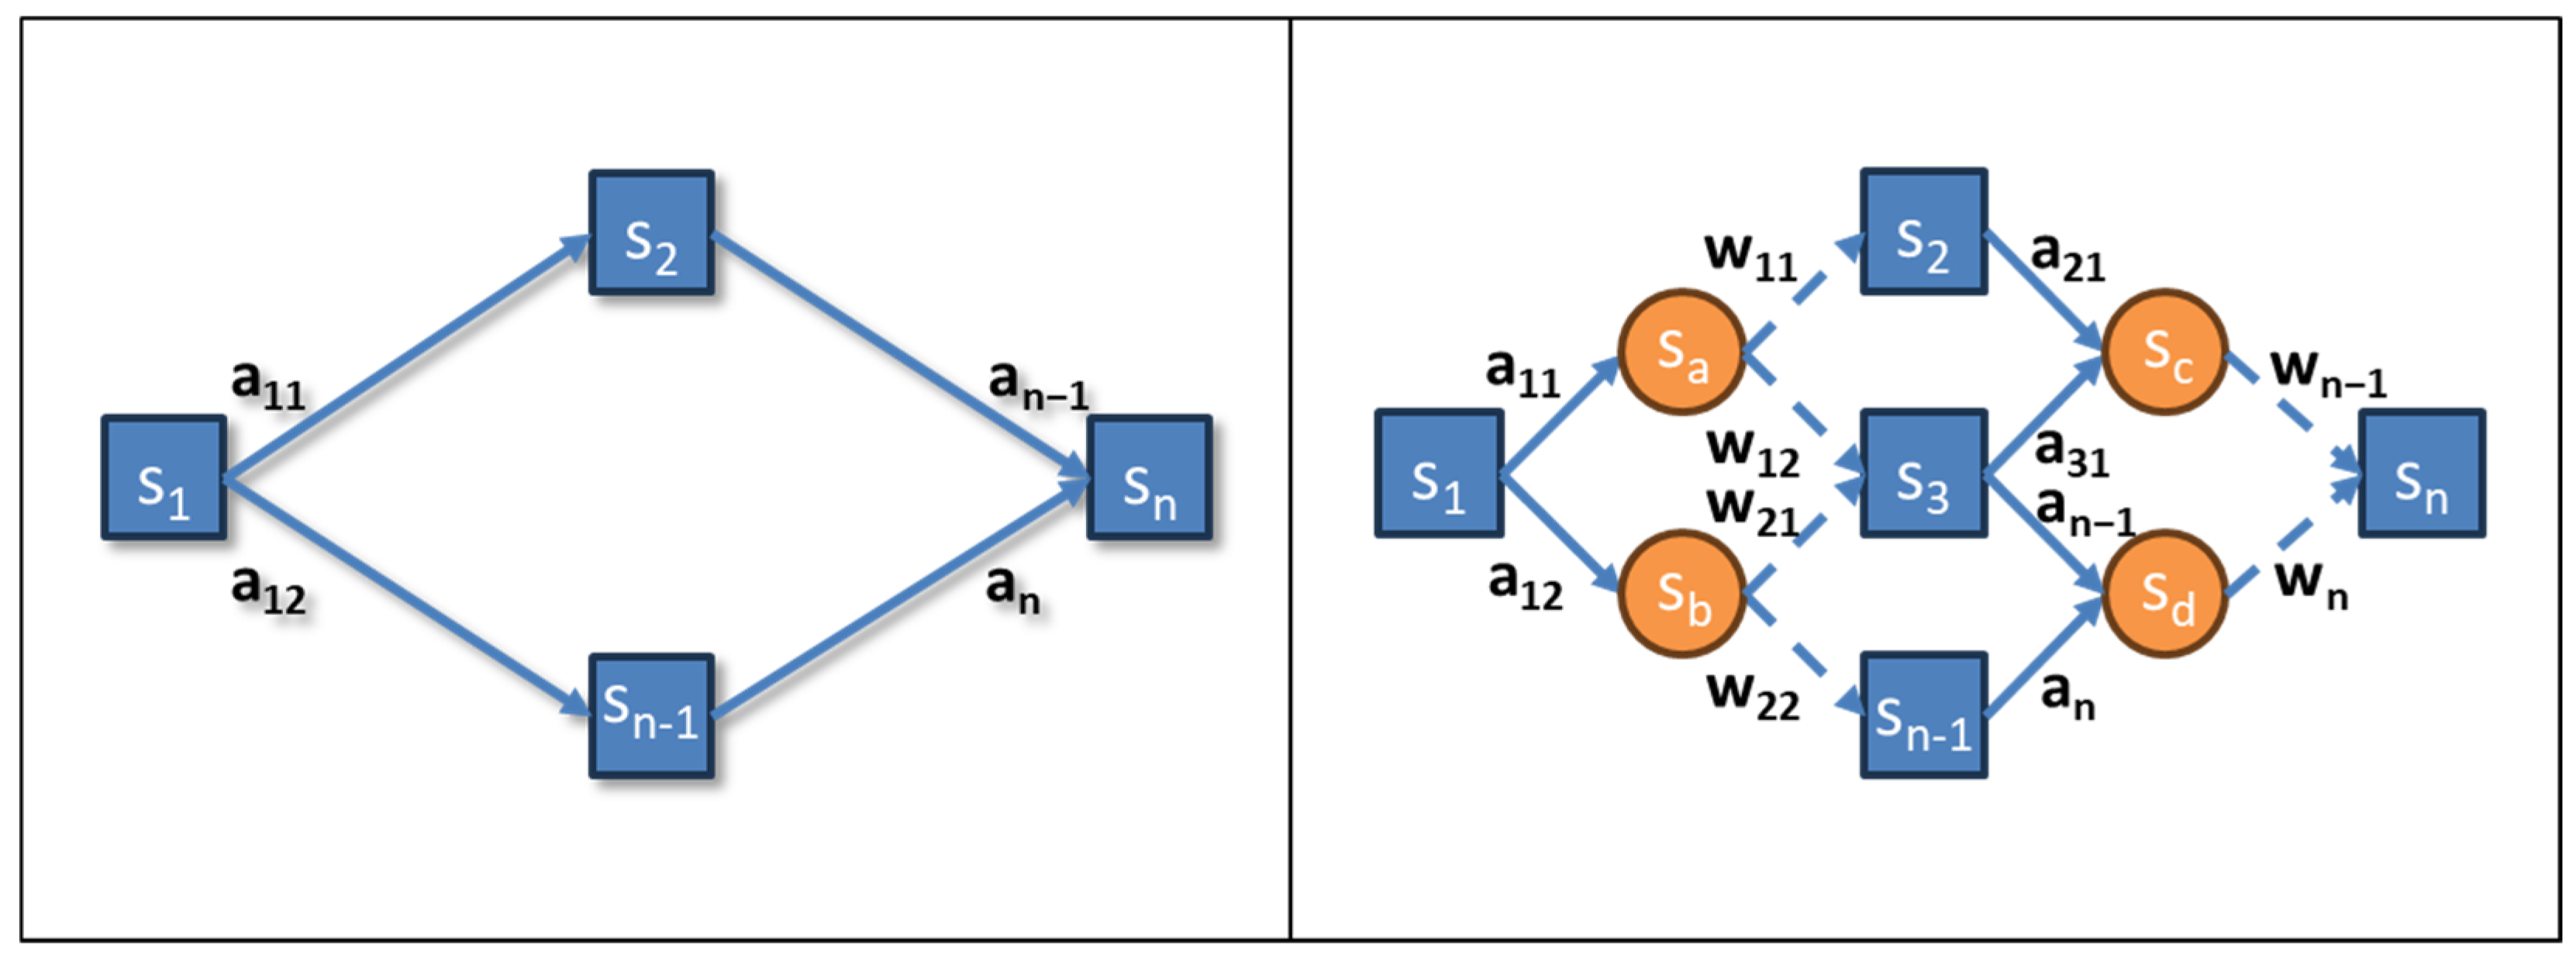
Issues in production systems are often oversimplified from a managerial perspective, mainly when uncertainty and stochasticity are ignored in decision-making processes. Figure 2 provides a visual comparison of deterministic and stochastic graphs.
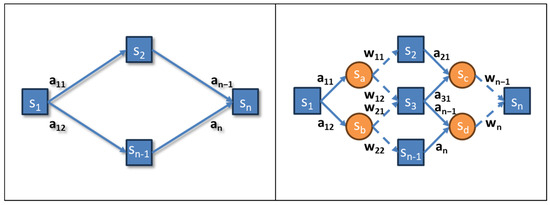
Figure 2.
Difference between considering and not considering uncertainty in the decision graph.
In a deterministic scenario, decisions may appear as binary choices between actions, such as a11 and a12 (solid arrows), that lead the system to intermediate states s2 and sn−1, eventually progressing to the target state sn. However, such a representation is far from realistic. In actual production systems, actions rarely result in perfectly predictable outcomes due to stochastic noise or uncertainties.
To address this complexity, we distinguish between pre-decision states s1 and post-decision states sa–sd [19]. Actions taken at a pre-decision state may lead to intermediate post-decision states, influenced by stochastic effects denoted as w11–wn (dashed arrows). These uncertainties can introduce unplanned scenarios or transitions, adding unforeseen costs and complexities to the system. For example, an action intended to move the system to sn could instead result in an unconsidered state due to random disturbances, requiring re-evaluation of subsequent decisions.
The SDP approach is particularly suited to addressing such challenges. It allows for systematically exploring the decision graph while accounting for uncertainties. One practical method for solving this graph is the backwards greedy algorithm, which identifies the path of minimal cumulative cost (for minimisation problems) by working backwards from the target state sn to the current state. This approach ensures that decisions are optimised under uncertainty, enhancing the system’s ability to adapt to stochastic events during production ramp-up.
3.3. Stochastic Dynamic Programming Optimisation of the System Evolution Path
The literature recognises technologies that effectively address uncertainty and complexity, including methods like stochastic dynamic programming (SDP) [20,21] and concepts like the DT [22,23]. The DT concept is considered in this work as a tool for ramp-up analysis. Specifically, those methods and tools can assist production managers in clarifying their vision of the production decision-making process in a highly uncertain, stochastic environment, navigating the user through the optimal path from Figure 1. The optimisation procedure for overcoming the ramp-up phase can be modelled using the Bellman equation. The Bellman equation defines the state-value function (1) under the optimal policy, facilitating the evaluation of cumulative costs and determining the optimal actions for transitioning between states, and is formulated below. The novelty of this approach is that it connects this optimisation technique to the ramp-up conceptual model with the description of the states and transitions, as well as to the digital twin based on the conceptual model.
The equations are parameterised with key variables such as the immediate costs , transition probabilities , and the discount factor . The latter is set to 1 to emphasise the equal importance of immediate and future throughput losses during the ramp-up phase. This formulation enables a structured approach to efficiently identifying optimal policies for managing state transitions.
The Bellman equation for a state-value function can be expressed as follows:
where
- represents the pre-decision, current state.
- is an ordered set of all possible actions, where a group of actions can represent each action.
- represents the available action (or a group of actions) in the state , where .
- represents the ordered set of all possible states.
- represents a post-decision state after taking an action in state .
- is the possible next state from a post-decision state after taking an action in state .
- is the immediate cost charged when transitioning from a pre-decision state to a post-decision state .
- is the discount factor, which accounts for the present value of future costs, which can be within the limits ; in the present case, it equals 1, as here, is considered equally important as its future costs. Further consideration can include the learning rate that could explore a decrease of along time as the learning curve changes during the ramp-up.
- is the probability of transitioning from a post-decision state to state .
- represents the expected cumulative future costs when starting from the state .
- represents the expected cumulative future cost value when starting from the state and following an optimal policy .
- is an optimal policy vector that contains the optimal action name for the ordered sequence of the states.
3.4. States and Transition Assumptions
Below is a system evolution description of the states and transition assumptions for the decision graph. As the performance indicators, the [4] and OEE [9,10] were considered. was calculated according to the target throughput as the difference between the target throughput and gained throughput volume. OEE was considered simplified, so the simulation was deemed suitable and sufficient when this value was more than 75% [24].
- Letting be the set of all resources in the production system (e.g., machines and workers), an individual resource is denoted by .
- Letting be the set of all possible states during the ramp-up process, each state is the state transition matrix characterised by two key performance indicators (KPIs): and OEE.
- Letting be the ordered set of states representing the sequence of states during the ramp-up process, , where is the initial state and is the final state.
- Letting be an a matrix of change vectors, each element is a vector representing changes to the variables , , and for a subset of resources .
- Each is a set of action vectors, with each vector corresponding to a resource in the subset .
- State vector :
- Matrix of change vectors :
- Change vector :
Not all actions are universally applicable to every state. Each action is first tested for feasibility in the context of the current resource configuration. Actions targeting unavailable or non-existent resources are excluded from the feasible action set in that state. This ensures that all generated transitions are valid within the system’s operational constraints. Specifically, the change vector refers to the actions that influence OEE in different ways:
- are the parameters that influence the quality, namely, the defect occurrence rate and the repair rate .
- are the parameters that influence the availability, namely, the failure rate and the repair rate .
- are the parameters that influence the availability, namely, the mean processing time and the standard deviation of the process time .
3.5. Production System State Model Assumptions
The production system state model assumptions serve as a conceptual model description. This part is crucial to studying the production system, as the conceptual model transfers into the discrete event simulation model, the core of the DT. It describes products, processes, resources, loading and dispatching policies, and station dynamics. The results of the DT experiments are to be used to estimate the probabilities of the state transitions and the latter’s costs.
Product and Process. The production system produces product types. Each product type is denoted as . For each product type , operations are needed to transform the unfinished product into the finished product according to the standard process flow. The ordered sequence of operations IDs is contained in the set , with dimension . For each operation on station , a processing time is defined with mean and standard deviation , with and . For each operation on part type , defect types can be originated. For each defect type, a probability of occurrence is associated, namely, . Once defect is observed, the part must be reworked in-machine with probability , or it is sent to scrap with the probability . The rework operation is done on the dedicated rework station and requires the same time with mean and standard deviation as the other stations. The state of each part in the system is characterised by the triple , including the (i) progressive part ID, which is an integer number, (ii) the part type , and (iii) the process completion level , where represents the last operation performed on the specific part. When a part enters the system, its completion level is always . A part leaves the system when the completion level is achieved. An infinite space to store finished parts is assumed.
Resources (stations, buffers, operators, and AGVs). The system is composed of operational or inspection stations, , and one rework station, . An operation on part type can be performed on a subset of stations. The association between operations and stations is contained in the binary matrix with and . There are agents in the system: operators who can supervise the stations or perform transportation tasks, and AGVs who can only perform transportation tasks. As a subset of agents, each operator has a specific skill and can execute a subset of operations on a subset of part types. The association among operations on a part type and operators is based on skills and is contained in the binary matrix , with , , and . Stations can be unreliable, and a failure rate and a repair rate characterise each station. The value of both rates is between 0 and 1. Under these settings, each machine is characterised by the following states:
- Operational: This is the operational state. The station is operational and processing a part. When the station is non-automated, operator supervision is required.
- Ready: This is a non-operational state. The station is ready to be associated with a specific operation on a particular part. When the station is non-automated, operator supervision is required.
- Idle: This is a non-operational state. When the station is non-automated, operator supervision is needed.
- Failed: This is a non-operational state. The non-operational station failed with a failure rate and was repaired with a repair rate. Repair and maintenance workers are not explicitly simulated.
When an operation is started on a machine when the station is non-automated, the operator must supervise the machine for the entire operation. Operators’ or AGVs’ travel time while transporting the products or moving from one machine to another is negligible. A vector characterises the state of an operator, assuming a value of “0” if the operator is not assigned to a specific operation on a machine, and the value if it is assigned to the station . Each station has an input and output buffer. The capacity of each is equal to one.
Loading policy. The arrival of new raw parts to be processed in the central buffer is stochastic and modelled as a Poisson process. A raw part type arrives in the system with a rate , where is the inter-arrival time of parts of type .
Station dynamics. Whenever a part is loaded on a “ready” station, the station state is “operational”, and the variable that contains the processed part ID is set to the considered part ID. After processing, the part is moved to the output buffer of the station, so if space is available in the input buffer of one of the subsequent possible operations, the part is moved to the buffer of the corresponding station. The machine state is set to “ready”. The next part can be loaded onto the station. When the station is not automated, the operator remains at the machine or is “idle” if the operator moves to a different machine for another operation. If the input buffer of one of the subsequent possible operations is full, as is the output buffer of the current station, the station state is set to idle.
Dispatching policy. The dispatching policy acts as follows: when the stations that can perform the operations required by the product are “ready”, the product from some output buffer is moved to the input buffer of the machine with the lowest operation time . This assumption models the shortest processing time dispatching policy [25]. When the station is not automated, the operator must supervise it. When operators are required in the system, they stay at the worker pool or go there after finishing each task. Therefore, the operator moves to the machine, performing processes in its skill domain randomly selected on demand from the station with the specific product.
4. Developed Framework for Decision Support for Complexity and Uncertainty Management in Production Ramp-Up Planning
The developed tool, named Policy Maker, mirrors the developed framework concept and integrates three core components: (i) a digital twin (DT), (ii) a Custom Experiment Manager (CEM), and (iii) a Graph Solver (GS). Aggregating these components into a single tool, decision support is provided for managing complexity and uncertainty in production ramp-up planning, offering users the optimal set of actions for a cost-efficient ramp-up. The interaction between the components is done in a way that is shown below, in Figure 3.
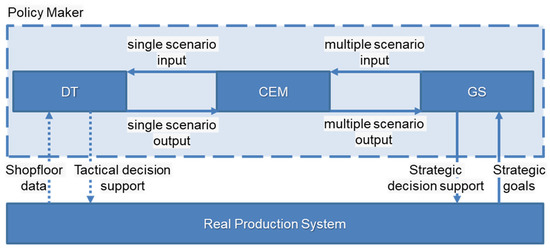
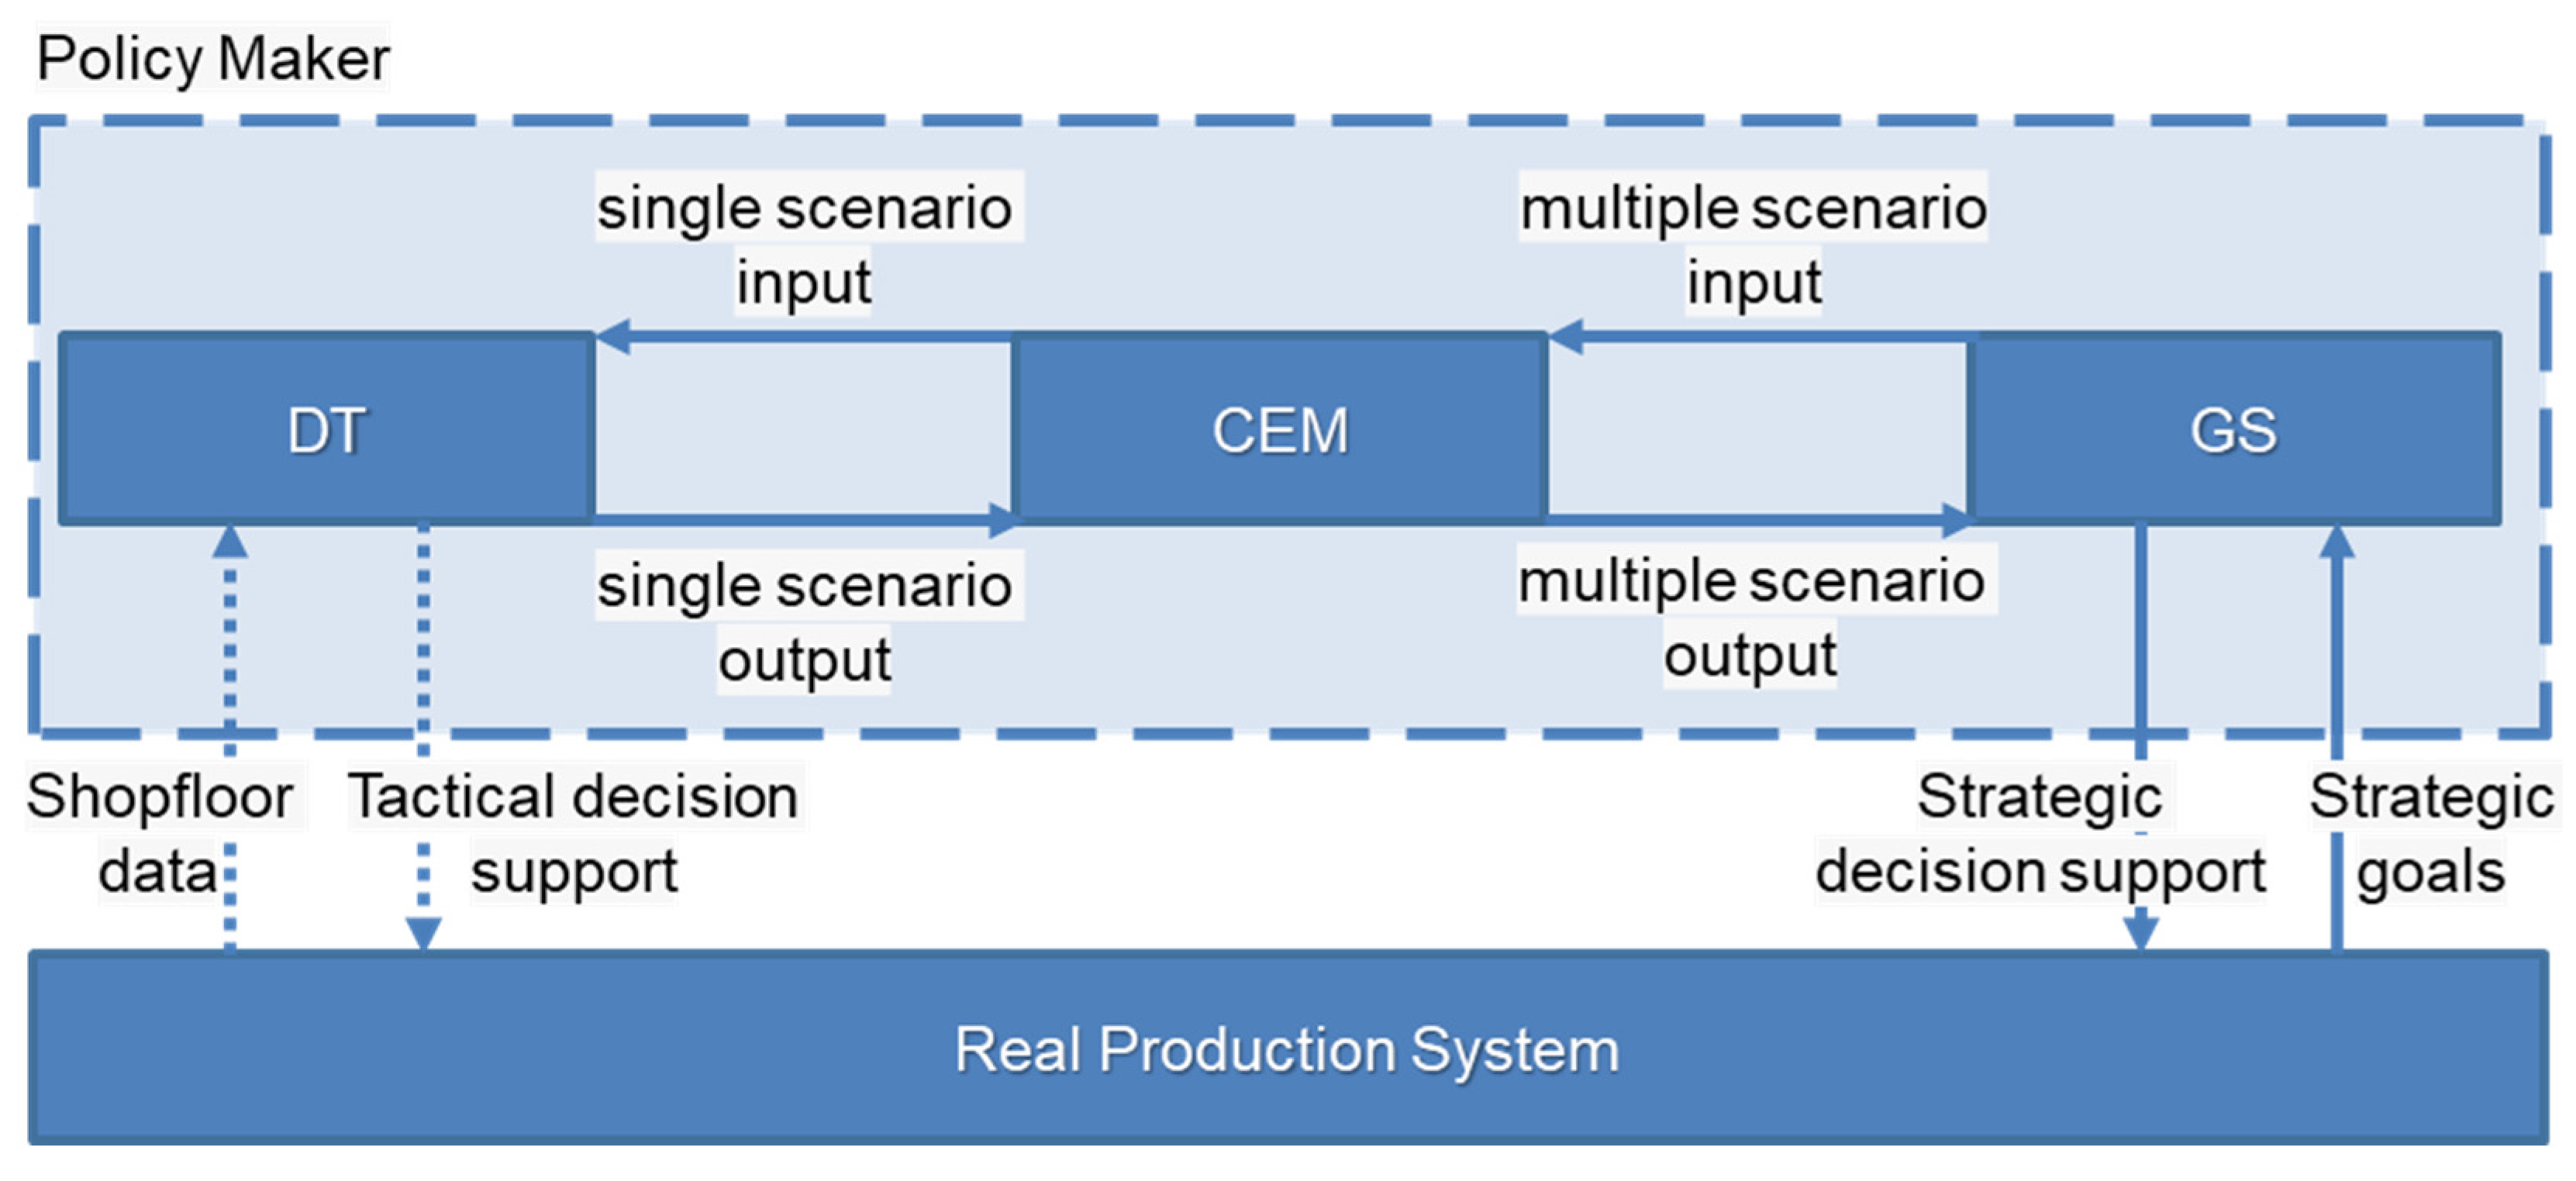
Figure 3.
PSME framework component interactions.
The work features both strategic and tactical planning. Strategic goals are more abstract and relate to generic key performance indicators valued by industrial companies. In the current research, these include target effective throughput, takt time, quality, and productivity losses, evaluated over a one-year timeline with a four-month ramp-up frequency. Strategic planning is defined at the management level and then communicated to the operational level. Tactical planning refers to the practical actions that can be implemented during the ramp-up phase at different points in time. It takes into account potential losses and their associated probabilities. Tactical planning is conducted at the operational level and is guided by the strategic goals set by management.
The framework represents a dual-loop decision-support system for production ramp-up, integrating DT, CEM, and GS to enhance tactical and strategic decision-making. By integrating real-time monitoring with scenario-based experimentation, this framework ensures a structured decision-making process that optimises short-term operational performance and long-term strategic planning in production ramp-up.
The first loop focuses on real-time monitoring and tactical adjustments. The DT continuously interacts with the actual production system, receiving shopfloor data and providing tactical decision support. This closed-loop exchange ensures rapid response to operational changes, improving short-term stability.
The second loop drives strategic decision-making. The process begins with strategic goals, which inform the GS to define multiple scenario inputs. The CEM processes these scenarios to generate a set of single-scenario inputs for further analysis. The DT then simulates a single scenario set one by one, considering real-world conditions, producing a single scenario output. Receiving the set of single-scenario outputs, the CEM allows a broad exploration of potential outcomes in one decision branch. Then, the CEM parses the data from the multiple experiments and provides them to the GS. Therefore, the GS uses these data to solve the graph and to obtain the optimal path of the decision graph, together with the optimal policy vector that contains all optimal actions to be taken. Finally, the GS provides strategic decision support, aligning refined scenarios with long-term objectives to improve system adaptability and ramp-up efficiency.
The DT is built upon a standalone discrete event simulation model that implements the system dynamics defined in the conceptual model (Section 3.4 and Section 3.5). These simulations provide the performance metrics and transition data the GS uses to evaluate state transitions and solve the decision graph. It serves as a virtual representation of the real-world manufacturing system, replicating its behaviour with high fidelity. The DT is connected to the manufacturing system through a DT pipeline [18], which ensures seamless integration with real-world processes. The model utilises the Attribute Explorer object within Plant Simulation to facilitate data exchange during simulations. This object acts as an interface for reading and writing values between the simulation model and external input/output files. The input files are structured in standardised comma-separated (.csv) or Excel (.xlsx) formats, where rows and columns correspond to objects and their attributes within the simulation model. Input files populate the model with parameter values, while output files are generated dynamically during the simulation to store results.
The CEM tool provides a simple and transparent framework for executing simulation experiments. Unlike the embedded Experiment Manager in Plant Simulation, limited to predefined configurations, our customised solution offers enhanced adaptability and control through varying models and inputs in the front end and other parameters in the back end. It supports the execution of multiple simulations with varying input parameters, stochastic behaviour, and iterative workflows. This flexibility enables users to design and perform complex multi-stage experiments tailored to specific optimisation goals. While the current implementation supports only Plant Simulation models, the architecture allows for extensibility to other simulation environments if required. The CEM interacts closely with the DT to run simulations efficiently and collect relevant output data for further processing. The user interface of the CEM is given below in Figure 4.
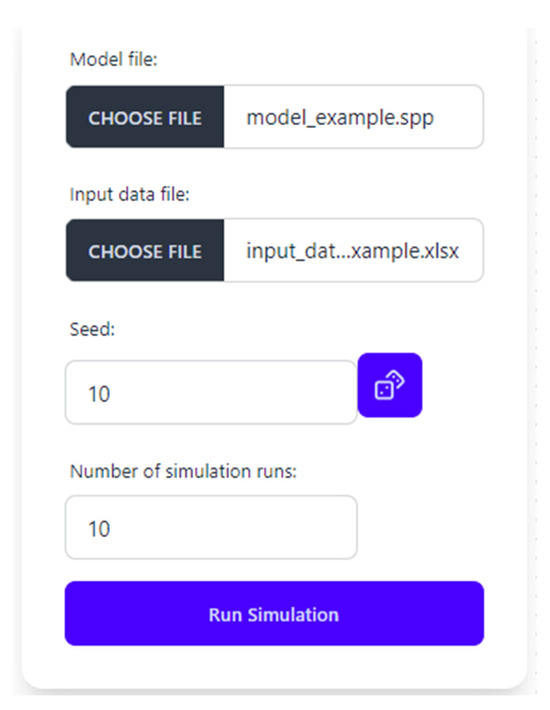
Figure 4.
Interface of the CEM.
The third core component, the GS, employs stochastic dynamic programming (SDP) to determine the optimal action policy within a decision graph. Starting from a defined initial state, the GS navigates through the graph’s nodes, evaluating decisions at each stage while accounting for uncertainty and stochastic events. The process continues iteratively until the system reaches predefined ramp-up goals. By analysing cumulative costs and state transitions, the GS identifies an optimal policy that minimises costs and enhances the efficiency of the ramp-up process.
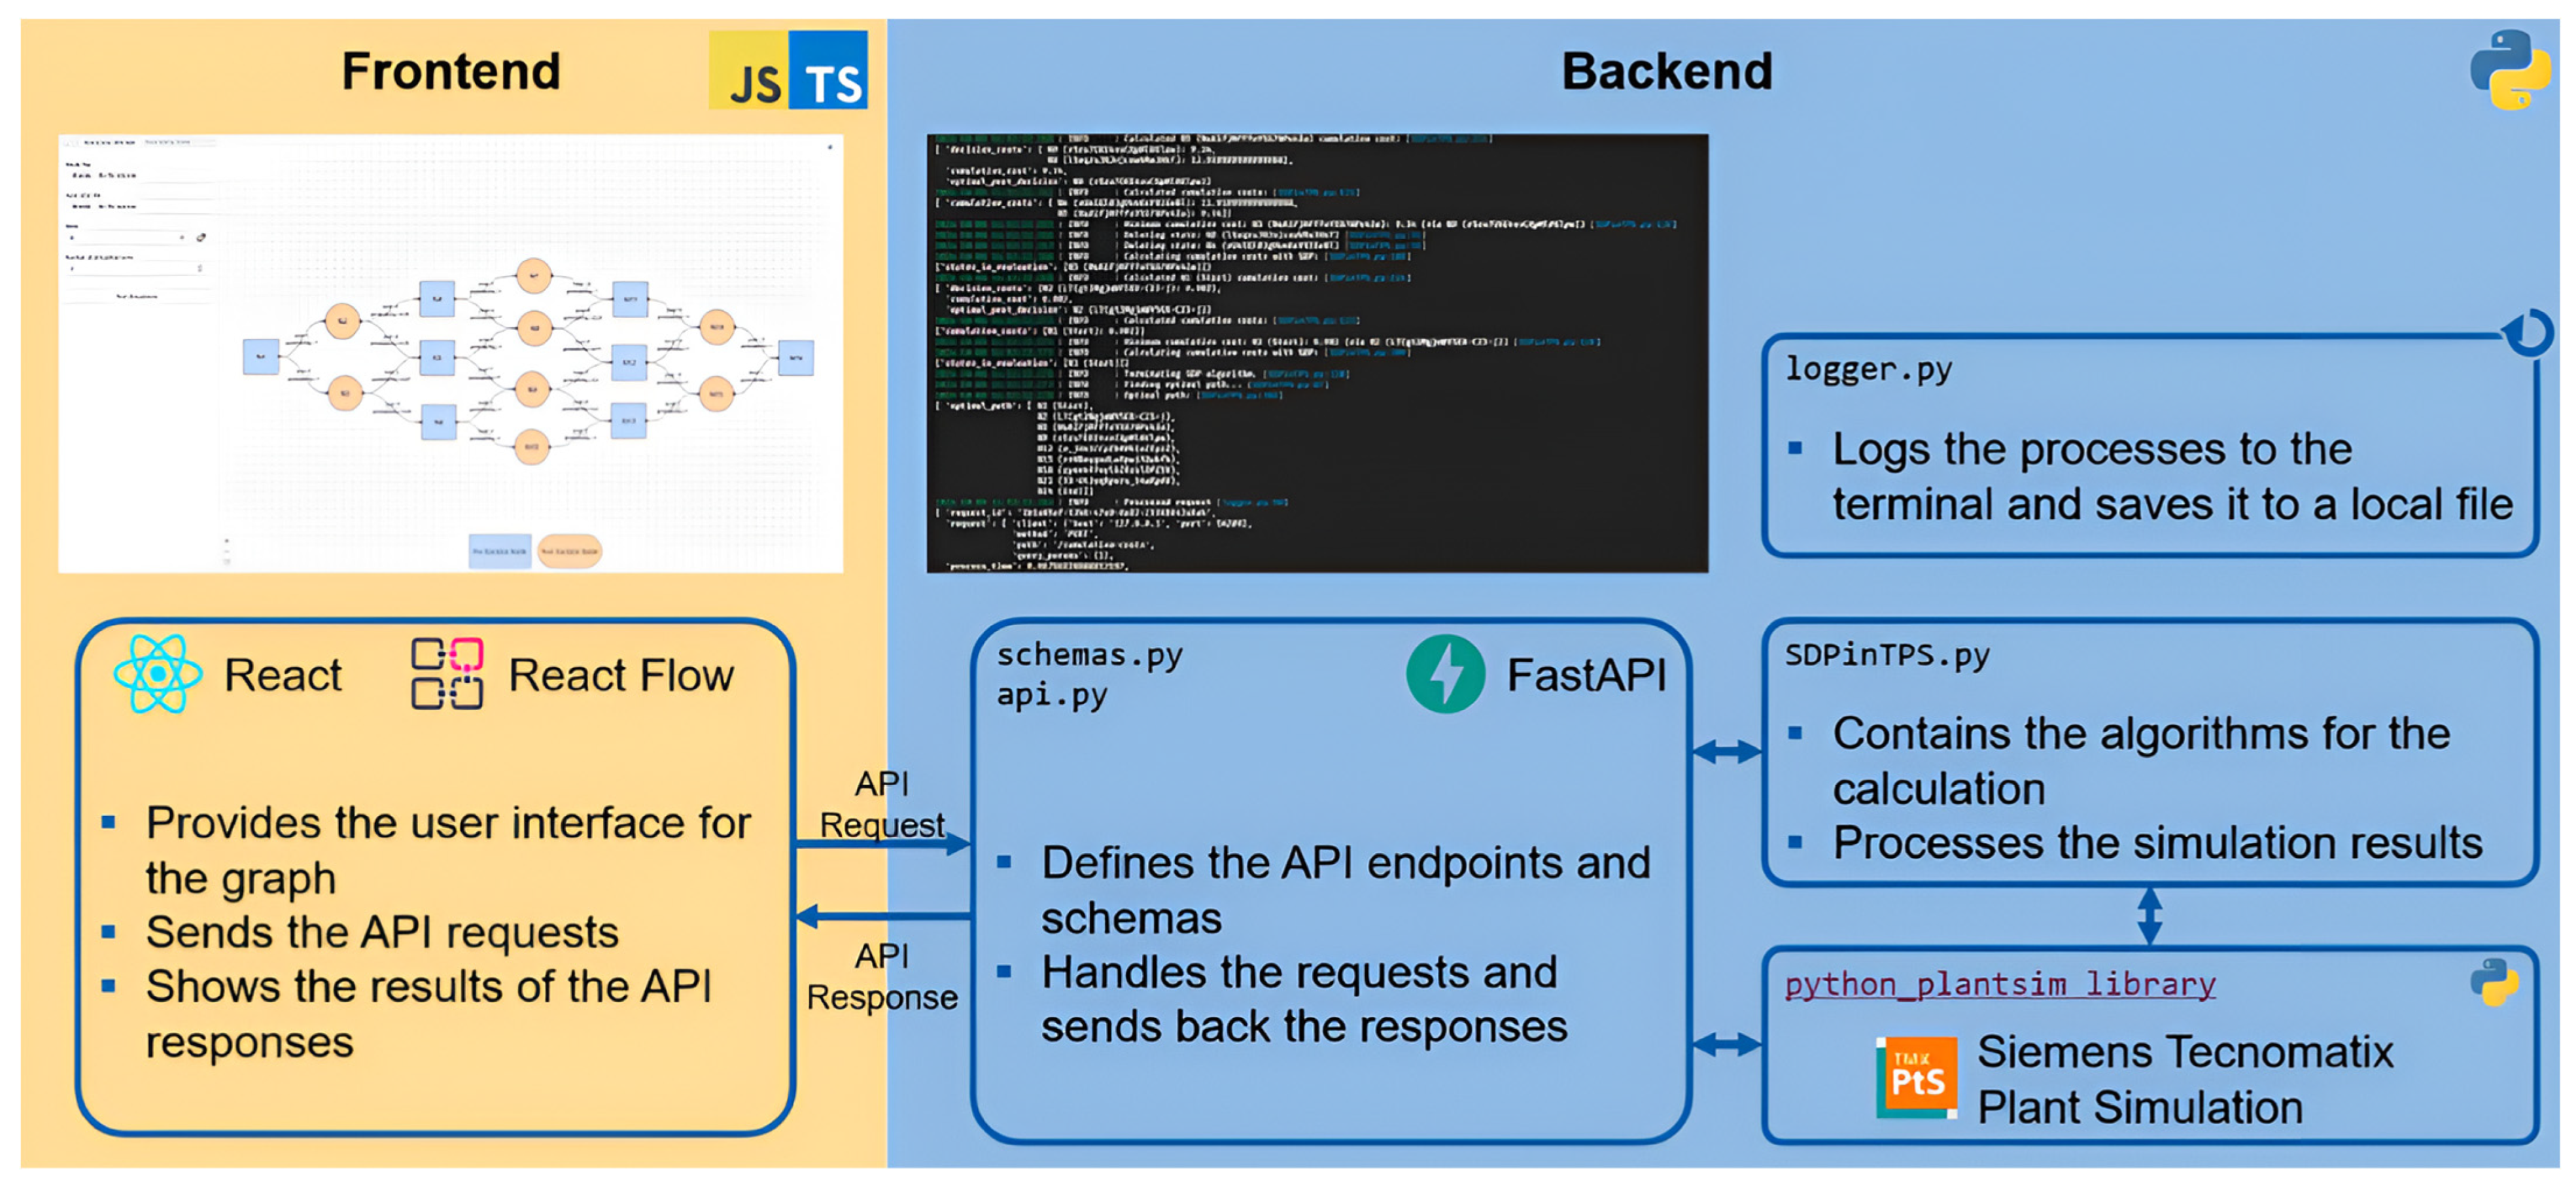
The seamless integration of the DT, CEM, and GS ensures a cohesive workflow where simulation, experimentation, and optimisation are performed in tandem. The tool enables precise modelling of complex manufacturing systems. It allows users to explore alternative scenarios, evaluate system performance under uncertainty, and derive actionable insights to support decision-making. The architecture of the Policy Maker tool is illustrated in Figure 5. Python 3.12 was used for the tool development.
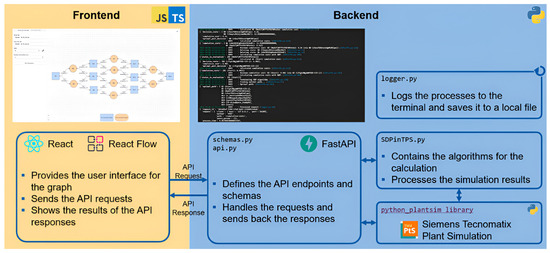
Figure 5.
The architecture of the Policy Maker tool.
To summarise the technical workflow, the input data required for simulations are provided in a standardised tabular format, with object paths and attribute values defined for each relevant parameter. The CEM dynamically modifies input values, triggering multiple DT discrete event simulations of defined scenarios on the decision graph. The SDP-based GS processes the results from these simulations, and evaluates the system states and determines the optimal sequence of actions to achieve ramp-up objectives efficiently. Outputs are logged and available for visualisation through the user-friendly React-based front end.
This architecture, combining simulation-based experimentation with dynamic optimisation, positions the Policy Maker to be an effective tool for analysing, optimising, and managing the ramp-up phase of manufacturing systems efficiently and proactively. By leveraging the flexibility of the CEM, the precision of the DT, and the GS’s decision-making capabilities, the tool aims to provide a comprehensive solution for addressing the complexities inherent in ramp-up processes. The developed architecture provides real-time decision support for various production ramp-up scenarios, including gradually integrating equipment and other resources, implementing quality improvement measures, and providing initiatives to enhance operator productivity.
5. Case Study: Production Ramp-Up of an Electric Battery Plant
A company specialising in electric battery production is preparing to open a new manufacturing plant. To achieve this goal, the company has acquired a facility where the new production system will be installed. For this purpose, the company issued a call for proposals from system integrators. The integrator selected through this competition will be responsible for designing and implementing the production system in the newly acquired facility.
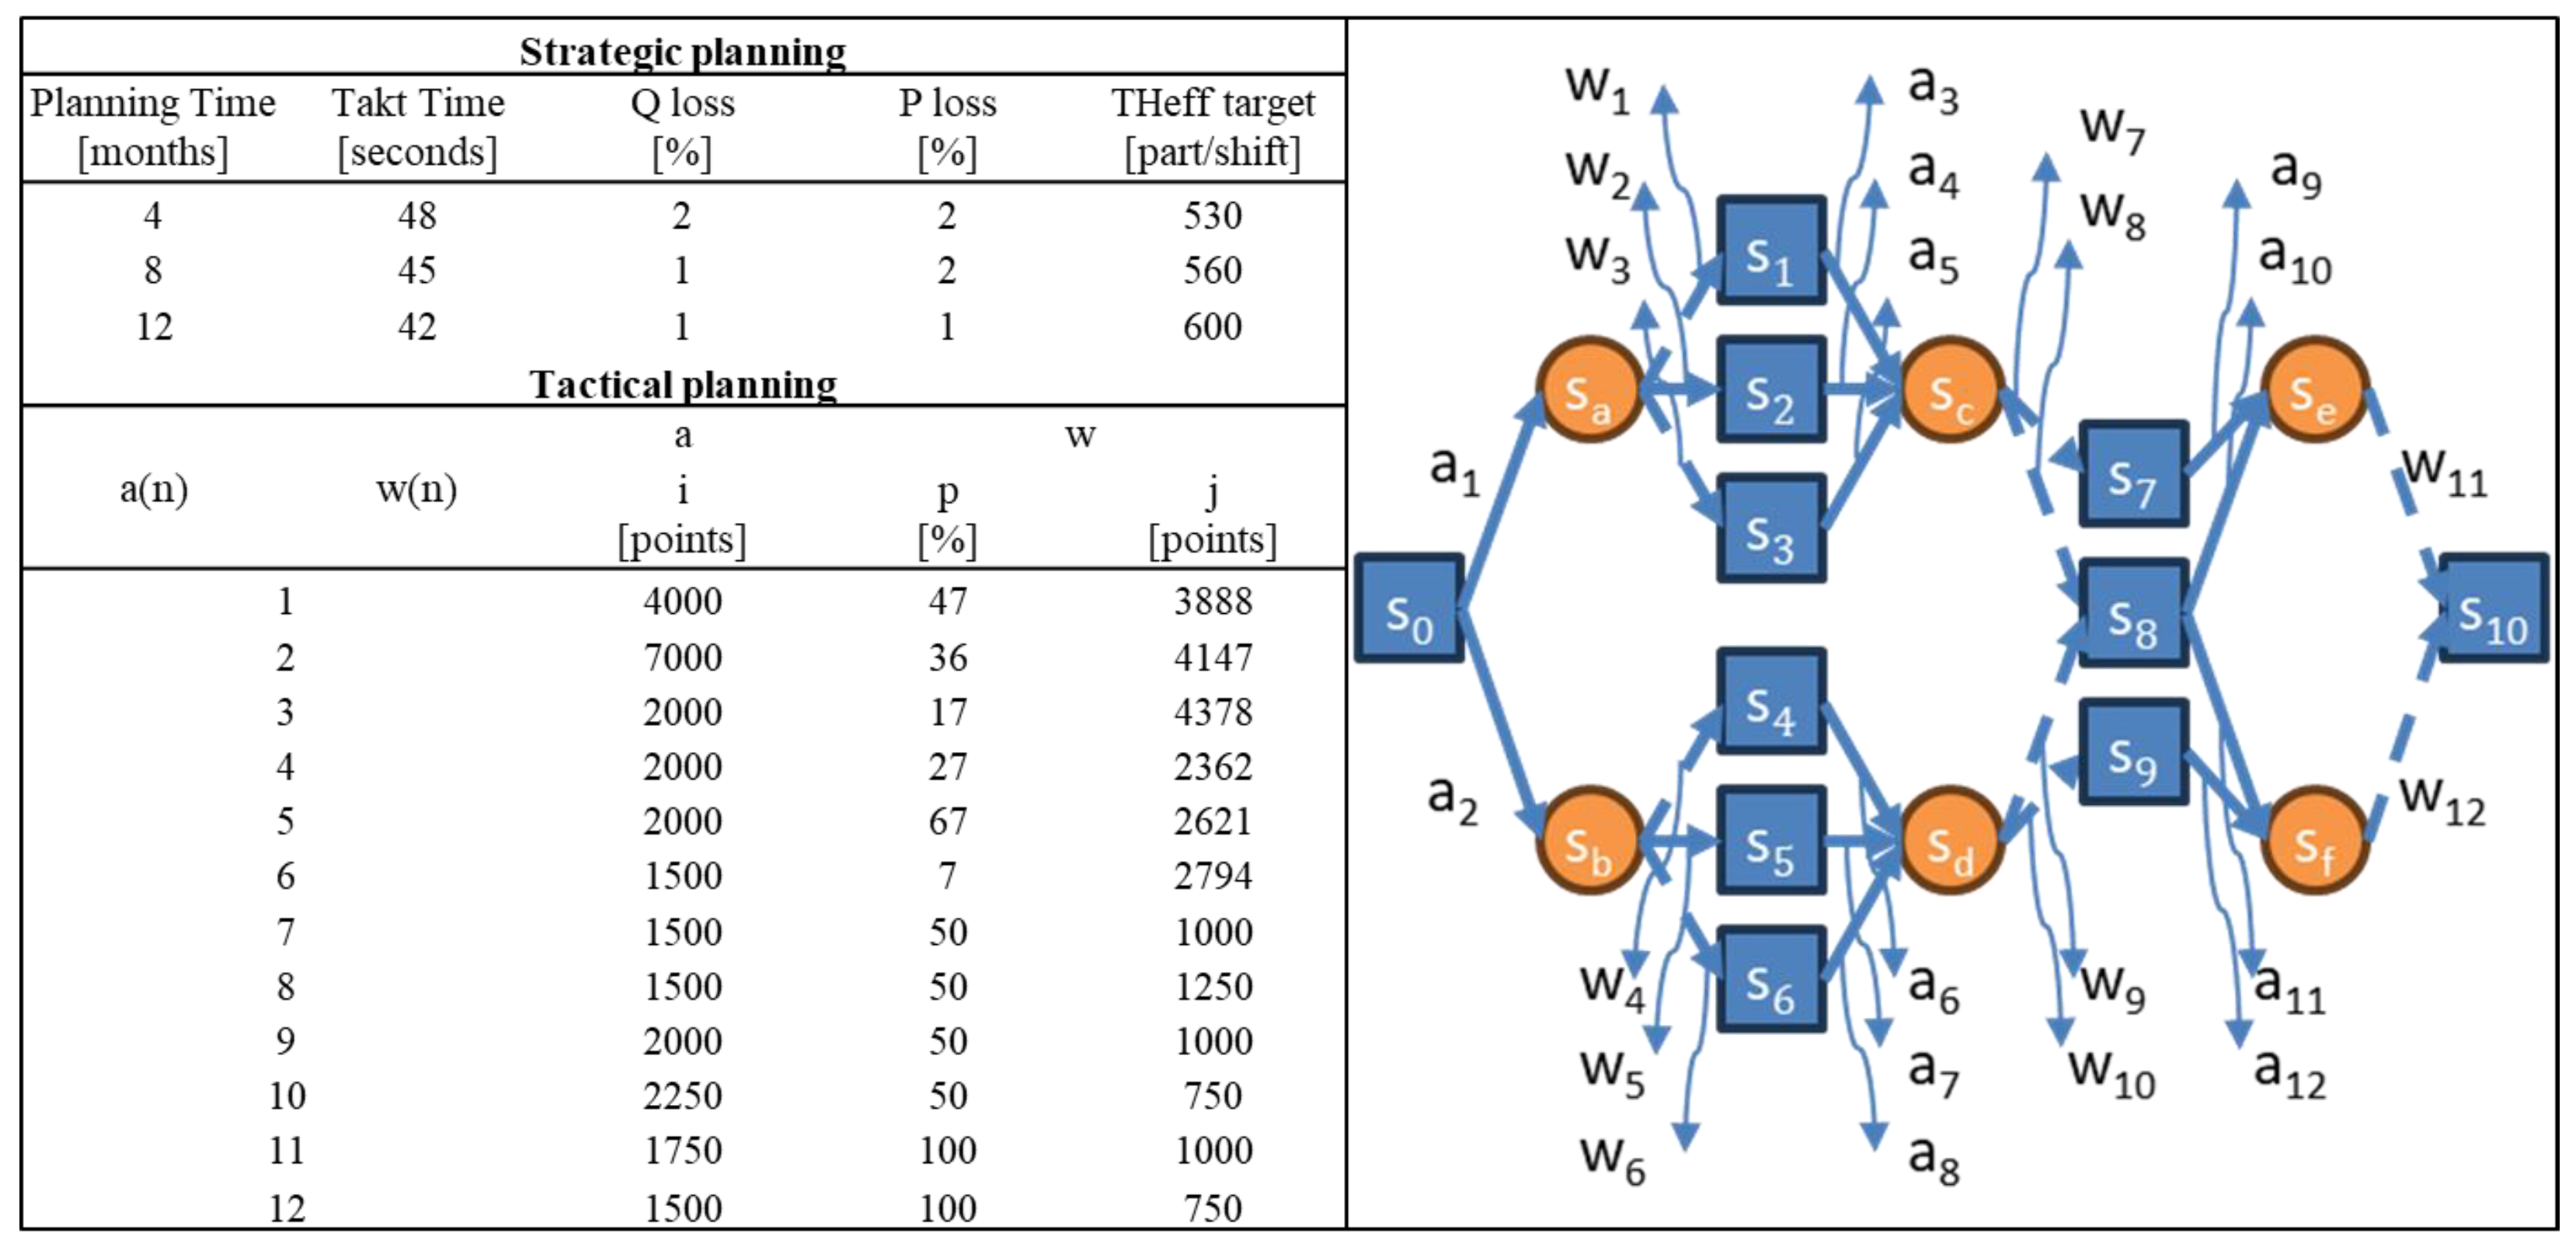
Figure 6 presents the production targets for a one-year ramp-up period, divided into four-month intervals. Here, the actions represent the integrators’ choice, implying various changes in the production system. The upper-level management provided the strategic vision and high-level planning for achieving these goals. Meanwhile, the current work combines the data from the system integrators and formulates tactical planning, which differs from the strategic plan in the level of detail modelled between each strategic goal. States and uncertainties were defined and added to the decision graph depicted in the figure to model the production ramp-up process realistically using a developed tool. Notations follow Section 3.2 of the methodology part of this work.
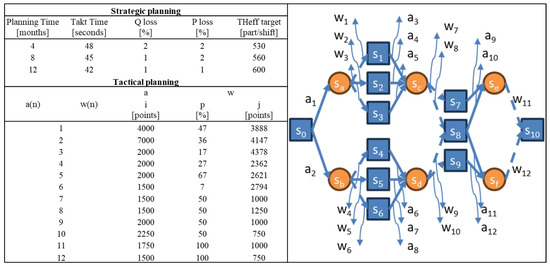
Figure 6.
Graph of scenarios.
In the decision graph, each state transition incurs an immediate cost and is influenced by a stochastic element representing uncertainty, which has a probability of occurring and leads to a future cost . These values, immediate costs, probabilities, and future costs were carefully estimated through simulations and expert knowledge.
The competing system integrators provided immediate costs to , while a set of simulation model experiments derived the probabilities of different outcomes, to . These simulations locked effective throughput outcomes into three clusters, defining high, medium, and low scenarios. Expert knowledge from the use case company was employed during the thresholds’ definition to ensure they were meaningful and practical. The thresholds were determined as fractions of the best-case simulated throughput in this use case. For example, if the best-case effective throughput equalled 100 units per unit of time, the medium- and low-performance thresholds were set at 66.6 and 33.3 units per unit of time, respectively. For each simulation subset representing a system state, the future cost was calculated by multiplying the , compared to the effective target throughput, by the product’s unit price.
This process allowed us to define sub-scenarios representing the system’s performance under uncertainty on the path from the current to the target state. Specifically, for the action leading to the state , the sub-scenarios , , and represent high, medium, and low production performance. Similarly, subsequent actions leading to , , and are represented by additional sub-scenarios to , each characterised by different levels of performance and uncertainty. Beyond system performance, the outcomes of personnel training activities were also applied to the simulations of 8-month states and, consequently, incorporated into the decision graph. These estimations are represented in sub-scenarios , , and , each influenced by stochastic effects , , and . In this case, the target state represents the performance achieved after tuning activities to , further subject to uncertainties and . The level of uncertainty across these sub-scenarios inside the simulation models and personnel training was determined during interviews with use case company representatives and production system integration experts. A key observation was that internal model uncertainty is inversely related to the level of process automation: manual processes exhibit greater stochasticity than automated ones.
Then, using the previously described SDP method, implemented in the Policy Maker tool, we solved the decision graph to determine the optimal policy vector . The optimal policy identifies the best action to take at each pre-decision state to minimise the cumulative cost and efficiently achieve the production ramp-up goals under stochastic conditions.
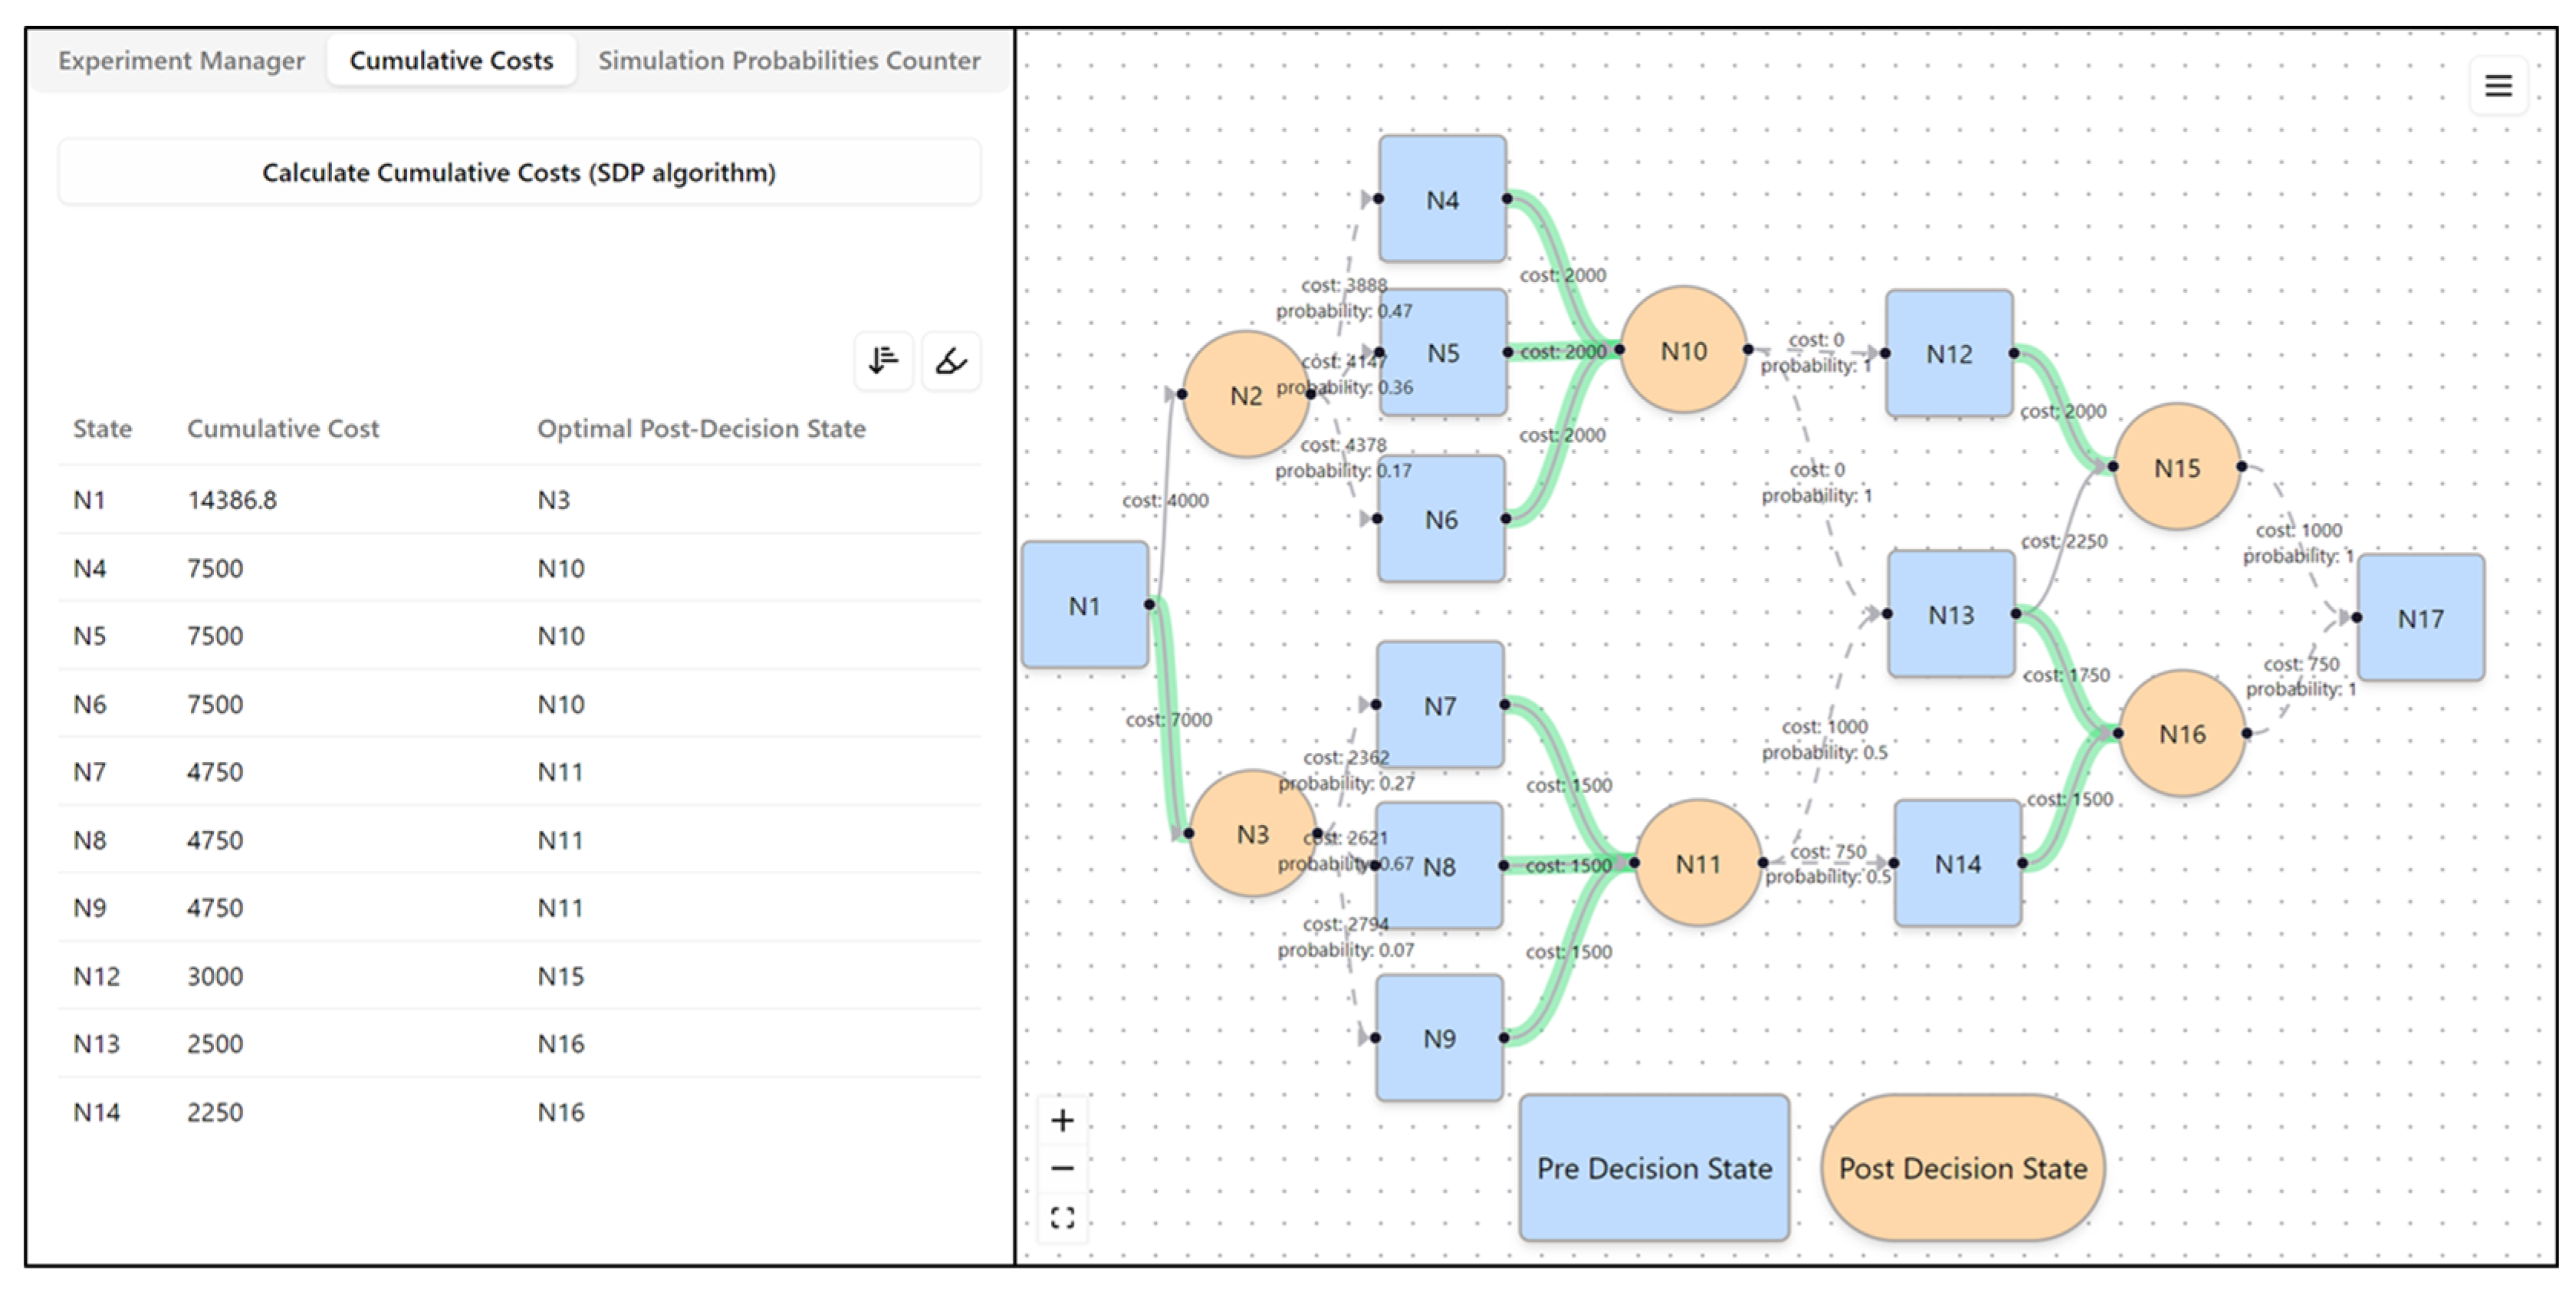
As shown in Figure 7, the optimal policy is represented by the green lines connecting pre-decision states (blue squares) to post-decision states (orange circles). These green paths indicate the actions that lead to the minimal cumulative cost while accounting for uncertainties and stochastic outcomes. For instance, at state , the optimal action transitions the system to , where subsequent decisions continue to follow the least-cost trajectory.
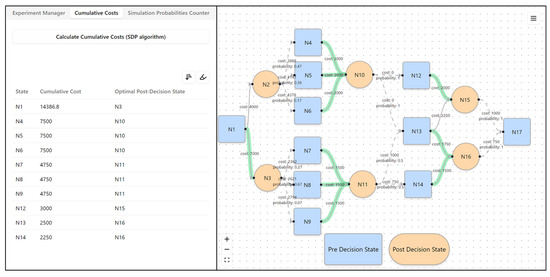
Figure 7.
Graph of solved scenarios.
The cumulative costs for each state and their corresponding optimal post-decision states are summarised in the table on the left side of Figure 7. For example, starting from , the cumulative cost is approximately 14,386.89, and the optimal next state is . Similarly, for other pre-decision states (, , etc.), the table provides insights into the expected costs and recommended transitions.
Techniques described in the work of Rabe [26] were used to validate the enhanced PSM framework. In particular, animation, structured walkthroughs, and submodel testing were conducted in the simulation model to verify component functionality and logical behaviour. Face validity checks, supported by domain expertise, confirmed the reasonableness of the results, while continuous monitoring addressed potential inconsistencies. Moreover, internal validity tests analysed multiple runs under identical initial conditions to assess consistency. Specifically, a low standard deviation of 5% was observed within the clusters of solutions defining the states from the decision graph. This finding indicates that the framework maintains high stability and consistency in evaluating and transitioning between decision states, even in the presence of stochastic variability. This validation process reinforces the PSME framework’s reliability and applicability, supporting its role in addressing the complexity and uncertainty of production ramp-up scenarios.
This way, the optimal path through the production system evolution decision graph was defined and validated. The use-case company used the findings to navigate through the optimal action policy, choosing the most reliable integrator. Even though at this point the developed tool lacks the possibility of structural model change testing, it matches theoretical findings and can introduce parametric changes both on the conceptual and simulation levels. Therefore, it can be used in actual industrial environment cases.
6. Conclusions
The PSME framework offers a novel approach to addressing the challenges of complexity and uncertainty in production ramp-up management by integrating stochastic dynamic programming, DT technology, and simulation-based experimentation. This approach demonstrates significant potential for enhancing decision-making, optimising system performance, and reducing throughput losses during the ramp-up phase. The Policy Maker tool allows for systematic evaluation of production system evolution, enabling practitioners to assess the impact of various decisions and strategies in a controlled, simulated environment.
This research addresses a gap in the literature. Existing methods often focus on qualitative analyses or isolated aspects, such as workforce training or equipment configuration, without providing a system-level, quantitative approach. Previous studies have not sufficiently explored the integration of DT and advanced decision-support techniques, such as stochastic dynamic programming, to tackle the dynamic and stochastic nature of ramp-up processes holistically. By filling this void, PSME bridges the gap between theoretical methods and practical applications, offering a comprehensive framework for modern manufacturing challenges.
Indeed, a key strength of the framework lies in its ability to provide actionable insights by modelling stochastic variability and dynamic production states. This is particularly valuable in scenarios where traditional deterministic methods fail to capture the uncertainties and complexities of real-world production systems. Integrating metrics such as and OEE further enhances the framework’s applicability, providing measurable indicators for evaluating ramp-up performance. Validation efforts demonstrated the framework’s robustness, with low variability observed within the clusters of decision graph states across multiple simulation runs, underscoring its consistency and reliability in capturing complex production dynamics.
However, the framework is not without limitations. One significant challenge is the computational intensity of the simulation processes, which can become a bottleneck for large-scale applications. While this study did not directly address this issue, future research could explore machine learning algorithms to approximate simulation results and reduce computational requirements. This could significantly enhance the framework’s practicality for real-time and iterative decision-making scenarios.
Another limitation lies in the reliance on decision graphs to structure solutions. While effective for many scenarios, this approach may not adequately represent more complex or multi-dimensional decision spaces. Alternative structures, such as decision trees or hybrid models, could provide greater flexibility and adaptability, expanding the framework’s applicability to a broader range of use cases.
The case study presented in this work demonstrates the framework’s capability to effectively model and optimise a production ramp-up scenario. However, its findings are based on specific assumptions and conditions, limiting generalisability to other contexts. Further validation through diverse case studies across industries and production systems is essential to fully understanding the framework’s robustness and scalability.
Overall, PSME provides a strong foundation for addressing the challenges of modern ramp-up management. Combining digital technologies, stochastic optimisation, and actionable decision-support tools bridges the gap between theoretical approaches and practical applications. Future enhancements focusing on computational efficiency, decision structure flexibility, and real-time adaptability will further solidify its role as a critical tool for production ramp-up in dynamic manufacturing environments.
Author Contributions
Conceptualisation, O.M.; methodology, O.M.; software, O.M.; validation, O.M.; formal analysis, O.M. and J.B.; investigation, O.M.; resources, A.G.; data curation, O.M. and J.B.; writing—original draft preparation, O.M.; writing—review and editing, O.M., J.B., A.G., T.T. and R.H.S.; visualisation, O.M.; supervision, T.T. and R.H.S.; project administration, T.T. and A.G.; funding acquisition, R.H.S. All authors have read and agreed to the published version of the manuscript.
Funding
This research was funded by the German Federal Ministry of Economics and Climate Protection (BMWK), grant number 16BZF311, as part of the research and development project “REVAMP”. The project was organised by VDI/VDE-IT.
Data Availability Statement
The use-case company data is not publicly available. However, the source code for the modules of the decision support framework can be provided upon request.
Acknowledgments
The authors would like to acknowledge the invention of the concept of ‘Pit-Stop Manufacturing’ in practical industrial application by Gianluigi Viscardi, CEO of Cosberg SpA.
Conflicts of Interest
The authors declare no conflict of interest.
References
- Alsahali, K.F.; Malagueño, R. An empirical study of sustainability reporting assurance: Current trends and new insights. J. Account. Organ. Change 2022, 18, 617–642. [Google Scholar] [CrossRef]
- Mura, P.O.; Donath, L.E. Digitalisation and Economic Growth in the European Union. Electronics 2023, 12, 1718. [Google Scholar] [CrossRef]
- Basse, I.; Schmitt, S.; Gartzen, T.; Schmitt, R. Solution Principles for Managing Instabilities in Ramp-up. Procedia CIRP 2014, 20, 93–97. [Google Scholar] [CrossRef]
- Colledani, M.; Tolio, T.; Yemane, A. Production quality improvement during manufacturing systems ramp-up. CIRP J. Manuf. Sci. Technol. 2018, 23, 197–206. [Google Scholar] [CrossRef]
- Tolio, T.A.M.; Magnanini, M.C. The Paradigm of Pit—Stop Manufacturing. In Proceedings of the 4th International Conference on the Industry 4.0 Model for Advanced Manufacturing, Belgrade, Serbia, 3–6 June 2019; Monostori, L., Majstorovic, V.D., Hu, S.J., Djurdjanovic, D., Eds.; Springer International Publishing: Cham, Switzerland, 2019; pp. 35–47, ISBN 978-3-030-18179-6. [Google Scholar]
- Melnychuk, O.; Rachner, J.; Kaven, L.; Göppert, A.; Schmitt, R.H.; Tolio, T. Evaluation of Material Shortage Effect on Assembly Systems Considering Flexibility Levels. Procedia CIRP 2022, 107, 966–971. [Google Scholar] [CrossRef]
- Doltsinis, S.C.; Ratchev, S.; Lohse, N. A framework for performance measurement during production ramp-up of assembly stations. Eur. J. Oper. Res. 2013, 229, 85–94. [Google Scholar] [CrossRef]
- Kukulies, J.; Schmitt, R. Stabilizing production ramp-up by modeling uncertainty for product design verification using Dempster–Shafer theory. CIRP J. Manuf. Sci. Technol. 2018, 23, 187–196. [Google Scholar] [CrossRef]
- Fleischer, J.; Lanza, G.; Ender, T. OEE Simulation in Production Ramp-up. In Proceedings of the 3rd International Industrial Simulation Conference 2005: ISC 2005, Berlin, Germany, 9–11 June 2005; Krüger, J., Ed.; Eurisis-ETI: Berlin, Germany, 2005; pp. 173–178, ISBN 90-77381-18-X. [Google Scholar]
- Muchiri, P.; Pintelon, L. Performance measurement using overall equipment effectiveness (OEE): Literature review and practical application discussion. Int. J. Prod. Res. 2008, 46, 3517–3535. [Google Scholar] [CrossRef]
- Schmitt, S.; Schmitt, R. Lifecycle Oriented Ramp-Up—Conception of a Quality-Oriented Process Model. In Re-Engineering Manufacturing for Sustainability; Nee, A.Y.C., Song, B., Ong, S.-K., Eds.; Springer: Singapore, 2013; pp. 441–445. ISBN 978-981-4451-47-5. [Google Scholar]
- Schmitt, R.; Heine, I.; Jiang, R.; Giedziella, F.; Basse, F.; Voet, H.; Lu, S. On the future of ramp-up management. CIRP J. Manuf. Sci. Technol. 2018, 23, 217–225. [Google Scholar] [CrossRef]
- Terwiesch, C.; Bohn, R.E. Learning and process improvement during production ramp-up. Int. J. Prod. Econ. 2001, 70, 1–19. [Google Scholar] [CrossRef]
- Niroomand, I.; Kuzgunkaya, O.; Bulgak, A.A. The effect of system configuration and ramp-up time on manufacturing system acquisition under uncertain demand. Comput. Ind. Eng. 2014, 73, 61–74. [Google Scholar] [CrossRef]
- Glock, C.H.; Grosse, E.H. Decision support models for production ramp-up: A systematic literature review. Int. J. Prod. Res. 2015, 53, 6637–6651. [Google Scholar] [CrossRef]
- Fjällström, S.; Säfsten, K.; Harlin, U.; Stahre, J. Information enabling production ramp-up. J. Manuf. Technol. Manag. 2009, 20, 178–196. [Google Scholar] [CrossRef]
- Ngo, Q.H.; Schmitt, S.; Ellerich, M.; Schmitt, R.H. Artificial intelligence based decision model for a quality oriented production ramp-up. Procedia CIRP 2020, 88, 521–526. [Google Scholar] [CrossRef]
- Göppert, A.; Grahn, L.; Rachner, J.; Grunert, D.; Hort, S.; Schmitt, R.H. Pipeline for ontology-based modeling and automated deployment of digital twins for planning and control of manufacturing systems. J. Intell. Manuf. 2023, 34, 2133–2152. [Google Scholar] [CrossRef]
- Goodson, J.C.; Thomas, B.W.; Ohlmann, J.W. A rollout algorithm framework for heuristic solutions to finite-horizon stochastic dynamic programs. Eur. J. Oper. Res. 2017, 258, 216–229. [Google Scholar] [CrossRef]
- Li, C.; Liu, F.; Cao, H.; Wang, Q. A stochastic dynamic programming based model for uncertain production planning of re-manufacturing system. Int. J. Prod. Res. 2009, 47, 3657–3668. [Google Scholar] [CrossRef]
- Cristobal, M.P.; Escudero, L.F.; Monge, J.F. On stochastic dynamic programming for solving large-scale planning problems under uncertainty. Comput. Oper. Res. 2009, 36, 2418–2428. [Google Scholar] [CrossRef]
- Wang, Y.; Wang, X.; Tao, F.; Liu, A. Digital twin-driven complexity management in intelligent manufacturing. Digit. Twin 2021, 1, 9. [Google Scholar] [CrossRef]
- Grieves, M.; Vickers, J. Digital Twin: Mitigating Unpredictable, Undesirable Emergent Behavior in Complex Systems. In Transdisciplinary Perspectives on Complex Systems; Kahlen, F.-J., Flumerfelt, S., Alves, A., Eds.; Springer International Publishing: Cham, Switzerland, 2017; pp. 85–113. ISBN 978-3-319-38754-3. [Google Scholar]
- Hansen, R.C. Overall Equipment Effectiveness: A Powerful Production/Maintenance Tool for Increased Profits; Industrial Press Inc.: New York, NY, USA, 2001; ISBN 9780831131388. [Google Scholar]
- Conway, R.W.; Maxwell, W.L.; Miller, L.W. Theory of Scheduling; Dover: Garden City, NY, USA, 2003; ISBN 9780486428178. [Google Scholar]
- Rabe, M.; Spiekermann, S.; Wenzel, S. Verifikation und Validierung für die Simulation in Produktion und Logistik; Springer: Berlin/Heidelberg, Germany, 2008; ISBN 978-3-540-35281-5. [Google Scholar]

Disclaimer/Publisher’s Note: The statements, opinions and data contained in all publications are solely those of the individual author(s) and contributor(s) and not of MDPI and/or the editor(s). MDPI and/or the editor(s) disclaim responsibility for any injury to people or property resulting from any ideas, methods, instructions or products referred to in the content. |
© 2025 by the authors. Licensee MDPI, Basel, Switzerland. This article is an open access article distributed under the terms and conditions of the Creative Commons Attribution (CC BY) license (https://creativecommons.org/licenses/by/4.0/).