1. Introduction
The digital economy is reshaping the global economic landscape and competitive dynamics. As the core engine driving a new round of technological revolution and industrial transformation, the digital economy not only gives rise to new production methods, business models, and value creation paradigms but also profoundly alters the trajectory of modernization, benefiting both local and global economies [
1,
2]. The digital economy has become an important measure of national competitiveness and a key component of new quality productive forces. Its catalytic effect on technological innovation, transformation and upgrading of traditional industries, and profound revolution of production relations provide powerful momentum for promoting the comprehensive upgrading of national governance and industrial policies and accelerating the formation of new quality productive forces [
3,
4]. However, the rapid development of the digital economy has also generated new governance challenges, such as data security, social equity, and sustainable development issues, and traditional governance models can hardly adapt to the complexity of the digital era [
5,
6]. Therefore, how to build a resilient and vibrant digital economy development model has become a major theoretical and practical topic facing countries worldwide.
The digital economy is a new form of economic development that continuously creates new products, business formats, and models by deeply integrating digital technology with the real economy, with digitized knowledge and data as key elements and modern information networks as the primary carrier [
7]. This definition highlights the value creation attributes of data elements, the enabling function of digital technology, and the development path of digital-real integration, providing a theoretical basis for analyzing digital economy development models. The industrial development model reflects the logic and characteristics of industrial development under specific conditions involving multiple dimensions such as technological innovation, factor allocation, market cultivation, and policy support [
8]. The digital economy development model refers to a series of methods and measures that use digital technology as the core driving force, with digital transformation as the main focus. They promote the digitalization of industries and the industrialization of digital technologies, and reshape the industrial development path, ecosystem, and governance mechanisms. This reflects the deep integration of digital technology and industrial development and represents a new paradigm for achieving high-quality growth. The research points out that constraints on development models are an important factor restricting the high-quality development of the digital economy, highlighting the urgent need for in-depth research on digital economy development models [
9].
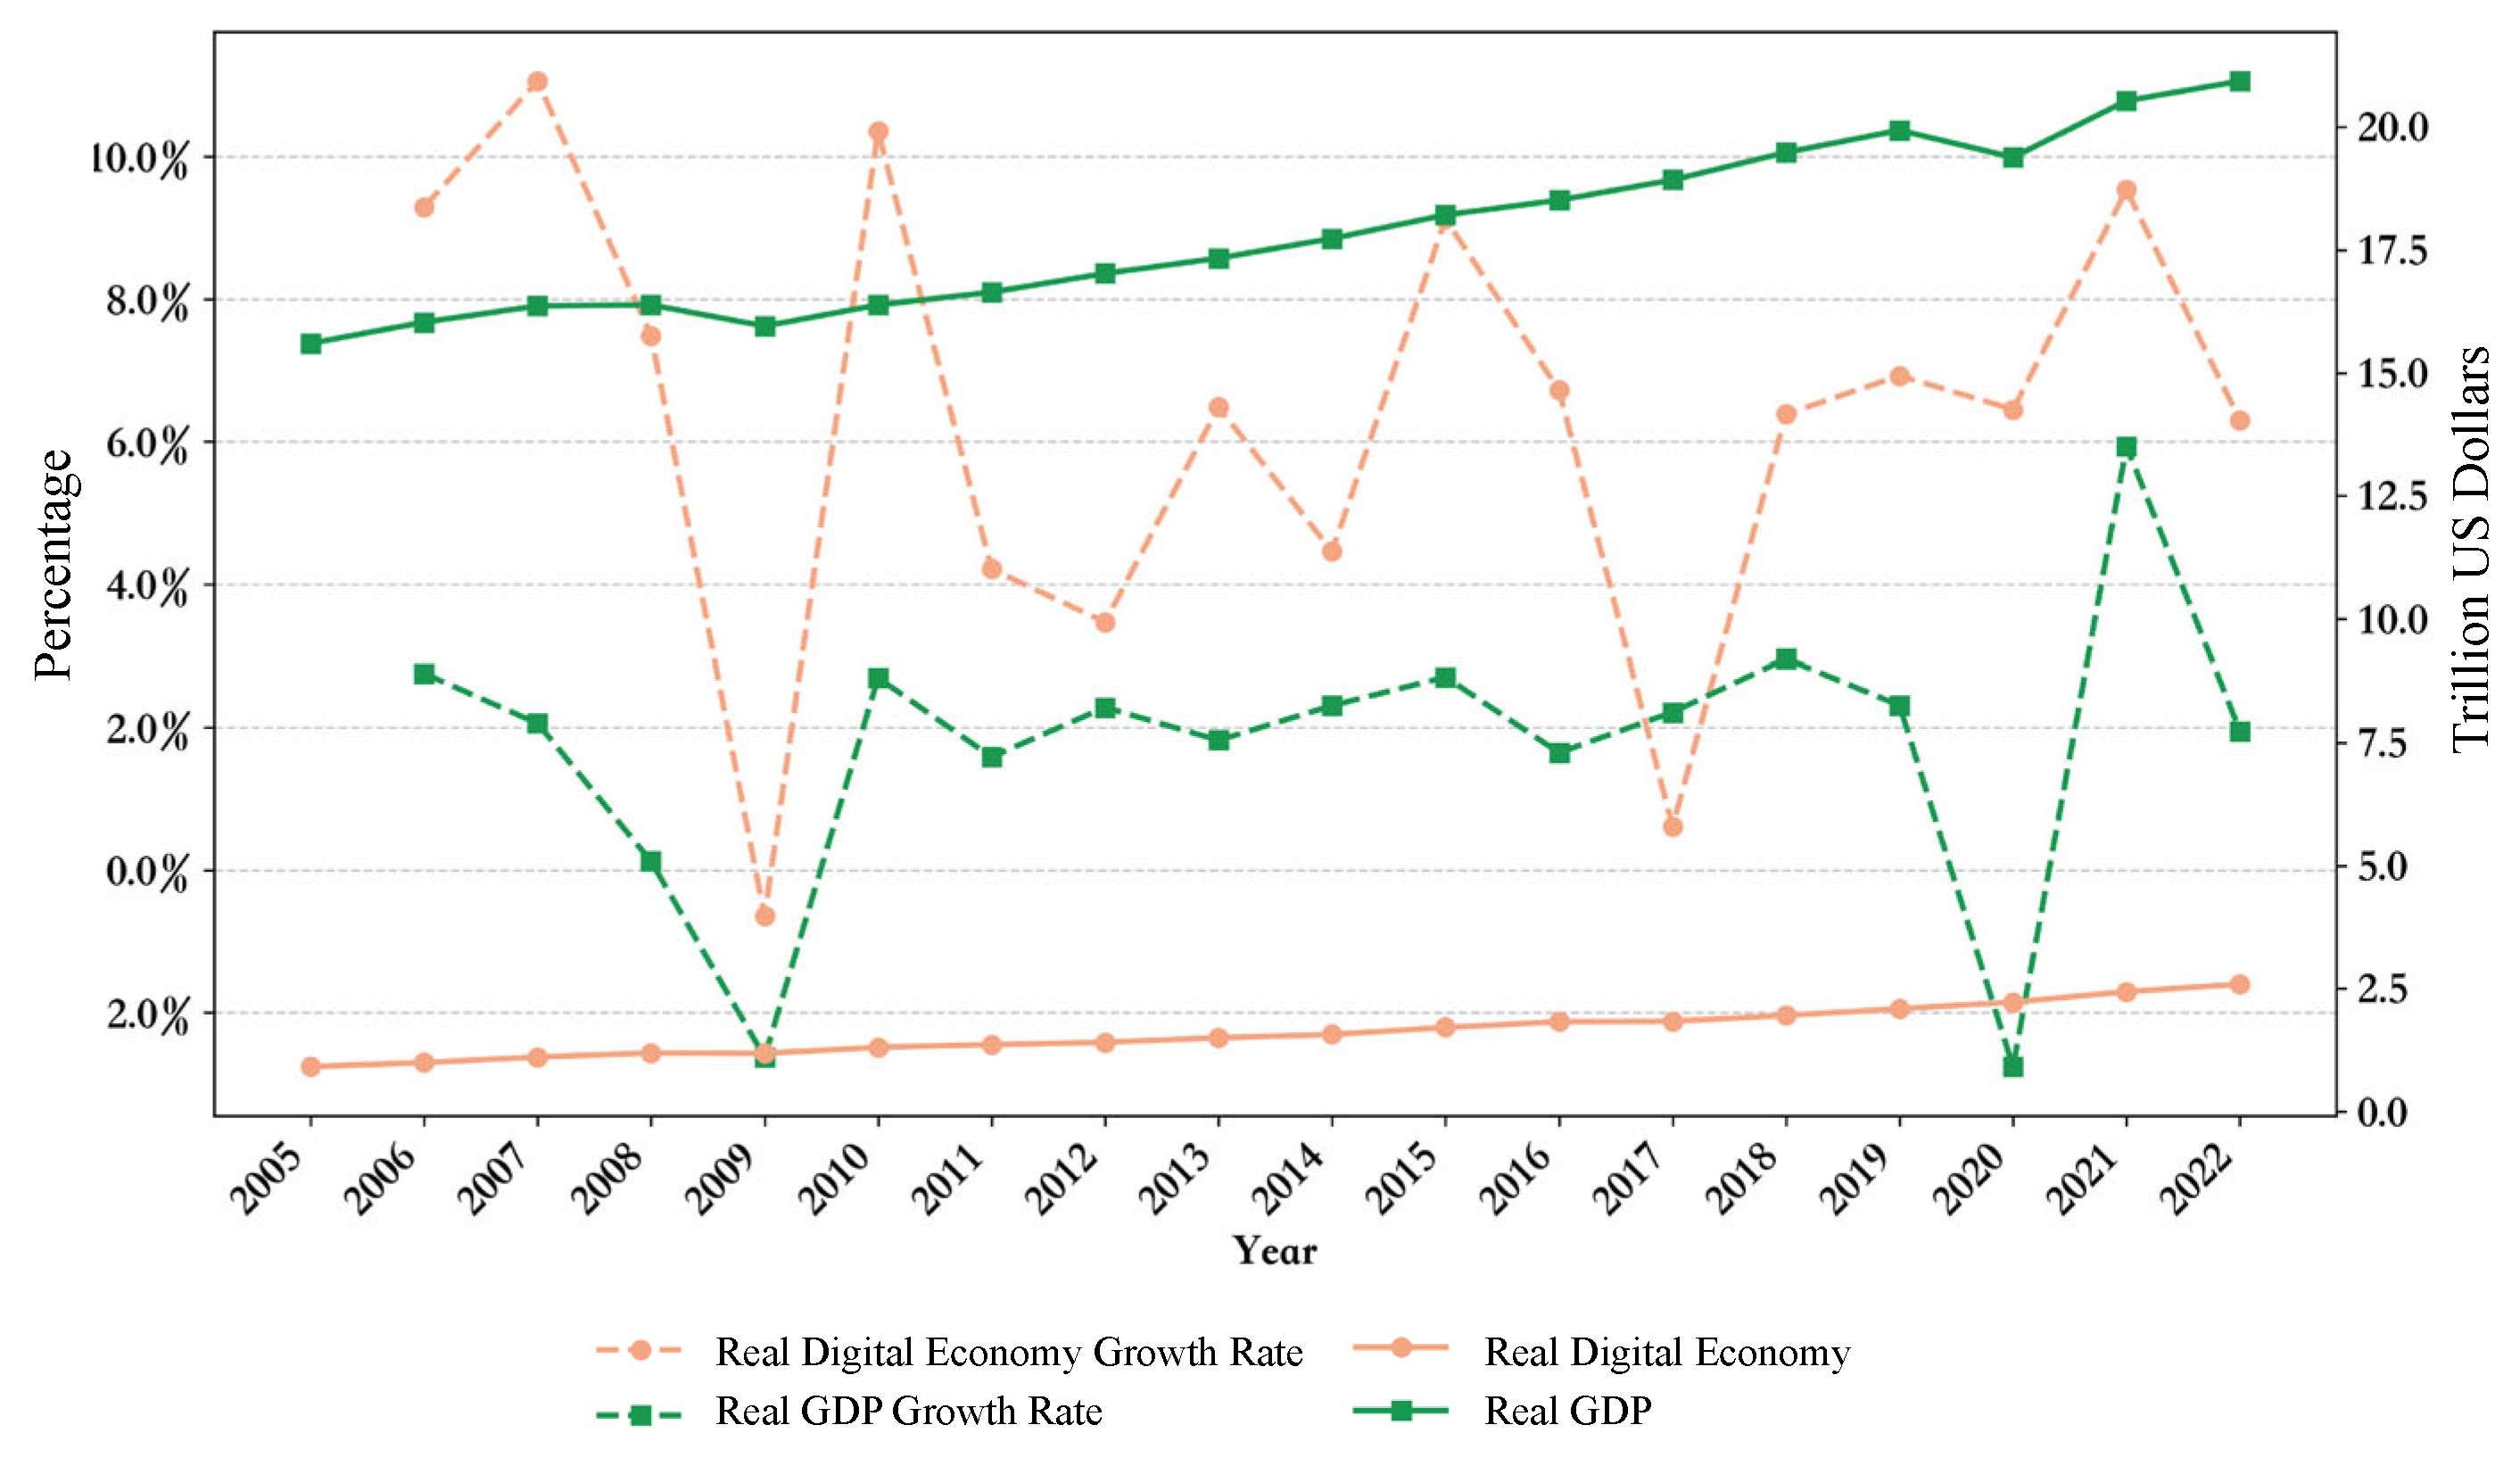
As the global leader in the digital economy, the United States has achieved significant strategic success, with its digital economy scale reaching
$17.2 trillion in 2022, accounting for approximately 74.7% of its GDP. Through decades of continuous development, the United States has accumulated rich experience and formed systemic advantages in essential technology research and development, digital technology innovation, industrial ecosystem cultivation, market mechanism optimization, and other aspects, establishing its dominant position in the global digital economy. However, existing research mostly focuses on single dimensions such as technological innovation paths, platform economy development, or talent cultivation mechanisms. Some scholars have explored the development path of the U.S. digital industry from the perspective of technological innovation [
10,
11], while others have focused on aspects like the platform economy and higher education to analyze the driving factors and competitive advantages of the U.S. digital economy’s development [
12,
13]. However, the complexity of the digital economy requires a multidimensional and comprehensive analytical framework, especially in the current new stage characterized by the deep integration of digital technology and industry and the accelerated coupling of digital and physical spaces. There is an urgent need to construct a more integrative and dynamic analytical framework to reveal the internal logic and evolutionary patterns of the U.S. digital economy’s development, and to systematically evaluate how policy guidance, institutional coordination, and talent development interact to maintain leadership in the digital economy [
5,
14]. In particular, how the U.S. government strategically balances industrial competitiveness and digital security, effectively coordinates multiple stakeholders, and systematically cultivates digital talents has not been thoroughly discussed in the existing international literature.
The research questions addressed in this paper are as follows: As the most developed country in the global digital economy, how does the U.S. integrate its resources, such as policies, mechanisms, and talents, to maintain its global leading position in the digital economy? How do we explore the internal laws of American digital economy development from a management model perspective? Analyzing these questions and finding answers to solve them are this paper’s research motivations and objectives. Based on this, this paper innovatively proposes the PCT (Policy–Coordination–Talent) model for developing the digital economy. It analyzes the development and governance of the U.S. digital economy from three key dimensions: policy guidance, coordination mechanisms, and talent cultivation. Specifically, in the policy guidance dimension, we construct a strategy matrix based on perceived competitiveness and security to analyze the evolutionary characteristics of U.S. digital economy policies and examine how the United States seeks a balance between industrial security and competitiveness. In the coordination mechanism dimension, we combine industry maturity and core intellectual property (IP) concentration to study how the U.S. government adopts differentiated coordination strategies according to the industrial development stage and distribution of innovation capabilities. In the talent cultivation dimension, we explore how the United States establishes a talent training system adapted to the needs of the industrial value chain from the perspective of value creation and talent attributes, revealing the characteristics of talent cultivation in the U.S. digital economy industry. The answers to these questions will help us understand the systemic features of the U.S. digital economy’s development and provide insights into the development of China’s digital economy.
The contributions of this research can be articulated at both theoretical and practical levels. This study makes three key theoretical contributions: First, it develops the Policy–Coordination–Talent (PCT) analytical framework, addressing the limitation of existing research that often examines digital economy development from singular perspectives; the PCT framework provides an integrated approach that considers the interconnected roles of government policies, coordination mechanisms, and talent development strategies in shaping digital economy outcomes. Second, based on systematic analysis of policy documents, patent data, and unicorn companies’ development patterns, we construct three analytical matrices: (1) a policy intensity matrix based on perceived competitiveness and perceived security dimensions; (2) a coordination mechanism matrix incorporating industry maturity and core IP concentration; and (3) a talent cultivation matrix combining industry value chain positioning with talent attributes. These matrices can serve as analytical tools for studying digital economy governance approaches and industrial policy implementation. Third, by applying the PCT framework to analyze the U.S. case, the study provides deeper insights into the developmental mechanisms that have facilitated the U.S.’s position in the digital economy. At a practical level, the findings can provide reference points for policymakers seeking to strengthen digital economy governance systems. The PCT framework and analytical matrices may help identify priority areas for digital economy development strategies, particularly for emerging digital economies aiming to strengthen their position in the global digital landscape.
Section 2 reviews the literature on digital economy development models.
Section 3 presents the PCT analytical framework.
Section 4 applies the PCT framework to analyze the U.S. digital economy.
Section 5 concludes and discusses implications.
Section 6 offers policy recommendations for China’s digital economy development.
2. Related Literature Review
With the rapid development and widespread application of digital technologies, the digital economy has become an important engine driving global economic growth. Data from the U.S. Department of Commerce shows that from 2017 to 2022, the U.S. digital economy grew at an average annual rate of 7.1%, significantly higher than the average annual GDP growth rate of 2.2% [
15]. To systematically review the existing research, this section examines four key areas: the role of the digital economy in enabling high-quality economic development, governance approaches to the digital economy, key factors influencing digital economy development, and current research gaps that this study aims to address.
2.1. Digital Economy Empowers High-Quality Economic Development
The digital economy has become a critical driver for economic growth and structural transformation globally. Many nations are positioning digital economy development as a strategic priority for constructing new development patterns and establishing national competitive advantages [
16,
17]. However, developing economies often face structural challenges in their digital development journey. Despite impressive growth in scale, many countries still need breakthroughs in core technology innovation and key industry chain development, resulting in digital economies that are significant in scale but lacking in core technological capabilities. Notable gaps exist between developing and advanced digital economies, particularly in governance structures and innovation ecosystem construction [
18].
From a macro perspective, the digital economy is important in promoting economic transformation and upgrading, promoting high-quality development of regional economies, and enhancing regional innovation levels [
19]. The digital economy positively impacts renewable energy consumption and power generation transformation, and improves energy efficiency by promoting green technology innovation [
20]. Furthermore, the digital economy provides new momentum for low-carbon development by strengthening green technology innovation, optimizing industrial structure, and improving resource utilization efficiency [
21,
22,
23].
From a micro perspective, the digital economy provides new momentum for enterprise organizational reform and operational capability improvement. Digital technology innovation has become a core factor driving economic development across regions. The development of digital economies creates conditions for high-quality enterprise development by improving capital and labor utilization efficiency, optimizing resource allocation, and promoting economic model transformation from factor-input driven to efficiency-driven growth [
16,
24]. The digital economy can also significantly enhance enterprise innovation capability from aspects of innovation input, innovation output, and innovation efficiency [
25,
26]. Digital transformation effectively breaks enterprise innovation barriers by alleviating financial constraints and improving corporate governance, with this effect being more significant in high-tech industries and industries with intense competition [
27].
In addition, the relationship between the digital economy and national sustainable competitiveness has also been a focus of academic attention. Balkyte and Tvaronavičiene (2010) proposed the concept of “sustainable competitiveness”, suggesting that competitiveness should be built on a broad vision of economy and society, requiring research on how sustainable development and competitiveness interact [
28]. The concept of national competitiveness and its policy practicality has been explored from the perspective of international economics [
29]. More recently, the concept of digital resilience has emerged, emphasizing how digital technology helps build the ability to absorb shocks, adapt to disruptions, and transition to new stable states [
30]. A comprehensive study of 274 cities in China [
31] has explored the impact mechanism and spatial effects of the digital economy on urban economic resilience.
2.2. Digital Economy Governance
Globally, digital economy governance has become an essential component of national governance modernization. With the penetration of digital technology, the world is facing challenges in constructing a sustainable digital economy.
Digital economy governance strategies vary in their approach to balancing market forces and regulatory intervention. Linkov et al. identified three principal strategies: market-oriented laissez-faire, government preventive intervention, and government-led active regulation with innovation promotion [
2]. Interventionist policies are crucial for addressing structural challenges in developing economies, particularly regarding platform power imbalances and domestic enterprise limitations [
14]. For European contexts, the priorities are in digital infrastructure investment, value chain asset strengthening, and R&D advancement [
32].
At the organizational level, traditional governance mechanisms often prove inadequate for digital economy challenges. A custodial governance model was proposed based on “authenticity, transparency, trust, and technological fairness” to address these limitations [
1]. The effectiveness of governance approaches varies across contexts, as evidence suggests that good governance positively impacts sustainable digital economy development through social reform and economic policy mechanisms [
33]. Further investigations have identified synergistic effects between digital economy development and government governance in promoting urban low-carbon transformation through innovation and industrial upgrading [
4].
Complementing this value chain perspective, a framework of three digital governance models [
6]—simulative, augmentative, and automated—emphasizes the importance of balancing interactivity and governance costs when selecting optimal governance approaches. From an environmental perspective, recent studies show the digital economy’s positive impact on collaborative governance of pollutants and carbon emissions through green technology innovation [
34]. This line of inquiry was expanded through identifying significant spatial autocorrelation patterns in the relationship between digital economy development and environmental governance, characterized by “high-high” and “low-low” spatial clustering features that suggest the importance of regionally tailored governance approaches [
35].
2.3. Key Factors for Digital Economy Development
As the digital economy industry governance becomes an important component of national governance modernization, promoting the high-quality development of the digital economy has become a strategic choice for economic development in the new era. Improving institutional supply, strengthening talent cultivation, releasing element value, promoting regional coordination, and deepening opening up are the five development paths [
36]. There are still prominent difficulties in the process of digital economy empowering high-quality economic development, including policy and regulatory constraints, development model limitations, industrial transformation, intensified market competition, and imbalanced talent structure [
9]. These studies indicate that government industrial policies, coordination mechanisms, and talent attraction and cultivation are key factors influencing and driving digital economy development.
In terms of government industrial policy, the existing research has confirmed its irreplaceable strategic value in guiding and supporting the development of the digital economy. Mistry’s research shows that in the process of digital economy development, the government should assume a leading role [
37]. Broadly speaking, all government actions in industrial development belong to industrial policy [
38]. He (2023) further defines industrial policy as government intervention activities with the direct goal of enhancing the competitiveness of specific industries [
39]. Research shows a significant positive correlation between the government’s strategic emphasis on digital technology and the promotion effect of digital technology on economic growth [
40]. In the United States, industrial policy formulation and implementation reflect both domestic political games and the strategic intention of strengthening international power and dominance [
41]. Evidence indicates that interventionist policies are crucial for addressing structural challenges in developing digital economies, while research emphasizes priorities in digital infrastructure investment, value chain strengthening, and R&D advancement for European contexts [
14,
32].
The government coordination mechanism’s supporting role in digital economy development has become increasingly prominent. Research shows that the government policy framework and support mechanisms not only shape the institutional environment for business operations but also profoundly affect the capacity building of enterprises to adapt to and cope with the challenges of the digital age [
42,
43]. Raji et al. (2024) took the United States as an example, they empirically tested the key promoting effects of various policy tools, such as government loans, tax incentives, and public–private partnerships, on the digital transformation of small and medium-sized enterprises [
44]. Precise implementation of policies and systematic identification of enterprises’ innovation environments and needs are required for effective government support [
45]. Yin et al. (2023), from the perspective of transaction cost theory, indicate that transactional mechanisms provide better explanations for reducing perceived opportunism between supply chain partners than combinations of relational and transactional mechanisms [
46].
High-level talents have become a scarce strategic resource for developing the digital economy. The digital economy has a broad and profound innovation-driven effect on the continuous improvement of total factor productivity, and high-tech talents play an indispensable supporting role [
47]. Due to the high professionalism and wide-ranging impact of digital transformation, talent shortage has become a common problem faced by most enterprises [
48]. Liu’s (2025) research further confirms that the level of digital talent supply is a key variable in forming differences in regional economic growth [
49]. It is worth noting that the digital economy’s development has promoted the emergence of innovative talents, forming a virtuous interaction mechanism between talent resources and industrial development [
50]. Recent analysis shows that digital transformation significantly affects talent management processes, with digital workplace, HR processes, and employee services forming core elements of HR management transformation [
51]. Studies observe that digital HR management processes utilize new technologies for selection, training, and evaluation functions, bringing benefits while also having potential impacts that warrant attention [
52].
2.4. Research Review and Theoretical Gaps
The literature review reveals three main shortcomings in the existing research: First, studies mainly proceed from single perspectives, lacking a comprehensive analytical framework to fully grasp digital economy development patterns, especially how the United States maintains its digital economy leadership through policy guidance, coordination, and talent strategies. Second, research on the government’s role is not deep enough, particularly regarding how governments guide development direction, coordinate stakeholders, and construct digital ecosystems. Third, the coupling mechanism between talent cultivation and industrial development needs deeper exploration, especially regarding stage-specific talent strategies aligned with industry value chain requirements.
To address these theoretical gaps, this study constructs the “Leading Policy-Coordination Mechanism-Talent Cultivation” (PCT) framework to systematically analyze the intrinsic mechanisms behind U.S. digital economy leadership. The framework also provides a structured approach for analyzing how governments balance competing priorities, adapt coordination strategies to industry conditions, and align talent development with value chain needs. The insights generated through this framework will contribute to both a theoretical understanding of digital economy development and the practical improvement of digital economy governance systems in other contexts.
3. Methodology
Based on a systematic review of research on existing digital economy governance models, this study innovatively integrates three key dimensions: policy guidance, coordination mechanisms, and talent attraction/cultivation. Using the Directional Policy Matrix (DPM) method as technical support, we propose the PCT (Policy–Coordination–Talent) analysis framework for U.S. digital economy development. The PCT framework is not only an analytical tool but also a theoretical model aimed at revealing the strategic logic and implementation paths of U.S. digital economy development at the macro level, which has important theoretical value for deeply understanding the internal mechanisms and competitive advantages of the U.S. digital economy’s continued leadership. The following will elaborate on the theoretical foundation, core elements, and operational methods of the PCT framework and demonstrate its comparative advantages over existing analytical models.
3.1. Theoretical Foundation and Development of the PCT Framework
The existing research mainly explores digital economy development from a single dimension. For example, the three digital economy governance strategies (laissez-faire strategy, preventive intervention strategy, and active regulation strategy) mainly focus on differences in government intervention degrees [
2]. Research on three digital economy organizational strategies—modularity, open innovation, and platforms—mainly applies to the enterprise level and struggles to explain national-level digital economy competitiveness differences [
53]. The digital policy framework for late-developing economies emphasizes technological catch-up rather than how to build sustainable digital economy leadership advantages [
14]. While these studies reveal certain aspects of digital economy development from different perspectives, they lack an integrated framework for systematically analyzing developed economies, especially the United States’ sustained leadership mechanisms in the digital economy field.
Meanwhile, academia has begun to pay attention to the multidimensional characteristics of digital economy development in recent years. Studies confirm that government support promotes digital economy development through the complete mediating effect of regional innovation ecosystem resilience, and regional innovation ecosystem resilience has a positive spatial spillover effect on digital economy development [
54]. Research from cognitive and institutional theoretical perspectives reveals the relationship between executive cognitive structures (cognitive centrality and complexity) and enterprise digital transformation, and how institutional pressures generated by digital policies strengthen this relationship [
55]. Evidence indicates the positive impact of digital transformation leadership and organizational agility on digital transformation, as well as the moderating role of digital strategy [
56]. These studies provide a theoretical basis for constructing a multidimensional analytical framework.
The proposed PCT framework fills the theoretical gap in existing research by integrating three key dimensions: policy guidance, coordination mechanisms, and talent attraction/cultivation, providing a more comprehensive perspective for analyzing digital economy development. Compared with existing single-dimensional analytical frameworks, the PCT framework has the following advantages: First, based on systems theory, the PCT framework views digital economy development as a complex system constituted by multi-dimensional interactions. Prior research indicates that government support promotes digital economy development through the complete mediating effect of regional innovation ecosystem resilience, suggesting complex interactive relationships between policy support, innovation ecosystem construction, and regional development [
54]. By integrating policy, coordination, and talent dimensions, the PCT framework better captures the systemic characteristics of digital economy development. Second, it focuses on the government’s role transformation from traditional regulator to active promoter, more in line with governance realities in the digital economy era. Zhu et al. (2022) emphasize the government’s multiple roles in shaping the digital economy development environment [
56]. By analyzing the government’s role mechanisms in different dimensions, the PCT framework more comprehensively grasps the complexity of the government’s promotion of digital economy development. Third, the digital economy is essentially a knowledge-intensive economic form. Talent management theory emphasizes that talent strategies in the digital economy era need to closely match industrial chain value creation demands, and talent management needs to more precisely and systematically promote continuous upgrading of talent capabilities [
51,
57]. Governments and enterprises need to focus on cross-domain capabilities, continuous learning abilities, and innovation capabilities of talents to achieve sustainable industrial competitive advantages. The PCT model emphasizes the key role of talent attraction/cultivation in digital economy development, constructing a talent strategy matrix based on industrial chain value creation and talent characteristics, systematically analyzing talent strategy layout logic.
3.2. DPM Method
The methodological foundation of the PCT framework is built on the Directional Policy Matrix (DPM) method. The DPM method was proposed by McKinsey Consulting in the 1970s, initially used for business portfolio analysis in corporate strategic planning, and later widely applied in public policy analysis and technology roadmap formulation [
58]. This method maps policy measures or strategic choices into a two-dimensional matrix by selecting two key dimensions of specific research objects, helping to systematically evaluate and compare the priorities and potential effects of different choices.
The selection of the DPM method as technical support for the PCT framework is primarily based on the following three reasons: First, digital economy development involves complex decision-making at multiple levels and with multiple factors. The DPM method can visualize complex problems through two-dimensional matrices, facilitating the grasp of core contradictions and key variables. Second, digital economy policies need to balance multiple objectives, and the DPM method is particularly suitable for handling such multi-objective decision problems. Third, the DPM method emphasizes dynamic adjustment of strategies with environmental changes, highly compatible with the rapidly evolving nature of the digital economy. In the digital economy research field, the DPM method has been applied to analyze the interactive evaluation of the digital economy, improve financial resilience, and prioritize e-commerce construction [
59,
60,
61]. These applications indicate that the DPM method has significant advantages in handling complex decision problems involving multiple factors and objectives, particularly suitable for the systematic analysis of national-level digital economy strategies.
The PCT framework innovatively applies the DPM method to digital economy development analysis by constructing two-dimensional matrices for each of the three dimensions—policy guidance, coordination mechanisms, and talent cultivation—forming a multi-level analytical system. This method not only helps clearly demonstrate the strategic layout and internal logic of U.S. digital economy policies but also more comprehensively grasps the strategic logic of U.S. digital economy development.
3.3. Core Dimensions of PCT Model
Through systematic data analysis using the Directional Policy Matrix (DPM) method, this paper proposes the PCT (Policy–Coordination–Talent) framework for analyzing the U.S. digital economy development. The framework integrates three interrelated yet distinct core dimensions, each analyzed through a specialized two-dimensional strategy matrix to form a comprehensive analytical system.
3.3.1. Leading Policy Dimension
Leading policies, the primary dimension of the PCT framework, refer to a series of policy systems formulated by the U.S. government in the process of digital economy development, which have the functions of global strategic leadership and competitive advantage maintenance, including laws and regulations, strategic plans, and specific guidelines. The U.S., through the systematic use of national strategic resources, shapes a digital economy industrial system that meets its development needs and has a dominant position in the global value chain.
Research shows that governments shape a competitive environment favorable to digital innovation through strategic planning and policy tools, directly supporting the key role of policy leadership in digital economy development [
62]. Additionally, effective competitive industrial policies can promote the release of enterprises’ long-term competitiveness and play a role in promoting economic growth [
63]. On the other hand, policy preferences in the digital economy field are often influenced by multiple factors such as competitive pressure and national security concerns [
64]. Therefore, this study selects perceived security and perceived competitiveness as two key dimensions for analyzing the U.S. digital economy’s leading policy intensity strategy matrix. Perceived competitiveness focuses on the U.S.’s emphasis on the competitiveness of digital industries, while perceived security addresses the strategic considerations of policies that prevent, control, and govern digital economy security risks. A comprehensive evaluation of policy performance along these two aspects helps to assess the strategic balance between security and development in U.S. digital economy policies, providing critical insights into the internal logic of U.S. digital economy governance. In particular, building competitive advantages, ensuring digital sovereignty, maintaining data security, stabilizing the development environment, and containing strategic opponents constitute the strategic orientation of U.S. digital economy policies, and how these orientations are reflected through specific policy measures can be clearly presented through the leading policy strategy matrix.
3.3.2. Coordination Mechanism Dimension
The coordination mechanism is the second core dimension of the PCT framework, referring to a series of initiatives and actions the U.S. government takes to maintain its strategic interests, discourse power, and competitive advantages in the global digital economy. These measures involve communication, negotiation, coordination, and even mandatory actions on a global scale.
Institutional economics emphasizes the key role of formal rules, informal constraints, and enforcement characteristics in shaping economic behavior [
65], providing a theoretical foundation for understanding coordination mechanisms in the digital economy. Governance theory focuses on interaction networks between different actors, especially how governments integrate resources, resolve conflicts, and achieve common goals through coordination mechanisms [
66]. Current research has shown that effective interaction between governments, enterprises, and other stakeholders can be achieved through multi-level coordination mechanisms [
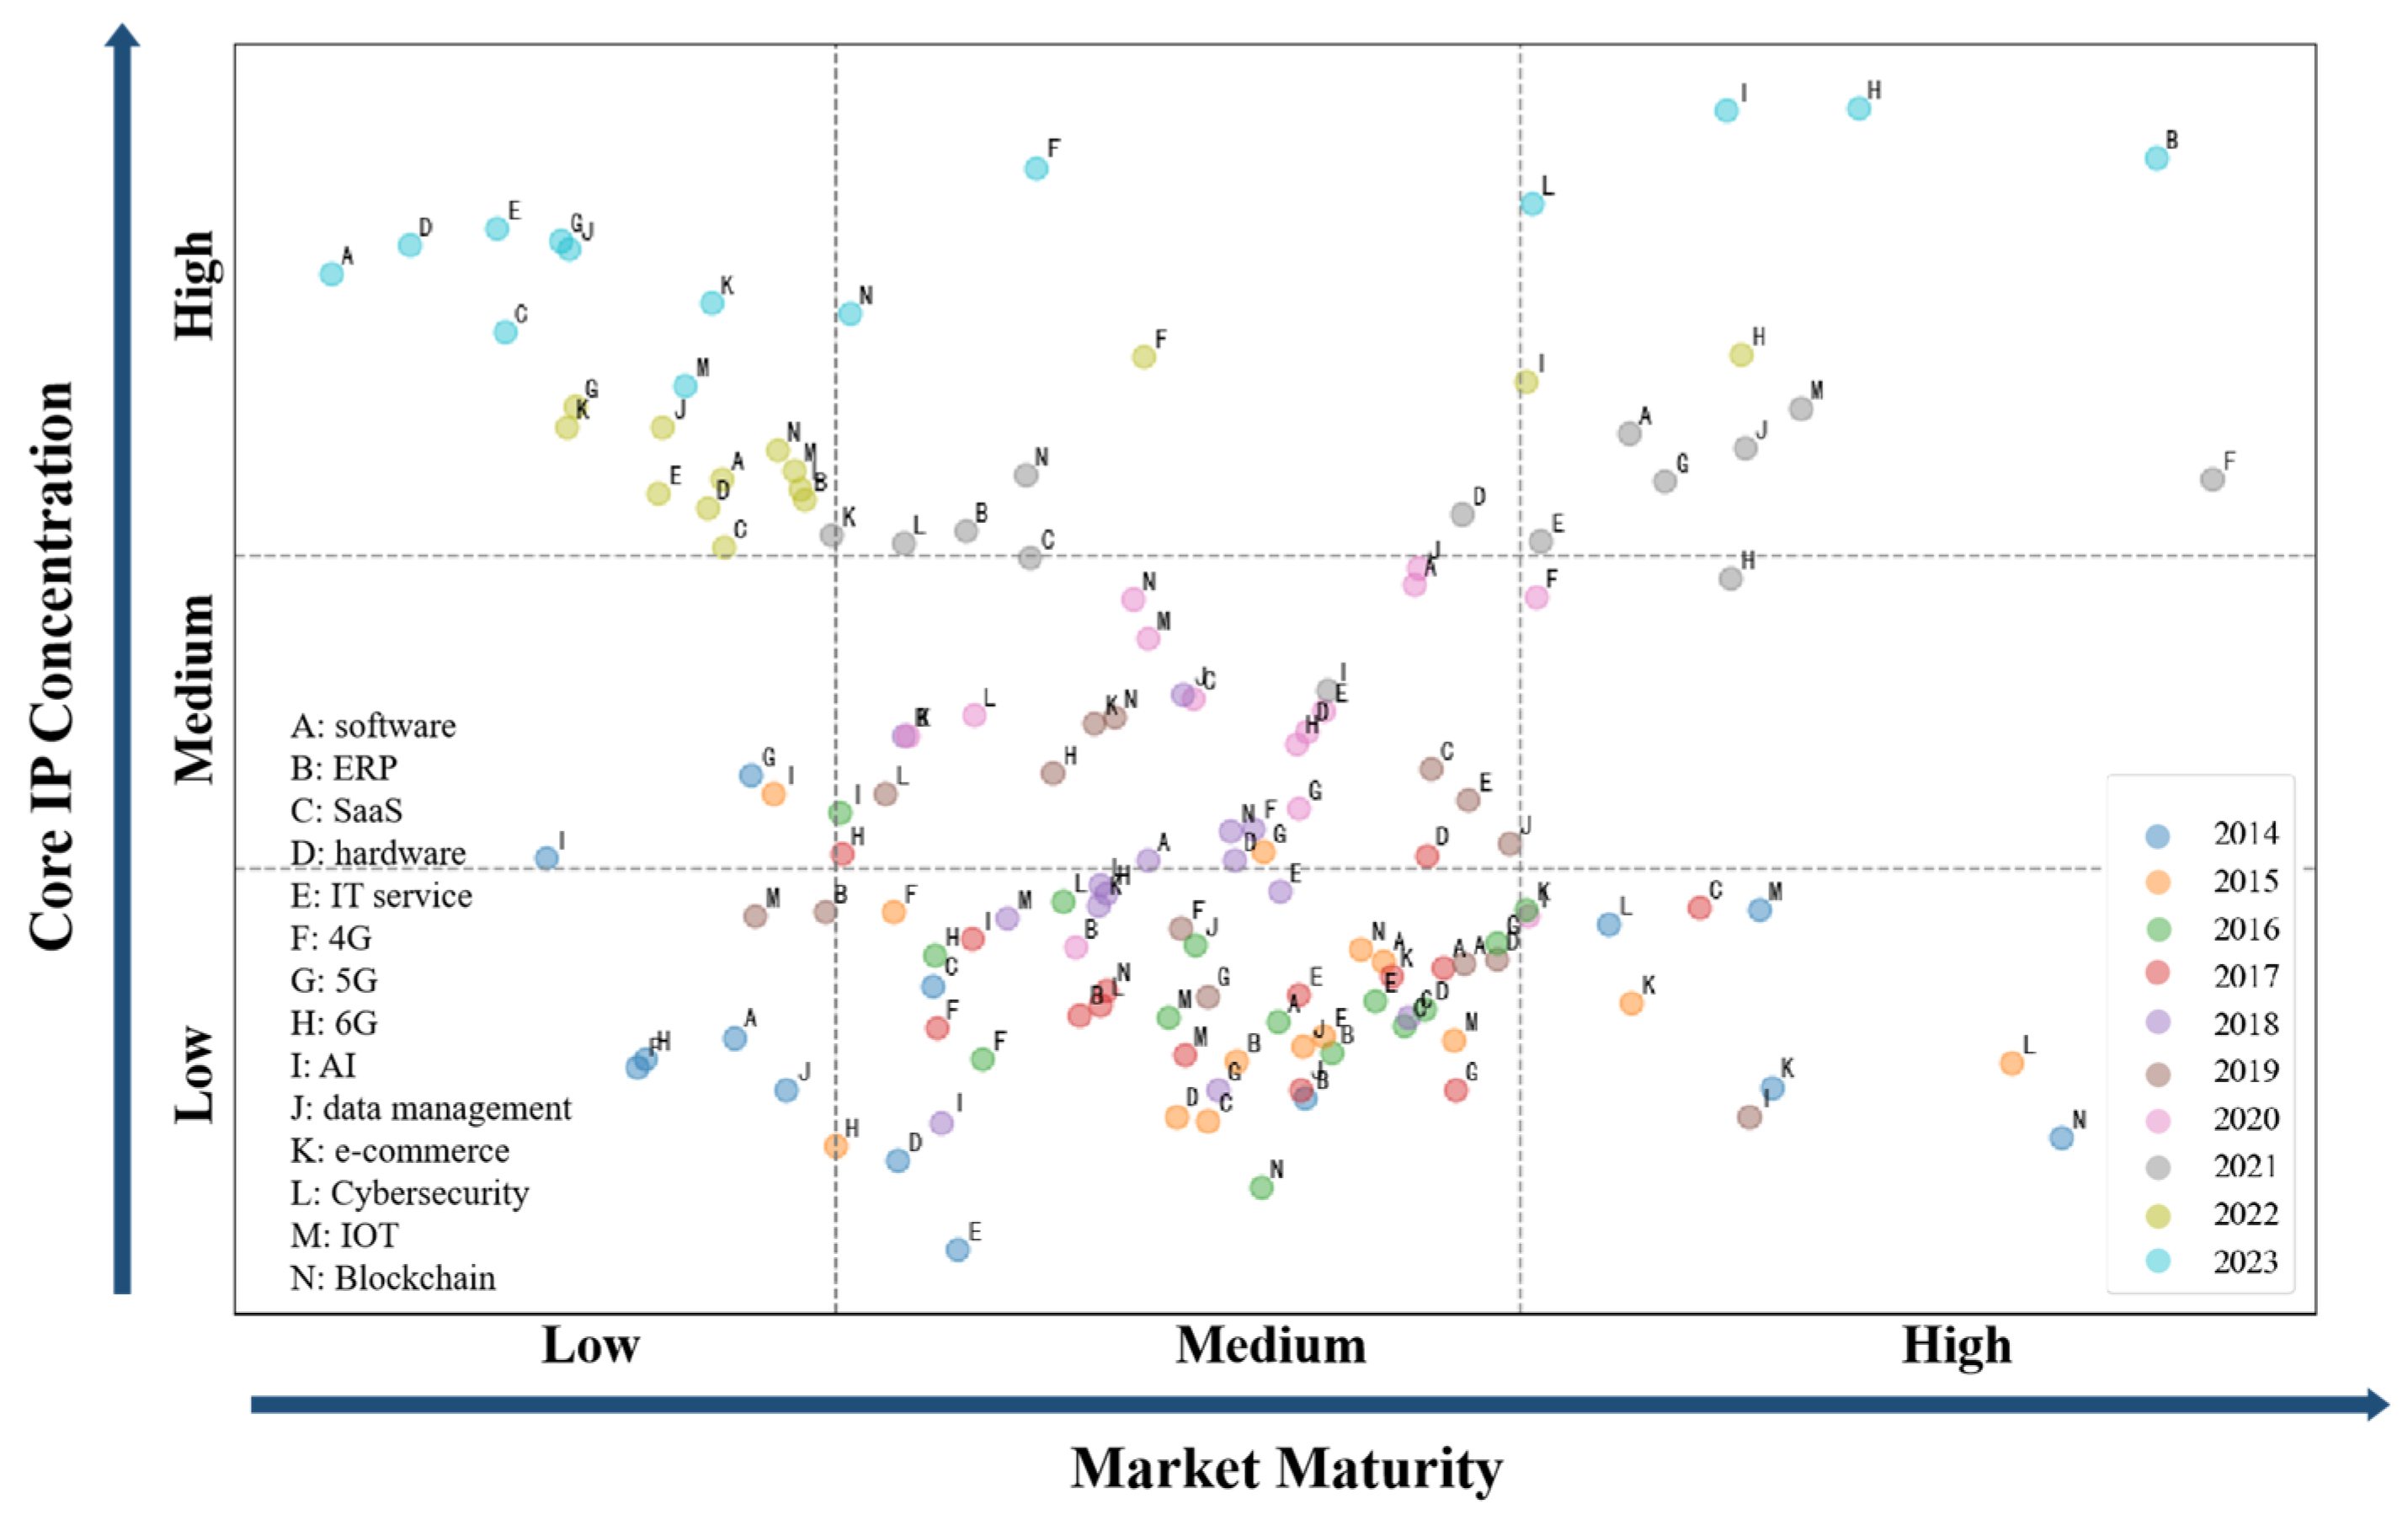
67], supporting the important role of coordination mechanisms in digital economy development. This paper examines two key sub-dimensions—market maturity and core IP concentration—to evaluate the U.S. government’s coordination behavior and decision-making processes in the digital economy field. Market maturity reflects the development stage of different segments within the digital economy. As industries progress through stages such as start-up, growth, and maturity, they face distinct challenges and issues, necessitating the government to adopt appropriate coordination strategies. Core IP concentration captures the differences in competition patterns and innovation capabilities within the industry. Combining these two dimensions allows a more comprehensive understanding of the U.S. government’s coordination behavior in digital economy governance, helping to understand how the U.S. government adopts differentiated coordination strategies for digital industries at different development stages and with different competitive landscapes to maximize its global digital economy interests.
3.3.3. Talent Cultivation Dimension
Talent cultivation, the third core dimension of the PCT framework, refers to the systematic policy and mechanism arrangements for introducing and developing various talents needed for digital economy development, and is the core driving force for continuous innovation in the digital economy. In the digital economy era, talent was not only a conventional production factor but also the subject of innovation and a key builder of the digital ecosystem.
The infrastructure, platform systems, and application services that underpin the development of the digital economy place differentiated demands on talent capabilities [
57]. Moreover, the evaluation system for digital economy talent is based on a multi-dimensional assessment of qualities such as political integrity, innovation ability, and adaptability. Among these factors, digital literacy represents the specific manifestation of innovation ability in the digital economy era, directly influencing talent’s innovation output and value creation [
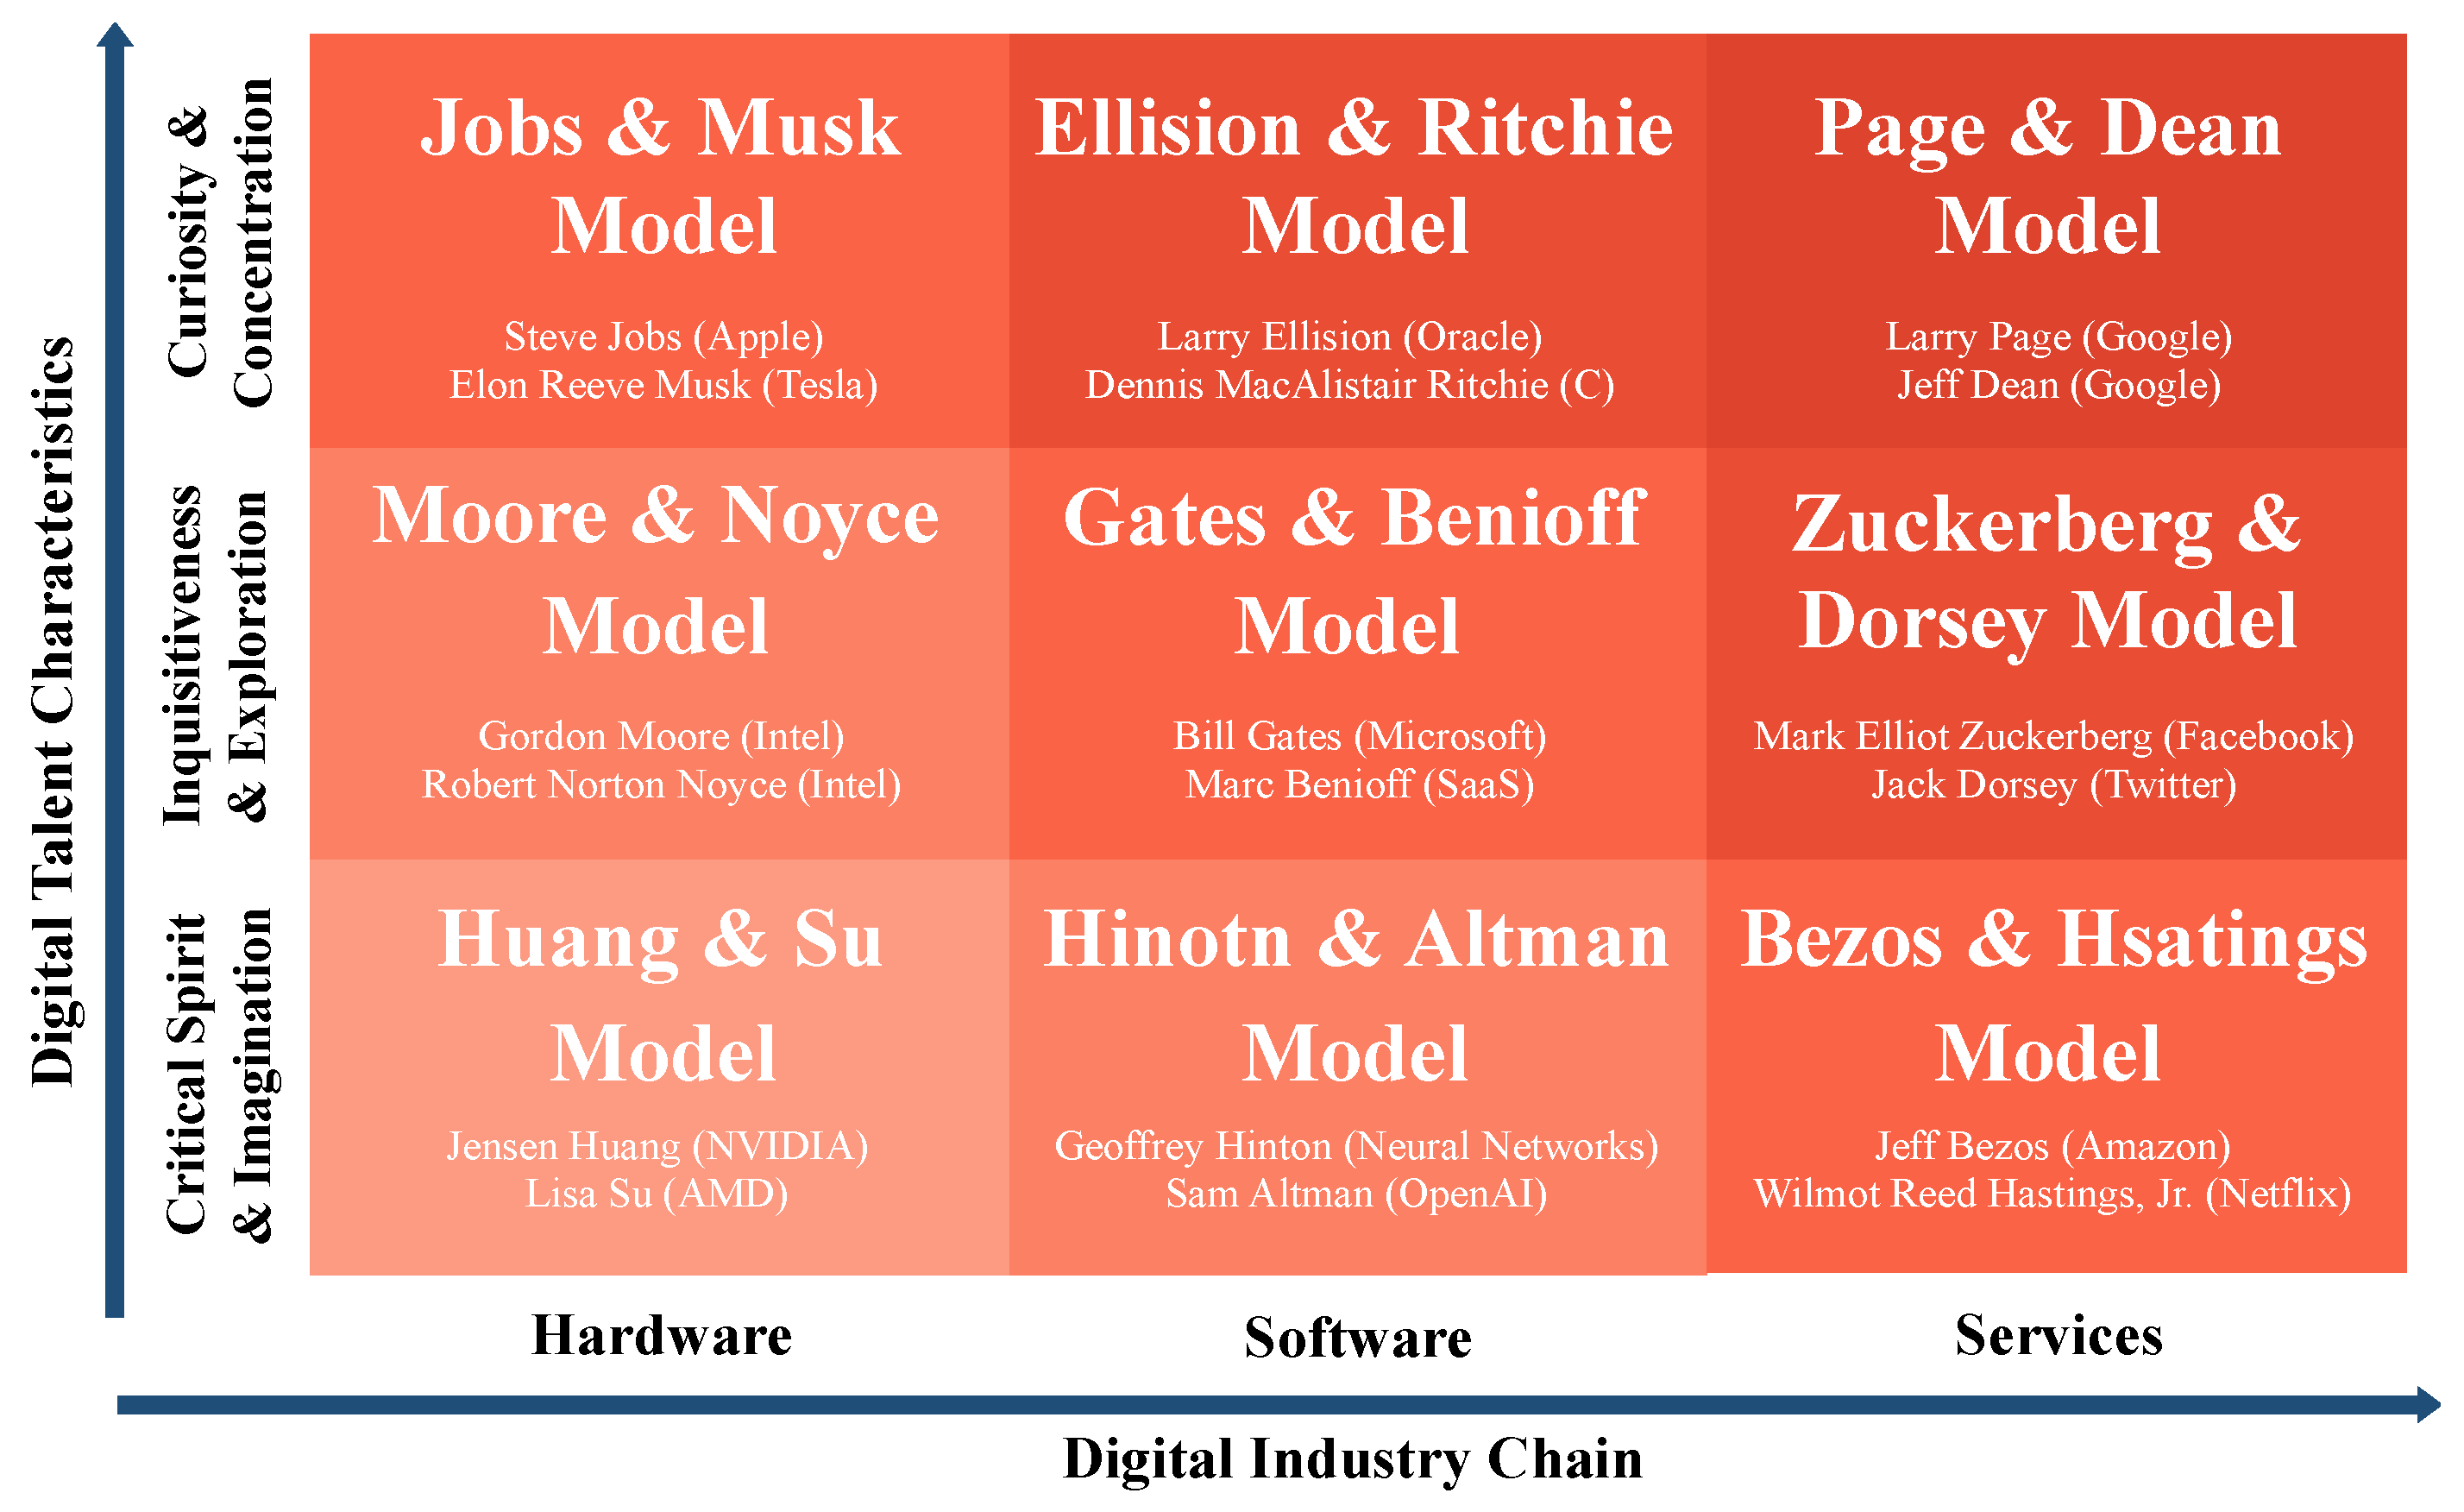
68]. Based on the DPM method, this research constructs an analytical framework from two dimensions: the digital industry chain and digital talent characteristics. The digital industry chain dimension reflects the position of talent in the digital economy value chain, including the infrastructure layer, platform layer, and application service layer. The digital talent characteristics dimension reflects the professional characteristics and innovation capabilities of talent, including technical, managerial, and entrepreneurial categories.
As a theoretical model and analytical tool, the PCT framework’s systematicity and innovation are reflected in three aspects. First, multi-dimensional integration, cross-level analysis, dynamic evolution perspective, and practice orientation. In terms of multi-dimensional integration, the PCT framework organically integrates policy guidance, coordination mechanisms, and talent cultivation. Second, in cross-level analysis, it achieves the connection of macro, meso, and micro levels of national strategic policies, industrial coordination mechanisms, and individual talent development, enhancing research clarity through visualized strategy matrices. Third, in terms of practice orientation, the PCT framework not only provides a theoretical framework for understanding digital economy development but also provides decision-makers with a decision-making tool based on real data, which has strong practical value.
3.4. Data Sources
This research employs a diversified data source system to ensure the scientific validity and reliability of research conclusions. For the overall analysis of the U.S. digital economy, GDP data are sourced from the World Bank (
https://www.worldbank.org, accessed on 11 March 2025), selecting U.S. real GDP from 2005 to 2022 as research data. Corresponding U.S. digital economy data are obtained from the Bureau of Economic Analysis (
https://www.bea.gov/, accessed on 11 March 2025), including digital economy real value added, the proportion of value added by various components of the digital economy, and the contribution of each component to the real value added of the digital economy.
In the leading policy dimension, this research selects 63 representative digital economy policies from 1991 to 2024 as analytical samples, with data sourced from authoritative government channels including U.S. Congressional legislative records (
https://www.congress.gov/, accessed on 10 March 2025), the Federal Register (
https://www.federalregister.gov/, accessed on 10 March 2025), and the White House official website (
https://www.whitehouse.gov/about-the-white-house/, accessed on 14 March 2025). Policy texts were obtained in their complete original form to ensure comprehensive textual analysis. Through text mining methods, these policies are analyzed to calculate perceived competitiveness and perceived security, evaluating policy leadership effectiveness.
In the coordination mechanism dimension, the research utilizes the PatSnap global patent information database as the data source for digital economy patent information (
https://www.zhihuiya.com/, accessed on 22 March 2025). Data screening is limited to patents accepted by the United States Patent and Trademark Office, selecting valid patents based on their legal status, and conducting statistical analysis based on patent application years. Based on existing industry classification standards and technological frontiers, the research selects ten representative digital industry categories and their corresponding search keywords, including software, hardware, IT services, network communications, artificial intelligence, big data analytics, e-commerce, cybersecurity, Internet of Things, and blockchain technology. Industry maturity and IP concentration are measured through patent quantities and distribution to assess industrial coordination effectiveness.
In the talent cultivation dimension, this research selects data from CBINSIGHT’s 2024 Global Unicorn List (
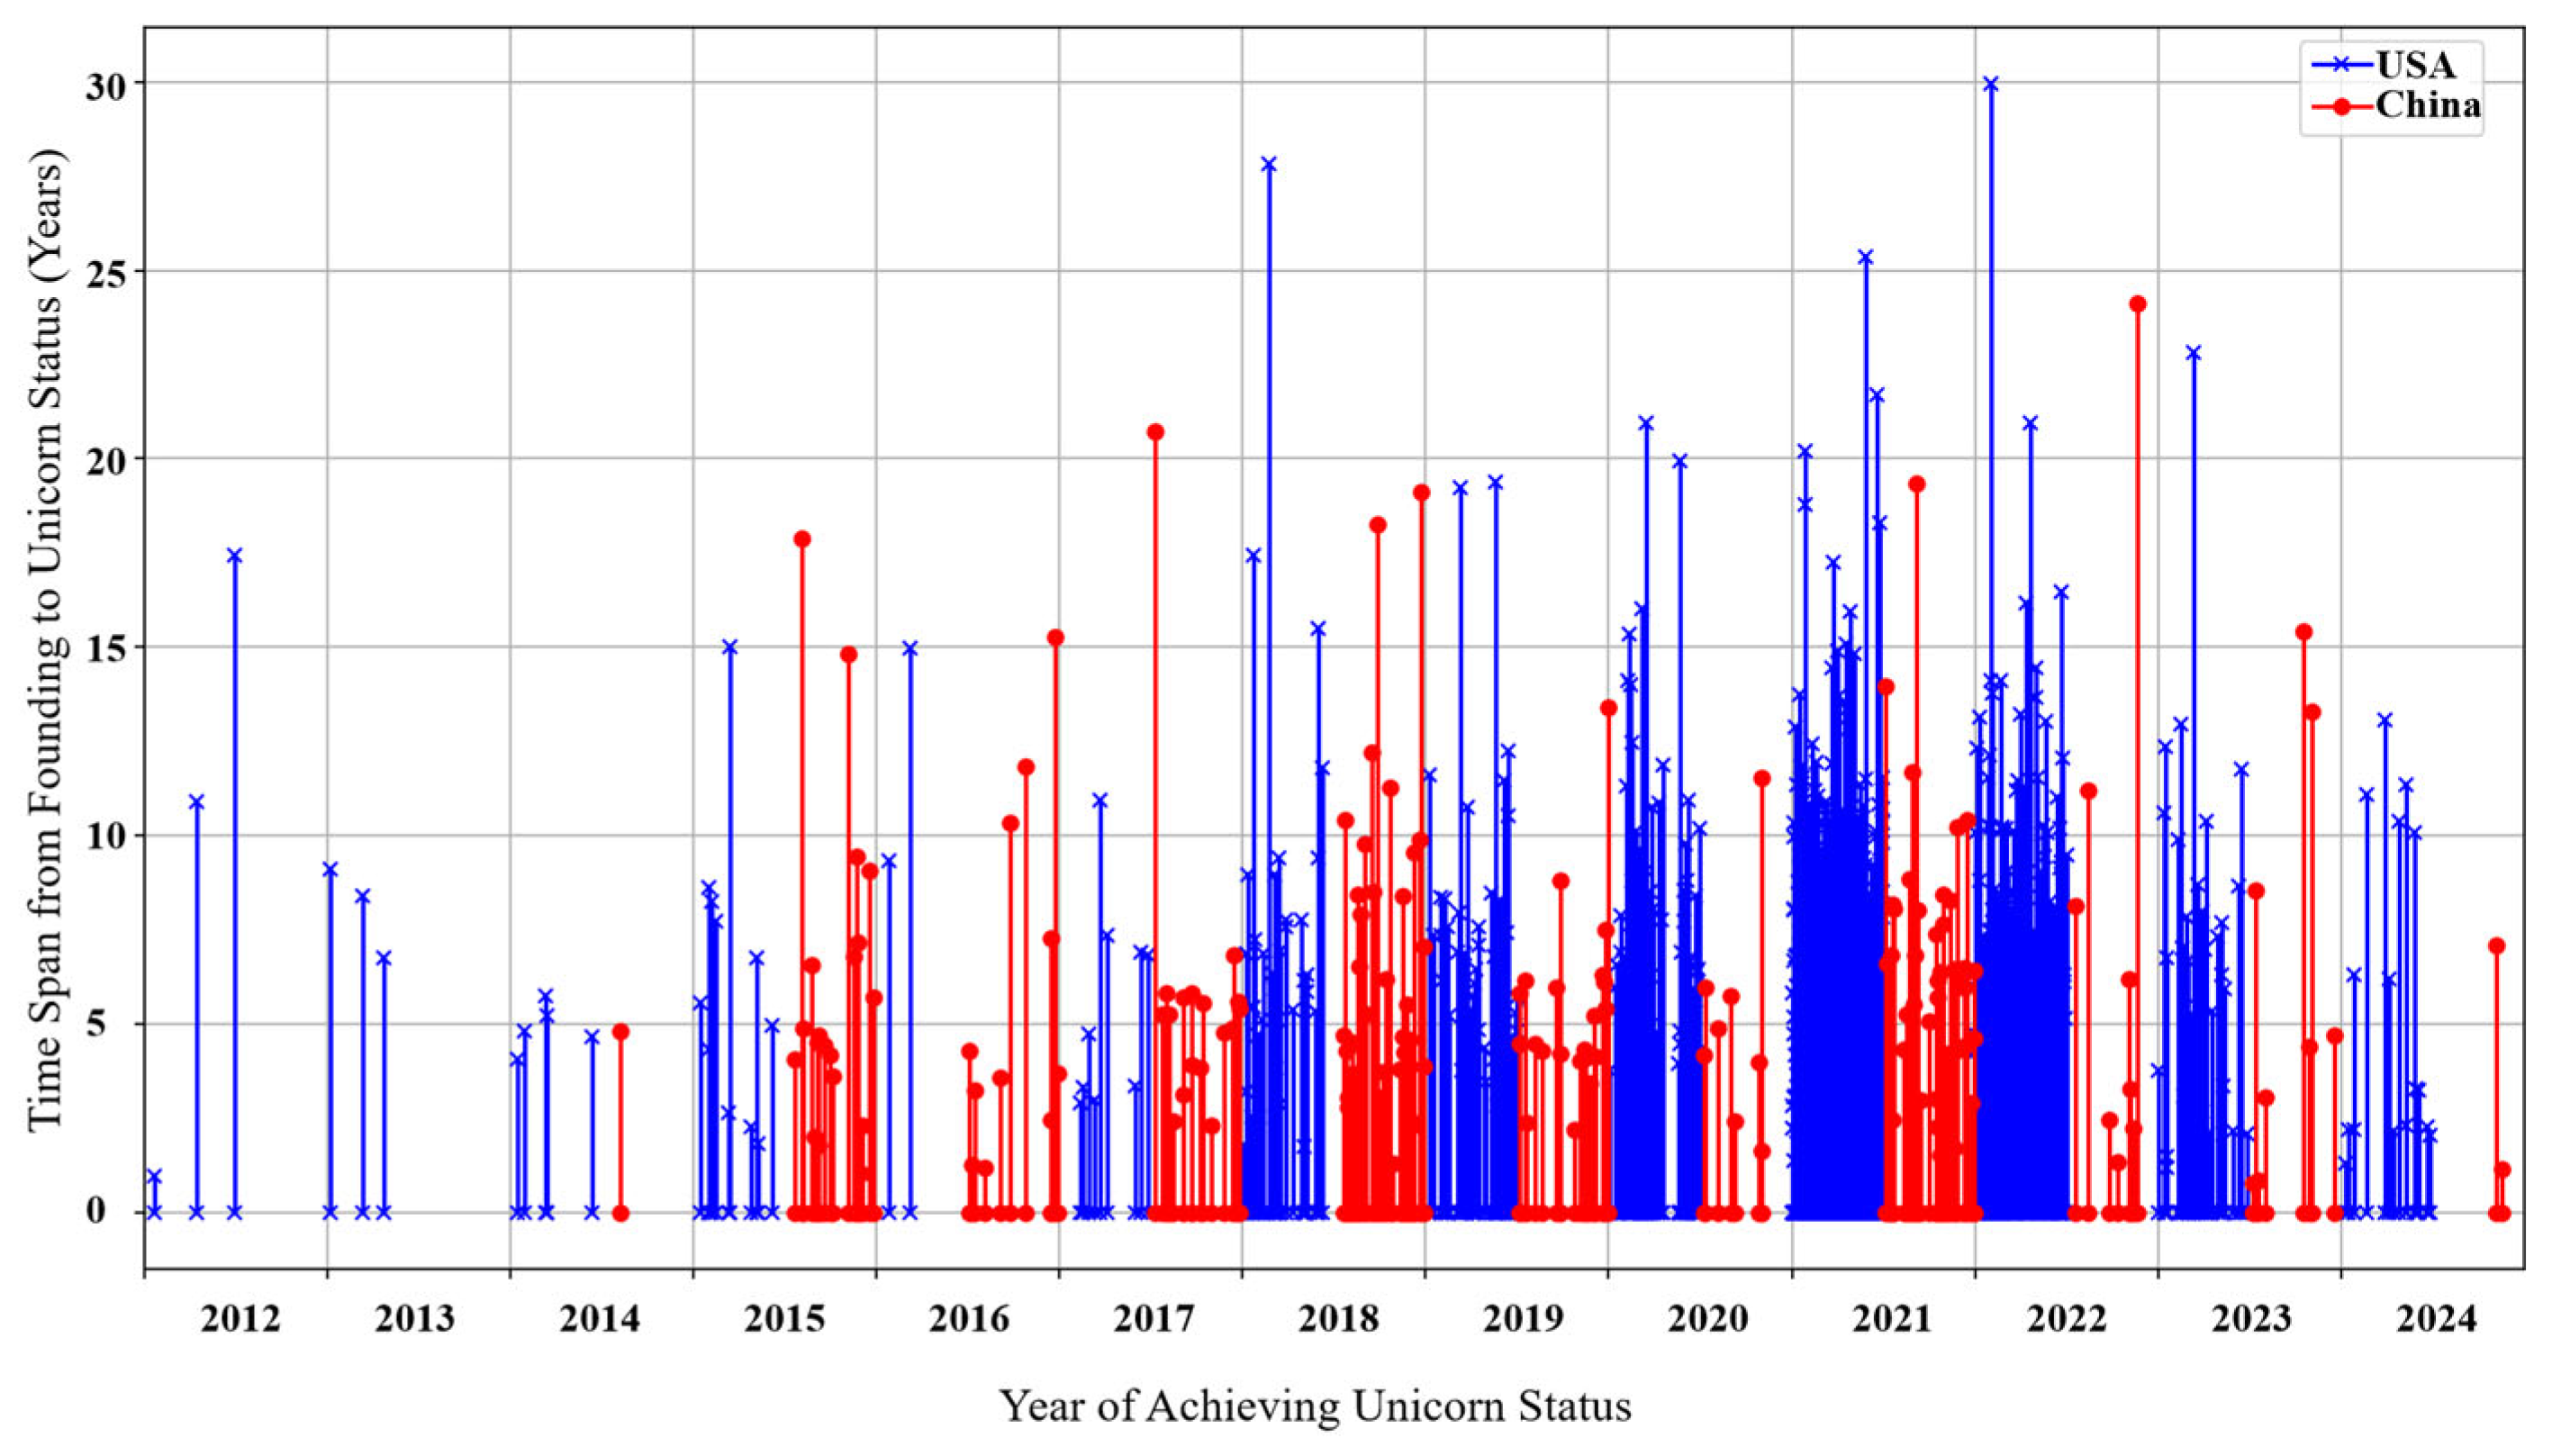
https://www.cbinsights.com/research-unicorn-companies, accessed on 20 March 2025) as baseline data (including 168 Chinese enterprises and 665 U.S. enterprises), focusing on analyzing key information such as company establishment year, founder background, and time of inclusion in the list. By analyzing the time span distribution from enterprise establishment to list inclusion, combined with text mining techniques for quantitative assessment of key talent characteristics in the digital economy field, the research reflects the effectiveness of the United States in building a digital economy talent ecosystem.
4. Analysis of the U.S. Digital Economy Development Model
4.1. Overall Analysis
As the leading country in the global digital economy, the evolutionary characteristics of the U.S. digital economy’s value-added data are worthy of our in-depth research. According to the statistical framework of the U.S. Bureau of Economic Analysis (BEA) [
15], the composition of the digital economy can be divided into four core elements: infrastructure, e-commerce, priced digital services, and federal nondefense digital services. These components cover the material basis, transaction activities, service business, and policy support, constituting the whole picture.
4.1.1. Macro Changes in U.S. Digital Economy Value-Added
To systematically grasp the development trend of the U.S. digital economy, this study first examines the macro changes in its value-added.
Figure 1 compares the real value-added of the U.S. digital economy and real GDP from 2005 to 2022. The data shows that during the observation period, the digital economy’s real value-added growth rate consistently surpassed the overall economy. Notably, even during the 2020 global economic downturn, the digital economy maintained positive growth, demonstrating its strategic role in the U.S. economy.
4.1.2. Developmental Characteristics of U.S. Digital Economy Value-Added
Analyzing the internal structure’s dynamic evolution is crucial for understanding the digital economy’s development laws.
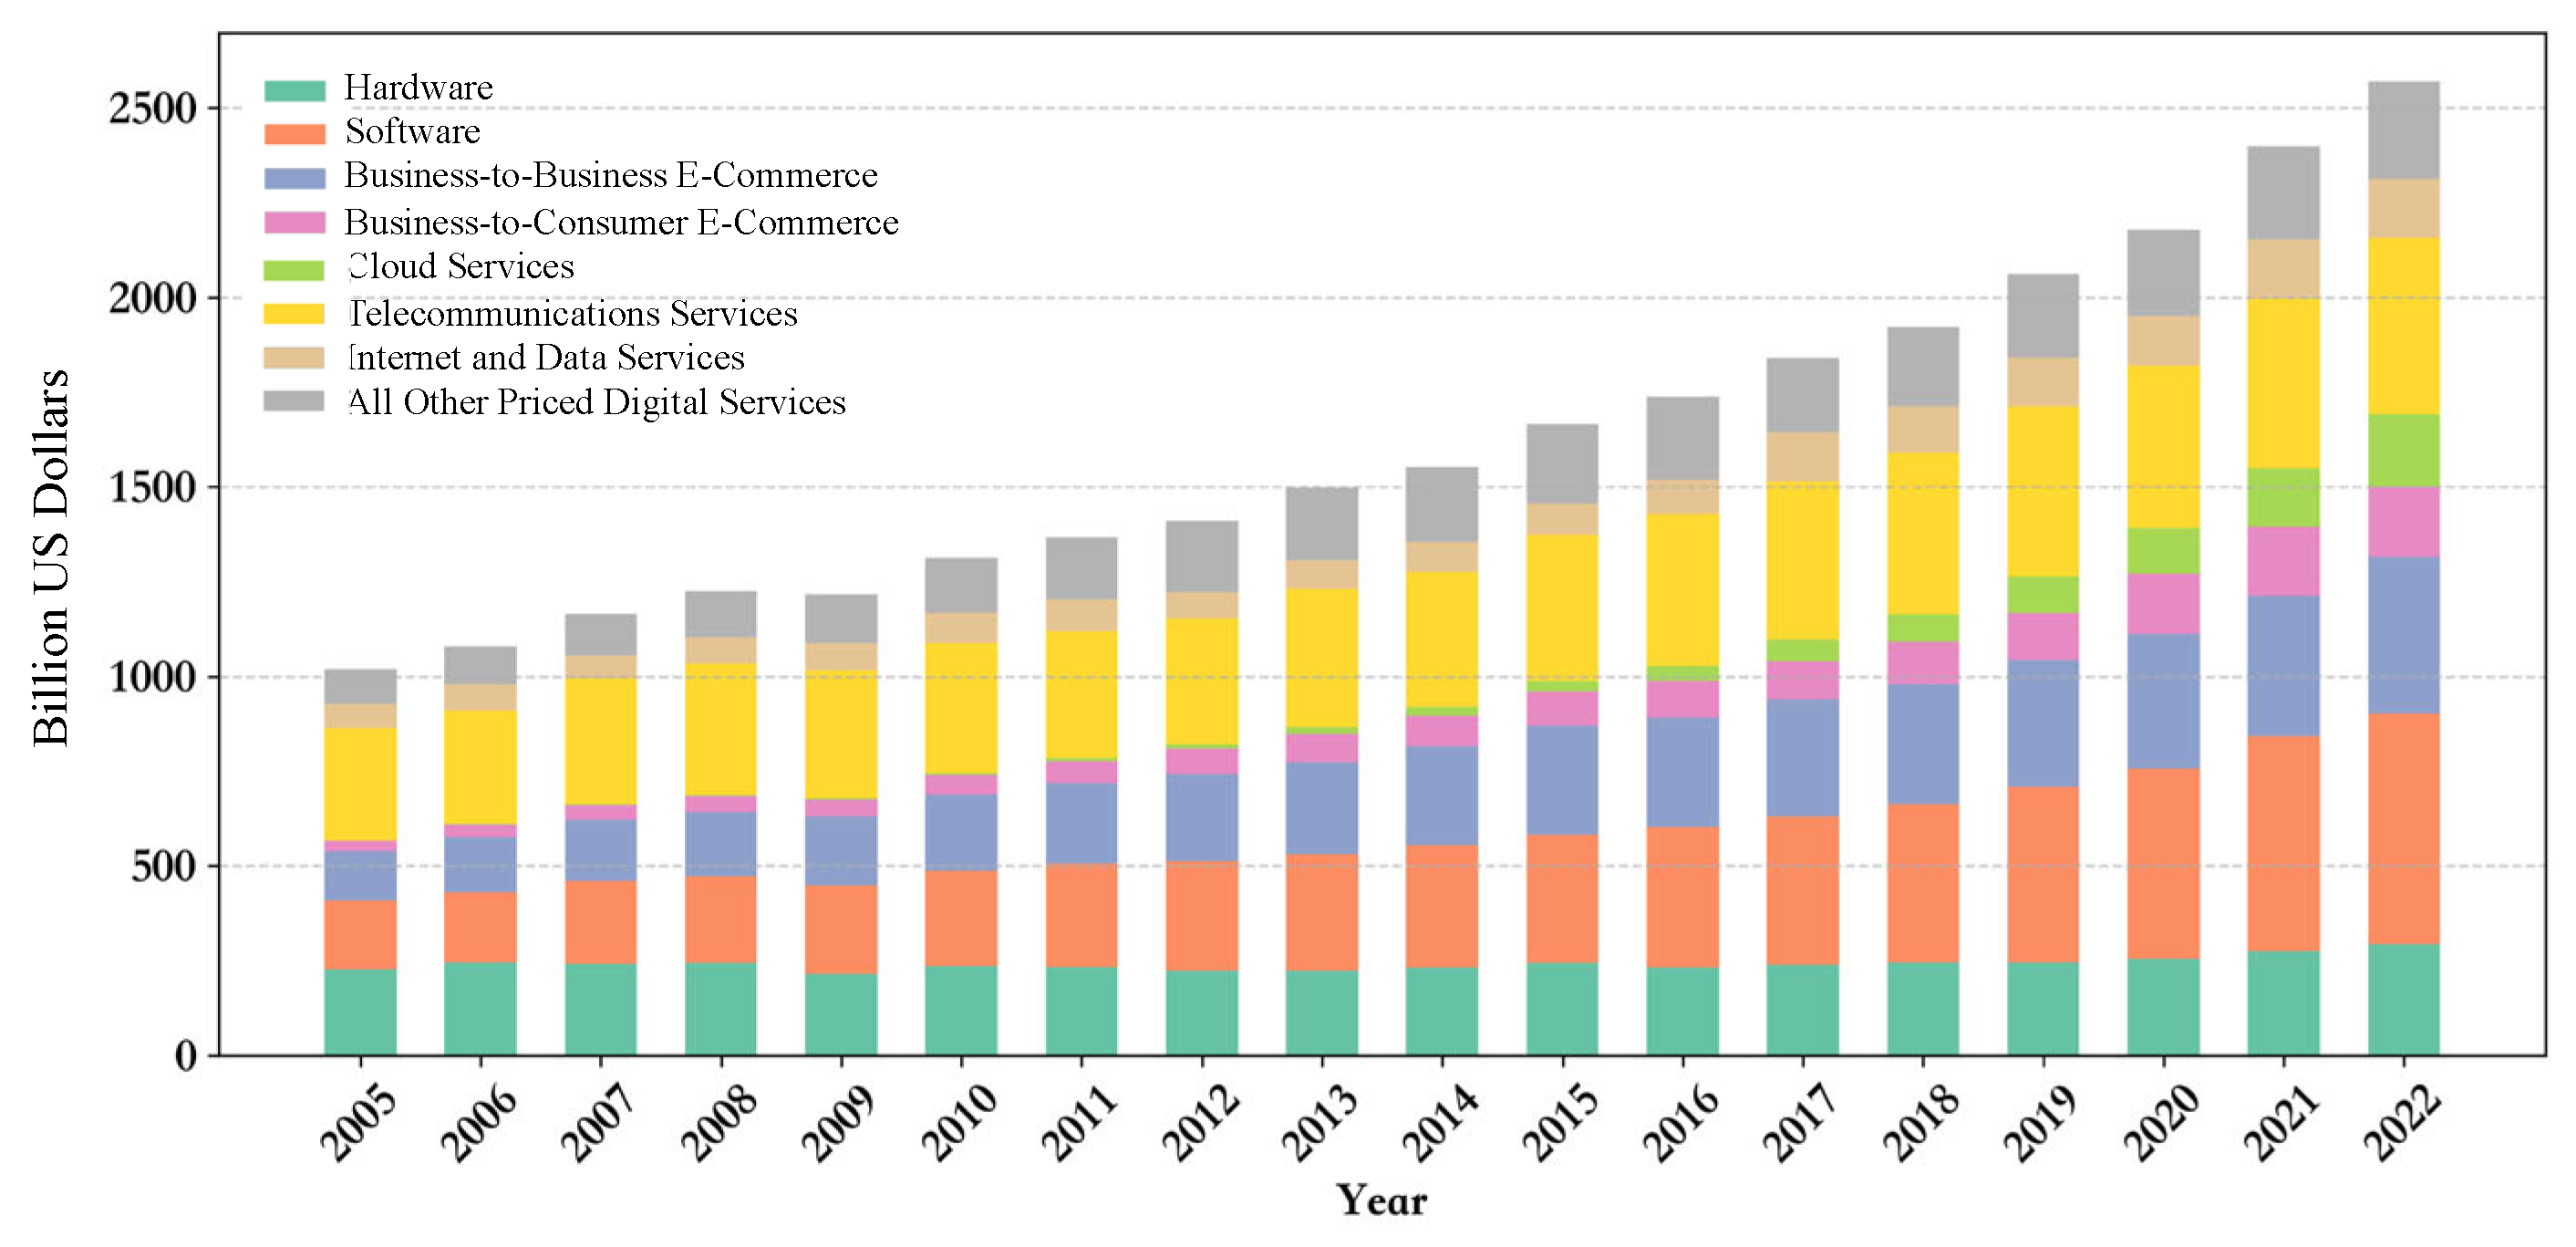
Figure 2 reveals the contribution of each digital economy component to real value-added from 2005 to 2022. In 2022, software systems contributed the largest share, followed by telecommunications services and B2B digital trade. Cloud computing services, despite having a small base, exhibited the fastest growth rate. This structural characteristic reflects the digital economy’s transformation from infrastructure construction to platform service innovation.
Figure 3 shows each element’s dynamic contribution to the digital economy’s value-added from 2006 to 2022. Digital infrastructure had the most significant real output growth, followed by priced digital services and digital commerce, indicating that infrastructure construction, service innovation, and market transactions are the three major driving forces.
The data analysis reveals the following trends from 2005 to 2022: First, the growth rate of the digital economy has consistently led the overall economy, showing strong development resilience. Second, the software and information service industry has become the primary source of value creation, reflecting the continuous optimization of the industrial structure. Third, emerging fields such as cloud computing and e-commerce have also shown strong growth momentum, building new growth poles. Fourth, the enabling role of the digital economy in traditional industries, such as professional and business services, has become increasingly prominent. Fifth, the continuous expansion of digital infrastructure investment has provided solid support for developing the digital economy.
While the United States maintains global leadership in the digital economy, China, as the largest emerging digital economy, shows remarkable momentum, with its digital economy reaching 53.9 trillion yuan in 2023 (42.8% of GDP). Between 2016 and 2023, China’s digital economy grew faster than the US, demonstrating a late-mover advantage, though gaps remain in absolute scale and economic proportion. Structurally, the US excels in software and information technology services, dominating software systems and cloud computing through its technology-driven model. China, meanwhile, has built strengths in applications like e-commerce and digital payments, while investing heavily in digital infrastructure, creating a dual focus on application expansion and hardware foundation. This divergence reflects different policy orientations. The US has established a mature digital technology system with corresponding talent development models, while China is navigating a critical transition of simultaneous improvement in applications and foundational capabilities, with distinctive talent needs. These differences provide important context for analyzing the US PCT model.
The following text will deeply analyze the U.S. digital economy’s development model characteristics and internal logic from three dimensions: leading policies, coordination mechanisms, and talent cultivation.
4.2. Analysis of Leading Policy Intensity and Construction of Strategy Matrix
This section conducts a quantitative analysis of two sub-dimensions to understand the characteristics and evolution patterns of the U.S. digital economy’s leading policies. First, policy texts are quantitatively evaluated using text mining to reveal dynamic changes in policy orientation based on “perceived competitiveness” and “perceived security”. Second, a policy intensity distribution matrix is constructed to systematically analyze the spatial distribution characteristics of policies, extract policy types, and construct a DPM strategy matrix of policy intensity. This analysis method captures the overall trend of policy evolution and identifies the strategic positioning of specific policies, facilitating a comprehensive understanding of the deep logic behind the U.S. digital economy’s leading policies.
4.2.1. Review of Leading Policies in the U.S. Digital Economy
This paper analyzes 63 typical leading policies (
Appendix A,
Table A1) from 1991 to 2024 that relatively comprehensively reflect the evolution and strategic orientation of U.S. digital economy policies. The selection of these policies followed a systematic approach based on three core criteria: First, national significance. All selected policies were officially issued by federal-level institutions with direct relevance to digital economy development, including presidential executive orders, congressional acts, and federal agency directives. Second, comprehensive representation. The selection ensures coverage of all major technological transitions and strategic shifts in the U.S. digital economy landscape over the studied period, including information infrastructure, e-commerce, cloud computing, big data, artificial intelligence, and semiconductor technologies. Third, historical continuity. Policies were selected to demonstrate the evolutionary trajectory of U.S. digital economy governance across different administrations, enabling analysis of long-term strategic patterns.
Policies in the early 1990s laid the foundation for constructing the U.S. information infrastructure and developing the digital economy. At the beginning of the 21st century, the focus shifted to emerging fields like e-commerce and the Internet economy. Around 2010, the policy focus expanded to cloud computing and advanced manufacturing. Since 2012, cutting-edge technologies such as big data and artificial intelligence have become strategic priorities. After 2018, the United States launched a new round of deployments around key technological fields, emphasizing technological and industrial chain security, reflecting the dual demands for competitiveness and security. After 2021, further emphasis was placed on international competition, digital economy governance, and data security, highlighting the United States’ ambition to lead the new order of global digital development.
The evolution of U.S. digital economy policies exhibits three distinct characteristics: First, policy formulation always maintains foresight and leadership. Second, policy objectives highlight the orientation of competitiveness. Third, policy deployment reflects an overall collaborative nature.
4.2.2. Leading Policy Analysis: Perceived Competitiveness and Perceived Security
To further quantitatively evaluate the orientation characteristics of the leading policies of the U.S. digital economy, this paper starts from two dimensions of “perceived competitiveness” and “perceived security”. It employs text-mining methods to quantitatively depict the dynamic evolution of policy orientation.
For both dimensions, keyword dictionaries were developed based on systematic policy analysis (see
Table 1 for details). The “perceived competitiveness” dimension incorporates terminology related to innovation capability, advanced technology, competitive advantage, and influence—including terms like “innovation”, “breakthrough”, “leading”, “influence”, “promote”, and “transform”. These keywords capture core drivers of digital industry development and reflect policy orientations toward enhancing international competitiveness. The “perceived security” dimension includes vocabulary related to risk prevention, compliance supervision, and stable development—such as “safety/security”, “risk”, “stability”, “protection”, “prevention”, and “regulation”. These terms address actual risks and challenges in digital economic development, covering prevention, supervision, and response mechanisms that reflect policy emphasis on maintaining industrial security and stability. The frequency of these keywords in policy texts was analyzed to objectively evaluate policy focus and depict the evolution of U.S. digital industry policies.
The calculation process for perceived competitiveness and perceived security consists of three main steps: First, we use natural language processing techniques to preprocess each policy text, including tokenization, lemmatization, and removal of stop words. Second, based on the keyword dictionary, we count the frequency of competitiveness and security-related keywords in each policy text. Third, we perform standardization to control for the impact of text length differences. For each policy text, we calculate standardized scores for both dimensions by dividing the frequency of respective keywords by the total word count. This standardization method ensures comparability between policy texts of different lengths and conforms to standard practices in text analysis.
Figure 4 illustrates the evolutionary trend of U.S. digital economy policy orientation over the period 1991–2024. The data show that the dimensions of perceived competitiveness and perceived security exhibit similar yet different characteristics of change. Scores for both dimensions are relatively flat until 2018, and then they experience rapid growth and decline during the following years. Notably, as of 2024, both dimensions are at a high level, but the perceived security score is significantly higher than the perceived competitiveness score, which indicates that the U.S. government pays more attention to risk prevention, control, and security governance while leading industrial innovation and development. This change in trend reflects that the United States’ digital economy policy seeks a new balance between promoting innovation and development and maintaining security and stability.
4.2.3. Distribution of Leading Policy Intensity
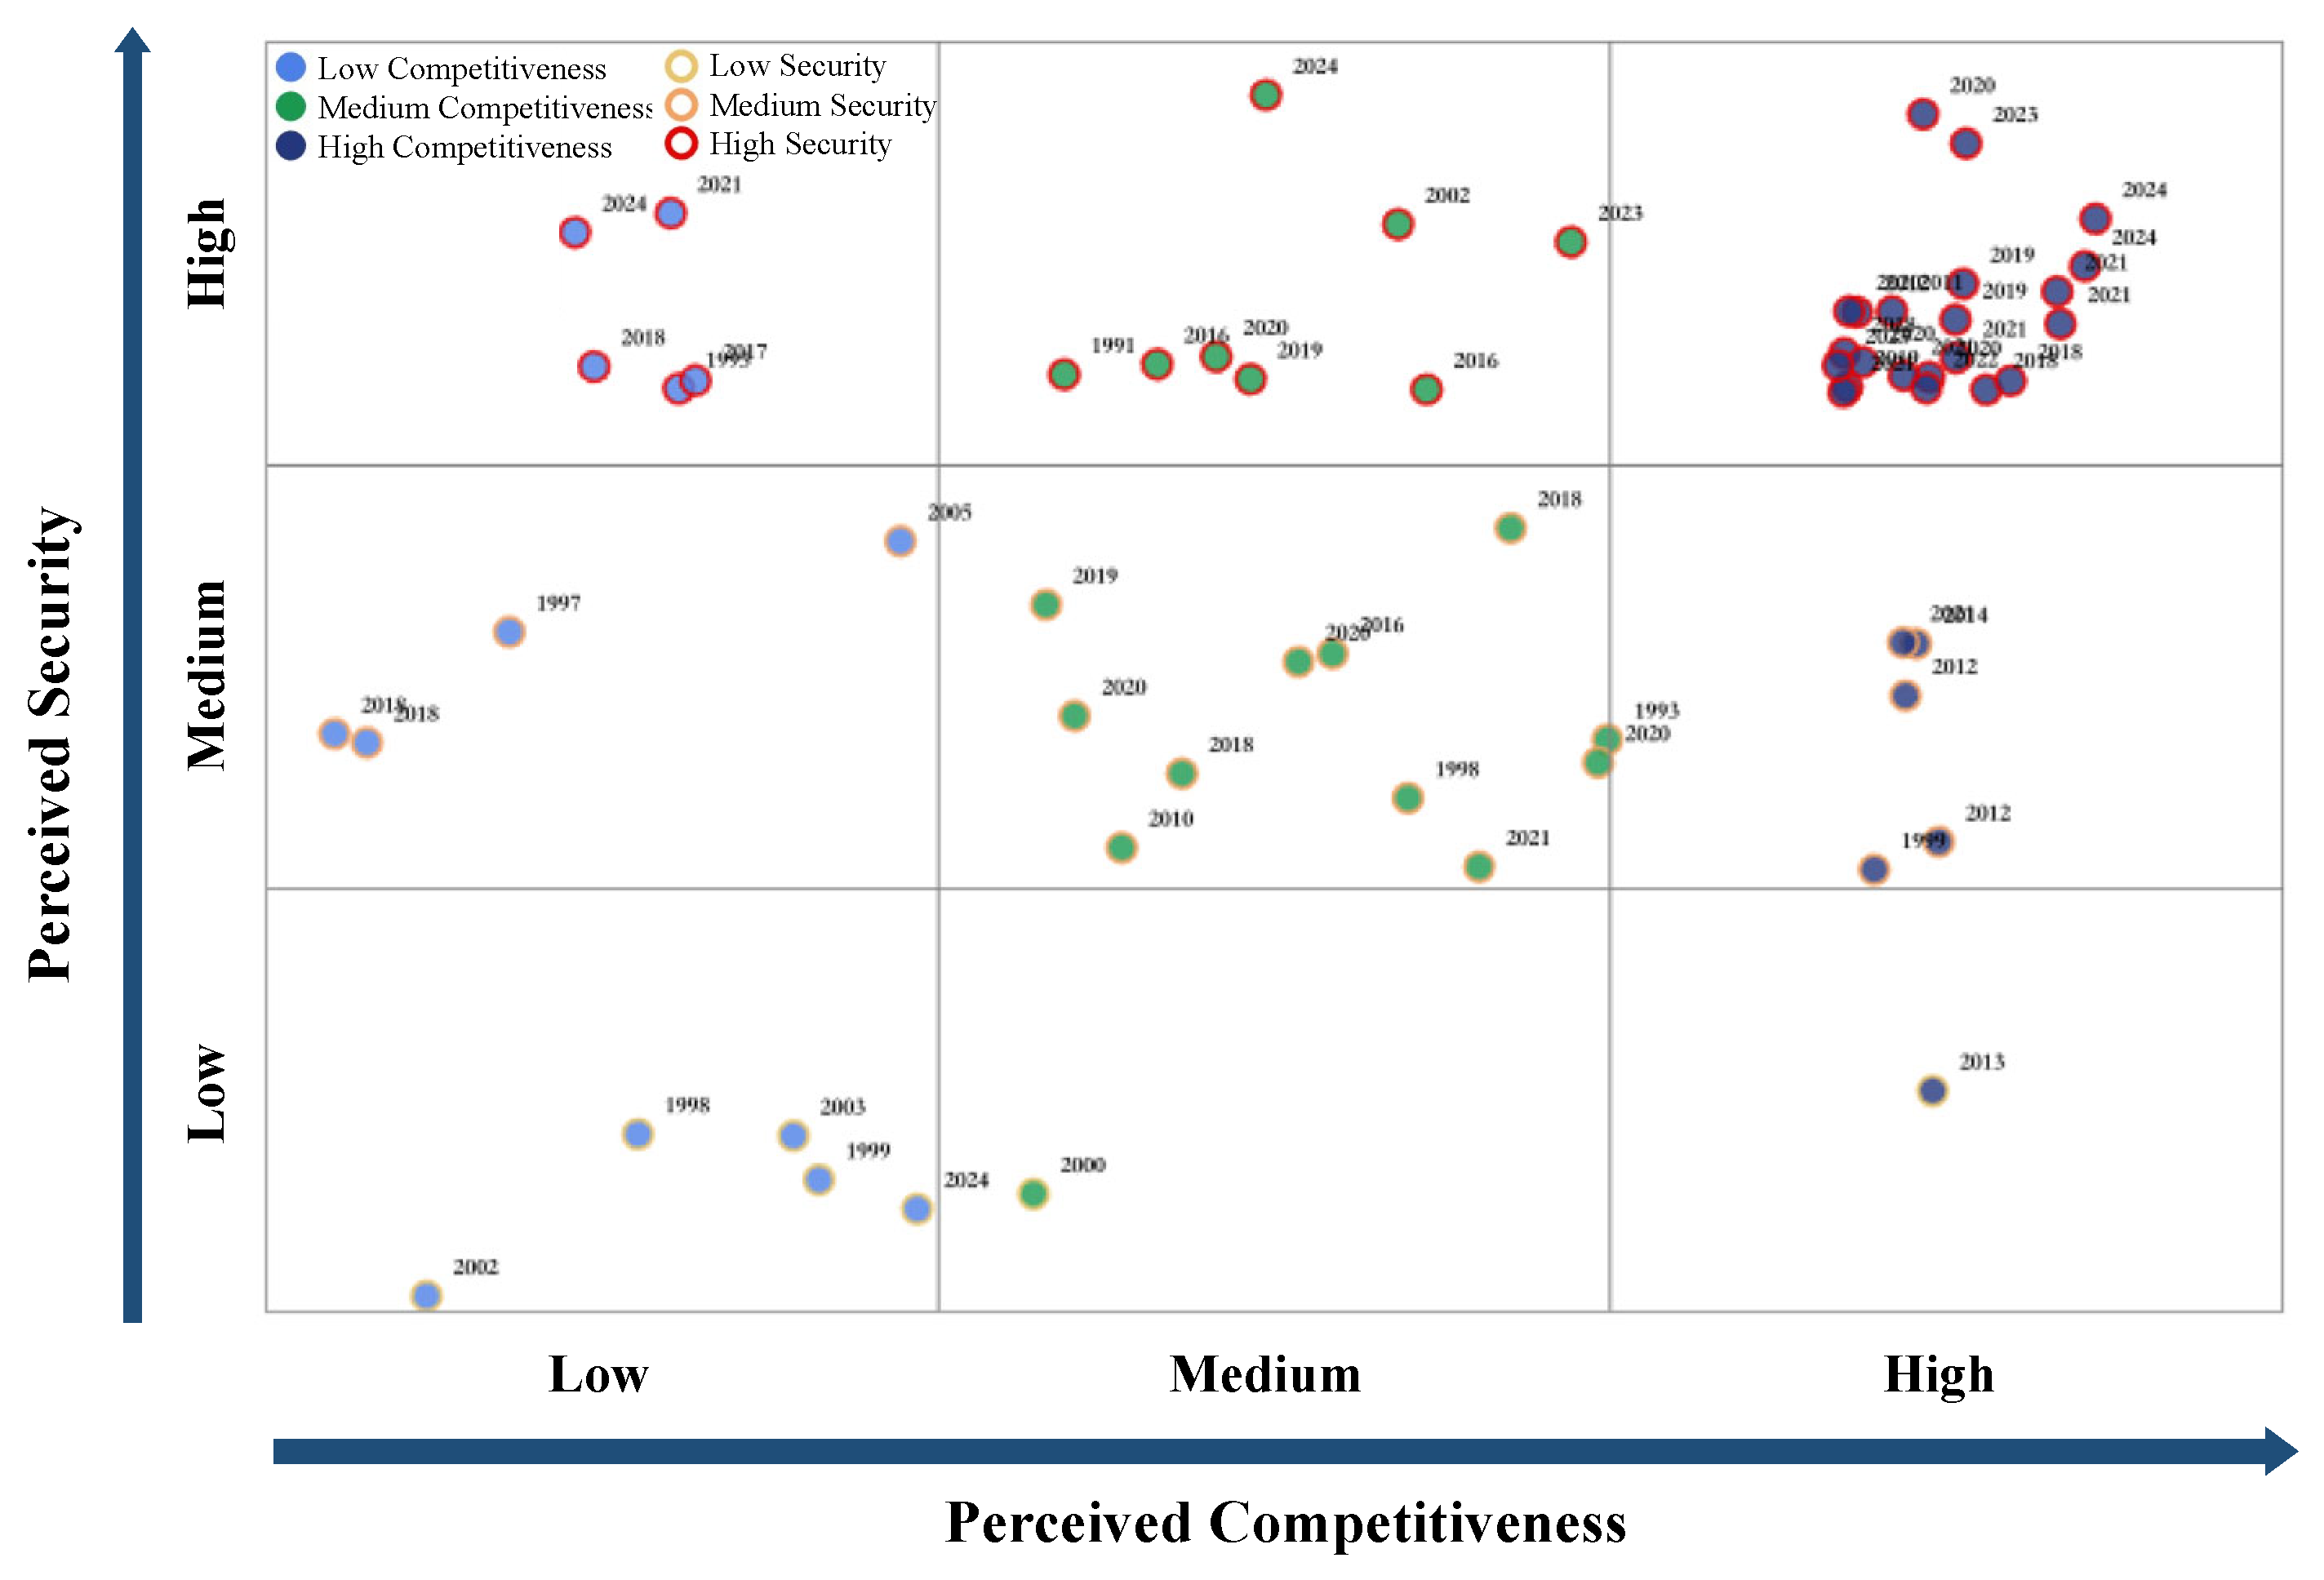
This study constructs a two-dimensional policy intensity distribution matrix (DPM) based on perceived competitiveness and security. The 63 policies are mapped into the matrix space (
Figure 5), with the word frequency ratio as the basic indicator and key thresholds of 0.5% and 1% dividing the policy space into nine quadrants. This method considers the objective characteristics of policy texts and reflects differences in policy orientation, providing a foundation for identifying policies’ general positioning and characteristics.
The threshold selection is based on a statistical analysis of keyword frequency distribution across the 63 policy samples. Through detailed analysis of perceived competitiveness scores and perceived security scores, we found that scores in both dimensions mainly concentrate within the 0–2% range. Specifically, the first quartile and median of perceived competitiveness scores are 0.58% and 0.97%, respectively; for perceived security scores, they are 0.68% and 1.1%. Selecting 0.5% and 1% as boundary points for both dimensions allows for statistically reasonable classification of policies into “low” (<0.5%), “medium” (0.5–1%), and “high” (>1%) levels, thereby forming nine policy quadrants that intuitively present the distribution characteristics of policies across different dimensions. Further sensitivity analysis results, achieved by gradually adjusting threshold ranges (0.4–0.6% and 0.9–1.1%) and observing the stability of policy classification, verified the robustness of this threshold selection. This threshold setting, based on statistical distribution and sensitivity analysis, can systematically identify strategic orientation differences in policy texts regarding competitiveness and security, providing a quantitative tool for studying policy evolution and optimization, while also offering a practical reference for policymakers to balance different orientations when formulating policies.
From the perspective of spatial distribution, the policies mainly exhibit three significant characteristics. First, the high-competitiveness-high-security quadrant (upper right region) concentrates the most on policy points, indicating that U.S. digital economy policies generally pursue the collaborative improvement of competitiveness and security. Second, many policies introduced after 2018 are distributed in the high-security region, highlighting the policy shift towards a security orientation. Third, the policy distribution exhibits prominent sequential evolution characteristics, with early policies primarily located in the medium-low intensity region and recent policies concentrated in the high-intensity region. This distribution pattern is highly consistent with the U.S. digital economy development strategy. In recent years, the U.S. has continuously invested in digital infrastructure, artificial intelligence, cybersecurity, and other fields, which is a strategic consideration of digital sovereignty and a practical need for industrial competitiveness. The overall increase in policy intensity reflects the U.S.’s strategic intent to seek a leading position in the global competition of the digital economy.
4.2.4. Leading Policy Intensity Strategy Matrix
Based on the distribution characteristics of the policy intensity matrix, this subsection constructs a policy intensity distribution DPM based on perceived competitiveness and perceived security, categorizing the U.S. digital economy’s leading policies into nine main types. This classification and naming reflect how the U.S. balances national security and economic development when formulating relevant policies and how it maintains its own interests in the context of globalization. These policies also affect the interaction between the U.S. and other countries, especially China.
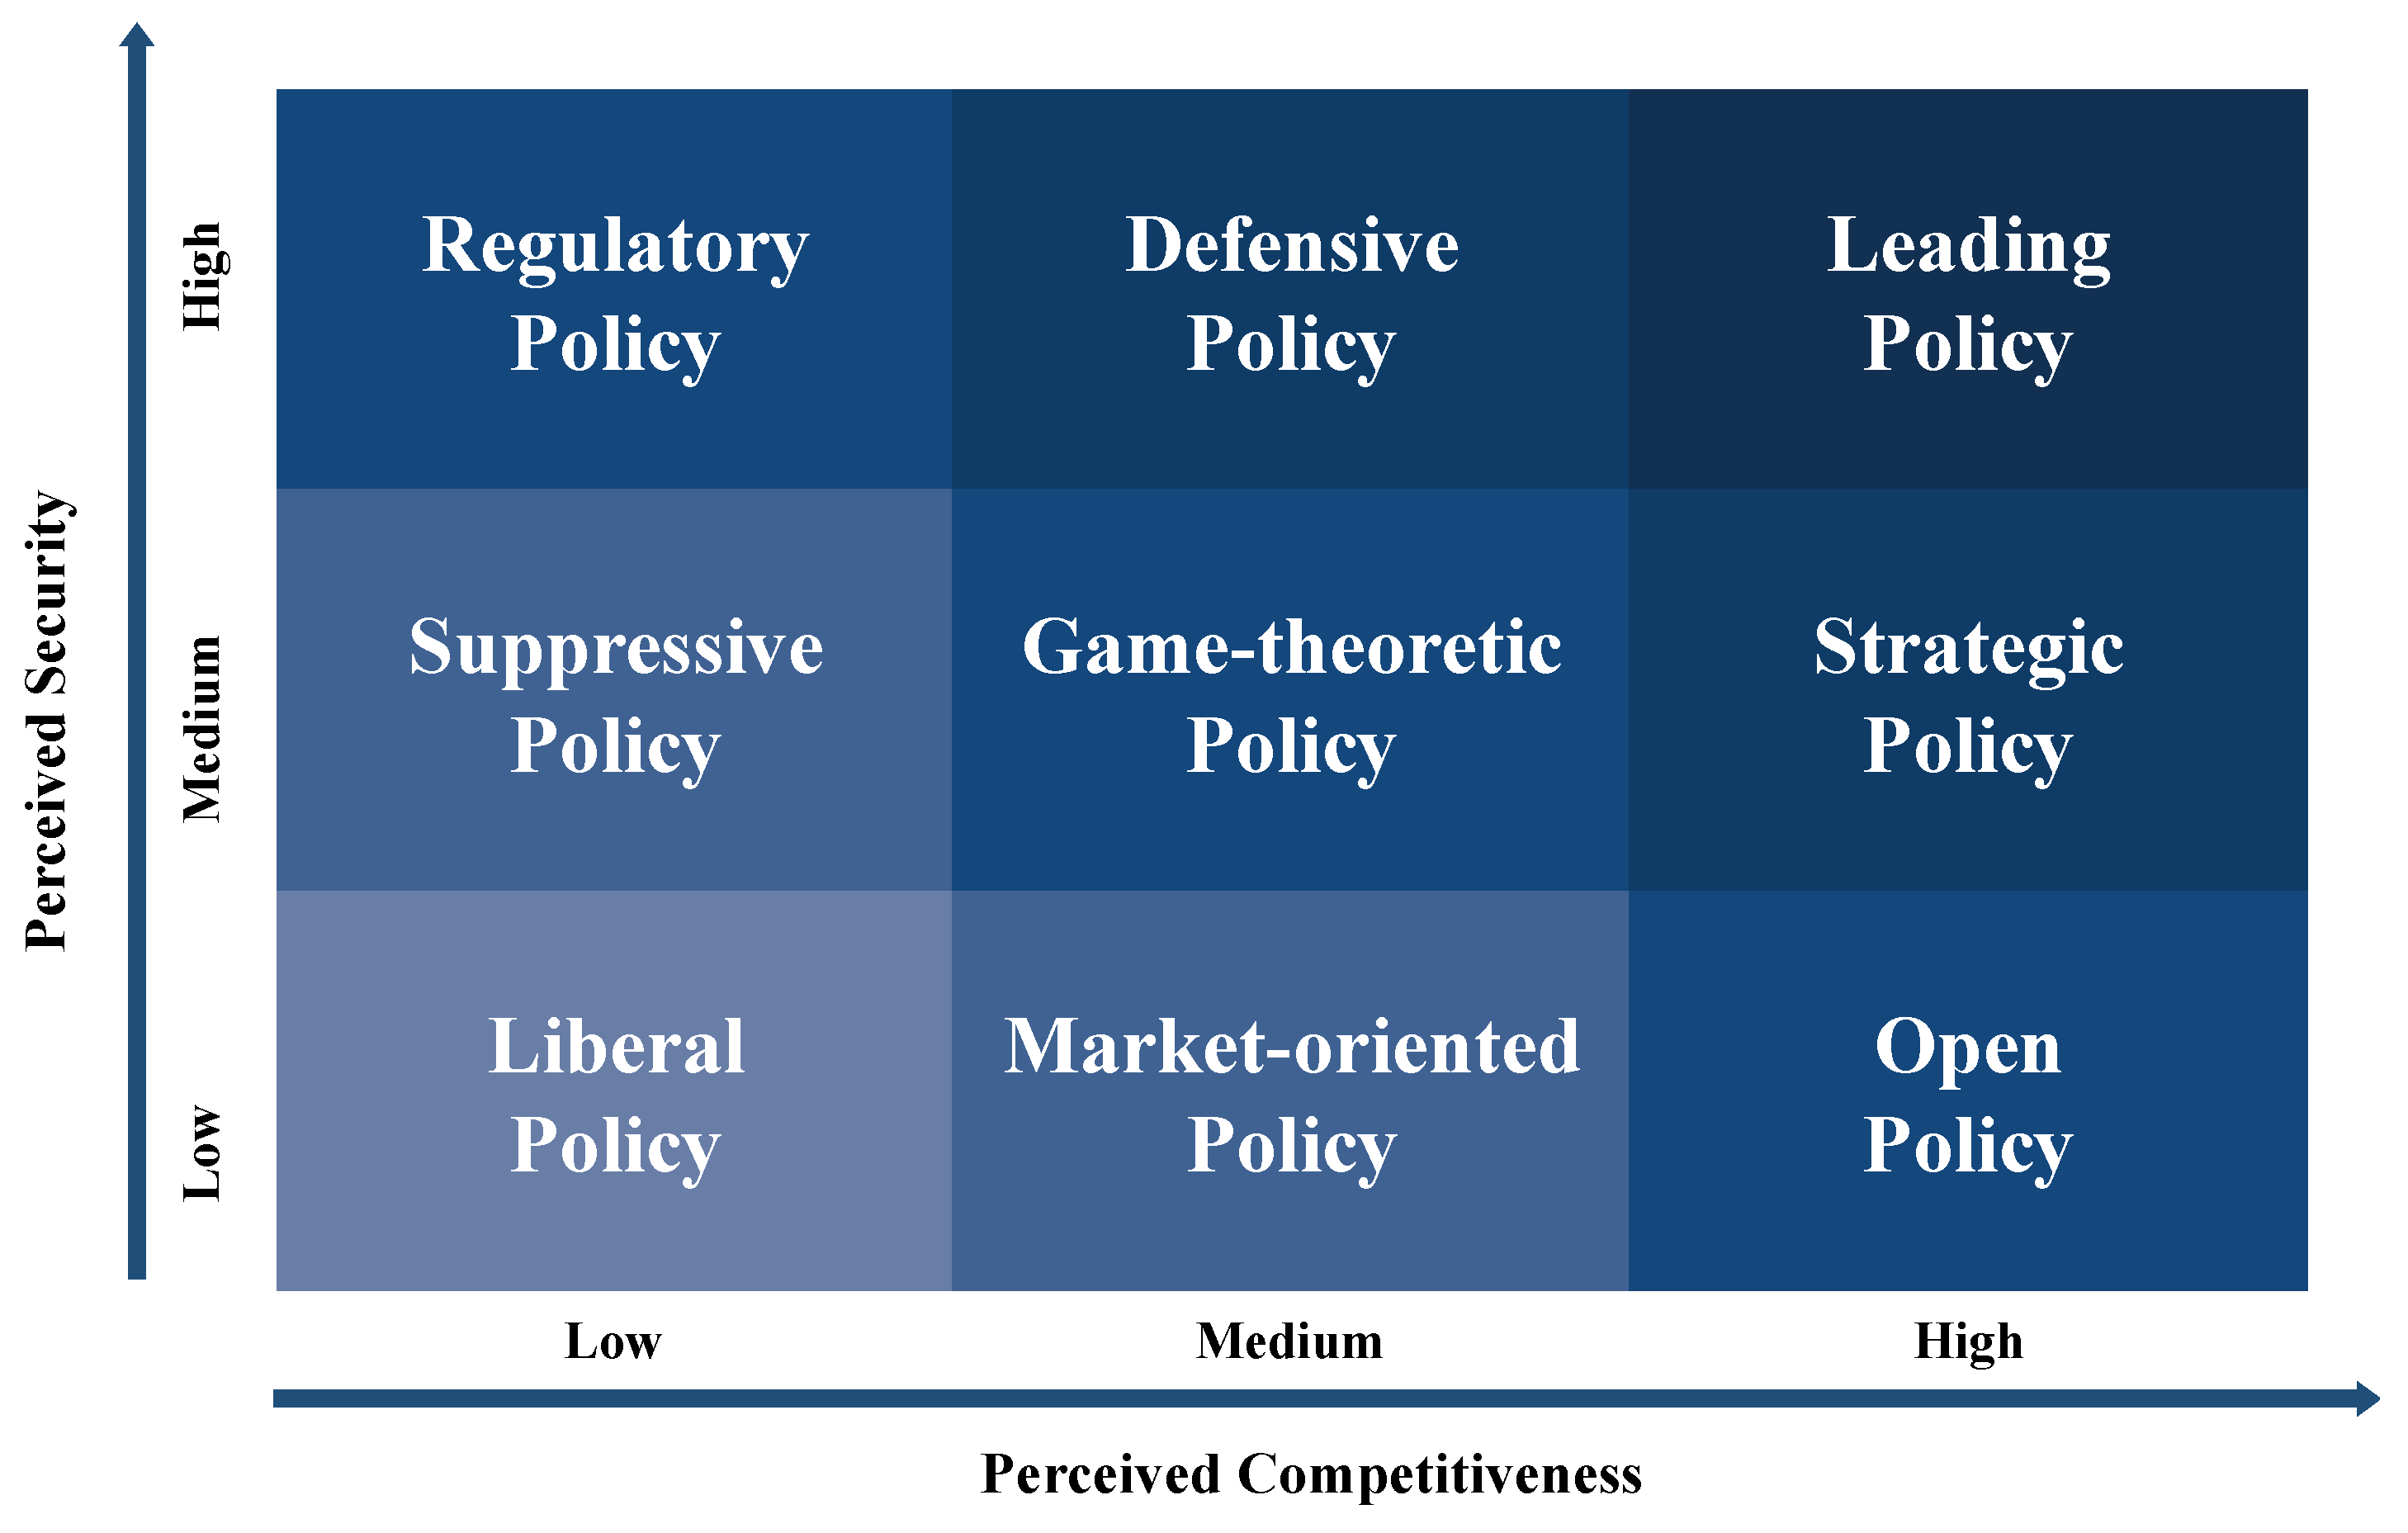
As shown in
Figure 6, (1) High perceived security, high perceived competitiveness: leading policies. These policies aim to consolidate the U.S.’s leading advantage in key technology fields, ensuring national security and economic prosperity. (2) High perceived security, medium perceived competitiveness: defensive policies. These policies focus on strengthening the U.S.’s security defense in key areas, dealing with potential threats and challenges. (3) High perceived security, low perceived competitiveness: regulatory policies. These policies prioritize ensuring national security by strengthening regulation and control, but may, to a certain extent, affect the competitiveness of related industries. (4) Medium perceived security, high perceived competitiveness: strategic policies. These policies support and empower the U.S.’s development in specific fields, enhancing comprehensive national strength and global competitiveness. (5) Medium perceived security, medium perceived competitiveness: game-playing policies. These policies balance security and development, seeking to balance national security and economic development, considering both short-term and long-term interests. At the same time, the U.S. engages in games and competitions with other countries on related issues. (6) Medium perceived security, low perceived competitiveness: containment policies. The primary purpose of these policies is to protect the U.S.’s economic interests, possibly using national security to guard against competition from other countries, such as taking restrictive measures against Chinese companies or technologies, which is a typical “suppression” move. (7) Low perceived security, high perceived competitiveness: liberal policies. These policies emphasize innovation-driven and free competition, with relatively low attention to security issues, which may increase the difficulty for China in catching up in related fields. (8) Low perceived security, medium perceived competitiveness: market-oriented policies. These policies provide moderate support for the continued development of the U.S. economy but with relatively little consideration for security. (9) Low perceived security, low perceived competitiveness: laissez-faire policies. These policies rely more on market mechanisms and free competition, with less government intervention and guidance regarding security and development.
Extending this analytical perspective to the international comparative level, we can observe differentiated strategic choices and evolutionary trajectories in digital economy policies among the United States, China, and other typical countries. The U.S. policy framework after 2018 demonstrates a dual-driven characteristic of “competitiveness-security”, as revealed by the policy intensity distribution matrix discussed earlier. In contrast, China’s policy system is mainly distributed in the strategic policy quadrant and game-playing policy quadrant, showing a more prominent orientation toward industry cultivation and application scenario expansion. This characteristic is clearly reflected in the systematic deployment of industrial-scale expansion and scenario innovation in China’s “14th Five-Year Plan” for digital economy development. China began systematically planning its digital economy with the “Internet+” strategy in 2015; although its overall start was relatively behind the United States, the policy formulation time gap in frontier fields such as artificial intelligence and quantum computing has significantly narrowed, reflecting the characteristics of late-developing economies in policy learning and strategic catch-up.
In differentiated contrast to China and the United States, the European Union has adopted a unique “regulation-first” approach, with its policies mainly concentrated in the high perceived security and low perceived competitiveness quadrant (regulatory policies) and the medium perceived security and low perceived competitiveness quadrant (containment policies). The Digital Services Act, Digital Markets Act, and AI Act constitute a structurally complete digital governance framework globally, forming what academics call the “Brussels Effect”, which exerts institutional influence on global digital economy governance through market access mechanisms. Ireland represents a special model for small open economies, with its policy layout mainly positioned in the low perceived security and high perceived competitiveness quadrant (liberal policies) and the low perceived security and medium perceived competitiveness quadrant (market-oriented policies). Through its 12.5% low corporate tax rate, “Knowledge Development Box” tax incentives, and English-speaking talent advantages, Ireland attracts U.S. tech companies to establish European operations centers, forming a unique institutional competitiveness. This model has resulted in Ireland’s significant performance in terms of digital economy output—in 2022, the digital economy accounted for more than 15% of its GDP. However, this development path dependent on international IT companies has also led to structural challenges of “large scale but weak strength”, with limitations in independent innovation capabilities.
These international comparisons not only reveal the diversity of digital economy policy orientations but also highlight the key role of leading policy intensity dimensions in shaping national digital economy development paths. Through the policy intensity analysis matrix, we can identify different countries’ strategic choices in balancing competitiveness and security, providing a methodological tool for international comparative research on the “leading policy guidance” dimension within the PCT framework, while also laying the foundation for subsequent analysis of coordination mechanisms and talent strategy dimensions.
4.3. Analysis of Coordination Mechanism Intensity and Construction of Strategy Matrix
The choice and implementation of government coordination mechanisms largely depend on the industrial development stage and market structure characteristics. This section constructs indicators of industry maturity and core IP concentration based on U.S. digital economy patent data to analyze how the U.S. government implements differentiated coordination strategies to maintain its leading position in the global digital economy.
4.3.1. Analysis of U.S. Digital Economy Patent Data
Patents reflect a country’s innovation capability, the competitive landscape of market players, and the distribution of technological advantages. This study comparatively analyzes the patent competition situation between the U.S. and other major economies in the digital economy field.
Figure 7 shows the changing trends in the number of digital economy patents for the United States, China, Japan, and the European Union between 2014 and 2023. The data reveals significant differences in growth characteristics and competitive advantages, with the United States maintaining a global leading position. This leading advantage stems from three aspects: a comprehensive intellectual property protection system, an innovation ecosystem characterized by deep integration of industry, academia, and research, and high-intensity R&D investment coupled with flexible talent policies. The distribution characteristics of patent data indicate that the United States has formed a relatively mature innovation system and market structure in the digital economy field, providing favorable conditions for the government to implement precise coordination mechanisms.
4.3.2. Coordination Mechanism Analysis: Measuring Industry Maturity and IP Concentration
In order to scientifically measure the development characteristics of various sub-fields of the U.S. digital economy, this study constructs two core indicators: industry maturity and core IP concentration. These two indicators, respectively, reflect the industry development stage and market structure characteristics, which help us understand the government’s choice of coordination strategies in different contexts.
Industry maturity refers to the development stage of a specific technology field or industry in its life cycle, reflecting the stability of the technological paradigm, market acceptance, and the maturity level of business models in that field. In the context of the digital economy, industry maturity characterizes the dynamic evolutionary process of specific digital technologies from emergence and growth to stability and possible decline. Core IP Concentration derives from the concept of market concentration in industrial organization theory but specifically focuses on the distribution of knowledge assets. In the digital economy context, Core IP Concentration measures the degree of concentration in the ownership distribution of key intellectual property rights in a specific technology field, reflecting the market structure characteristics, innovation resource allocation patterns, and potential market power conditions in that field.
(1) Measurement Method
In terms of measuring industry maturity, this study constructs a dynamic evaluation index based on patent data. This method assumes that when the growth rate of patents in an industry reaches its maximum value, it indicates that the industry has entered a mature stage. Specifically, for an industry, at time , when the growth rate of the number of patents in the industry reaches the maximum speed , it is considered mature and reaches the maturity threshold (set to 0.6 in this study). The linear interpolation method is used to calculate the maturity at each period before and after the relative maturity time point. This threshold can accurately capture the characteristics of the industry’s rapid growth period while leaving sufficient room for subsequent development.
This study uses the ratio of the number of newly added patents in the current year to the cumulative number of patents to characterize the industry growth rate:
where
represents the number of new patents in industry
in year
,
represents the cumulative number of patents up to year
.
To normalize the industry maturity distribution within the interval [0, 1], the following standardization treatment is performed:
where
represents the industry maturity in year
,
represents the maturity threshold,
represents the maximum growth rate during the entire observation period,
represents the growth rate in year
,
represents year
, and
represents the year when the growth rate reaches its maximum value. This standardized processing allows for horizontal comparison of maturity across different digital economy subsectors on a unified scale.
When measuring the concentration of core IP in an industry, the top companies with the largest number of patents in the industry are selected, and the proportion of the number of patents owned by these companies to the total number of patents in the industry is used to measure the concentration of core IP in the industry. The calculation formula is as follows:
Specifically, this study identifies the top
companies (
) with the largest patent share in each sub-industry through the PatSnap global patent database and then uses the proportion of the total number of patents owned by these companies to the total number of patents in the industry. The database allows us to directly retrieve patent ownership information for each company within specific digital economy domains, ensuring consistency and accuracy in our concentration metrics. This indicator can effectively reflect the market structure characteristics and distribution of innovation resources in the industry. The specific calculation formula is as follows:
where
represents the total number of patents in industry
,
represents the number of IPs owned by company
in industry
, and
represents the top
companies with the most patents in industry
. A higher
value indicates that core intellectual property in the field is concentrated among a few enterprises, suggesting the possible existence of technological oligopolies; a lower
value indicates that intellectual property distribution in the field is more dispersed, with a more open competitive landscape.
These two quantitative indicators jointly form a two-dimensional framework for analyzing the coordination mechanisms of the digital economy. The industry maturity dimension reflects the stage of technological evolution, guiding governments to adjust support intensity and intervention methods; the core IP concentration dimension reveals market structure characteristics, guiding governments to balance the relationship between innovation incentives and competition maintenance. Through these two sub-dimensions, we can analyze how the U.S. government implements differentiated coordination strategies according to the development characteristics of different digital economy subsectors.
(2) Analysis of the Maturity of Digital Economy Industries
Based on the above methods, this research measured the maturity of various segmented industries in the U.S. digital economy. As shown in
Figure 8, different segmented industries present differentiated development trajectories. In the industry development speed line chart, when the speed curve reaches the highest point, it is considered that the development speed of the industry has reached its peak. Then, this article believes that the development of the industry has reached maturity.
From the perspective of the technology life cycle, the maturity evolution during 2014–2023 presents three patterns: first, a prominent peak appears during the observation period, indicating that the technology has entered a mature period; second, the peak has passed, indicating that the technology has entered a post-mature period; third, the peak has not yet been reached, indicating that the technology is still in a growth period. This diversified development characteristic requires the government to adopt more precise and differentiated coordination strategies.
These quantitative indicators provide important support for the subsequent construction of a coordination mechanism strength strategy matrix. The research found that the maturity differences in different segmented industries reflect the structural characteristics of the U.S. digital economy, and these characteristics directly affect the choice and implementation of government coordination mechanisms. For example, the government focuses more on maintaining market order in relatively mature fields such as cloud computing. In contrast, emerging fields such as quantum computing emphasize innovation support and industrial cultivation. This analysis method, based on quantitative indicators, provides a scientific basis for understanding how the U.S. government adjusts coordination strategies according to industry characteristics and also lays the foundation for subsequent research on the evolution of government coordination mechanisms.
The threshold settings for categorizing low, medium, and high levels of industry maturity and core IP concentration are based on statistical quartile analysis of our collected patent data. For both dimensions, we analyzed the distribution of calculated scores across all 10 digital economy subsectors for the period 2014–2023. Based on this distribution, we established thresholds at the first quartile and median, categorizing industries below 0.25 as “low”, between 0.25 and 0.5 as “medium”, and above 0.5 as “high” for both maturity and IP concentration dimensions. This quartile-based approach ensures our categorization directly reflects the actual statistical distribution of the observed data.
4.3.3. Distribution of Coordination Mechanism Strength Strategies
This research analyzed the distribution of coordination mechanism strategies in the U.S. digital economy from 2014 to 2023 using industry maturity and core IP concentration indicators.
Figure 9 shows a scatter plot of the strategy distribution, revealing the evolution characteristics and dynamic adjustment of government coordination priorities over the past decade.
The development of U.S. digital economy segments shows distinct stage characteristics. Before 2016, most fields had low market maturity and high IP concentration, with the government focusing on creating an innovation-conducive environment. During the rapid growth stage (2017–2020), market maturity increased, and IP concentration differentiated, prompting the government to maintain a fair, competitive environment. In the differentiated development stage (2021–2023), the government’s coordination focus varied based on the maturity and IP distribution of each segment.
The U.S. government’s coordination mechanism continuously adjusts according to the industry development stage and market structure characteristics, maintaining innovation vitality and orderly market development. This dynamic adaptability is an important institutional guarantee for the United States to maintain its global leading position.
4.3.4. Coordination Mechanism Strength Strategy Matrix
Based on the quantitative analysis of the U.S. digital economy’s maturity and IP concentration, this study constructs a DPM of coordination mechanism strength strategies (
Figure 10) to depict the government’s coordination choices under different development stages and market structures. The matrix divides government coordination mechanisms into nine typical modes, each reflecting the focus of government intervention under specific conditions.
According to different combinations of market maturity and core IP concentration, the nine coordination modes are expressed explicitly as follows: (1) Low market maturity, low core IP concentration: free competition market. In this type of market, there is less government intervention, mainly relying on the market’s competition mechanism to promote development. (2) Low market maturity, medium core IP concentration: market opening market. The government promotes market development through policy guidance and incentive measures in the opening market. (3) Low market maturity, high core IP concentration: cooperation guidance market. The government guides market development in the cooperation guidance market by promoting cooperation and collaborative innovation. (4) Medium market maturity, low core IP concentration: arrogant protection market. In the arrogant protection market, the government may provide specific protection measures for existing market participants to prevent industry turmoil caused by excessive market competition. (5) Medium market maturity, medium core IP concentration: technology-driven market. The government promotes market development in the technology-driven market by promoting technological innovation and industrial coordination. (6) Medium market maturity, high core IP concentration: intellectual property protection market. In the intellectual property protection market, the government protects innovation and competition through strict intellectual property protection measures. (7) High market maturity, low core IP concentration: courtyard wall containment market. In the courtyard wall containment market, government support is less, but relatively strict review and supervision are carried out to protect domestic enterprises’ competitive advantages and market environment. (8) High market maturity, medium core IP concentration: technology upgrade market. In the technology upgrade market, the government focuses on promoting the upgrading of technology and the sustainable development of the market through policy and financial support. (9) High market maturity, high core IP concentration: technology dominance market. In the technology-dominant market, the government’s role may involve more antitrust regulation and market norms, and it may even intervene in the regular operation of the market.
This matrix-based coordination mechanism design enables the U.S. government to implement precise coordination according to the characteristics of different digital economy segments, ensuring innovation vitality and market order, and providing an institutional guarantee for the U.S. to maintain its global leading position.
From an international comparative perspective, different countries demonstrate systematic differences in the design and implementation of digital economy coordination mechanisms, reflecting unique paths in institutional environments, technological capabilities, and development stages. The U.S. coordination mechanism centers on market entities with indirect government support, forming the nine coordination modes summarized in this research; in contrast, China’s coordination mechanism exhibits stronger top-level design and government guidance characteristics, promoting digital industry development through a “government-guided, market-operated” model. Taking the semiconductor industry as an example, the U.S. has adopted a government-led coordination mechanism through the CHIPS Act, while China relies more on policy tools such as the National Integrated Circuit Industry Investment Fund to create resource aggregation effects. South Korea’s “Digital New Deal” plan demonstrates a distinctive coordination model of close collaboration between the government and chaebol enterprises, which operates efficiently in contexts of medium industry maturity and high IP concentration; Germany’s “Industry 4.0” strategy reflects a typical “government-industry-research institution” trilateral coordination mechanism, playing a significant role in technology upgrade markets with high industry maturity and medium IP concentration. These differentiated coordination mechanisms reflect how various countries apply the coordination mechanism intensity strategy matrix proposed in this paper differently based on their own industrial development stages and market structure characteristics.
Additionally, Ireland provides a case of a special coordination model for a small open economy. Through precise coordination by IDA Ireland (Industrial Development Authority of Ireland), Ireland has constructed a “trinity” coordination mechanism: tax incentives (12.5% corporate tax rate), talent support (such as the “Critical Skills Occupations List”), and industrial clusters (The Galway City Innovation District). This coordination mechanism has successfully attracted over 90% of major U.S. tech companies to establish European headquarters or operation centers in Ireland, creating a special digital economy development path that depends on external technology but efficiently integrates global resources. The Irish model forms a stark contrast with the U.S. independent innovation model, demonstrating diversity in the global digital economy coordination mechanism spectrum, while also validating the applicability of the coordination mechanism intensity matrix proposed in this study in analyzing different countries’ digital economy development paths.
4.4. Talent Cultivation Strategy Analysis and Strategy Matrix Construction
In the era of the digital economy, talent competition has become the core of international competition. As the global digital economy leader, the United States’ talent cultivation strategy has important reference value. This section constructs an “industry chain-talent characteristics” strategy matrix, combined with the development data of unicorn companies, to analyze the practical experience of the United States in the cultivation of digital economy talents. On this basis, it refines a universally applicable talent cultivation strategy matrix to provide helpful enlightenment for the cultivation of digital economy talents in China.
4.4.1. Sub-Dimensions on Talent Cultivation Analysis
This subsection constructs a two-dimensional “industrial chain-talent characteristics” analysis perspective to examine the talent development strategies of the U.S. digital economy, considering both the industrial characteristics and the inherent laws of talent development.
In the industrial chain dimension, the analysis objects are divided into three levels based on the digital economy’s technological characteristics and value chain distribution: hardware (basic infrastructure industries), software (core technologies), and services (application scenarios). This hierarchical framework reflects the vertical structure of the digital economy and the differentiated needs of different links for talent.
In the talent characteristic dimension, based on Guilford’s creative personality theory and combining the special requirements of digital economy talents, this study proposes three core characteristic dimensions: curiosity and concentration reflect the inner motivation for continuous innovation, the desire for knowledge and exploration reflects the learning ability to break through boundaries, and critical thinking and imagination represent the way of thinking to solve problems. These characteristic dimensions have a theoretical basis and practical pertinence, which can better describe the key characteristics of digital economy talents. Curiosity and concentration reflect the internal driving force for continuous innovation and perseverance in problem-solving. The desire for knowledge and exploration embodies the cross-domain learning abilities necessary for breaking boundaries. Critical thinking and imagination represent cognitive methods that contribute to solving complex problems and disruptive innovation.
4.4.2. Analysis of Unicorn Enterprises Cultivation
Based on the aforementioned analytical framework, this research first approaches from the perspective of unicorn enterprises to examine the practical effectiveness of U.S. digital economy talent cultivation. As an important indicator of the innovation and entrepreneurship ecosystem, the development characteristics of unicorn enterprises can effectively reflect the implementation effectiveness of a country’s talent cultivation policies. Based on the unicorn enterprises’ data, the study analyzed and examined the development models and growth cycles of Chinese and American unicorn enterprises as indicators of talent cultivation effectiveness.
On this foundation, to further examine talent characteristics, this dissertation systematically reviewed unicorn founders and key figures in the digital economy and collected related news materials about these figures. Using text analysis methods to quantify the frequency of characteristic keywords, it subsequently constructed a talent distribution scatter plot. This methodology achieved both a quantitative assessment of talent cultivation models and provided qualitative analysis within the PCT framework.
Following this methodological approach, unicorn enterprises serve as an ideal proxy indicator for the talent cultivation dimension for several compelling reasons. First, unicorn enterprises represent the pinnacle of entrepreneurial talent success, directly reflecting the effectiveness of talent cultivation systems. The quality of founders and core teams—their technical capabilities, management skills, and innovation mindsets—is the primary determinant of unicorn emergence and growth. Second, unicorn development simultaneously demonstrates the interplay between all PCT dimensions: these enterprises thrive where forward-leading policies create favorable innovation environments, where effective coordination mechanisms facilitate resource allocation and knowledge transfer, and where sophisticated talent ecosystems produce entrepreneurial leaders with both domain expertise and cross-disciplinary capabilities. This comparative approach thus enriches our understanding of how talent development functions within the broader PCT framework.
From the perspective of the enterprise growth cycle, in recent years, the time span from the establishment of unicorn enterprises in China and the United States to their inclusion in the list has shown a significant shortening trend (
Figure 11). Especially among enterprises established after 2022, some outstanding enterprises have entered the list in just 1–2 years, which reflects the acceleration of enterprise growth cycles by digital technology innovation. This trend poses new requirements for talent cultivation, such as accelerating the pace of talent cultivation and enhancing the continuous innovation ability of talents.
From the perspective of the distribution of the number of enterprises, the United States maintains a clear advantage in the field of unicorn enterprises, particularly after 2021. This reflects its strong enterprise incubation capabilities and talent agglomeration effects, which can be attributed to a complete innovation and entrepreneurship ecosystem, a high-quality education resource system, and an open and inclusive innovation culture.
These findings provide an important basis for further in-depth analysis of talent distribution characteristics and the construction of cultivation strategies. In particular, the development characteristics of unicorn enterprises not only reflect the effectiveness of the U.S. digital economy talent policies but also provide a realistic reference for understanding the cultivation models of different types of talents.
For our analysis, we systematically collected data on 58 founders of digital economy unicorn enterprises from authoritative sources. Using text mining techniques with standardized keyword dictionaries for each talent characteristic dimension, we analyzed 217 documents of text to quantify each founder’s characteristic scores based on standardized keyword frequency ratios. The thresholds of 15% and 25% for categorizing talent characteristics as low, medium, or high were determined based on statistical distribution analysis of all collected data, with these values approximating the first quartile and third quartile boundaries across the analyzed founder sample. Sensitivity analysis confirmed the stability of these threshold selections for talent classification. For industry chain positioning, classification was based on companies’ primary business focus and core technology offerings.
4.4.3. Talent Characteristic Distribution
To deeply understand the distribution patterns of U.S. digital economy talents, this study conducts a systematic review and characteristic extraction of unicorn enterprises and important figures in the digital economy field based on the “industry chain-talent characteristics” analysis framework constructed in the previous section. A two-dimensional scatter plot that reflects talent distribution characteristics is constructed through text analysis of key dimensions such as career experience, innovation achievements, and leadership styles of these key figures (
Figure 12).
The thresholds of 15% and 25% for categorizing talent characteristics as low, medium, or high were determined based on statistical distribution analysis of all collected data, with these values approximating the first quartile and third quartile boundaries across the analyzed founder sample. Sensitivity analysis confirmed the stability of these threshold selections for talent classification. For industry chain positioning, classification was based on companies’ primary business focus and core technology offerings.
In the scatter plot, the horizontal axis represents the three levels of the digital economy industry chain (hardware, software, services), and the vertical axis reflects three types of core talent characteristics (curiosity and concentration, desire for knowledge and exploration, critical thinking and imagination), forming nine area combinations. The specific position of each talent in the plot is determined by two factors: the horizontal position reflects their influence and status in the industry, and the vertical position reflects the degree of prominence of their characteristic features. This visualization method can intuitively display the overall distribution pattern of talents and reveal the characteristic differences between different talents.
A systematic analysis of the scatter plot shows the following key characteristics: First, distribution balance. U.S. digital economy talents are distributed in all nine regions, with outstanding talents in different fields having different characteristics. There are representative figures of unicorn enterprises in each group, and their talent cultivation system can meet the diverse needs of industrial development. Second, in the hardware and software fields, the distribution of talent is relatively dense, especially in areas that require strong technological innovation capabilities, reflecting the deep accumulation of essential R&D talent in the United States. Third, outstanding talents in different fields often exhibit specific combinations of characteristics. For example, talents in the hardware field generally have strong concentration and exploration spirit, while talents in the service field more prominently display imagination and innovative thinking. By analyzing talents from different periods, dynamic changes in talent characteristic requirements can be observed, which provides a basis for the dynamic adjustment of talent cultivation policies.
4.4.4. Talent Cultivation Strategy Matrix
Based on the analysis of talent distribution characteristics, this study constructs a U.S. digital economy talent cultivation strategy matrix (
Figure 13). It aims to systematically summarize the cultivation models of different types of talents and provide a reference framework for policy formulation. The matrix maintains a 3 × 3 structure design, but further refines the strategic connotations of each area.
The analysis of typical figures summarizes nine representative talent models (
Figure 13). The hardware field, represented by Jobs and Musk, Moore and Noyce, and Huang and Su, reflects product innovation driven by concentration, technological breakthroughs driven by the spirit of exploration, and industrial transformation led by strategic thinking, respectively. In the software field, the Ellison and Ritchie model emphasizes technical depth, the Gates and Benioff model focuses on continuous innovation, and the Hinton and Altman model represents cutting-edge breakthroughs. In the service field, the Larry and Jeff model showcases technological service innovation, the Zuckerberg and Dorsey model reflects social media innovation, and the Bezos and Hastings model represents business model innovation. These models reflect the diversity of U.S. digital economy talents and reveal the differentiated needs of different fields for talent characteristics. The study finds that successful digital economy talents often possess outstanding characteristics in their respective fields, and these characteristics are highly related to their innovative achievements and industry contributions. This finding provides an important reference for precisely implementing talent cultivation policies.
The development trajectories of Chinese and American digital economy unicorn enterprises show certain differences, essentially reflecting the distinctive talent strategy characteristics of the two countries. The U.S. digital talent cultivation system is market demand-oriented, presenting a relatively balanced distribution pattern and forming the nine representative talent models outlined in our research. In comparison, China emphasizes the expansion of higher education and the popularization of digital skills, achieving significant accomplishments in talent quantity development. There are also differences in the characteristic distribution patterns of Chinese and American digital talents. American talents typically emphasize innovative thinking and entrepreneurial spirit, while Chinese talents demonstrate unique advantages in system development and application implementation. Globally, Israel has established a unique position in cybersecurity talent development through its military-civilian integrated talent cultivation system. India, leveraging its large-scale, high-quality IT talent pool, has become an important global digital service provider, creating unique competitive advantages. European countries, especially Germany, have traditional advantages in technological breakthrough talents in the hardware field, providing talent support for their technological innovation in Industry 4.0. This diversified global landscape indicates that the choice of digital talent cultivation models is closely related to national innovation systems and industrial characteristics, with different countries forming differentiated distribution patterns across the nine quadrants of the talent strategy matrix.
4.5. Analysis of Interactive Relationships Among the Three PCT Dimensions
The three dimensions of policy guidance, coordination mechanisms, and talent cultivation do not exist in isolation but form complex relationships of mutual promotion and constraint. Based on the previous analysis, this section further explores the interactive relationships among these three dimensions to better understand the U.S. digital economy development model.
First, policy guidance and coordination mechanisms construct a bidirectional feedback loop. On one hand, policy orientation determines coordination priorities and intervention intensity. For example, high perceived competitiveness policies typically correspond to market opening and technology-driven coordination mechanisms, providing a relaxed environment for enterprise innovation; while high perceived security policies tend to adopt intellectual property protection and technology-led coordination mechanisms, strengthening security guarantees for key technologies. On the other hand, the implementation effects of coordination mechanisms influence policy adjustments in return—the implementation status of coordination mechanisms may provide feedback for policy adjustments, and changes in industrial development conditions may prompt the government to reassess policy priorities [
69].
Second, leading policies and talent cultivation form a strategic, synergistic relationship. The development of digital technology is profoundly reshaping work content and organizational forms, requiring corresponding adjustments in talent policies. Appropriate policies can significantly enhance regional talent mobility and innovation culture [
53,
70]. Taking the artificial intelligence field as an example, after the U.S. released the “National Artificial Intelligence R&D Strategic Plan” in 2016, the National Science Foundation (NSF) gradually expanded AI talent support in the following years; with continuous updates to “The National Artificial Intelligence R&D Strategic Plan” in 2019 and 2023, the NSF, along with multiple partner agencies, launched the National Artificial Intelligence Research Resource (NAIRR) pilot project in 2024, aiming to provide advanced computing, datasets, models, software, training, and user support for U.S. researchers and educators, forming a cascading advancement model of policy and talent cultivation. Similarly, talent innovation activities also influence policy-making directions—the rapid development of big data technology and the continuous promotion by research teams were among the important considerations for the U.S. in formulating the “Federal Big Data Research and Development Strategic Plan” in 2016, reflecting the influence of the research community on policy directions. This interactive relationship ensures that policy orientation and talent cultivation can mutually adapt and adjust.
Third, there exists a complementary relationship between coordination mechanisms and talent cultivation. Different types of coordination mechanisms need to match differentiated talent characteristic structures—free competition market environments require entrepreneurial talents with high innovation and risk-taking spirit, while technology-led markets rely more on scientist talents focused on deep research. For example, in fields such as cloud computing and application software, the U.S. government tends to adopt market-opening coordination mechanisms, which form positive interactions with the demand for innovative talents in these fields; while in key technology fields, such as semiconductors and advanced computing, the government adopts more cooperative guidance and supportive coordination approaches, matching the demand for professional research talents in these fields. Conversely, the distribution of talent characteristics in specific fields also affects the effectiveness and evolutionary direction of coordination mechanisms, such as the interdisciplinary nature of artificial intelligence talents, prompting the government to adopt more open and integrated coordination mechanisms.
The three dimensions of policy guidance, coordination mechanisms, and talent cultivation form a dynamic relationship of mutual influence: forward-looking policies lead industrial direction, precise coordination helps policy implementation, and systematic talent cultivation supports continuous innovation. Through the dimensional interaction analysis under the PCT framework, we can more accurately grasp the complex dynamic process of digital economy development, providing a more scientific theoretical basis for policy formulation and practical application.
5. Conclusions and Implications
This study constructs a “Leading Policy-Coordination Mechanism-Talent Introduction and Cultivation” (PCT) analysis framework to examine the formation mechanism of the United States’ leading advantages in the digital economy and reveal its strategic layout and institutional innovation.
Research conclusions: The formation of the United States’ leading advantages in the digital economy results from multi-dimensional linkage. In the policy dimension, the DPM policy strength matrix analysis reveals that 2018 is an important turning point, and the policy orientation has shifted from competitiveness-driven to “competitiveness-security” dual-driven. The differentiated layout of nine policy types reflects the strategic focus of different development stages. In the coordination dimension, based on the coordination mechanism strength matrix constructed using industrial maturity and core IP concentration, it shows that the strength of government intervention is dynamically adjusted with market development, forming nine typical models from free competition to technological dominance. In the talent dimension, through the two-dimensional analysis of the industrial chain and talent characteristics, nine representative talent models are constructed, revealing that the core characteristics of successful talents in different fields highly match their field characteristics.
The explanatory power of the PCT framework in this paper is further validated through specific successful cases and challenges in the U.S. digital economy. For example, the rapid development of the U.S. cloud computing industry (2010–2020) embodies the optimal synergy of the three PCT dimensions: forward-looking legislation such as the 2018 “Clarifying Lawful Overseas Use of Data Act”, effective industry-academia-research collaboration achieved through the “National Strategic Computing Initiative”, and the precise cultivation of technical architects and platform innovators. In contrast, the struggles in the early commercialization of quantum computing (2015–2019) can be attributed to PCT imbalance: despite strong policy support through the 2018 “National Quantum Initiative Act”, coordination mechanisms were dispersed among federal agencies, and talent cultivation lagged behind technological progress. The improvements after 2020 precisely followed adjustments guided by the PCT framework: streamlining funding coordination through the Quantum Economic Development Consortium and establishing specialized talent cultivation programs at top universities.
The development trends in the artificial intelligence field further validate the explanatory power of the PCT framework. In the policy dimension, the U.S. government issued the “American AI Initiative” in 2019 and committed to significantly increasing AI R&D investment, with the Department of Defense announcing over USD 1 billion for AI research in 2020; in the coordination dimension, an efficient cross-departmental coordination mechanism was established through the National Artificial Intelligence Research Institutes (NAIR); in the talent dimension, top universities and corporate laboratories formed a powerful talent cultivation network. However, the recent challenges faced by U.S. AI development can also be interpreted through the PCT framework: signs of weakening in the coordination dimension —although streamlined federal coordination accelerated AI development during 2019–2022, the subsequent increase in regulatory agencies has created coordination redundancy, with industry leaders reporting that this has slowed the pace of innovation; the talent dimension also faces pressure—despite maintaining leadership in advanced AI research, with policy adjustments affecting immigration and relatively declining educational investment, the U.S. faces increasingly fierce global competition for AI talent. Meanwhile, competing economies such as China have implemented comprehensive digital economy policies emphasizing talent development, such as the “14th Five-Year Plan for Digital Economy Development” in 2021, which strengthened policy support; the “New Generation Artificial Intelligence Ethics Code” in 2022, which improved coordination mechanisms; while simultaneously strengthening talent cultivation through the “High-End Talent Development Program”, forming a relatively coordinated PCT framework system in specific fields.
These specific cases validate the explanatory power of the PCT framework: when policy, coordination, and talent dimensions are strategically aligned, technological leadership follows; conversely, disharmony between dimensions creates developmental vulnerabilities. The PCT framework not only effectively explains past successes and challenges but also provides a practical tool for identifying strategic gaps in the digital economy and formulating precise intervention measures, offering important guiding value for national digital economy strategic planning.
Based on these findings and case analyses, this study proposes several practical implications for digital economy development. First, policy formulation should focus on dynamic adjustment, and the policy focus should be adjusted in a timely manner according to the stage of industrial development, competitive situation, and other factors. Second, coordination mechanisms should be precisely implemented, and differentiated measures should be taken for fields with different maturity and IP concentrations. Third, talent cultivation needs a systematic layout, and talents with different characteristics should be cultivated in a targeted manner according to the characteristics and development stages of the industry. Finally, it is necessary to promote the coordinated development of the three dimensions of policy support, effective coordination, and talent aggregation, as well as build a benign interactive development pattern. By applying the PCT model, policymakers can grasp the inherent laws of digital economy development from a strategic height, avoid single-dimensional policy interventions, achieve the coordinated advancement of policy leadership, coordination mechanisms, and talent cultivation, thereby more effectively enhancing a country or region’s competitive position in the global digital economy.
Although this research has constructed a systematic PCT analysis framework and revealed the internal mechanisms of U.S. digital economy development, it still has the following limitations: first, the research is mainly based on quantitative analysis of policy texts and patent data, and the examination of informal institutional arrangements and market micro-interactions needs further in-depth investigation; second, the research timespan is limited, especially in terms of talent cultivation analysis, failing to achieve long-cycle dynamic tracking; third, based on research focus considerations, although this dissertation conducts a China-U.S. comparison, systematic comparative analysis of other digital economies remains insufficient. These limitations point to promising directions for future research, which are outlined below.
Looking to the future, follow-up research can further deepen the quantitative relationship research between the three strategic matrices, explore the matrix framework’s applicability in other countries, study the impact of new technology development on matrix evolution, and analyze the matrix’s dynamic adjustment mechanism under the background of global competition. The three strategic matrices and their interactive relationship analysis framework provide a new perspective for grasping the U.S. digital economy’s development strategy and an important reference for other countries to formulate digital economy development strategies.
6. Policy Recommendations
Accurately grasping the laws of digital economy development is significant for China to seize the high ground of global digital economy competition. This article constructs an innovative PCT analysis framework from three dimensions: leading policies, coordination mechanisms, and talent introduction and cultivation, aiming to provide a useful reference for the high-quality development of China’s digital economy.
From the perspective of leading policies, it is necessary to formulate forward-looking and systematic digital economy development strategies and plans. This involves clarifying goals and key tasks, improving the relevant policy system, and strengthening the formulation and implementation of innovation policies to promote innovation and stimulate market vitality. For example, building a national-level innovative operating system that integrates key functions can provide systematic support for developing the digital economy and national digital transformation.
From the perspective of coordination mechanisms, establishing and improving the overall coordination mechanism for digital economy development is crucial. This includes setting up a national-level innovative operating system coordination committee, strengthening communication and cooperation between different departments, and forming a joint force to promote digital economy development, ultimately enhancing China’s international influence and discourse power in the digital economy.
From the perspective of talent introduction and cultivation, improve the digital talent introduction and cultivation system. In terms of talent training, constructing a strong higher education country requires improving the independent innovation capabilities in important fields, opening up an integrated channel for industry-university-research integration, and enhancing the ability of the higher education system to serve economic and social development and significant strategies. In this context, the digital transformation of higher education is not only the choice of the times for the development of higher education in the digital age but also an inevitable requirement for realizing the modernization of higher education. Specifically, through the construction of future technology colleges and modern industrial colleges, strengthen the construction of a multi-level and diversified digital talent training system, and strengthen the cultivation of high-end local talents in digital industries such as hardware, software, and services; increase the cultivation of master’s talents in innovative operating system engineering to provide high-quality talent support for the construction of a national-level innovative operating system. Additionally, talent introduction and incentive policies should be improved to attract outstanding overseas digital talents, especially from Belt and Road countries.
In summary, promoting the high-quality development of China’s digital economy requires systematic measures and efforts in various aspects, such as leading policies, coordination mechanisms, and talent introduction and cultivation. Creating a good policy environment, gathering forces from all parties, and building a strong talent foundation will help China’s digital economy achieve higher quality and more competitive development, enabling China to occupy a more favorable position in the global digital economy pattern and provide strong support for shaping new national competitive advantages.


 ,
, 