1. Introduction
In the context of accelerating global technological and industrial transformations, technological catch-up has become critical for latecomer nations and regions striving for economic and technological advancement [
1]. Previous studies have extensively explored the catch-up mechanisms of state-led industries, such as high-speed rail service and satellite manufacturing in China, from a meso-level perspective [
2,
3]. However, with the rise of artificial intelligence (AI), firms like OpenAI, Tesla, Intel, and Huawei have emerged as pivotal forces in technological innovation. As key drivers of innovation, firms play a central role in national technological catch-up efforts, prompting growing scholarly attention to their micro-level mechanisms.
Collaboration networks and knowledge networks are two key channels through which firms access external knowledge and strengthen their internal innovation capability. Collaboration networks facilitate knowledge exchange and synergistic innovation with external partners. Prior research suggests that occupying structural holes and central positions in collaboration networks can enhance firms’ access to diverse knowledge and critical resources, thereby promoting technological innovation [
4,
5,
6]. Knowledge networks are formed by the connections among knowledge elements, and their structures vary significantly across firms [
7,
8]. Whether through cross-border mergers and acquisitions or technological collaborations, the restructuring and evolution of internal knowledge networks accelerate knowledge flows and technology spillovers. Characteristics such as network density and clustering coefficients have been shown to significantly influence the speed and quality of technological innovation [
9,
10].
Some researchers have investigated the interaction between knowledge networks and collaboration networks in innovation [
11]. However, the effect mechanism of this interaction on the TCP of firms remains unclear. Although prior studies acknowledge that both networks influence innovation, there is no consensus on the precise mechanisms through which they interact to inspire innovation. In addition, the current research regarding the relationship between networks and firms’ TCP primarily relies on linear regression methods, assuming that network characteristics exert uniform effects across firms. However, this assumption overlooks firm heterogeneity. In fact, different firms may experience distinct influences from collaboration and knowledge networks depending on their structural positions and strategic orientations.
This study argues that firms are heterogeneous and that it is necessary to examine the characteristics of the collaboration and knowledge networks that influence the TCP of different firms. To this end, this study mainly focuses on the following three questions: (1) What are the collaboration and knowledge network characteristics among different firms? (2) Which network characteristics are the main influencing factors of firm TCP? (3) How do the characteristics of collaboration networks and knowledge networks jointly influence firm TCP?
Given the fact that traditional linear approaches struggle to capture contextual variations and threshold effects caused by firm heterogeneity, this study employs the two-step machine learning approach: first, hierarchical clustering is used to identify distinct firm groups based on network characteristics, and the CART algorithm is then employed to uncover the primary and secondary factors driving TCP within each firms group. This combined application of two algorithms not only considers firm heterogeneity but also provides comprehensive, in-depth, and interpretable insights for firm TCP research, which can help firms develop more effective TCP strategies. That is, this study contributes to both theory and practice. Theoretically, it advances research on knowledge and collaboration networks by revealing their nonlinear and context-dependent effects on TCP. Practically, it offers tailored managerial insights for firms seeking to optimize their network positions for technological advancement.
This study is organized as follows.
Section 2 provides a review of the relevant literature.
Section 3 introduces the research framework and two related machine learning algorithms and measures the related variables.
Section 4 scientifically divides firms based on the collaboration and knowledge network characteristics and further identifies the influence of network characteristics on firm TCP.
Section 5 describes the conclusions and discusses the managerial implications and future directions.
2. Literature Review
To explore the factors affecting firms’ TCP, this study reviews the relevant literature.
2.1. Collaboration Networks and Technological Catch-Up
The existing studies regarding the relationship between collaboration networks and innovation are mostly founded on the knowledge-based view [
12], the proximity theory [
13,
14], the strong and weak relationship theory [
15,
16], and the embeddedness theory [
17]. They argue that elements like partner selection, partner relationship, and network embeddedness (measured by network centrality, structural holes, and local aggregation coefficients) are critical in shaping innovation outcomes [
18]. For example, Zhao et al. [
19] and Guan and Liu [
20] demonstrate that the presence of structural holes and a high degree of centrality can enrich the resource base of firms, stimulating innovative technological combinations.
Although the relationship between the characteristics of collaboration networks and the performance of firms has been widely discussed, research on how these characteristics affect firm TCP is limited. Although R&D collaboration is widely regarded as the core factor influencing TCP [
21], the existing literature largely contains arguments on whether to collaborate or not, rather than providing clear guidance on how to structure such networks to accelerate catch-up progress [
22,
23,
24]. This study seeks to address this gap by focusing explicitly on the network configurations that differentiate high TCP from low TCP outcomes.
2.2. Knowledge Network and Technological Catch-Up
The current research on the relationship between knowledge networks and innovation mainly focuses on how firms’ internal knowledge combinations drive future innovation [
7]. The field mainly employs two modes: One is to construct knowledge networks based on industry-level patent data and further assess measures like degree centrality and structural holes [
20,
25]. The other is to use firm-level patent data to evaluate the network density and global clustering coefficient [
10,
11,
26]. These studies suggest that a well-connected knowledge network with abundant combination opportunities can confer a competitive technological advantage [
5,
27]. Yet, while industry-level analyses reveal that latecomers struggle in knowledge-complex and diverse environments [
28], few studies have investigated the role of internal knowledge recombination at the firm level or how these internal structures interact with external collaboration networks to influence TCP.
In summary, while it is widely acknowledged that collaboration serves as a vital resource for firms engaged in the technology catch-up process, empirical evidence on their specific influences on TCP remains limited, and the mechanisms underlying their interplay are not fully understood [
29]. To address these gaps, this study adopted machine learning methods—specifically, the hierarchical clustering and CART algorithms are employed to explore the complex nonlinear relationships between the collaboration and knowledge network characteristics and the TCP of firms. This approach allows us not only to classify firms into meaningful groups based on network characteristics but also to derive decision rules that shed light on the precise mechanisms driving technological catch-up performance.
3. Methodology and Variables
This section introduces a research framework and two machine learning algorithms.
3.1. Research Framework
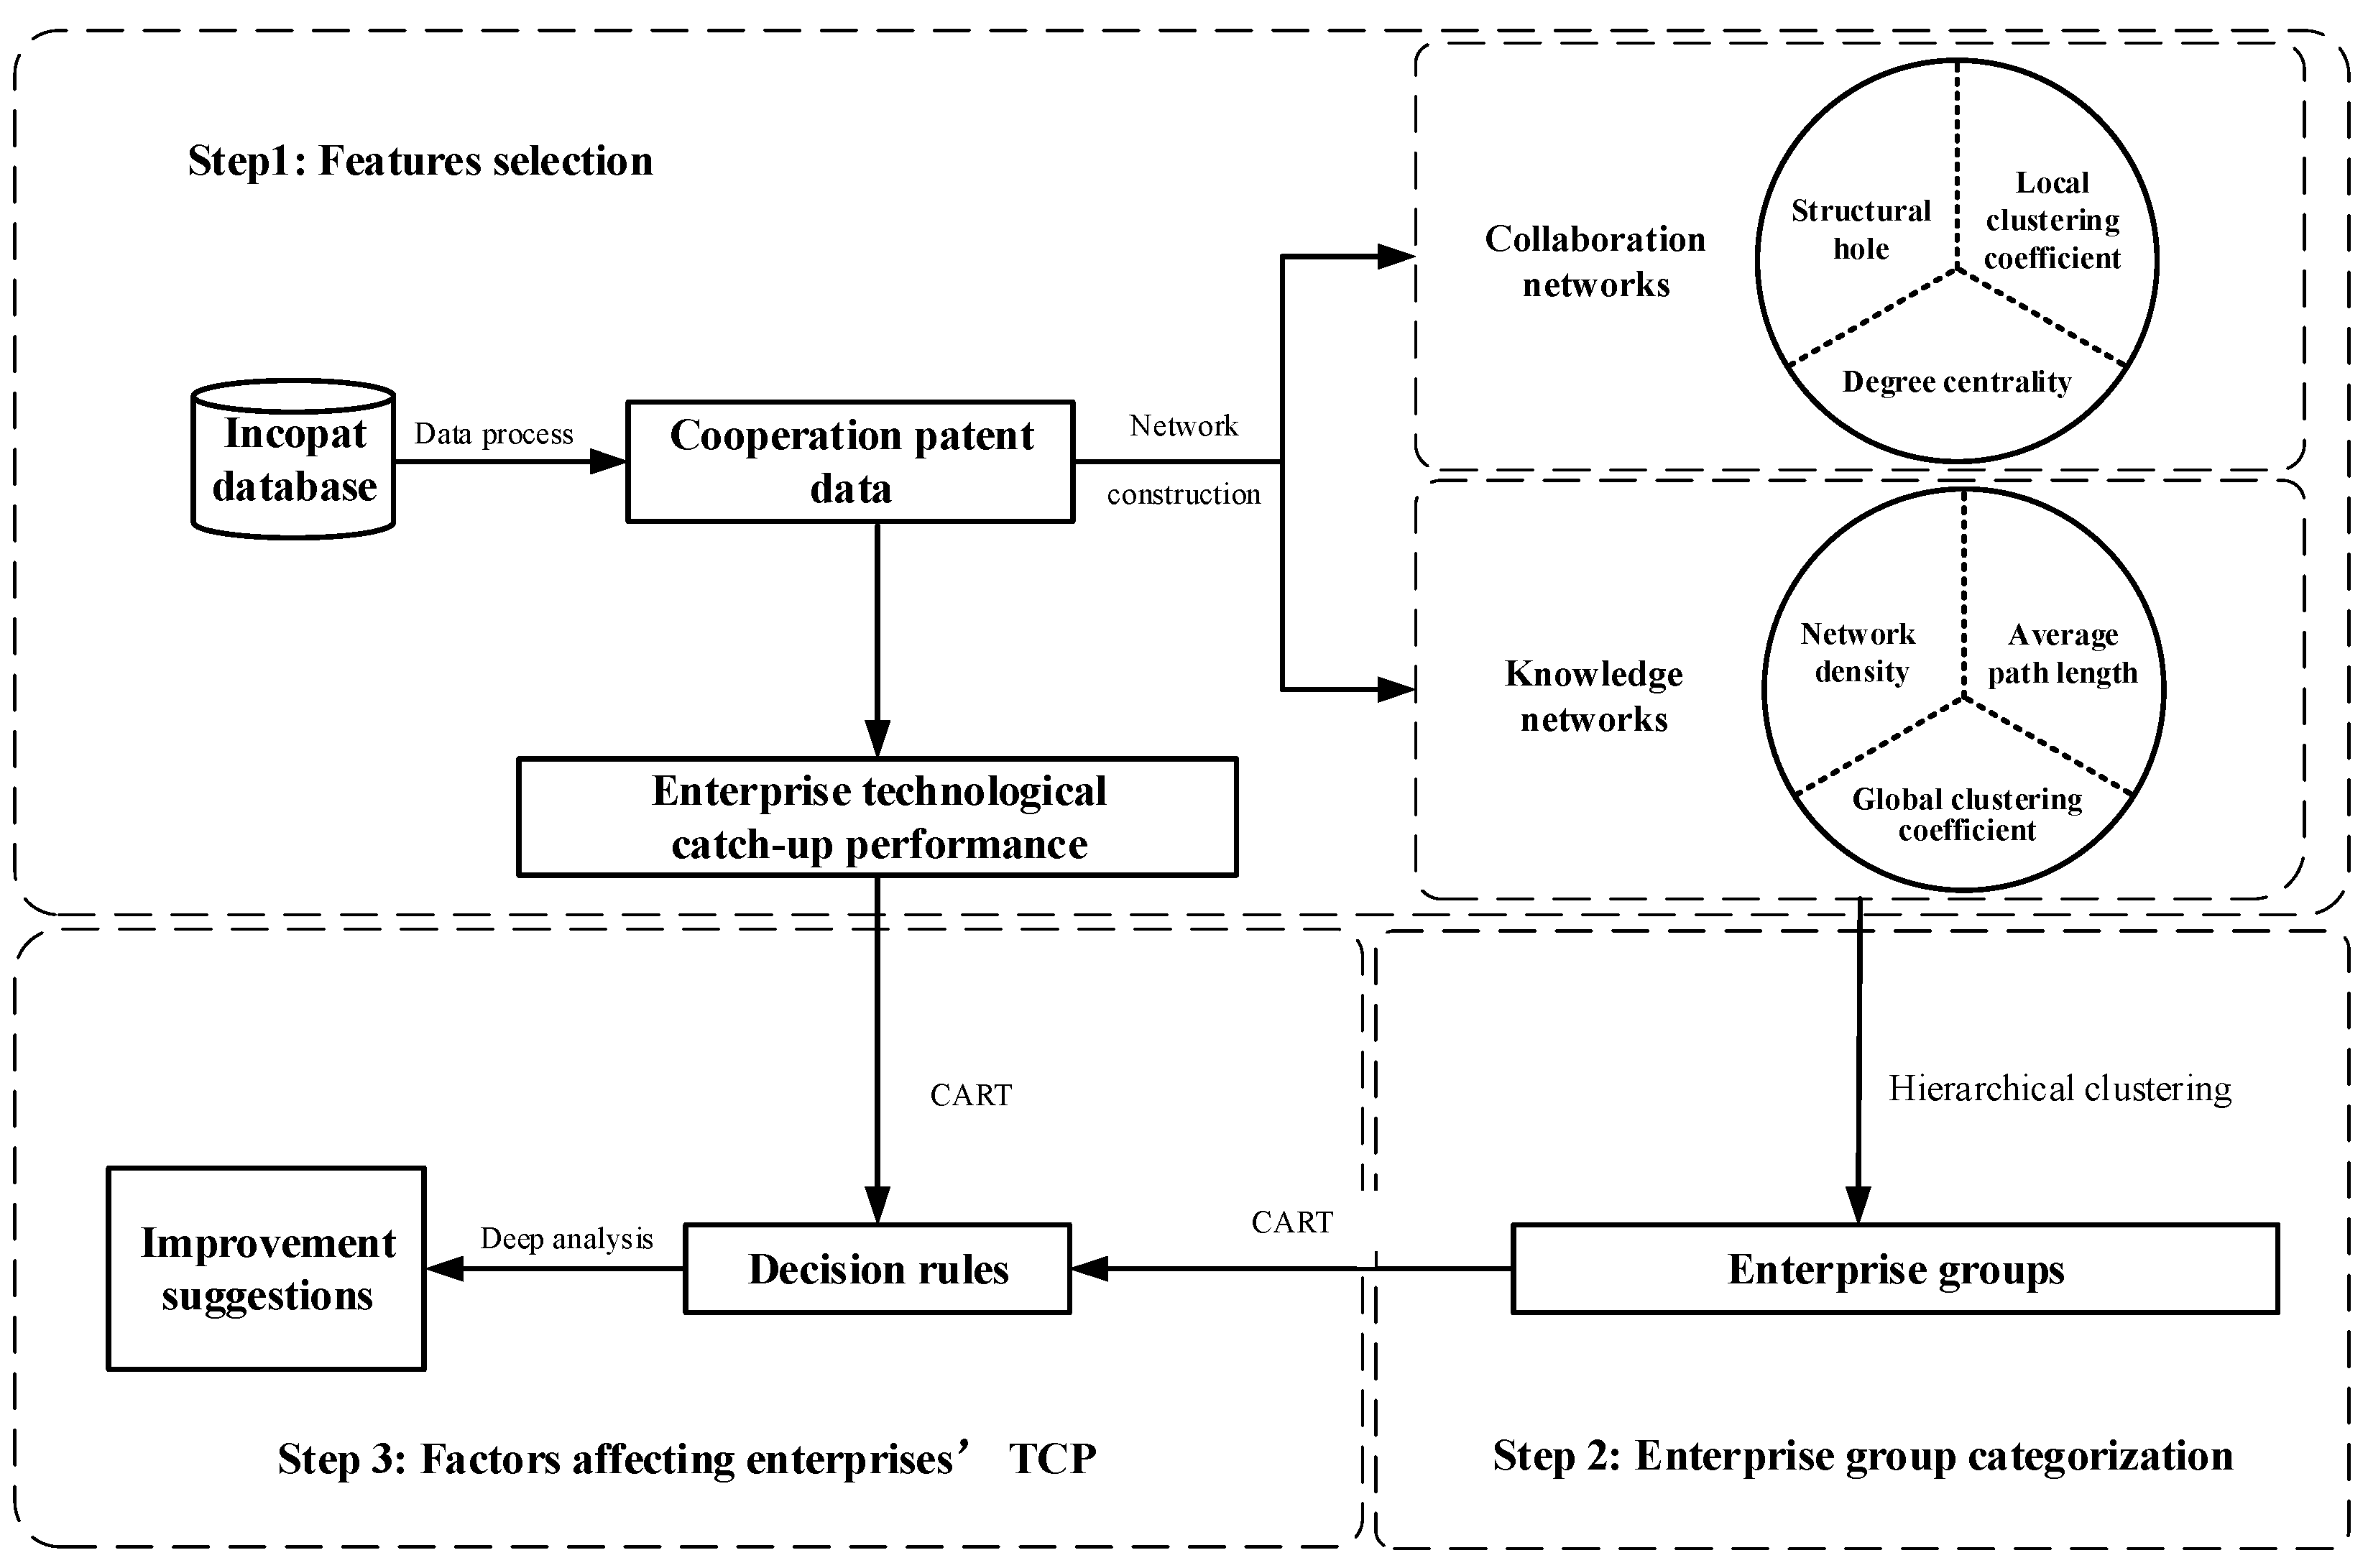
In order to specifically identify the influence of the collaboration and knowledge network characteristics on the TCP of different types of firms, this study designs a research framework. The framework consists of three main steps. Step 1 is to process the patent data from the Incopat database and further select six network characteristics (structural hole, local clustering coefficient, degree centrality, network density, average path length, and global clustering coefficient) from the constructed collaboration and knowledge networks of firms. Step 2 is to classify firms based on the six network characteristics, using the hierarchical clustering algorithm [
30,
31]. This step aims to reveal the differences in network characteristics among various firm groups, laying the foundation for subsequent targeted research in Step 3. Step 3 is to identify the factors influencing the TCP of different types of firms. Taking network characteristics as conditional attributes and TCP as the decision attribute, the corresponding decision rules and influence factors for each firm group are obtained by employing the CART algorithm [
32,
33]. At this time, targeted strategic recommendations for different types of firms to enhance their TCP can be provided. The research framework is depicted in
Figure 1.
3.2. Machine Learning Methods
3.2.1. Hierarchical Clustering Algorithm
To examine the heterogeneous characteristics of collaboration and knowledge networks across different firms, this study employs an unsupervised learning technique, the hierarchical clustering algorithm [
30,
31], which was chosen for three key reasons. First, it does not require the number of clusters to be specified beforehand, making it particularly suitable for exploratory research in which the optimal number of clusters is unknown [
34]. This flexibility helps prevent biases that might arise from manually predefining clusters. Second, hierarchical clustering produces a dendrogram that provides a visual representation of the relationships between different data points, allowing for better interpretation of the underlying structure within collaboration and knowledge networks. Third, this study applies the complete linkage method, which defines the distance between clusters based on the maximum pairwise distance between points in different clusters. This method tends to create more compact and well-separated clusters, enhancing the interpretability of the clustering results. This study follows an agglomerative (bottom-up) clustering approach in which each data point starts as an individual cluster and the algorithm iteratively merges the two most similar clusters until a termination condition is met.
Based on the hierarchical clustering algorithm, this study systematically categorizes firms based on the structural characteristics of their collaboration and knowledge networks, providing a foundation for further comparative analysis.
3.2.2. CART Algorithm
The classification and regression trees (CART) algorithm is a decision-tree-based predictive model that systematically splits a dataset into smaller subsets to maximize the homogeneity of the target variable within each subset [
32]. It identifies key factors influencing the outcome and clarifies their impact mechanisms [
33]. In a decision tree, internal nodes represent decision criteria (conditional attributes), branches indicate possible outcomes, and leaf nodes correspond to final classifications. The model iteratively partitions the data based on attribute values, forming a tree-like structure where each pathway from the root to a leaf node represents a decision rule. This hierarchical organization makes the results easy to interpret and provides insight into how different attributes jointly determine the outcome.
This study uses the CART algorithm to analyze the relationships between the characteristics of collaboration and knowledge networks and firm TCP. Specifically, decision rules for the TCP of firms are extracted by setting the characteristics of knowledge and collaboration networks as conditional attributes and TCP as the decision attribute. The CART algorithm is chosen due to its ability to model nonlinear relationships and provide an interpretable hierarchical structure, which helps to uncover how different network attributes together contribute to TCP. Compared with other classification methods such as logistic regression or SVM, CART offers transparent decision rules that align with managerial decision-making and policy implications. In addition, the effectiveness of the CART algorithm in analyzing complex, multi-factorial relationships in innovation research has been confirmed by recent studies. For example, Zhou and Li [
35] employed a decision tree approach to investigate how configurations of R&D team networks and knowledge diversity jointly influence breakthrough innovation in the Chinese biopharmaceutical manufacturing industry. Their findings demonstrate that decision trees are particularly useful for identifying the combined effects and threshold conditions under which network and knowledge attributes drive innovation performance.
To optimize the model and reduce overfitting, post-pruning was applied based on the Gini impurity index, where branches with insufficient purity gain were pruned. Additionally, this study applied a minimum support threshold of 60%, ensuring that only rules with sufficient representativeness were retained.
3.3. Measurement of Variables
3.3.1. Technological Catch-Up Performance
Technological catch-up performance (TCP) is defined as the extent to which a firm has narrowed the gap between its technological capacity and the technological forefront of the industry [
36]. In reality, many latecomer firms have narrowed this technological gap through technology learning, innovation, and resource integration, rising rapidly to occupy a leading market position. For example, although LONGi started relatively late in the photovoltaic industry, it has reduced silicon wafer costs through process improvement and economies of scale, achieving global leadership. In existing studies, the procedure for calculating the TCP often comprises two steps: the first is to assess the technology capability (TC) of the firm, and the second is to calculate the firm’s technology gap, which is the gap between the firm’s TC and the technological frontier of the industry overall. To present TCP scientifically, this study defines it as 1 minus the technology gap. Obviously, if a firm’s TCP is close to 1, then it demonstrates better catch-up performance.
This study uses patent data to measure TC, an approach that has been widely used in previous studies because patent data can reflect a firm’s technological output. Referring to Wu et al. [
37], the technology gap for firm
k is calculated as the ratio of the firm’s technological capability
(TCk) to the maximum technology capability of the industry (
TCmax). Therefore, the calculation formula for the TCP of firm
k is defined as follows:
In line with previous studies, the measurement of TC in this study incorporates three dimensions: patent quantity, patent quality, and patent contribution [
38]. Patent quality (PQ) is assessed via five common indicators used in patent value assessment: inventors [
39], patent citations [
29], IPCs [
40], patent holders, and patent claims [
41].
Table 1 gives detailed information on these metrics. Based on the weight of each indicator calculated by the entropy weight method [
42], the corresponding PQ of each patent is defined as follows:
where
xij is the value of patent
i on the patent quality indicator
j and
is the weight of
,
,
,
.
The patent contribution (PC) is defined as the inverse of the number of applicants of a patent. If a patent has m applicants, then each applicant’s PC is 1/m. Obviously, the more applicants in a patent, the lower each applicant’s contribution is.
Based on the above definition, the technology capability (TC) of a firm is defined as the sum of the product of each firm’s PQ and PC in all patents. That is, the formula for a firm’s technology capability is as follows:
where
n is the total number of patents of firm
k,
is the patent quality of patent
i, and
is the contribution of firm
k to patent
i.
3.3.2. Characteristics of Collaboration Networks
- ➀
A collaboration network’s degree centrality (CDC) measures the node’s direct connection in the collaboration network [
43]. It represents a quick overview of local influence and collaborative relationships. Its calculation formula is as follows:
where
j is the node except
i. When there is a connection between
i and
j, the value of
is 1; otherwise, it is 0.
- ➁
A collaboration network’s structural hole (CSH) refers to a bridging position that can connect two unconnected nodes. Firms with more structural holes enjoy greater diversity in information and corporate ties. The structural hole is related to the constraint index
Ci [
44]. It is often defined as follows:
where
Ci is the total constraint of node
i in the network,
j is the node directly connected to
i,
k is the node directly connected to
i and
j,
is the proportion of total investment that node
i has directly invested in node
j, and
and
represent the proportion of the total investment of node
i and node
j to node
k.
- ➂
A collaboration network’s local clustering coefficient (CLCC) measures the possibility of a firm’s neighbors forming groups, reflecting the aggregation degree of firms. A high CLCC means that neighbors are connected directly, forming a tight collaborative relationship with more opportunities and synergies [
45]. Its calculation formula is defined as follows:
where
Ei is the actual number of edges between adjacent nodes of node
i and
ki is the number of adjacent nodes of node
i. When node
i has only one adjacent node, the maximum possible number of edges between its adjacent nodes is 1. To avoid the denominator being 0, add 0.5 to the denominator.
3.3.3. Characteristics of Knowledge Networks
- ➀
A knowledge network’s network density (KND) measures the ratio of actual connections to potential connections in knowledge networks, indicating the compactness of the network [
4]. Its calculation formula is as follows:
where
n is the node count and
m is the actual connection in the knowledge network.
- ➁
A knowledge network’s global clustering coefficient (KGCC) measures the closeness between nodes in a knowledge network. It mirrors the internal knowledge correlation and the firm’s technology integration capability. The global clustering coefficient is calculated as the average of local clustering coefficients across all nodes [
43]. That is, KGCC can be calculated by the following:
where
LCCi is the local clustering coefficient of node
i.
- ➂
A knowledge network’s average path length (KAPL) measures the average shortest distance between any two nodes in knowledge networks, reflecting the efficiency of information flow in the entire network [
46]. Its calculation formula is as follows:
where
dij is the shortest distance between nodes
i and
j.
4. Experimental Analysis
To verify the feasibility of the research method, this section describes an experimental analysis based on patent data from the Chinese artificial intelligence (AI) industry.
4.1. Data Source and Processing
4.1.1. Data Source
The experimental data in this study primarily come from the Chinese AI industry’s patent data in the Incopat database. Patent data are chosen for the research because they are commonly used to reflect a firm’s technological capability and collaborative activities [
21]. There are three reasons for selecting the Chinese AI industry as the sample: (1) The high R&D intensity of AI industry implies that technological capability is of importance, making the research findings representative. (2) Firms in the AI industry actively apply for patents for technology protection, which allows us to trace their technological capability. (3) The AI industry is characterized by intensive technology collaboration and a high level of technological sophistication. Therefore, it is significant to set the AI industry as the sample to explore the relationship between collaboration and knowledge networks and the TCP of firms.
4.1.2. Data Processing
A total of 252,641 authorized patent data samples from the AI industry between 2013 and 2022 were collected from the Incopat database, including 18,260 collaborative patents, encompassing information such as patent title, International Patent Classification (IPC), patent owners, and so on.
Following the research of Yang et al. [
18], firms without collaborative patents were excluded and firms with at least three collaborative patents were treated as focal firms. After integrating firms with name changes, the final dataset comprised 1436 focal firms and 10,444 collaborative patents. Based on these data and the research of Chen et al. [
28], the knowledge network of each focal firm was constructed by treating the IPC subclass (the first four digits of the IPC number) as the node and connecting two nodes with co-occurrence relationships. Ultimately, a total of 1436 knowledge networks were constructed, and there was a total of 37,189 target patents across all firms. Similarly, a collaboration network can also be constructed by treating the focal firm as the node and connecting two nodes with co-occurrence relationships. In addition, to discuss the influence of characteristics of knowledge and collaboration networks on firm TCP, this study assigns labels to firms based on their TCP. Firms with a TCP above the median are labeled as “high-performance”, while those below are labeled as “low-performance”.
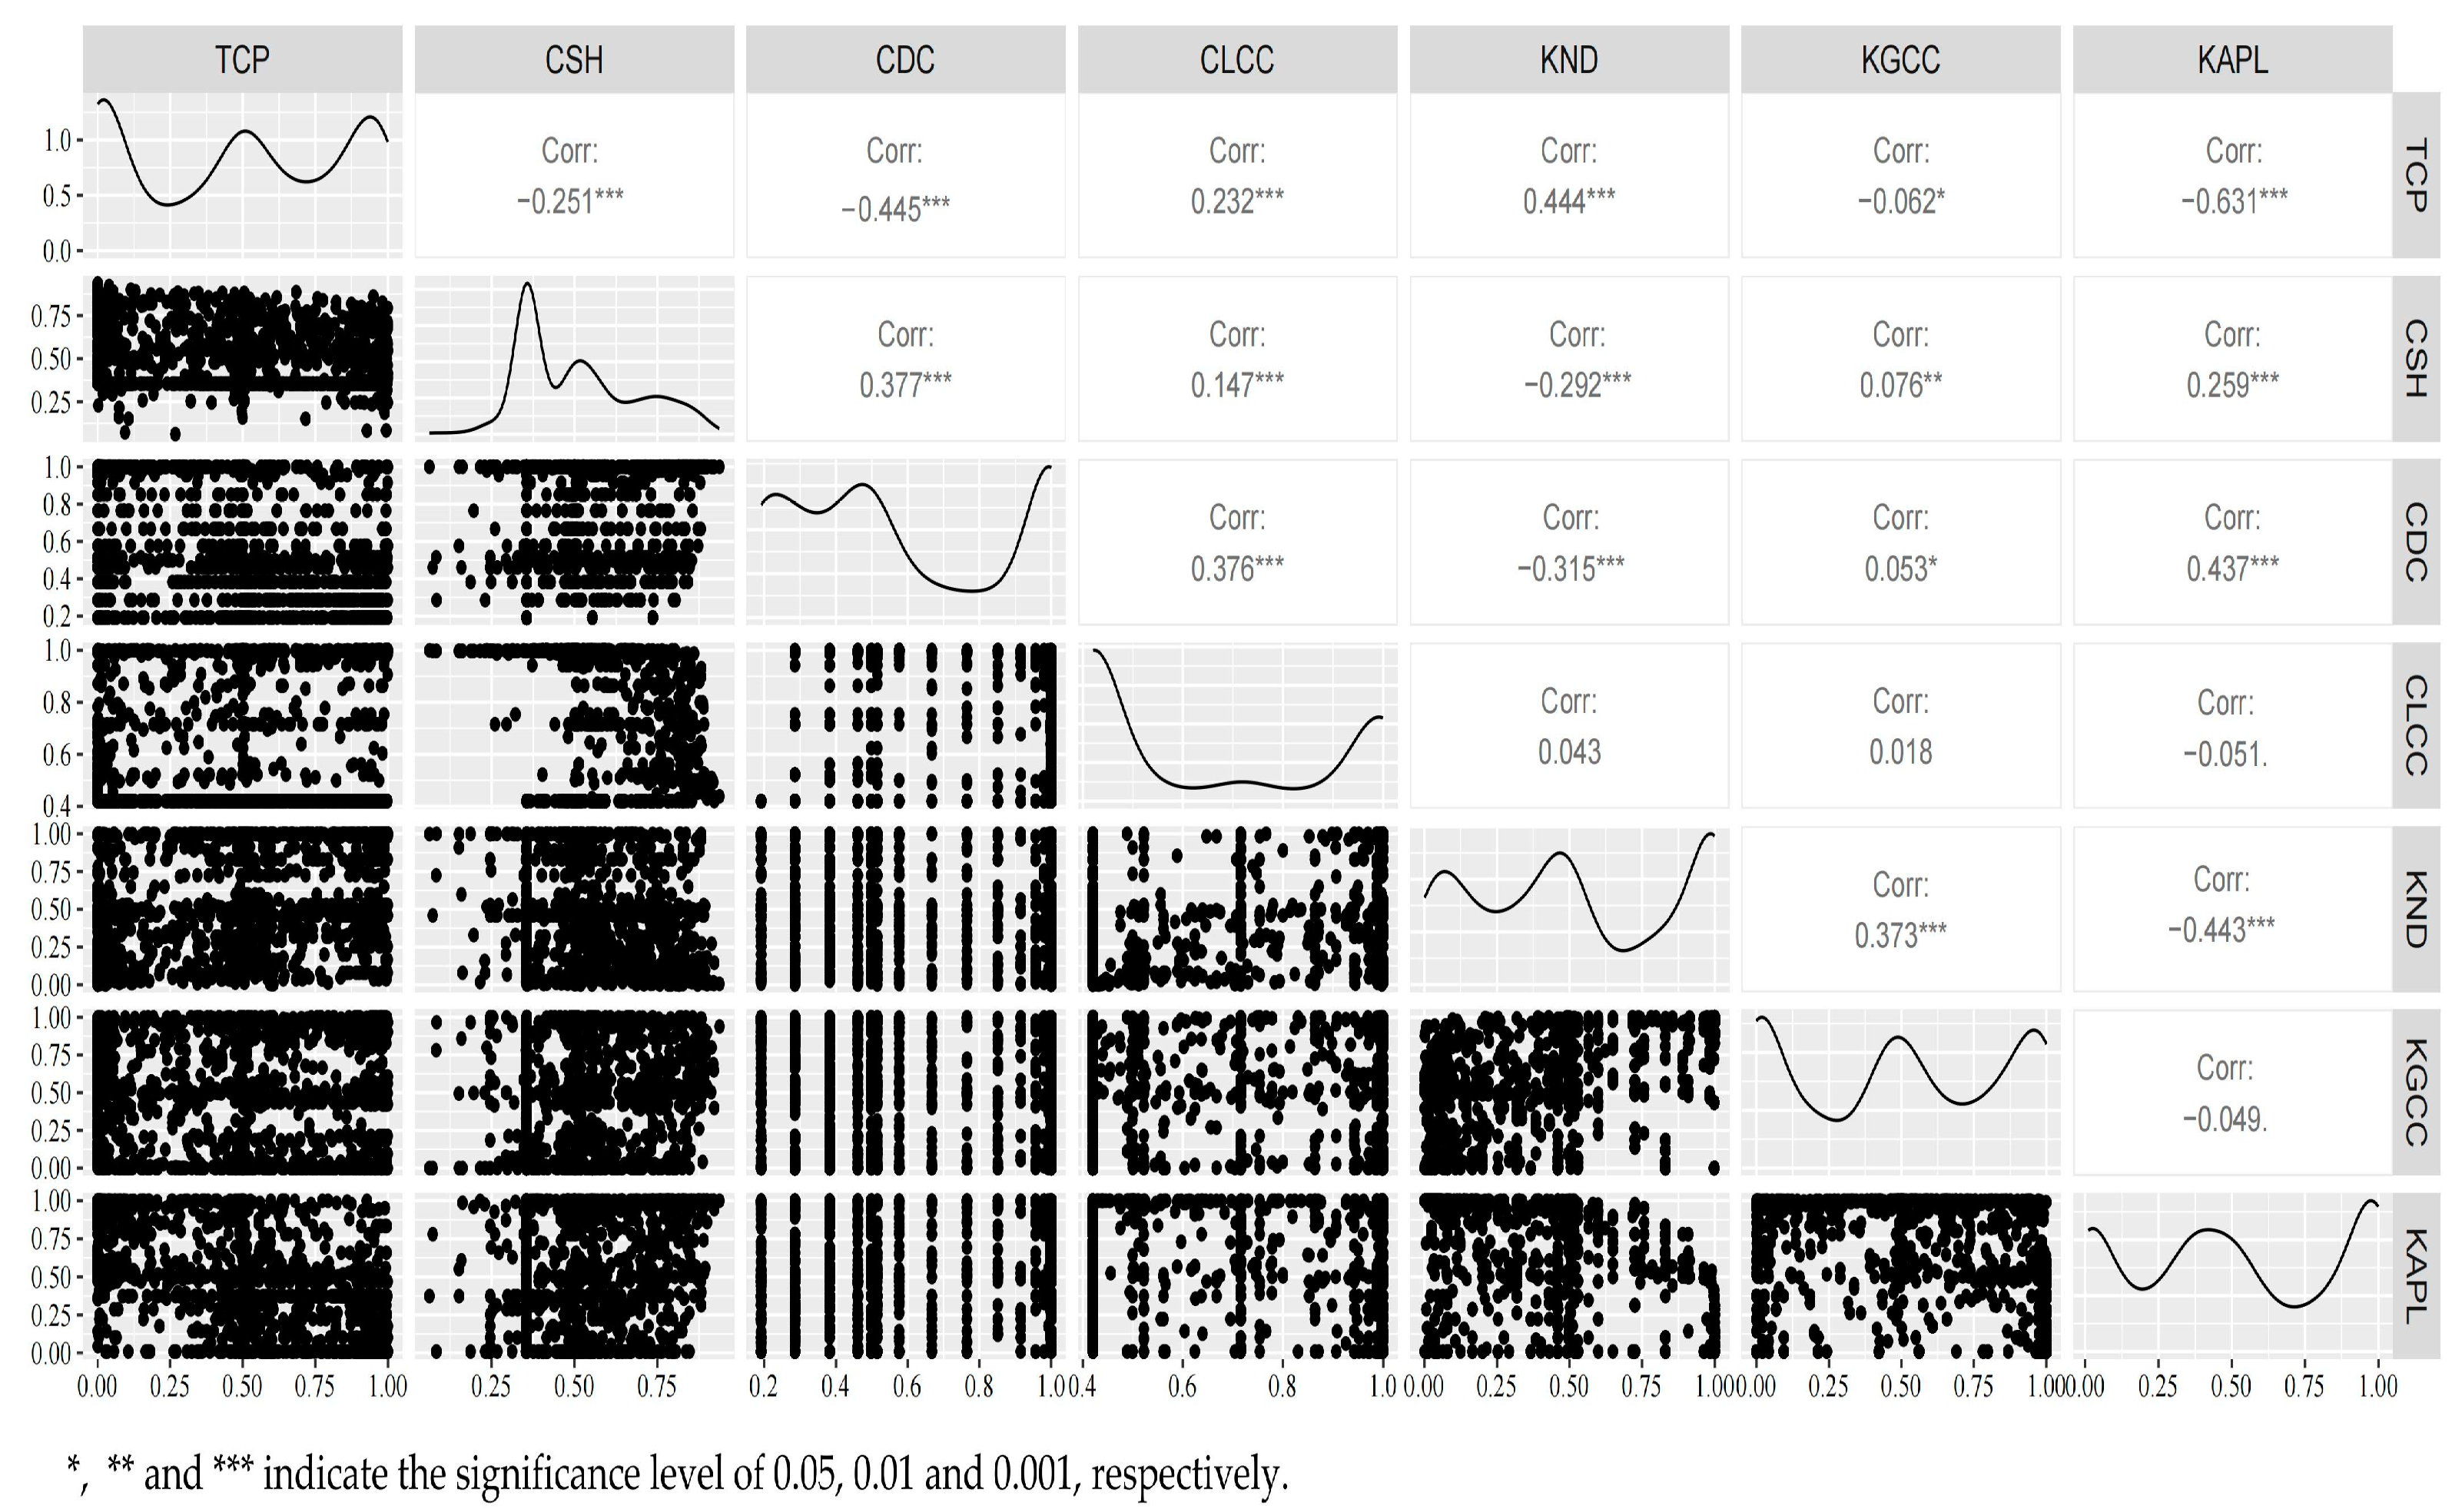
It should be noted that this study uses the cloud model for calibration and maps the data to membership values ranging from 0 to 1 to reduce the influence of uneven data distribution and outliers on the cluster analysis [
47]. The correlation results between variables are shown in
Figure 2. Obviously, there is no significant linear relationship between network characteristics and firm TCP. Meanwhile, the VIF value of each variable is less than 5, which proves that there is no serious multicollinearity among variables.
4.2. Firm Group Categorization and Characteristic Analysis
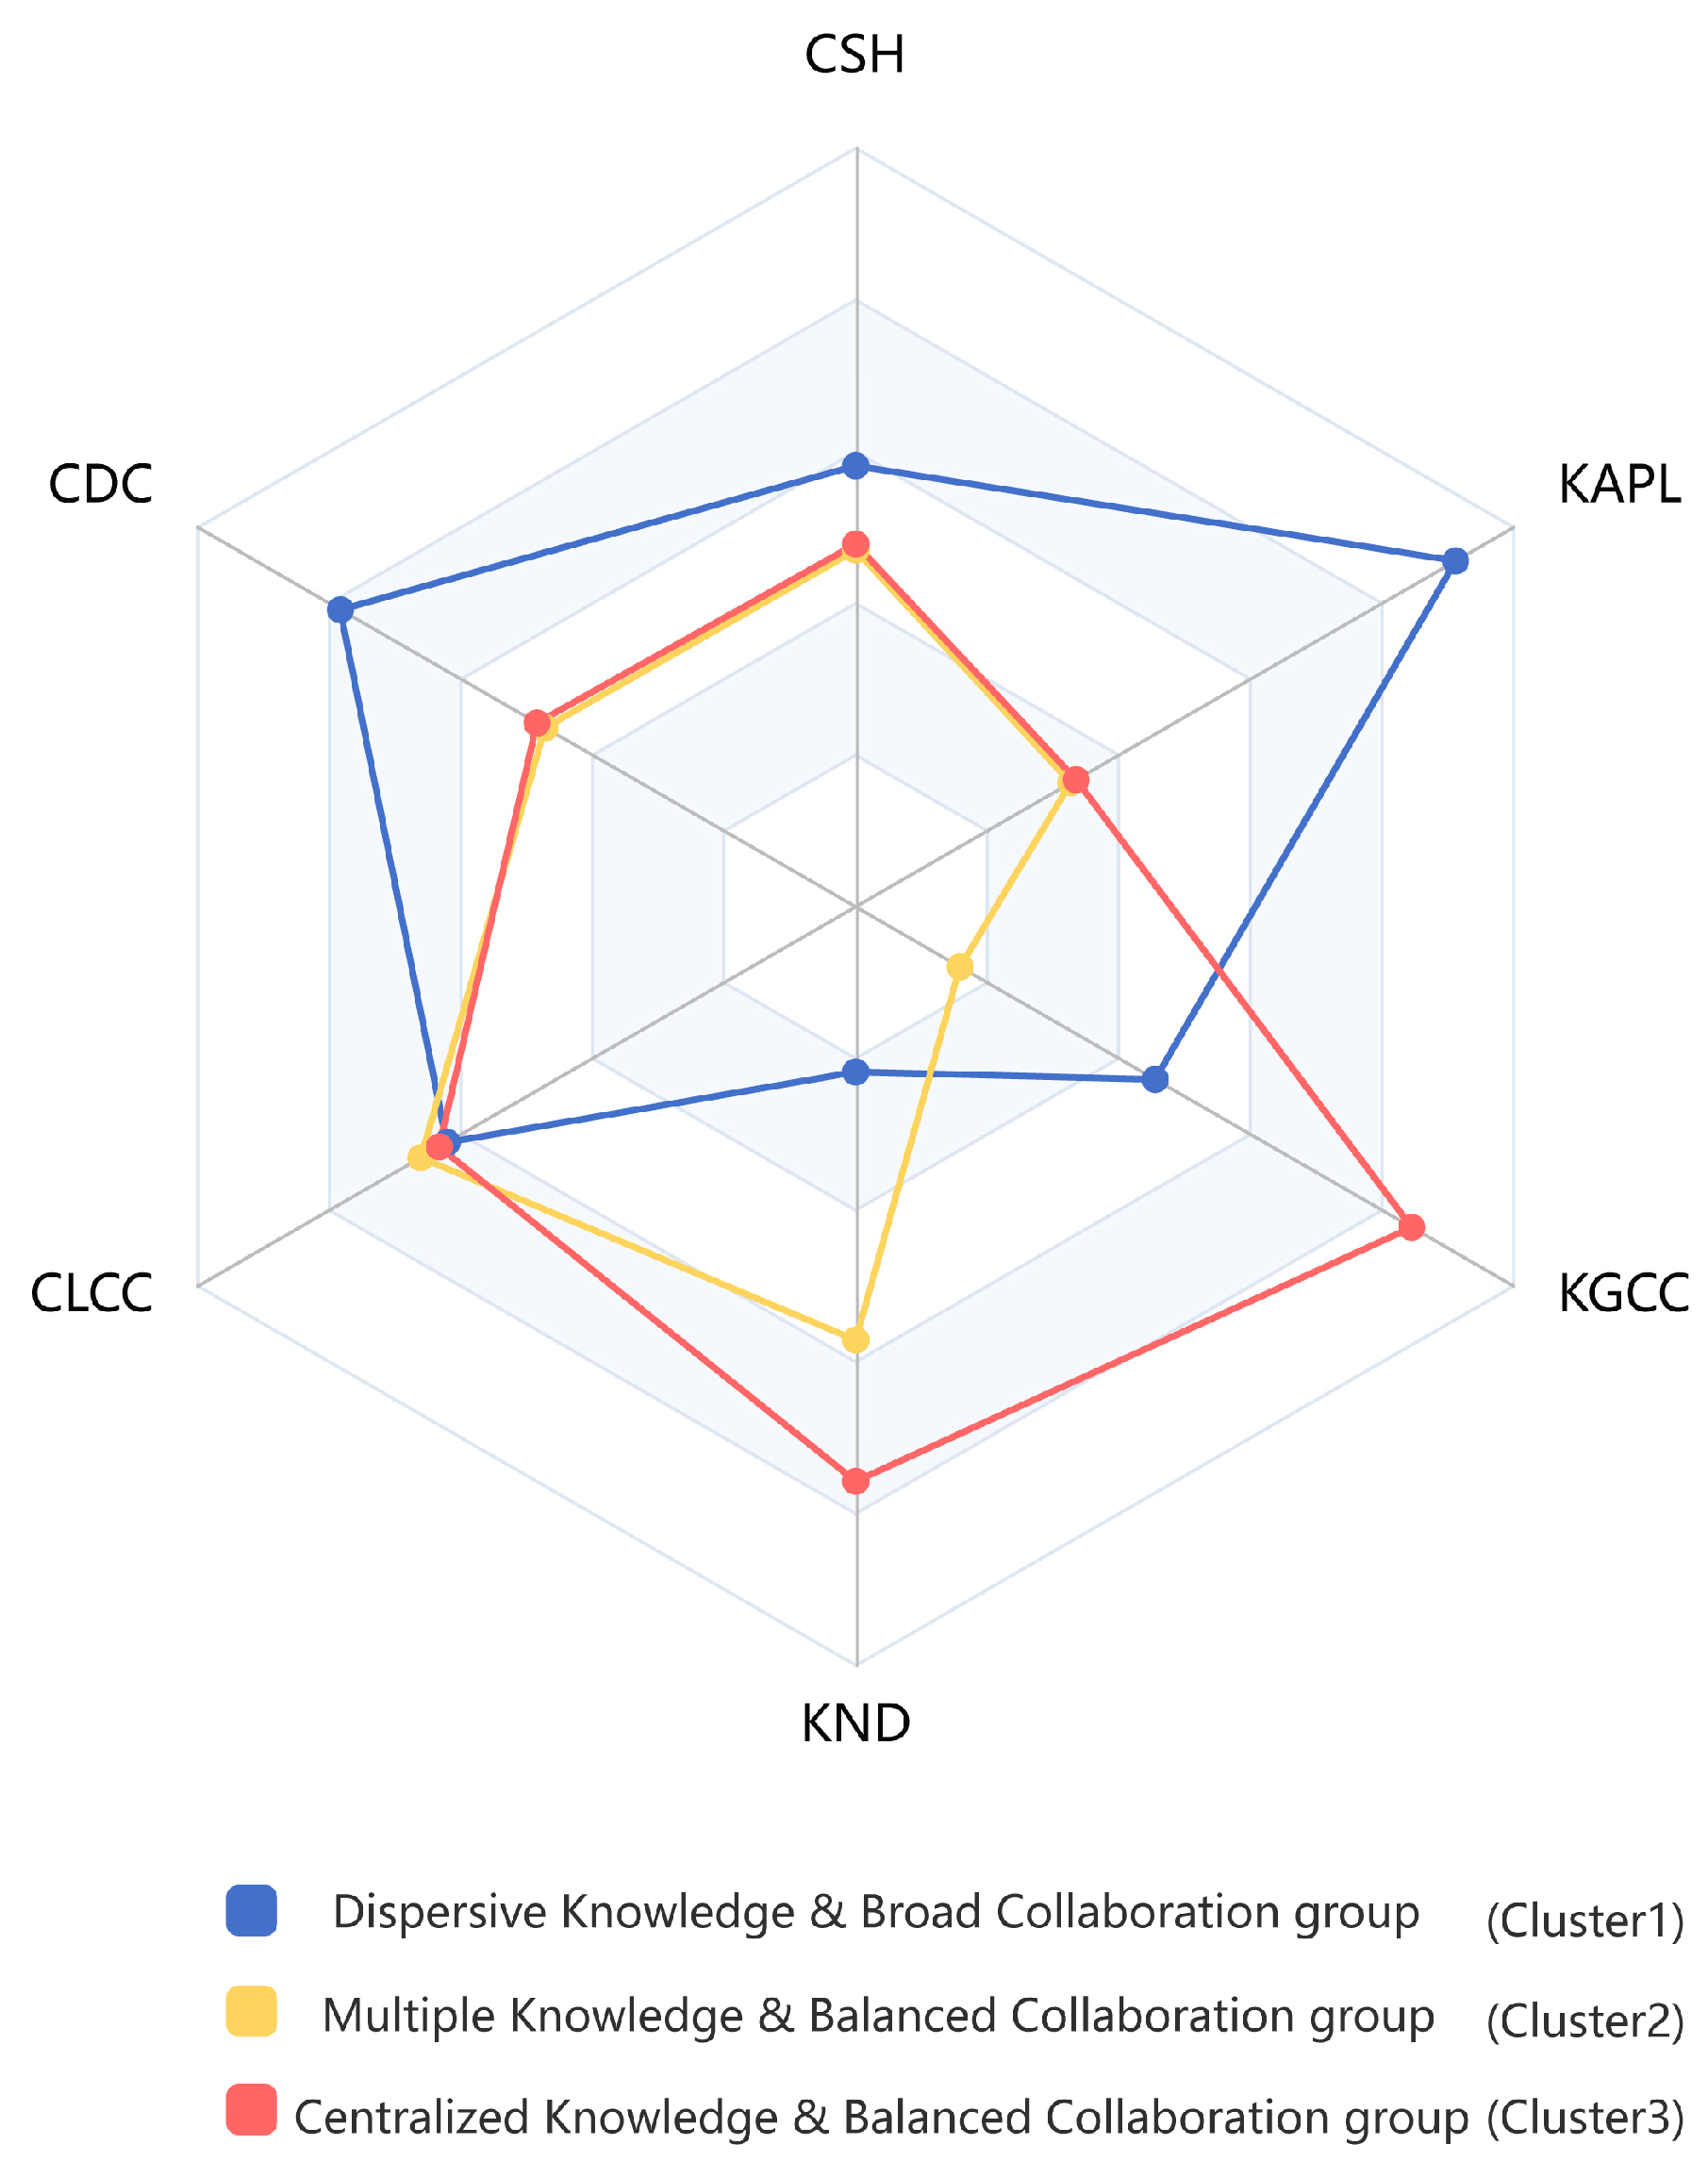
This study categorizes focal firms based on their knowledge and collaboration network characteristics. Using a hierarchical clustering algorithm, firms were grouped into three clusters according to six key network indicators: CSH, CDC, CLCC, KND, KGCC, and KAPL. The cluster labels were assigned based on the overall structural characteristics of the knowledge and collaboration networks of each group. As shown in
Table 2, the mean values of key indicators for each group illustrate distinct structural patterns in knowledge and collaboration networks. Additionally, the distribution of TCP within each cluster was analyzed. This study used the median TCP value within each cluster as the threshold. Firms with TCP values above the median were classified as having high TCP, while those below the median were categorized as having low TCP. From
Figure 3, it can be observed that Clusters 2 and 3, which exhibit higher TCP levels, share common network characteristics. They both have high densities and short paths in their knowledge networks, as well as moderate degree centrality and structural holes in their collaboration networks. This suggests that the firms in these groups benefit from a well-connected knowledge structure and an optimized collaboration strategy. The detailed characteristics for each cluster are as follows.
Firms in Cluster 1 have characteristics of “Dispersive Knowledge & Broad Collaboration”, as they exhibit the longest average path length (KAPL) and the lowest network density (KND) in their knowledge networks, suggesting a relatively fragmented knowledge structure. Meanwhile, they have high degree centrality (CDC) and structural hole (CSH) levels in their collaboration networks, indicating that they are well positioned to access diverse information sources and act as key connectors in the network.
Firms in Cluster 2 exhibit “Multiple Knowledge & Balanced Collaboration” characteristics. Their knowledge networks have the lowest global clustering coefficient (KGCC) and shortest average path length (KAPL), showing that their knowledge elements are distributed yet efficiently connected. Additionally, their collaboration network indicators are close to the industry average, reflecting a balanced collaboration strategy.
Firms in Cluster 3 are characterized by “Centralized Knowledge & Balanced Collaboration”, as they have the highest network density (KND) and global clustering coefficient (KGCC) and shorter average path length (KAPL) in their knowledge networks. Namely, their knowledge networks have typical characteristics of small-world networks. In addition, similar to Cluster 2, firms in this cluster also have a balanced collaboration strategy because of their moderate collaboration network characteristics.
4.3. Factors Affecting Firms’ TCP
The CART algorithm was employed to identify the key influencing factors of TCP in the different groups. With six network characteristics (CDC, CSH, CLCC, KND, KGCC, and KAPL) as conditional attributes and TCP as the decision attribute, a total of ten decision rules, shown in
Table 3, were generated. The decision rule confidence ranges from 60% to 96%, indicating that the prediction results of the decision rule are reliable. The network characteristics that contribute to the differences in intra-group performance vary across groups, suggesting that the contribution of knowledge and collaboration network characteristics to performance varies in different contexts. Next, decision rules will be analyzed by combining decision trees from each group with the confidence level of the decision rules in
Table 3.
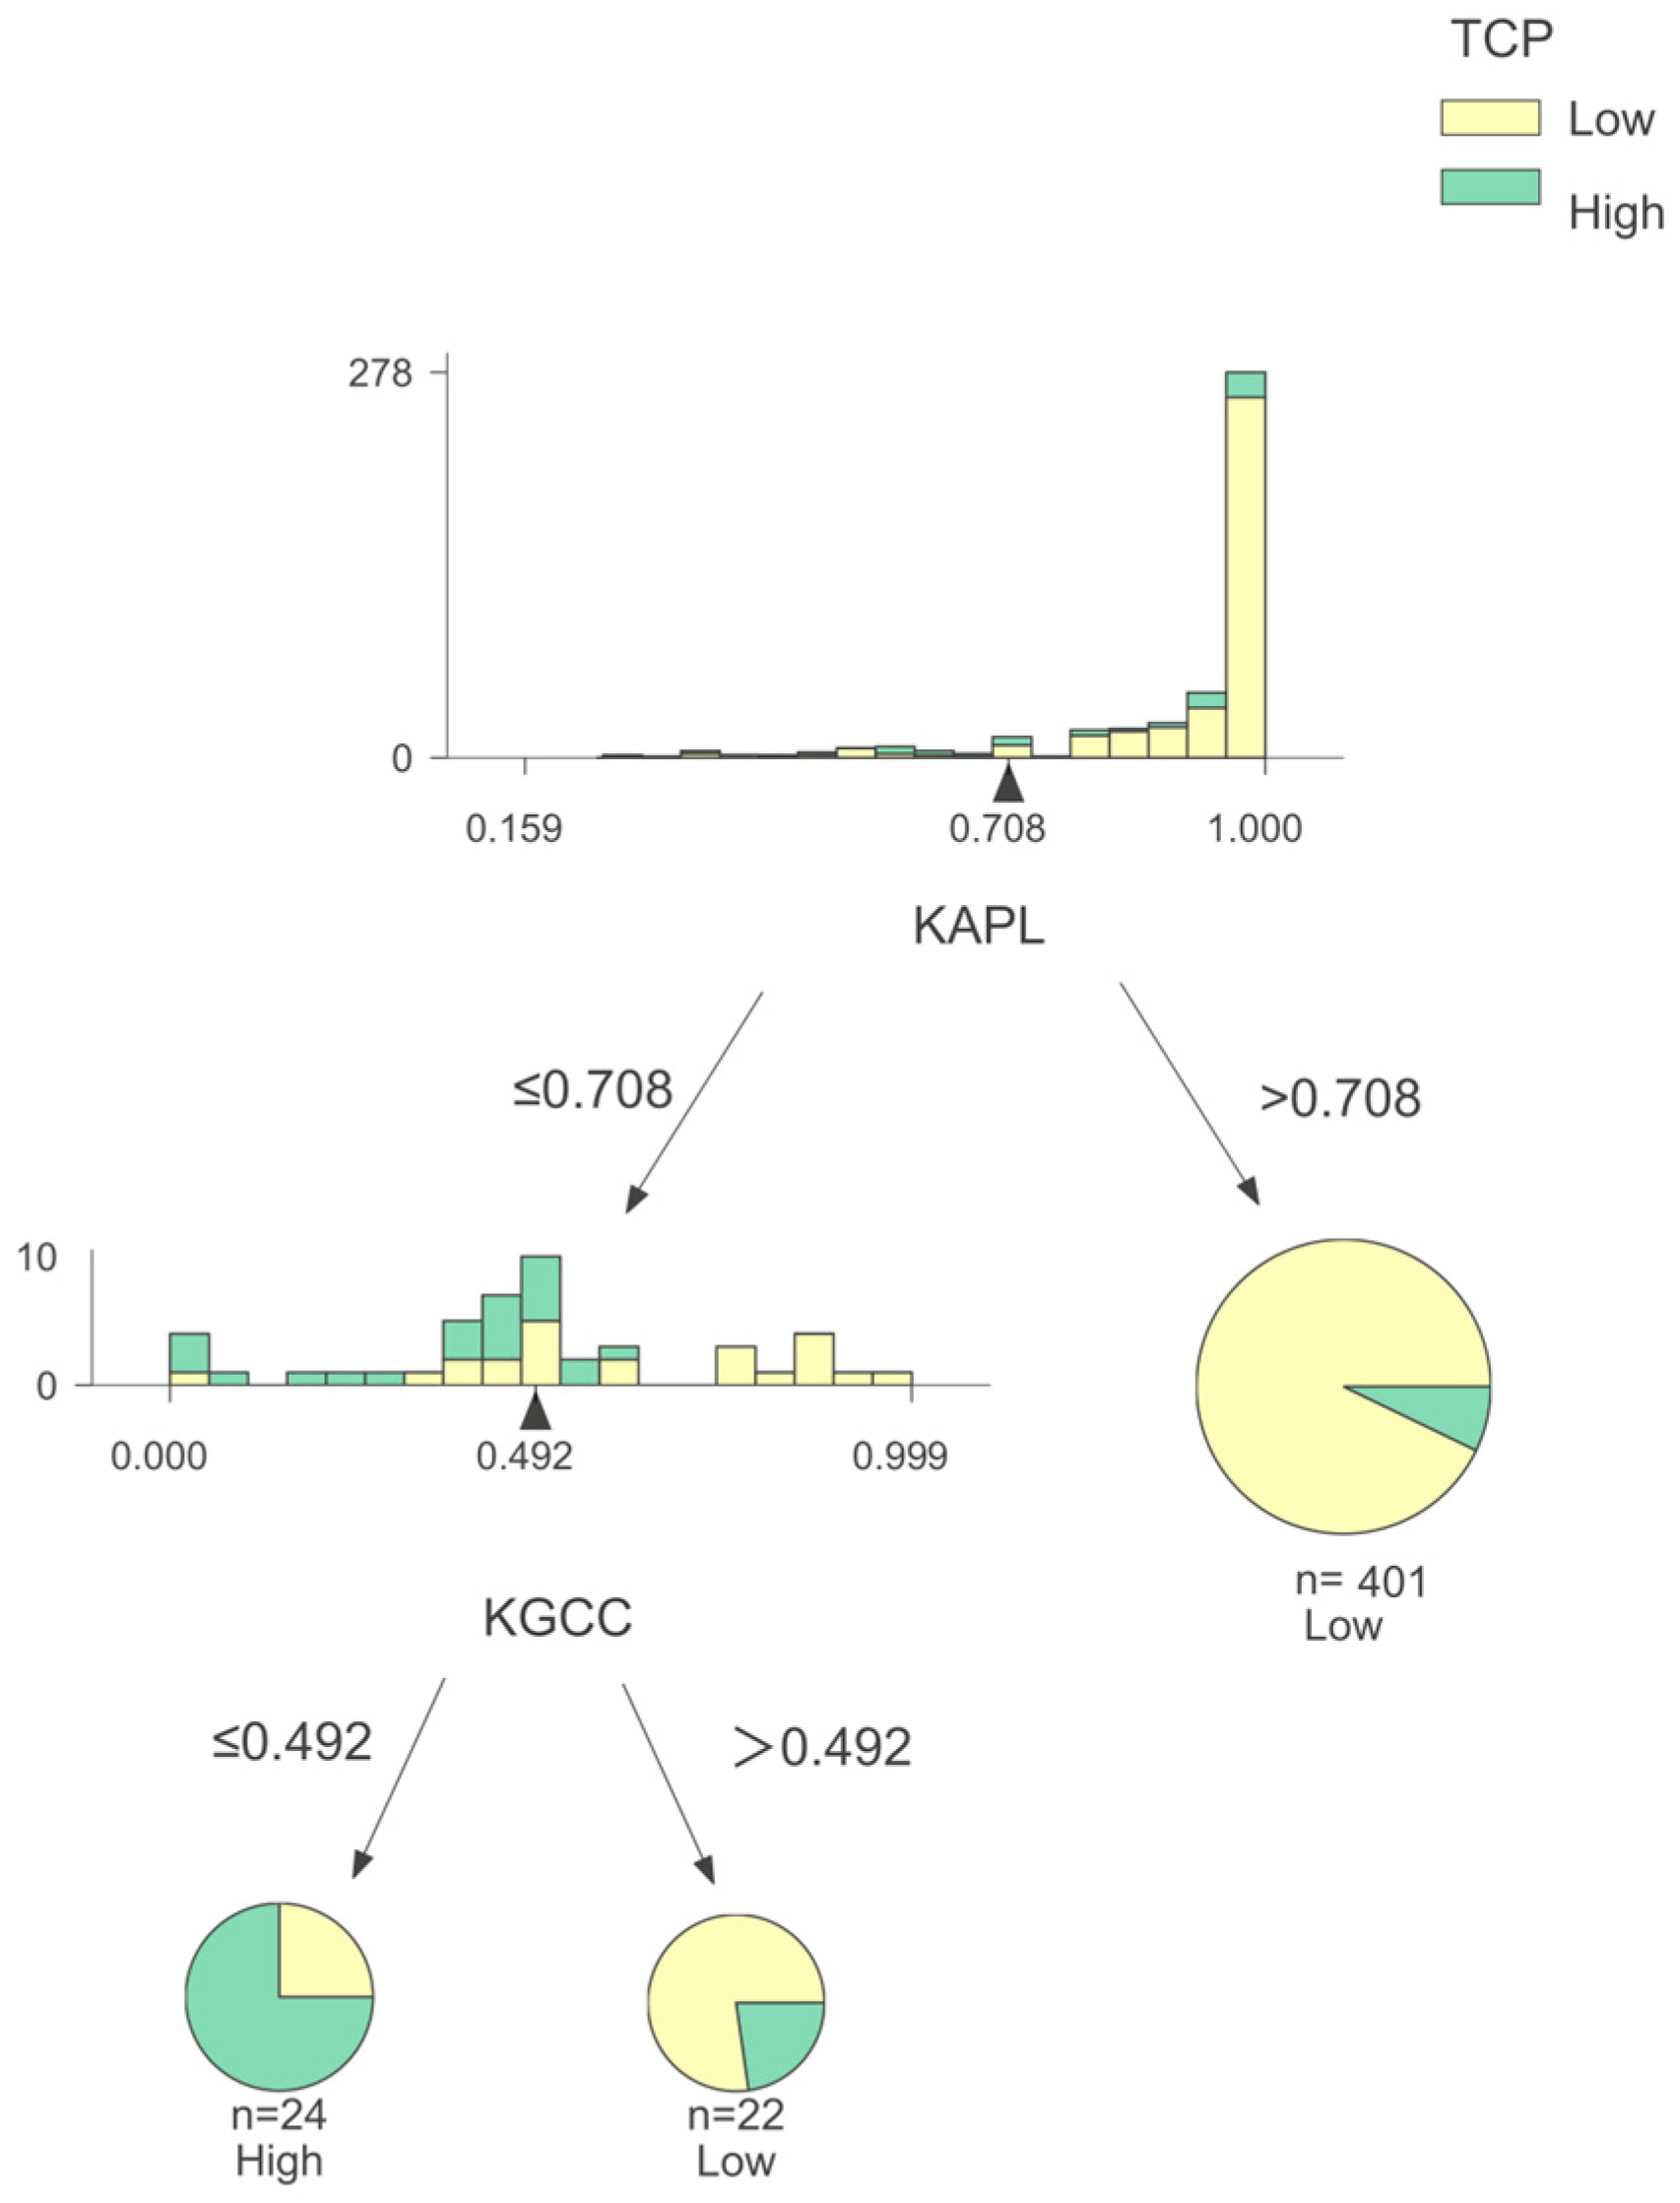
4.3.1. Decision Rules Analysis of “Dispersive Knowledge & Broad Collaboration” Group
As shown in
Figure 4, for firms in the “Dispersive Knowledge & Broad Collaboration” group, TCP is impacted by both the KAPL and KGCC of knowledge networks. Specifically, when the average path length is high (KAPL > 0.708), firms have a 90.3% probability of achieving low TCP. This result suggests that a longer average path length may hinder technological innovation by increasing the cognitive and coordination costs associated with knowledge diffusion. Prior research indicates that when knowledge elements are highly dispersed across different modules, firms may struggle with efficient knowledge recombination, ultimately hindering innovation processes [
20].
Conversely, when the average path length is low (KAPL ≤ 0.708), TCP outcomes vary based on the global clustering coefficient (KGCC). When the average path length is low (KAPL ≤ 0.708), firms with a low global clustering coefficient (KGCC ≤ 0.492) have a 75% probability of achieving high TCP, whereas those with a high global clustering coefficient (KGCC > 0.492) have only a 22.7% probability.
4.3.2. Decision Rules Analysis of “Multiple Knowledge & Balanced Collaboration” Group
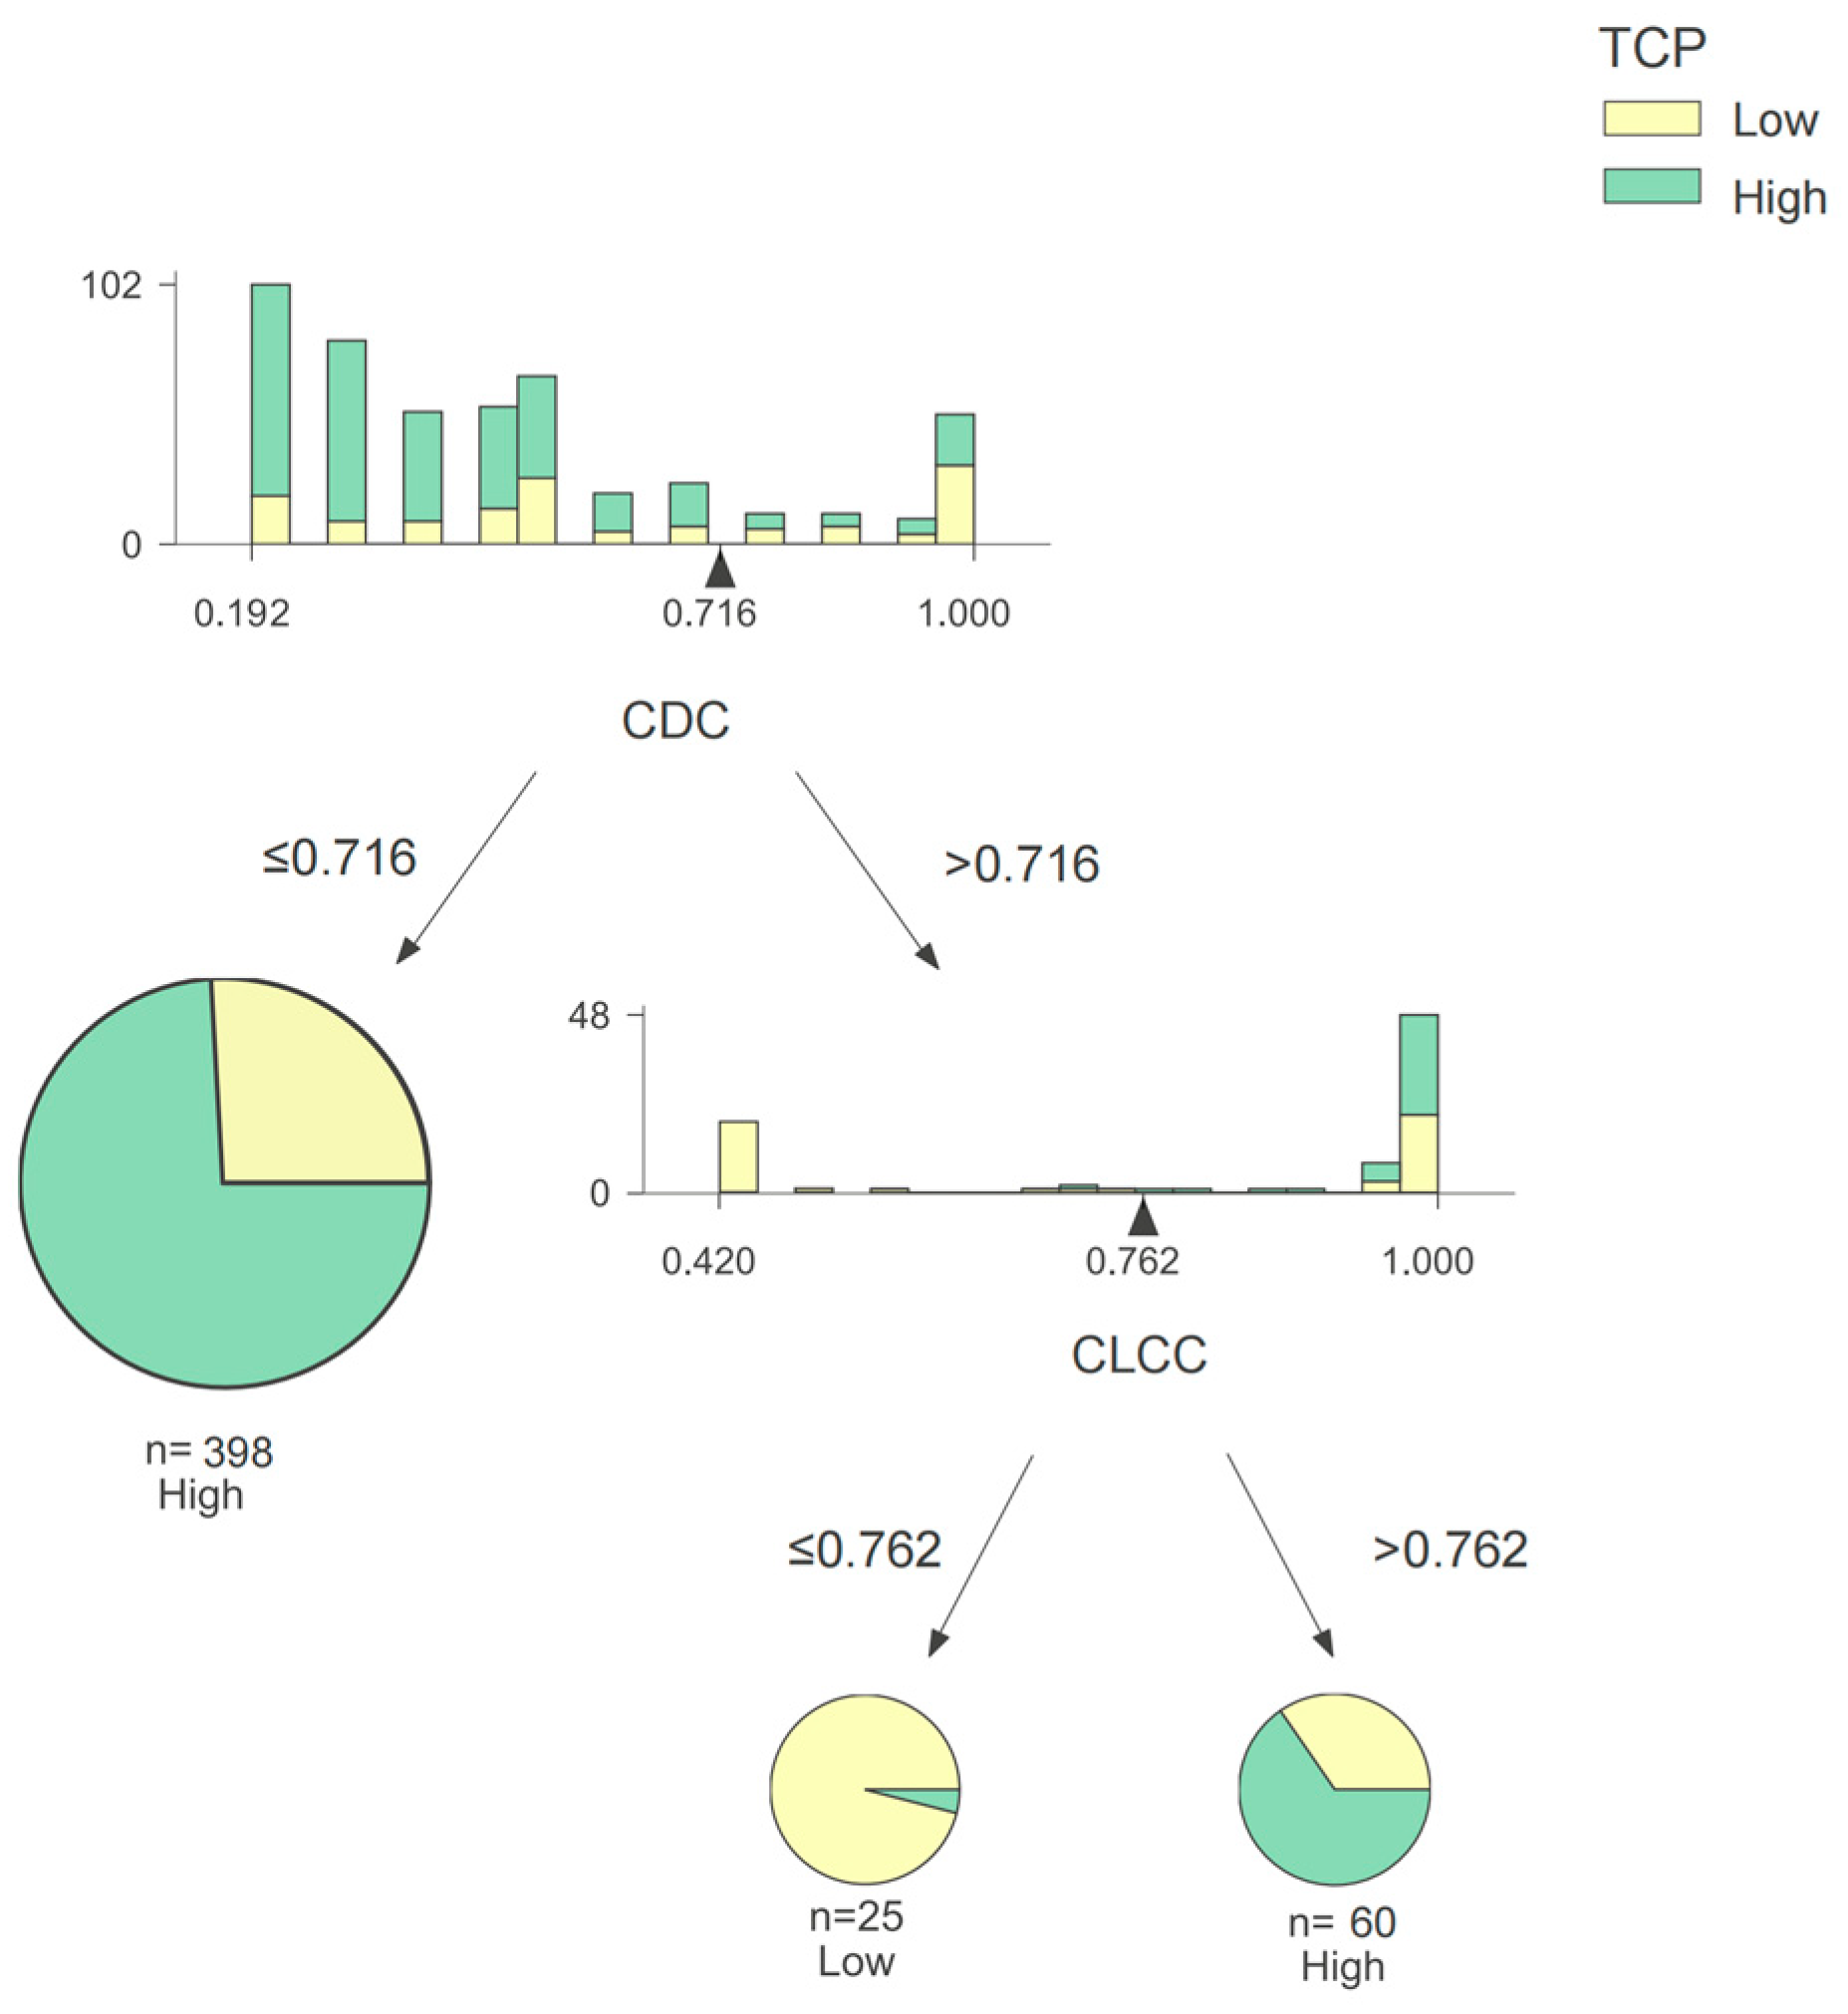
As shown in
Figure 5, for firms in the “Multiple Knowledge & Balanced Collaboration” group, TCP is associated with the CDC and CLCC of collaboration networks. When the degree centrality is low (CDC ≤ 0.716), firms have a 77.6% probability of achieving high TCP. However, when the degree centrality is high (CDC > 0.716), the likelihood of achieving high TCP drops to just 4%. Notably, this probability can increase to 60% if the local clustering coefficient is raised to 0.762, suggesting that the structural properties of collaboration networks play a critical role in technological advancement.
Moreover, enhanced local clustering—by fostering stronger communication among adjacent partners—facilitates more efficient information exchange and enables firms to make timely strategic adjustments. This, in turn, allows firms to swiftly respond to market changes and maintain their competitive edge.
From a managerial perspective, firms in the “Multiple Knowledge & Balanced Collaboration” group should focus on cultivating high-quality partnerships rather than maximizing the number of connections. This entails systematically evaluating partners’ contributions to innovation and discontinuing collaborations that yield limited benefits. Additionally, strengthening interactions among neighboring partners can enhance network synergies and improve innovation efficiency.
4.3.3. Decision Rules Analysis of “Centralized Knowledge & Balanced Collaboration” Group
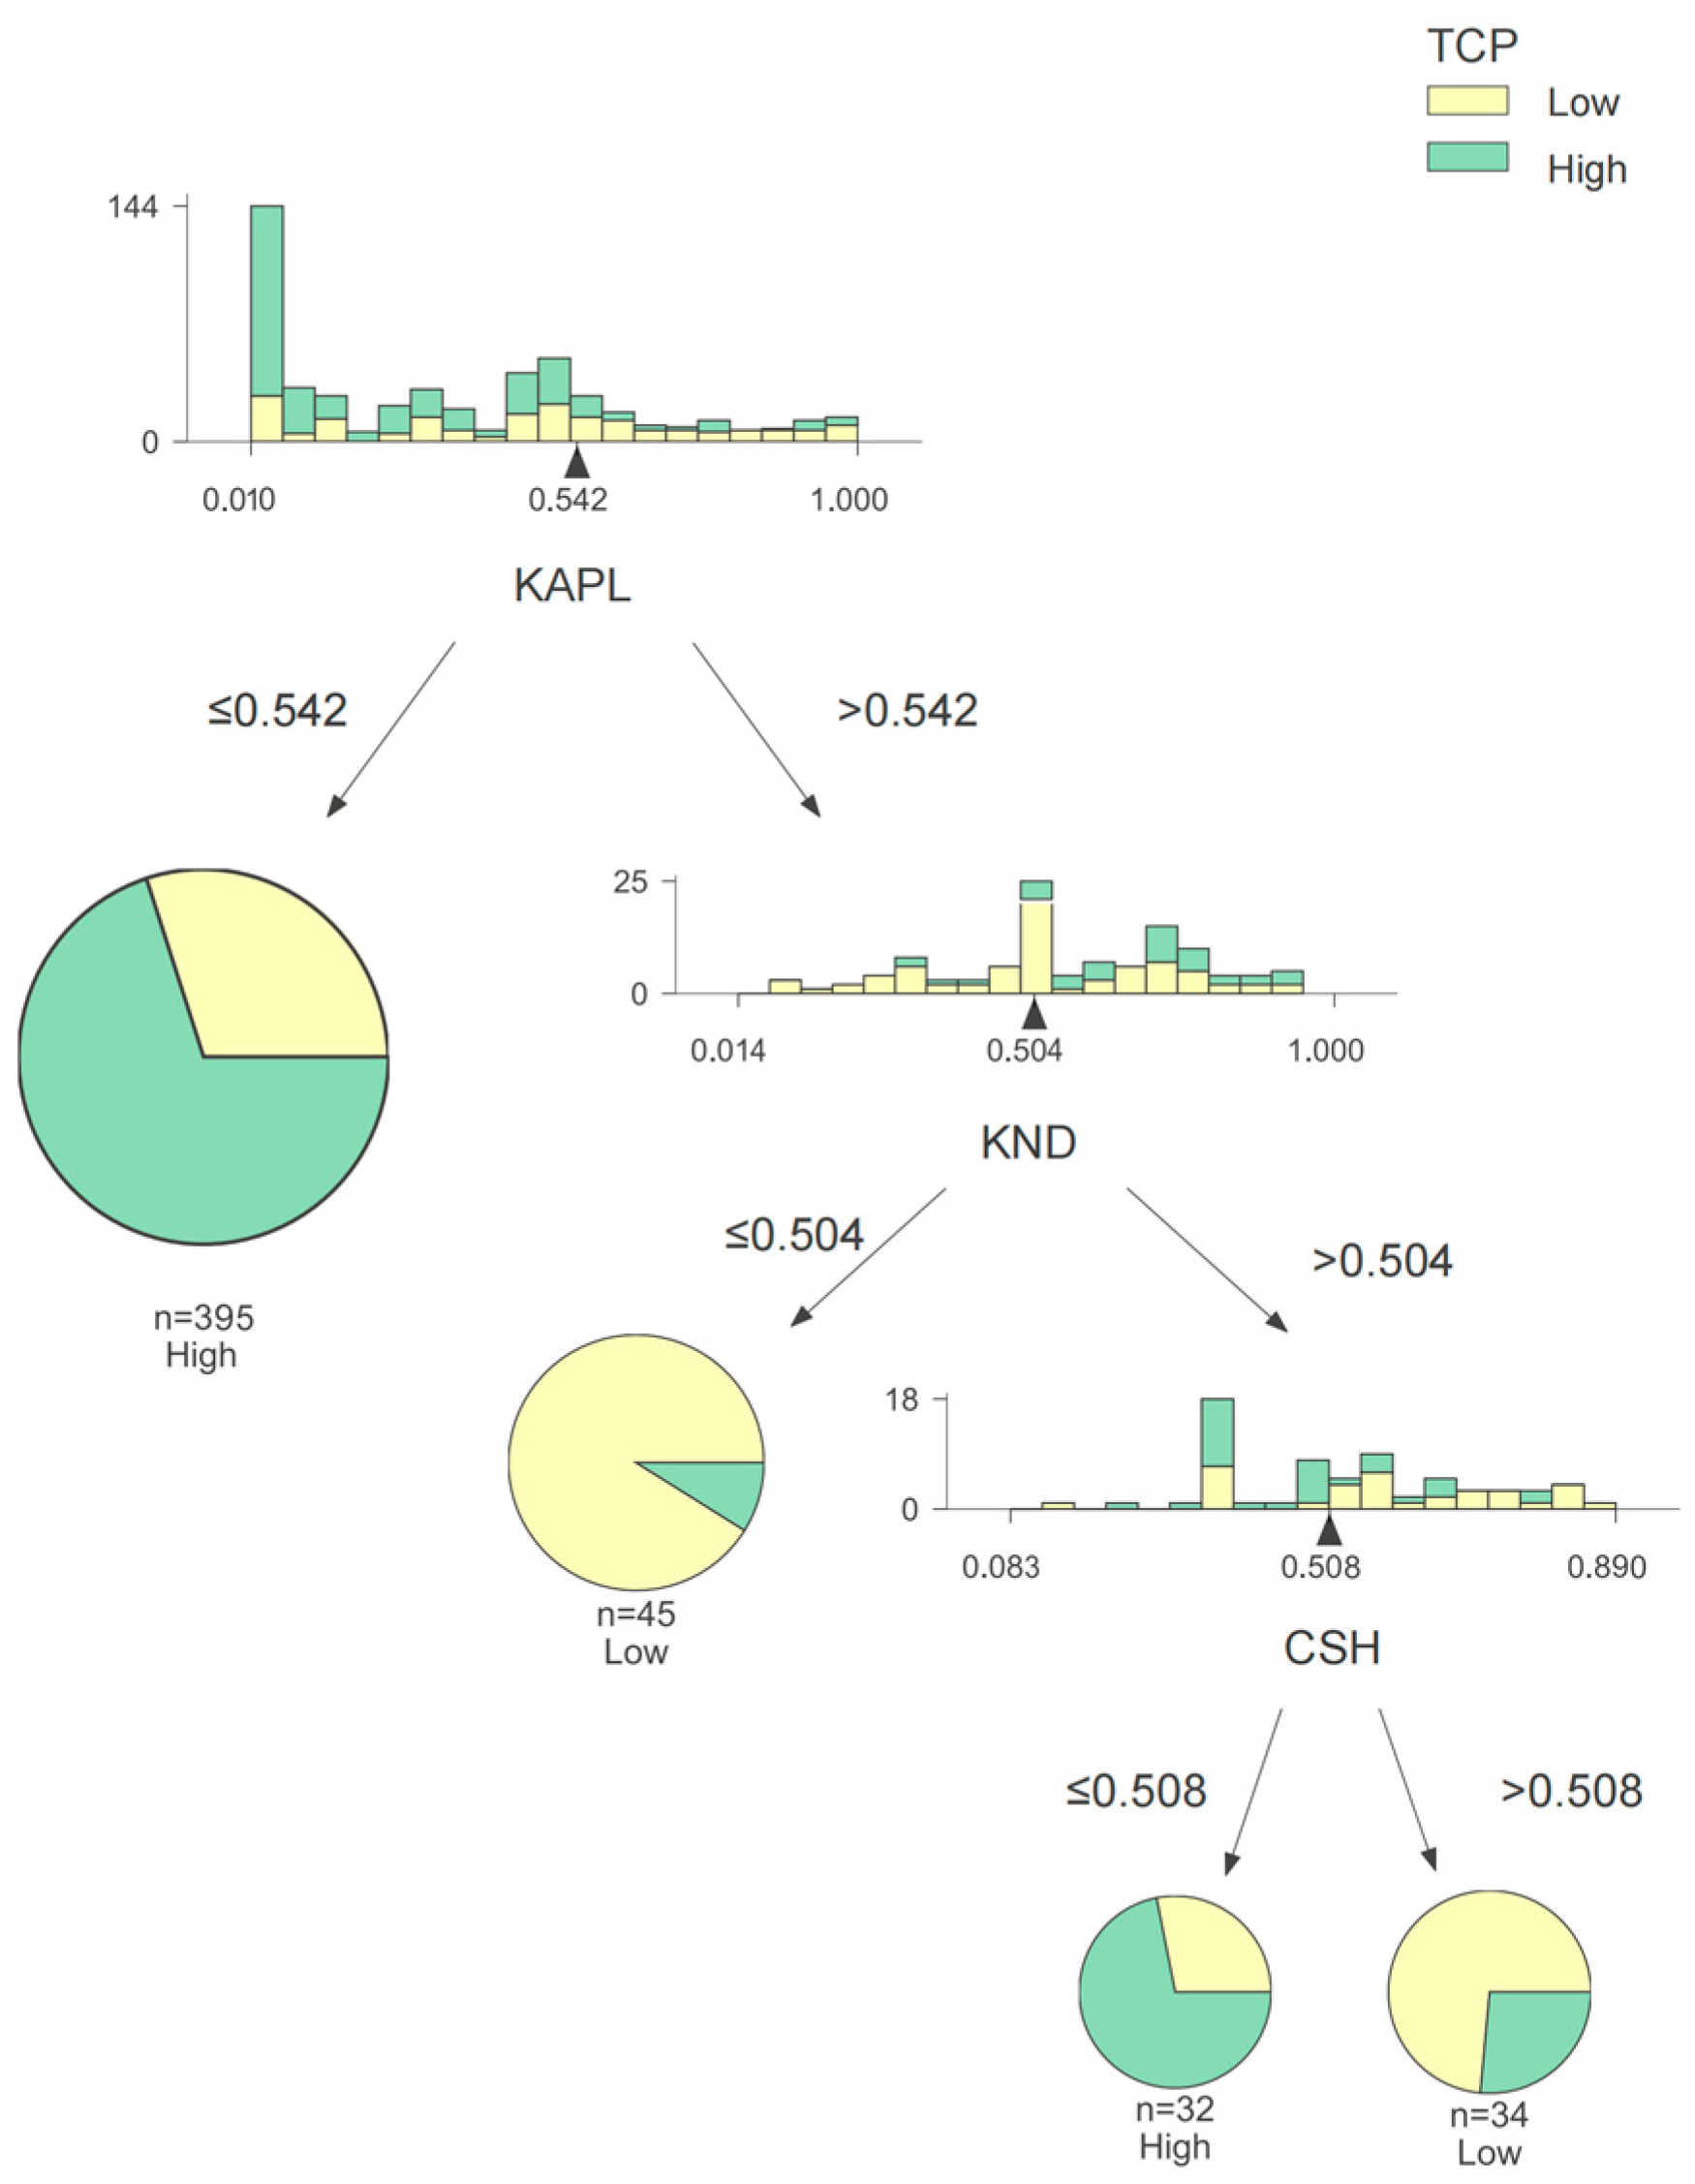
As shown in
Figure 6, for firms in the “Centralized Knowledge & Balanced Collaboration” group, TCP is mainly affected by the KAPL and KND of knowledge networks and the CSH of collaboration networks. The detailed findings are as follows:
At the first level of decision tree, the average path length (KAPL) serves as the initial determinant. firms with a low average path length (KAPL ≤ 0.542) have a 69.4% probability of achieving high TCP, highlighting that the average path length of a knowledge network may again be important for achieving high performance.
At the second level of the decision tree, the probability of firms with a low knowledge network density (KND ≤ 0.504) achieving low TCP is up to 91%, indicating that a lower network density is associated with weaker catch-up performance. Meanwhile, firms with KND >0.504 proceed to the next decision node based on the structure holes of collaboration networks (CSHs).
At the third level of the decision tree, there is a higher proportion of high TCP firms when CSH ≤ 0.508, while firms with CSH > 0.508 exhibit a greater likelihood of having low TCP. This suggests that within firms already possessing higher knowledge novelty, a more homogeneous collaboration structure may be conducive to technological catch-up. A possible explanation is that, although the connectivity between knowledge modules may not be optimal, the rich combinations of knowledge elements within each module enhance internal innovation. Additionally, the heterogeneous knowledge brought by the external structural holes inspires new technological paths and ensures the innovativeness of the intra-module knowledge recombination [
16].
However, the results also reflect that excessive structural holes have negative impacts on TCP. This could be attributed to the increased R&D costs associated with coordinating and integrating technological domains across diverse disciplinary boundaries [
48]. When the costs of managing external collaborations outweigh the benefits of structural holes, firms may experience diminished innovation efficiency, ultimately leading to weaker catch-up performance.
Therefore, firms in this group can enhance their TCP by shortening the average path length (KAPL) or increasing knowledge network density (KND) while avoiding overly broad and loosely structured collaborative partnerships. This can be achieved by prioritizing the identification of novel knowledge combinations rather than repetitive recombinations of existing knowledge. Regarding the construction of collaboration networks, firms should strategically select partners from technologically relevant fields and establish stable, deep collaborations to facilitate the effective integration of their core technologies into emerging domains. By fostering targeted and stable partnerships, firms can optimize knowledge exchange efficiency while mitigating the coordination costs associated with excessive structural holes.
4.4. Discussion
4.4.1. Result Analysis
One of the most consistent findings across firm groups is the dominant role of average path length (KAPL) in predicting technological catch-up performance (TCP). In the CART decision tree across three groups, KAPL frequently appears as the first-level decision node, highlighting its strong explanatory power across different network configurations. For example, the shorter knowledge path lengths (i.e., faster access to dispersed knowledge) and higher recombination flexibility collectively form the structural basis for successful catch-up. Obviously, it can be interpreted through the small-world network theory [
49], which posits that networks with short path lengths and high clustering coefficients facilitate both efficient information diffusion and effective knowledge recombination. Prior studies confirm that such small-world configurations facilitate faster product improvement in leading firms by supporting rapid information flow and tighter knowledge integration [
50]. A low KAPL reflects a compact and navigable knowledge structure, allowing firms to access and integrate distributed knowledge elements with minimal cognitive and coordination burden [
51]. Its high predictive power across firm groups suggests that global structural compactness is especially critical for firms pursuing technological catch-up.
Although the small-world network theory emphasizes the important role of short paths and high agglomeration in promoting firm technological catch-up, our results suggest that high agglomeration may not always be a necessary condition for innovation in the catch-up context. As small-world networks mature, they may become increasingly closed and less accessible to new knowledge elements. High agglomeration often results in repeated interactions within tightly knit subgroups, which leads to information redundancy and limits exposure to novel or diverse ideas [
52]. For firms focused on exploratory innovation, such structural closure can constrain knowledge diversity and learning agility. To mitigate these risks, some firms may deliberately reduce clustering in their networks to preserve openness and avoid lock-in. In this regard, strategically loosening local density can serve as an effective approach to sustain innovation dynamism in uncertain and rapidly changing environments
For latecomer firms, a less clustered but globally efficient knowledge structure may be more suitable. A lower global clustering coefficient (KGCC) reflects looser coupling among knowledge modules, which enhances flexibility and expands the search space for novel combinations. When paired with short path length, such structures enable firms to navigate across diverse knowledge domains quickly, without being trapped in dense local clusters. This may represent a form of “lean recombination” strategy—agile, broad, and less burdened by the coordination demands typical of tightly clustered networks. Overall, our findings refine the application of small-world theory by suggesting that in catch-up contexts, the optimal knowledge network structure may diverge from the classic small-world ideal. Instead, strategically sparse yet efficiently connected network systems may better support innovation speed and structural adaptability.
In addition to the internal knowledge network, our results reveal a nonlinear relationship between degree centrality (CDC) in collaboration networks and TCP. This finding echoes Guan and Liu [
20], who identified an inverted U-shaped relationship between the number of direct collaborative ties and innovation performance. Moderate levels of direct collaboration can enhance innovation by enabling knowledge synergy through complementary partnerships. Collaborators from diverse backgrounds provide access to heterogeneous knowledge, technologies, and expertise, allowing firms to combine and recombine ideas to support technological advancement [
53]. These interactions also help firms stay attuned to emerging trends and developments, thereby improving innovation efficiency and responsiveness.
However, excessive direct collaboration may diminish these benefits. As the number of direct ties grows, managing the network becomes more complex, requiring greater investments in coordination and relationship governance. This leads to resource dilution and reduces innovation output [
52]. Moreover, large networks may cause information overload and misalignment of goals, ultimately increasing managerial burden and collaboration risks that hinder innovation performance [
54].
4.4.2. Theoretical Contributions and Managerial Implications
This study contributes to the literature on innovation networks and technological catch-up in several important ways. First, previous studies have predominantly viewed knowledge network characteristics as moderators or mediators of the relationship between collaboration network positions and innovation outcomes [
55]. In contrast, our findings suggest that in the context of technological catch-up, the configuration of internal knowledge networks—particularly average path length and network density—plays a more fundamental and direct role in shaping firm performance than collaboration networks. This highlights the context-dependent salience of network structures, emphasizing that for latecomer firms, the efficiency of internal knowledge integration may be a necessary foundation for realizing the benefits of external collaborations. This insight calls for a rethinking of the hierarchical importance and interplay of different types of networks in innovation research, especially under dynamic or resource-constrained conditions.
Second, this study makes a methodological contribution by employing a novel two-step machine learning framework that combines hierarchical clustering with the CART algorithm. Unlike traditional linear models that assume homogeneity across firms, this approach allows us to capture nonlinear, interactive, and context-specific relationships between network characteristics and firm TCP. It thus opens new possibilities for understanding how innovation drivers vary across firm types.
Third, our findings underscore the heterogeneity of firms and the non-universality of innovation strategies. Different firms experience distinct configurations of knowledge and collaboration networks that lead to high or low TCP. This challenges the notion of “one-size-fits-all” best practices and instead supports the development of more adaptive, cluster-specific strategies for network management.
Finally, the study reveals a nuanced role for collaboration networks—not as primary drivers, but as moderators that can enhance or compensate for knowledge network weaknesses. For example, structural holes in collaboration networks can mitigate the negative effects of fragmented internal knowledge structures, contributing to a more dynamic understanding of how exploration and exploitation strategies co-evolve in complex network environments. Taken together, these contributions deepen the theoretical understanding of technological catch-up by emphasizing the dynamic, layered, and interdependent nature of internal and external network structures.
5. Conclusions
This study systematically explores the interplay between collaboration networks, knowledge networks, and firm TCP in the Chinese AI industry. The key findings generated are as follows:
First, firms exhibit distinct network configurations. High TCP is associated with high-density, short-path knowledge networks and moderate collaboration strategies. Conversely, low TCP correlates with fragmented knowledge structures and overly broad collaboration networks. This signifies the importance of balancing external partnerships with internal knowledge integration.
Second, the drivers of TCP vary across firm groups. For the “Dispersive Knowledge & Broad Collaboration” group, optimizing knowledge network cohesion (e.g., reducing path length) is critical. In contrast, the “Multiple Knowledge & Balanced Collaboration” group benefits from prioritizing partner quality over quantity. The “Centralized Knowledge & Balanced Collaboration” group must balance structural holes in collaboration networks to avoid coordination costs while maintaining knowledge novelty.
Third, while knowledge networks dominate TCP outcomes, collaboration networks act as moderators. For instance, structural holes in collaboration networks can mitigate the negative effects of fragmented knowledge structures. This synergy highlights the need for firms to align external partnerships with internal knowledge strategies.
This study has some limitations. The first limitation is that this study only focused on technological catch-up, leaving marketing catch-up unexplored. Research regarding the effect of network characteristics on the marketing performance of firms is necessary to construct comprehensive catch-up strategies, because some network structures may not be conducive to technological innovation but can help firms capture a greater proportion of the market share. A second limitation may arise from the fact that this study focuses on firms from a single industry. AI provides a representative context in which to examine the role of knowledge networks; however, caution is required when generalizing the results. Different industries may differ in collaboration patterns and knowledge network structures. To test the applicability of our results, evidence from different industry settings is required.
Author Contributions
Conceptualization, L.Z. and X.W.; methodology, X.W.; software, J.L. (Jing Lai); data curation, J.L. (Jing Lai); writing—original draft, J.L. (Jiangmei Li) and J.L. (Jing Lai); writing—review and editing, J.L. (Jiangmei Li) and X.W.; visualization, J.L. (Jing Lai); supervision, L.Z. All authors have read and agreed to the published version of the manuscript.
Funding
This research was supported by the Social Science Foundation Project of Fujian Province of China (FJ2023B109, FJ2024BF039).
Data Availability Statement
The raw data supporting the conclusions of this research will be made available by the authors on request.
Conflicts of Interest
The authors declare no conflicts of interest.
References
- Li, Y.; Ji, Q.; Zhang, D. Technological catching up and innovation policies in China: What is behind this largely successful story? Technol. Forecast. Soc. Change 2020, 153, 119918. [Google Scholar] [CrossRef]
- Zhao, X.; Cai, X.; Jiang, C.; Wang, D.; Zhang, L.; Shi, F. The determining mechanism of technology catch-up in China’s photovoltaic (PV) industry: Machine learning approaches. J. Clean. Prod. 2024, 450, 142028. [Google Scholar] [CrossRef]
- Li, Y.; Teng, Y.; Wu, D.; Wu, X. From lagging behind to going beyond: Windows of opportunity and latecomers’ catch-up strategies. Eur. J. Innov. Manag. 2025, 28, 978–1009. [Google Scholar] [CrossRef]
- Shi, X.; Zheng, Z.; Zhang, Q.; Liang, H. External knowledge search and firms’ incremental innovation capability: The joint moderating effect of technological proximity and network embeddedness. Manag. Decis. 2020, 58, 2049–2072. [Google Scholar] [CrossRef]
- Yan, J.; Yu, Z.; Fernandes, K.; Xiong, Y. Dual networks: How does knowledge network embeddedness affect firms’ supply chain learning? Int. J. Oper. Prod. Manag. 2023, 43, 1277–1303. [Google Scholar] [CrossRef]
- Zhang, H.; Guo, J.; Guo, F.; Zhang, W. Knowledge Networks, Collaboration Networks, and Local Search Behaviors. Group Organ. Manag. 2023, 2020, 10596011231203364. [Google Scholar] [CrossRef]
- Yayavaram, S.; Ahuja, G. Decomposability in Knowledge Structures and Its Impact on the Usefulness of Inventions and Knowledge-base Malleability. Adm. Sci. Q. 2008, 53, 333–362. [Google Scholar] [CrossRef]
- Figueiredo, P.N.; Cohen, M. Explaining early entry into path-creation technological catch-up in the forestry and pulp industry: Evidence from Brazil. Res. Policy 2019, 48, 1694–1713. [Google Scholar] [CrossRef]
- Xu, L.; Li, J.; Zhou, X. Exploring new knowledge through research collaboration: The moderation of the global and local cohesion of knowledge networks. J. Technol. Transf. 2019, 44, 822–849. [Google Scholar] [CrossRef]
- Li, J.; Yu, Y. From collaborative research to new product development: Why a central or brokered network position is not enough. J. Knowl. Manag. 2022, 26, 615–641. [Google Scholar] [CrossRef]
- Xu, X.; Tian, S. Should It Always Be Central? Substitution Effects of Multi—Network Embeddedness on Absorptive Capacity. Systems 2025, 13, 20. [Google Scholar] [CrossRef]
- Cheng, L.; Liu, Y.; Lou, X.; Chen, Z.; Yang, Y. Does technology conglomeration promote innovative outcomes of new energy vehicle enterprises? The moderating effect of divisive faultlines. J. Clean. Prod. 2021, 324, 129232. [Google Scholar] [CrossRef]
- Moaniba, I.M.; Su, H.-N.; Lee, P.-C. Geographic distance between co-inventors and firm performance: The moderating roles of interfirm and cross-country collaborations. Technol. Forecast. Soc. Change 2020, 157, 120070. [Google Scholar] [CrossRef]
- Xiao, J.; Bao, Y.; Wang, J. Which neighbor is more conducive to innovation? The moderating effect of partners’ innovation. J. Technol. Transf. 2023, 48, 33–67. [Google Scholar] [CrossRef]
- Moon, H.; Di Benedetto, A.; Kim, S.K. The effect of network tie position on a firm’s innovation performance. J. Bus. Res. 2022, 144, 821–829. [Google Scholar] [CrossRef]
- Ju, X.; Wang, G. How do network ties affect firm performance growth and its variability? The mediating roles of exploratory and exploitative knowledge utilization. J. Bus. Res. 2023, 160, 113781. [Google Scholar] [CrossRef]
- Nikiforou, A.I.; Lioukas, S.; Voudouris, I. Network structure and firm-level entrepreneurial behavior: The role of market and technological knowledge networks. J. Bus. Res. 2020, 106, 129–138. [Google Scholar] [CrossRef]
- Yang, B.; Li, X.; Kou, K. Research on the influence of network embeddedness on innovation performance: Evidence from China’s listed firms. J. Innov. Knowl. 2022, 7, 100210. [Google Scholar]
- Zhao, Y.; Li, Q.; Lyu, J. Quantity or Quality? The Impact of Multilevel Network Structural Holes on Firm Innovation. Systems 2024, 12, 57. [Google Scholar] [CrossRef]
- Guan, J.; Liu, N. Exploitative and exploratory innovations in knowledge network and collaboration network: A patent analysis in the technological field of nano-energy. Res. Policy 2016, 45, 97–112. [Google Scholar] [CrossRef]
- Miao, Y.; Song, J.; Lee, K.; Jin, C. Technological catch-up by east Asian firms: Trends, issues, and future research agenda. Asia Pac. J. Manag. 2018, 35, 639–669. [Google Scholar] [CrossRef]
- Yang, H.; Lin, Z.; Lin, Y. A multilevel framework of firm boundaries: Firm characteristics, dyadic differences, and network attributes. Strateg. Manag. J. 2010, 31, 237–261. [Google Scholar] [CrossRef]
- Giuliani, E.; Martinelli, A.; Rabellotti, R. Is co-invention expediting technological catch up? Astudy of collaboration between emerging country firms and EU inventors. World Dev. 2016, 77, 192–205. [Google Scholar] [CrossRef]
- Zhang, H.; Shi, Y.; Liu, J.; Wu, X. How do technology strategies affect the catch-up progress of high-tech latecomers? Evidence from two Chinese research-institute-transformed telecommunications firms. J. Bus. Res. 2021, 122, 805–821. [Google Scholar] [CrossRef]
- Wang, C.; Rodan, S.; Fruin, M.; Xu, X. Knowledge networks, collaboration networks, and exploratory innovation. Acad. Manag. J. 2014, 57, 484–514. [Google Scholar] [CrossRef]
- Chen, F.; Liu, H.; Ge, Y. How does integration affect industrial innovation through networks in technology-sourcing overseas M&A? A comparison between China and the US. J. Bus. Res. 2021, 122, 281–292. [Google Scholar]
- Hou, T.; Wang, W.; Zhang, L.; Li, J.J.; Chong, B. Dual network configurations and invention renewals within the pharmaceutical industry. Manag. Decis. 2024, 62, 2029–2054. [Google Scholar] [CrossRef]
- Rosiello, A.; Maleki, A. A dynamic multi-sector analysis of technological catch-up: The impact of technology cycle times, knowledge base complexity and variety. Res. Policy 2021, 50, 104194. [Google Scholar] [CrossRef]
- Ebersberger, B.; Feit, M.; Mengis, H. International knowledge interactions and catch-up. Evidence from European patent data for Chinese latecomer firms. Int. Bus. Rev. 2023, 32, 101855. [Google Scholar] [CrossRef]
- Güçdemir, H.; Selim, H. Integrating multi-criteria decision making and clustering for business customer segmentation. Industrial Manag. Data Syst. 2015, 115, 1022–1040. [Google Scholar] [CrossRef]
- Lambert, L.; Dedeurwaerdere, T.; Nyssens, M. Unpacking the organizational diversity within the collaborative economy: The contribution of an analytical framework from social enterprise theory. Ecol. Econ. 2019, 164, 106343. [Google Scholar] [CrossRef]
- Ramdani, B.; Belaid, F.; Boukrami, E. Profiling exporting SMEs: The role of innovation-orientation. J. Bus. Res. 2022, 149, 1–13. [Google Scholar] [CrossRef]
- Li, H.; Tang, H.; Zhou, W.; Wan, X. Impact of enterprise digitalization on green innovation performance under the perspective of production and operation. Front. Public Health 2022, 10, 971971. [Google Scholar] [CrossRef]
- Saleem, M.A.; Eagle, L.; Low, D. Market segmentation based on eco-socially conscious consumers’ behavioral intentions: Evidence from an emerging economy. J. Clean. Prod. 2018, 193, 14–27. [Google Scholar] [CrossRef]
- Zhou, W.; Li, H. R&D team network configurations, knowledge diversity and breakthrough innovation: A combined effect framework. Eur. J. Innov. Manag. 2024; ahead-of-print. [Google Scholar]
- Wang, J.; Liu, X.; Wei, Y.; Wang, C. Cultural Proximity and Local Firms’ catch up with Multinational Enterprises. World Dev. 2014, 60, 1–13. [Google Scholar] [CrossRef]
- Wu, J.; Xia, Q.; Li, Z. Green innovation and enterprise green total factor productivity at a micro level: A perspective of technical distance. J. Clean. Prod. 2022, 344, 131070. [Google Scholar] [CrossRef]
- Sears, J.B.; Hitt, M.A. Post-acquisition integrative invention and differences in the quality of target and acquirer technological capabilities. J. Bus. Res. 2023, 156, 113516. [Google Scholar] [CrossRef]
- Frietsch, R.; Neuhäusler, P.; Jung, T.; Van Looy, B. Patent indicators for macroeconomic growth—The value of patents estimated by export volume. Technovation 2014, 34, 546–558. [Google Scholar] [CrossRef]
- Sun, W.; Zhao, Y.; Sun, L. Big Data Analytics for Venture Capital Application: Towards Innovation Performance Improvement. Int. J. Inf. Manag. 2020, 50, 557–565. [Google Scholar]
- Su, H.N.; Moaniba, I.M. Does geographic distance to partners affect firm R&D spending? The moderating roles of individuals, firms, and countries. J. Bus. Res. 2020, 106, 12–23. [Google Scholar]
- Li, H.; Wang, Z.; Lin, W. How Sino-foreign Cooperation Networks Affect Innovation Performance of Chinese Enterprises? Evidence from Biomedical Industry. IEEE Trans. Eng. Manag. 2023, 71, 8809–8825. [Google Scholar] [CrossRef]
- Yin, C.; Gu, H.; Zhang, S. Measuring technological collaborations on carbon capture and storage based on patents: A social network analysis approach. J. Clean. Prod. 2020, 274, 122867. [Google Scholar] [CrossRef]
- Shipilov, A.; Li, S.X.; Bothner, M.S.; Truong, N. Network advantage: Uncontested structural holes and organizational performance in market crises. Strateg. Manag. J. 2023, 44, 3122–3154. [Google Scholar] [CrossRef]
- Li, F.; Liu, W.; Bi, K. Exploring and visualizing spatial-temporal evolution of patent collaboration networks: A case of China’s intelligent manufacturing equipment industry. Technol. Soc. 2021, 64, 101483. [Google Scholar] [CrossRef]
- Ding, N. How intrafirm collaboration network influences a firm’s new knowledge search? Longitudinal evidence from the US biotechnology industry. J. Knowl. Manag. 2024, 28, 96–117. [Google Scholar]
- Zhou, Y.; Cai, J.; Xu, Y.; Wang, Y.; Jiang, C.; Zhang, Q. Operation performance evaluation of green public buildings with AHP-fuzzy synthetic assessment method based on cloud model. J. Build. Eng. 2021, 42, 102775. [Google Scholar] [CrossRef]
- Yayavaram, S.; Chen, W. Changes in firm knowledge couplings and firm innovation performance: The moderating role of technological complexity. Strateg. Manag. J. 2015, 36, 377–396. [Google Scholar] [CrossRef]
- Watts, D.; Strogatz, S. Collective dynamics of ‘small-world’ networks. Nature 1998, 393, 440–442. [Google Scholar] [CrossRef]
- Ozkan-Canbolat, E.; Beraha, A. A configurational approach to network topology design for product innovation. J. Bus. Res. 2016, 69, 5216–5221. [Google Scholar] [CrossRef]
- Zhang, G.; Guan, J.; Liu, X. The impact of small world on patent productivity in China. Scientometrics 2014, 98, 945–960. [Google Scholar] [CrossRef]
- Gulati, R.; Sytch, M.; Tatarynowicz, A. The rise and fall of small worlds: Exploring the dynamics of social structure. Organ. Sci. 2012, 23, 449–471. [Google Scholar] [CrossRef]
- Vanhaverbeke, W. Explorative and exploitative learnings strategies in technology-based alliance Networks. Technol. Forecast. Soc. Change 2016, 111, 209–221. [Google Scholar]
- Wu, W. Dimensions of social capital and firm competitiveness improvement: The mediating role of information sharing. J. Manag. Stud. 2010, 45, 122–146. [Google Scholar] [CrossRef]
- Lin, R.; Li, B.; Lu, Y.; Li, Y. Degree assortativity in collaboration networks and breakthrough innovation: The moderating role of knowledge networks. Scientometrics 2024, 129, 3809–3839. [Google Scholar] [CrossRef]
| Disclaimer/Publisher’s Note: The statements, opinions and data contained in all publications are solely those of the individual author(s) and contributor(s) and not of MDPI and/or the editor(s). MDPI and/or the editor(s) disclaim responsibility for any injury to people or property resulting from any ideas, methods, instructions or products referred to in the content. |
© 2025 by the authors. Licensee MDPI, Basel, Switzerland. This article is an open access article distributed under the terms and conditions of the Creative Commons Attribution (CC BY) license (https://creativecommons.org/licenses/by/4.0/).


