Article

The Dynamic Impact of Industrial Robot Penetration on Chain Resilience: City Evidence from China

School of Economics, Hangzhou Dianzi University, Hangzhou 310018, China
*
Author to whom correspondence should be addressed.
Systems 2025, 13(5), 362; https://doi.org/10.3390/systems13050362
Submission received: 27 March 2025 / Revised: 2 May 2025 / Accepted: 5 May 2025 / Published: 7 May 2025

Abstract

:
Nowadays, the security and stability of the global industrial chain are facing unprecedented challenges. In this context, understanding how industrial robots affect chain resilience is key to promoting high-quality economic development. This study focuses on 104 cities in the Yangtze River Delta, using data from 2006 to 2021. It applies a threshold regression model and a spatial Durbin model to examine how industrial robot penetration drives chain resilience and how its effects spread across regions. The results reveal three main findings: First, the integration of advanced manufacturing and modern services, together with strong urban innovation capacity, plays a significant role in enhancing industrial chain resilience. Second, this study evaluates policy experiments, such as Low-Carbon City and Broadband China initiatives, using a multi-period difference-in-differences model. The findings show that pilot cities involved in these programs demonstrate higher levels of chain resilience. Third, the relationship between robot penetration and chain resilience shows clear spatial and temporal patterns. Cities with higher robot usage tend to drive development in surrounding areas. This, in turn, encourages more intensive production and fosters stronger coordination across industries. Overall, this study contributes to the growing body of research on chain resilience. More importantly, it offers practical policy insights. Governments and regional firms can work together to build a new development model that enhances resilience and supports long-term economic stability.

1. Introduction

In recent years, global geopolitical and trade frictions have been intensifying, and coupled with the impact of the COVID-19 epidemic, the world situation is not optimistic. The risk of a break in the global industrial chain has increased, and all kinds of uncertain factors fill the business environment of enterprises, leading to the “broken chain”, “missing chain”, “blocked chain”, and other problems in the industrial production of enterprises. To ensure the security of the supply chain and industry chain, countries have begun to adopt the strategic consideration of the short chain and the flattening of the industrial chain (Gereffi, 2020) [1]. Under the influence of concepts such as economies of scale, enterprises have implemented global industrial chain strategies to gain greater competitive advantages (Cahyono et al., 2023) [2]. At the same time, from a broader perspective of sustainable development, a stable industrial chain resilience system not only maintains the long-term continuity of the economic system during crises but also efficiently resists external shocks. It enables flexible resource allocation, promotes green transformation, and reduces ecological damage. Consequently, it balances environmental, economic, and social goals and thus becomes a key mechanism for supporting sustainable development (Liu and Ling, 2020; Manioudis and Meramveliotakis, 2022) [3,4]. Against this background, the Chinese Government proposes to strengthen the ability to cope with various risks, enhance the intrinsic dynamics and reliability of the domestic general circulation, improve the quality and level of the international circulation, and strengthen the resilience and the safety of the industry and supply chains. However, although existing studies have extensively discussed supply chain resilience and economic resilience, research on the concept and influencing mechanisms of industrial chain resilience remains limited. Therefore, this paper clarifies the concept of industrial chain resilience and, from a unique industrial chain perspective, explores its influencing factors and mechanisms. It also proposes policy implications, further filling the gap in the existing literature.
The term “resilience” is derived from the Latin word “Resilire”, meaning “restoration”, which means the system has a self-healing ability after external disturbances (Cheng and Zhang, 2020) [5]. At present, a large number of studies have focused on “supply chain resilience” and “economic resilience”. Supply chain resilience refers to the ability of a supply chain system to quickly respond to and recover from market risks (Christopher and Lee, 2004; Soni et al., 2014) [6,7]. For example, Ponomarov and Holcomb (2009) [8] divided it into three capabilities: preparation, a rapid response, and adaptive recovery. From a management perspective, Baskshi and Kleindorfer (2009) [9] emphasized the role of supply chain resilience in maintaining system continuity. Innovation capacity and risk management infrastructure are also seen as key supporting factors (Ambulkar et al., 2015; Grossman et al., 2023) [10,11]. In addition, supplier diversity and flexible cooperation mechanisms are considered effective ways to prevent supply chain disruptions in advance (Jüttner & Maklan, 2011; Hosseini et al., 2019; Gao et al., 2021; Gu et al., 2021) [12,13,14,15]. In contrast, research on economic resilience focuses more on a region’s ability to adapt to and recover from macro-level shocks. It covers conceptual definitions, measurement frameworks, and transmission mechanisms (Martin and Sunley, 2015; Brown & Greenbaum, 2017) [16,17]. These theories provide important references for studies on industrial chain resilience. However, it is worth noting that industrial chain resilience, as an independent concept, has rarely been clearly defined and systematized in the existing literature.
From an evolutionary perspective, industrial chain resilience refers to the ability of different segments of an industrial chain (especially key nodes) to coordinate responses, recover quickly, and maintain system stability and continuity under complex external shocks (Zhang et al., 2022) [18]. Although closely related to supply chain resilience, this concept focuses on the structural shock resistance of the entire industrial system. It emphasizes the recovery process involving cross-firm, cross-regional, and cross-industry collaboration, rather than merely the coordination of material flow between companies. Recently, some studies have begun to explore the factors influencing industrial chain resilience. Yang and Liu (2024) [19] pointed out that building digital infrastructure can significantly enhance the dynamic recovery ability of industrial chains. Chowdhury and colleagues further emphasized that, with increasingly complex industrial divisions of labor, high coupling between geographic embedding and organizational structures makes traditional industrial organization models less effective in dealing with external disruptions (Chowdhury and Quaddus, 2017; Katsaliaki et al., 2022) [20,21]. However, it is important to note that most of these studies focus on infrastructure and organizational aspects, with limited attention to the role of emerging technologies, especially artificial intelligence, in strengthening industrial chain resilience.
Artificial intelligence is the core driving force of the new round of industrial revolution, and the onset of the AI boom has caused industrial robots to begin to be used on a large scale in corporate production, affecting the production function by replacing low-skilled labor and increasing the demand for high-skilled labor, thus enhancing the sensitivity of the industrial chain association. Its use continues to provide new dynamics for economic development (Gasteiger and Prettner, 2022; Graetz and Michaels, 2018) [22,23], social employment (Dauth et al., 2018) [24], and labor relations (Acemoglu and Restrepo, 2020) [25], among others. Zhang (2023) [26] has found that the AI industry has a tendency to promote both the “upgrading” and “polarization” of both high-skilled and low-skilled labor, which ultimately leads to overall economic development. All of the above literature side by side provides evidence that industrial robot penetration empowers industry chain resilience. However, its specific impact pathways on industrial chain resilience have not yet been directly studied.
In summary, existing studies still have limitations in defining industrial chain resilience, exploring its influencing mechanisms, and developing measurement approaches. In particular, there is a lack of systematic research on how artificial intelligence technologies (such as industrial robots) enhance industrial chain resilience by optimizing production structures and improving response capabilities. Therefore, this paper aims to fill this gap by conducting an empirical analysis of the impact mechanisms of industrial robot penetration on industrial chain resilience and addresses the following key questions: First, from a research perspective, the existing literature on economic toughness and supply chain toughness research has drawn rich conclusions, but few scholars consider the enabling effect of industrial robot penetration on industry chain toughness, and there is no clear understanding of whether and how industrial robot penetration affects industry chain toughness. Second, at the research level, most of the existing studies study the level of industrial robot penetration and industry chain resilience from the macro level of provinces, and the research at the city level is still in its infancy. Further, from the perspective of factors affecting industrial chain resilience, the above literature does not explain from the perspective of factors such as industrial integration and urban innovation vitality. In addition, the above literature has not explored whether the implementation of relevant government policies is effective in improving the resilience of regional industrial chains. Based on this, this paper analyzes the industry chain resilience structure in depth and constructs multi-level and multi-dimensional industry chain resilience indicators so as to help the evaluators grasp the industry chain resilience level of each city more accurately and then explores whether the penetration of industrial robots can promote the development of the industry chain resilience level through the integration of the two industries and the urban innovation vitality, as well as explores its dynamic evolution and spatial spillover effect. In addition to enriching the depth of industry chain resilience research, it also has certain theoretical significance and reference value for the future state to improve the related policies of industrial robots and industry chain safety and enhance stability.
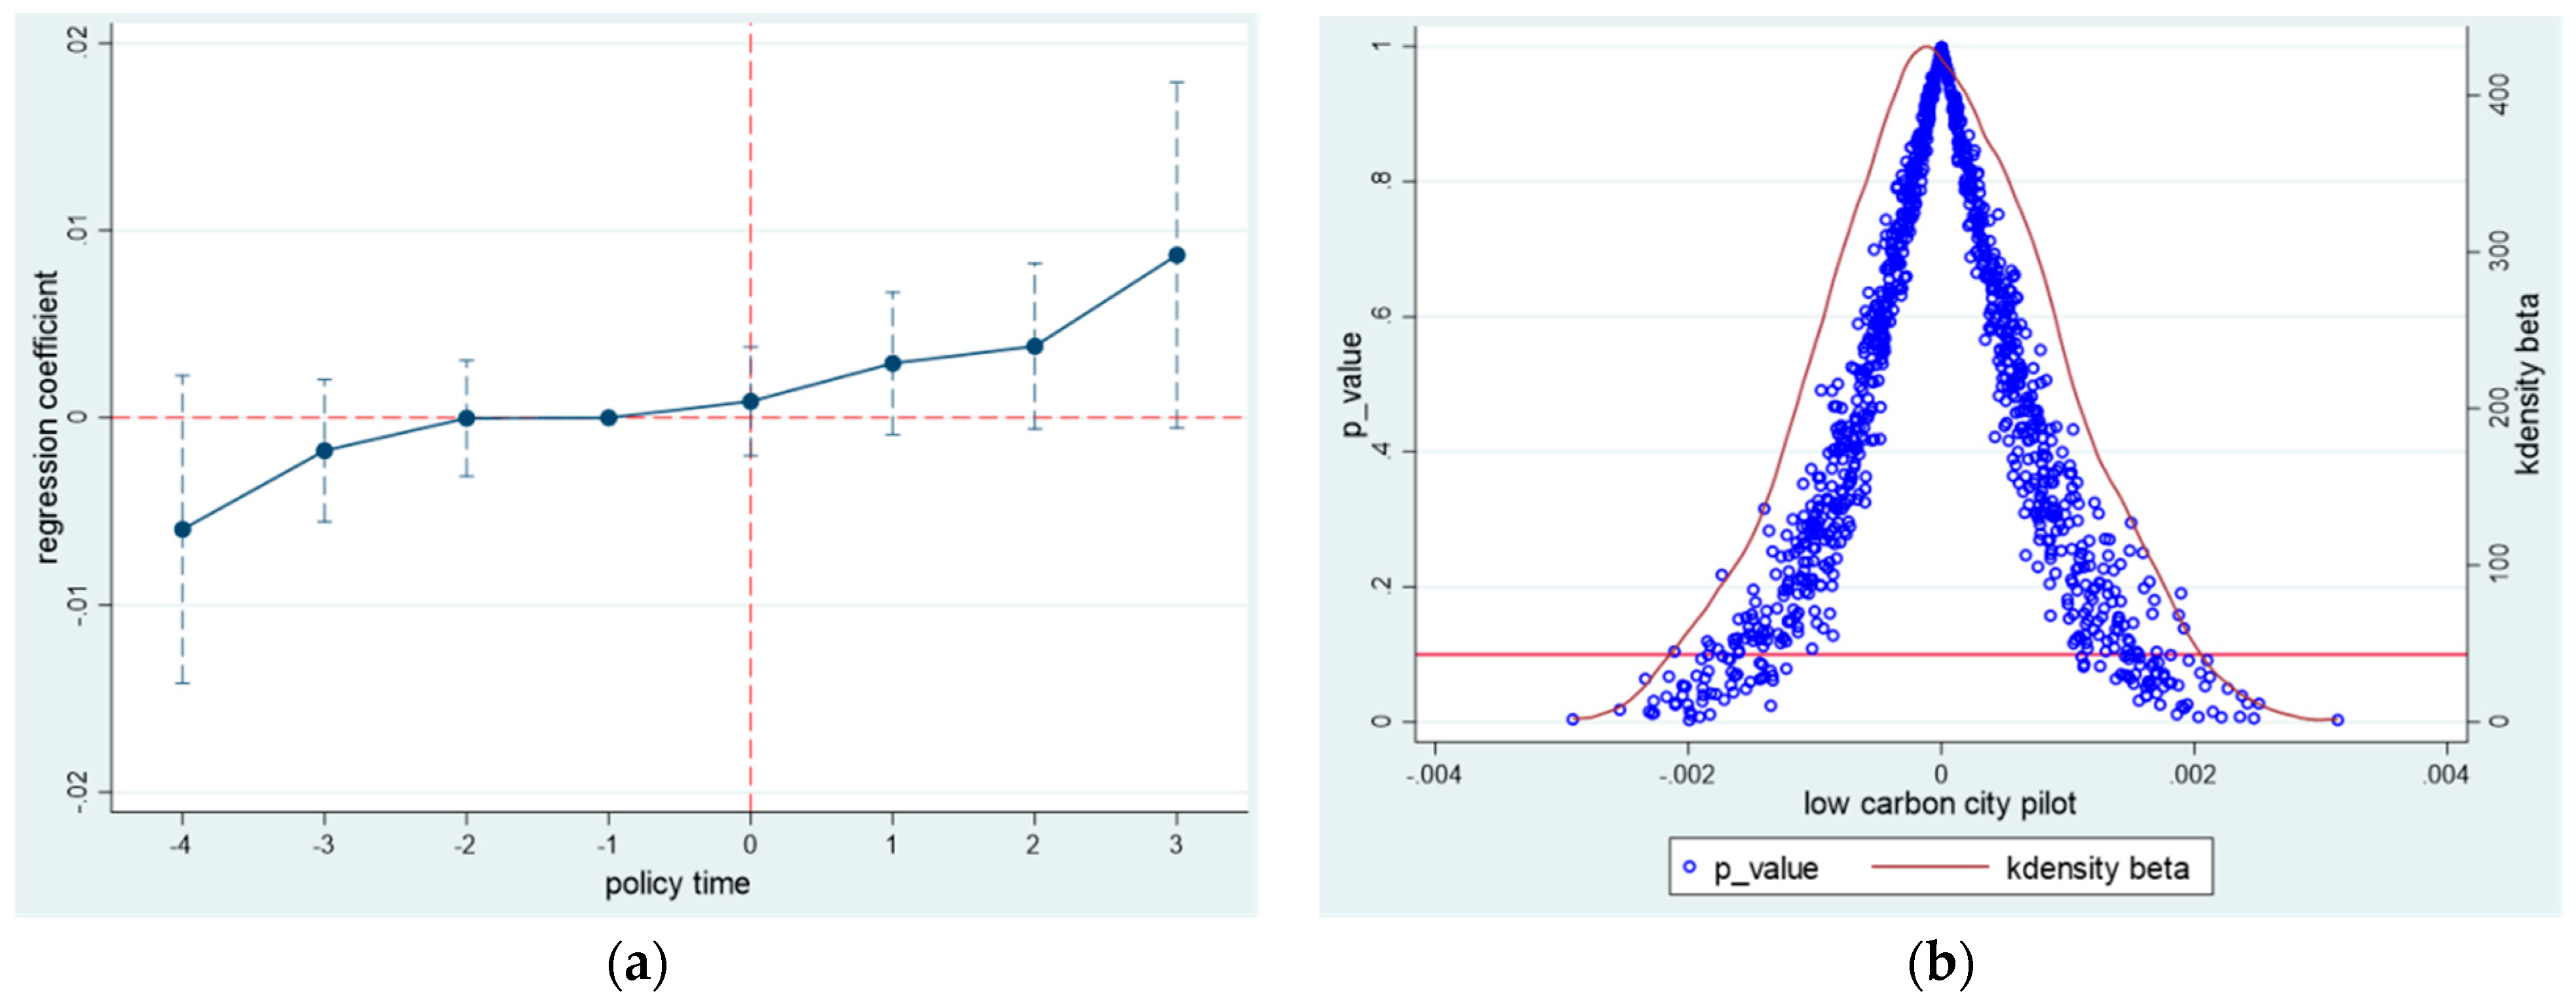
This paper contributes in three main ways: First, based on the idea of evolutionary toughness, the industry chain resilience index system is constructed from the three dimensions of resistance, resilience, and sustainability to measure the industrial resilience at a more microscopic city level, and the mechanism of industrial robot penetration affecting industrial resilience through two paths is demonstrated, thus enriching the research framework of industry chain resilience. Second, we add a “low carbon city”, “broadband China”, and the “innovative city” as the exogenous shocks of pilot policies and explore the impacts of different policies on industry chain resilience with staggered difference-in-differences methods, thus providing a new reference for governments to formulate urban industrial development policies. Third, by constructing threshold and spatial Durbin models, we further assess the nonlinear dynamic evolutionary and spatial spillover effects caused by the influence of industrial robot penetration on industry chain resilience.
This paper is structured as follows: Section 2 presents three research assumptions. Section 3 introduces the data and methodology used in the article, including model introduction, indicator selection, variable description, and information sources. 
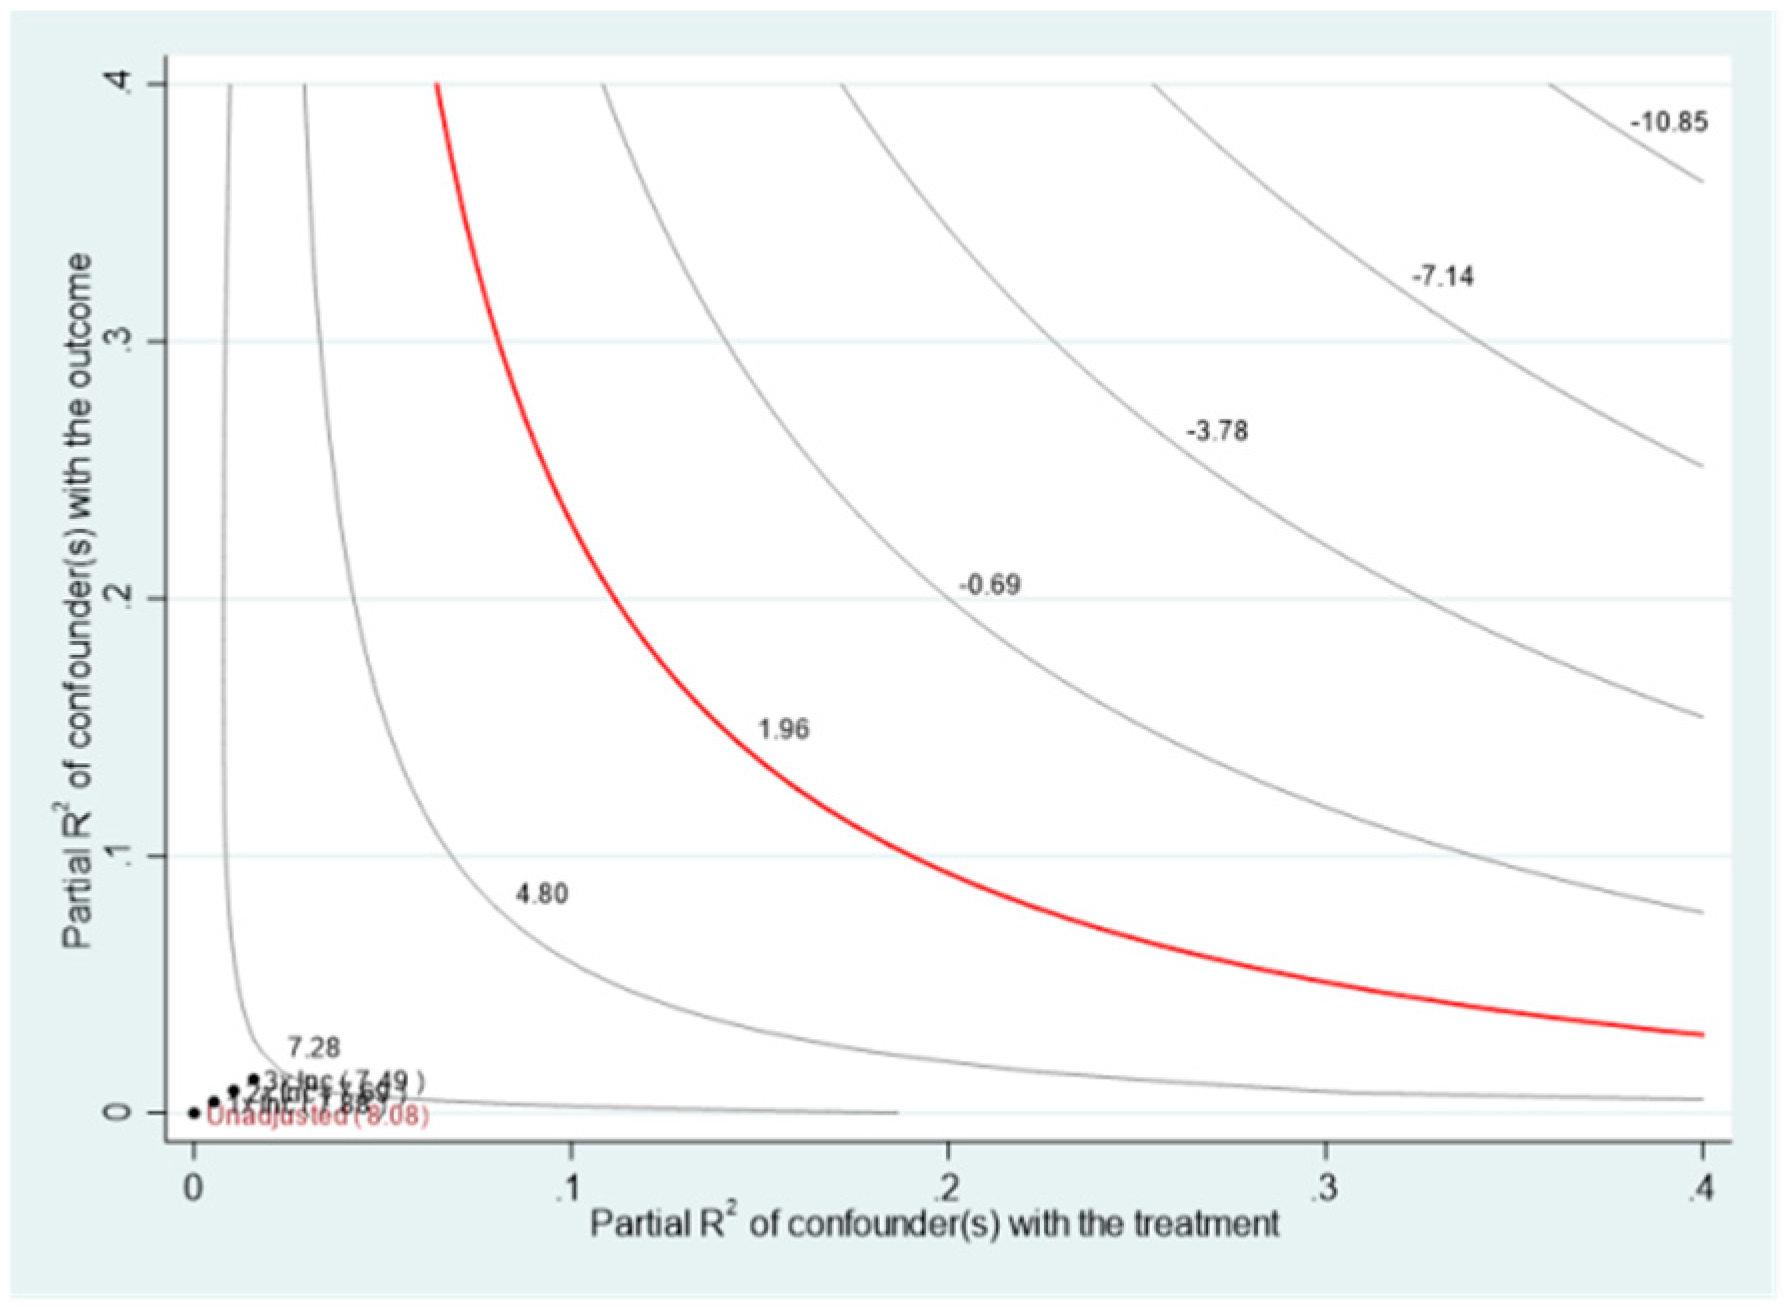
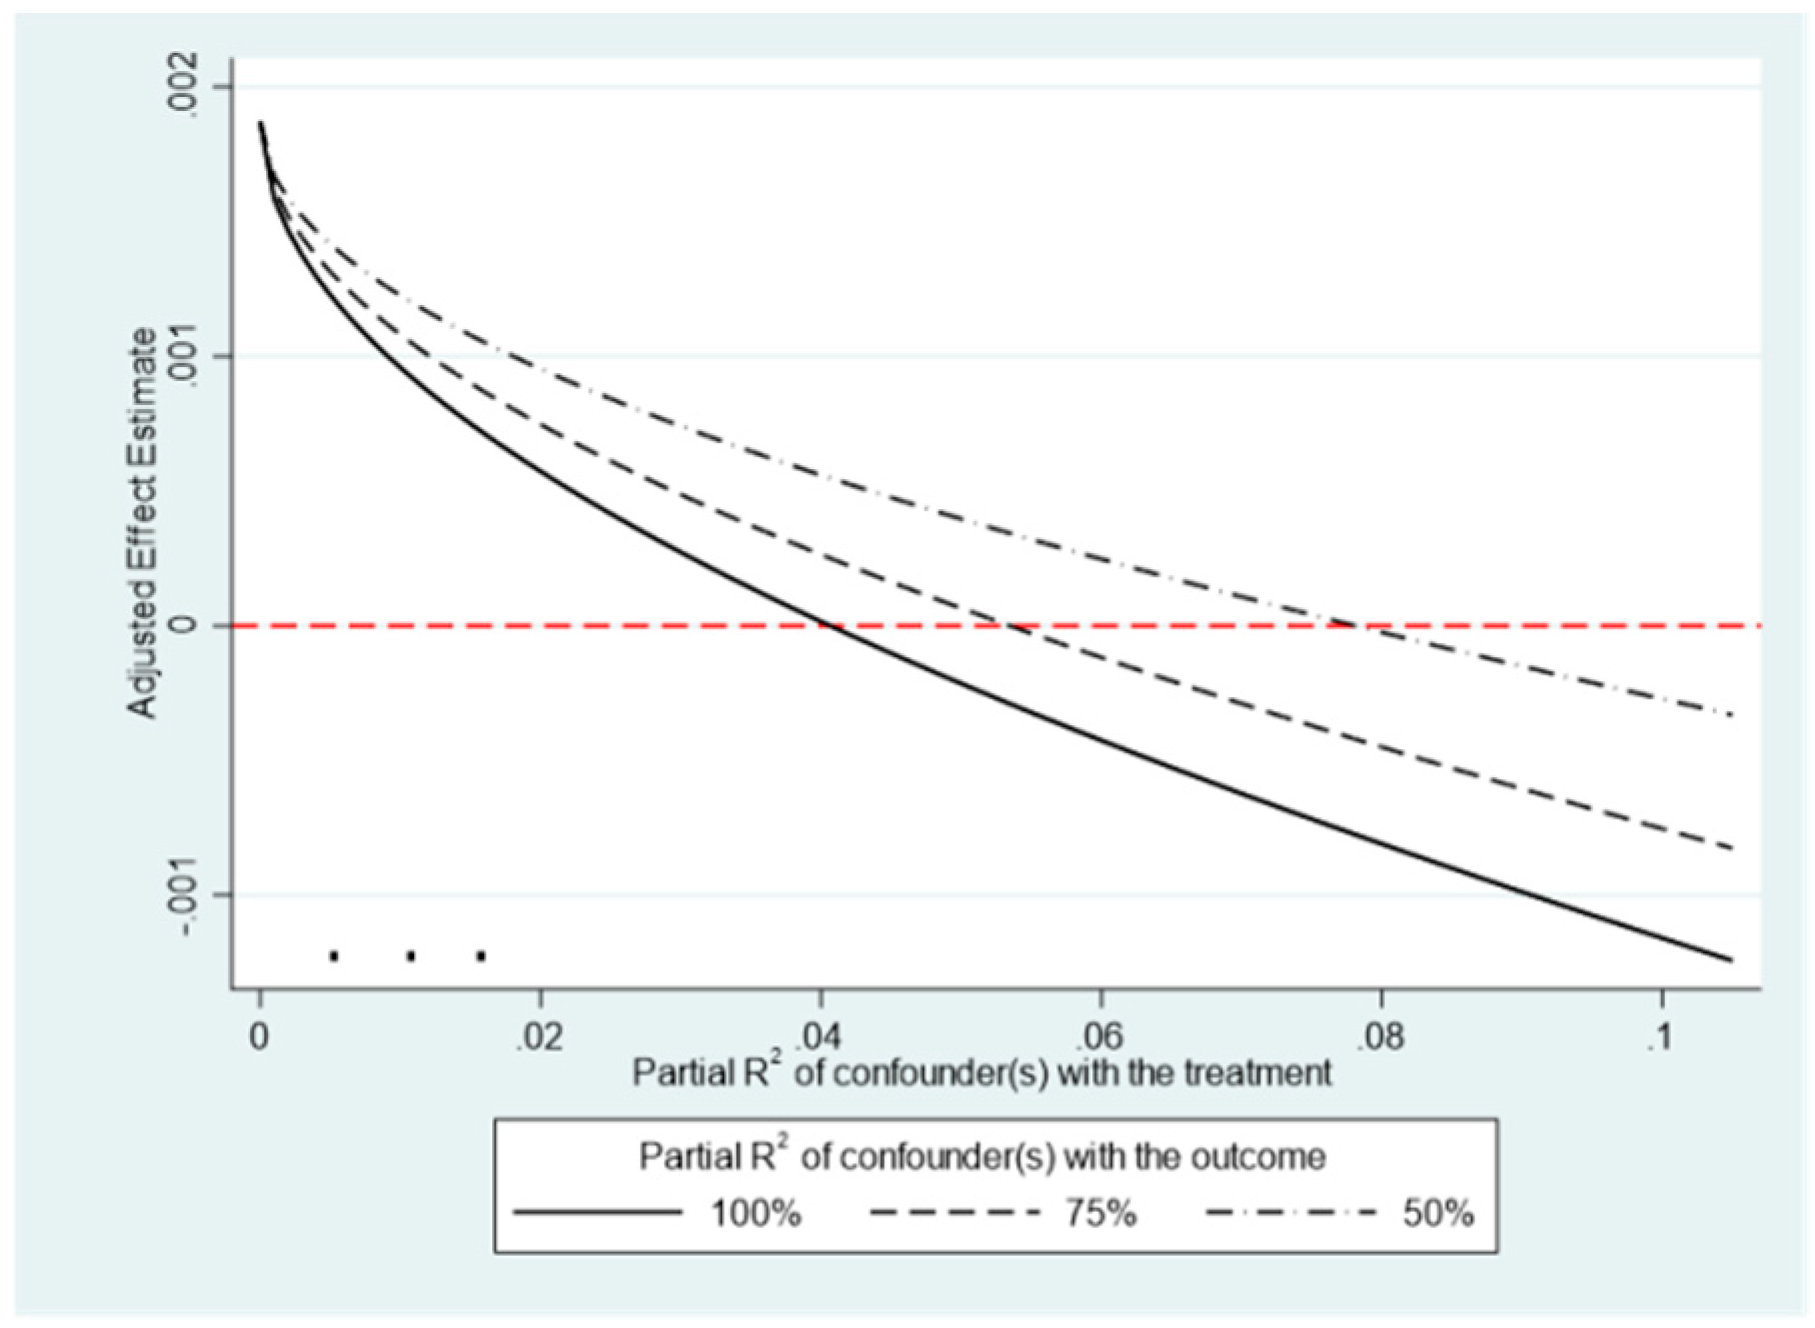
Section 4 explores various influence mechanisms of industrial robots on industry chain resilience and conducts exogenous shock tests. Further, we select multiple methods to conduct endogeneity, robustness, and heterogeneity tests. Section 5 summarizes the research results of this paper and provides policy recommendations.

2. Conceptual Analysis and Hypothetical Frameworks

With the development of the economy, enterprises are looking for more efficient ways to foster the development of the industrial chain so as to enhance their competitiveness. According to the definition given by the International Federation of Robotics, industrial robots are a kind of multi-jointed manipulator or multi-degree-of-freedom robot used in industrial production, which can replace human beings to accomplish certain monotonous, complex, and time-consuming work (Acemoglu and Restrepo, 2020) [25].
First, industrial robot penetration can enhance the resilience of the industry chain. As a specialized type of industrial automation equipment, industrial robots improve production efficiency, enable enterprises to respond quickly to changes in market demand, and adjust production capacity in a timely manner. This ensures that enterprises maintain competitiveness amid supply and demand fluctuations, thereby strengthening the industry’s ability to withstand external risks. Graetz and Michaels (2018) [23] argued that the inputs of industrial robots can increase enterprise total factor productivity, thus increasing the development potential of the manufacturing sector. Secondly, industrial robots can significantly reduce errors caused by human operations and improve product quality. Therefore, industrial robotics technology not only enhances production efficiency but also strengthens quality management, further improving the resilience of the industrial chain. In addition, with the increase in uncertainty in the global production chain, such as natural disasters, epidemics, and geopolitical conflicts, enterprises often face the risk of interruption of the industrial chain supply chain, while industrial robots can quickly adapt to diversified production tasks; scientifically deploy upstream and downstream resource elements; guarantee the continuous supply of enterprise funds, manpower, materials, and other resources; and help enterprises or regions to resist risks. Therefore, the penetration of industrial robots can significantly improve the resistance of the industrial chain, especially in the face of emergencies, and industrial robots can quickly adjust the production line to maintain stable production.
Second, industrial robot penetration can improve chain resilience. Grabner and Modica (2022) [27] concluded that more industrialized regions seem to be less affected by economic shocks than other regions, probably because of the structure of an industry in each region (e.g., the specialization and diversification of production, etc.). First, industrial robots are highly flexible and can quickly adjust production lines in response to unforeseen circumstances or changes in market demand. Traditional production methods require significant time and resources to adjust when the industrial chain is disrupted or demand changes suddenly. In contrast, industrial robots can switch tasks quickly through rapid reprogramming. This ensures that production continues without interruption from external factors. This flexible production capacity enables companies to quickly resume operations and shorten recovery time when experiencing a crisis. Secondly, the increased level of automation reduces the reliance on human resources, and industrial robots have the ability to ensure the continuation of production in extreme environments. This self-healing ability allows the industry chain to recover faster in the face of unexpected events. Finally, industrial robots can optimize the production process in real time through intelligent control and monitoring systems. When external resources are in short supply, industrial robots optimize resource utilization, helping enterprises maintain production stability even when the industry chain is disrupted. Therefore, industrial robots not only improve the flexibility of production but also enhance the enterprise’s self-repair ability in the face of emergencies and promote better recovery of the industrial chain.
First, based on the resource-based view (RBV) theory, a firm’s competitive advantage comes from the efficient use of scarce and irreplaceable resources (Barney, 1991) [28]. Industrial robots help improve resource efficiency through smart technologies. They optimize the allocation of production factors, which reduces energy consumption and waste. This not only lowers the environmental burden during production but also extends equipment lifespan and lessens the dependence on non-renewable resources. These effects align with the principles of the circular economy (Geissdoerfer et al., 2017) [29]. Second, according to the theory of dynamic capabilities, firms need to sense changes, respond quickly, and reconfigure resources to maintain their competitive advantage in a changing environment (Teece et al., 1997) [30]. The high flexibility and adaptability of industrial robots enable production systems to adjust rapidly to external changes, such as market demand fluctuations or industrial chain disruptions. This improves the adaptability and resilience of industrial chains under resource constraints and market volatility. It also helps avoid resource waste and overproduction, supporting stable operations and green transformation (Teece, 2014) [31]. Finally, from the perspective of the ecological modernization theory, technological innovation is seen as a key driver for solving environmental problems and achieving sustainable development. Industrial robots promote the deep integration of high-tech manufacturing and green production processes. They strengthen firms’ capabilities in using renewable energy and eco-friendly materials, pushing industrial chains toward greener and low-carbon development (Andersen and Massa, 2000) [32]. This innovation-driven green growth model not only boosts business competitiveness but also provides structural support for the long-term sustainability of industrial chains in the face of global climate change and resource constraints.
Hypothesis 1. 
Industrial robot penetration significantly impacts industry chain resilience. Industrial robots can significantly enhance industrial chain resilience by improving production efficiency, reducing errors during manufacturing, and increasing the flexibility and adaptability of the industrial chain. Based on the previous theoretical analysis and empirical evidence, we propose that the penetration of industrial robots has a significant positive impact on industrial chain resilience.
How can industrial robots enhance the development of industrial chain resilience? First of all, industrial robots enhance the overall resilience of the industry chain. They promote accelerated synergy between the manufacturing and service sectors, driving the industry toward higher-end development. The penetration of industrial robots enhances the automation level in the manufacturing industry. Additionally, they integrate deeply with the upstream, midstream, and downstream links of the manufacturing chain through productive service industries. For example, production process optimization, intelligent logistics, and other service industry areas have been able to seamlessly integrate with manufacturing, greatly enhancing the flexibility and adaptability of the industry chain. Chen et al. (2024) [33], taking listed companies in China’s service industry as an example, found that AI promotes shared prosperity among service industry enterprises, thereby laying the foundation for developing regional industry chains. According to Jacobe’s externality theory, with the advancement of economic globalization, the differences and diversity between different industries create the conditions for knowledge spillover, which promotes the collaborative innovation of advanced manufacturing and production service industries. The knowledge spillover effect not only enhances the speed of technological innovation but also optimizes the allocation of resources, making the manufacturing and service industries more closely integrated. The deepening of industrial integration means that the boundaries between different industries are gradually blurred, and resources and technology can flow flexibly between the manufacturing and service industries, which improves the resilience of the industrial chain to external shocks. Autor et al. (2003) [34] believe that the integration of the manufacturing and service industries has raised the level of automation, which significantly reduces labor demand. This trend has not only weakened firms’ dependence on a single link but also enhanced their ability to allocate and manage resources within the supply chain, thereby improving their ability to cope with external market changes and supply chain disruptions.
Second, the enhancement of urban innovation vitality is a crucial factor. It allows industrial robot penetration to drive the resilient development of the industrial chain. Schumpeter’s new economic theory argues that the value of innovations can be realized only in the process of diffusion and application (Schumpeter and Opie, 1934) [35]. With the wide application of industrial robots in different cities and regions, the city’s innovation vitality has been increasing, especially in technology-intensive cities, which have formed regional innovation clusters by attracting high-end manufacturing enterprises and scientific and technological innovation talents through robotics. Through this clustering effect, cities are not only able to promote the rapid transformation of scientific and technological achievements but also provide better innovation infrastructure and resource support for the integration of the manufacturing and service industries. This enhancement of regional innovation capacity drives technological breakthroughs in manufacturing enterprises. It also fosters the development of the industrial chain towards higher value-added and greater resilience. Based on the data of industrial robots in China, Liu et al. (2020) [36] discovered that the development of industrial robots plays a crucial role in advancing technological innovation within enterprises, particularly in high-tech industries. Robotics accelerates technological iteration, enhancing the flexibility and resilience of businesses in adapting to market changes and supply chain fluctuations. Such technological innovation is not only reflected at the individual level of enterprises but also promotes the optimization of the entire economic structure and contributes to the regional and national industrial chain with stronger resilience in the face of external shocks.
In summary, industrial robots significantly enhance the resilience of the industrial chain by promoting the industrial integration of the manufacturing and service industries and enhancing the innovation capacity of cities, and the dual mechanisms work together. Industrial integration optimizes resource allocation and increases the flexibility of resource and technology flow between industries. Meanwhile, urban innovation vitality offers an external impetus for the technological transformation of the industrial chain. Together, these factors enhance the resilience of the industrial chain, providing a stronger foundation to cope with global economic fluctuations. Based on this, this paper proposes the following assumptions.
Hypothesis 2. 
Industrial robot penetration promotes industry chain resilience through two mechanisms: industrial integration and urban innovation dynamics. In the previous discussion, we showed that industrial robots not only promote the deep integration of manufacturing and services but also boost innovation at the city level. Based on both theory and empirical analysis, we propose that the penetration of industrial robots strengthens industrial chain resilience by driving industrial integration and enhancing urban innovation capacity.
The spatial spillover effect of industrial robot penetration on industry chain resilience manifests in several areas. Geographic proximity and the sharing of technology resources play key roles. These factors can foster interregional collaborative innovation and facilitate knowledge spillover. Tang et al. (2022) [37] have found that geographic proximity can promote collaborative innovation among enterprises, which in turn promotes the development of industrial agglomeration and the regional industrial economy. This agglomeration effect is not only limited to interactions within a single industry but also enhances the innovation capacity and stability of the industrial chain of the whole region through cross-industry knowledge sharing and technology diffusion. Goldfarb and Tucker (2019) [38] further point out that the development of the digital economy has the same significant spatial spillover effect. Carlino and Kerr (2015) [39] examine the manufacturing industry from the perspectives of spatial agglomeration and innovation. They analyze the spatial spillover effects and internal mechanisms of manufacturing development. Their findings suggest that spatial agglomeration not only fosters innovation activities but also enhances industry chain resilience through knowledge flow and technology spillover.
Industrial robots facilitate industrial agglomeration and growth in the region and its surroundings by fostering interactions among technology, talent, and capital with neighboring areas. This agglomeration effect not only makes the technology spillover effect more obvious but also raises the competitive pressure among enterprises, prompting them to continuously improve their productivity and innovation ability, forming a virtuous cycle. Liu and Zhang (2021) [40] argue that the spatial agglomeration of the manufacturing industry has a significant contributing effect on the resilience of the manufacturing industry, but there is urban heterogeneity. This means that different regions will show different expressiveness in absorbing the spillover effects of industrial robotics.
In summary, industrial robots, as an emerging technology, promote the industrial agglomeration and development of the region through the exchange of talent resources, technology resources, and capital with neighboring regions and generate technological spillovers. At the same time, technological spillover will also cause inter-industry competition, and enterprises will continue to improve their own production efficiency in order to obtain higher returns, which in turn will boost the level of regional industrial chain resilience. Based on this, this paper puts forward the following hypothesis.
Hypothesis 3. 
Industrial robot penetration generates a spatial spillover effect on the development of industry chain resilience. Spatial spillover effects are an important sign of industrial clustering and resource sharing. Industrial robots interact with nearby regions through technology, talent, and capital. This promotes regional industrial clustering and strengthens industrial chain resilience through technology spillovers. Therefore, we propose that the penetration of industrial robots has significant spatial spillover effects.

3. Research Design

3.1. Formulation of the Empirical Model

To comprehensively examine how industrial robot penetration influences industrial chain resilience, this study adopts several econometric models, which are organized as follows:
First, to test Hypothesis H1 and determine if industrial robot penetration significantly enhances industrial chain resilience, a baseline regression model is employed. The model controls for the economic development level, the marketization degree, technological innovation capacity, human capital accumulation, residents’ income level, and fiscal investment. City fixed effects and time fixed effects are included to reduce potential omitted variable bias. The core explanatory variable is industrial robot penetration, and the dependent variable is the level of urban industrial chain resilience.
Second, given the heterogeneity of resilience across cities, focusing only on mean effects may overlook important distributional differences. Therefore, this study applies a quantile regression model, following Koenker (2004) [41]. Marginal effects are estimated at the 10th, 25th, 50th, 75th, and 90th quantiles to capture how the impact varies across different resilience levels.
Third, to verify Hypothesis H2 and determine whether industrial robot penetration promotes resilience through specific transmission mechanisms, an indirect effect model is constructed based on Baron and Kenny (1986) [42]. Stepwise regressions are used to test the effect of robot penetration on mediating variables, such as industrial intelligence and innovation output, as well as the impact of these mediators on resilience. This helps to identify the underlying transmission pathways.
Fourth, considering that the effect of robot penetration may be nonlinear, a threshold regression model is introduced. Potential threshold variables, such as the economic development level and industrial upgrading, are used to test whether the marginal effect changes significantly once certain conditions are met.
Fifth, to assess the dynamic effects of national policy interventions, such as smart manufacturing pilot programs, a staggered difference-in-differences model is applied, following Bertrand and Mullainathan (1998) [43]. The differences between the treatment and control groups before and after policy implementation are compared. A parallel trend test is conducted to confirm that both groups followed similar trends before the intervention.
Finally, acknowledging the potential spatial spillover effects of robot penetration through industrial chains or knowledge diffusion, a spatial Durbin model (SDM) is estimated based on the baseline model. Spatial weight matrices are constructed using three approaches, namely inverse squared distance, inverse distance, and a combined geographic–economic structure, to ensure the robustness of the findings.
For conciseness and clarity, detailed mathematical formulations, variable definitions, and derivations are presented in Appendix A.

3.2. Variable Settings

3.2.1. Core Explanatory Variable

The core explanatory variable is the penetration of industrial robots at the city level in this paper. Since 2013, China’s industrial robot market has consistently ranked first in the world in terms of sales. A total of 268,195 new industrial robots were installed in China in 2021, representing a strong growth of 51%, and for the first time, China accounted for more than 50% of the global market, reflecting that China’s manufacturing industry is rapidly developing towards automation. Acemoglu and Restrepo (2020) [25], in their study of the influence of industrial robots on the U.S. labor market, constructed an indicator of the density of robots at the regional level in the U.S. based on the idea of “Bartik instrumental variables”, which are widely recognized and use (Goldsmith-Pinkham et al., 2020) [44].
Drawing on the methodology of Acemoglu and Restrepo (2020) [25], firstly, this paper matches the industry classification of the IFR data with that of statistics from China’s second economic survey. So, we can obtain data on the amount of industrial robots installed and stocked in each industry in China in the current year and calculate the penetration of industrial robots at the industry level. Further, we choose 2008 (the year of statistics from China’s second economic census) as the base year to calculate the weights of industrial robot penetration in each industry in China’s Yangtze River Delta cities, and finally, we calculate the penetration of industrial robots in each city in each year using the following formula:
R o b o t i t = s = 1 S e m p l o y s , i , t = 2008 e m p l o y i , t = 2008 × S t o c k s t e m p l o y s , t = 2008
where s denotes the manufacturing industries; Robotit means the industrial robot penetration of city i in year t; Stockst implies the robot stock of industry s in year t; employs,t=2008 indicates the employment of industry s in 2008; Stockst/employs,t=2008 denotes the industry-level robot density indicator in each year; employs,i,t=2008 is the employment of industry s in city i in 2008; and as the weight of the robot penetration of each industry, employs,i,t=2008/employi,t=2008 is the ratio of the employment of industry s to the overall employment of city i. By weighting the penetration of industrial robots in each industry, the penetration of industrial robots at the city level is obtained.

3.2.2. Explained Variable

Given that the industry chain is a complex multi-dimensional system, it is difficult to provide a comprehensive measure of the regional industrial chain resilience level using one indicator. Therefore, this paper selects indicators according to two selection criteria: policy proposal and theoretical foundation. Firstly, the policy proposed refers to the measures on industry chain resilience and security mentioned in government documents, such as “the Pain Points, Blockages, and Countermeasures Suggestions for Safeguarding the Security of the Industry Chain Supply Chain” issued by the Price and Cost Investigation Center of the National Development and Reform Commission in 2021, which provides a detailed definition of the connotation of industry chain resilience. Secondly, the theoretical basis refers to the industry chain indicator system constructed with reference to Liu et al. (2020) [36]; this paper categorizes industry chain resilience into three dimensions, namely industry chain resisting power, industry chain recovery power, and industry chain sustainable power, and selects 14 sub-indicators to build a comprehensive industry chain resilience index system. The economic meaning of each secondary and tertiary indicator is given below:
Among them, industry chain resistance reflects the ability of the industry chain to maintain its stability and prevent the industry chain from breaking when it suffers a shock. Manpower quality (manufacturing employment and total manufacturing profits) represents the health of labor and capital allocation within the industrial chain. Industrial foundation (number of industrial enterprises above scale and total industrial output value above scale) reflects the diversity and scale of industrial chain nodes.
The recovery of the industry chain demonstrates its ability to adjust to the impact and restore economic functions swiftly. Industrial structure (the rationalization of industrial structure and advanced industrial structure) shows the flexibility of structural adjustment and upgrading within the industrial chain. Industry benefits (local general public budget expenditure, local general public budget expenditure, fixed asset investment, and foreign direct investment contract projects) captures the ability to mobilize resources and attract investment during recovery.
Industry chain sustainability reflects the ability of the industry chain to optimize and upgrade in the face of the crisis. Digital leadership (internet broadband access subscribers and the number of patents granted) represents the capacity of digital infrastructure and technological innovation. Science expenditures refers to the investment in innovation resources that support the long-term development of the industrial chain. Pollution emission (environmental regulations) reflects the industrial chain’s ability to achieve green transformation and sustainable growth.
Considering that the entropy weight method assigns weights based on the internal variation in each indicator, it is highly objective and helps avoid biases from subjective weighting, making it particularly suitable for multi-indicator comprehensive evaluation problems. This paper adopts this method to measure the industry chain resilience index of 104 cities in China’s Yangtze River Delta region from 2006 to 2021 (ICR). Indicators are presented in Table 1.
Using the Theil index, this paper measures the degree of rationalization of the industrial structure of 104 cities in the Yangtze River Delta region with the following formula:
t h e i l i ,   t = m = 1 3 y i ,   m ,   t ln ( y i ,   m ,   t / l i ,   m ,   t ) , m = 1 , 2 , 3
where yi,m,t denotes the proportion of the m industry in GDP during the t period, li,m,t indicates the proportion of the number of employees in industry m to the total number of employees during the t period. If the value is not 0, it suggests that the industrial structure is out of balance and is characterized by an imbalance in industrial composition. The advanced industrial structure can be quantified as the ratio of value added in the tertiary industry to value added in the secondary industry. Environmental regulation is measured by the integrated industrial solid waste utilization rate indicator.

3.2.3. Control Variables

The resilience of the industry chain can be constrained by a variety of control factors, such as economic development and the market. Therefore, in order to improve the precision of the regression results, this paper uses a set of control variables to overcome the problem of omitted variable bias. The level of economic development (Eco) can be expressed as per capita GDP and is taken as a logarithm. The marketization level (Mar) can be represented as urban private and self-employed persons/urban employed persons. The level of science and technology (Tec) can be expressed as science and technology expenditure/general government expenditure. The level of human capital (Peo) can be expressed as the ratio of students enrolled in general colleges and universities to the total population at year-end. Data on the per capita disposable income of urban residents (Inc) are directly accessible. Fiscal investment (Inv) can be expressed as investment in fixed assets/general government fiscal expenditure.

3.2.4. Mechanism Variables

(1) City innovation vitality: Urban innovation vitality reflects a city’s overall ability in knowledge creation, technology transformation, and entrepreneurial activities. Industrial chain resilience relies on continuous technological innovation and the emergence of new industries, and cities with higher innovation vitality are better able to quickly adjust and upgrade in the face of shocks (Audretsch, 1995; Breschi and Malerba, 2001) [45,46]. Drawing on Kou and Liu’s (2017) [47] calculation method, we take the invention-authorized patents of the State Intellectual Property Office of China as the research object and accumulate the value of each patent at the city level so as to obtain the city innovation index. We use the data of new enterprises in each city to measure other types of innovation output and sum up the registered capitals of the new firms in each city to form the city entrepreneurship index. Then, we calculate the average of the rankings to obtain the final result.
(2) The integration of the two industries: The advanced manufacturing sector and the contemporary service industry present a dynamic and coordinated relationship of interdependence and common development (Kelle, 2013) [48]. This paper establishes two sub-systems of the coordinated development model of the advanced manufacturing industry (Z) and the productive service industry (S), with a total of 20 indicators, and calculates the coupled coordination degree of the two systems according to the coupled coordination model with the following formula (Wang et al., 2021) [49]:
C = i = 1 n U i 1 n i = 1 n U i n 1 n , T = i = 1 n α i × U i , i = 1 n α i = 1 , D = C × T
where n denotes the number of sub-systems, Ui is the value of each sub-system, and the distribution interval is [0, 1]. The larger the value of C, the smaller the degree of discretization between sub-systems and the higher the degree of coupling. αi is the weight of the ith sub-system, which usually takes the same weight.

3.3. Data Sources

This paper takes the panel data of 104 cities in China’s Yangtze River Delta region from 2006 to 2021 as the research sample. The relevant raw data mainly come from the National Bureau of Statistics, China’s Science and Technology Statistical Yearbook, China’s Tertiary Industry Statistical Yearbook, China’s Urban Statistical Yearbook, etc., and some of the missing data are made up using linear interpolation. The data used in this paper to calculate the penetration of industrial robots at the city level are mainly IFR robotics data and the Second National Economic Census data. IFR provides robot stock data by country, industry, and year and new installation data in the current year, which specifically contain information on the installation of industrial robots in more than 50 countries in the period of 1993–2021. There are seven specific categories. In 2008, the National Bureau of Statistics (NBS) surveyed all legal entities, industrial activity units, and individually owned households engaged in the secondary and tertiary industries in China, which involved 30 provinces across the country and totaled about 5 million individuals. The data include the administrative category code, the administrative division code, and the year-end workforce count for each enterprise. Based on these data, this paper measures the penetration of industrial robots in each prefecture-level city in combination with IFR data (Acemoglu and Restrepo, 2020) [25].

4. Empirical Finding Analysis

4.1. Descriptive Statistics for Variables

First, the existence of multicollinearity between the explanatory variables was tested. The results show that the total VIF value and the VIF value of individual explanatory variables are less than three, which indicates that there is no significant multicollinearity. Further, since the p-value of the Hausman test is 0.0375, which is significantly smaller than 0.05, the original hypothesis is rejected, so the fixed effect model is selected. The descriptive statistics of all variables are shown in Table 2. As shown in Table 2, the minimum value of industry chain resilience is 0.0209, while the maximum value is 0.4053. So, this implies that the overall level of industry chain resilience in China’s Yangtze River Delta region is not high at this stage.

4.2. Baseline Regression

Table 3 presents the results of the benchmark regression of industrial robot penetration on industry chain resilience. Column I presents the regression results without control variables and without fixing time and individuals. The coefficient associated with the core explanatory variable Robot is markedly positive at the 1% level, suggesting that industrial robot penetration can promote industry chain resilience. In order to eliminate the interference of economic and social development factors on the empirical results as much as possible, column II shows the regression results after adding control variables such as the level of economic development (Eco) and not fixing the year and individual. Column III gives the regression results of fixing years but not fixing individuals after adding control variables. Column IV reports results with control variables and fixed years and individuals.
As can be seen from columns II–IV, the level of economic development (Eco) is negative, indicating that the current economic system is not yet able to provide financial security for the industry chain to effectively respond to risks. The coefficients of Tec and Peo are both significantly positive, which shows that they have a positive impact on the development of industry chain resilience. Mar has a significant negative effect on the level of industry chain resilience development but accounts for a relatively small proportion, suggesting that excessive market intervention will instead inhibit industry chain resilience development. The coefficient of Inv is positive but not significant, implying that it cannot incentivize the enhancement of the industrial chain level. As can be seen from Table 3, the regression coefficients of industrial robot penetration are significantly positive across all four models, indicating that industrial robot penetration significantly enhances industrial chain resilience. This result is consistent with agglomeration theory and studies on how automation promotes productivity growth. It suggests that industrial robot penetration can reduce uncertainties and internal and external risks within the industrial chain, improve firms’ production efficiency, strengthen their ability to cope with market fluctuations, and provide new momentum for the security and stability of the industrial chain. Therefore, industrial robot penetration is an important factor in promoting the development of industry chain resilience, and Hypothesis 1 is proven.

4.3. Panel Quantile Regression

To further explore the marginal impact of industrial robot penetration on industry chain resilience under different industry chain resilience levels, this paper establishes a panel quantile regression model, and the regression results are shown in Table 4. As shown in Table 4, the overall impact of industrial robot penetration on industry chain resilience is positive. The quantile regression results show that in regions with lower industrial chain resilience (at the 10–25% quantiles), the positive effect of industrial robot penetration is limited. This may be due to weaker infrastructure and lower technological adaptability, which prevent robots from fully realizing their potential. At the 50% quantile, the regression coefficient for robot penetration is the smallest and not significant, suggesting that the issue of “carbon lock-in” still exists in the current development of industrial chains, hindering the break from old path dependencies. In regions with higher resilience (at the 75–90% quantiles), the positive effect of robot penetration on industrial chain resilience is significantly stronger, indicating that more resilient regions can utilize robotics more effectively and develop innovation-driven growth models. The empirical results show that the widespread use of industrial robots reduces production costs, improves efficiency and resource utilization, and promotes technological development. This finding highlights the path-dependent nature of technology diffusion, suggesting that policymakers should focus on building adaptive capacity in regions with weaker technological foundations when promoting robot penetration.

4.4. Mechanism Testing

On the basis of the benchmark regression model, this paper takes the integration of the advanced manufacturing and modern service industries (referred to as the integration of the two industries) and urban innovation vitality as the mechanism variables to construct the indirect effects model and then tests the impact of industrial robot penetration on industry chain resilience. The regression results are shown in Table 5.
From columns I and III of Table 5, it can be seen that the estimated coefficients of industrial robot penetration on the integration of two industries are markedly positive at the 1% level. Additionally, the estimated coefficients on urban innovation vitality are also markedly positive at the 1% level. This suggests that industrial robot penetration significantly optimizes the regional industrial structure, which in turn improves capacity utilization, strengthens the integration of advanced manufacturing and modern productive services, and ultimately enhances regional innovation capabilities. From the estimation results in columns II and IV, intermediary indicators enhance the positive effect of industrial robot penetration and have different degrees of influence on the level of industry chain resilience. Specifically, the mediating effects of two-industry integration and urban innovation vigor account for 0.07% and 3.53% of the total effect.
The above results show that both two-industry integration and the innovation index have a direct positive effect. This effect is on the development level of regional industrial chain resilience. The penetration of industrial robots can enhance industry chain resilience through the paths of promoting the integration of two industries and improving the city’s innovation capacity. This conclusion verifies Hypothesis 2.

4.5. Threshold Effect Analysis

In order to further verify whether there is a nonlinear dynamic evolutionary relationship between industrial robot penetration and industry chain resilience, this paper takes Peo, Inno, Tec, and Inv as the threshold variables and analyzes them using the threshold regression model introduced by Hansen (1999) [50]. In addition to this, 300 samples were taken using the bootstrap method to verify the number of thresholds and significance, and the results of the test of the number of thresholds are shown in Table 6. As can be seen from Table 6, the single threshold effect and double threshold effect of the threshold variables both pass the 5% significance level, but none of them pass the triple threshold effect.
Due to space constraints, only the threshold estimation graph of the LR test with Peo as the threshold is released. From Figure 1a, the first threshold value of human capital is 0.0247 below the dotted line, and from Figure 1b, the second threshold value is 0.054 below the dotted line, and the estimation of the thresholds aligns with the actual value.
Table 7 gives the results of the threshold regression for the relationship between industrial robot penetration and the level of development of industry chain resilience. From column I of Table 7, when the innovation index is in the lower development range (Inno ≤ 80.9791), the regression coefficient is 0.0009 and is significant at the 5% level; when the innovation index is located in the medium development range (80.9791 < Inno ≤ 172.5112), the regression coefficient is 0.0039 and is significant at the 1% level; when the innovation index is located in the higher development range (Inno > 172.5112), the regression coefficient continues to increase to 0.01 and is significant at the 1% level. This finding shows that the impact of robot penetration on industrial chain resilience depends on innovation. Only when a region’s innovation level reaches a certain point can robots fully realize their potential. This result has important implications for regional economic development strategies. In areas with lower innovation levels, simply promoting robot use may have limited effects. Policies should focus more on strengthening the technological foundation, such as building smart manufacturing parks or offering technical training. In areas with higher innovation levels, robot penetration has become a key driver for upgrading industrial chains. Therefore, it is important to encourage deeper integration between robotics, advanced manufacturing, and the digital economy to further enhance industrial chain resilience.
As can be seen in column II, the regression coefficients increase for each threshold crossing of Peo and show significant positive effects at the 1% level, implying that the positive effect of industrial robot penetration on the resilience of the industry chain is more pronounced in regions with more abundant human capital. It can be concluded that the rapid development of the education and healthcare sectors has increased the level of human capital, which improves the quality of workers’ physical fitness knowledge and ability and thus increases labor productivity. In addition, the level of human capital also positively affects neighboring regions, which helps maximize efficiency and ultimately promotes industry chain resilience. The regression coefficients in columns III-IV also increase steadily in the same way and are significantly positive at the 1% level after crossing a certain threshold, indicating that the positive contribution of industrial robot penetration to the industry chain is greater in regions with developed technology levels and high per capita incomes. These regions tend to gather more resources, thus driving the development of related industries and facilitating the enhancement and modernization of the industrial structure. These findings suggest that promoting human capital accumulation, increasing investment in technology, and raising income levels are crucial for building a highly resilient industrial chain.

4.6. Endogeneity Test

4.6.1. Permutation Test

Permutation testing is a common robustness check used to assess the stability of research results by randomly reshuffling the sample data. The results of the permutation test are given in Table 8. From Table 8, T = 0.0019 > 0. After replacing the sample order 500 times, the statistical test was recalculated. It is found that the t-values were all less than 0.0019 with p = 0.0000, indicating that the results are robust. Therefore, this test effectively rules out the influence of possible concurrent events and further confirms the reliability of the results.

4.6.2. Instrumental Variable Test

Due to rapid economic advancement, industry chain resilience is increasing. Therefore, economically developed and industry-rich regions choose more efficient production methods, prompting local governments to encourage enterprises to introduce robotic equipment by means of financial subsidies and innovation support in order to realize the improvement of the manufacturing level. This shows that there may be a reverse causality between industrial robot penetration and industry chain resilience.
Instrumental variable (IV) testing is one of the key methods to address endogeneity. Drawing on Acemoglu and Restrepo (2020) [25], this paper uses the mean of robot penetration of China’s industrial robot import source countries (the United States, Japan, Germany, Sweden, and South Korea) as an instrumental variable (Bartikstall), which is calculated as follows:
P R i m , j i = s = 1 S e m p l o y s , j , t = 2008 e m p l o y j , t = 2008 × R o b o t i m s t e m p l o y s , t = 2008
B a r t i k s t a l l = 1 5 ( P R u s j t + P R j p j t + P R g e j t + P R s w j t + P R k r j t )
where s denotes each industry, R o b o t i m s t is the stock of robots in industry s in year t in the source country, e m p l o y s , t = 2008 is the number of people employed in industry s in China in 2008, and e m p l o y j , t = 2008 is the number of people employed in city j in China in 2008, and an instrumental variable is constructed using the mean of the data from the five importing source countries.
In addition, this paper uses data on the stock of industrial robots in Sweden, one of the importing source countries, as another instrumental variable (SW_bartikstock). Instrumental variables need to satisfy both correlation and exogeneity. Goldsmith-Pinkham et al. (2020) [44] argued that it is sufficient for either of the external shocks to satisfy Bartik’s instrumental variables (industrial robot density) or the employment share to satisfy the condition of exogeneity. Borusyak et al. (2022) [51] equated the uncorrelation between the instrumental variables and the error term at the regional level to that at the industry level. This paper uses a single employment structure for 2008 in its construction, which provides some indication that the exogeneity condition is satisfied.
Table 9 gives the regression results for the instrumental variables, as indicated in columns I and III of Table 9; the regression instrumental variables are all markedly and positively correlated with urban industrial robot penetration (Robot) in the first stage, and the Cragg–Donald Wald F statistic and the Kleibergen–Paap Wald rk F statistic are both much larger than the empirical thresholds, rejecting the original hypothesis of weak instrumental variables. Furthermore, the Kleibergen–Paapr k LM statistic is p < 0.01, which rejects the initial hypothesis of instrumental variables’ under-identification. As can be seen from columns II and IV, the second-stage regression industrial robot penetration is significantly positively correlated with industry chain resilience, which aligns with the baseline regression findings of this study. This result further strengthens our conclusion that industrial robot penetration promotes industrial chain resilience. It also shows that the instrumental variable we use is exogenous and effectively controls for potential endogeneity bias.

4.6.3. The Dependent Variable Lagged One Period

Considering that the installation and use of robots is a gradual process, and the development of industrial chain resilience also requires time to build up, we include the one-period lag of industrial chain resilience as a test variable. From column V of Table 9, the test results are consistent with the baseline regression, indicating that our findings are robust and that introducing the lagged effect does not alter the core conclusion.

4.6.4. Propensity Score Matching

Propensity score matching (PSM) is a common method used to reduce selection bias. In this test, we divide the Yangtze River Delta cities into high- and low-concentration groups based on the median level of industrial robot penetration. Using nearest-neighbor matching, we control for potential differences between samples. As shown in Column VI of Table 9, after controlling for other variables, cities in the high-concentration group show a significant improvement in industrial chain resilience compared to those in the low-concentration group. This effect is significant at the 10% level. These results further confirm the positive impact of industrial robot penetration on industrial chain resilience.

4.6.5. Exogenous Pilot Shock

To further test the exogeneity of industrial robot penetration, we use the carbon trading pilot policy (Liu et al., 2023) [52], the “Broadband China” policy (Xin, 2023) [53], and the innovative city policy as quasi-natural experiments. Table 10 reports the regression results. It shows that cities covered by these pilot policies have higher levels of industrial chain resilience than non-pilot cities, and the differences are significant at the 5% level. This suggests that setting up pilot zones can clearly promote the development of industrial chain resilience.
The premise of the validity of the DID method is to pass the parallel trend test, and the common trend graph of the pilot low-carbon city policy is given, as shown in Figure 2a. From Figure 2a, before the implementation of the low-carbon city policy, the level of industry chain resilience is not significantly different in the two groups. However, after the implementation of the policy, the level of industry chain resilience in the treatment group rises significantly compared with the control group, which shows that the pilot low-carbon city policy has a sustained role in fostering the development of regional industry chain resilience. The hypothesis of the common trend is established.
To show that the impact of the low-carbon city pilot policy on industrial chain resilience is not driven by random factors, we follow La Ferrara et al. (2012) [54] and conduct a placebo test. The results are shown in Figure 2b. The estimated coefficients are roughly normally distributed, and most are not significant at the 10% level. This suggests that the observed effect is not due to chance. Therefore, the results from the pilot policy shocks provide external support for our main conclusion.

4.7. Robustness Testing

For the consideration of ensuring the robustness of the baseline regression results, this paper also undertakes the following: (1) Explanatory variable lagged one period: since industrial robot penetration takes time, the lagged one-period independent variable is selected for regression. (2) Replacement of industrial robot penetration indicators: the industrial robot stock indicator is used to measure the level of robot application in China. (3) Regress the stock of industrial robots (Stock) after the one-period lag. (4) Add city-level control variables (degree of openness to the outside world (the ratio of total imports and exports to gross regional product) and employment structure (the ratio of tertiary industry employment to total employment)), and the two variables are denoted by open and job. (5) Tailoring: to mitigate the impact of extreme outliers, all variables are subjected to 1% shrinkage. The results of the robustness test are shown in Table 11, where the regression coefficients of the explanatory variables are always markedly positive at the 5% level, as shown in columns I–V of Table 11, showing that the results of the benchmark regression are robust.
On this basis, this paper draws on the methodology by Cinelli and Hazlett (2020) [55] to conduct omitted variable sensitivity analysis. It investigates what critical value the omitted variables have to reach to overturn the original results and whether the benchmark regression results are robust in the worst case scenario (where the omitted variable explains all the remaining variance in the industry chain resilience level). Inc is used as the reference variable. Figure 3 and Figure 4 represent the t-statistic results and the worst-case plots, respectively. As can be seen in Figure 3 and Figure 4, the sign of the coefficients of the benchmark model does not change even with the addition of Inc at three times the intensity in the standard model, suggesting that the estimation results are insensitive to the omitted variable problem, and the model remains robust.
To test whether the two-way fixed effects estimates are robust to heterogeneous treatment effects, De Chaisemartin and D’Haultfoeuille (2020) [56] provide the following two indicators:
σ ¯ f e = | β ~ f e | σ ( w ) ,   σ ̿ f e = | β ~ f e | T s + S s 2 / 1 P s 1 / 2
where the first indicator divides the absolute value of the two-way fixed effects estimates by the standard deviation of the weights. If it is very close to zero, the two-way fixed effects model is not robust, and the second indicator works similarly.
When using industry chain resilience as an explanatory variable for the measure, it is found that the standard deviation is close to zero, and the estimation results are not robust. Therefore, referring to the fuzzy double difference method proposed by De Chaisemartin and D’Haultfoeuille (2020) [56], we estimate the local average treatment effect for the promotion effect of industrial robot penetration on industry chain resilience, focusing on the local treatment effect of switchers. That is, the indicator variables for the change in processing status are the change in the resilience level of the industry chain resilience affected by industrial robot penetration in two adjacent periods and the first-order forward shift; the time variable is the year, and the processing variable is the penetration of industrial robots, and the selection of “time correction” and the corresponding covariate terms are adopted at the same time. The estimation results show that the p-value is equal to 0.03,which is significant at the 1% level, showing that although it is not possible to identify the average treatment effect across the entire sample, the localized treatment effect is relatively large for the study sample with a change in treatment status. To some extent, this has confirmed the positive impact of industrial robot adoption on the resilience of the industrial chain, as revealed by the benchmark results.

4.8. Heterogeneity Test

In order to study the impact of industrial robot penetration on industry chain resilience in different regions, this paper refers to the study by Yao (2020) [57] and others, which divides the Yangtze River Delta (YRD) urban agglomerations into provincial and non-provincial capitals, as well as central and peripheral cities. According to the “Eleventh Five-Year Plan for National Environmental Protection” issued by the State Council in 2007, the YRD urban agglomeration is divided into key cities for environmental protection and non-key cities for environmental protection. In order to examine the differences in the dividend effect caused by the implementation of the environmental protection tax under different industrial bases, the YRD urban cluster is divided into cities with old industrial regions and cities without old industrial bases based on the National Plan for the Adjustment and Transformation of Old Industrial Bases (2013–2022). The findings of the heterogeneity analysis are given in Table 12a,b.
As shown in Table 12a, compared with non-capital and non-central cities, the impact of industrial robot penetration on the level of industry chain resilience development is not significant or even inhibitory. It can be seen that these central and provincial capitals already have a mature economic development system, and the coordinated development of resources and industry is close to saturation, so if we continue to increase the placement of industrial robots, we may cross the saturation point, resulting in the less efficient use of resources. As shown in Table 12b, compared with the environmental protection non-focused cities and non-old industrial cities, industrial robot penetration in environmental protection-focused and old industrial cities has a smaller and non-significant impact coefficient on the development of the industrial chain, showing that the transparency of environmental information strengthens the supervision of environmental protection by the local government, which no longer takes industrial robots as the focus of the resources for the development of industries but shifts to more environmentally friendly new energy. Old industrial base cities are mainly heavy industry development, and some of them belong to the national key energy base, undertaking the production of major technical equipment. It is difficult to make the industrial enterprises introduce industrial robots to change the traditional mode of production, and forcing the introduction of industrial robots may have the opposite effect.

4.9. Spatial Durbin Model Analysis

Using the global spatial autocorrelation model, this article tests the spatial correlation characteristics of the development level of industry chain resilience in China’s Yangtze River Delta region. The global Moran’s I is calculated as follows (Xiong et al., 2019) [58]:
I = n i = 1 n j = 1 n W i j ( x i x ¯ ) ( x j x ¯ ) i = 1 n j = 1 n W i j ( x i x ¯ ) 2
where n is the total number of cities; xi and xj denote the industry chain resilience level of cities i and j, respectively; and x ¯ is the average value of industry chain resilience; Wij is the element of row i and column j in weight matrix W among 104 cities. The global Moran’s I index results are given in Table 13. From Table 13, the global Moran’s I index is significant in three different weight matrices, showing that there is a significant spatial autocorrelation in chain resilience.
Global Moran’s I measures spatial autocorrelation across an entire region. It shows whether similar values tend to cluster or spread out, highlighting overall spatial patterns. However, it assumes that spatial relationships are uniform across the area. This makes it less effective at detecting local differences. When spatial variation is strong, a single global measure may overlook important local patterns, like hot spots or cold spots. To address this, the local Moran’s I is used. It calculates a separate index for each location, showing how each area relates to its neighbors. This helps reveal clusters or outliers that the global index might miss. To further study the spatial characteristics of localized regions, this paper chooses the local Moran’s I (Zhang, 2018) [59], which is calculated as follows:
I = n ( x i x _ ) j = 1 n W i j n ( x j x _ ) i = 1 n n ( x i x _ ) 2
Due to space limitations, this paper only shows the results of the geo-economic nested multiplication matrix (W3), and the rest of the two spatial weighting matrices obtain the same results. The localized Moran scatter plots for 104 cities in the Yangtze River Delta in 2006 and 2021 are given in Figure 5. As depicted in Figure 5, the scatterplot divides the regions into four types of agglomerations: H-H (high-high), L-H (low-high), L-L (low-low), and H-L (high-low). The figures show that although most of the areas are in the L-L agglomeration area, the cities in the L-L area are moving towards the L-H area, and the cities in the L-H area are gradually moving towards the H-H area. In contrast, certain cities in Yunnan, Jiangxi, and Guizhou, such as Lijiang and Jingdezhen, form L-L agglomerations due to their own economic and industrial development constraints, more low-end manufacturing industries, and lower levels of industrial development in both their own and neighboring regions. Some cities in Yunnan, Anhui, and Hubei, such as Lishui and Xuancheng, are neighboring areas with developed industrial levels but have not yet developed into industrial high-quality areas due to their own weak absorptive capacity, thus forming L-H agglomerations. Certain cities in Sichuan and Hubei, especially the provincial capitals, despite having their own economy and high levels of industrial chain development, have not yet radiated to the neighboring underdeveloped areas, thus forming the H-L cluster area. Cities in Zhejiang and Jiangsu have formed H-H clusters due to their concentration of talent, capital, and industrial resources, resulting in high development levels in these and surrounding areas. The conclusions indicate significant spatial autocorrelation in the industrial chain resilience of cities across different provinces in the Yangtze River Delta. Different regions exhibit distinct clustering characteristics, so spatial factors are included in the model for empirical research.
This paper investigates the evolution of the spatio-temporal pattern of industrial resilience in the Yangtze River Delta city cluster under industrial robot penetration using ArcGIS 10.8. Figure 6 shows the spatial pattern of industrial chain resilience for 104 cities in 2006 and 2021. According to ArcGIS’s natural breakpoints, these cities can be categorized into five levels of industrial resilience. The trends from 2006 to 2021 indicate an overall increase in industrial resilience, with more high-quality clusters emerging in coastal regions and gradually spreading inward.
In this paper, the LM test (Elhorst, 2014) [60], the LR test, and the Wald test are conducted under three different spatial weight matrices, and the results reject the original hypothesis, so the SDM is chosen. Based on the results of Hausman’s test, this paper chooses the fixed effects model and finally uses the double fixed SDM by comparing the size of Log-L. The regression results of the spatial Durbin model are given in Table 14, from which we know that the coefficients of industrial robot penetration are all significantly positive, implying that industrial robot penetration helps to promote the development of the industrial chain level, and the spatial lag coefficient of industrial robot penetration is also markedly positive, suggesting that the penetration of industrial robots in this region promotes the development of the industrial chain level of neighboring regions. Therefore, Hypothesis 3 is verified.
In addition to this, according to the partial differentiation method proposed by LeSage (2009) [61], this paper decomposes the interaction information in the regression coefficients of the model into the total effect, the direct effect, and the indirect effect. Taking W3 as an example, the coefficients of the direct and indirect effects of industrial robot penetration are both significantly positive, indicating that an increase in the penetration of local industrial robots affects the penetration of industrial robots in neighboring regions to a certain extent, which in turn affects the level of local industry chain resilience. The indirect effect indicates that for every 1-unit increase in local industrial robot penetration, the industry chain resilience level of neighboring regions increases by 0.0068 units.

5. Concluding Remarks and Policy Implications

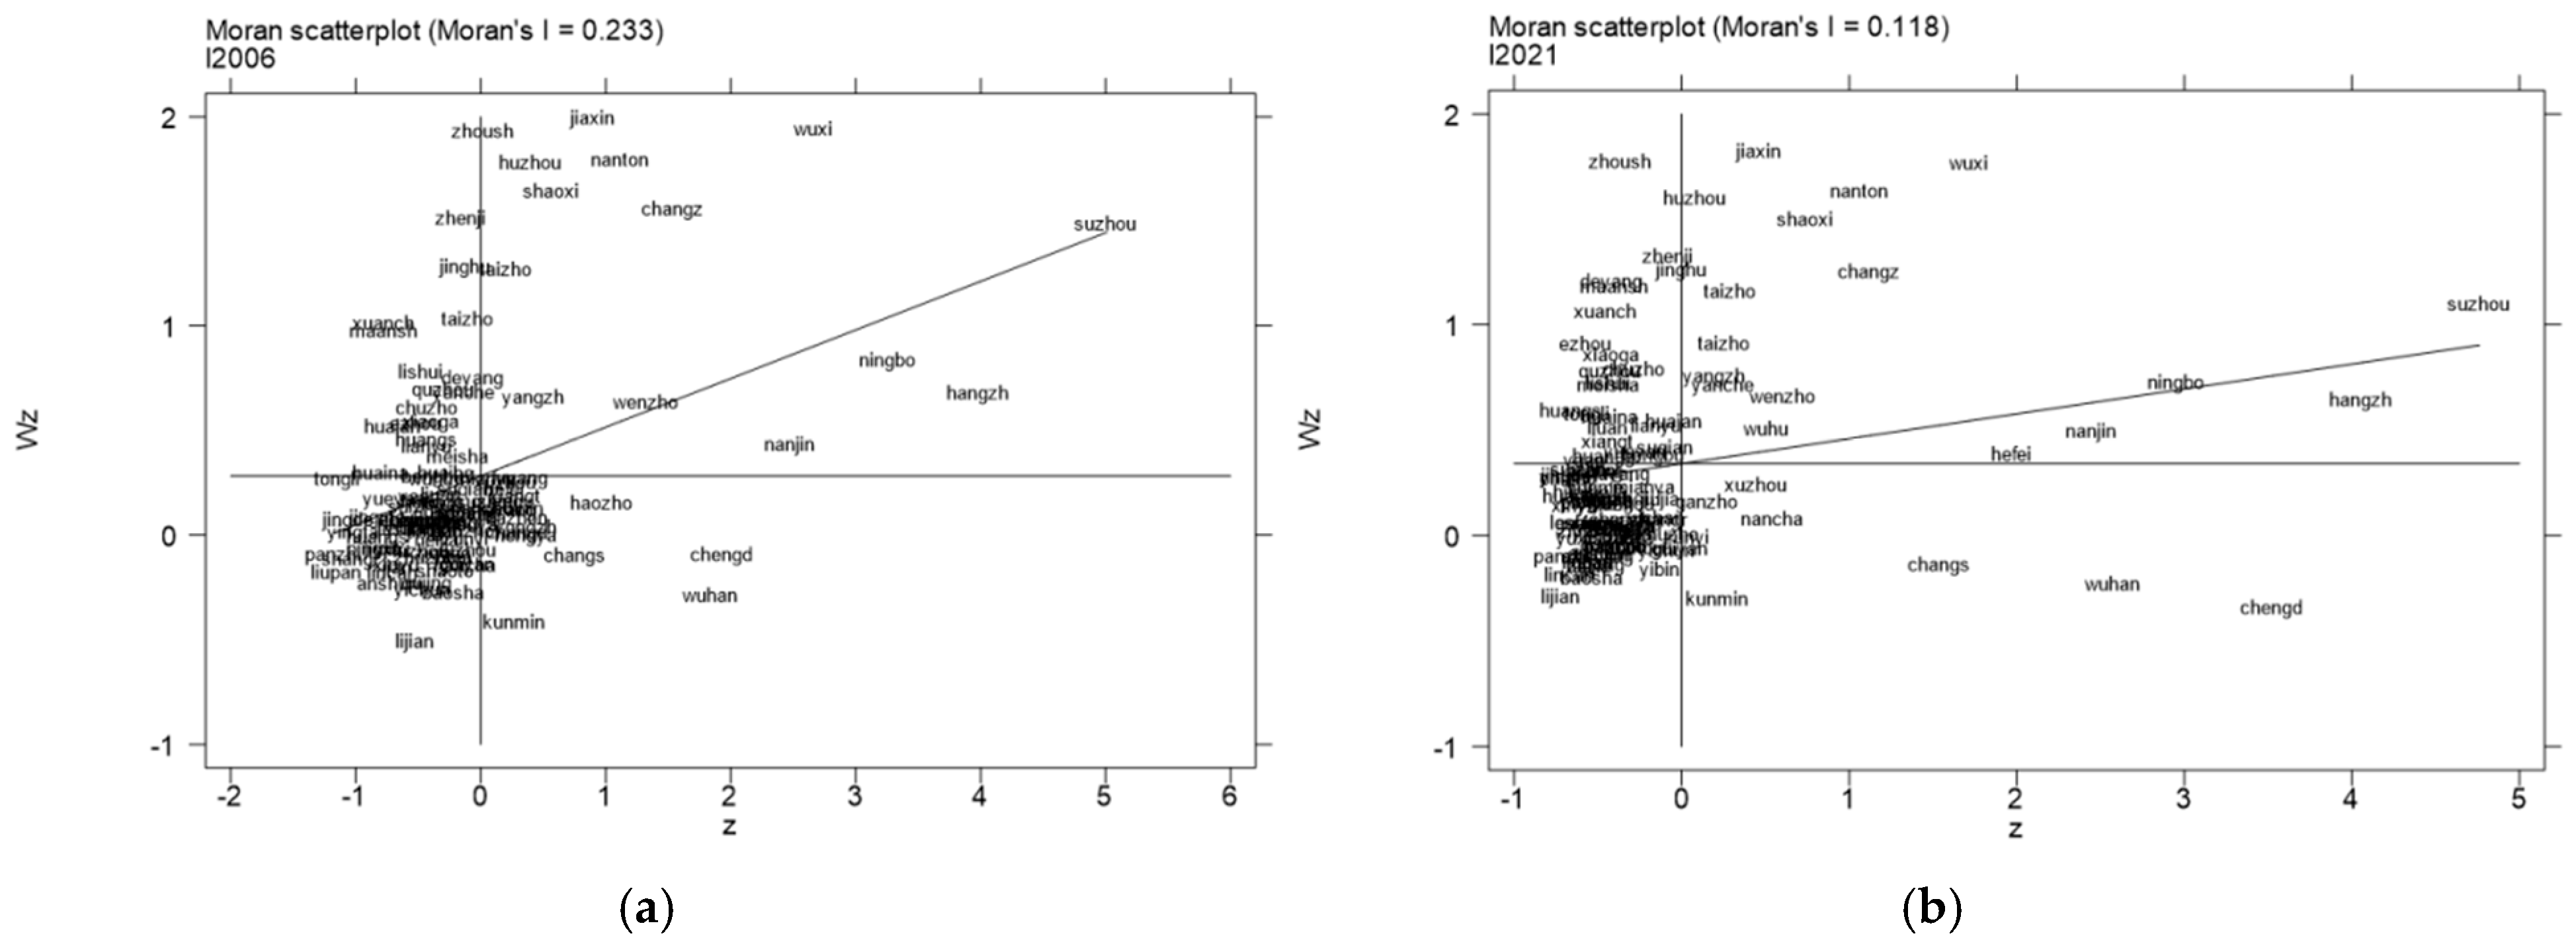
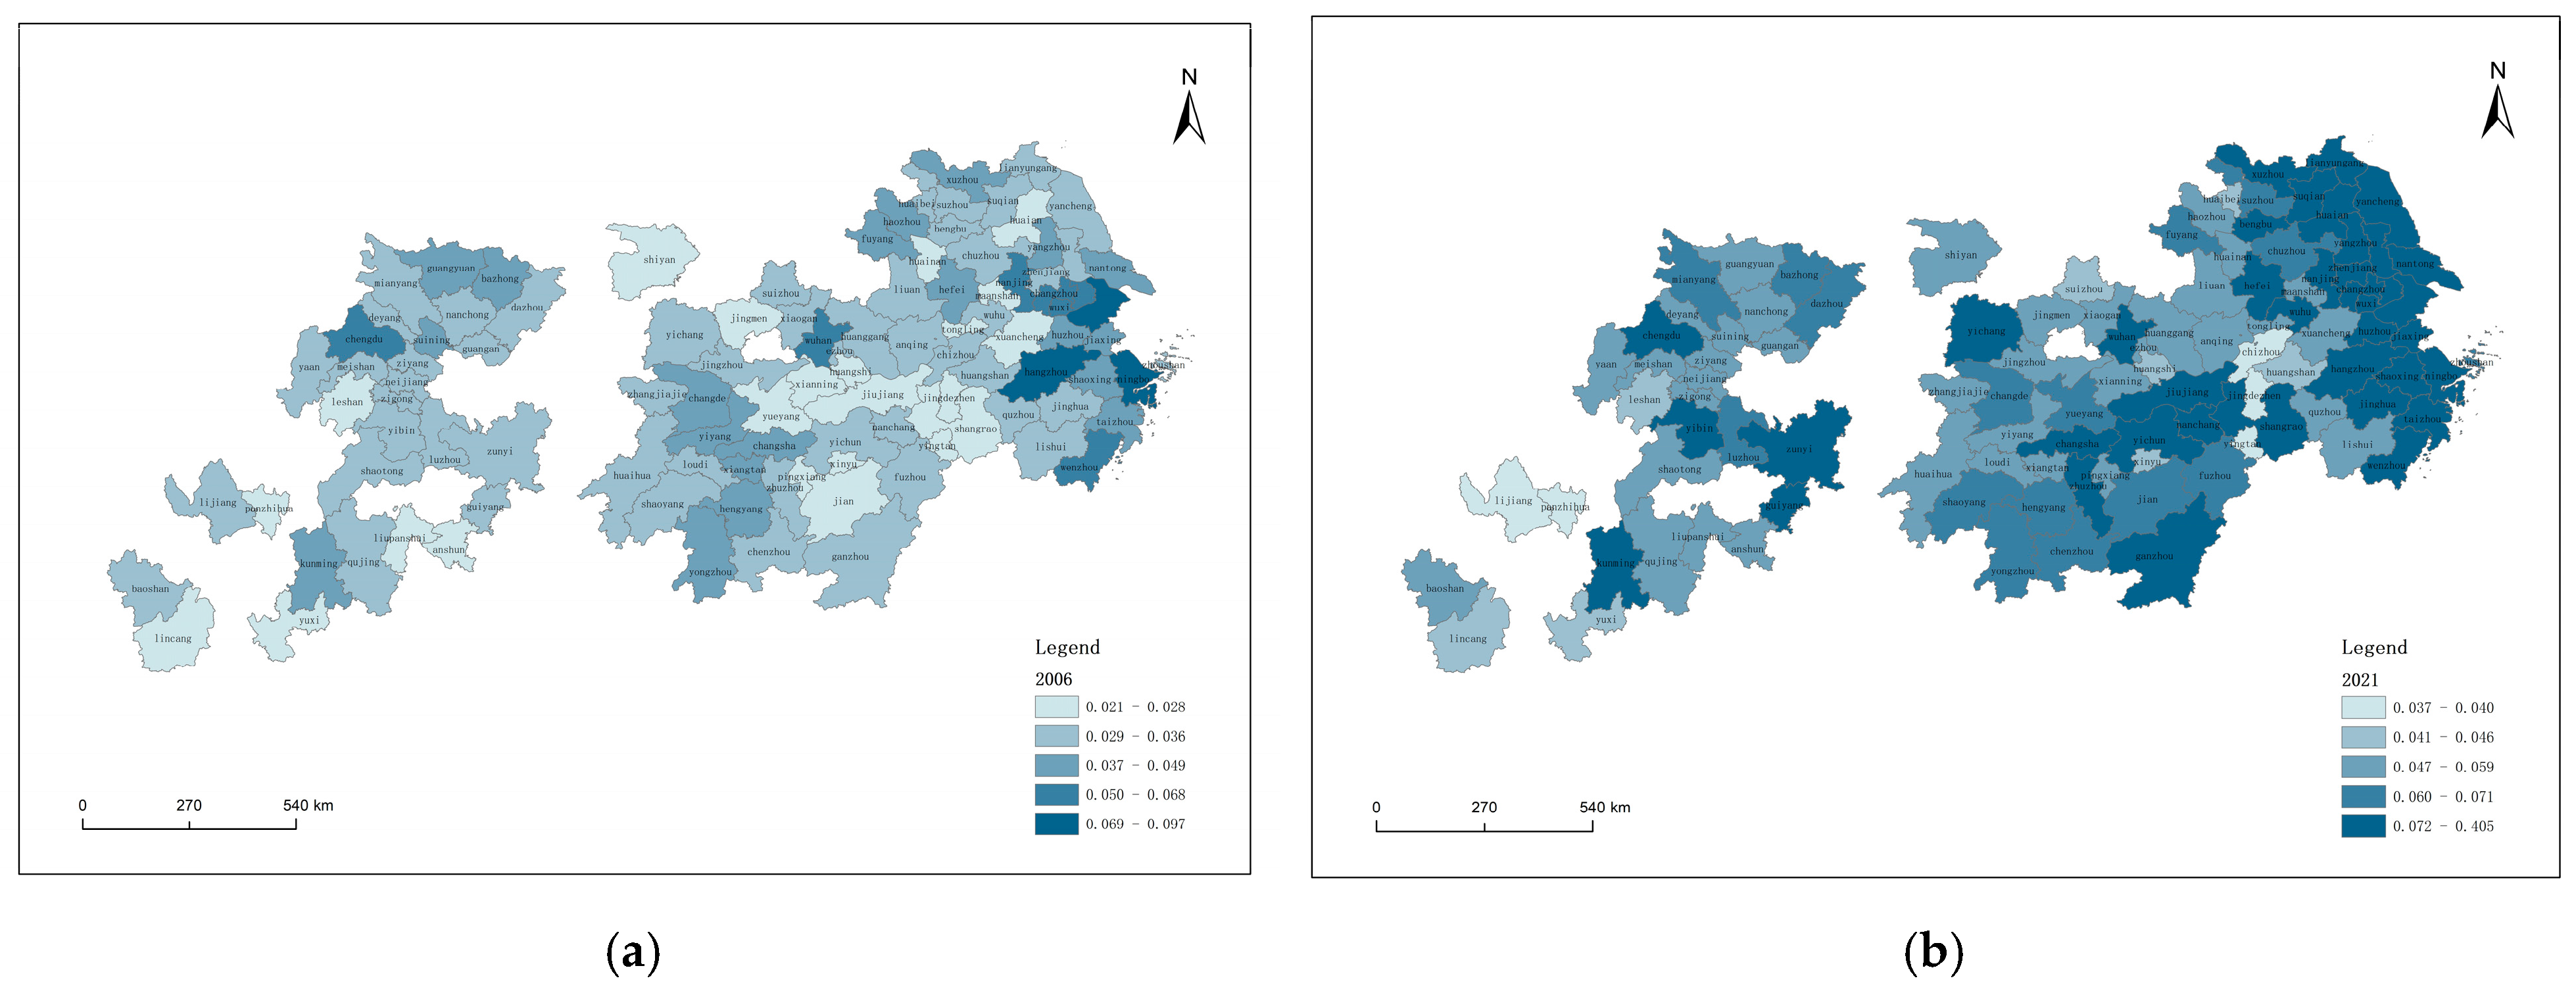
This paper empirically examines the driving mechanism and spillover effect of industrial robot penetration on regional industry chain resilience development based on the panel data of 104 cities in China’s Yangtze River Delta urban agglomeration from 2006 to 2021 using quantile regression, the indirect effects model, the threshold model, the multi-temporal difference model, and the spatial measurement model. The results show that, firstly, industrial robot penetration has a positive effect on industry chain resilience development, and the promotional impact is notably stronger within the upper quartile of the industry chain. Secondly, industrial robot penetration can enhance regional industry chain resilience development through the two mechanisms of two-industry integration and urban innovation vitality. Thirdly, through threshold effect analysis and a quasi-natural experiment design, urban innovation vitality, the human capital level, the science and technology level, and the disposable income of urban residents have a nonlinear significant impact on the development of the industry chain resilience level, and the government promotes the development of the industry chain through the introduction of “low carbon city”, “broadband China”, and other policy pilots. Fourthly, the penetration of industrial robots and the industry chain resilience level has a strong spatial and temporal correlation as well as regional aggregation, and the spatial spillover coefficient is significantly positive, demonstrating that the radiation effect is positive.
Based on the above findings, this paper proposes three practical policy recommendations. These aim to guide the rollout of industrial robots more effectively, boost regional industrial chain resilience, and address the uneven impact of technology adoption.
First, tailor industrial robot strategies to local conditions to improve regional adaptability and efficiency. The results show that the positive effect of robot penetration on industrial chain resilience is more significant in high-resilience cities, demonstrating a “stronger becomes stronger” effect. In this context, the government should implement robot development strategies according to local industrial structures and resource endowments. For core cities with strong manufacturing foundations, innovation capabilities, and complete industrial chains, the government should encourage them to take the lead in deepening robot integration, focusing on upgrading information infrastructure, 5G network coverage, and building industrial data platforms to create national “smart manufacturing demonstration zones”. On the other hand, for cities with weak industrial chain resilience or insufficient capacity to absorb high-tech innovations, the government should offer policy support and technical assistance, such as subsidies for robot purchases, collaborative platforms between local universities and enterprises, and training programs to mitigate the labor displacement caused by robots, ensuring that robot technology is “accessible, usable, and manageable”. Additionally, social capital should be encouraged to participate in robot technology promotion and the digital transformation of industrial chains using financial guiding funds and government–social capital cooperation (PPP) mechanisms to alleviate the “initial disadvantage” faced by small and medium-sized cities in terms of funding and technology.
Second, leverage industrial robots as a mediator in the integration of manufacturing and services, as well as enhance urban innovation vitality. The mechanism analysis shows that industrial robots contribute to industrial chain resilience by promoting the integration of advanced manufacturing and modern services, as well as improving the efficiency of urban innovation resources. Therefore, the government should focus on deepening the coupling of manufacturing and services. In terms of policy tools, the government should support leading manufacturing enterprises in increasing service levels by building digital supply chain platforms, introducing flexible manufacturing systems, and upgrading to smart factories. Foster service-oriented intermediaries to provide high-value-added services such as system integration, data analysis, and operational support for manufacturing enterprises, thus enhancing the robot ecosystem. Promote the development of new industries such as high-end manufacturing, technological services, information services, and the platform economy, thereby creating a “manufacturing + services + innovation” collaborative development model. In terms of enhancing urban innovation vitality, based on the threshold model, the government should increase R&D investment in cities with low innovation capacity and promote the construction of regional innovation hubs, technology transfer centers, and joint experimental platforms, especially focusing on breakthrough R&D in key technologies such as precision reducers and servo motors used in industrial robots. Furthermore, an “Industrial Chain Resilience Enhancement Plan” could be established to support key industries in addressing weak links and attracting foreign investment and high-end talent, thus strengthening the city’s “internal innovation” capabilities.
Third, promote regional industrial collaboration, enhance the spatial positive spillover effect of robot penetration, and build an open and resilient development framework. The empirical results from the spatial Durbin model show that industrial robot penetration has a significant spatial positive spillover effect, where high-resilience cities drive technological diffusion and institutional imitation in neighboring cities. However, regional administrative barriers and resource isolation hinder the formation of cross-regional resilience mechanisms. Therefore, the government should break down regional protectionism and coordinate the establishment of industry collaboration platforms at the city cluster level. This would encourage high-resilience cities to work with neighboring smaller cities to build “industrial enclaves”, “shared factories”, and “distributed service centers”, enabling the optimal allocation of robot technology, data, and talent across a broader spatial scale. Moreover, leveraging national strategies such as the Yangtze River Delta integration and metropolitan area development, the government should establish a regional industrial chain resilience coordination mechanism. This would involve shared public technology platforms and cross-domain industrial linkage projects to enhance policy coordination and the flexibility of responses to unexpected events. In particular, during natural disasters or supply chain disruptions, enhancing the deployment of industrial robots in critical enterprise nodes will help ensure the stable operation of core segments of the industrial chain.
In conclusion, industrial robot penetration plays a significant role in improving regional industrial chain resilience, but its effects vary significantly across regions, and there are certain risks associated with labor displacement and technology adaptation. Future policy design should focus on shifting from “promoting technology diffusion” to “encouraging quality technology absorption” with differentiated promotion, mechanism integration, and regional collaboration to build a robust, flexible, and cooperative industrial chain resilience enhancement system.

Author Contributions

Conceptualization, R.Y. and Y.Z.; methodology, Y.Z.; software, Y.Z.; validation, Y.Z.; writing—review and editing, Y.Z.; supervision, Y.Z.; funding acquisition, Y.Z. All authors have read and agreed to the published version of the manuscript.

Funding

This research was funded by National Bureau of Statistics Key Project of China (grant number: 2024LZ029).

Data Availability Statement

The data are already in the graphs of the paper and further inquiries can be made by contacting the corresponding author.

Acknowledgments

To the distinguished editors and reviewers, the authors extend their thanks.

Conflicts of Interest

The authors declare no conflicts of interest.

Appendix A. Description of Model Settings and Variables

Appendix A.1. Baseline Regression Model

I C R i t = α 0 + α 1 R o b o t i t + β X i t + λ i + μ t + ε i t
where the explained variable ICRit is the level of industry chain resilience at city i in year t; the explanatory variable Robotit is the penetration of industrial robots at city i in year t; and Xit denotes a series of control variables including the level of economic development (Eco), the level of marketization (Mar), the level of science and technology (Tec), the level of human capital (Peo), the per capita disposable income of urban residents (Inc), and the strength of fiscal investment (Inv). λ i represents the individual fixed effects that remain constant over time t; μ t is the fixed effect of time t; ε i t is the error term.

Appendix A.2. Quantile Regression Model

Q I C R i t ( τ | R o b o t i t , X i t ) = α 1 ( τ ) R o b o t i t + α c ( τ ) X i t + μ i + δ t + ε i t
where Q I C R i t ( τ | R o b o t i t , X i t ) is the τ -quantile of the resilience level of the industry chain and α 1 ( τ ) is the τ -quantile estimated coefficient of the impact of industrial robot penetration on the industry chain resilience, where the quantile points of 10%, 25%, 50%, 75%, and 90% are chosen. µi represents the individual fixed effects that remain constant over time t; δt is the fixed effect of time t; εit is the error term.

Appendix A.3. Indirect Effects Model

M e d i t = β 0 + β 1 R o b o t i t + β X i t + λ i + μ t + ε i t
I C R i t = γ 0 + γ 1 R o b o t i t + γ 2 M e d i t + γ X i t + λ i + μ t + ε i t
where Medit is the mediating variable and Xit is the control variable.

Appendix A.4. Threshold Regression Model

I C R i t = φ 0 + φ 1 R o b o t i t × I ( T h i t θ ) + φ 2 R o b o t i t × I ( T h i t θ ) + φ X i t + λ i + μ t + ε i t
where Thit is a threshold variable, I(.) is an indicator function that takes the value of one or zero, which is satisfied with one and zero otherwise. Xit denotes each control variable.

Appendix A.5. Staggered Difference-in-Differences Model

I C R i t = π 0 + π 1 D I D i t + π X i t + λ i + μ t + ε i t
where the core explanatory variable DIDit indicates the operation of the policy at city i in year t, with DIDit = 1 if the policy is tried and DIDit = 0 otherwise.
This paper constructs the following dynamic difference-in-differences model for parallel trend testing:
I C R i t = η + β s p r e c u t [ D i × I ( t T D < 3 ) ] + s = 3 2 β s p r e [ D i × I ( t T D = s ) ] + s = 0 2 β s p o s t [ D i × I ( t T D = s ) ] + β s p o s t c u t [ D i × I ( t T D > 2 ) ] + γ X i t + λ i + μ t + ε i t
where Di = 1 represents city i as the treatment group; Di = 0 represents city i as the control group; and I(.) is the indicative function. TD refers to the current period in which the pilot policy was enacted, and the relative time from the time of the pilot policy release is used as the reference system, where s = −1 is the base period. The coefficient of interest in this model is βs, and its change reflects the dynamic change in the effect of the pilot policy on chain resilience; if the regression coefficients β s p r e c u t and β s p r e are not significantly different from zero but β s p o s t c u t and β s p o s t are significantly different from zero, this proves that the staggered difference-in-differences model constructed in this paper passes the parallel trend test.

Appendix A.6. Spatial Durbin Model

I C R i t = β 0 + β 1 R o b o t i t + ρ j = 1 n W i j I C R i t + φ j = 1 n W i j R o b o t i t + δ j = 1 n W i j X i t + β 2 X i t + λ i + μ t + ε i t
ε i t = η W ε i t + ζ i t
where ρ is the spatial autocorrelation coefficient; β1 and β2 are the coefficients of the core explanatory and control variables; φ and δ represent the coefficients of the spatially lagged terms for the main explanatory and control variables; β0 is a constant term; and Wij is the standardized spatial weight matrix. In this paper, the inverse distance squared weight matrix, the inverse distance primary weight matrix, and the spatial geo-economic nested (multiplicative) weight matrix, denoted by W1, W2, and W3, respectively, are used. The specific formulas are as follows:
W 1 = 1 d i j 2 , i = j 0 , i j
W 2 = 1 d i j , i = j 0 , i j
W 3 = W 1 d i a g Y 1 ¯ Y ¯ , Y 2 ¯ Y ¯ Y n ¯ Y ¯
where dij denotes the straight-line distance between areas i and j; Y n ¯ is the economic indicator of the region; and Y ¯ is the total of all regional economic indicators. It refers exclusively to the annual average value of regional GDP per capita in this paper, and diag is a diagonal matrix.

References

  1. Gereffi, G. What does the COVID-19 pandemic teach us about global value chains? The case of medical supplies. J. Int. Bus. Policy 2020, 3, 287–301. [Google Scholar] [CrossRef]
  2. Cahyono, Y.; Purwoko, D.; Koho, I.R.; Setiani, A.; Supendi, S.; Setyoko, P.I.; Sosiady, M.; Wijoyo, H. The role of supply chain management practices on competitive advantage and performance of halal agroindustry SMEs. Uncertain Supply Chain Manag. 2023, 11, 153–160. [Google Scholar] [CrossRef]
  3. Liu, H.; Dan, L. Value chain reconstruction and sustainable development of green manufacturing industry. Sustain. Comput. Inform. Syst. 2020, 28, 100418. [Google Scholar] [CrossRef]
  4. Manioudis, M.; Meramveliotakis, G. Broad strokes towards a grand theory in the analysis of sustainable development: A return to the classical political economy. New Political Econ. 2022, 27, 866–878. [Google Scholar] [CrossRef]
  5. Cheng, L.; Zhang, J. Is tourism development a catalyst of economic recovery following natural disaster? An analysis of economic resilience and spatial variability. Curr. Issues Tour. 2020, 23, 2602–2623. [Google Scholar] [CrossRef]
  6. Christopher, M.; Lee, H. Mitigating supply chain risk through improved confidence. Int. J. Phys. Distrib. Logist. Manag. 2004, 34, 388–396. [Google Scholar] [CrossRef]
  7. Soni, U.; Jain, V.; Kumar, S. Measuring supply chain resilience using a deterministic modeling approach. Comput. Ind. Eng. 2014, 74, 11–25. [Google Scholar] [CrossRef]
  8. Ponomarov, S.Y.; Holcomb, M.C. Understanding the concept of supply chain resilience. Int. J. Logist. Manag. 2009, 20, 124–143. [Google Scholar] [CrossRef]
  9. Bakshi, N.; Kleindorfer, P. Co-opetition and investment for supply-chain resilience. Prod. Oper. Manag. 2009, 18, 583–603. [Google Scholar] [CrossRef]
  10. Ambulkar, S.; Blackhurst, J.; Grawe, S. Firm’s resilience to supply chain disruptions: Scale development and empirical examination. J. Oper. Manag. 2015, 33–34, 111–122. [Google Scholar] [CrossRef]
  11. Grossman, G.M.; Helpman, E.; Lhuillier, H. Supply Chain Resilience: Should Policy Promote International Diversification or Reshoring? J. Political Econ. 2023, 131, 3462–3496. [Google Scholar] [CrossRef]
  12. Jüttner, U.; Maklan, S. Supply chain resilience in the global financial crisis: An empirical study. Supply Chain Manag. Int. J. 2011, 16, 246–259. [Google Scholar] [CrossRef]
  13. Hosseini, S.; Tajik, N.; Ivanov, D.; Sarder, M.D.; Barker, K.; Al Khaled, A. Resilient supplier selection and optimal order allocation under disruption risks. Int. J. Prod. Econ. 2019, 213, 124–137. [Google Scholar] [CrossRef]
  14. Gao, Y.; Feng, Z.; Zhang, S. Managing supply chain resilience in the era of VUCA. Front. Eng. Manag. 2021, 8, 465–470. [Google Scholar] [CrossRef]
  15. Gu, M.; Yang, L.; Huo, B. The impact of information technology usage on supply chain resilience and performance: An ambidexterous view. Int. J. Prod. Econ. 2021, 232, 107956. [Google Scholar] [CrossRef]
  16. Martin, R.; Sunley, P. On the notion of regional economic resilience: Conceptualization and explanation. J. Econ. Geogr. 2015, 15, 1–42. [Google Scholar] [CrossRef]
  17. Brown, L.; Greenbaum, R.T. The role of industrial diversity in economic resilience: An empirical examination across 35 years. Urban Stud. 2017, 54, 1347–1366. [Google Scholar] [CrossRef]
  18. Zhang, Y.S.; Deng, S.Y.; Zhang, Y.X. Research on Urban Economic Resilience: Theoretical Progress and Future Directions. J. Manag. 2022, 35, 54–67. [Google Scholar]
  19. Yang, L.; Liu, Y. The impact of digital infrastructure on industrial chain resilience: Evidence from China’s manufacturing. Technol. Anal. Strat. Manag. 2024, 2024, 2319614. [Google Scholar] [CrossRef]
  20. Chowdhury, M.H.; Quaddus, M. Supply chain resilience: Conceptualization and scale development using dynamic capability theory. Int. J. Prod. Econ. 2017, 188, 185–204. [Google Scholar] [CrossRef]
  21. Katsaliaki, K.; Galetsi, P.; Kumar, S. Supply chain disruptions and resilience: A major review and future research agenda. Ann. Oper. Res. 2022, 319, 965–1002. [Google Scholar] [CrossRef] [PubMed]
  22. Gasteiger, E.; Prettner, K. Automation, stagnation, and the implications of a robot tax. Macroecon. Dyn. 2022, 26, 218–249. [Google Scholar] [CrossRef]
  23. Graetz, G.; Michaels, G. Robots at work. Rev. Econ. Stat. 2018, 100, 753–768. [Google Scholar] [CrossRef]
  24. Dauth, W.; Findeisen, S.; Suedekum, J.; Woessner, N. Adjusting to robots: Worker-level evidence. Oppor. Incl. Growth Inst. Work. Pap. 2018, 13, 1–50. [Google Scholar]
  25. Acemoglu, D.; Restrepo, P. Robots and jobs: Evidence from US labor markets. J. Political Econ. 2020, 128, 2188–2244. [Google Scholar] [CrossRef]
  26. Zhang, Z. The impact of the artificial intelligence industry on the number and structure of employments in the digital economy environment. Technol. Forecast. Soc. Chang. 2023, 197, 122881. [Google Scholar] [CrossRef]
  27. Grabner, S.M.; Modica, M. Industrial resilience, regional diversification and related variety during times of crisis in the US urban-rural context. Reg. Stud. 2022, 56, 1605–1617. [Google Scholar] [CrossRef]
  28. Barney, J.B. Firm Resources and Sustained Competitive Advantage. J. Manag. 1991, 17, 99–120. [Google Scholar] [CrossRef]
  29. Geissdoerfer, M.; Savaget, P.; Bocken, N.M.P.; Hultink, E.J. The Circular Economy—A new sustainability paradigm? J. Clean.Prod. 2017, 143, 757–768. [Google Scholar] [CrossRef]
  30. Teece, D.J.; Pisano, G.; Shuen, A. Dynamic Capabilities and Strategic Management. Strateg. Manag. J. 1997, 18, 509–533. [Google Scholar] [CrossRef]
  31. Teece, D.J. The foundations of enterprise performance: Dynamic and ordinary capabilities in an (economic) theory of firms. Acad. Manag. Perspect. 2014, 28, 328–352. [Google Scholar] [CrossRef]
  32. Andersen, M.S.; Massa, I. Ecological modernization–Origins, dilemmas and future directions. J. Environ. Policy Plan. 2000, 2, 337–345. [Google Scholar] [CrossRef]
  33. Chen, K.; Chen, X.; Wang, Z.-A.; Zvarych, R. Does artificial intelligence promote common prosperity within enterprises?—Evidence from Chinese-listed companies in the service industry. Technol. Forecast. Soc. Chang. 2024, 200, 123180. [Google Scholar] [CrossRef]
  34. Autor, D.H.; Levy, F.; Murnane, R.J. The skill content of recent technological change: An empirical exploration. Q. J. Econ. 2003, 118, 1279–1333. [Google Scholar] [CrossRef]
  35. Schumpeter, J.A.; Opie, R. The Theory of Economic Development: An Inquiry into Profits, Capital, Credit, Interest, and the Business Cycle; Harvard University Press: Harvard, MA, USA, 1934. [Google Scholar]
  36. Liu, J.; Chang, H.; Forrest, J.Y.-L.; Yang, B. Influence of artificial intelligence on technological innovation: Evidence from the panel data of China’s manufacturing sectors. Technol. Forecast. Soc. Chang. 2020, 158, 120142. [Google Scholar] [CrossRef]
  37. Tang, C.; Qiu, P.; Dou, J. The impact of borders and distance on knowledge spillovers—Evidence from cross-regional scientific and technological collaboration. Technol. Soc. 2022, 70, 102014. [Google Scholar] [CrossRef]
  38. Goldfarb, A.; Tucker, C. Digital economics. J. Econ. Lit. 2019, 57, 3–43. [Google Scholar] [CrossRef]
  39. Carlino, G.; Kerr, W.R. Agglomeration and innovation. Handb. Reg. Urban Econ. 2015, 5, 349–404. [Google Scholar]
  40. Liu, R.; Zhang, W. Can spatial agglomeration enhance the resilience of China’s manufacturing industry—From the perspective of industrial adaptive structure adjustment. Contemp. Financ. Econ. 2021, 16, 16–27. [Google Scholar]
  41. Koenker, R. Quantile regression for longitudinal data. J. Multivar. Anal. 2004, 91, 74–89. [Google Scholar] [CrossRef]
  42. Baron, R.M.; Kenny, D.A. The moderator–mediator variable distinction in social psychological research: Conceptual, strategic, and statistical considerations. J. Personal. Soc. Psychol. 1986, 51, 1173. [Google Scholar] [CrossRef]
  43. Bertrand, M.; Mullainathan, S. Is there discretion in wage setting? A test using takeover legislation. RAND J. Econ. 1998, 30, 535. [Google Scholar] [CrossRef]
  44. Goldsmith-Pinkham, P.; Sorkin, I.; Swift, H. Bartik instruments: What, when, why, and how. Am. Econ. Rev. 2020, 110, 2586–2624. [Google Scholar] [CrossRef]
  45. Audretsch, D.B. Innovation and Industry Evolution; MIT Press: Cambridge, MA, USA, 1995. [Google Scholar]
  46. Breschi, S.; Malerba, F. The geography of innovation and economic clustering: Some introductory notes. Ind. Corp. Chang. 2001, 10, 817–833. [Google Scholar] [CrossRef]
  47. Kou, Z.; Liu, X. Find Report on City and Industrial Innovation in China (2017); Fudan Institute of Industrial Development, School of Economics, Fudan University: Shanghai, China, 2017. [Google Scholar]
  48. Kelle, M. Crossing industry borders: German manufacturers as services exporters. World Econ. 2013, 36, 1494–1515. [Google Scholar] [CrossRef]
  49. Wang, S.-J.; Kong, W.; Ren, L.; Zhi, D.-D.; Dai, B.-T. Research on misuses and modification of coupling coordination degree model in China. J. Nat. Resour. 2021, 36, 793–810. [Google Scholar] [CrossRef]
  50. Hansen, B.E. Threshold Effects in Non-dynamic Panels: Estimation, Testing, and Inference. J. Econom. 1999, 93, 345–368. [Google Scholar] [CrossRef]
  51. Borusyak, K.; Hull, P.; Jaravel, X. Quasi-experimental shift-share research designs. Rev. Econ. Stud. 2022, 89, 181–213. [Google Scholar] [CrossRef]
  52. Liu, Y.; Zhao, X.; Kong, F. The dynamic impact of digital economy on the green development of traditional manufacturing industry: Evidence from China. Econ. Anal. Policy 2023, 80, 143–160. [Google Scholar] [CrossRef]
  53. Xin, D.L.; Peng, Z.Y. Impact of the ‘Broadband China’ strategy pilot policy on urban green innovation. China Popul. Resour. Environ. 2023, 33, 159–170. [Google Scholar]
  54. Ferrara, E.L.; Chong, A.; Duryea, S. Soap operas and fertility: Evidence from Brazil. Am. Econ.J. Appl. Econ. 2012, 4, 1–31. [Google Scholar] [CrossRef]
  55. Cinelli, C.; Hazlett, C. Making sense of sensitivity: Extending omitted variable bias. J. R. Stat. Soc. Ser. B Stat. Methodol. 2020, 82, 39–67. [Google Scholar] [CrossRef]
  56. De Chaisemartin, C.; d’Haultfoeuille, X. Two-way fixed effects estimators with heterogeneous treatment effects. Am. Econ. Rev. 2020, 110, 2964–2996. [Google Scholar] [CrossRef]
  57. Yao, S.; Fang, J.; He, H. Can time–space compression promote urban economic growth? Evidence from China’s high-speed rail projects. China World Econ. 2020, 28, 90–117. [Google Scholar] [CrossRef]
  58. Xiong, Y.; Bingham, D.; Braun, W.J.; Hu, X.J. Moran’s I statistic-based nonparametric test with spatio-temporal observations. J. Nonparametr. Stat. 2019, 31, 244–267. [Google Scholar] [CrossRef]
  59. Zhang, J.; Chang, Y.; Zhang, L.; Li, D. Do technological innovations promote urban green development?—A spatial econometric analysis of 105 cities in China. J. Clean. Prod. 2018, 182, 395–403. [Google Scholar] [CrossRef]
  60. Elhorst, J.P. Spatial Econometrics: From Cross-Sectional Data to Spatial Panels; Springer: Berlin/Heidelberg, Germany, 2014. [Google Scholar]
  61. LeSage, J.; Pace, R.K. Introduction to Spatial Econometrics; Chapman and Hall/CRC: Boca Raton, FL, USA, 2009. [Google Scholar]
Figure 1. (a) First threshold of Peo. (b) Second threshold of Peo. The red dashed line in the figure typically represents the critical value, which is used to determine whether there is a significant threshold effect in the threshold model.
Systems 13 00362 g001
Figure 2. (a) Parallel trend tests for low-carbon cities. (b) Placebo test for low-carbon cities.
Systems 13 00362 g002
Figure 3. t-statistic results.
Systems 13 00362 g003
Figure 4. Worst-case scenario diagram. The small black dots on the horizontal axis represent scenarios in which the omitted variable has an influence equivalent to 1 to 3 times the strength of Inc.
Systems 13 00362 g004
Figure 5. (a) Localized Moran scatterplot (2006). (b) Localized Moran scatterplot (2021).
Systems 13 00362 g005
Figure 6. (a) Spatial pattern of industrial chain. (b) Spatial pattern of industry chain resilience levels in 104 cities, 2006 resilience levels in 104 cites, 2021.
Systems 13 00362 g006
Table 1. Construction of industry chain resilience indicators.
Sub-SystemIndex LayerIndicator DescriptionIndicator
Attribute
Weight
Industry chain resisting powerManpower qualityManufacturing employmentPositive0.0431
Total manufacturing profitsPositive0.0788
Industrial foundationNumber of industrial enterprises above scalePositive0.0277
Total industrial output value above scalePositive0.1394
Industry chain recovery powerIndustrial structureRationalization of industrial structurePositive0.1766
Advanced industrial structurePositive0.0284
Industry benefitsExpenditure on educationPositive0.0318
Local general public budget expenditurePositive0.0900
Fixed asset investmentPositive0.0068
Foreign direct investment contract projectsPositive0.0292
Industry chain sustainable powerDigital leadershipInternet broadband access subscribersPositive0.0318
Number of patents grantedPositive0.0057
Science expendituresPositive0.2270
pollution emissionEnvironmental regulationsPositive0.0837
Table 2. Descriptive statistics.
VariablesNMeanSDMinp50Max
ICR16640.05880.04340.02090.04530.4053
Robot16643.88014.17090.02282.281824.9653
Inno166416.366142.53830.05912.0971276.3702
D16640.12600.03380.09000.12260.5867
Eco166410.45910.75938.671610.515511.9601
Mar16641.43591.04800.08091.14156.3964
Tec16640.01910.01810.00000.01380.1627
Peo16640.01810.02350.00000.00990.1311
Inc16640.85780.4986−0.37030.90572.0398
Inv16644.76971.72081.61474.51169.5912
Table 3. Baseline regression results.
IIIIIIIV
VariablesICRICRICRICR
Robot0.0037 ***0.0015 ***0.0020 ***0.0019 ***
(0.0001)(0.0004)(0.0007)(0.0007)
Eco −0.0006−0.0006−0.0004
(0.0005)(0.0006)(0.0006)
Mar −0.0000 ***−0.0000 ***−0.0000 ***
(0.0000)(0.0000)(0.0000)
Tec 0.9461 ***0.9735 ***0.9553 ***
(0.2255)(0.2355)(0.2336)
Peo 0.4593 ***0.4348 ***0.3677 **
(0.1128)(0.1141)(0.1521)
Inc 0.0091 ***−0.0004−0.0181 *
(0.0032)(0.0069)(0.0099)
Inv 0.0005 *0.00050.0005
(0.0003)(0.0003)(0.0003)
Number of cities104104104104
Fixed TimeNONOYESYES
Fixed RegionNONONOYES
N1664166416641664
R20.3490.5800.6000.602
Note: *, **, and *** denote significant at the 10%, 5%, and 1% levels, respectively, with standard errors in parentheses, as shown in the table below.
Table 4. Quantile regression results.
Quartile Point10%25%50%75%90%
Robot0.0006 ***0.0007 ***0.00030.0013 ***0.0007 **
(0.0001)(0.0002)(0.0002)(0.0004)(0.0003)
Control VariablesYESYESYESYESYES
Fixed TimeYESYESYESYESYES
Fixed RegionYESYESYESYESYES
N16641664166416641664
Note: *, **, and *** denote significant at the 10%, 5%, and 1% levels, respectively.
Table 5. Mechanism test results.
IIIIIIIV
VariablesDICRInnoICR
Robot0.0005 ***0.0009 ***3.3717 **0.0006 *
(0.0002)(0.0002)(1.299)(0.0003)
D 0.1398 ***
(0.0260)
Inno 0.0004 ***
(0.0000)
Control VariablesYESYESYESYES
Number of cities104104104104
Fixed TimeYESYESYESYES
Fixed RegionYESYESYESYES
N1664166416641664
R20.24270.76790.32830.8803
Note: *, **, and *** denote significant at the 10%, 5%, and 1% levels, respectively.
Table 6. Threshold effect test results.
Explanatory VariableThreshold NumbersThreshold ValueF-Valuep-ValueBSBoundary Value
10%5%1%
InnoSingle80.97911045.280.000030027.414336.489944.9104
Double172.5112163.830.000030028.183336.061646.7571
PeoSingle0.0247525.080.000030055.757083.9460172.8297
Double0.0540127.740.013330056.960380.0241143.0746
TecSingle0.0438291.950.000030040.147449.884667.9409
Double0.0662124.840.000030036.239047.970964.9003
IncSingle1.5191235.830.000030025.425734.677551.2274
Double1.7758100.570.003330015.084819.096240.0306
Table 7. Threshold regression results.
IIIIIIIV
VariablesICR (Inno) ICR (Peo) ICR (Tec) ICR (Inc)
DI (q < γ1)0.0009 **0.0018 ***0.0011 **0.0001
(0.0004)(0.0005)(0.0005)(0.0006)
DI (qγ1 or q < γ21)0.0039 ***0.0044 ***0.0041 ***0.0021 ***
(0.0004)(0.0016)(0.0009)(0.0006)
DI (qγ22)0.0100 ***0.0121 ***0.0087 ***0.0045 ***
(0.0012)(0.0021)(0.0015)(0.0012)
Control VariablesYESYESYESYES
γ21 (Dual Threshold)80.97910.02470.04381.5191
γ22 (Dual Threshold)172.51120.05400.06621.7758
Number of cities104104104104
Fixed TimeYESYESYESYES
Fixed RegionYESYESYESYES
N1664166416641664
R20.77820.71980.68560.6718
Note: *, **, and *** denote significant at the 10%, 5%, and 1% levels, respectively.
Table 8. Permutation test results.
TT (obs)TestcnpSE (p)[95% CI (p)]
beta0.0019lower5005001.00000.00000.9926 1.0000
upper05000.00000.00000.0000 0.0074
two-sided 0.00000.0000
Table 9. Instrumental variable results.
IIIIIIIVV
FirstSecondFirstSecond PSM
VariablesRobotICRRobotICRL.ICRICR
SW_bartikstock80.546 ***
(0.615)
Bartikstall 1.296 ***
(0.011)
Robot 0.003 *** 0.002 **0.002 ***0.002 *
(0.001) (0.001)(0.001)(0.0009)
Control VariablesYESYESYESYESYESYES
Cragg-Donald Wald F statistic1264.95 538.77
Kleibergen-Paap rk LM32.57 31.48
Kleibergen-Paap Wald rk F statistic17,134.02 13,221.79
Number of cities104104104104104103
N16641664166416641664454
R2 0.599 0.6020.5730.687
Note: *, **, and *** denote significant at the 10%, 5%, and 1% levels, respectively.
Table 10. Pilot shock regression results.
IIIIII
VariablesICRICRICR
Low-Carbon City0.0088 **
(0.0037)
Broadband China 0.0115 ***
(0.0043)
Innovative City 0.0243 ***
(0.0043)
Control VariablesYESYESYES
Number of cities104104104
Fixed TimeYESYESYES
Fixed RegionYESYESYES
N166416641664
R20.5940.6000.635
Note: *, **, and *** denote significant at the 10%, 5%, and 1% levels, respectively.
Table 11. Robustness testing results.
IIIIIIIVV
VariablesICRICRICRICRICR
L.Robot0.0018 ***
(0.0006)
Stock 0.0003 **
(0.0001)
L.Stock 0.0003 **
(0.0001)
Robot 0.0014 ***0.0010 ***
(0.0005)(0.0002)
Control VariablesYESYESYESYESYES
Open −0.0713 ***
(0.0209)
Job 0.0112
(0.0125)
Number of cities104104104104104
Fixed TimeYESYESYESYESYES
Fixed RegionYESYESYESYESYES
N15601664156016641664
R20.5770.6000.5750.6620.758
Note: *, **, and *** denote significant at the 10%, 5%, and 1% levels, respectively.
Table 12. (a) Heterogeneity analysis results. (b) Heterogeneity analysis results.
(a)
IIIIIIIV
VariablesProvincial CapitalNon-Provincial CapitalsCentral CityNon-Central City
Robot0.00270.0024 ***−0.0056 **0.0019 ***
(0.0037)(0.0006)(0.0019)(0.0006)
Control VariablesYESYESYESYES
Number of cities995599
Fixed TimeYESYESYESYES
Fixed RegionYESYESYESYES
N1441520801584
R20.9050.6170.9860.644
(b)
V
VariablesKey Cities for Environmental ProtectionNon-Key Cities for Environmental ProtectionOld Industrial CityNon-Old Industrial Cities
Robot0.00070.0009 **0.00010.0027 ***
(0.0013)(0.0004)(0.0008)(0.0008)
Control VariablesYESYESYESYES
Number of cities37673470
Fixed TimeYESYESYESYES
Fixed RegionYESYESYESYES
N59210725441120
R20.7020.7370.7510.668
Note: *, **, and *** denote significant at the 10%, 5%, and 1% levels, respectively.
Table 13. Global Moran’s I index results.
W1W2W3
YearIp-Value *Ip-Value *Ip-Value *
20060.2630.0000.0860.0000.5560.000
20070.2760.0000.0920.0000.5930.000
20080.2710.0000.0890.0000.5880.000
20090.2870.0000.0970.0000.6150.000
20100.3140.0000.1110.0000.6750.000
20110.3070.0000.1100.0000.6630.000
20120.2980.0000.1100.0000.6330.000
20130.2980.0000.1140.0000.6280.000
20140.2960.0000.1160.0000.6150.000
20150.2740.0000.1100.0000.5640.000
20160.2480.0000.1030.0000.5100.000
20170.2180.0000.0890.0000.4590.000
20180.2070.0000.0840.0000.4390.000
20190.1550.0000.0630.0000.3440.000
20200.1580.0000.0640.0000.3510.000
20210.1550.0000.0630.0000.3430.000
Note: * denote significant at the 10% levels.
Table 14. SDM regression results.
VariablesICRICRICR
Spatial Weight MatrixW1W2W3
Robot0.0005 **0.0006 **0.0007 ***
(0.0002)(0.0002)(0.0002)
W × Robot0.0088 ***0.0208 ***0.0080 ***
(0.0007)(0.0018)(0.0007)
Control VariablesYESYESYES
Direct Effect0.0005 **0.0006 **0.0006 ***
(0.0002)(0.0002)(0.0002)
Indirect Effect0.0094 ***0.0210 ***0.0068 ***
(0.0008)(0.0030)(0.0006)
Total Effect0.0100 ***0.0216 ***0.0074 ***
(0.0007)(0.0030)(0.0006)
N166416641664
Note: *, **, and *** denote significant at the 10%, 5%, and 1% levels, respectively.
Disclaimer/Publisher’s Note: The statements, opinions and data contained in all publications are solely those of the individual author(s) and contributor(s) and not of MDPI and/or the editor(s). MDPI and/or the editor(s) disclaim responsibility for any injury to people or property resulting from any ideas, methods, instructions or products referred to in the content.

