Article

Evolutionary Characteristics and Robustness Analysis of the Global Aircraft Trade Network System

1
School of Economics and Management, Civil Aviation Flight University of China, Guanghan 618307, China
2
School of Business, Renmin University of China, Beijing 100872, China
3
School of Economics, Peking University, Beijing 100871, China
4
Chengdu Low Altitude Economy High Quality Development Research Center, Chengdu 610000, China
*
Author to whom correspondence should be addressed.
Systems 2025, 13(11), 1016; https://doi.org/10.3390/systems13111016
Submission received: 5 October 2025 / Revised: 6 November 2025 / Accepted: 10 November 2025 / Published: 13 November 2025
(This article belongs to the Section Systems Practice in Social Science)

Abstract

In the context of escalating geopolitical tensions, recurring aircraft safety incidents, and frequent unforeseen events, the security of aircraft supply faces significant challenges. This research employs complex network theory to analyze the evolutionary characteristics of three global aircraft trade network (GATN) systems from 2015 to 2024. It then applies the entropy-weighted TOPSIS method to assess node importance within the network and finally conducts a robustness analysis based on the node importance ranking. The results indicate that the number of participating countries has declined post-pandemic, while trade concentration has increased. Analysis of the node’s importance reveals that the United States holds the most critical role in the GATN. The global medium aircraft trade network is characterized by one dominant player alongside several strong competitors, whereas the global large aircraft trade network features multiple major players coexisting. Regarding network robustness, targeted node attacks cause significantly more disruption than random node attacks. After removing 10% of key nodes, the global small aircraft trade network’s average connectivity fell to 0.6, and efficiency dropped to 0.1. Similar patterns were observed in the medium and large aircraft networks, with connectivity decreasing to 0.4 and efficiency to 0.05. Under targeted attacks, the global small aircraft trade network is more robust than the medium and large ones. This study provides quantitative insights to help optimize aircraft trade strategies.

1. Introduction

Aircraft are quintessentially complex products, characterized by their substantial size, intricate structures, high added value, advanced technology, and significant research and development costs. Amid the post-pandemic resurgence of the air transportation industry, demand for aircraft is projected to continue growing robustly in the coming years [1]. The inherently globalized and interdependent nature of aircraft manufacturing makes the GATN especially vulnerable to disruptions, including global health crises (e.g., COVID-19 [2]), geopolitical tensions [3], and safety accidents [4]. Trade networks are complex systems with complex trade relationships between countries [5]. An attack on one country within the network can disrupt the trade stability of other connected nations. For instance, the 2018 U.S.–China trade war exerted considerable pressure on bilateral relations, significantly restricting U.S. aircraft exports to China. Consequently, the trade value of U.S.-sourced aircraft in the Chinese market experienced a sharp contraction. The figure for 2019, at approximately $11 billion, stood in stark contrast to the 2018 level of over $18 billion [3]. These incidents disrupted normal aircraft trade between countries, triggering a crisis of aircraft shortages. Given that aircraft trade constitutes a vital component of global high-end equipment trade, it not only reflects the development dynamics of the international aviation industry but also bears close relevance to economic cooperation, technological competition, and geopolitical dynamics among nations. Therefore, studying the evolutionary characteristics of the GATN and the stability of trade relations amid escalating multidimensional uncertainties is crucial for nations to enhance the security of their aircraft supply.
Amidst escalating global political and economic instability, scholars have increasingly focused on studying the stability of trade networks [6,7]. Research on network stability typically employs robustness analysis methods. Robustness is an endogenous attribute of complex systems. A robust network is characterized by its ability to maintain core operational capabilities despite internal malfunctions and external disturbances [8]. Scholars commonly assess network robustness by quantifying network connectivity and efficiency after randomly or strategically removing nodes [9,10]. Since the importance of nodes determines their removal order, accurately assessing node importance is crucial for targeted attacks and significantly influences the robustness assessments of complex networks [11]. Consequently, establishing reliable rankings of node importance is critical for accurately evaluating network robustness under targeted node attacks. This method can systematically evaluate the impact of attacks on major aircraft-trading nations on the GATN. This paper employs the entropy-weighted TOPSIS method to address the multifaceted challenge of assessing node importance, which is influenced by multiple topological features. This method enhances evaluation accuracy by objectively weighting different indicators and producing a comprehensive ranking.
Based on the above analysis, this paper first employs complex network theory to construct GATN, examining the evolutionary characteristics of the network from 2015 to 2024. Subsequently, the entropy-weighted TOPSIS method is applied to evaluate the importance of nodes within GATN. Finally, through simulation analyses of random and targeted node attacks, the robustness of GATN is systematically assessed. This study makes three key contributions: First, it applies complex network methods to the GATN, enriching research on global high-end manufacturing equipment trade. Second, by comparing the evolutionary characteristics and robustness of GATN, the findings provide valuable decision-making references for policymakers and industry stakeholders. Third, an integrated evaluation framework is developed using the entropy-weighted TOPSIS approach. This multidimensional approach, which incorporates topological features, identifies key nodes within the GATN and establishes removal orders in attack scenarios, thereby improving the accuracy and dependability of network robustness assessments.

2. Literature Review

2.1. Global Trade Network

Complex network methods are quantitative analytical tools for studying global trade networks [12]. These methods typically represent countries or regions as nodes, trade relationships as edges, and trade value or volume as weights to construct international trade network models [13]. The complex network approach analyzes the macroscopic structure of trade networks using indicators such as degree distribution while simultaneously assessing individual nodes through centrality measures [14,15,16]. They also analyze the temporal evolution of the structural features of international trade networks [17,18]. Currently, most studies on trade networks focus on scarce resources, including energy [19], mineral resources [17], and food [20]. Research on trade networks for high-end equipment, such as aircraft, remains comparatively limited. In the context of escalating geopolitical tensions and recurring aircraft safety incidents, the prolonged R&D and production cycles, substantial technical barriers, and significant capital requirements inherent in aircraft manufacturing pose considerable challenges to supply security [21]. This underscores the urgent need to employ complex trade network analysis to examine the evolutionary characteristics and robustness of the GATN.

2.2. Network Robustness in the Aviation Industry

Most existing studies in this area are concentrated more on the robustness of the air transport network. These studies represent airports as nodes and route relationships as edges to construct weighted or unweighted air route networks, simulating the robustness of the entire network when certain airports or routes are removed [21,22]. Meanwhile, some scholars have focused their research on the vulnerability and robustness of the aviation supply chain. Gupta et al. investigated risk management in the aviation supply chain, identified risk factors in civil aviation, and discussed its vulnerabilities [23]. Zeng et al. analyzed the characteristics of aircraft supply chains and examined the robustness of aircraft manufacturing supply chain networks against random and targeted attacks [24]. However, the research above has primarily focused on supply chain robustness. That is to say, the ability of a supply chain to maintain its revenue stream and continuous operational functions when disrupted by uncertainties, whether from internal operations or external emergencies [25]. In contrast to trade network robustness, supply chain robustness focuses on the supply chain management of individual enterprises or corporate groups, involving specific operational activities such as supplier management, inventory control, and production planning [26]. Trade network robustness examines the network of trade relationships between countries or regions, emphasizing the importance of nodes, connectivity, and the structural characteristics of the network [20]. It is noteworthy that, unlike the supply chain robustness of the aviation industry, the aircraft trade network has received less scholarly attention. In a context of intensifying geopolitics, the stability of the aircraft trade network is crucial for ensuring a secure supply of aircraft, necessitating in-depth research.
Furthermore, existing research on trade network robustness predominantly relies on single indicators to determine the importance rankings of nodes [27,28]. Nevertheless, it has been demonstrated that some nodes may hold significant importance for the network, despite having low rankings in individual indicators [29]. This highlights the critical need for multidimensional node importance assessment frameworks to comprehensively capture network characteristics and functionalities, thereby preventing information loss [30]. Therefore, this study adopts a comprehensive evaluation method to assess node importance. The TOPSIS method is a classic technique for solving multi-criteria decision-making problems. However, its weight assignment can be subjective [31]. In contrast, the entropy weight method can objectively determine weights based on the variability of the indicators [32]. Therefore, this paper combines the TOPSIS method and the entropy weight method to determine the sequence of node removal under targeted attacks.

3. Data and Methodology

3.1. Framework of Evolutionary Characteristics and Robustness Analysis for the GATN System

Figure 1 illustrates the framework of this research. Firstly, construct global trade networks for small, medium, and large aircraft to analyze their evolutionary characteristics. Secondly, employ the entropy-weighted TOPSIS method to assess the importance of nodes within the global aircraft trade network. Finally, conduct a robustness analysis of the worldwide aircraft trade network based on the node importance evaluation results.

3.2. Data Sources

Based on a dataset provided by the United Nations Statistics Division, this study examines the global aircraft trade network over the decade from 2015 to 2024. Aircraft trade codes are categorized into 880220, 880230, and 880240. Specifically, code 880220 represents aircraft with an operating empty weight not exceeding 2000 kg; code 880230 represents aircraft with an operating empty weight exceeding 2000 kg but not exceeding 15,000 kg; and code 880240 represents aircraft with an operating empty weight exceeding 15,000 kg. For convenience, 880220 will be referred to as small aircraft, 880230 as medium aircraft, and 880240 as large aircraft. Due to differences in statistical methods, trade values reported by exporting and importing countries often do not match. Since countries (or regions) typically impose stricter controls on imports than on exports, this study uniformly adopts each country’s annual import trade value as the basis for analysis. Additionally, all data for Hong Kong, China, and Macao, China, are consolidated under China. To facilitate the model establishment, we define the notations as shown in Appendix A.

3.3. Model Construction and Overall Indicators of the GATN

Based on aircraft trade network data, global small, medium, and large aircraft trade networks have been constructed. The GATN is represented by the set M = ( A , B ) . A a 1 , a 2 , a 3 a n is the set of nodes representing countries or regions involved in the GATN. n represents the number of nodes. B ( b i j ) is the edge set of the aircraft trade network, representing the trade relationship between node i and node j . In a weighted trade network, edges represent the direction and strength of node connections. This paper uses aircraft trade value to measure trade intensity between two countries.
  • Degree and strength
In directed trade networks, a node’s degree consists of both in-degree and out-degree, representing the number of import and export partners, respectively. Strength refers to a country’s trade intensity. The specific formulas are given in Equations (1) and (2):
k i = k i i n + k i o u t
s i = j = 1 n w j i + j = 1 n w i j
where k i is the degree of i , k i i n is the in-degree of i , k i o u t is the out-degree of i , s i stands for the strength of i , w j i denotes the trade value exported from country j to country i .
2.
Degree distribution
From a statistical perspective, the degree distribution p ( k ) fully characterizes the probability that a node has k trading partners. The degree distribution is expressed by Equation (3):
p ( k ) = c k r
where c and r are constants.
3.
Network density
To assess the sparsity of trade networks, we utilise network density, which measures the proportion of potential trade linkages that are actually realized [33]. The density D is given in Equation (4):
D = M N ( N 1 )
where M is the total count of edges within the network, N is the number of nodes in the network.
4.
Average path length (APL)
Equation (5) defines the average path length. In the GATN, a lower average path length indicates greater network efficiency [34].
A P L = 1 N ( N 1 ) i j d i j
where A P L denotes the average path length, and d i j is the count of edges between i and j .
5.
Average clustering coefficient (ACC)
The clustering coefficient reflects the degree of clustering within the GATN. A higher ACC indicates closer cooperation in the GATN. The ACC is given in Equation (6):
A C C = 1 N i = 1 N 2 e i N ( N 1 )
where ACC denotes the average clustering coefficient of the network, and e i represents the number of nodes that have trade relationships with node i .

3.4. Node Importance Evaluation

3.4.1. Evaluation Indicators

Referencing relevant research [11], five indicators—degree, strength, betweenness centrality, closeness centrality, and eigenvector centrality—were selected to evaluate node importance using the entropy-weighted TOPSIS method. The calculation methods for degree and strength are shown in Equations (1) and (2).
  • Betweenness Centrality
According to Equation (7), betweenness centrality measures a node’s importance as a bridge by calculating the proportion of shortest paths between all pairs of nodes that pass through that node [35].
C B ( i ) = s i t g s t ( i ) g s t
where C B ( i ) denotes the betweenness centrality of i , g s t represents the number of shortest paths between nodes s and t , g s t ( i ) embodies the number of shortest paths through node i .
2.
Closeness Centrality
Closeness centrality is calculated using Equation (8). A node with high closeness centrality is closer to other nodes in the network [36].
C i = N 1 j = 1 N d i j
where C i refers to the closeness centrality of i .
3.
Eigenvector Centrality
Eigenvector centrality measures a node’s importance not only by the number of neighbours but also by the importance of those neighbours—that is, the more important your neighbours are, the more critical you become [37]. Eigenvector centrality is defined by Equation (9).
E i = 1 λ j = 1 n a i j x j
λ E = A E
where E i refers to the Eigenvector centrality of node i , λ denotes the eigenvalues of matrix A , and E is the eigenvector corresponding to the eigenvalue of matrix A . When there is a connection between node i and node j , a i j = 1 , otherwise, a i j = 0 .

3.4.2. Entropy-Weighted TOPSIS

This paper employs entropy-weighted TOPSIS to evaluate node importance. As a comprehensive evaluation method, entropy-weighted TOPSIS is unaffected by the number of indicators or the dispersion of data [31]. Decision matrix X is constructed using the indicators described in Section 3.4.1.
X = x 11 x 1 n x m 1 x m n
where m represents the number of nodes in the network, n represents the number of indicators in the network, and x i j is the value of indicator j for node i . Since the measurement scales of the indicators vary, it is necessary to standardize them to create a standardized matrix. Because all indicators in this study are positive, the standardization formula is presented in Equation (12):
y i j = ( x i j x i j ) / ( x i j + x i j )
where y i j is the standardized value of x i j . After standardization, the entropy value for each indicator is calculated using Equations (13) and (14):
e j = 1 ln m i = 1 m p i j ln p i j
p i j = y i j i = 1 m y i j
where e j represents the entropy of each indicator, and the weight w j for each indicator is calculated based on its entropy value, as shown in Equation (15):
w j = 1 e j i = 1 n ( 1 e j )
After calculating the weights, the TOPSIS method is applied to compute the relative scores for each node. First, compute the weighted normalized matrix Z .
Z = z 11 z 1 n z m 1 z m n = w 1 y 11 w n y 1 n w 1 y m 1 w n y m n
Then, calculate the positive and negative ideal solutions using Equations (17) and (18).
Z + = Z 1 + , Z 2 + Z n + , Z n + = max ( z 1 n , z 2 n z m n )
Z = Z 1 , Z 2 Z n , Z n = min ( z 1 n , z 2 n z m n )
Next, calculate the distances between the positive and negative ideal solutions using Equations (19) and (20).
L + = i = 1 n ( Z j + z i j ) 2 , ( i = 1,2 n )
L = i = 1 n ( Z j z i j ) 2 , ( i = 1,2 n )
Finally, the relative scores for each node are calculated, as shown in Equation (21).
C i = L L + L + , i = 1,2 , m
where C i is the score of node i .

3.5. Robustness Assessment of the GATN

Node failures are typically caused by random node attacks and targeted node attacks [38]. Random node attacks model the effects of stochastic events, such as epidemics, on a network by randomly removing nodes. Targeted node attacks involve deliberately damaging critical nodes within a network to disrupt its functionality, as seen during geopolitical crises. The sequence of targeted node attacks is determined by attacking nodes in order of their importance, as calculated using the method described in Section 3.4. Additionally, network robustness is typically measured by changes in connectivity and efficiency when subjected to attacks [24].
  • Network Connectivity
If all nodes in a network are interconnected, the network’s connectivity coefficient equals 1. If some nodes are not connected to others, the connectivity coefficient is less than 1. When a network is attacked, it breaks into several connected subgraphs. Network connectivity can be quantified by G , the fraction of nodes residing in the largest connected component. The formula is shown in Equation (22).
G = N ' N
2.
Network efficiency
Average path length can be used to evaluate network efficiency; however, it has normalization issues. Therefore, we measure network efficiency using Equation (23).
F = 1 N ( N 1 ) i j 1 d i j

4. Results and Discussions

4.1. Changes in Global Aircraft Trade Value

Figure 2 illustrates the changes in trade value for small, medium, and large aircraft from 2015 to 2024. In 2018, the U.S.–China trade war brought bilateral aircraft trade to a standstill [39], while safety incidents involving the Boeing 737 MAX led to numerous order cancellations and delays [40]. Consequently, trade value for small, medium, and large aircraft declined in 2018. The COVID-19 pandemic in 2020 disrupted aircraft supply chains, severely impacting the production and delivery of medium and large aircraft, further reducing trade value. In contrast, trade value for medium aircraft has steadily increased since 2021, surpassing 2019 levels by 2023. The trade value of large aircraft only began recovering in 2022; although it rose to $131.09 billion by 2023, it sharply declined again to $86.245 billion in 2024. On the one hand, the recovery of international long-haul travel has been relatively slow [41], resulting in lower demand for large aircraft. Medium aircraft offer greater flexibility and can operate on short-haul international and domestic routes, which are recovering more quickly. Consequently, the recovery of large aircraft lags behind that of medium aircraft. On the other hand, amid elevated oil prices, airlines are increasingly opting to deploy two medium aircraft instead of a single large aircraft to reduce costs and maintain operational flexibility. Additionally, given the greater stability of air cargo operations, many carriers actively pursue passenger-to-freighter conversions, resulting in a surge in the modification of medium passenger aircraft into freighters. This trend has contributed to the observed growth in medium aircraft trade value [42]. Beyond these factors, the sharp decline in large aircraft trade value to $86.245 billion in 2024 was also linked to a series of Boeing safety incidents that year.
Compared to medium and large aircraft, the trade value of small aircraft remained largely unaffected by the COVID-19 pandemic, with 2020 figures nearly identical to those of 2019. Notably, in 2021, the trade value of small aircraft surged significantly to $2.341 billion, more than doubling the value in 2020. This increase resulted from economic, social, and policy factors in the post-pandemic era. Following the outbreak of the pandemic, more individuals purchased or flew small aircraft for safer travel. Simultaneously, disruptions in global supply chains prompted many businesses to rely on small aircraft to swiftly and flexibly transport critical components and personnel. After 2022, as the pandemic subsided, demand for small aircraft declined. This decrease was compounded by the fact that 2021 had already absorbed a portion of future purchasing power, resulting in a sustained decline in the value of the small aircraft trade. Overall, influenced by events such as trade wars, safety incidents, and the COVID-19 pandemic, trade value for both small and large aircraft experienced significant fluctuations. In contrast, trade value for medium aircraft remained relatively stable, demonstrating stronger resilience to risks.

4.2. Evolutionary Characteristics of the GATN

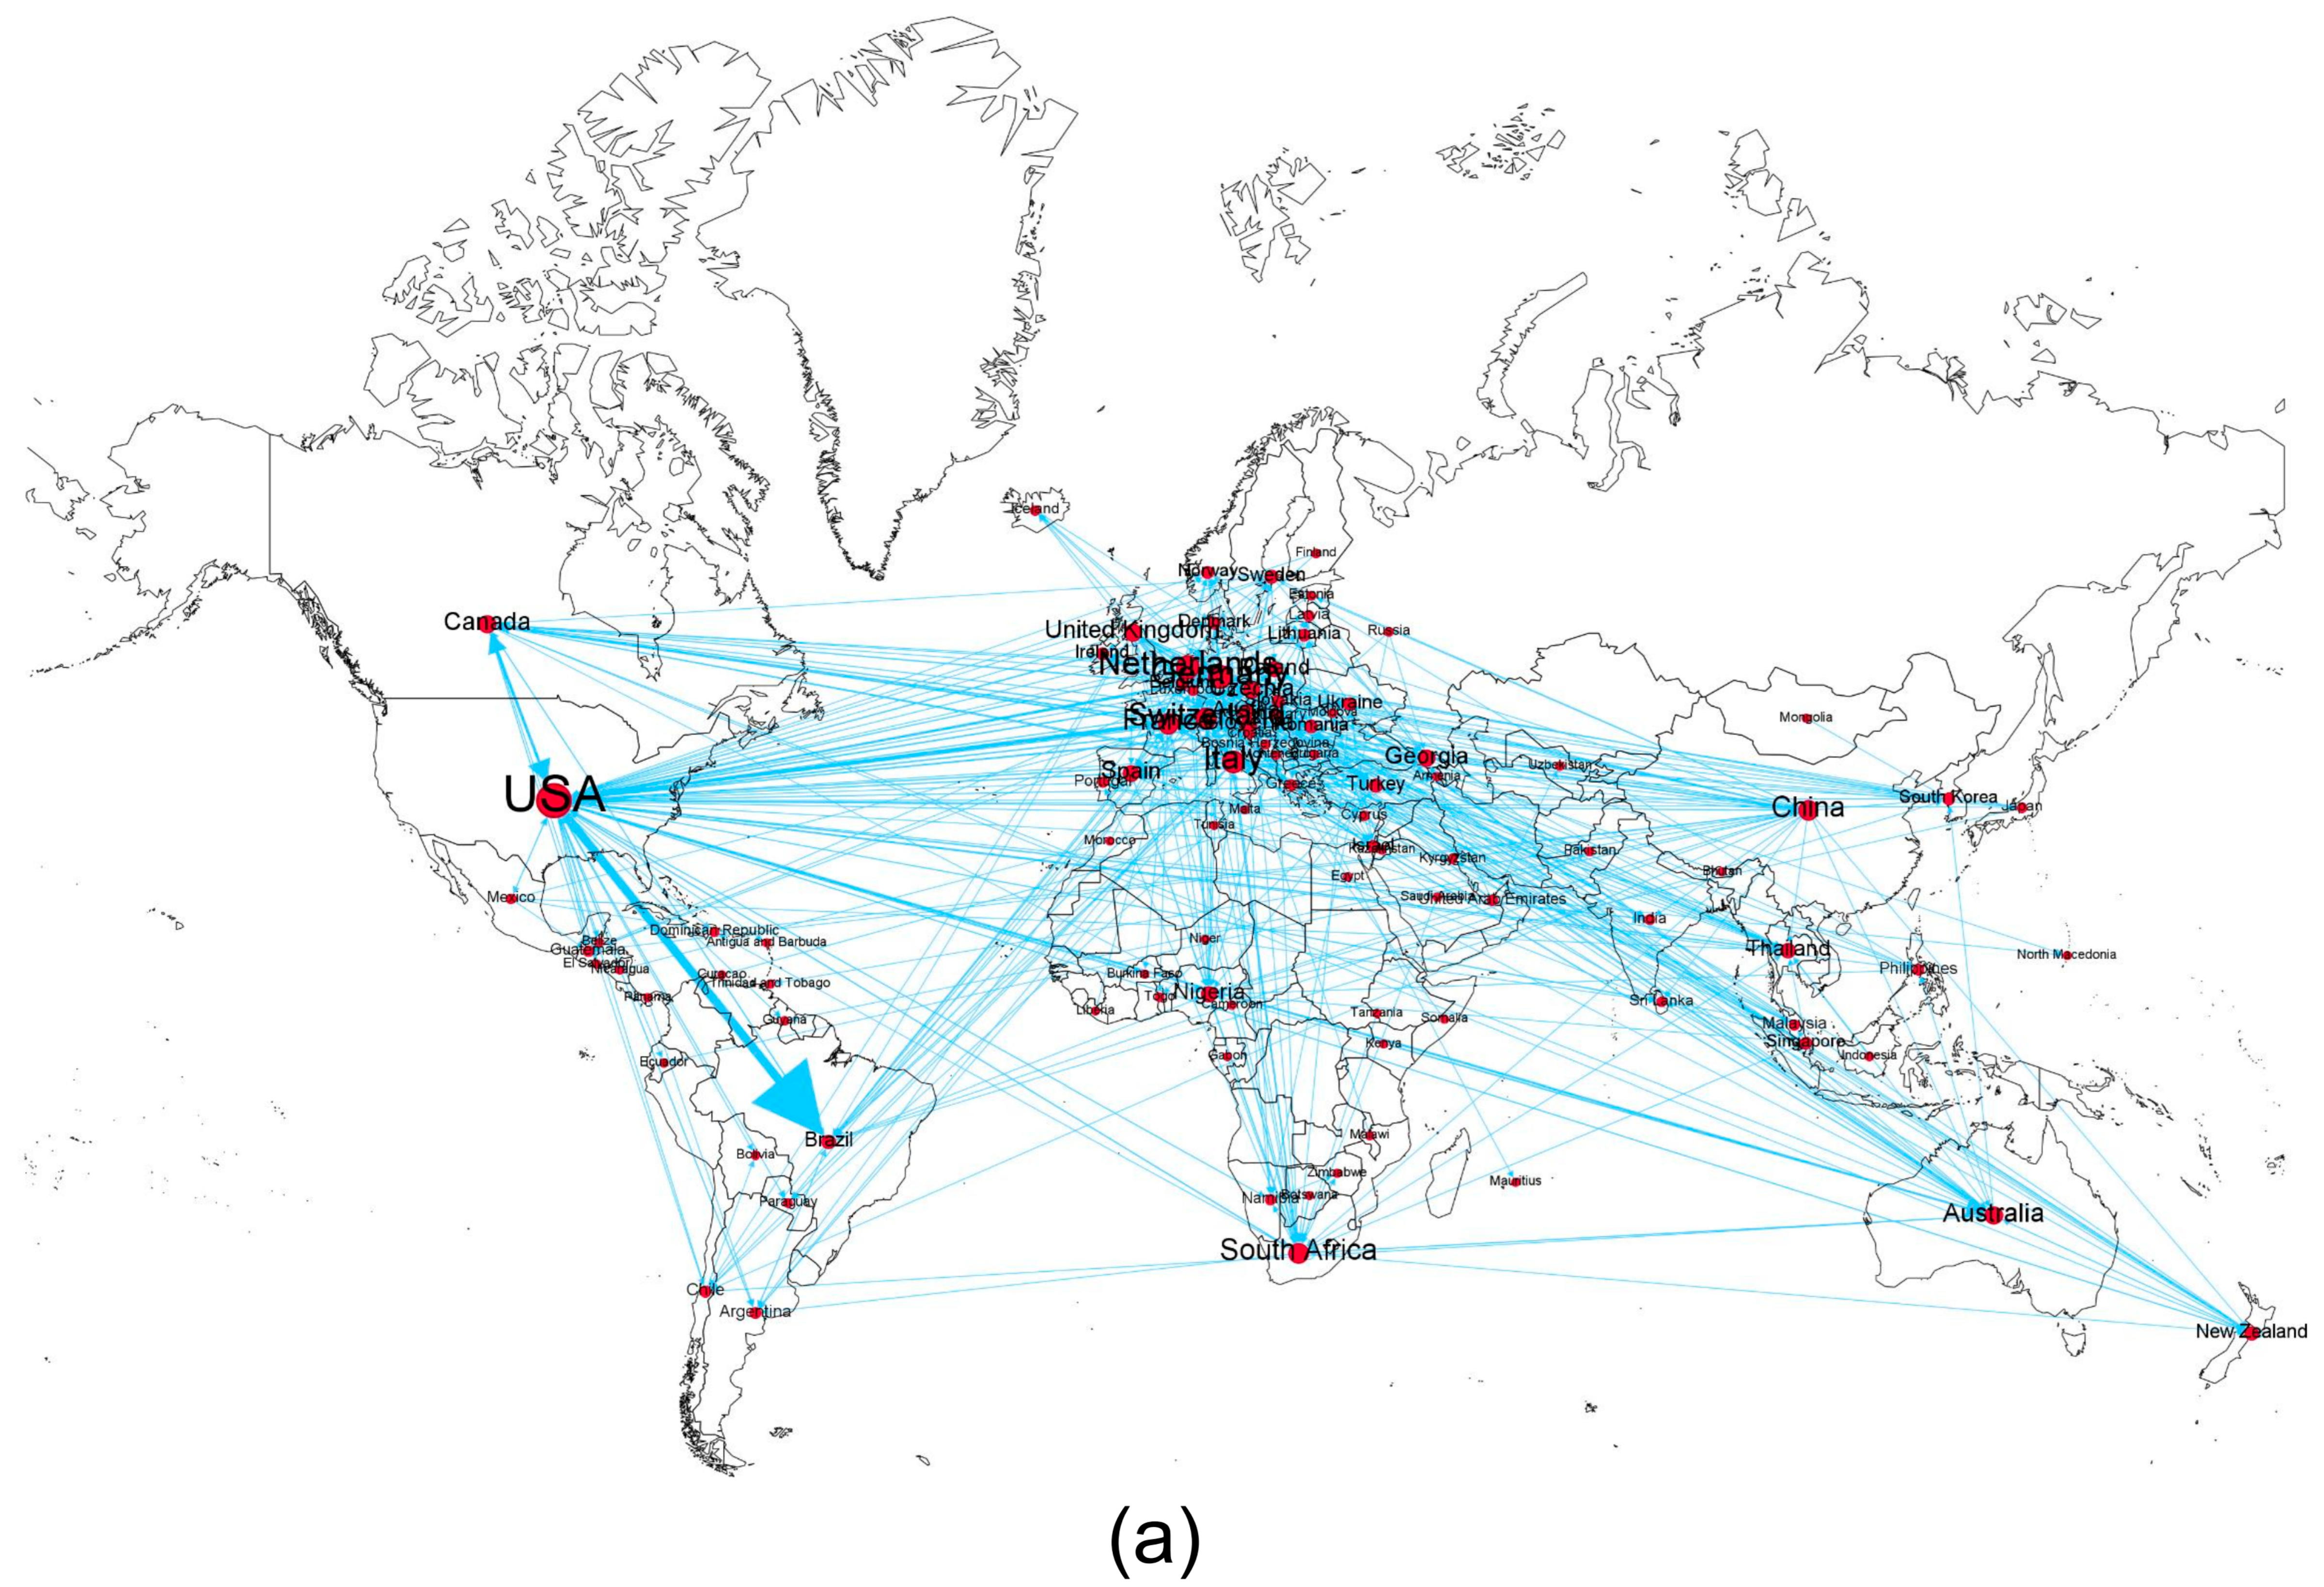
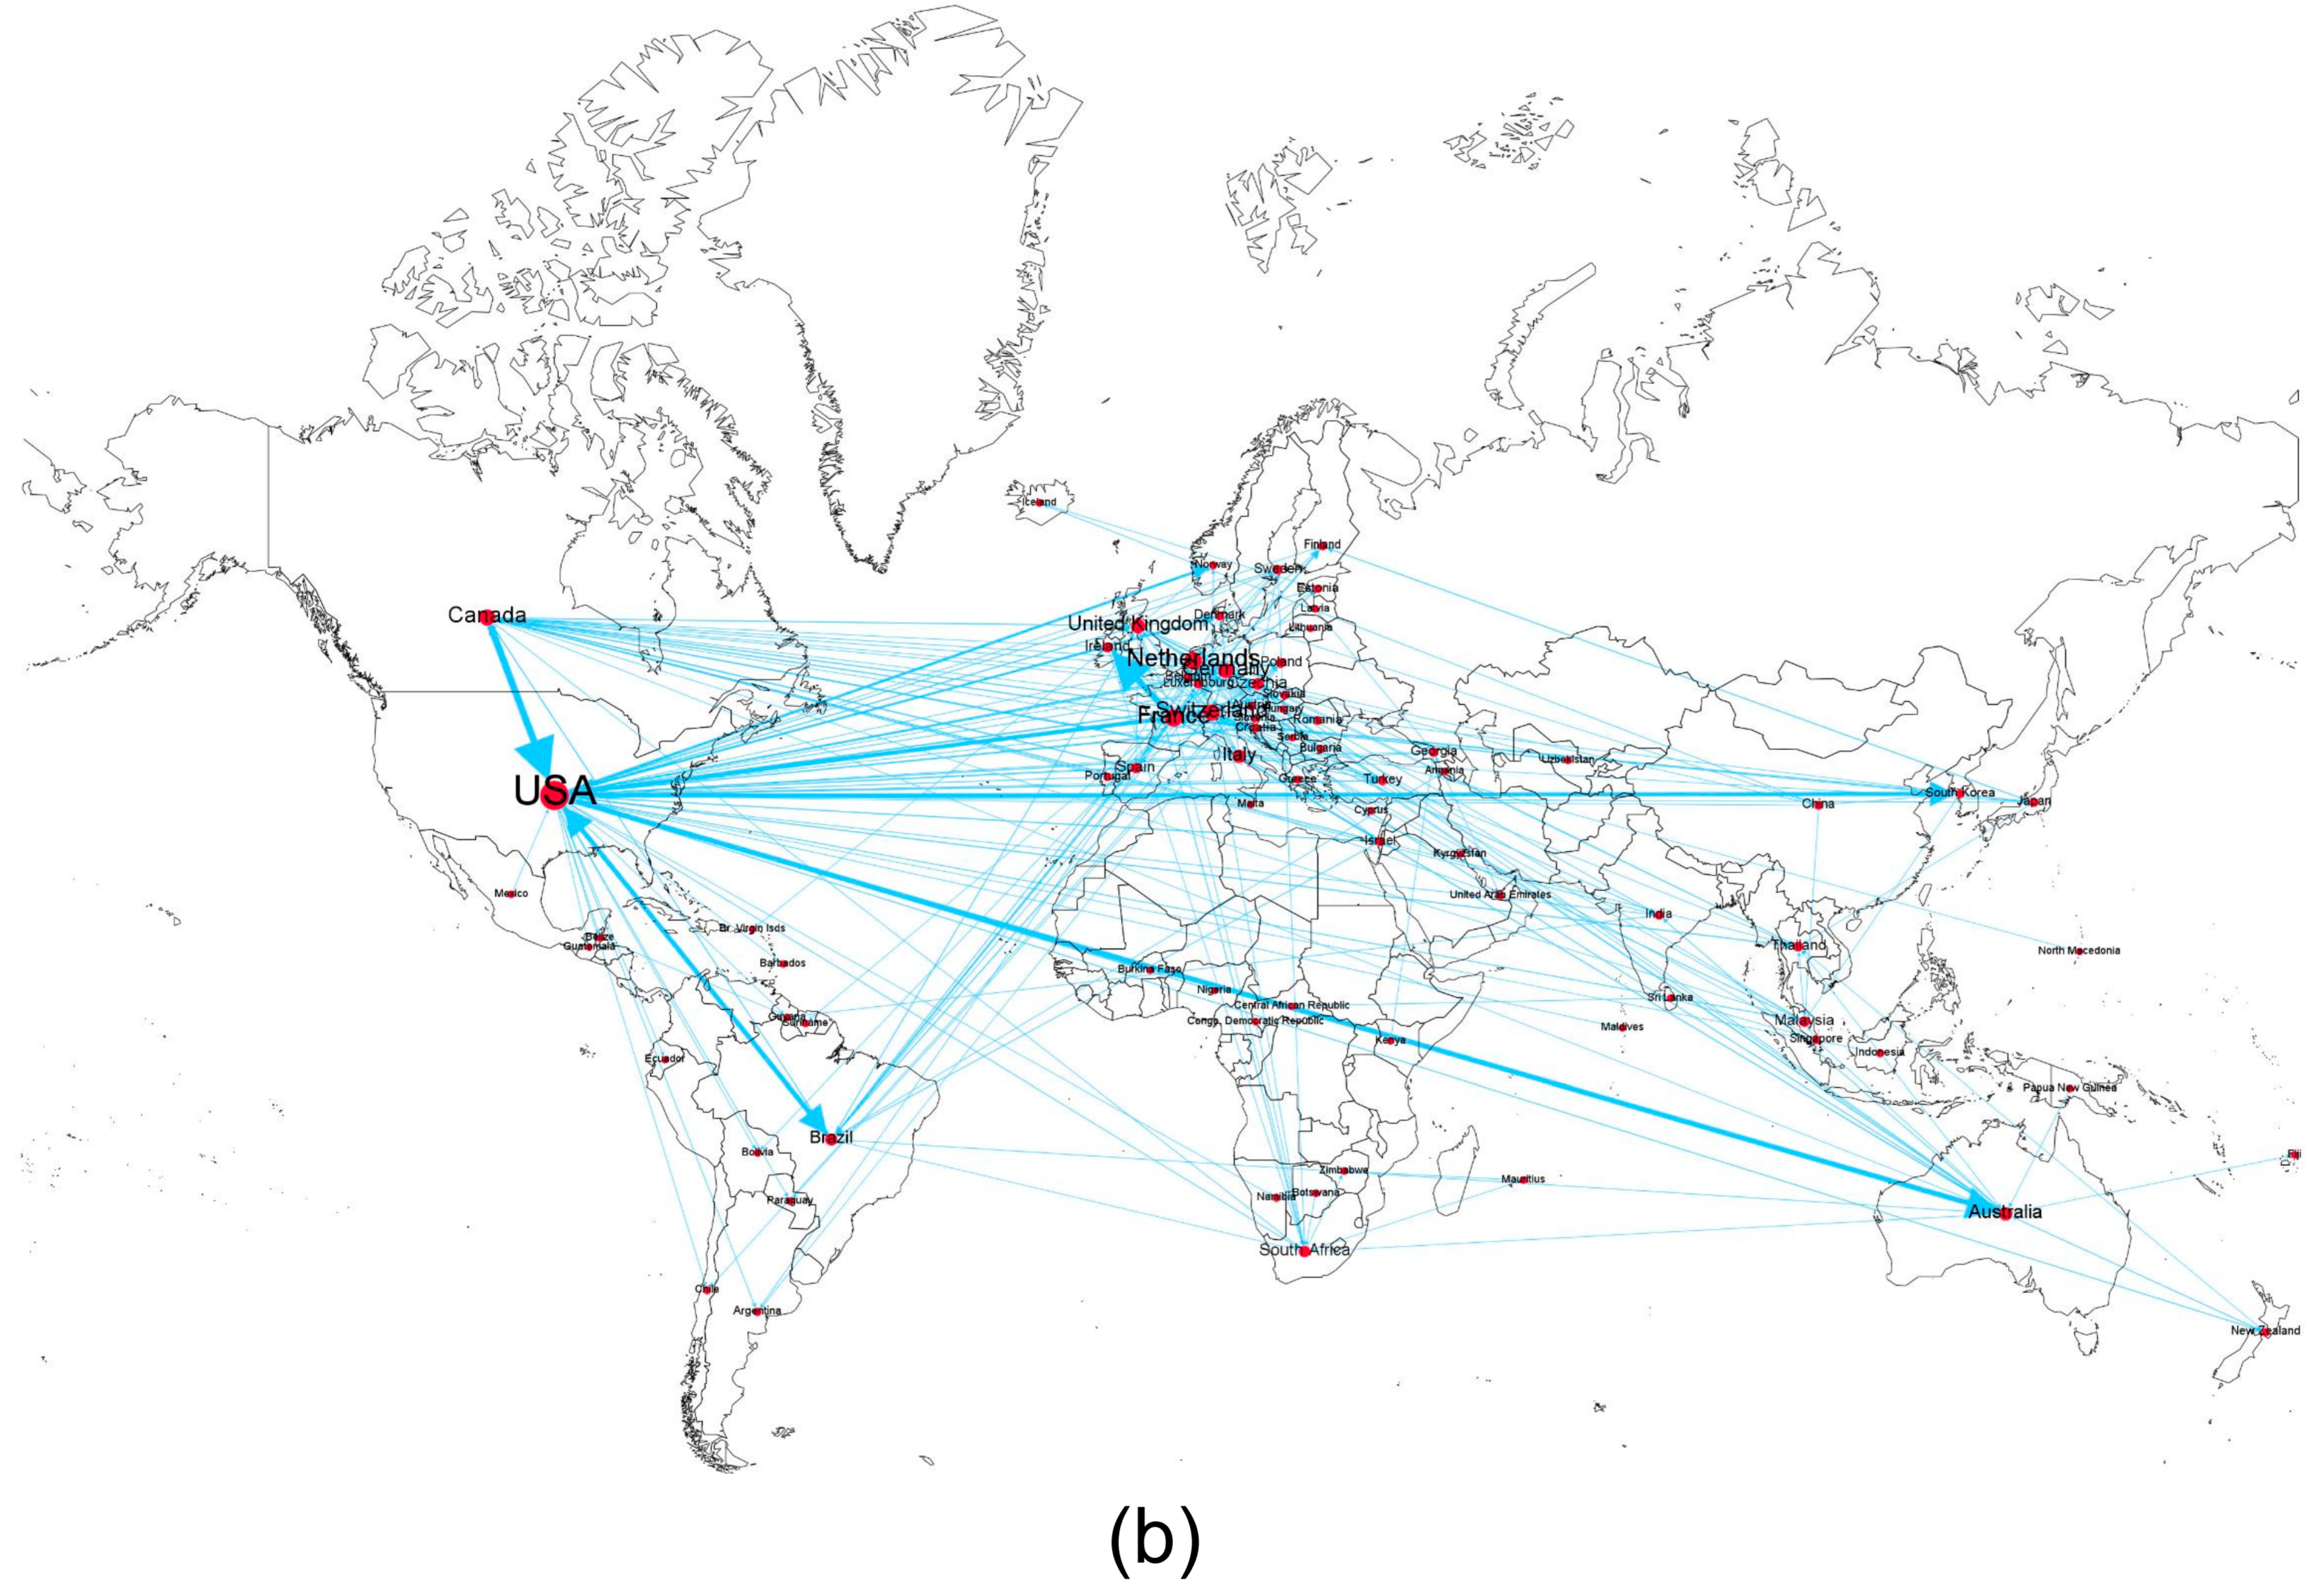
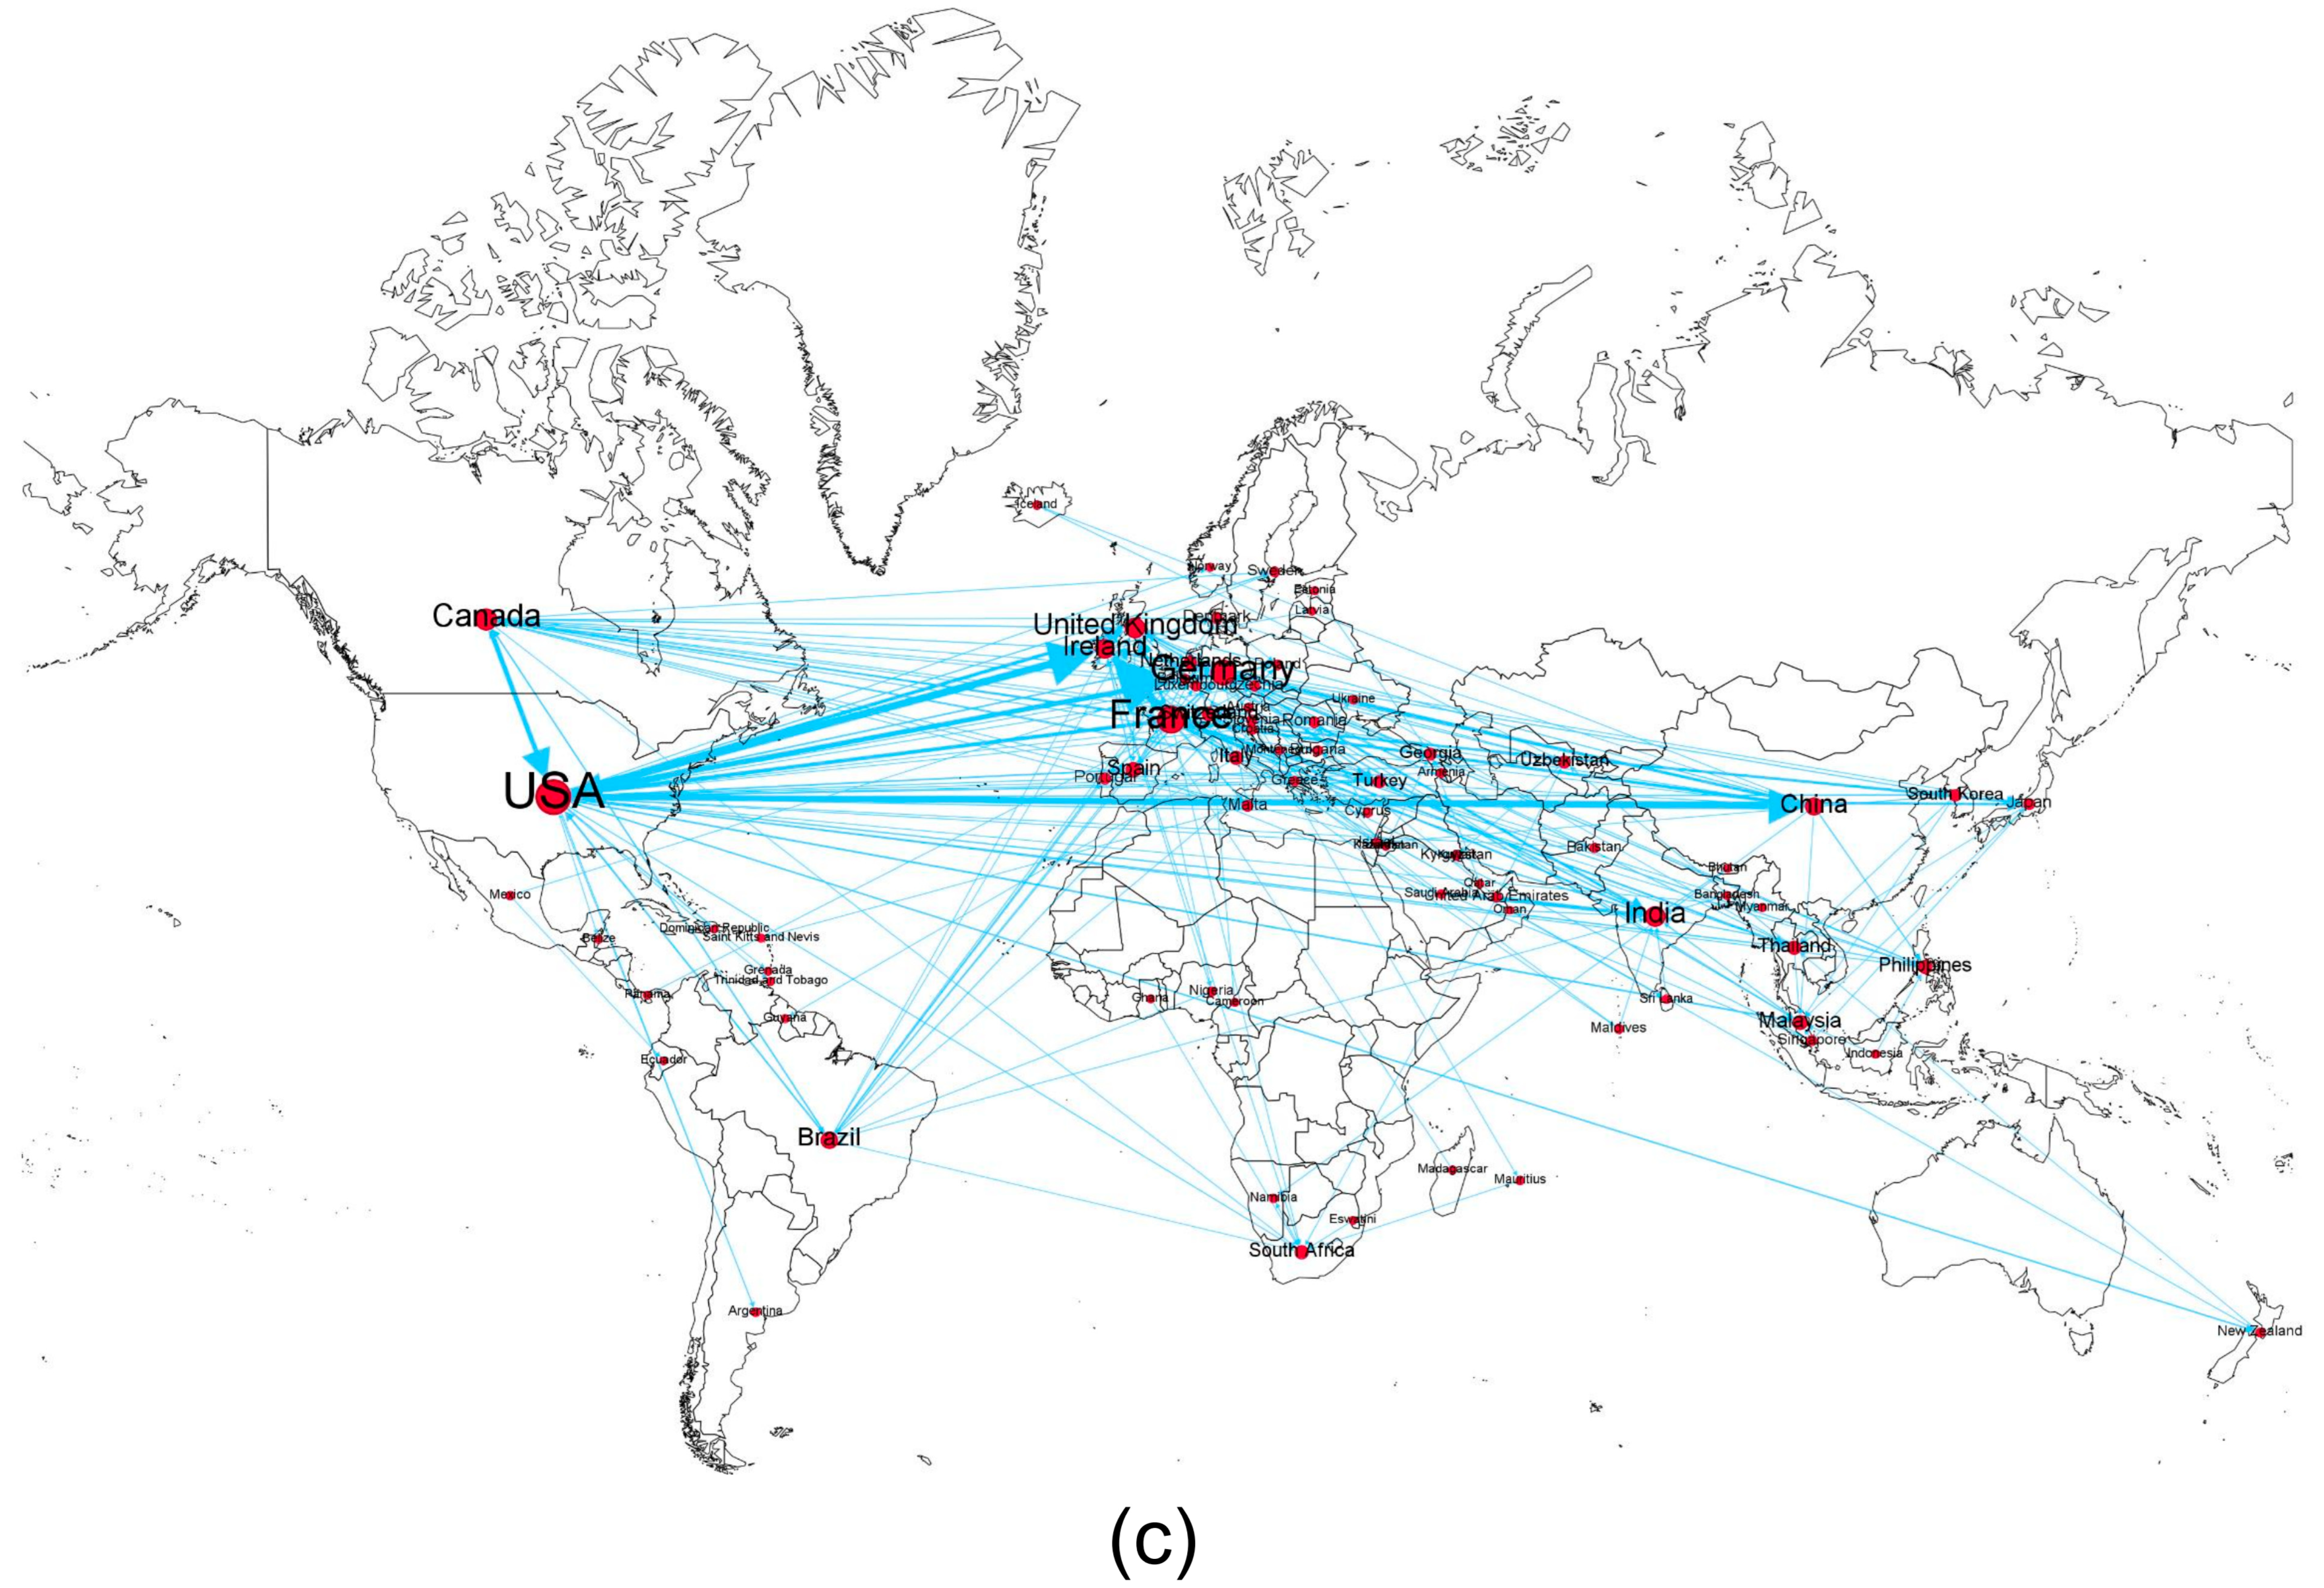
Figure 3 illustrates the trade networks for small, medium, and large aircraft in 2024, and Table 1 shows the average values of network indicators from 2015 to 2024. In 2024, 101 countries and regions participated in the global small aircraft trade, encompassing 511 trade routes. For medium aircraft, 80 countries and regions were involved, comprising 274 trade routes. Similarly, 80 countries participated in the large aircraft trade, which included 246 trade routes. The small aircraft trade network demonstrates greater complexity than the medium and large aircraft networks, involving the most participating countries. Furthermore, the global small aircraft trade network exhibited higher average network density and a higher average clustering coefficient, along with a shorter average path length, compared to the medium and large aircraft trade networks. This indicates that the global small aircraft network operates with greater efficiency, features tighter connections among countries, and demonstrates a more clustered characteristic.
To analyze the degree distribution characteristics of small, medium, and large global aircraft trade networks, we plotted scatter plots of their degree distributions along with fitted curves for 2024. As shown in Figure 4, these three GATNs all approximately follow a power-law distribution, consistent with the properties of scale-free networks. It indicates that most nodes have a low degree, while only a few nodes have a high degree; these high-degree nodes play a dominant role in the networks. A typical characteristic of a scale-free network is that it can quickly collapse when nodes with high degrees are targeted for attack. In contrast, it can usually maintain its basic structure and function when facing random failures.
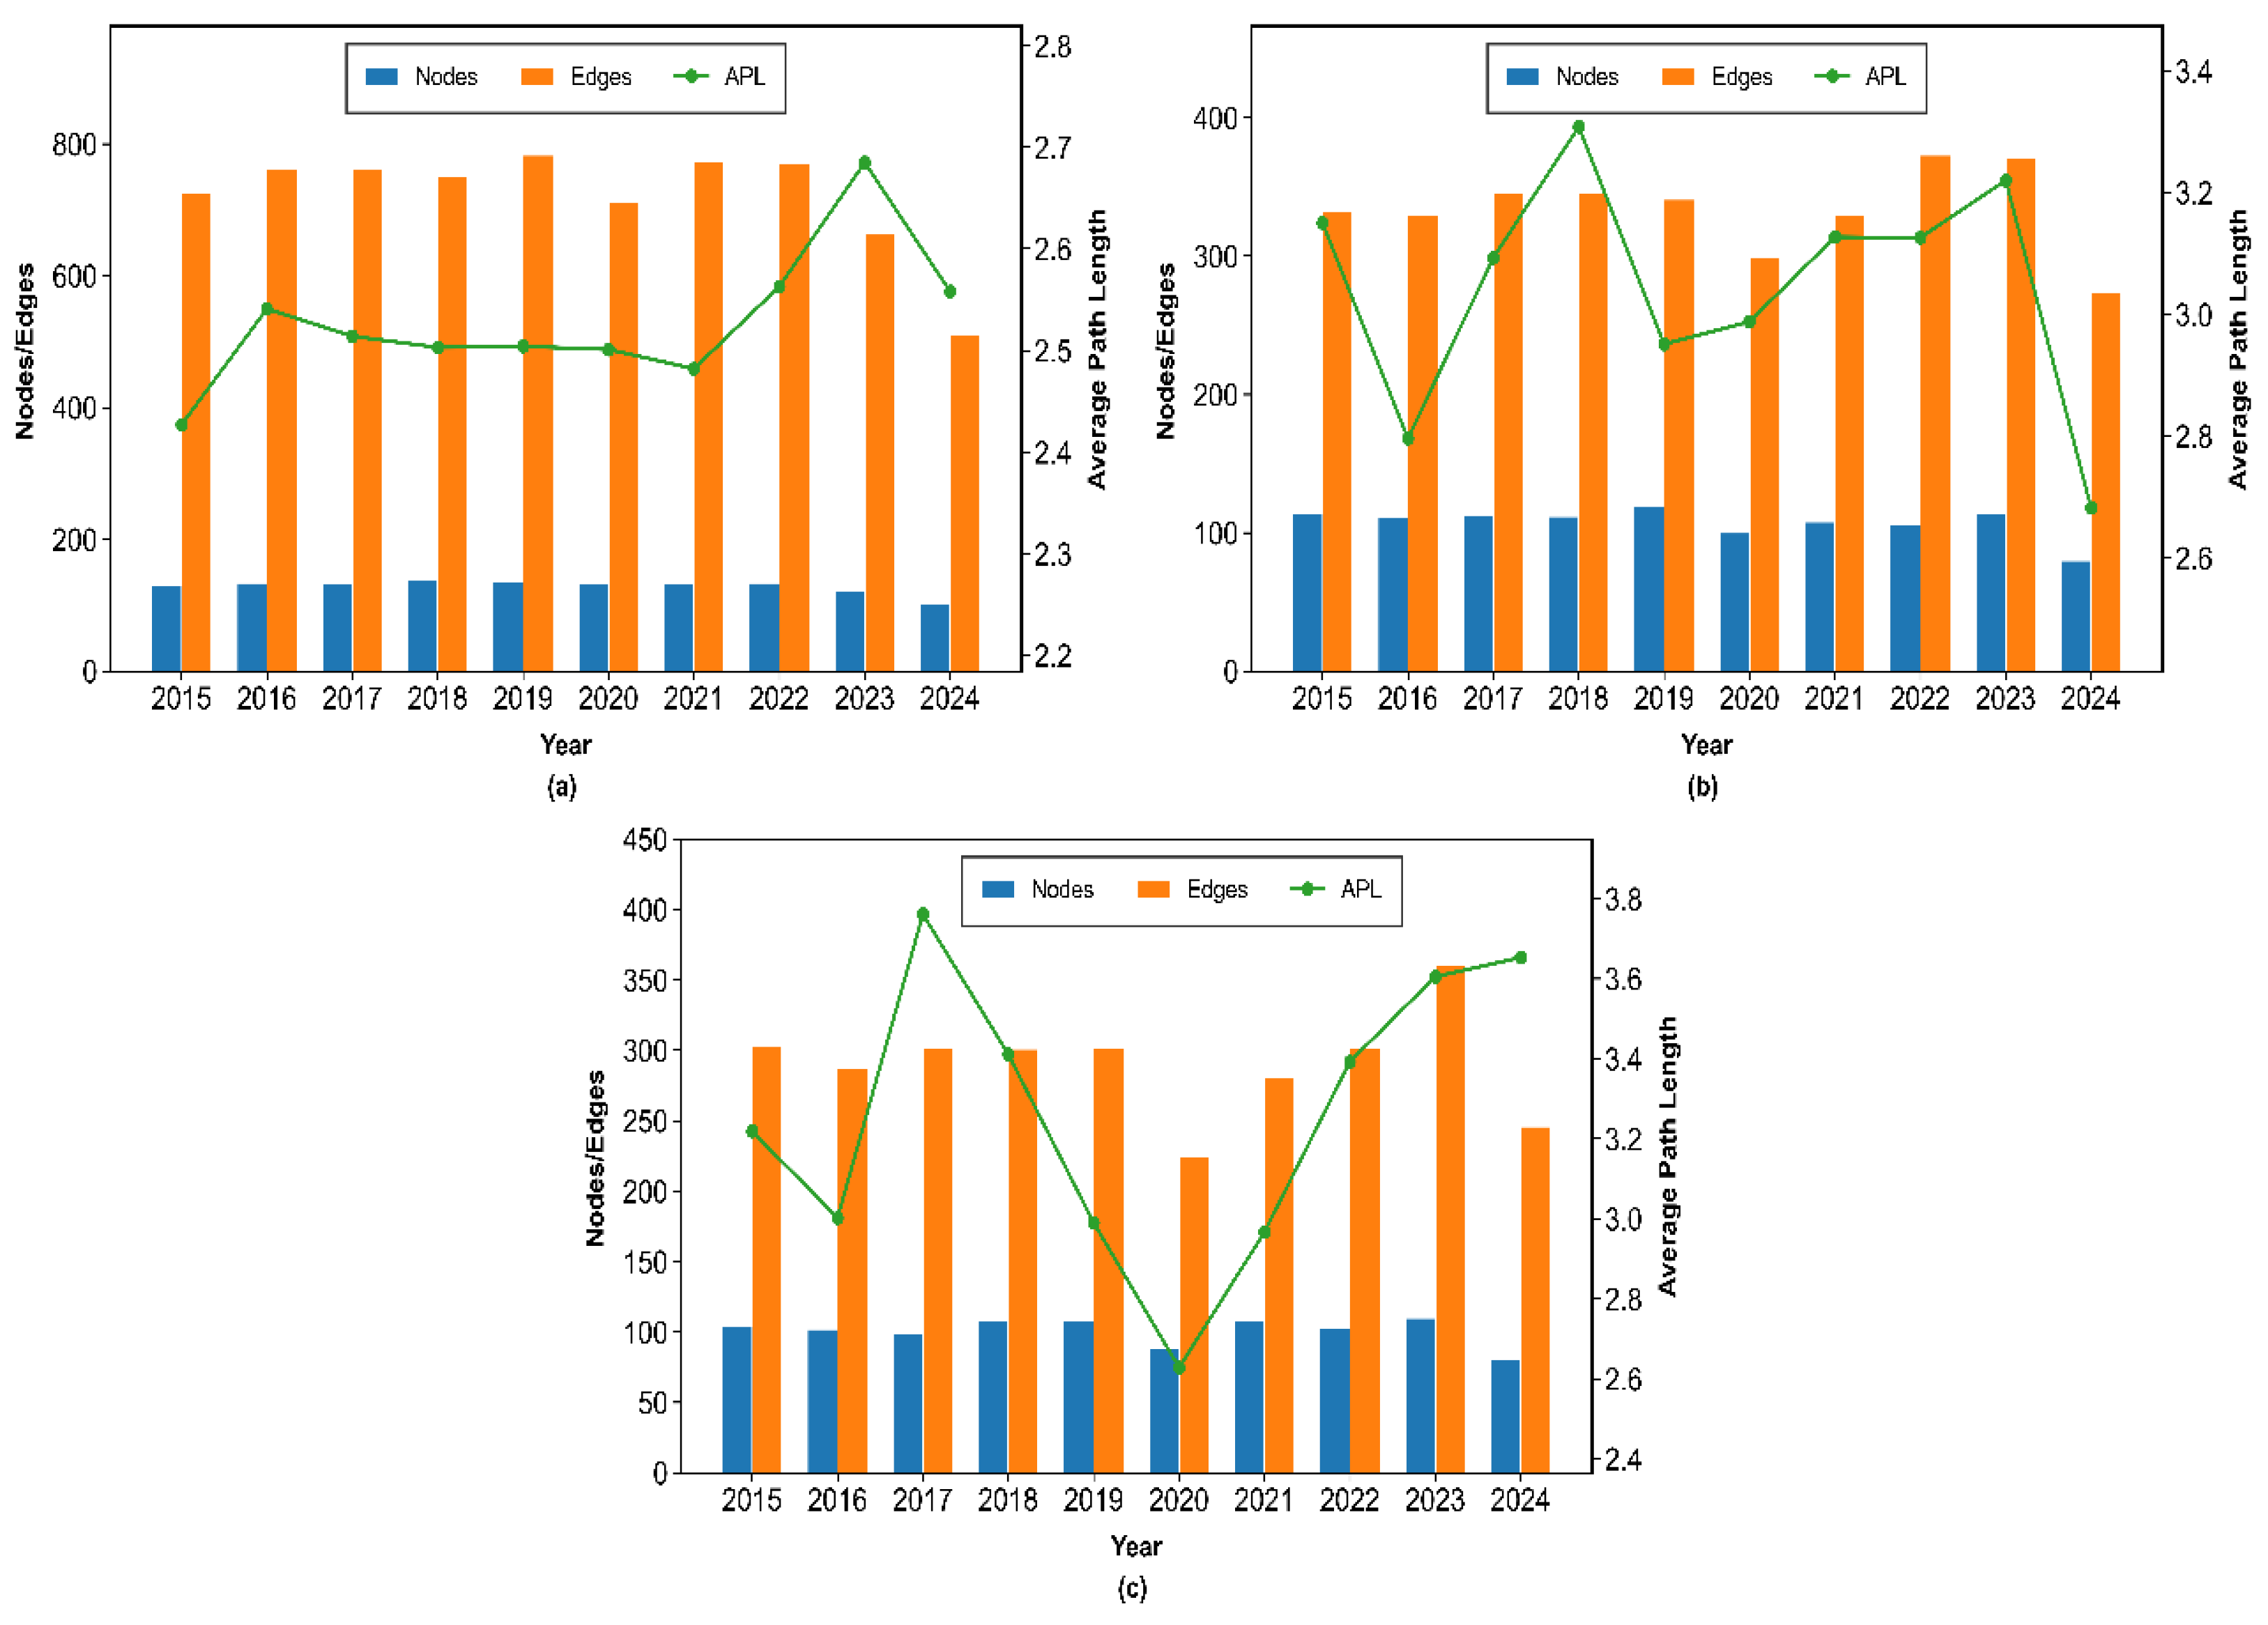
Figure 5 presents the quantities of nodes, edges, and the APL for three distinct categories of GATNs spanning 2015 to 2024. Between 2015 and 2022, the number of countries participating in the global small aircraft trade network and the number of trade edges remained relatively stable. The number of participating countries fluctuated between 131 and 138, while the number of trade edges remained steady between 711 and 770. In 2023, the number of countries involved in the global small aircraft trade network decreased to 122, and further declined to 101 in 2024. Concurrently, the number of edges in this network dropped to 663 in 2023 and 511 in 2024. Many countries withdrew from the small aircraft trade, primarily developing nations in Asia and Africa. These countries generally face economic fragility and fiscal pressures, making the purchase and operation of small aircraft particularly challenging [43]. Additionally, the immense value of small aircraft purchased in 2021 has preempted future demand. The number of countries participating in the global medium and large aircraft trade networks was significantly affected by the COVID-19 pandemic, as many airlines faced operational difficulties and bankruptcy [43]. In 2020, the number of countries in the global medium aircraft trade network decreased from 119 to 100, with trade network edges falling from 341 to 299. Similarly, the number of countries in the global large aircraft trade network declined from 108 in 2019 to 88 in 2020, with edges decreasing from 302 to 224. From 2021 to 2023, trade in medium and large aircraft gradually recovered, with the number of participating countries and trade routes steadily increasing. However, in 2024, the number of participating countries and trade routes for medium and large aircraft experienced a significant decline. Considering that trade value for medium aircraft increased while large aircraft decreased substantially in 2024, this outcome may be attributed to three possible factors. First, amid a global economic downturn and high oil prices, some airlines replaced specific large aircraft with medium ones to reduce costs. Second, increasingly complex geopolitical factors and rising trade protectionism have impacted the procurement of both medium and large aircraft [44]. Finally, a series of safety incidents involving Boeing in 2024 led to delays or cancellations of some orders.
From 2015 to 2024, the APL of the global small aircraft trade network remained stable at 2.5, indicating low susceptibility to external influences and significantly outperforming medium and large aircraft networks in terms of efficiency. In contrast, the APL of the global medium aircraft trade network fluctuated considerably, peaking at 3.308 in 2018, when the network’s efficiency was at its lowest. This network exhibits a core–periphery structure, making it highly vulnerable to the influence of key nodes [45]. In 2018, the U.S.–China trade war erupted, and the Boeing 737 MAX crashes led to a loss of confidence in the aircraft among global airlines [4]. These events disrupted or suspended some trade relationships, resulting in less direct and less efficient network connections. The COVID-19 pandemic significantly impacted the APL for large aircraft, reaching its lowest point of 2.628 in 2020. Alongside reductions in trade value, participating countries, and trade edges, this apparent efficiency gain did not arise from network optimization but rather from the disappearance of numerous weak connections. The loss of links and contraction of trade relationships led to the network becoming more compact.
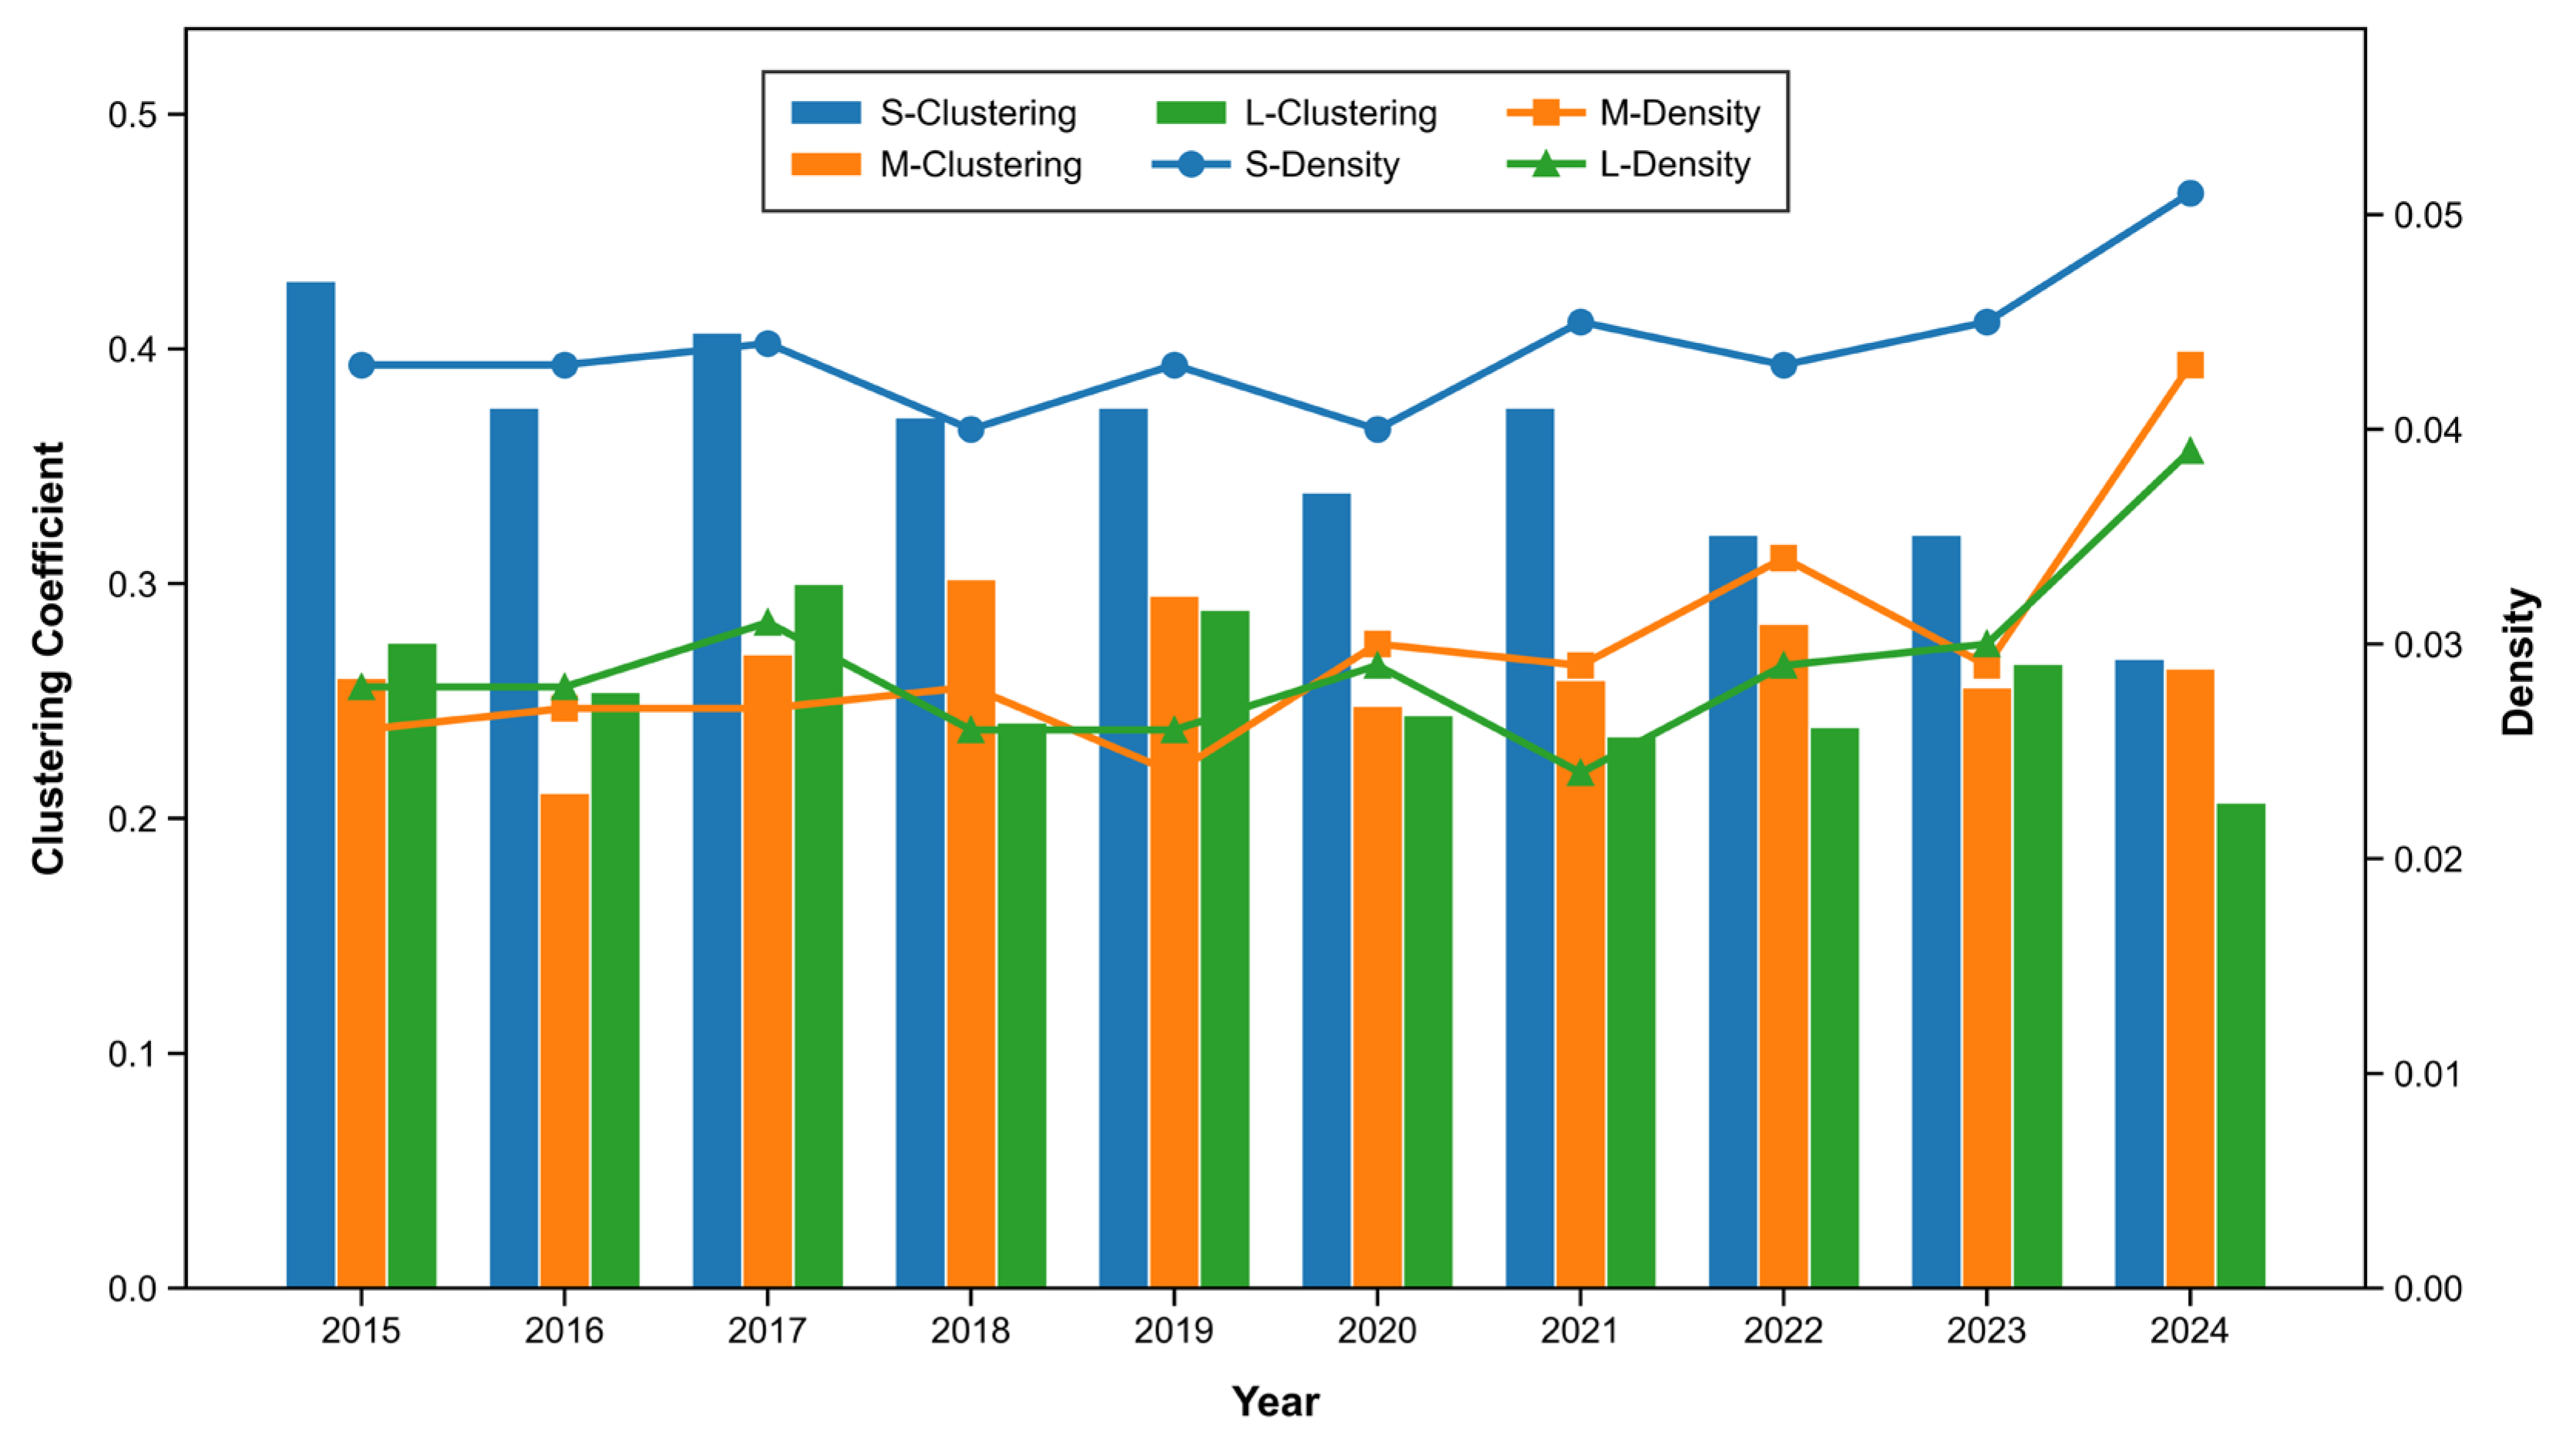
Figure 6 illustrates the network density and ACC of GATNs for different aircraft types. Regarding network density, all kinds of GATNs exhibit relatively low density with an upward trend. Among them, the global small aircraft trade network demonstrates higher density than the medium and large aircraft networks, fluctuating between 0.04 and 0.051. The global medium and large aircraft trade networks exhibit network densities ranging from 0.024 to 0.043, indicating sparse connectivity. In 2015, the global small aircraft trade network exhibited pronounced clustering, with the ACC reaching 0.423—the highest level in nearly a decade. From 2016 to 2021, the ACC fluctuated around 0.35, then declined to 0.305 in 2022 and decreased to 0.263 by 2024. The ACC of the global medium aircraft trade network remained stable around 0.25 in most years, except in 2016, when it reached its lowest point of 0.203. The ACC of the global large aircraft trade network remained stable between 2015 and 2023, peaking at 0.282 in 2019 but declining significantly to 0.211 in 2024. Notably, in 2024, the network density of the GATN for all three categories increased significantly. An examination of the trade relationships of each node revealed that the majority of nodes did not see an increase in connections. This suggests that the rise in network density was not due to a genuine strengthening of trade ties among existing nodes, but rather a result of the withdrawal of a large number of peripheral nodes, which reduced the overall network size. Additionally, the COVID-19 pandemic outbreak in 2020 led to a substantial decrease in the ACC across global trade networks for all three aircraft types, indicating that post-pandemic trade among nations has become more concentrated, shifting from multilateral trade to trade among a smaller number of countries. After several years of recovery, the ACC of the global medium aircraft trade network has approached pre-pandemic levels. However, the ACC of the global small and large aircraft trade networks remain significantly below their pre-pandemic levels.

4.3. Node Importance Evaluation Analysis

The entropy weight method was employed to calculate the topological indicator weights for the global trade networks of small, medium, and large aircraft, as shown in Table 2. The results indicate that strength and betweenness centrality carry the greater weights, emphasizing their critical roles in analyzing network characteristics and identifying key nodes.
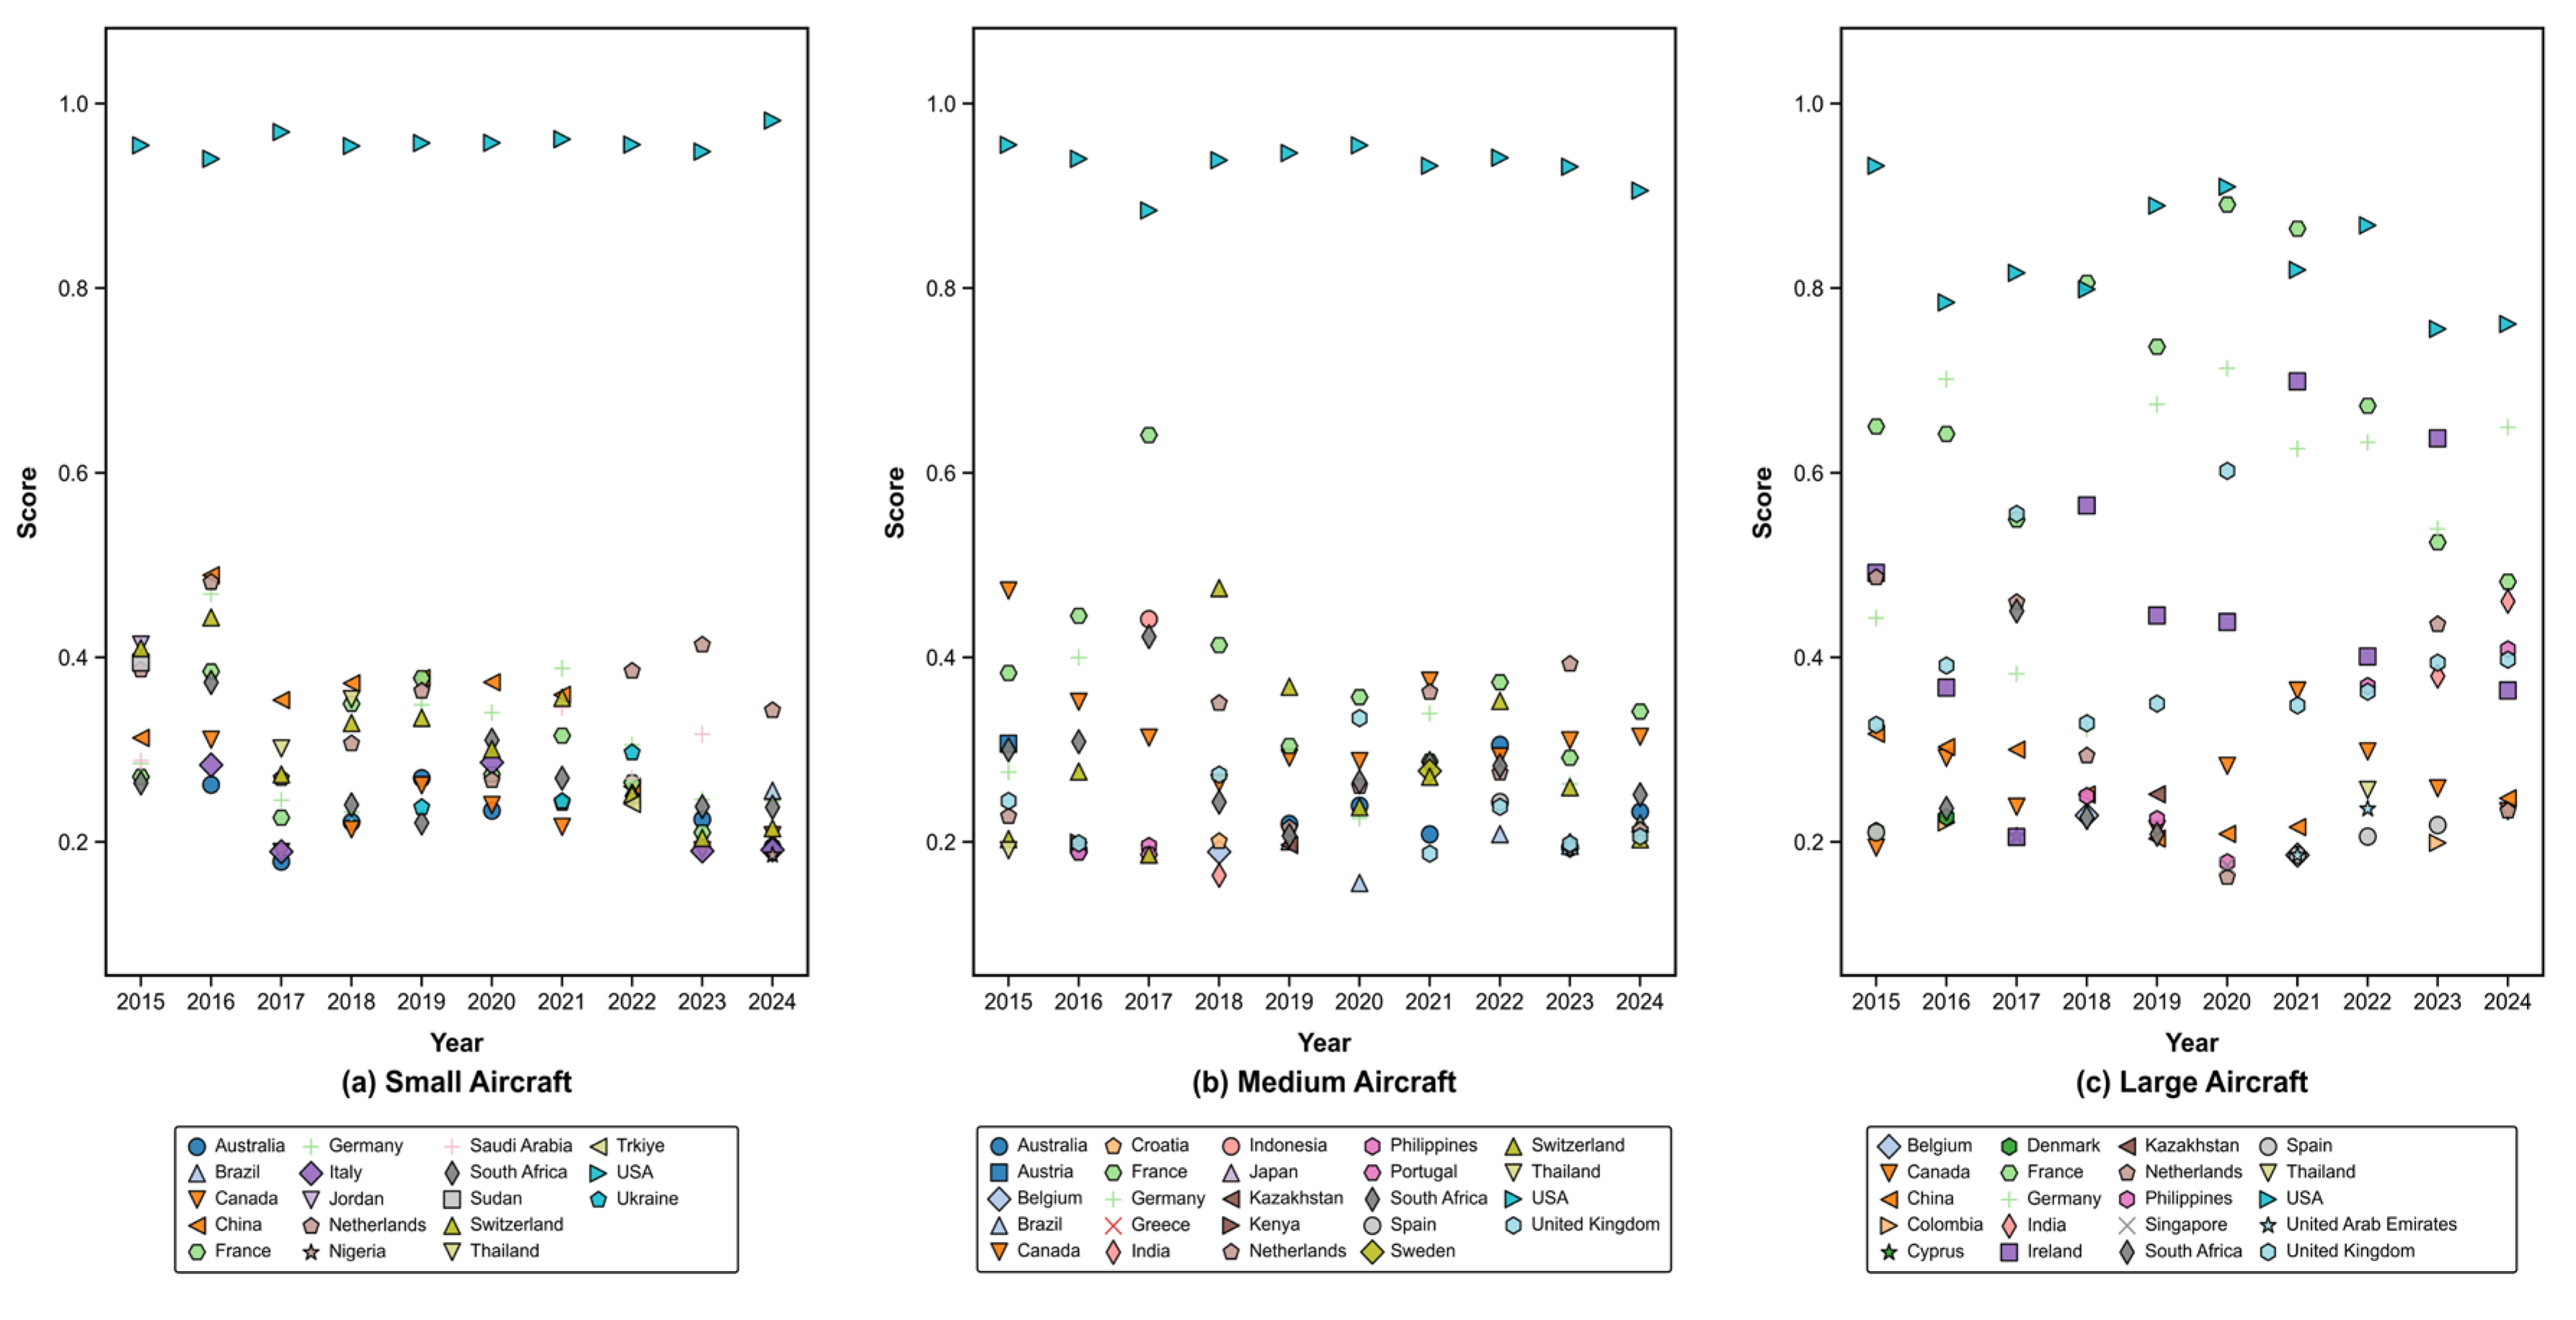
A comprehensive node importance evaluation was conducted using the TOPSIS method and node indicator weights for three distinct categories within the GATNs. Figure 7 presents the top ten countries by node importance in the global trade networks for small, medium, and large aircraft from 2015 to 2024. The results indicate that the United States holds the most significant position in the GATNs. Key nodes in the global small aircraft trade network have experienced substantial changes over the past decade, reflecting considerable volatility in small aircraft trade among nations. For example, Jordan’s share of global light aircraft exports reached 31.89% in 2015, ranking second to the United States. This surge was primarily driven by Sudan’s import of approximately $600 million worth of small aircraft from Jordan, accounting for roughly 30% of the global trade value in small aircraft. This transaction propelled Sudan and Jordan into the top five in the 2015 global small aircraft trade rankings. However, in subsequent years, neither country’s import nor export value has ranked among the world’s top ten.
Compared to small aircraft, medium and large aircraft are more challenging to manufacture and incur higher costs. Consequently, the key nodes within the global medium and large aircraft trade networks have remained essentially unchanged over the past decade, with country rankings showing relative stability. In the medium aircraft trade network, the United States, France, Canada, South Africa, Germany, and Switzerland have consistently ranked among the top ten in node importance for most years, with the overall network exhibiting a pattern of one dominant player alongside several strong competitors. In the medium aircraft trade network, aside from the United States, the scores of the other top 10 most influential countries show an increasingly converging trend. In the global large aircraft trade network, the United States, France, Germany, Ireland, Canada, the United Kingdom, and China consistently rank among the top ten in importance. The score gap between France, Germany, Ireland, and the United States is relatively small, particularly for France, whose score surpassed that of the United States in 2018. Therefore, compared to the medium aircraft trade network, the United States’ dominance in the large aircraft trade network is diminishing, currently reflecting a state where multiple major players coexist.

4.4. Robustness of the GATN

When the GATN is subjected to external attacks, its connectivity and efficiency are compromised. These external attacks primarily include random node attacks (RAs) and targeted node attacks (TAs). RA involves randomly removing nodes from the network, whereas TA sequentially remove nodes in descending order of importance, as determined in Section 3.3.
The initial average connectivity of the GATNs across all three categories approaches 1, indicating virtually no isolated trade relationships within these networks. From 2015 to 2024, the initial average network efficiency for global small, medium, and large aircraft trade networks was 0.47, 0.44, and 0.43, respectively. This disparity may result from the greater complexity inherent in the small aircraft trade network.

4.4.1. Analysis of the Robustness of the GATN Under Random Node Attacks

Figure 8 presents the robustness results of GATNs across different categories under the RA for the period 2015–2024. Over time, the global medium aircraft trade network maintained consistent accessibility trends throughout the study period, while the global small and large aircraft networks fluctuated significantly in 2015, which may be attributed to fewer peripheral nodes in that year.
Under RA, network efficiency exhibits a nonlinear declining trend, indicating that specific nodes either enhance or inhibit network performance. Simultaneously, changes in global aircraft trade efficiency under RA follow a convex curve, indicating that the failure of a single node has a minimal impact on overall network efficiency. Many nodes under RA can find similar alternative paths, so randomly removing less critical nodes has a limited effect on network efficiency. Consequently, network efficiency remains relatively stable after deleting 30% of the nodes. However, network efficiency declines more rapidly after substantial node removals, with the network nearly collapsing when approximately 90% of nodes are removed. Over time, the efficiency trends of both small and large aircraft trade networks under RA have been largely consistent across the years, except for 2015, which is likely due to the relatively straightforward network structure observed that year.

4.4.2. Analysis of the Robustness of the GATN Under Targeted Node Attacks

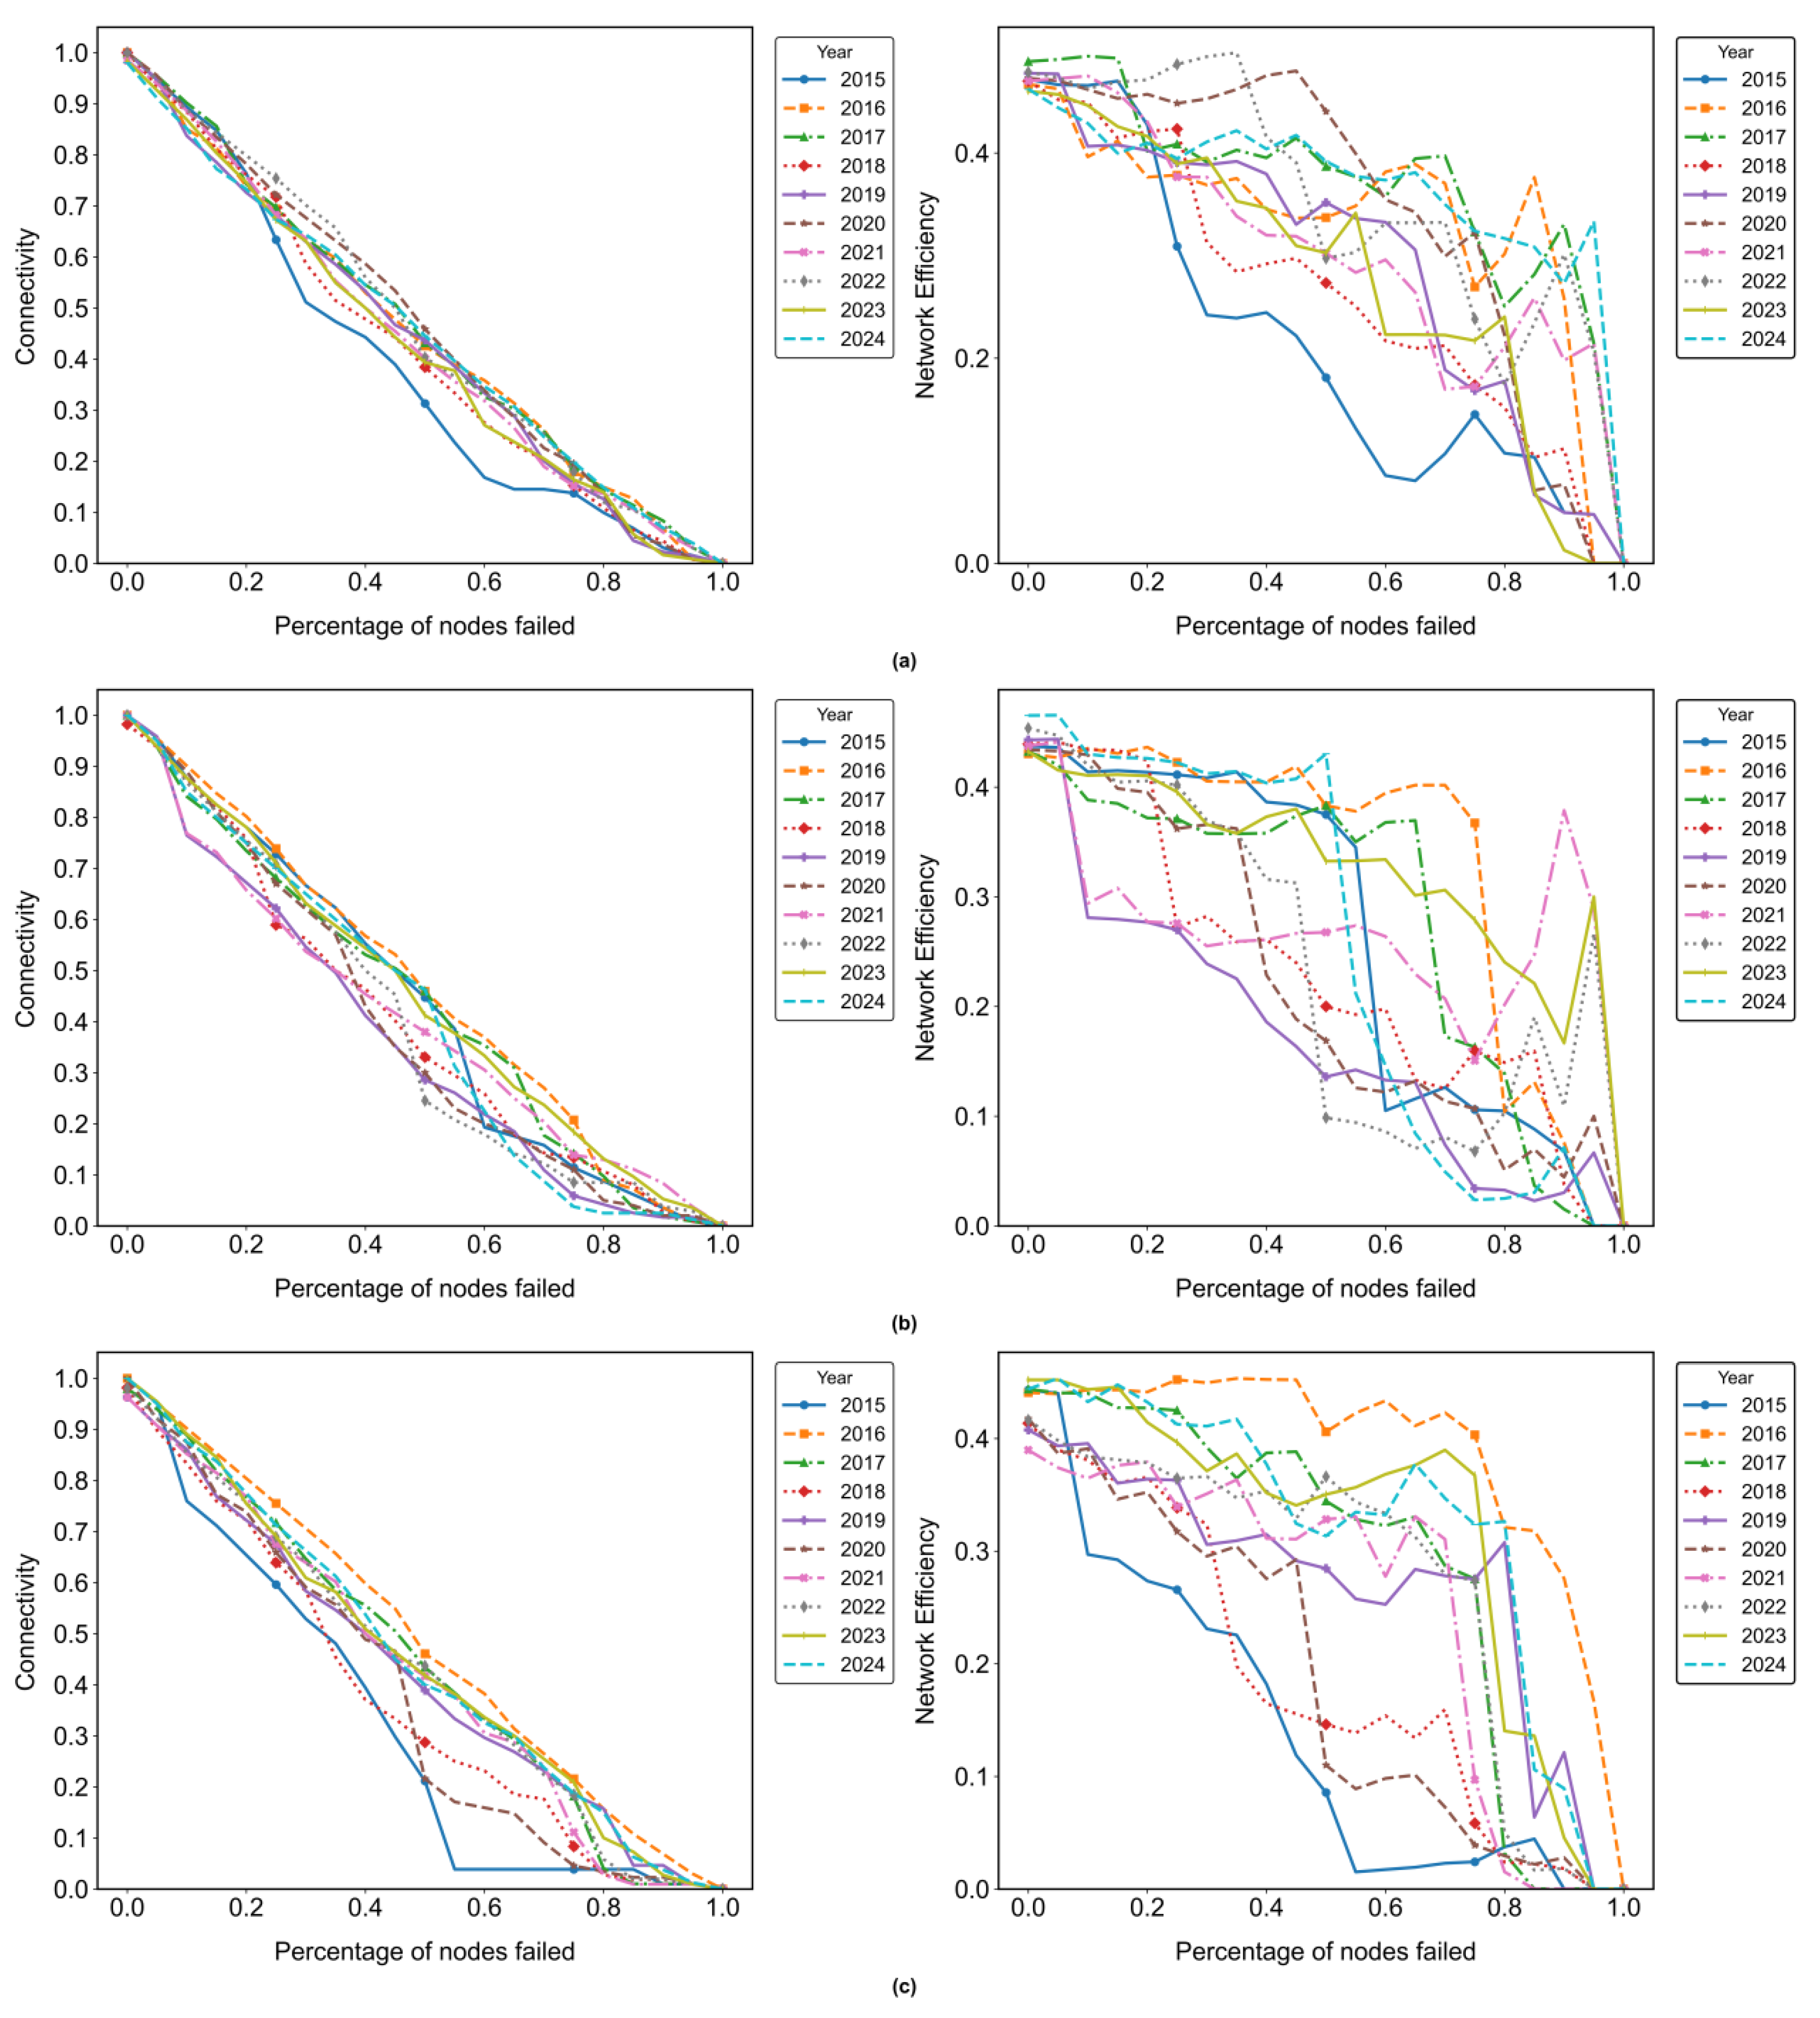
Targeted node attacks on the GATN involve systematically removing nodes in descending order of their importance. As the proportion of failed nodes increases, the network’s connectivity and efficiency gradually decline to zero. Figure 9 illustrates the changes in connectivity and efficiency over a decade for three distinct aircraft categories under the TA model. The network demonstrates significant vulnerability under TA. Compared to RA, the network collapses much more rapidly under TA and exhibits substantially lower robustness. This indicates that a few critical countries play a pivotal role in the aircraft trade network: removing these key countries can easily lead to the paralysis of the entire network.
Overall, the robustness of the global small aircraft trade network under TA is higher than that of the global medium and large aircraft trade networks. In contrast, the robustness difference between the medium and large aircraft trade networks is insignificant. Regarding connectivity across different types of aircraft trade networks, when the node failure rate reaches 10% in the global small aircraft trade network, connectivity drops to approximately 0.6. In contrast, connectivity in the global medium and large aircraft trade networks declines to around 0.4. Regarding efficiency, when the node failure rate in the global small aircraft trade network reaches 20%, network efficiency decreases to approximately 0.1. In contrast, the efficiency of the global medium and large aircraft trade networks falls to around 0.05. Compared to medium and large aircraft, small aircraft are relatively easier to manufacture and have lower import costs. Consequently, more countries participate in their trade networks, increasing their complexity. This complexity provides greater robustness against TA than medium and large aircraft networks.
The failure process of GATN across different categories under TA can be generally delineated into three phases. The first stage (removal of the top 10% of nodes) represents a period of drastic change, characterized by a sharp decline in network connectivity and efficiency. Over a decade, the average connectivity decline for small, medium, and large aircraft networks reached 36%, 50%, and 51%, respectively, while the average efficiency decline over the same period reached 59%, 77%, and 77%, respectively. This demonstrates the aircraft trade network’s heavy reliance on a few critical nodes; the removal of these nodes causes widespread disruptions to the paths between them. The second stage (removal of 10–25% of nodes) is the collapse phase. During this period, network connectivity and efficiency continue to decline, but at a slower rate. Connectivity for small, medium, and large aircraft trade networks decreased to 0.27, 0.15, and 0.17, respectively, while efficiency dropped to 0.05, 0.02, and 0.02. Although the nodes removed in this phase are not core, they are relatively important secondary nodes in the network, causing it to fragment into isolated subgraphs. The third stage (removal of more than 25% of nodes) is the paralysis phase, where network connectivity and efficiency approach zero. The remaining nodes cannot form effective connections, and network functionality is almost completely lost.
From a temporal perspective, the global small aircraft trade network under TA exhibited greater robustness after 2021 than before 2021. In 2021, the immense value of small aircraft purchased 2021 has preempted future demand. Concurrently, after 2021, global economic growth slowed down, and many developing countries in Africa and Asia, which generally faced economic vulnerabilities and fiscal pressures, were unable to purchase or operate more small aircraft, thus withdrawing from the small aircraft trade network. The reduction in peripheral nodes in the small aircraft trade network led to an increase in network density, thereby enhancing the cohesion, interdependence, and trade efficiency among core members, and ultimately strengthening the network’s robustness.
The COVID-19 pandemic had a more severe impact on the global medium and large aircraft trade networks than on the small ones. In 2020, their robustness declined significantly compared to previous years. Following the failure of the top 10% of nodes, the connectivity of the global medium aircraft trade network dropped from 0.51 in 2019 to 0.36 in 2020, while efficiency decreased from 0.1 to 0.05. The global large aircraft trade network experienced declines in connectivity and efficiency from 0.43 and 0.07 in 2019 to 0.35 and 0.06 in 2020, respectively. In 2021, the robustness of the global medium aircraft trade network recovered; after the failure of the top 10% of nodes, its connectivity and efficiency remained at 0.47 and 0.08. However, the robustness of the global large aircraft trade network deteriorated further, with connectivity and efficiency dropping to 0.33 and 0.06, respectively, lower than in 2020. The 2024 global medium and large aircraft trade networks demonstrated the strongest resilience. After 10% node failures, the 2024 medium aircraft trade network achieved connectivity and efficiency of 0.58 and 0.15, respectively, while the large aircraft trade network maintained connectivity and efficiency at 0.66 and 0.2. This indicates increased network redundancy within the global medium and large aircraft trade networks, strengthened connections to secondary nodes, and a gradual decentralization of network hubs.

5. Conclusions and Suggestions

This study employed complex network methods to construct three GATNs, analyzing the evolutionary characteristics and robustness of trade networks for three distinct aircraft categories from 2015 to 2024. Methodologically, an integrated evaluation framework is developed using the entropy-weighted TOPSIS approach. This multidimensional method incorporates topological features to identify key nodes within the GATN and establish their removal order in attack scenarios, thereby enhancing the accuracy and reliability of network robustness assessments. Meanwhile, this study enriches the research on global high-end manufacturing equipment trade. In terms of application, the comparison of evolutionary characteristics and robustness of the GATN yields valuable decision-making references for policymakers and industry stakeholders. Key findings are summarized below.
  • From 2015 to 2024, the global aircraft trade has exhibited fluctuating patterns, reflecting its cyclical nature. Influenced by trade wars, safety incidents, and the COVID-19 pandemic, trade value for both small and large aircraft has experienced significant volatility. In contrast, the trade of medium-sized aircraft has demonstrated a faster recovery during crises and has maintained a growth trend in recent years.
  • From the evolutionary characteristics of the GATN, the network exhibits scale-free properties and follows a power-law distribution. The average path length of the medium-sized aircraft trade network fluctuated significantly, peaking at 3.308 in 2018 when network efficiency was at its lowest. The COVID-19 pandemic significantly impacted the average path length for large aircraft, reaching its lowest point of 2.628 in 2020. This apparent increase in efficiency did not result from network optimization but rather from the disappearance of numerous weak ties and the contraction of trade relationships, making the network more compact. Consequently, the number of countries participating in aircraft trade decreased after the pandemic, with trade becoming more concentrated between fewer nations—shifting from multilateral trade to trade among smaller countries.
  • The United States occupies a pivotal position within the GATN. Trade in small aircraft demonstrates significant volatility across countries. In contrast, medium and large aircraft are more difficult to manufacture and command higher prices, resulting in relatively stable rankings among key nodes in the global medium and large aircraft trade networks over the past decade. Within the global medium aircraft trade network, the USA, France, Canada, and South Africa consistently rank among the top five most important nodes in most years, reflecting a pattern of one dominant player alongside several strong competitors. In the global large aircraft trade network, France, Germany, and Ireland have scores close to that of the USA, indicating a state of multiple strong players coexisting.
  • The damage caused by RA to the GATN is significantly less than that caused by TA. When the GATN experiences TA, connectivity and efficiency decline rapidly. This indicates that a few critical countries play a pivotal role in the aircraft trade network; removing these key countries can easily lead to the paralysis of the entire network. For example, under TA, the connectivity of medium and large aircraft trade networks drops to only about 0.1 after removing 20% of nodes; whereas under RA, the connectivity remains around 0.6 after removing the same proportion of nodes. The significant disparity between the two scenarios demonstrates the critical role of key nodes in stabilizing aircraft trade networks. Under RA, the robustness gaps among global trade networks for small, medium, and large aircraft are relatively small, indicating that RA has a limited impact on the overall aircraft trade network. Compared to the medium and large aircraft trade, the small aircraft trade involves more participating countries and a more complex network. Under TA, the global small aircraft trade network demonstrates greater robustness than the medium and large aircraft networks.
Based on the above conclusions, the following policy recommendations are proposed. First, the trade value of global medium aircraft is stable, and the current network structure presents a pattern of one superpower and several major powers. Non-core countries can utilize policy tools, such as R&D subsidies and tax incentives, to steer resources toward the R&D and manufacturing of medium aircraft, encouraging companies to participate in the medium aircraft manufacturing supply chain actively. Furthermore, by focusing on the manufacturing of specific components or subsystems, non-core countries can leverage economies of scale and specialized expertise to reduce costs, thereby becoming a critical link in the global supply chain. Simultaneously, policies like tax incentives can be employed to attract the establishment of relevant enterprises. Second, the global trade networks for medium and large aircraft exhibit lower robustness than those of small aircraft. It is imperative to proactively establish stable, cooperative relationships with key nations within the medium and large aircraft trade networks to ensure supply stability, while simultaneously promoting trade diversification to mitigate the impact of unforeseen disruptions. Finally, targeted attacks have a far greater impact on the robustness of the aircraft trade network than random failures. Therefore, it is imperative to continuously monitor key global events affecting aircraft trade, particularly developments involving the network’s core nodes, and to ensure that contingency plans can be activated promptly upon risk identification.
This study has several limitations and shortcomings. At the data level, it primarily relies on macro-level HS code classifications, which do not differentiate specific aircraft models or encompass broader segments of the industrial chain, such as components and technical cooperation. In 2025, the United States imposed tariffs globally, leading to a rise in trade protectionism. This will significantly increase aircraft manufacturing costs and exacerbate delivery delays, posing a substantial shock to the aircraft trade network [46]. However, due to the lack of aircraft trade network data for 2025, a precise assessment of the event’s impact is currently unfeasible. Methodologically, the current static network analysis is restricted to an in-depth exploration of the dynamic evolution of trade network relationships and their cascading failure mechanisms. Given these limitations, future research could be expanded in the following directions: first, obtaining more granular trade data and constructing multi-layered or multimodal networks to provide a more comprehensive analysis. Simultaneously, incorporate the 2025 data into the discussion to adequately account for the impact of the trade war on the aircraft trade network. Second, adopting dynamic network models better to capture the temporal evolution of networks and cascading risks. And finally, quantitatively integrating non-structural variables, such as geopolitics and technological innovation, into models to enhance predictive capabilities for future shocks and improve the precision of policy recommendations.

Author Contributions

Conceptualization, Y.M.; methodology, Y.M.; software, P.Z.; validation, Y.M., P.Z. and C.C.; formal analysis, Y.M.; investigation, Y.M.; resources, P.Z.; data curation, C.C.; writing—original draft preparation, Y.M.; writing—review and editing, J.Y.; visualization, C.C.; supervision, P.Z.; project administration, J.Y.; funding acquisition, P.Z. All authors have read and agreed to the published version of the manuscript.

Funding

This research was funded by the Fundamental Research Funds for the Central Universities (grant number TD2025DS03), Fundamental Research Funds for the Central Universities (grant number QJ2023-028), Fundamental Research Funds for the Central Universities (grant number 25CAFUC09024), Key Project of Philosophy and Social Sciences Planning in Chengdu (grant number YJZX-2024-ZZZD-15).

Data Availability Statement

The data presented in this study are available on request from the corresponding author.

Conflicts of Interest

The authors declare no conflicts of interest.

Abbreviations

The following abbreviations are used in this manuscript:
GATNGlobal Aircraft Trade Network
APLAverage Path Length
ACCAverage clustering coefficient
RAsRandom Node Attacks
TAsTargeted Node Attacks

Appendix A

Table A1. Consolidated table of notations.
Variables and ParametersDefinition
k i The degree of i
k i i n The in-degree of i
k i o u t The out-degree of i
s i The strength of i
p ( k ) The probability that a node has k trading partners.
DNetwork density
APLAverage path length
d i j The count of edges between i and j
ACCAverage clustering coefficient
e i The number of nodes that have trade relationships with node i
C B ( i ) The betweenness centrality of i
g s t Represents the number of shortest paths between nodes s and t
g s t ( i ) The number of shortest paths through node i
C i The closeness centrality of i
E i The Eigenvector centrality of node i
A A is a matrix, when there is a connection between node i and node j , a i j = 1 , otherwise, a i j = 0 .
λ The eigenvalues of matrix A
M The total count of edges within the network.
E The eigenvector corresponding to the eigenvalue of matrix A
XThe decision matrix
m The number of nodes in the network
n The number of indicators in the network
x i j The value of indicator j for node i
y i j The standardized value of x i j
e j The entropy of each indicator
w j The weight for each indicator
Z the weighted normalized matrix Z
Z + The positive ideal solutions
Z The negative ideal solutions
L + The distances between the positive ideal solutions
L The distances between negative ideal solutions
C i The score of node i
G Network connectivity
N The number of nodes in the network
N ' Nodes residing in the largest connected component
F Network efficiency

References

  1. Hu, H.; Guo, S.; Qin, Y.; Lin, W. Two-Stage Stochastic Programming Model and Algorithm for Mitigating Supply Disruption Risk on Aircraft Manufacturing Supply Chain Network Design. Comput. Ind. Eng. 2023, 175, 108880. [Google Scholar] [CrossRef]
  2. Wang, J.; Zhou, H.; Sun, X.; Yuan, Y. A Novel Supply Chain Network Evolving Model under Random and Targeted Disruptions. Chaos Solitons Fractals 2023, 170, 113371. [Google Scholar] [CrossRef]
  3. Bown, C.P. The US–China Trade War and Phase One Agreement. J. Policy Model. 2021, 43, 805–843. [Google Scholar] [CrossRef]
  4. Collings, D.; Corbet, S.; Hou, Y.; Hu, Y.; Larkin, C.; Oxley, L. The Effects of Negative Reputational Contagion on International Airlines: The Case of the Boeing 737-MAX Disasters. Int. Rev. Financ. Anal. 2022, 80, 102048. [Google Scholar] [CrossRef]
  5. Hao, H.; Ma, Z.; Wang, A.; Xing, W.; Song, H.; Zhao, P.; Wei, J.; Zheng, S. Modeling and Assessing the Robustness of the Lithium Global Trade System against Cascading Failures. Resour. Policy 2023, 85, 103822. [Google Scholar] [CrossRef]
  6. Li, L.; Wang, H.; Li, Z.; Hu, S. Analysis of the Structure and Robustness of the Global Semiconductor Trade Network. PLoS ONE 2025, 20, e0313162. [Google Scholar] [CrossRef]
  7. Ma, C.; Zhang, L.; You, L.; Tian, W. A Review of Supply Chain Resilience: A Network Modeling Perspective. Appl. Sci. 2024, 15, 265. [Google Scholar] [CrossRef]
  8. Crucitti, P.; Latora, V.; Marchiori, M.; Rapisarda, A. Error and Attack Tolerance of Complex Networks. Phys. A Stat. Mech. Its Appl. 2004, 340, 388–394. [Google Scholar] [CrossRef]
  9. Bai, B. Strategic Business Management for Airport Alliance: A Complex Network Approach to Simulation Robustness Analysis. Phys. A Stat. Mech. Its Appl. 2022, 606, 126682. [Google Scholar] [CrossRef]
  10. Chen, W.; Li, W.; Zhang, T. Complex Network-Based Resilience Capability Assessment for a Combat System of Systems. Systems 2024, 12, 31. [Google Scholar] [CrossRef]
  11. Liu, J.; Guo, F.; Shi, Y.; Ding, R. Study on the Evolutionary Characteristics and Robustness of the Global Refined Oil Trade Network. Energy 2025, 331, 137032. [Google Scholar] [CrossRef]
  12. Serrano, M.A.; Boguna, M. Topology of the World Trade Web. Phys. Rev. E 2003, 68, 015101. [Google Scholar] [CrossRef] [PubMed]
  13. Zhao, G.; Li, W.; Geng, Y.; Bleischwitz, R. Uncovering the Features of Global Antimony Resource Trade Network. Resour. Policy 2023, 85, 103815. [Google Scholar] [CrossRef]
  14. Li, Y.; Peng, Y.; Luo, J.; Cheng, Y.; Veglianti, E. Spatial-Temporal Variation Characteristics and Evolution of the Global Industrial Robot Trade: A Complex Network Analysis. PLoS ONE 2019, 14, e0222785. [Google Scholar] [CrossRef]
  15. Zhao, L.; Sun, P.; Zhang, J.; Peng, M.; Zhong, Y.; Liang, W. A Complex Network Important Node Identification Based on the KPDN Method. Appl. Sci. 2023, 13, 8303. [Google Scholar] [CrossRef]
  16. Ding, S.; Wang, L.; Zhou, Q. Study on Evolution Mechanism of Agricultural Trade Network of RCEP Countries—Complex System Analysis Based on the TERGM Model. Systems 2025, 13, 593. [Google Scholar] [CrossRef]
  17. Chen, W.; Zhang, J.; Yu, Z.; Zhao, X. Structure and Evolution of Global Lead Trade Network: An Industrial Chain Perspective. Resour. Policy 2024, 90, 104735. [Google Scholar] [CrossRef]
  18. Liu, Y.; Zhang, L.; Failler, P.; Wang, Z. The Dynamic Evolution of Agricultural Trade Network Structures and Its Influencing Factors: Evidence from Global Soybean Trade. Systems 2025, 13, 279. [Google Scholar] [CrossRef]
  19. Du, R.; Wang, Y.; Dong, G.; Tian, L.; Liu, Y.; Wang, M.; Fang, G. A Complex Network Perspective on Interrelations and Evolution Features of International Oil Trade, 2002–2013. Appl. Energy 2017, 196, 142–151. [Google Scholar] [CrossRef]
  20. Ji, G.; Zhong, H.; Feukam Nzudie, H.L.; Wang, P.; Tian, P. The Structure, Dynamics, and Vulnerability of the Global Food Trade Network. J. Clean. Prod. 2024, 434, 140439. [Google Scholar] [CrossRef]
  21. Chen, Y.; Wang, J.; Jin, F. Robustness of China’s Air Transport Network from 1975 to 2017. Phys. A Stat. Mech. Its Appl. 2020, 539, 122876. [Google Scholar] [CrossRef]
  22. Diop, I.M.; Diallo, C.; Cherifi, C.; Cherifi, H. Robustness Analysis of the Regional and Interregional Components of the Weighted World Air Transportation Network. Complexity 2022, 2022, 6595314. [Google Scholar] [CrossRef]
  23. Gupta, A.; Mau, R.R.; Marion, J.W. Supply Chain Risk Management in Aviation and Aerospace Manufacturing Industry—An Empirical Study. Int. J. Supply Chain Oper. Resil. 2015, 1, 300. [Google Scholar] [CrossRef]
  24. Zeng, L.; Chen, H.; Chen, M.; Zhao, X. Resilience Assessment of the Aircraft Manufacturing Core Products Supply Chain: The International Trade Network Perspective. Ann. Oper. Res. 2024, 1–39. [Google Scholar] [CrossRef]
  25. Zhao, K.; Scheibe, K.; Blackhurst, J.; Kumar, A. Supply Chain Network Robustness Against Disruptions: Topological Analysis, Measurement, and Optimization. IEEE Trans. Eng. Manag. 2019, 66, 127–139. [Google Scholar] [CrossRef]
  26. Nakandala, D.; Chen, J.; Chikweche, T. SME Supply Chain Resilience in Disruptive Times: The Effects of Supply Chain Robustness, Access to Government Assistance and Disruption Intensity. Bus. Process Manag. J. 2025, 31, 467–496. [Google Scholar] [CrossRef]
  27. Rungta, P.D.; Meena, C.; Sinha, S. Identifying Nodal Properties That Are Crucial for the Dynamical Robustness of Multistable Networks. Phys. Rev. E 2018, 98, 022314. [Google Scholar] [CrossRef]
  28. Abdelaty, H.; Mohamed, M.; Ezzeldin, M.; El-Dakhakhni, W. Temporal Robustness Assessment Framework for City-Scale Bus Transit Networks. Phys. A Stat. Mech. Its Appl. 2022, 606, 128077. [Google Scholar] [CrossRef]
  29. Ding, Y.; Zhang, M.; Chen, S.; Nie, R. Assessing the Resilience of China’s Natural Gas Importation under Network Disruptions. Energy 2020, 211, 118459. [Google Scholar] [CrossRef]
  30. Zhang, Y.; Lu, Y.; Yang, G.; Hang, Z. Multi-Attribute Decision Making Method for Node Importance Metric in Complex Network. Appl. Sci. 2022, 12, 1944. [Google Scholar] [CrossRef]
  31. Zhou, H.; Guo, Y.; Li, Y. Cross-Border e-Commerce Business Environment Evaluation for Chinese Provinces Using a Combined Entropy-TOPSIS Approach. Eval. Program Plan. 2025, 112, 102658. [Google Scholar] [CrossRef]
  32. Bai, Y.; Wang, J.; Su, J.; Zhou, Q.; He, S. Assessment of Urban Rail Transit Development Using DPSIR-Entropy-TOPSIS and Obstacle Degree Analysis: A Case Study of 27 Chinese Cities. Phys. A Stat. Mech. Its Appl. 2025, 663, 130439. [Google Scholar] [CrossRef]
  33. Newman, M.E.J. The Structure and Function of Complex Networks. SIAM Rev. 2003, 45, 167–256. [Google Scholar] [CrossRef]
  34. Barrat, A.; Barthélemy, M.; Pastor-Satorras, R.; Vespignani, A. The Architecture of Complex Weighted Networks. Proc. Natl. Acad. Sci. USA 2004, 101, 3747–3752. [Google Scholar] [CrossRef] [PubMed]
  35. Freeman, L.C. A Set of Measures of Centrality Based on Betweenness. Sociometry 1977, 40, 35. [Google Scholar] [CrossRef]
  36. Everett, M.G.; Borgatti, S.P. The Centrality of Groups and Classes. J. Math. Sociol. 1999, 23, 181–201. [Google Scholar] [CrossRef]
  37. Ruhnau, B. Eigenvector-Centrality—A Node-Centrality? Soc. Netw. 2000, 22, 357–365. [Google Scholar] [CrossRef]
  38. Wang, J. Robustness of Complex Networks with the Local Protection Strategy against Cascading Failures. Saf. Sci. 2013, 53, 219–225. [Google Scholar] [CrossRef]
  39. Zou, L.; Dresner, M.E.; Yu, C. The Impact of the U.S.-China Trade War on Air and Ocean Shipments. Transp. Policy 2025, 160, 89–106. [Google Scholar] [CrossRef]
  40. Herkert, J.; Borenstein, J.; Miller, K. The Boeing 737 MAX: Lessons for Engineering Ethics. Sci Eng Ethics 2020, 26, 2957–2974. [Google Scholar] [CrossRef]
  41. Mumbower, S. Airline Market Exit after a Shock Event: Insights from the COVID-19 Pandemic. Transp. Res. Interdiscip. Perspect. 2022, 14, 100621. [Google Scholar] [CrossRef]
  42. Zheng, S.; Wang, K.; Jiang, C. Converting Passenger Aircraft into Cargo Planes under Volatile Market Demand. Transp. Res. Part A Policy Pract. 2024, 181, 104013. [Google Scholar] [CrossRef]
  43. Dube, K.; Nhamo, G.; Chikodzi, D. COVID-19 Pandemic and Prospects for Recovery of the Global Aviation Industry. J. Air Transp. Manag. 2021, 92, 102022. [Google Scholar] [CrossRef]
  44. Liu, K.; Fu, Q. How Does Geopolitical Risk Affect International Freight? J. Air Transp. Manag. 2024, 118, 102614. [Google Scholar] [CrossRef]
  45. He, S.; Hipel, K.W.; Kilgour, D.M. Analyzing Market Competition between Airbus and Boeing Using a Duo Hierarchical Graph Model for Conflict Resolution. J. Syst. Sci. Syst. Eng. 2017, 26, 683–710. [Google Scholar] [CrossRef]
  46. IATA. Global Outlook for Air Transport Protectionism on the Rise; IATA: Montreal, QC, Canada, 2025; Available online: https://www.iata.org/en/iata-repository/publications/economic-reports/global-outlook-for-air-transport-june-2025/ (accessed on 9 November 2025).
Figure 1. The research Framework.
Systems 13 01016 g001
Figure 2. Trade value of small, medium, and large aircraft from 2015 to 2024. (a) Small aircraft (Blue); (b) Medium aircraft (Orange); (c) Large aircraft (Green).
Systems 13 01016 g002
Figure 3. Global trade networks for small, medium, and large aircraft. (a) Small aircraft trade network; (b) Medium aircraft trade network; (c) Large aircraft trade network.
Systems 13 01016 g003aSystems 13 01016 g003bSystems 13 01016 g003c
Figure 4. Degree distribution of three GATNs. (a) Small aircraft trade network; (b) Medium aircraft trade network; (c) Large aircraft trade network.
Systems 13 01016 g004
Figure 5. The number of nodes, edges, and APL of the global small, medium, and large aircraft trade networks. (a) Small aircraft trade network; (b) Medium aircraft trade network; (c) Large aircraft trade network.
Systems 13 01016 g005
Figure 6. Network density and average clustering coefficient of the GATN for small, medium, and large aircraft. S-Density, M-Density, and L-Density denote the network densities of the global small, medium, and large aircraft trade networks. Similarly, S-Clustering, M-Clustering, and L-Clustering represent the ACC of the global small, medium, and large aircraft trade networks, respectively.
Systems 13 01016 g006
Figure 7. Top ten countries by node importance in the GATN for small, medium, and large aircraft from 2015 to 2024. (a) Small aircraft trade network. (b) Medium aircraft trade network. (c) Large aircraft trade network.
Systems 13 01016 g007
Figure 8. Robustness of the global trade networks for small, medium, and large aircraft under random node attacks. (a) Small aircraft trade network. (b) Medium aircraft trade network. (c) Large aircraft trade network.
Systems 13 01016 g008
Figure 9. Robustness of the global trade networks for small, medium, and large aircraft under targeted node attacks. (a) Small aircraft trade network. (b) Medium aircraft trade network. (c) Large aircraft trade network.
Systems 13 01016 g009
Table 1. Average values of network indicators (2015–2024).
TypeNodesEdgesNetwork
Density
ACCAPL
Small
aircraft
129.2721.20.04370.35812.5278
Medium
aircraft
107.7334.20.02970.26483.0441
Large
Aircraft
101290.80.0290.2553.2629
Table 2. Topological indicator weights of nodes.
TypeTimeDegreeStrengthBetweenness CentralityCloseness CentralityEigenvector Centrality
Small
aircraft
20150.1520.3530.3280.0880.079
20200.1570.3240.3450.0970.077
20240.1370.3390.350.0550.119
Medium
aircraft
20150.1750.3410.3060.1090.069
20200.1790.3470.3070.0850.082
20240.1620.3260.3280.080.104
Large
aircraft
20150.1730.3410.320.0920.074
20200.1820.3010.3390.090.088
20240.1680.3120.3290.0850.106
Disclaimer/Publisher’s Note: The statements, opinions and data contained in all publications are solely those of the individual author(s) and contributor(s) and not of MDPI and/or the editor(s). MDPI and/or the editor(s) disclaim responsibility for any injury to people or property resulting from any ideas, methods, instructions or products referred to in the content.