1. Introduction
Carbon emissions from fossil fuels contribute to global warming [
1], which poses substantial challenges to environmental conservation, economic stability, and social equity. To address this issue, the European Union launched the world’s first large-scale carbon market, the European Union Emissions Trading System (EU-ETS), in 2005, employing a cap-and-trade mechanism [
2]. Carbon trading has been increasingly adopted by various countries and regions as an effective mechanism to control carbon emissions. As a responsible major economy, China has been expanding its carbon emissions trading pilot programs since 2011 in Beijing, Shanghai, Tianjin, Chongqing, Shenzhen, and provinces including Hubei, Guangdong, and Fujian [
3,
4]. The carbon price serves as the core economic tool of carbon markets, incentivizing corporate emissions reductions. Therefore, accurate carbon price forecasting is crucial for governments to formulate evidence-based policies and for enterprises to participate effectively. However, the nonlinearity and complexity of carbon markets pose significant forecasting challenges [
5].
Currently, carbon price prediction research primarily covers two aspects: the analysis of influencing factors and the improvement of prediction models. Before the advent of deep learning, econometric models were commonly employed for a univariate carbon price prediction based solely on historical data. However, with a deeper analysis of data characteristics, it became evident that carbon price exhibits nonlinear and non-stationary properties [
6], making it difficult to achieve accurate predictions using historical data alone. As the superiority of machine learning (ML) techniques has been demonstrated across various domains, artificial intelligence (AI)-based models leveraging ML methods have proven effective in capturing nonlinear features [
7]. Consequently, an increasing number of scholars have integrated ML approaches with external factors to enhance carbon price prediction accuracy [
8].
Regarding influencing factor analysis, the existing carbon price forecasting studies primarily focus on structural determinants, including macroeconomic indicators, energy price fluctuations, and international carbon market linkages; there remains a notable research gap in the systematic incorporation and analysis of non-structural data sources [
9,
10]. One the one hand, numerous scholars emphasize the substantial influence of energy prices on carbon price fluctuations [
11,
12]. Wang and Guo (2018) [
13] identified that oil and natural gas prices exert significant influences on carbon price dynamics. Wang et al. (2023) [
14] further dissected the transmission mechanisms through which energy prices influence carbon prices. On the other hand, in the macroeconomic context, stock prices have become a crucial factor influencing carbon prices [
15]. Shi et al. (2023) [
16] found that macroeconomic fluctuations significantly impact carbon prices in their study of China’s carbon market. Song and Liu (2024) [
17] employed a vector autoregression model to study the Chinese market, revealing that stock prices significantly influence carbon prices. In addition, monetary policy tools such as interest rates and government bonds exert a substantial influence on carbon market prices [
18,
19]. Additionally, carbon price fluctuations may be influenced by environmental factors [
20,
21]. Zhou et al. (2024) [
22] found through their research that environmental variables such as air quality not only influence short-term fluctuations in carbon prices but also participate in the long-term price formation of carbon markets. With the advancement of big data technologies, internet search behaviors have increasingly become a crucial component of online information. Unstructured data are playing an ever more significant role in predictive analytics. Zhao et al. (2025) [
23] found that combining Baidu search index data with energy prices and economic factors can significantly improve the accuracy of carbon price forecasting. Zhou and Du (2025) [
24] proposed a multivariate event-enhanced pre-trained large language model (LLM) that integrates unstructured text data through sentiment analysis, demonstrating an exceptional predictive accuracy and robustness in the Hubei and Shanghai carbon markets.
As for the carbon price forecasting models, they can be broadly categorized into three approaches: traditional statistical models, AI models, and hybrid models [
25]. Traditional statistical models have been widely employed in early carbon price prediction studies [
26,
27]. However, these models often rely on linear assumptions, making it challenging to handle the nonlinear and highly volatile characteristics of carbon prices. In AI models, long short-term memory (LSTM) [
28], convolutional neural networks (CNNs) [
29], and temporal convolutional networks (TCNs) [
30] have gained increasing attention in recent years. These models can autonomously learn complex carbon price patterns and effectively capture long-term dependencies in time series data. Nevertheless, they also face challenges including overfitting, insufficient interpretability, and parameter randomness [
31]. To address these challenges, researchers have developed hybrid prediction models by integrating intelligent algorithms [
32]. Duan et al. (2024) [
33] employed the whale optimization algorithm (WOA) to optimize the parameters of the extreme gradient boosting (XGBoost) model. Building on this, researchers have explored integrating feature selection methods and decomposition techniques to further improve prediction accuracy [
34]. Liu et al. (2024) [
35] combined multi-stage decomposition with interval multilayer perceptron models enhanced by a sparrow search algorithm to obtain final carbon price predictions. Although the aforementioned models have achieved certain research progress, most of them are based on a single prediction model. Given that carbon prices are influenced by multiple factors and exhibit significant variations across different markets, it is difficult for a single prediction model to fit all carbon price components [
36]. Consequently, hybrid models comprising multiple prediction techniques can fully integrate the advantages of each constituent model through strategic combination, leveraging their respective strengths in handling different data characteristics to achieve more robust and adaptable prediction outcomes [
37]. Cui and Niu (2024) [
38] proposed a hybrid prediction framework integrating an attention–temporal convolutional network–bidirectional gated recurrent unit and LSTM for a model ensemble, with the entropy method assigning weights to their predictions, demonstrating a superior prediction performance. Zhao et al. (2025) [
39] developed an adaptive multi-factor integrated hybrid model based on periodic reconstruction and random forest techniques, demonstrating an outstanding predictive performance in empirical studies. Moreover, for complex hybrid models, the emergence of interpretability enhances transparency by visualizing decision-making principles, aiding users in understanding model logic and enabling stakeholders to grasp the key factors driving predictions, which is now widely applied in fields such as crude oil price and electricity load forecasting [
40,
41,
42].
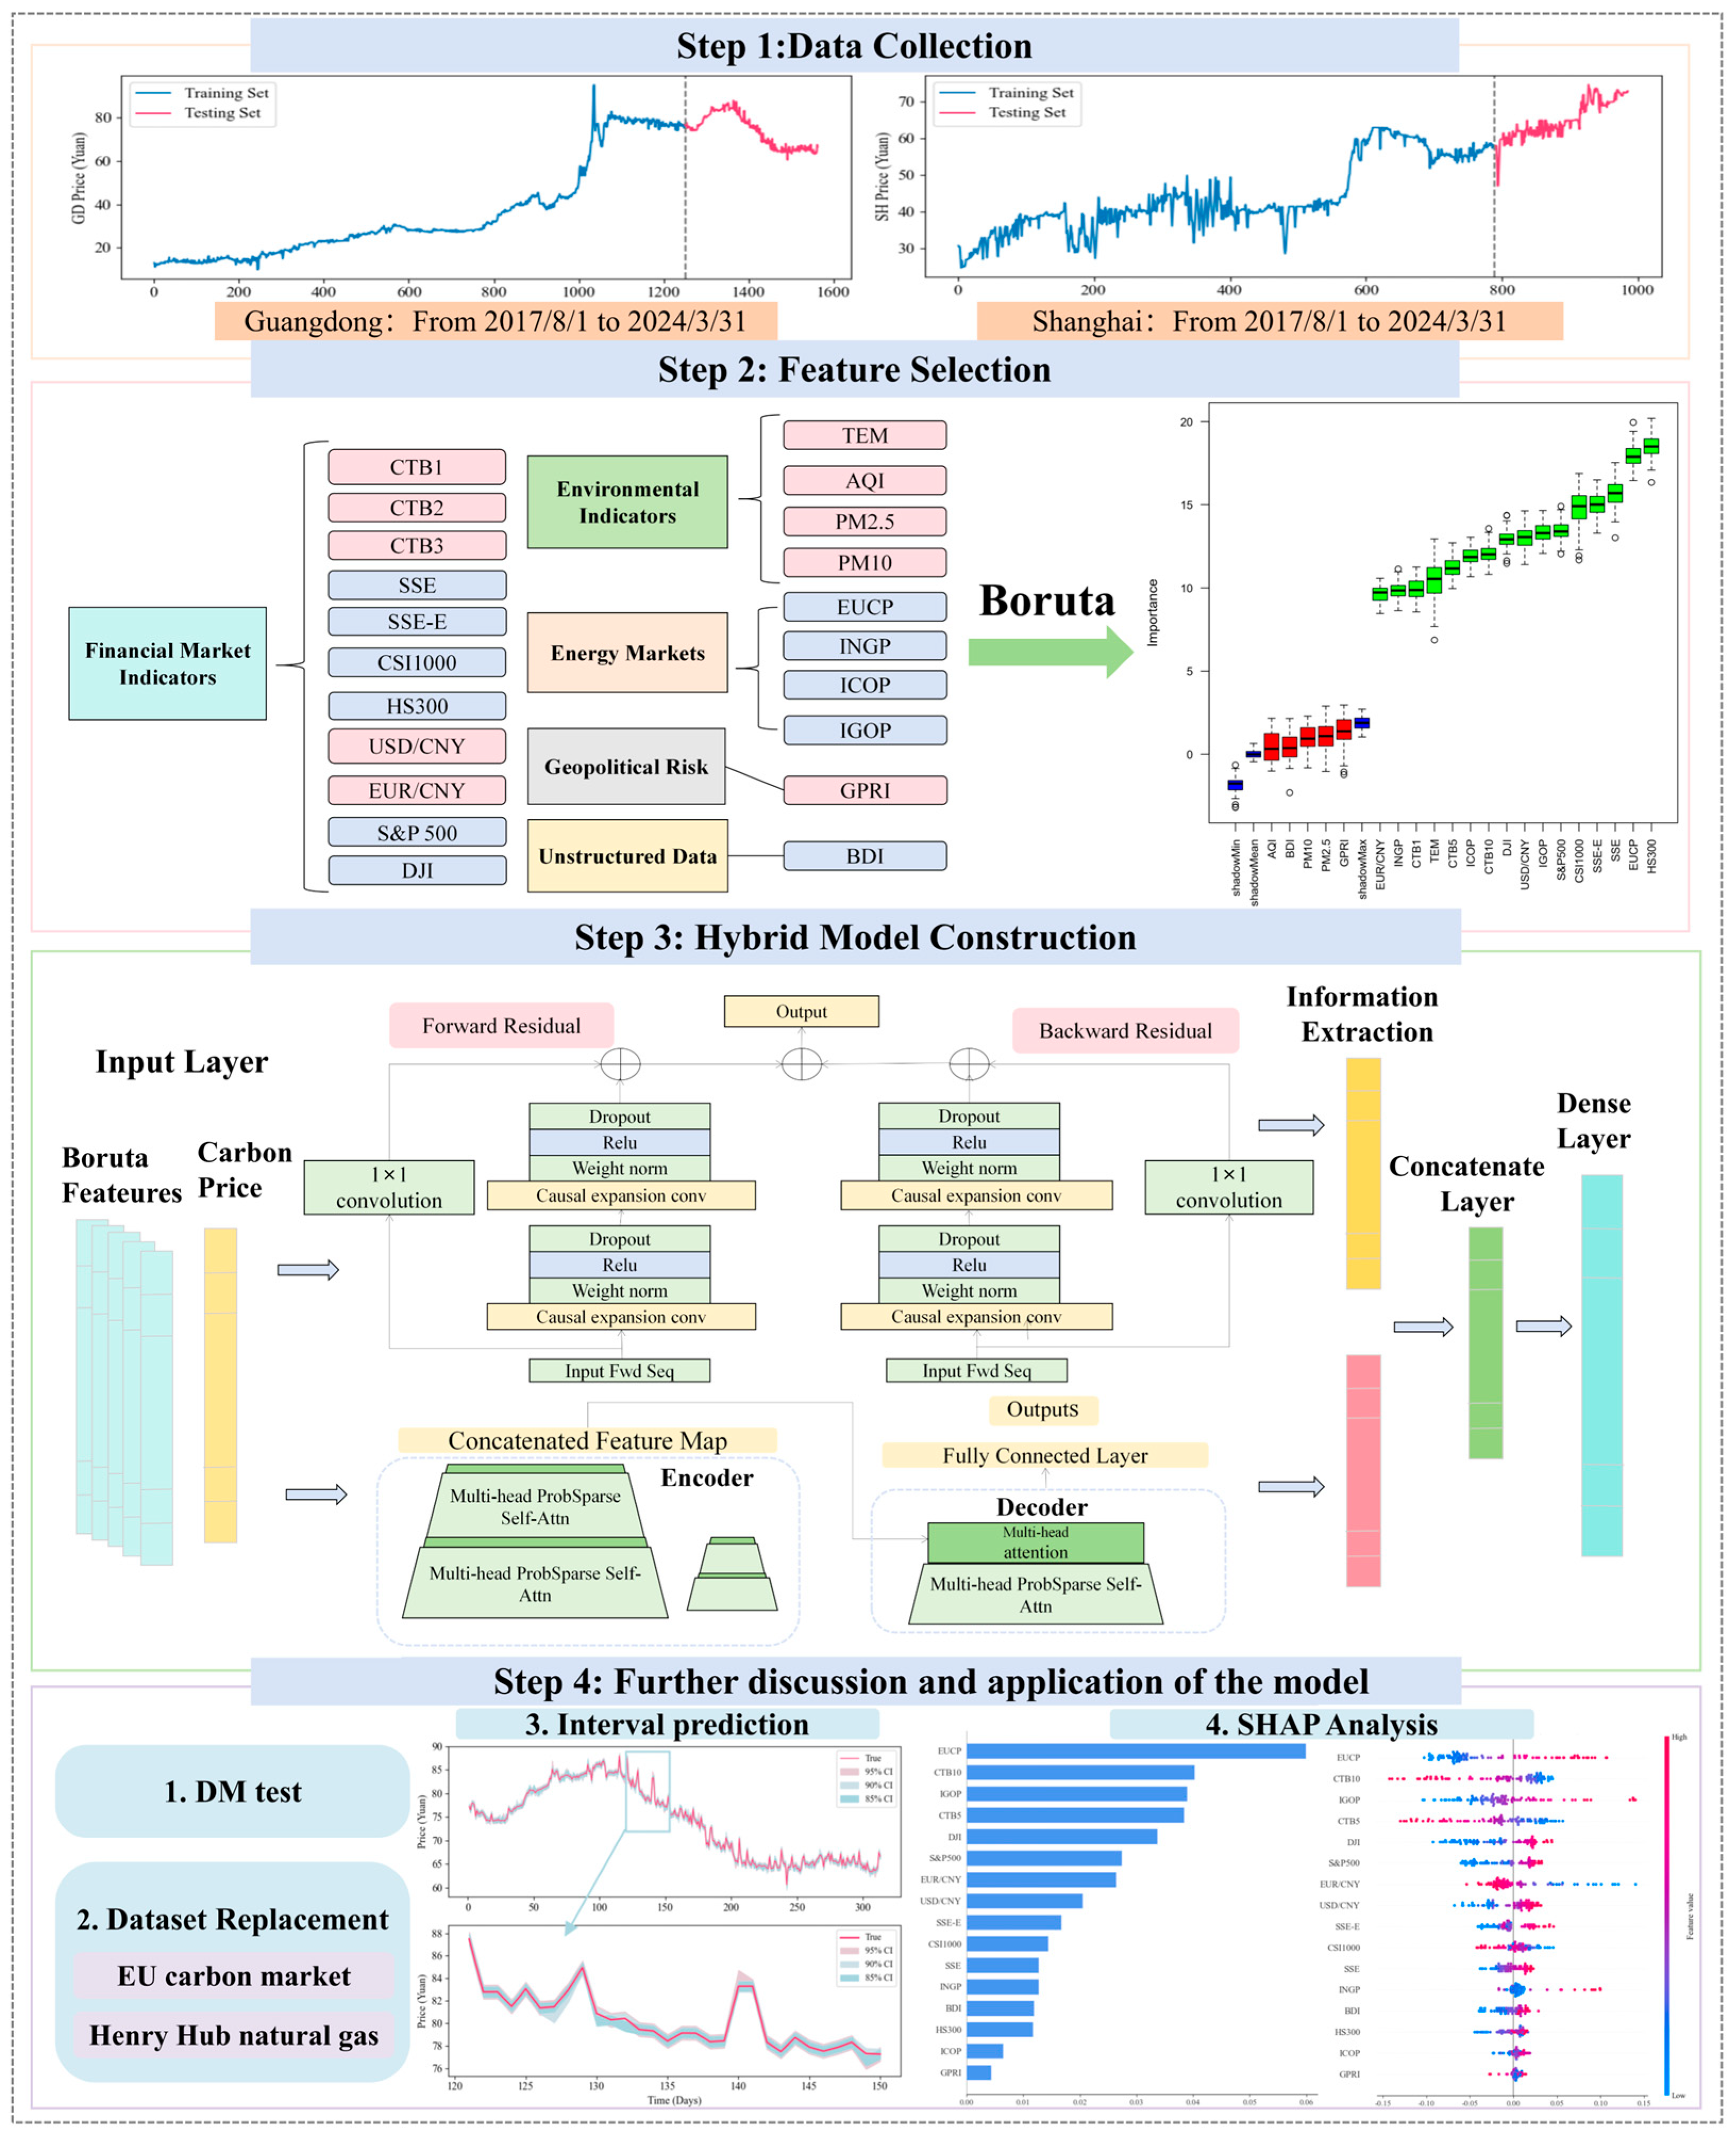
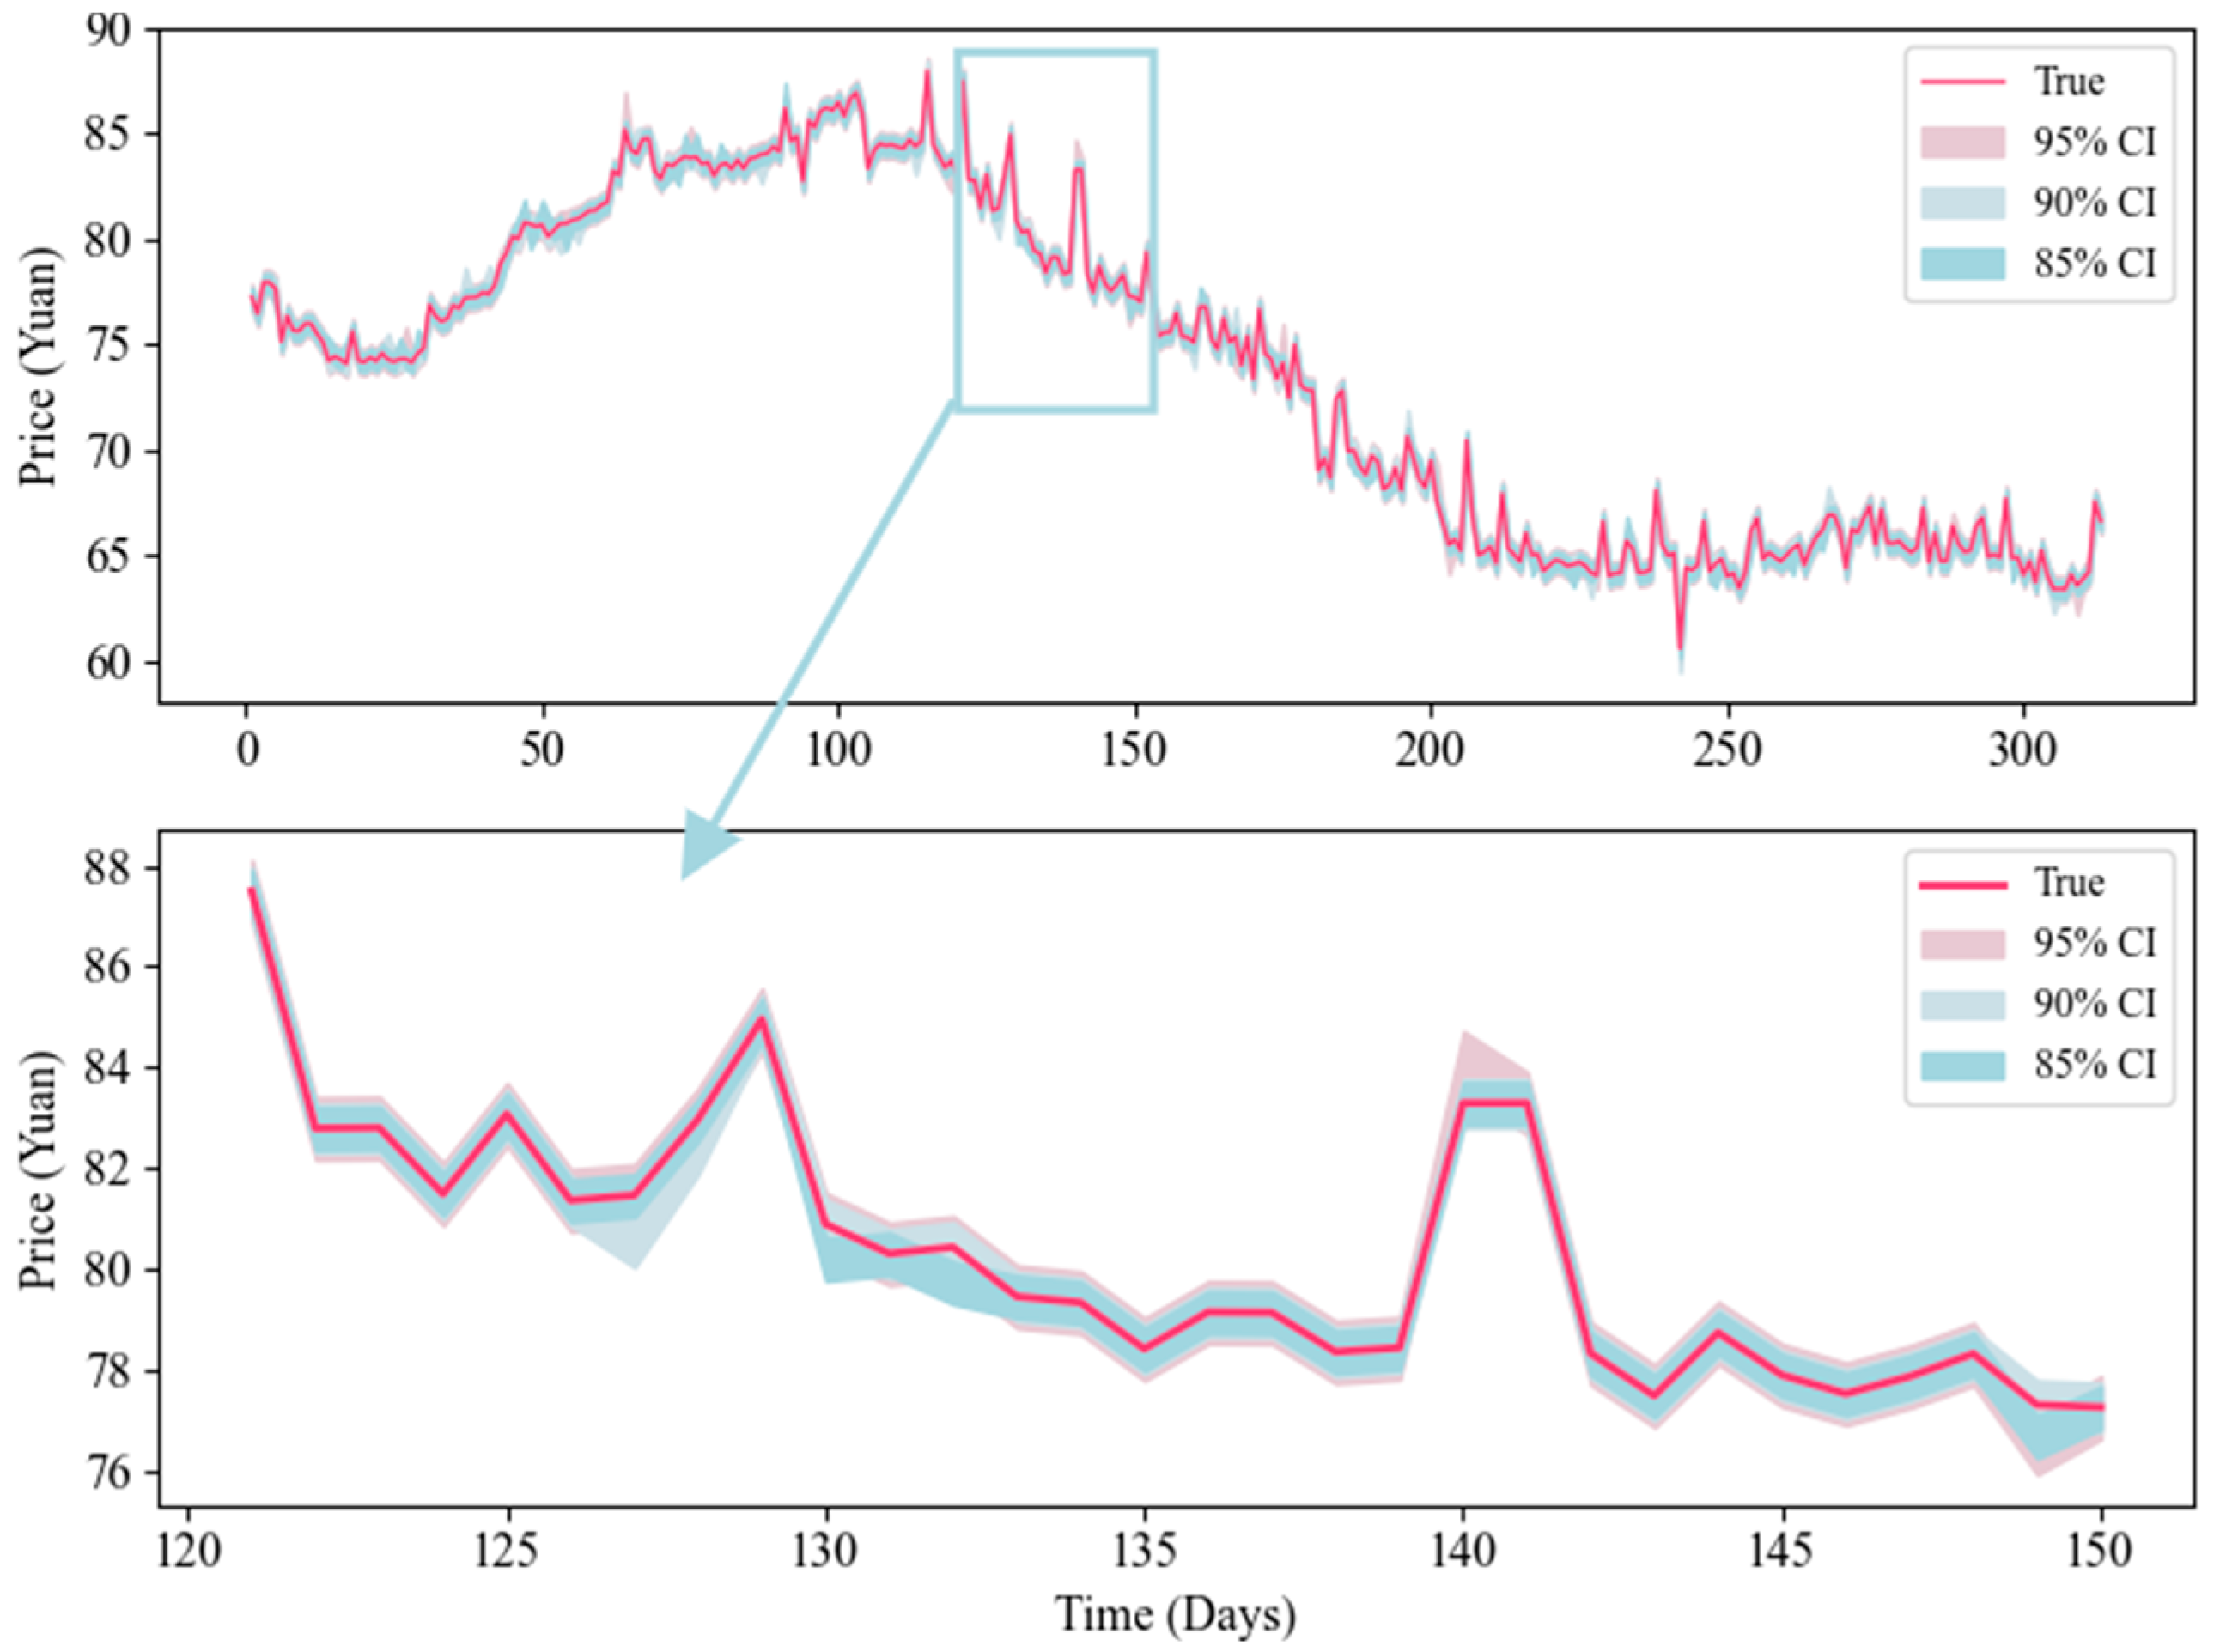
Inspired by the preceding discussion, this study combines feature screening algorithms, deep learning models, and interpretable explanatory analytics to construct an interpretable hybrid system for carbon market price prediction. First, multidimensional data sources, including macroeconomic indicators and the Baidu Index, are considered. The Boruta feature selection algorithm is then employed to construct a feature subspace, ensuring the inclusion of the most relevant predictive variables. Next, this study proposes a hybrid architecture of BiTCN and the Informer model, where BiTCN is used to extract local spatio-temporal dependent features, while the Informer captures the global features of the long sequences through the connectivity mechanism, which enables phased feature extraction and improves the prediction accuracy. Then, in order to improve the interpretability of the model and quantify the uncertainty, this study introduces the Shapley additive explanations (SHAP) to analyze the feature contributions in the prediction process and the Monte Carlo dropout method to achieve interval prediction, which provides a more interpretable prediction framework. Moreover, the contributions of this study are summarized below. (1) Previous studies have largely focused solely on structured data, neglecting unstructured information such as market sentiment. This study integrates twenty-one influential factors, including environmental variables such as weather and air quality, as well as macroeconomic indicators such as government bond yields and stock prices. Additionally, it also incorporates non-structural data, such as the Baidu Index, which can reflect real-time market sentiment and public attention, thereby enhancing the accuracy and timeliness of the predictions. (2) Traditional methods often employ linear ensembles, which struggle to uncover synergies between different models and provide only point predictions lacking interpretability analysis. This paper proposes a hybrid model that combines the strengths of multiple deep learning models. It preserves the original features without complex data decomposition, significantly improving prediction accuracy and enabling interval predictions. Simultaneously, it achieves interpretable predictive analysis using the SHAP method. (3) Previous studies lacked cross-regional, multi-scenario experimental validation. This paper conducts comparative experiments across multiple carbon markets, including Shanghai, Guangdong, and the EU. The results demonstrate the model’s significant predictive advantages and robustness across diverse market environments.
5. Further Discussions
This section is the discussion part of this study. Firstly, the superiority of the proposed model is verified once again using the Diebold–Mariano (DM) test. Then, the European Union carbon emission trading price and natural gas price datasets are adopted in order to verify the robustness of the proposed model. Finally, the interpretability analysis of the model predictions is performed by the SHAP method.
5.1. Diebold–Mariano (DM) Test
In this study, the DM test proposed by Diebold–Mariano in 1995 [
59] is utilized for the validation of the superiority of the proposed model. The DM test is capable of determining whether there is a significant difference between the two models in terms of their predictive performance at a given level of significance α. Models are compared according to the DM value. If the absolute value of the DM value is greater than Z
α/2, the null hypothesis, that there is no significant difference in the predictive performance of the two models, will be rejected. Otherwise, it is considered that there is no significant difference.
Table 8 presents the DM test values between the proposed model and comparison models.
As demonstrated in
Table 8, except for Boruta-BiLSTM-Informer model, all DM values exceed Z
0.05/2 = 1.96. This indicates that, at the 0.05 confidence level, the proposed model exhibits a significant difference in predictive performance relative to the other models. Furthermore, the vast majority of DM values also exceed Z
0.01/2 = 2.58, further demonstrating that the Boruta-BiTCN-Informer model exhibits a significantly superior predictive performance compared to benchmark models at the 0.01 confidence level. In summary, the DM test results confirm that the proposed model’s predictive performance differs significantly from the comparison models, exhibiting markedly superior predictive capabilities and achieving outstanding prediction results in carbon price forecasting tasks.
5.2. Further Study of the Model Performance Based on Other Datasets
To further validate the applicability and robustness of the proposed model, this study selects the European carbon trading price (EU) and the natural gas price from Henry Hub (NG) as supplementary datasets to test the model [
56,
60]. The experimental results are shown in
Table 9.
For the EU dataset, the Boruta-BiTCN-Informer model achieves an MAE value of 1.6336, lower than the those of the other models. Similarly, across the other model evaluation metrics, the proposed model can also demonstrate significantly lower prediction errors than the comparison models. This conclusion can also be validated using the NG dataset. For instance, the proposed Boruta-BiTCN-Informer model achieves an MAPE value of 0.0435, significantly smaller than the 0.0561 recorded by Boruta-BiLSTM-Transformer. Overall, the proposed Boruta-BiTCN-Informer model demonstrates a robust performance and strong prediction stability across all datasets. This also validates that the hybrid model framework proposed in this study is not only applicable to carbon price forecasting but also holds promise for other energy price prediction tasks, providing a reference for future research.
5.3. Interpretability Analysis
This study also adopts the SHAP method to quantitatively assess the impact of input features on carbon price predictions, thereby further elucidating the decision-making process of the BiTCN-Informer model.
Figure 9 presents the corresponding SHAP analysis results of the proposed model when predicting carbon prices in Guangdong and Shanghai. As illustrated in
Figure 9, taking Shanghai carbon price prediction as an example, the left-hand bar chart displays the global feature importance ranking based on the average absolute SHAP value, where the length of each horizontal bar indicates the contribution of that feature to the model’s prediction. The right-hand SHAP summary plot provides a more granular feature impact analysis. Each point in this plot represents a point sample, with the x-axis denoting SHAP values. Positive SHAP values indicate a positive contribution of the corresponding feature to carbon price prediction, while negative SHAP values indicate a negative contribution. Additionally, the color of each point represents the magnitude of the feature value, ranging from red (high value) to blue (low value).
From the bar chart, in the Guangdong carbon trading market, the five most influential factors driving carbon price fluctuations are the EU-ETS carbon price, China Treasury Bond (10-year), international crude oil price, China Treasury Bond (5-year), and the Dow Jones Index. Notably, the EU-ETS carbon price exerts a significantly stronger impact than the other factors, surpassing the second-ranked feature by a SHAP value margin of 0.01. This pronounced influence is likely attributed to Guangdong’s export-oriented economic structure. As China’s largest export hub, Guangdong accommodates numerous energy-intensive manufacturing enterprises whose carbon cost accounting is directly influenced by the EU Carbon Border Adjustment Mechanism (CBAM). Consequently, the EU-ETS carbon price transmits cross-regional policy spillover effects to the Guangdong carbon market, reinforcing its susceptibility to external regulatory and market dynamics. In contrast, the Shanghai carbon trading market exhibits a different set of key drivers. The five most influential factors are the international crude oil price, international natural gas price, USD/CNY exchange rate, S&P 500 Index, and China Treasury Bond (5-year). This indicates that energy market prices and financial market indicators play a dominant role in shaping carbon price dynamics in Shanghai. A plausible explanation is Shanghai’s status as a global financial hub, where market participants are more inclined to incorporate global energy supply–demand shifts and cross-border capital flows into their carbon asset pricing strategies.
A deeper examination of the SHAP summary plot reveals a notable heterogeneity in the impact of the EUR/CNY exchange rate across these two markets. In Shanghai, a higher EUR/CNY value is associated with positive SHAP values, indicating a positive correlation between the exchange rate and carbon prices. Conversely, in the Guangdong market, an increase in EUR/CNY corresponds to negative SHAP values, suggesting that the exchange rate exerts a suppressive effect on carbon price increases in Guangdong. These findings demonstrate that the depreciation of the Chinese yuan (CNY) relative to the euro (EUR) exerts heterogeneous impacts across different carbon markets. In the Shanghai market, participants predominantly focus on the transmission mechanism of exchange rate fluctuations, foreign capital flows, and carbon asset allocation. Concurrently, CNY depreciation may elevate imported energy costs or enhance market liquidity. Conversely, in the Guangdong market, participants prioritize the trade cost transmission pathway. An appreciation of the EUR amplifies carbon compliance costs transferred by EU importers, incentivizing local enterprises to adopt quota reservation strategies to suppress short-term carbon prices.
Based on the above analysis, different decision-makers may formulate rules or schemes for specific application scenarios: (1) For export-oriented, high-energy-consuming enterprises in Guangdong (e.g., home appliance manufacturers), when the SHAP value of EUCP exceeds a specific threshold (e.g., 0.04) over a continuous period, they may procure annual carbon allowances in advance to lock in compliance costs. When quoting export orders, convert the SHAP contribution from EUCP into a cost coefficient to hedge against carbon cost volatility. (2) For energy-dependent enterprises in Shanghai (e.g., steel producers), when the SHAP value of INGP exceeds a specific threshold (e.g., 0.03), prioritize low-energy production lines to reduce current-period carbon emissions. During carbon asset inventory, consider the heterogeneous impact of USD/CNY (positive in Shanghai markets). When the CNY depreciates, increase carbon allowance holdings modestly. (3) For the newly established national carbon market coordination department, set distinct weightings for different regions: Guangdong market allowances should reference the SHAP value from the EUCP (0.3–0.4), while Shanghai market allowances should reference the SHAP value from energy/financial indicators (0.25–0.35), thereby avoiding the bias inherent in uniform rules. Monitor the SHAP values for ICOP and USD/CNY and concurrently implement short-term exchange rate stabilization measures to mitigate carbon price volatility.
