1. Introduction
In modern society, with the development of social media, the speed and scope of information propagation has increased. Individuals have access to convenient channels for the gathering of information and to express their opinions about specific entities or events. This has led to the increased exchange of information through interpersonal communication. In the context of products and services, this phenomenon, commonly referred to as word-of-mouth (WOM), has emerged as a substantial source of information with the potential to influence companies’ reputation [
1], sales [
2], and even stock prices [
3].
Word-of-mouth can be considered one form of public opinion, and when information or events about products or services happen, the Internet can prompt numerous netizens to engage in discussions and express their opinions. According to the polarity of opinions, word-of-mouth can be classified into two distinct categories. Positive word-of-mouth communication has the power to greatly enhance a company’s performance, while negative word-of-mouth communication can present significant challenges for the company. Research on the dynamics of word-of-mouth propagation holds significant importance in the development of companies.
Many studies have been undertaken that look at word-of-mouth propagation and its dynamic behavior in online social networks. Because the propagation mechanism of word-of-mouth is similar to that of rumors and diseases, related research on the spread of rumors and diseases has provided a rich theoretical basis for the modeling of the spread of word-of-mouth and has greatly promoted the development of spread dynamics. For example, Li et al. [
4] constructed a dynamic model, known as the SIPNS model, capturing the WOM marketing process with both positive and negative comments. Han et al. [
5] proposed a word-of-mouth propagation model named N-P-N based on communicable disease models such as SIR and SIS. Mostafa et al. [
6] constructed a framework using the Susceptible–Infected–Susceptible (SIS) model to demonstrate the spread of WOM and derive demand functions. Meanwhile, other diffusion models and network models are also applied to analyze word-of-mouth. Wang et al. [
7] proposed a discrete propagation model by considering the hedging effect between positive and negative WOM. Huo et al. [
8] proposed a multi-layer network model to explore the effect of individual and enterprise behaviors on the interaction between product attribute information propagation and WOM communication.
Additionally, several scholars have studied the influence of WOM on the real world. Qiao et al. [
9] proposed the Susceptible–Infected1–Infected2–Agreeable–Disagreeable (SI1I2AD) model to analyze the influence of access to two information channels on consumers’ purchase choices. Mostafa et al. [
10] analyzed the effect of word-of-mouth advertising based on the Bass diffusion model and its extensions using features related to the game industry. Yu et al. [
11] discussed how word-of-mouth marketing affects the profits of product sales in social network-based shopping under a good after-sales service with optimal control.
Word-of-mouth, in its essence, reflects the quality of products or services and other related aspects. Additionally, the propagation of WOM ensures that more individuals know about certain situations, and it has certain impacts on reality, such as causing stock price fluctuations. Comprehensively understanding the process of word-of-mouth propagation and its impact on reality would be highly relevant to management practice.
This paper aims to uncover the dynamics encompassing the factors that influence word-of-mouth, its propagation mechanisms, and the consequential impact on reality illustrated through fluctuations in stock prices. WOM can be regarded as a signal to associate product quality or service quality with stock price fluctuations. The methodology employed in this paper includes theoretical analysis, numerical simulation experiments, and the event study method.
The organization of this paper can be summarized as follows.
Section 2 introduces the mathematical model to describe information propagation and stock price fluctuations and then analyzes the stability of the model.
Section 3 presents the numerical experiments, which highlights the different effects of the word-of-mouth dynamics on stock price fluctuations and uses real events to examine them.
Section 4 presents the empirical examination of 43 events to verify the generality of the model. Conclusions are drawn in
Section 5.
2. Model Construction and Theoretical Analysis
Suppose that, in a scenario whereby a new event about a product or service happens, the related information will spread online and formulate word-of-mouth. Word-of-mouth can have an impact on stock prices through its influence on consumer perceptions and investor sentiments. Therefore, it becomes imperative for the company’s public relations department to effectively address the word-of-mouth. This section focuses on modeling the propagation of information and its effects on stock price fluctuations.
2.1. Mathematical Model for Information Propagation and Stock Price Fluctuations
The mathematical model to describe to the whole process can be separated into two components: information propagation model and stock price fluctuations model.
Firstly, to describe the propagation of information in a social network, we propose that the individuals are divided into four categories:
- (1)
represents the individuals who have not received the information;
- (2)
represents the individuals who have recently received the information but not yet spread it to others;
- (3)
represents the individuals who have received the information and hold a negative attitude towards the product or service and then spread their negative WOM to others;
- (4)
represents the individuals who have received the information and hold a positive attitude towards the product or service and then spread their positive WOM to others.
As shown in
Figure 1, the spreading rules of our
model can be described as follows:
- (1)
Newly entering individuals enter the group and occur at a constant rate ;
- (2)
Each group of individuals has a certain churn rate ;
- (3)
A proportion of will come into contact with and ; then, will receive the information and become ;
- (4)
After being informed of the information, a proportion of will hold a negative attitude towards the product or service and then proceed to spread their negative WOM to others; represents the extent to which consumers are dissatisfied with the quality of the product or service;
- (5)
After being informed of the information, a proportion of will hold a positive attitude towards the product or service and then proceed to spread their positive WOM to others; represents the extent to which consumers accept and tolerate the quality of the product or service;
- (6)
Individuals who hold positive and negative word-of-mouth will participate in public opinion and may transform into each other with probabilities and , respectively.
The population size changes constantly due to
and
. Such dynamics are commonly observed in reality and are taken into account in certain models that study information propagation [
12].
According to the spreading process elaborated above, the differential equations can be described as follows:
Then, the influence on the company’s stock prices also needs to be identified and quantified. In finance, a return can refer to changes in stock prices, and abnormal returns (ARs) are a widely used measurement to illustrate the trends of stock price fluctuations. As for stocks, if an event is unexpected and value-relevant for some companies, it is bound to cause an AR as measured by the actual ex post return in proportion to the normal (or expected) one over the same period [
13].
Word-of-mouth propagation is a specific type of event. Positive word-of-mouth, such as favorable reviews or recommendations from individuals, plays a vital role in shaping a positive image of the company and its offerings. This positive perception has the potential to attract more customers and investors. Conversely, negative word-of-mouth, such as complaints or negative reviews, can have adverse consequences for the company’s reputation. This negative perception can discourage potential customers and investors.
Therefore, the variable “” is introduced into the model, which represents the cumulative abnormal returns and is computed by summing over time the AR. The fluctuation of stock prices may also be influenced by other factors. In order to focus on the influence of WOM, these additional factors are simplified and represented as a random variable. The initial value of is set as 0. The sign of “” indicates whether the influence of WOM on the stock price is positive or negative.
The differential equation can be described as follows:
denotes the coefficient of the influence caused by word-of-mouth, with a positive value.
denotes the random fluctuations caused by other factors, and it follows a normal distribution with , which means that this is a standardized variable of other factors.
To highlight the influence of word-of-mouth rather than other random factors, by default.
The term “” indicates that the influence of word-of-mouth is not unlimited or boundless. If is greater than , may be less than zero and the value of may decline; otherwise, the value of may increase, which constrains the influence of word-of-mouth within a restricted range.
2.2. Stability Analysis
It is obvious that the values of are not influenced by the value of . Therefore, to assess the stability of the whole model, we initially focus on analyzing Equation (1). The stability of Equation (1) will subsequently determine the stability of Equation (2).
2.2.1. Stability of Information Propagation
As for Equation (1), the basic reproduction number, denoted as , is a concept utilized in many models, including those for epidemics and rumor propagation. In the context of word-of-mouth propagation, is used to assess the extent to which information spreads from one individual to others within a population.
In Equation (1), .
If , it is obvious that Equation (1) has a unique equilibrium , which means that there are no online public opinions about the product or service, resulting in the absence of word-of-mouth propagation.
If
, there is another equilibrium that satisfies
, indicating the occurrence of word-of-mouth propagation and the formation of public opinion.
Through some simple calculations, the equilibrium can be determined as in Equation (4).
Given the research focus of this work on the effects resulting from word-of-mouth propagation, our attention is solely directed towards analyzing the equilibrium status represented by Equation (4) when .
Theorem 1. If , the equilibrium of Equation (1) is globally asymptotically stable.
Proof. To prove the global asymptotic stability, we use the method of Lyapunov functions. The Lyapunov function
is defined in the following form, which combines a logarithmic Lyapunov function and composite quadratic function
with a Lyapunov derivative
Substituting the derivatives
from Equation (1) into Equation (6), we have
At a steady state from Equation (3), we have
Substituting Equations (8)–(10) into Equation (7) gives
According to Equation (11), we have
Substituting Equations (13) and (14) into Equation (12) gives
Factorizing Equation (15) results in
Since the arithmetic mean exceeds the geometric mean and the square exceeds zero, the following inequality form in Equation (16) holds:
Thus, .
, if and only if Equation (17) is satisfied.
It is obvious that is the unique solution of .
Through LaSalle’s Invariance Principle [
14],
is globally asymptotically stable, and the proof is completed. □
In the real world, can be considered as the state in which WOM prevails on social media and public opinion is formed online.
2.2.2. Stability of Stock Price Fluctuations
According to the stability analysis, the initial status and specific trajectory by which WOM propagation occurs do not influence the final status of WOM, wherein it prevails on social media. At that time,
, and the equation of
can be rewritten as Equation (18).
In order to obtain the final status of
,
is set. Because there is a random variable in the model that follows a normal distribution with
,
will fluctuate slightly around a certain value. The value of
can be approximately described as in Equation (19).
3. Numerical Experiments
After the theoretical analysis, it is shown that the dynamical behavior of WOM propagation and stock price fluctuations will enter into the final status that is globally asymptotically stable.
Then, numerical experiments are conducted to explore the specific details of the final status. According to Equations (4), (18) and (19), there are three different types of situations that demonstrate the trends of WOM propagation and stock price fluctuations. Each situation is determined by the comparison of and , which essentially reflects whether the quality of the products or services can meet consumers’ expectations.
Therefore, in this section, corresponding real events for the situations are selected and the values of and are determined. The event study method is used to analyze the abnormal returns of real events and examine whether they are consistent with the simulation results generated by the model.
3.1. Event Study Method
The event study method employs statistical techniques to examine the influence of an event on the financial performance of a security, such as a company’s stock [
15]. The event study method is important in the present research. Therefore, the details of this method need to be specified first.
The performance of the event study method usually follows a well-established procedure, including defining the event window, calculating the normal returns, estimating the ARs and obtaining the CAR, and statistically testing the significance of the CAR.
The process and duration of WOM propagation may vary across events. For example, some events may experience the possibility of news leakages preceding themselves, while some events’ influences may lag. Therefore, we choose to define different event windows for the corresponding events.
To define the AR, the normal or expected performance must be calculated. This task requires the definition of an estimation window, i.e., a sample period prior to the event window. In this study, the estimation window is defined as
. The estimation of ARs is carried out using the single index model (SIM). The SIM states that the returns are due to a single factor, being the market factor. In other words, the returns of a stock can be found through its relationship to some market index [
16]. It can also be called the market model. The equation of
is expressed as in Equation (20).
where
is the actual ex post return, and
denotes the market return.
Considering that the stocks of different companies may be traded on different stock exchanges, this study selects the appropriate market returns based on the stocks of each company, such as the CSI 300 Index, the Hang Seng Index, S&P 500 Index, and others.
The real data of each event and the market returns are gathered from “Investing.com” (accessed on 20 August 2024). “Investing.com” can provide stock trading data from over 250 exchanges worldwide.
Without relying on any distribution, the test presented by Wilcoxon (1945) [
17] is selected to check for statistical significance and analyze whether the CAR is significantly greater or less than zero.
3.2. The Situation Where
indicates that consumers have a lower level of acceptance towards products or services, which is insufficient compared to their level of criticism and dissatisfaction. As a result, in this situation, the number of individuals expressing negative word-of-mouth on the Internet is expected to exceed the number of individuals expressing positive word-of-mouth. This implies that the quality of the products or services falls short in meeting consumers’ expectations. In the real world, this situation occurs quite frequently, including various events, such as poor service attitudes and substandard product quality. For example, in November 2022, a serious accident unfolded in Guangdong, China, involving a Tesla vehicle, leading to two fatalities and three injuries. The accident occurred when a Tesla Model Y unexpectedly lost control during parking and plowed into other vehicles at a high rate of speed. The driver maintained that efforts were made to engage the brakes but were unsuccessful in decelerating the vehicle. However, Tesla stated that the backend data showed that there was no record of the brakes being applied throughout the accident. This accident ignited heated discussions regarding the quality of Tesla’s vehicles. Some netizens linked this event to a series of prior accidents involving Tesla vehicles, raising concerns about the dependability of Tesla’s braking mechanisms. Meanwhile, certain netizens questioned the authenticity of Tesla’s driving data. Therefore, the values of the parameters are set as . The parameters have specific real-world interpretations corresponding to their respective values.
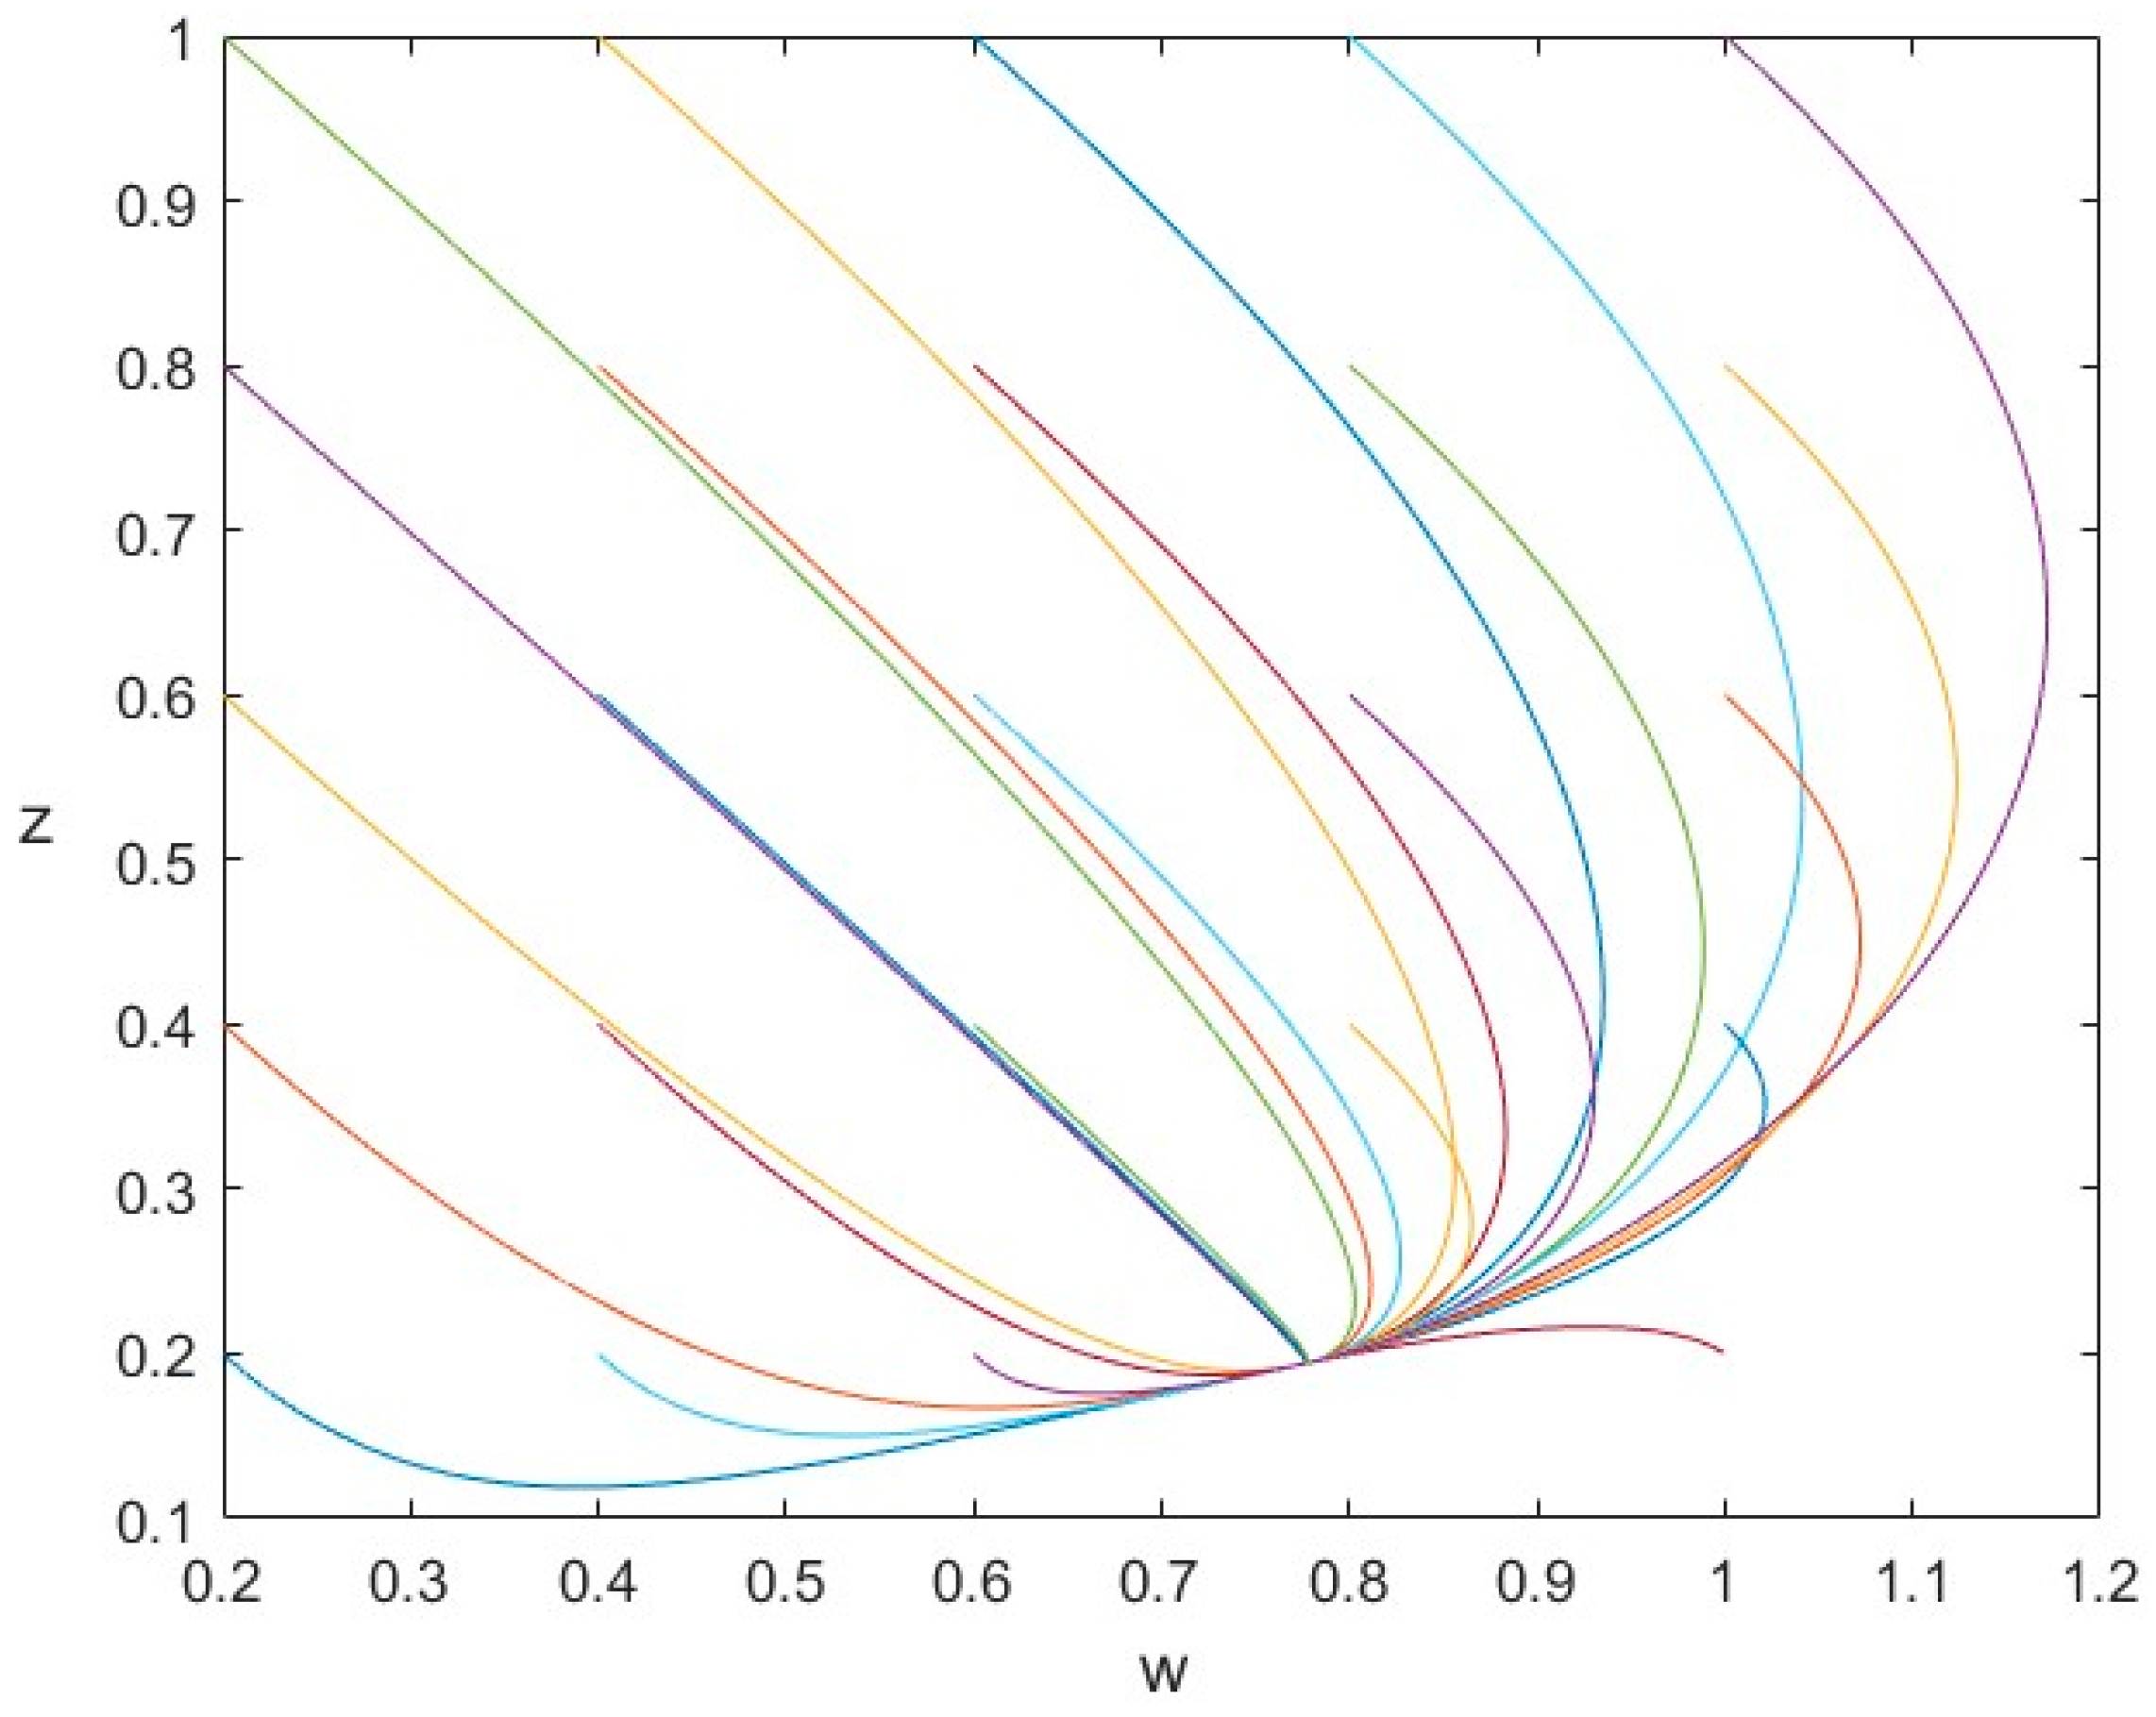
In mathematics, a phase portrait is a geometric representation of the trajectories of a dynamical system in the phase plane. Phase portraits are a tool used in studying dynamical systems. In the following, we utilize the phase portrait depicted in
Figure 2 to depict some orbits of
from different initial points and describe the nonlinear motion. It is evident that each orbit from different initial statuses converges to the same equilibrium point in which
. The word-of-mouth is negative.
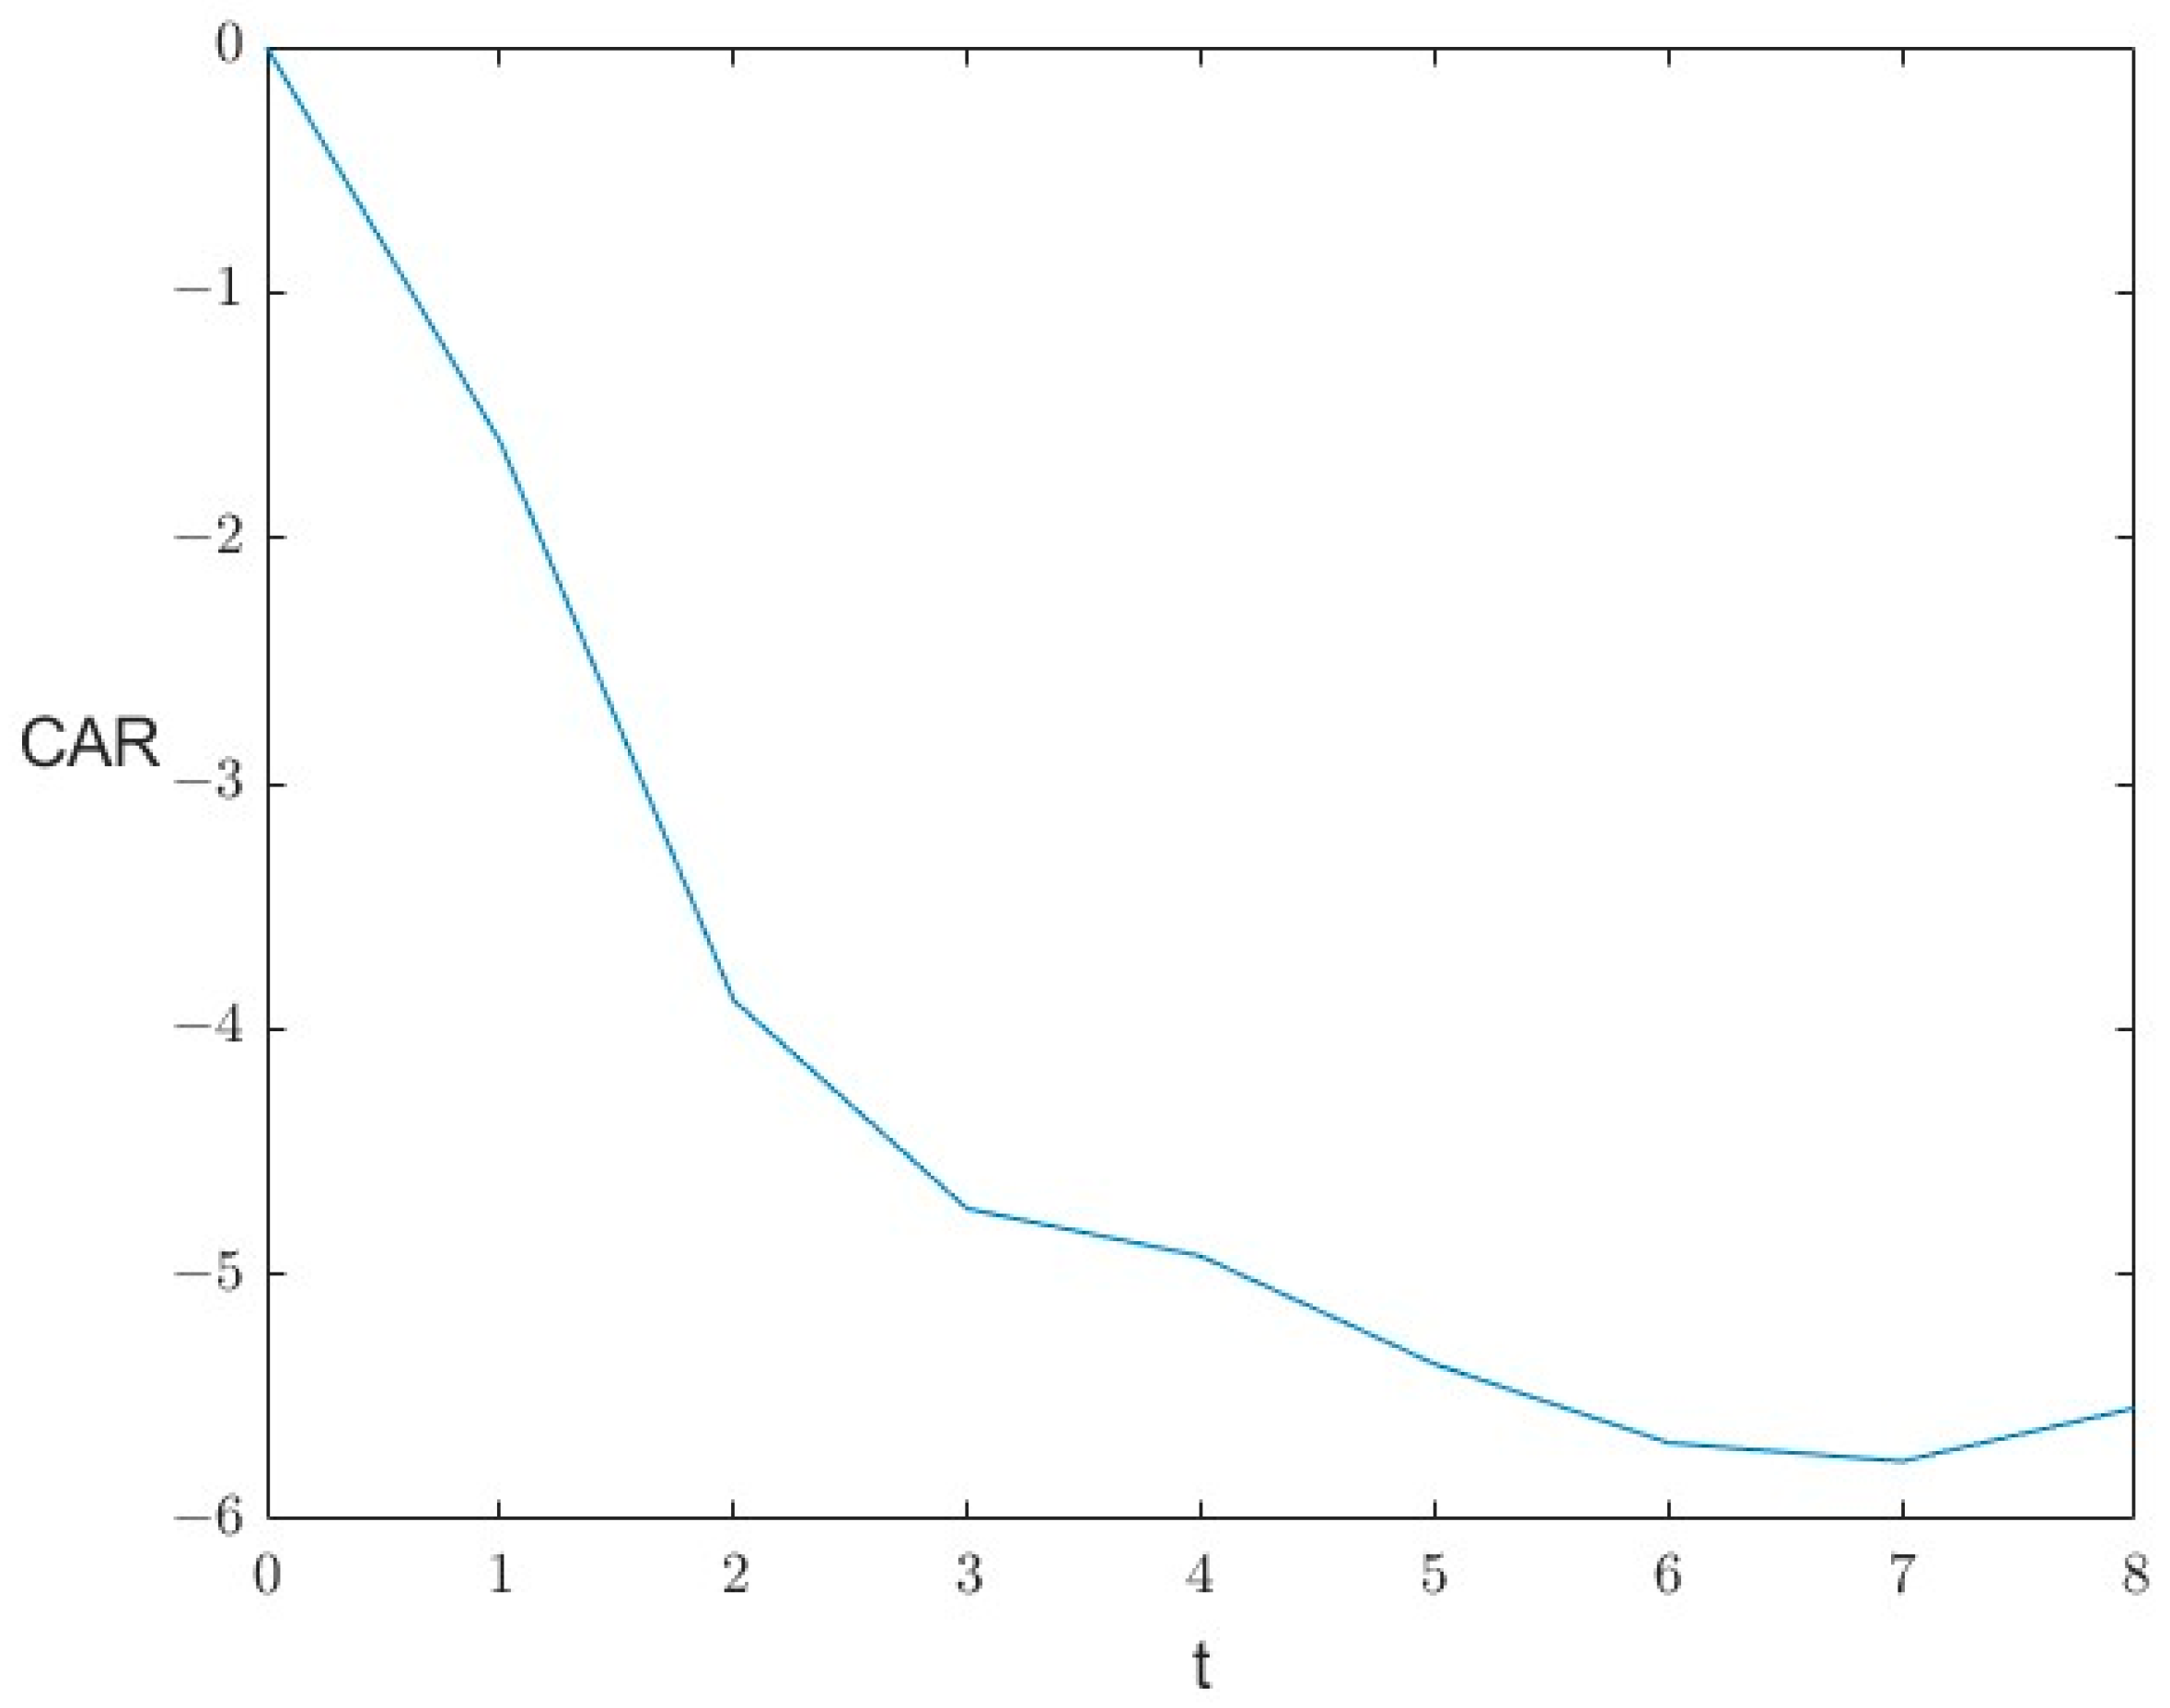
Then, we explore the CAR’s evolution. As mentioned before, the initial value of the CAR is set as 0. Additionally, the initial value of is set as . This implies that positive and negative word-of-mouth exert equal influences in the initial state.
The simulation result for CAR evolution is shown in
Figure 3. The evolution of CAR will enter into a stable status with the propagation of WOM and the final value is
. In this situation, the public opinion due to word-of-mouth has a strong influence, attracting a substantial number of individuals to actively participate in discussions. A greater number of individuals disseminate negative word-of-mouth compared to positive word-of-mouth. Consequently, these discussions possess greater potential to influence the stock price compared to the effects of other factors, having a negative influence on the stock price.
As for Tesla, the accident significantly tarnished Tesla’s reputation, causing a loss of prospective customers and eroding the company’s competitive position in the market.
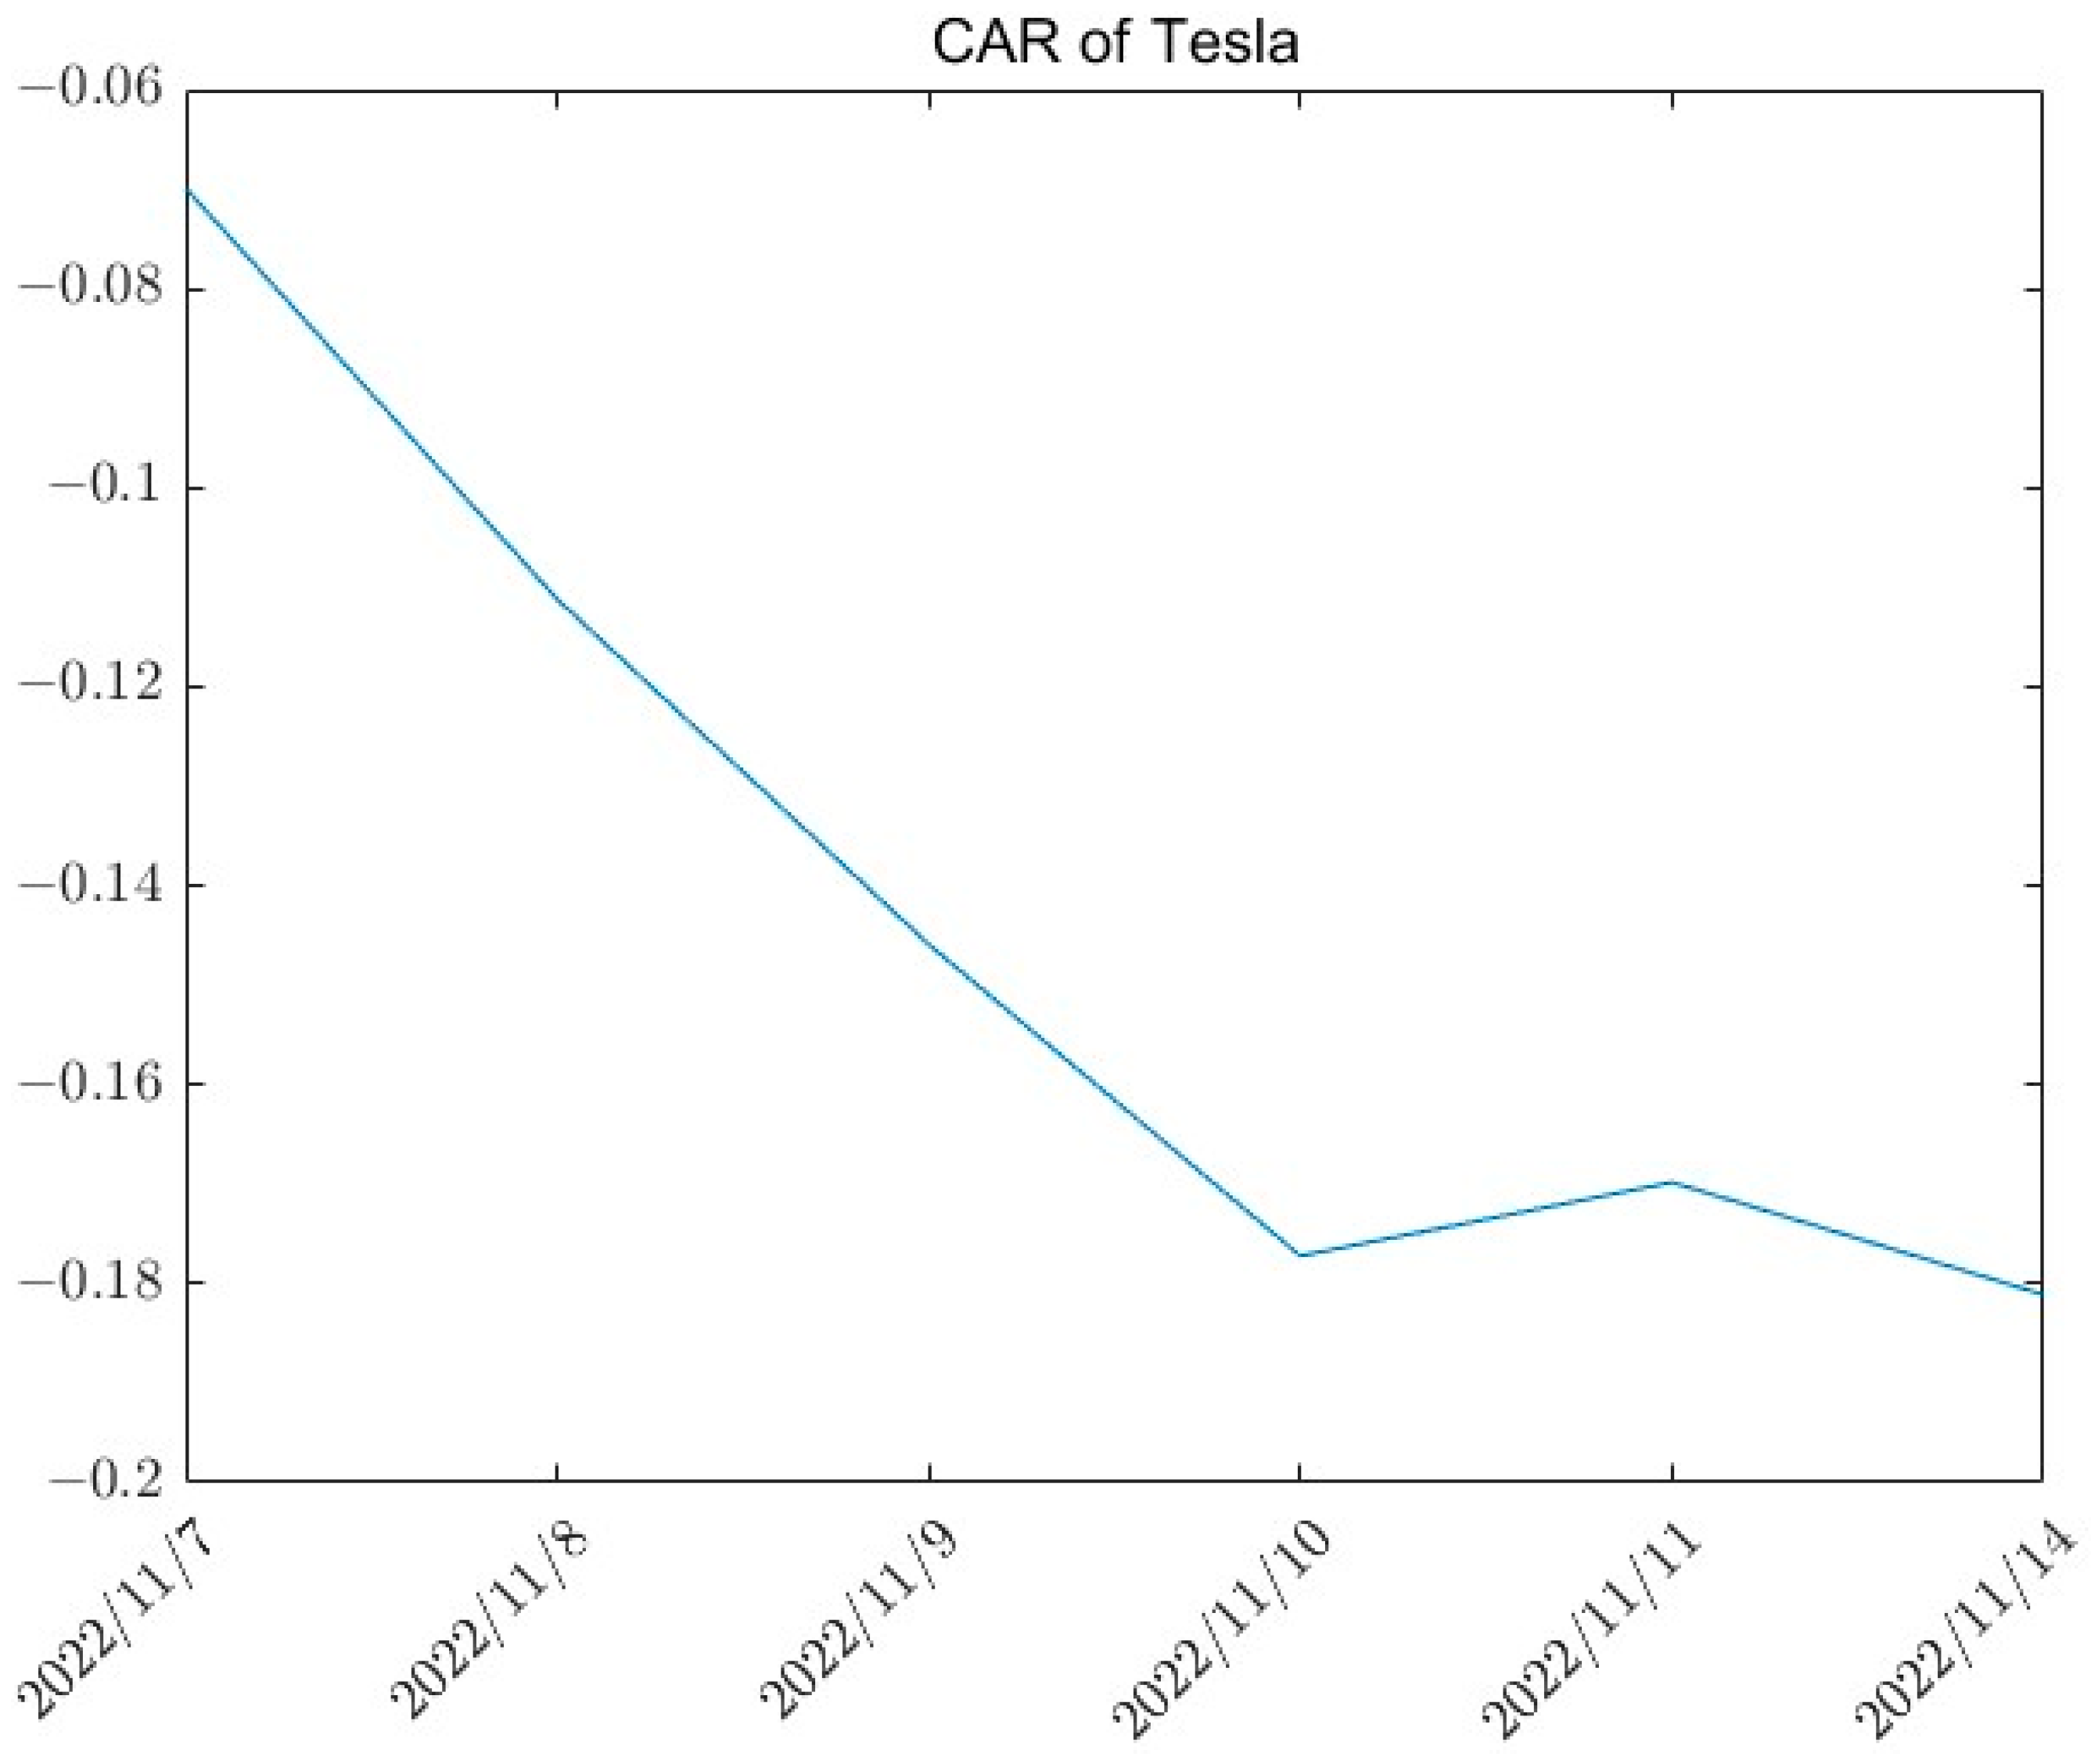
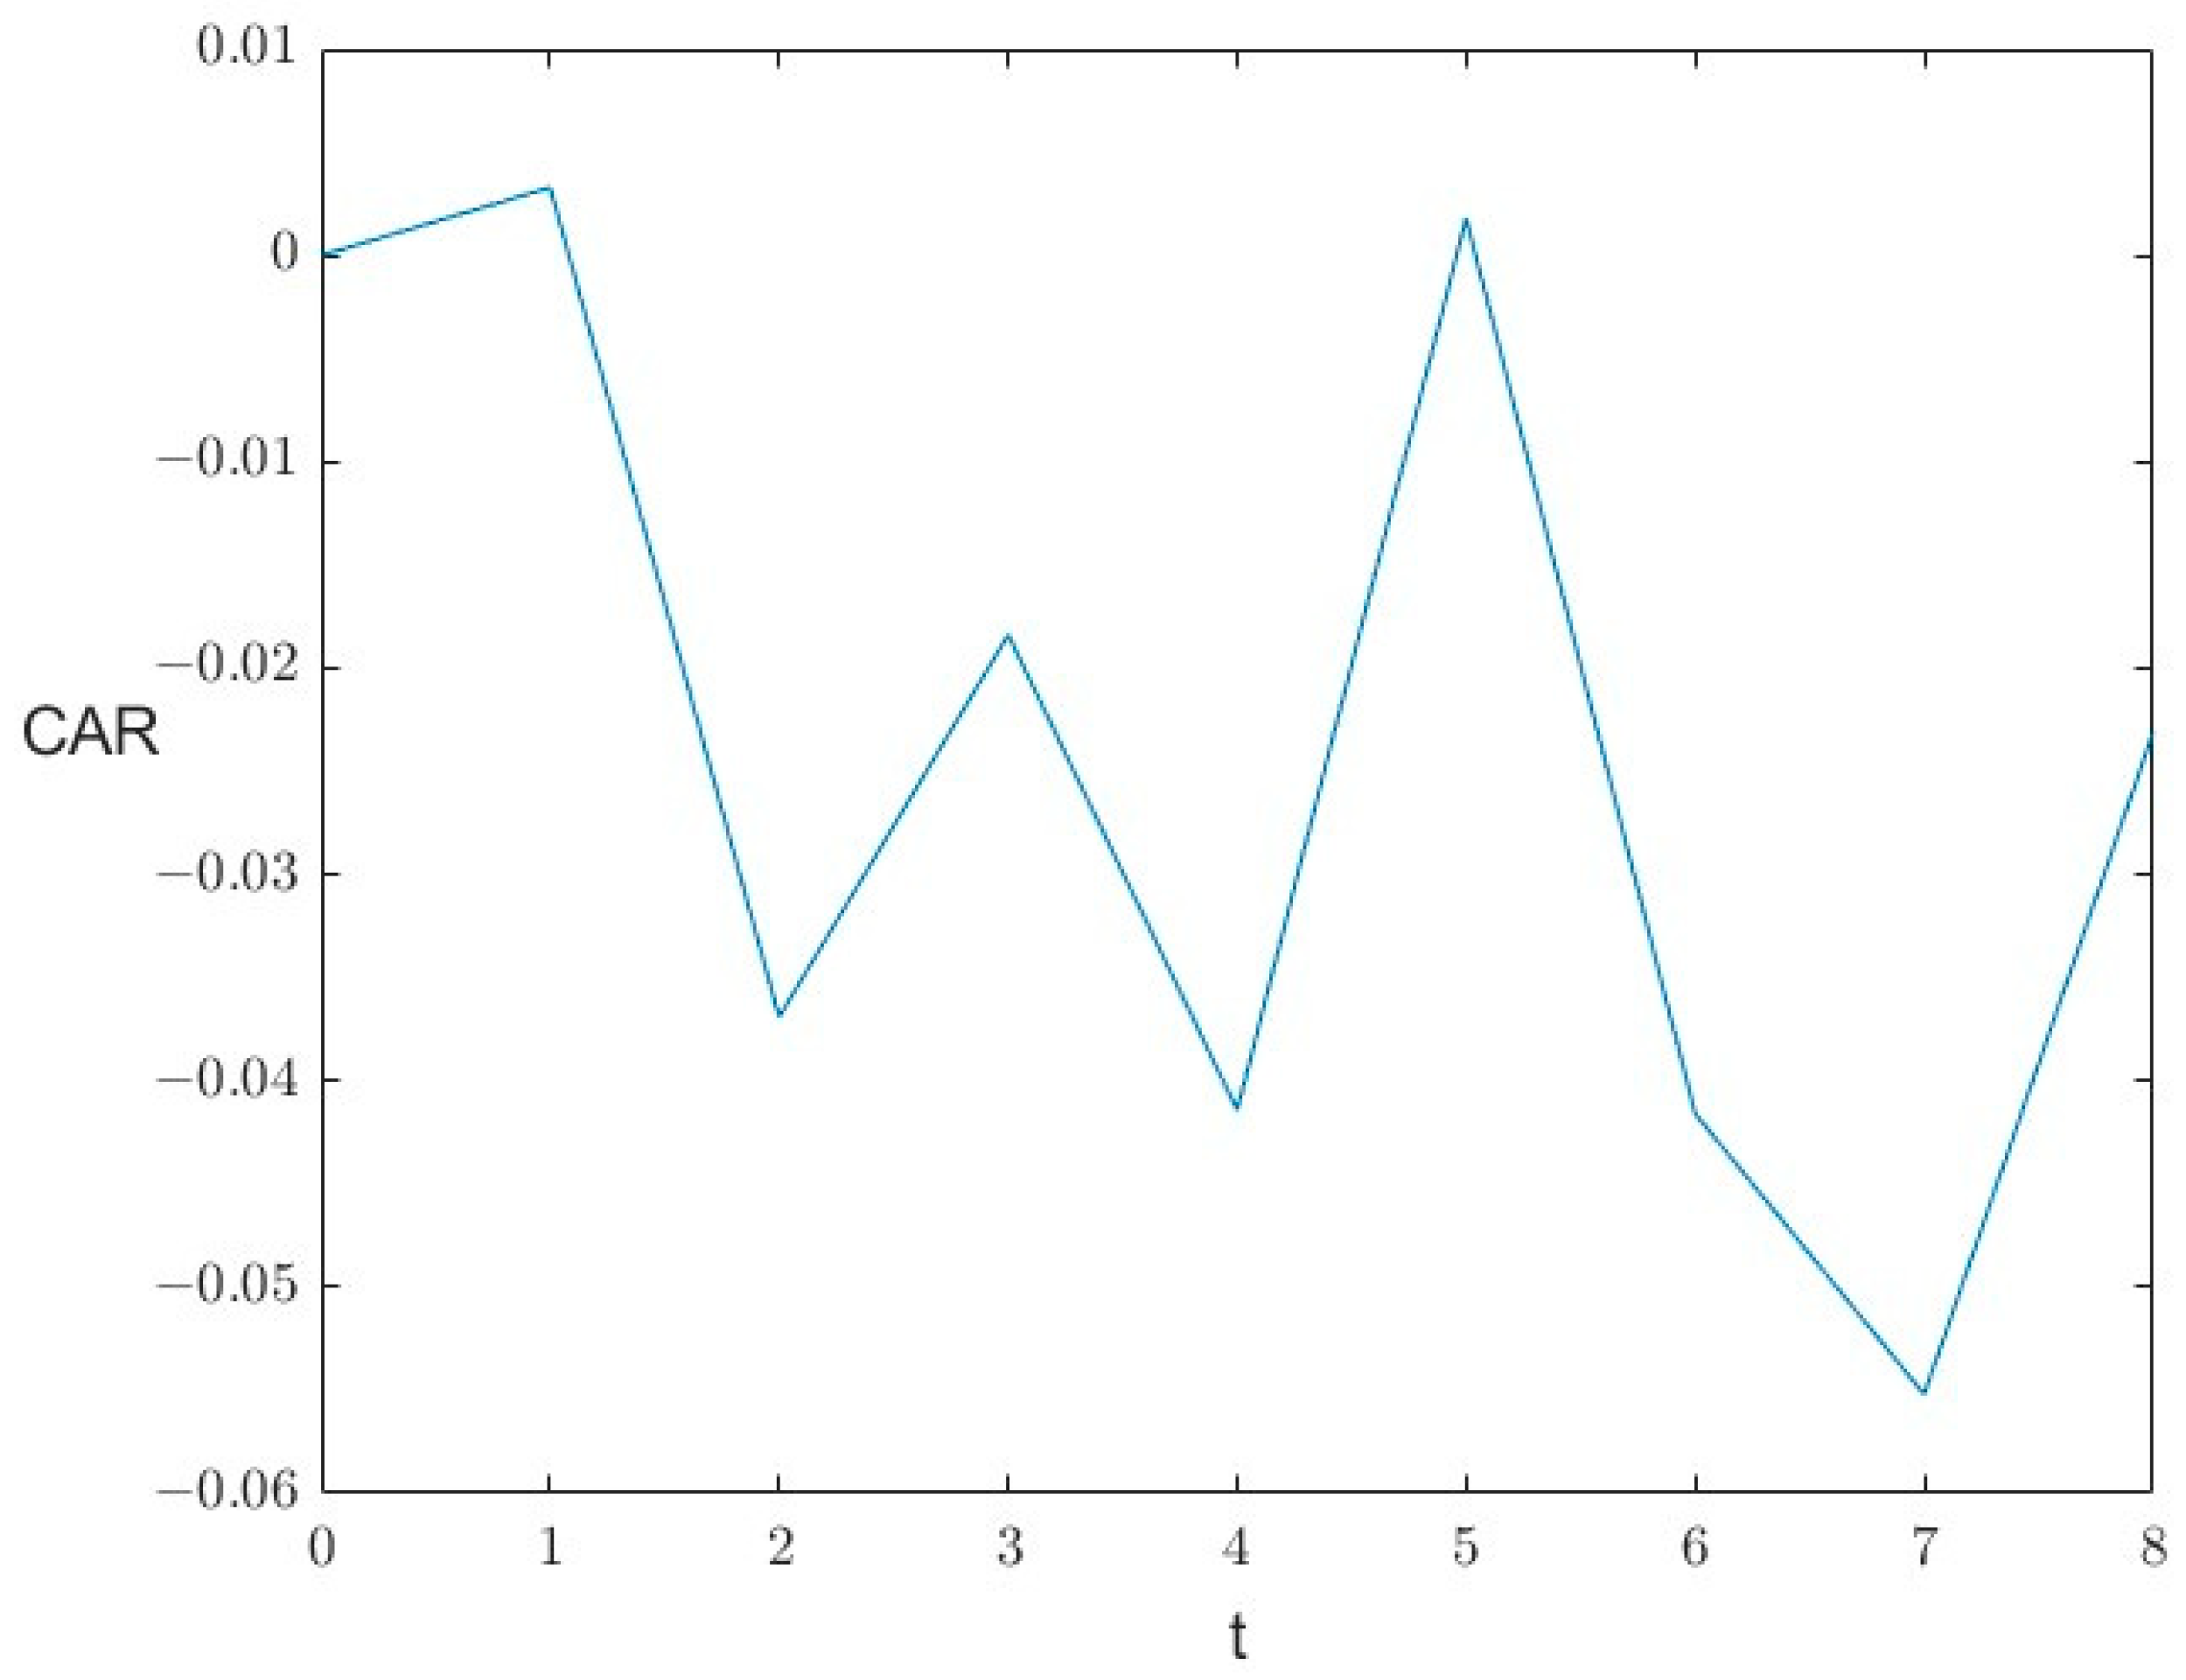
The event window is defined as
. Using the event study method, Tesla’s CAR for each day during the event window is determined, as shown in
Figure 4.
As shown in
Figure 4, the value of Tesla’s CAR is less than zero. The statistical test shows that CAR
is significantly less than zero, which means that WOM has a negative influence on the stock price.
3.3. The Situation Where
implies that the quality of products or services is satisfactory and meets the expectations of consumers. As a result, in this situation, the number of individuals expressing positive word-of-mouth on the Internet is expected to exceed the number of individuals expressing negative word-of-mouth.
In the real world, this situation typically arises when a company adopts innovative methods to enhance the quality of its products or services. For example, on 21 June 2022, Li Auto held a conference to unveil the Li L9, a revolutionary vehicle that was designed to enhance driving comfort and incorporate many intelligent services. This much-anticipated launch ignited fervent discussions across online platforms. A large number of netizens showed great interest in the vehicle. Some netizens noted its suitability for families due to its configuration. Some netizens were intrigued by its advanced technological attributes.
Therefore, the values of the parameters are set as . The parameters also have specific real-world interpretations corresponding to their respective values.
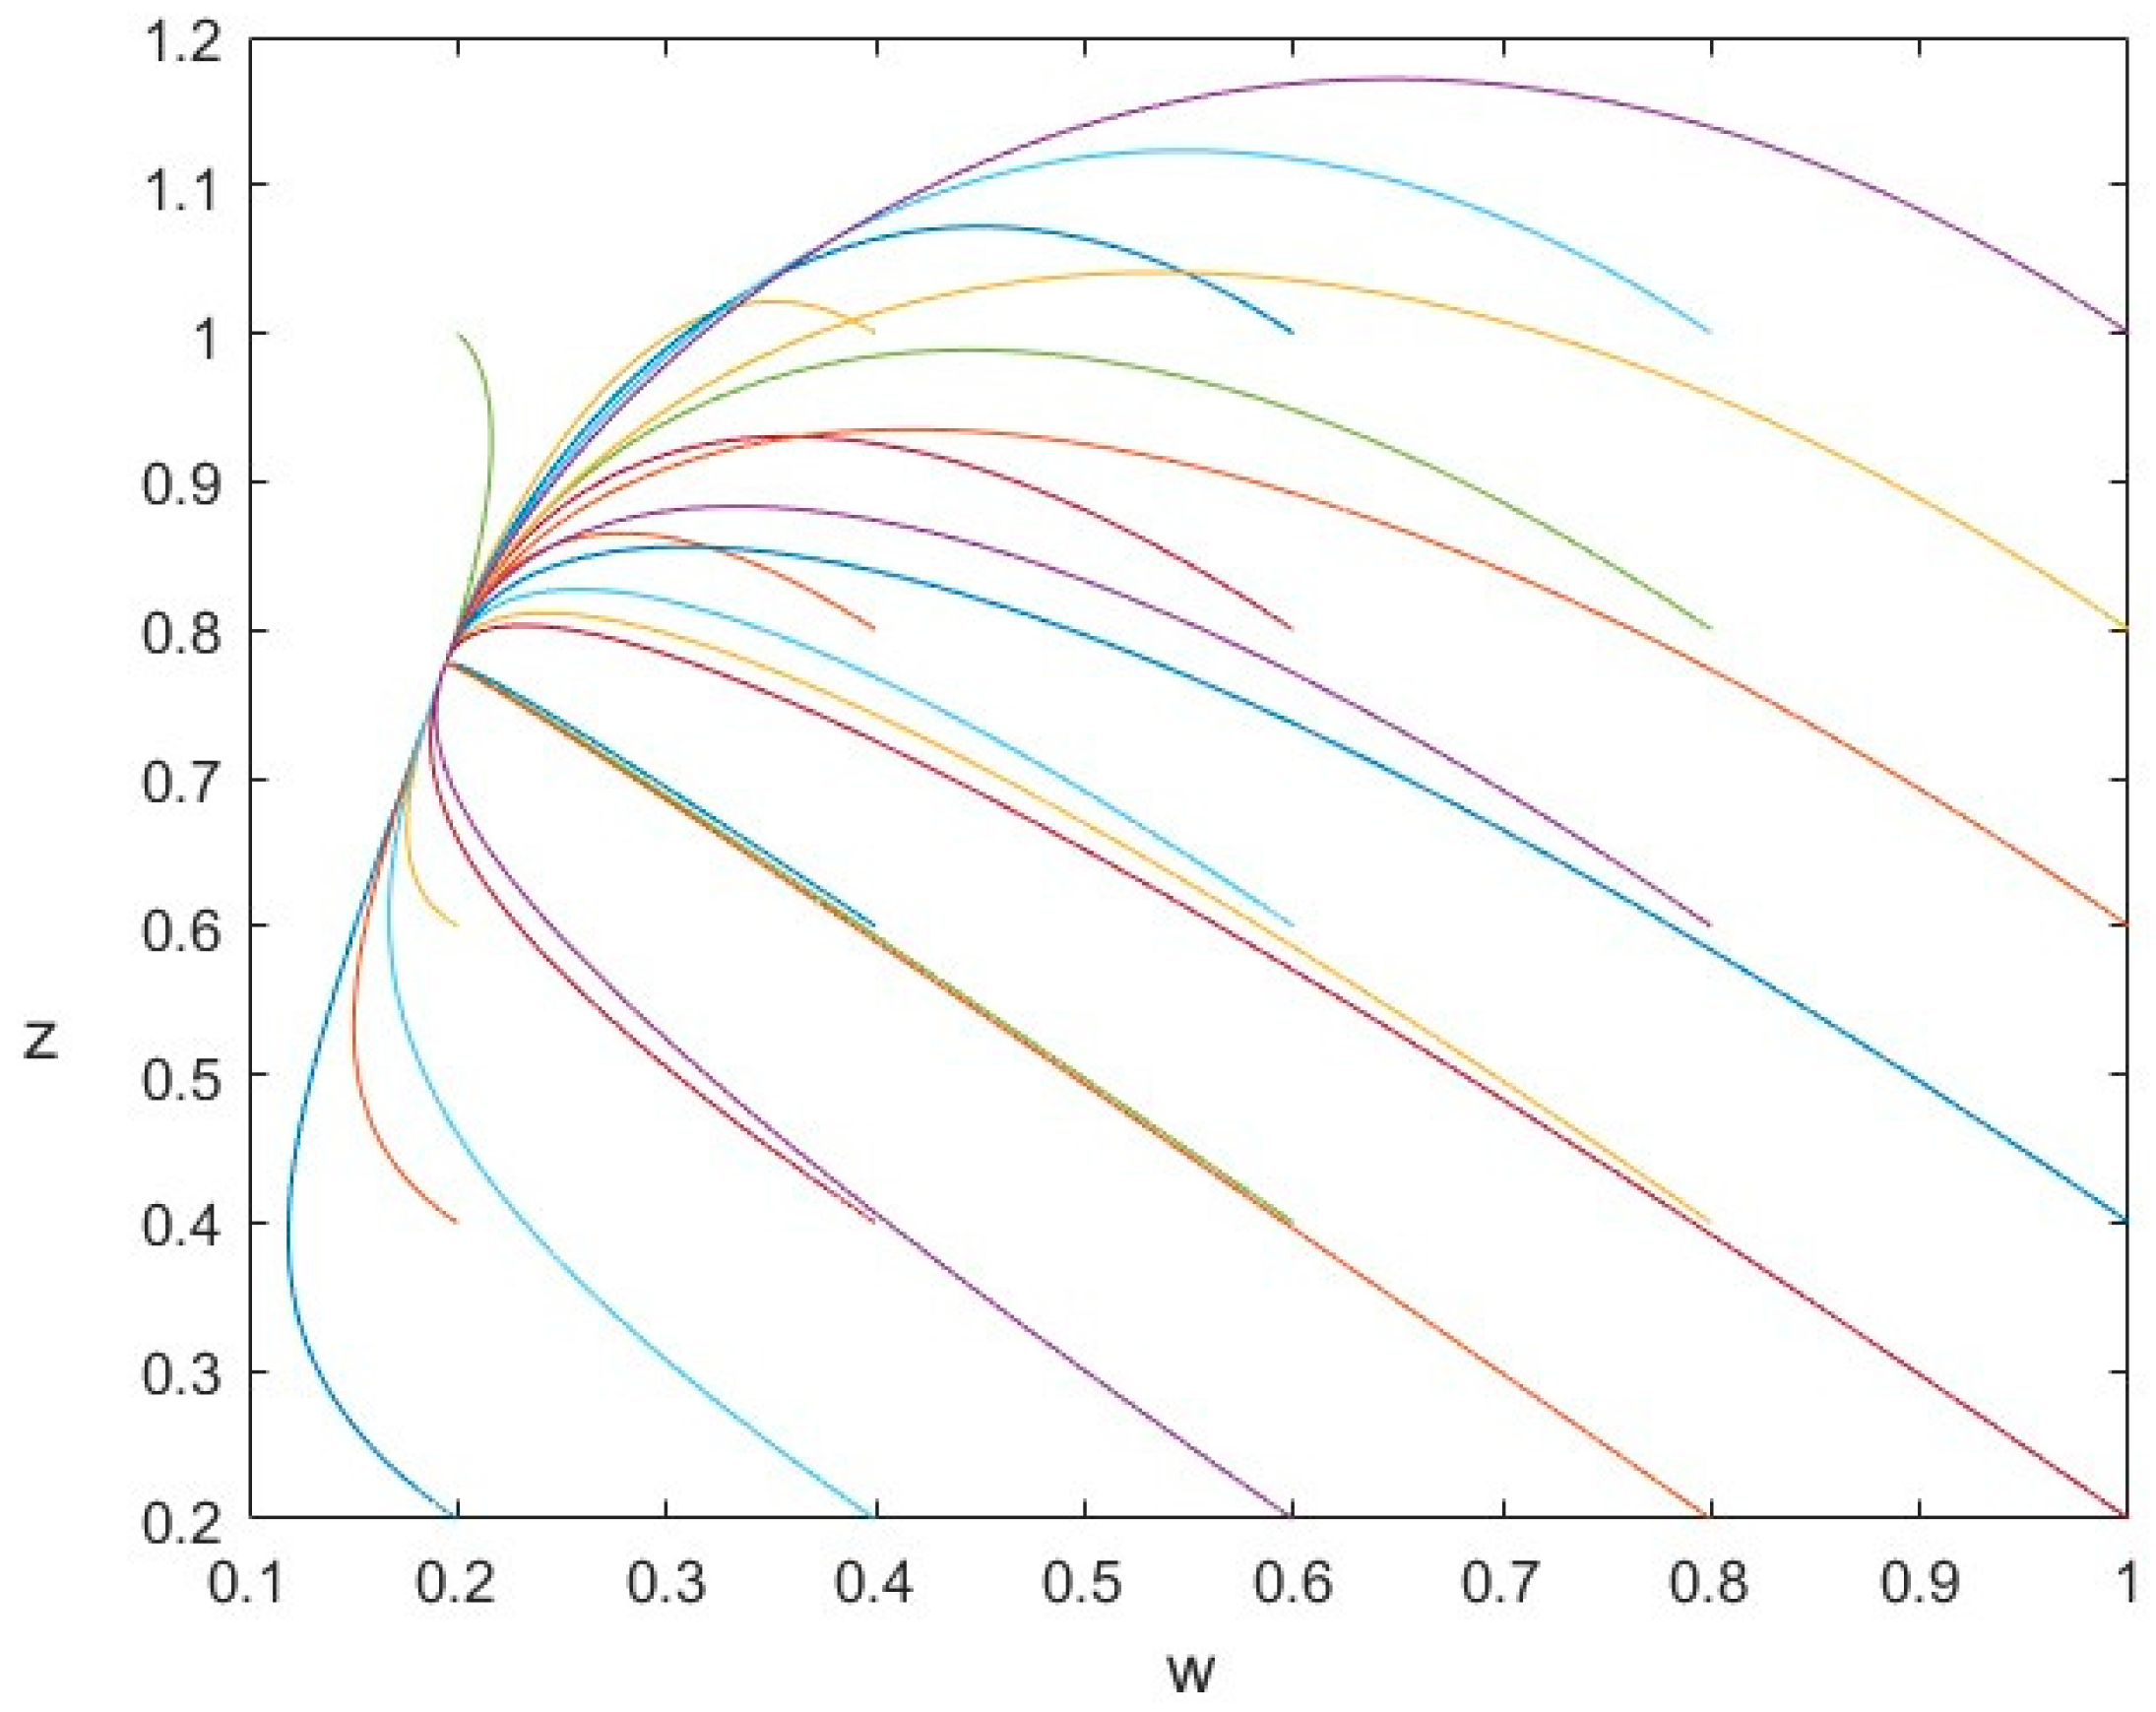
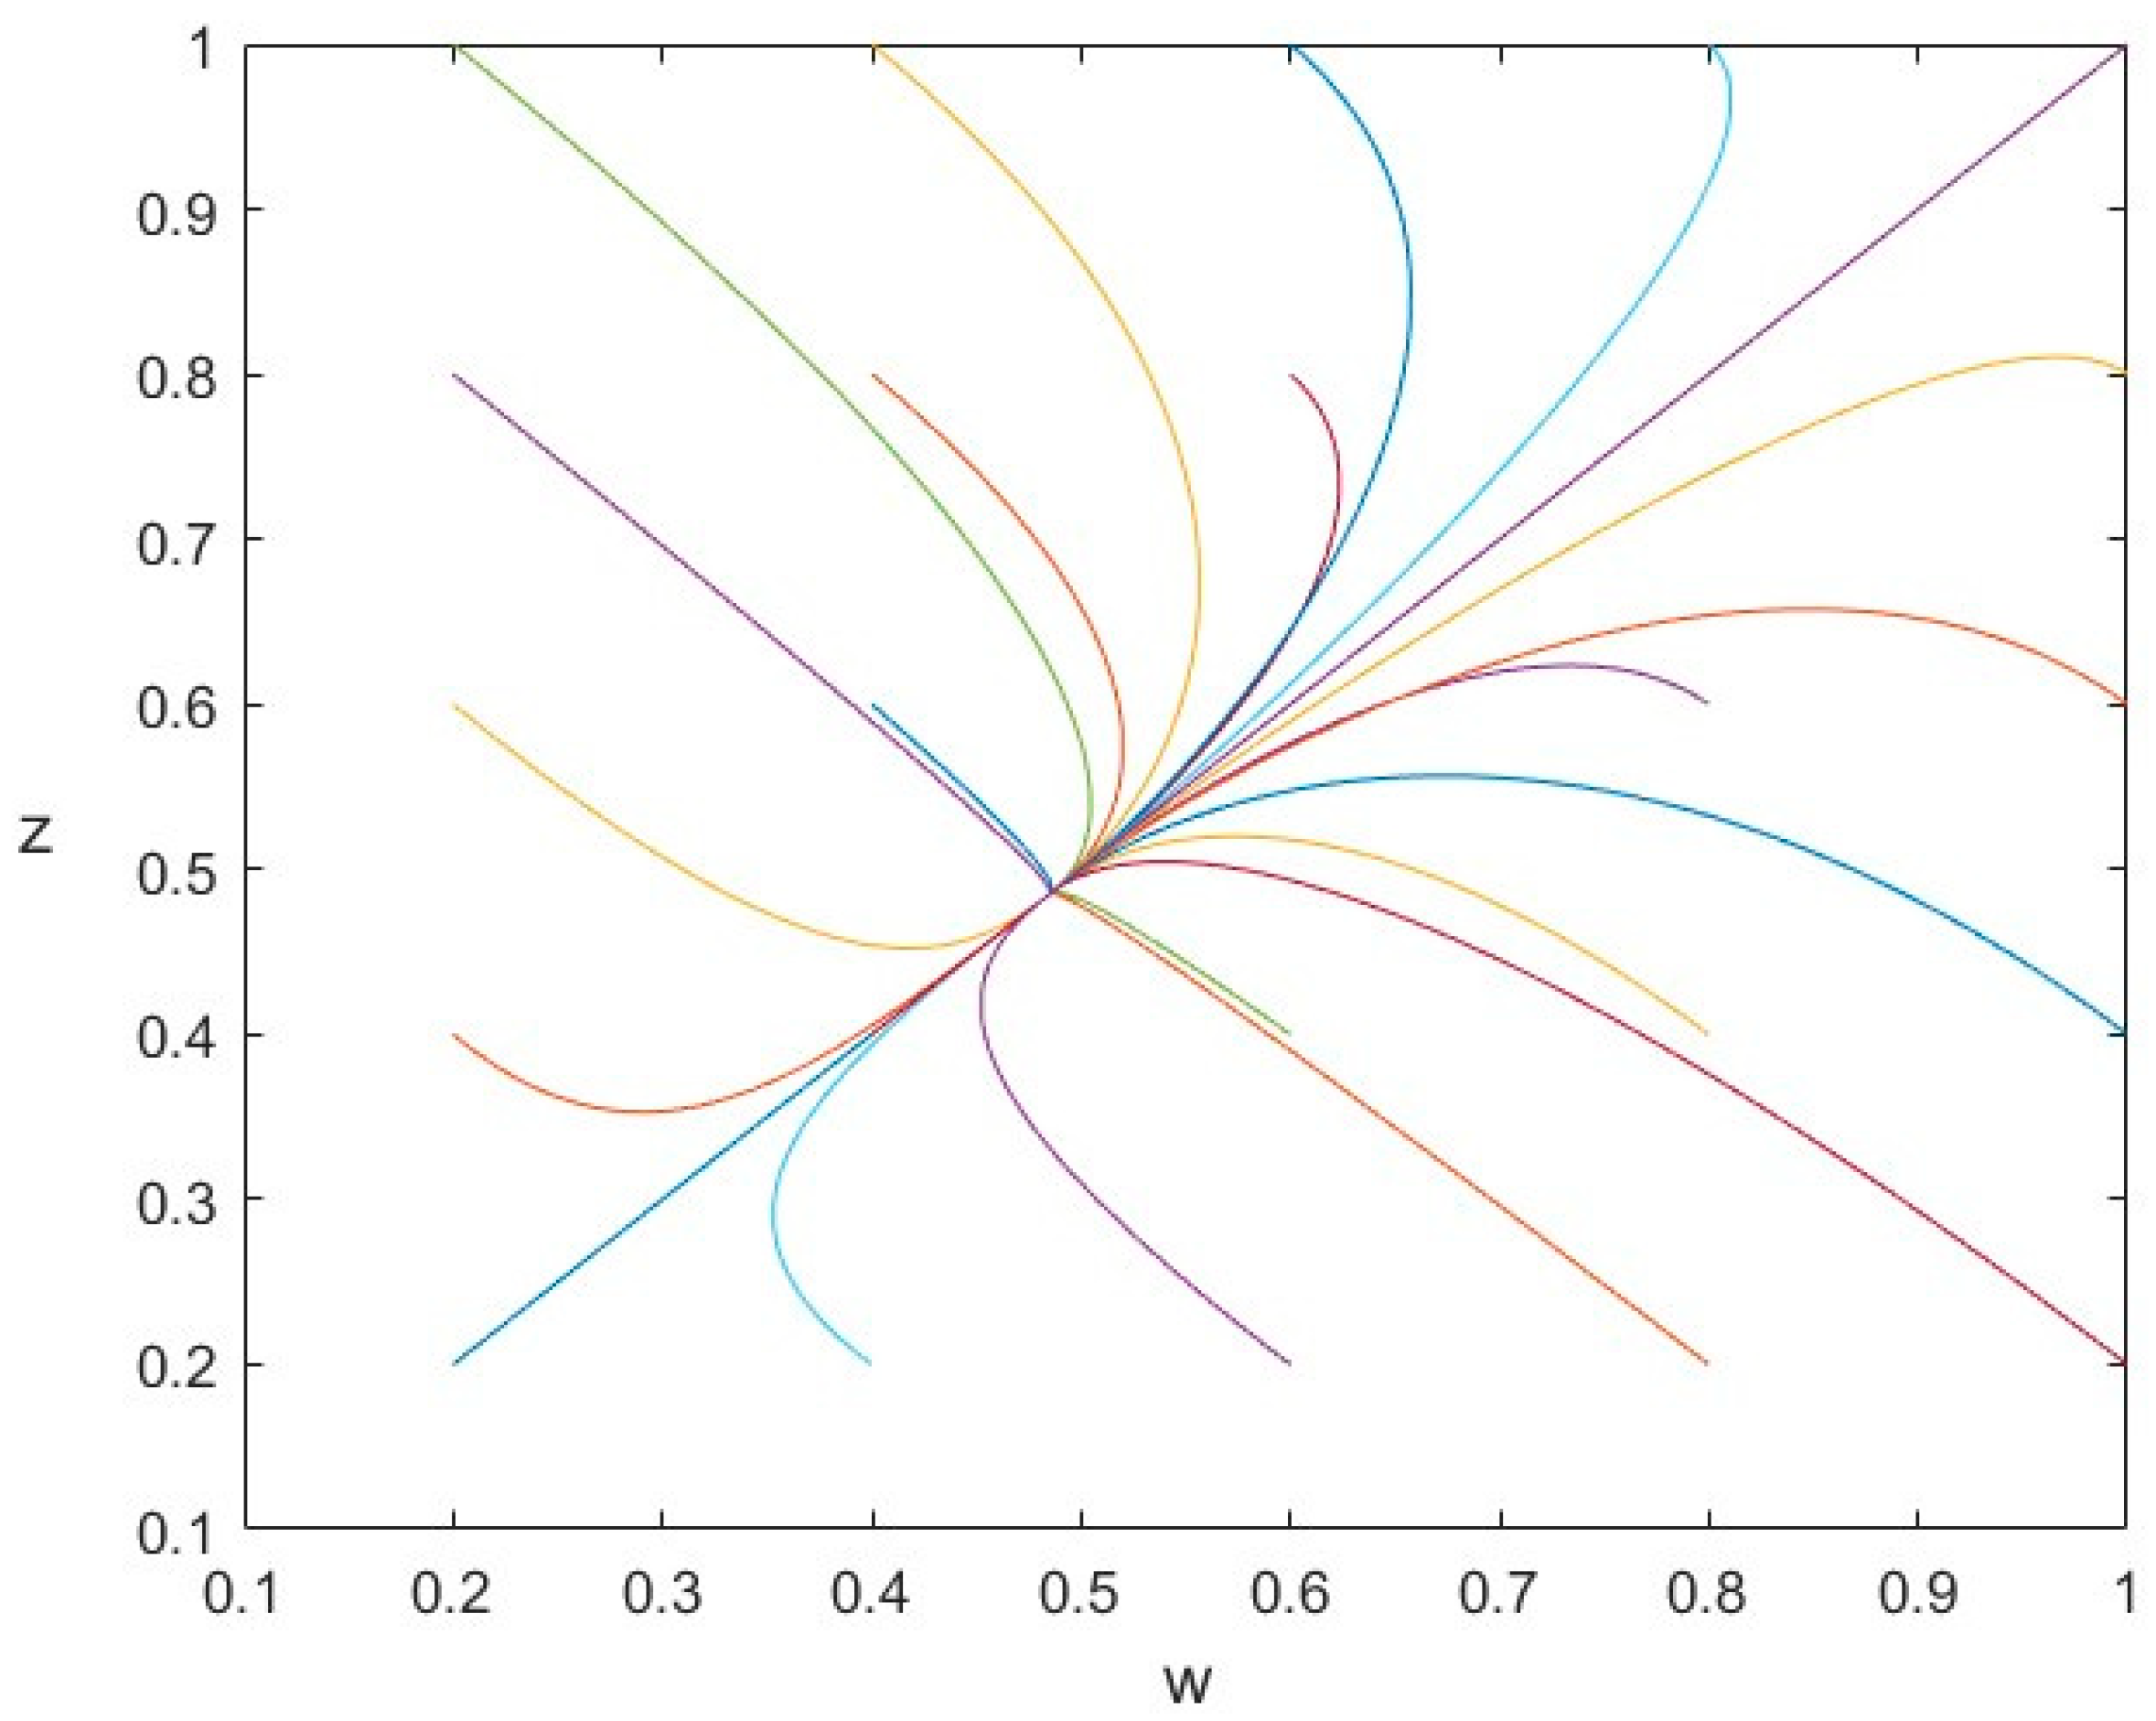
In the following, the phase portrait is utilized in
Figure 5 to depict some orbits of
from different initial points and describe the nonlinear motion. It is evident that each orbit from a different initial status converges to the same equilibrium point in which
. The word-of-mouth is positive.
Then, we explore the CAR evolution. The initial value of the CAR is set as 0. Additionally, the initial value of is set as .
The simulation result for the CAR evolution is shown in
Figure 6. The evolution of the CAR will enter into a stable status with the propagation of WOM and the final value is
. In this situation, the public opinion due to word-of-mouth also attracts a substantial number of individuals to actively participate in discussions. In contrast to
Section 3.1, more people propagate positive word-of-mouth rather than negative word-of-mouth. Consequently, these discussions possess greater potential to influence the stock price compared to the effects of other factors, having a positive influence on the stock price.
Thus, comparing the simulation result with the real-world case, the positive WOM generated by the Li L9 provided investors with insight into the company’s promising growth prospects.
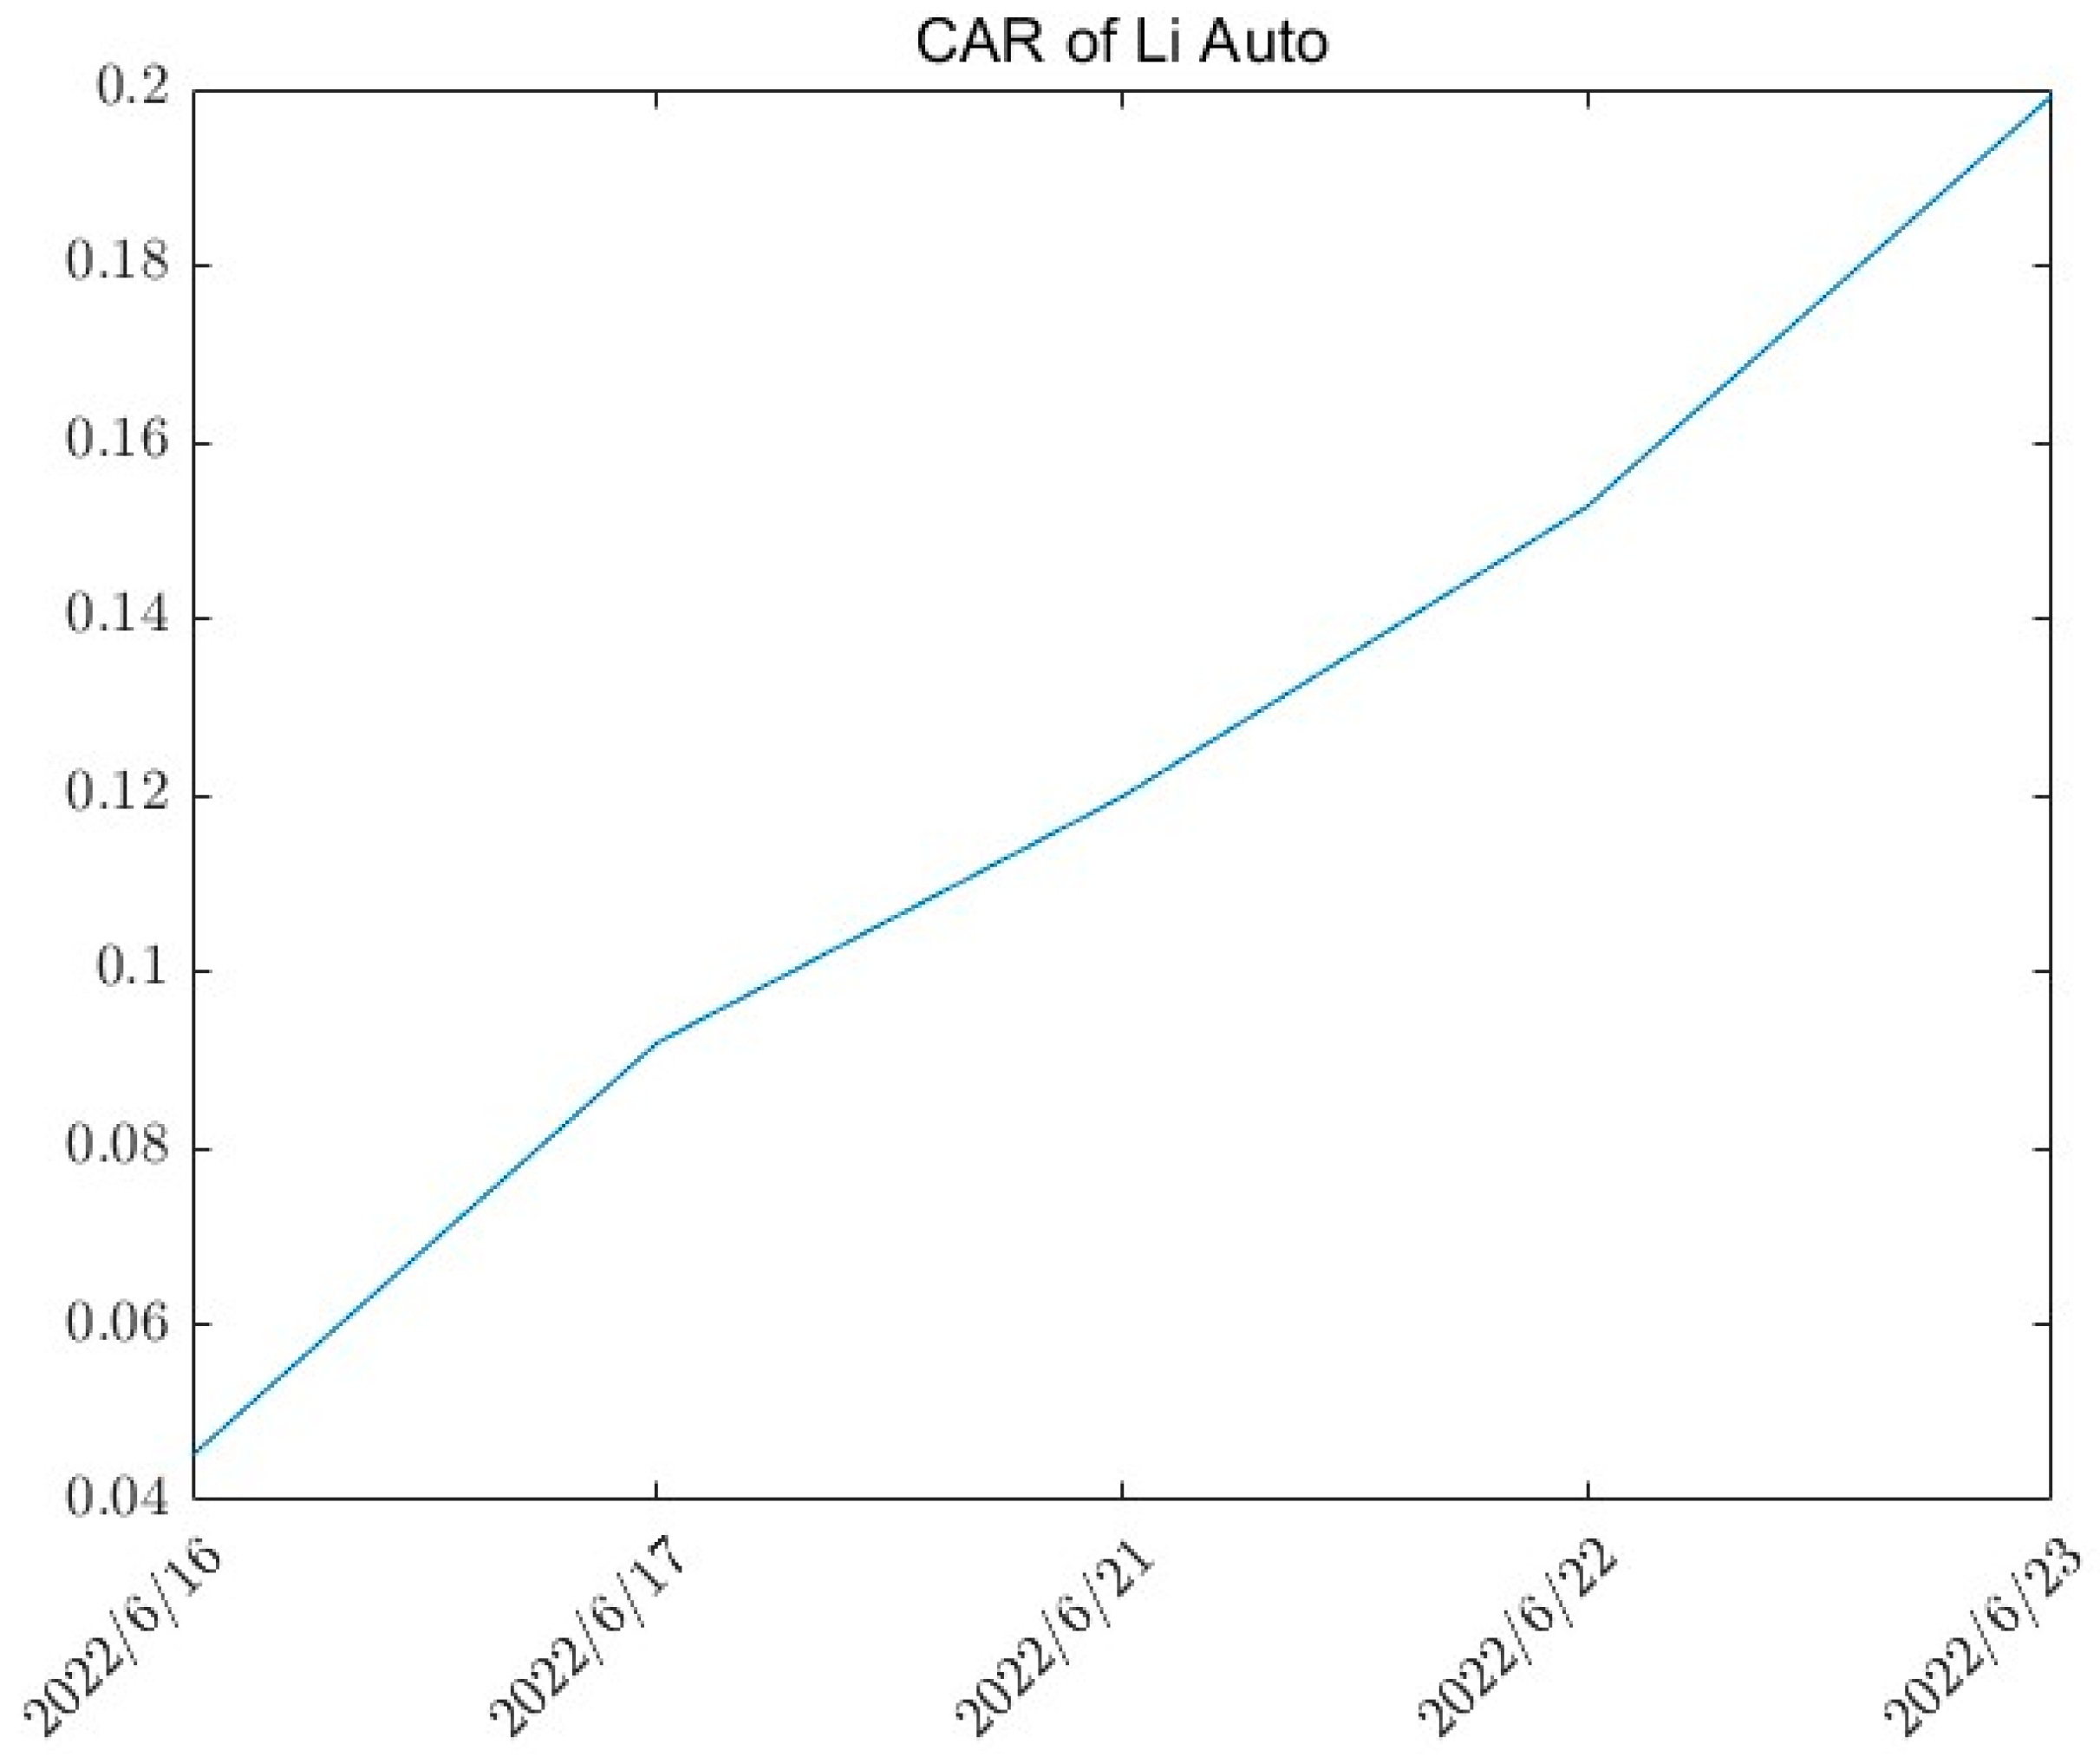
The event window is defined as
. Using the event study method, Li Auto’s CAR for each day during the event window is determined, as shown in
Figure 7.
As shown in
Figure 7, the value of Li Auto’s CAR is greater than zero. The statistical test shows that CAR
is significantly greater than zero, which means that the WOM has a positive influence on the stock price.
3.4. The Situation Where
implies that the quality of the product or service elicits a mixed response from individuals, characterized by a combination of cautious anticipation and skepticism. This diverse range of perspectives contributes to a wide array of opinions and perceptions regarding the product or service. For example, on 4 September 2023, Moutai and Luckin Coffee collaborated to create a novel beverage that fused baijiu with coffee. The product triggered complex discussions from netizens. Certain netizens perceived the beverage as an interesting experience for consumers. However, others found the flavor of this beverage unacceptable. Furthermore, some netizens questioned whether the expensive Moutai baijiu was genuinely added to the beverage. There were also some suggestions that the beverage might result in driving while intoxicated.
The values of the parameters are set as .
In the following, we utilize the phase portrait depicted in
Figure 8 to depict some orbits of
from different initial points and describe the nonlinear motion. It is evident that each orbit from a different initial status converges to the same equilibrium point in which
. Therefore, the effects of positive and negative word-of-mouth offset each other, leaving the price value solely influenced by the random variable
.
Then, we explore the CAR evolution. The initial value of the CAR is set as 0. Additionally, the initial value of is set as .
The simulation result for the CAR evolution is shown in
Figure 9. Compared with
Figure 3 and
Figure 6, the absolute value of the CAR is very small and close to zero.
As for Moutai, the contradictory responses provided investors with insights into the product’s potential short-term growth, yet it also prompted concerns regarding the future sales of the product. Therefore, the CAR is close to zero.
The event window is defined as (−2, +2), which includes the days before and after the event date. Using the event study method, Moutai’s CAR for each day during the event window is determined, as shown in
Figure 10.
As shown in
Figure 10, the value of Moutai’s CAR is close to zero. The statistical test shows that CAR
is not significantly different from zero, which means that the WOM does not influence the stock price.
3.5. Summary
According to the simulation results generated by the model, the influence of WOM on stock prices includes negative, positive, and almost zero influences. Employing the event study method to compute the CAR of each event, it is shown that the results of the three real events are similar to the simulation results.
4. Model Verification
It is necessary to verify whether the model can reflect the situations of other events. In other words, the generality of the model needs to be confirmed. Therefore, we collect more real events and use the event study method to examine them.
4.1. Data Collection
As mentioned before, word-of-mouth is one type of public opinion. The propagation of word-of-mouth in real-life scenarios represents the spread of public opinion. “Zhiweidata” is a well-known comprehensive data analysis platform for online public opinion events in China and is widely used in related research [
18]. “Zhiweidata” publishes annual company public opinion hot lists based on the heat trend. We select the events from the company public opinion hot lists of “Zhiweidata” in 2022, 2023, and 2024. However, not all of these events meet the requirements of our study. In order to focus on product and service quality and its influence on stock prices, we selectively obtain 43 real events that are related to the product and service quality of listed companies, including the three events used in
Section 3.
For each event, an analysis is conducted to assess the quality of the product or service, examining whether it meets the consumers’ expectations.
Of the 43 events in this study, the product or service quality fell short of consumer expectations in 23 events, met the expectations in 9 events, and generated a mixed response in the remaining 11 events. Subsequently, the values of and are determined. According to the model above, the comparison of and can be used to predict the CAR, which represents the fluctuations in the stock prices.
Moreover, the real data of each event and the market returns are gathered from “Investing.com” (accessed on 20 August 2024). “Investing.com” can provide stock trading data from over 250 exchanges worldwide.
4.2. Empirical Examination
Then, we need to compute the CAR of each event and examine whether the comparison of and can be used to predict the fluctuations in the stock prices. The event study method is used to examine the influence of WOM on stock prices.
The details of the event study method are the same as in
Section 3. For instance, the event window is defined according to the corresponding WOM propagation process, the estimation window is defined as
, and the estimation of the ARs is carried out using the single index model (SIM).
For each event, the analysis using the event study method produces results in which the CAR is either significantly greater than zero or significantly less than zero, or it is not significantly different from zero. If the predicted fluctuations using and are consistent with the results of the CAR, the prediction is correct.
Out of the 43 events, the number of correct prediction results compared to the actual results is 35. The precision is 81.4%. In other words, our model outperforms the SIM.
4.3. Applicability of the Model
The precision of the examination suggests that our model possesses generality and can effectively reflect the evolutionary trends of a certain type of public opinion in real-world scenarios. Specifically, if products or services surpass or fall short of consumer expectations, this can cause the spread of good or bad WOM, influencing stock price fluctuations. In essence, the propagation of WOM can reflect the quality of products or services and can be used to predict fluctuations in stock prices.
Additionally, the model and its associated findings also have significant managerial implications for both companies and investors.
For companies, it is often difficult to accurately measure the quality of products or services when developing them because the quality of products or services is not solely contingent on technological innovation but is also strongly associated with consumers’ expectations. WOM provides rapid information about market feedback, enabling companies to quickly analyze and adapt their product or service strategies in response to the market demands. For investors, WOM, as an objective reflection of the market conditions, helps them to make more rational investment decisions.

