Article

How Can a Community Pursue Equitable Health and Well-Being after a Severe Shock? Ideas from an Exploratory Simulation Model

1
ReThink Health and Rippel Foundation, Morristown, NJ 07960, USA
2
MIT Sloan School of Management, Cambridge, MA 02142, USA
3
Homer Consulting, Barrytown, NY 12507, USA
4
Pontifex Consulting, Atlanta, GA 30341, USA
5
Darden School of Business, University of Virginia, Charlottesville, VA 22903, USA
*
Author to whom correspondence should be addressed.
Systems 2022, 10(5), 158; https://doi.org/10.3390/systems10050158
Submission received: 5 August 2022 / Revised: 13 September 2022 / Accepted: 14 September 2022 / Published: 19 September 2022
(This article belongs to the Special Issue System Dynamics Models for Public Health and Health Care Policy)

Abstract

:
Local communities sometimes face severe shocks, such as the COVID-19 pandemic or economic recession, which inflict widespread harm, intensify injustice and test the ties that bind people together. A recent “Springboard” theory proposes a way to spring forward toward an equitable, thriving future by altering priorities among four structural drivers of population well-being: the extent of vital conditions, equity, urgent services capacity, and belonging and civic muscle. To explore the strategic implications of the Springboard theory, we developed the Thriving Together Model, a system dynamics simulation model that lets users play out alternative investment priorities and track changes over a decade as they try to maximize the number of people thriving and minimize suffering. The prototype model is exploratory, subject to further refinement and empirical support, but it has already sparked creative conversations among hundreds of changemakers who have interacted with it through an interactive theater. This paper presents the model’s structure, illustrative results, and tentative insights. The Thriving Together Model extends Ostrom’s Nobel Prize-winning work on shared stewardship by offering a general explanation about how stewards of a divided community can heal through a traumatic shock and spring forward toward a future with greater well-being and justice.

1. Introduction

All communities must contend with persistent gaps in health and well-being as well as sudden crises that may make things even worse and test a community’s resilience. Shocks (such as economic recessions, fires, floods, heat waves, mass violence, pandemics, etc.) typically unfold quickly, intensify pre-existing injustice, and lead to greater morbidity and mortality. When faced with such a shock, how can community changemakers establish conditions for everyone to heal and enhance life satisfaction, without leaving anyone behind?
A large body of evidence connects the health and well-being of individuals to features in the communities they inhabit [1,2]. Two sets of community-level contributors are especially crucial [3]: (1) adequacy of urgent services, which anyone may need temporarily in a crisis (e.g., acute care for injury or physical/mental illness; addiction treatment; crime response; environmental clean-up; homeless services; unemployment and food assistance); and (2) the presence of vital conditions, which everyone needs consistently to reach their full potential. Seven vital conditions are widely recognized: a thriving natural world; basic needs for health and safety; humane housing; meaningful work and wealth; lifelong learning; reliable transportation; and a sense of belonging and civic muscle (which is both a vital condition as well as practical capacity necessary for equitable progress in every other area) [4].
When a shock occurs, it tests community resilience and usually hits the most disadvantaged members hardest, widening pre-existing inequities. Much is known about the details of disaster recovery [5,6], but few studies explore what it takes to spring forward with greater levels of justice and equitable well-being.
At the start of the COVID-19 pandemic, more than 100 contributors came together to develop a general theory of how a shock that inflicts widespread loss might be converted into equitable renewal. The result was “Thriving Together: A Springboard for Equitable Recovery and Resilience in Communities Across America” [7]. The Springboard theory emphasizes four key elements for thriving together through periods of intense adversity:
  • Affirm racial justice and full inclusion for all people;
  • Strengthen belonging and civic muscle by working across differences, which, in turn, unlocks new assets for concerted action;
  • Expand all vital conditions with local stewards in the lead;
  • Renew civic life; economic life; and social, emotional, and spiritual life.
In conjunction with the Springboard, our system dynamics modeling team at ReThink Health (an initiative of the nonprofit Rippel Foundation) developed a model-based simulation to help changemakers understand the strategic challenges they would inevitably face when trying to spring forward toward an equitable, thriving future. The resulting Thriving Together Model (TTM), though still exploratory, enables community stewards to play out the dynamics of renewal over a 10-year time horizon, while they experiment with various ways to balance investment priorities among vital conditions, equity, belonging and civic muscle, and the adequacy of urgent services. This paper describes the structure, empirical foundation, illustrative results, and strategic insights from the prototype Thriving Together Model, as well as how it might be further refined.

2. Materials and Methods

2.1. Extending an Earlier Line of Research

The current TTM continues our inquiry into the dynamics of population well-being, which initially explored how to set investment priorities in communities that are contending with multiple interrelated or “tangled” threats [8]. That study compared the relative value of investing in one or more vital conditions. For that analysis, each of the seven vital conditions (other than reliable transportation) was operationalized using metrics available from the US County Health Rankings [9].
The TTM is broader than the earlier tangled threats analysis. It portrays a decade-long strategic challenge to equitably renew well-being after a severe shock using four interconnected investment priorities. However, it is also admittedly still exploratory, not yet as well grounded in data and community experiences as it could be. In the Discussion, we describe directions for further development to assure that this tool becomes more accurate and useful. Nonetheless, the current TTM has provoked strong interest from several hundred changemakers who have experienced it, making its preliminary findings worth documenting.

2.2. Representing Well-Being and Its Drivers

The TTM takes a broad view of population outcomes, looking not only at conventional measures of health status but more generally at population well-being using the Cantril Ladder categories of thriving, struggling, and suffering [10]. These self-reported life evaluation metrics are measured regularly in the US and around the world by Gallup.
Users of the TTM must find a way to allocate community assets over a period of 10 years so that more people are thriving and fewer are struggling and suffering. This involves generating greater equity, more secure vital conditions, adequate urgent services, and a stronger sense of belonging and civic muscle. Time starts at Year 0; shocks occur in Year 1; and the overall path toward renewal is tracked from Year 2 to Year 12.

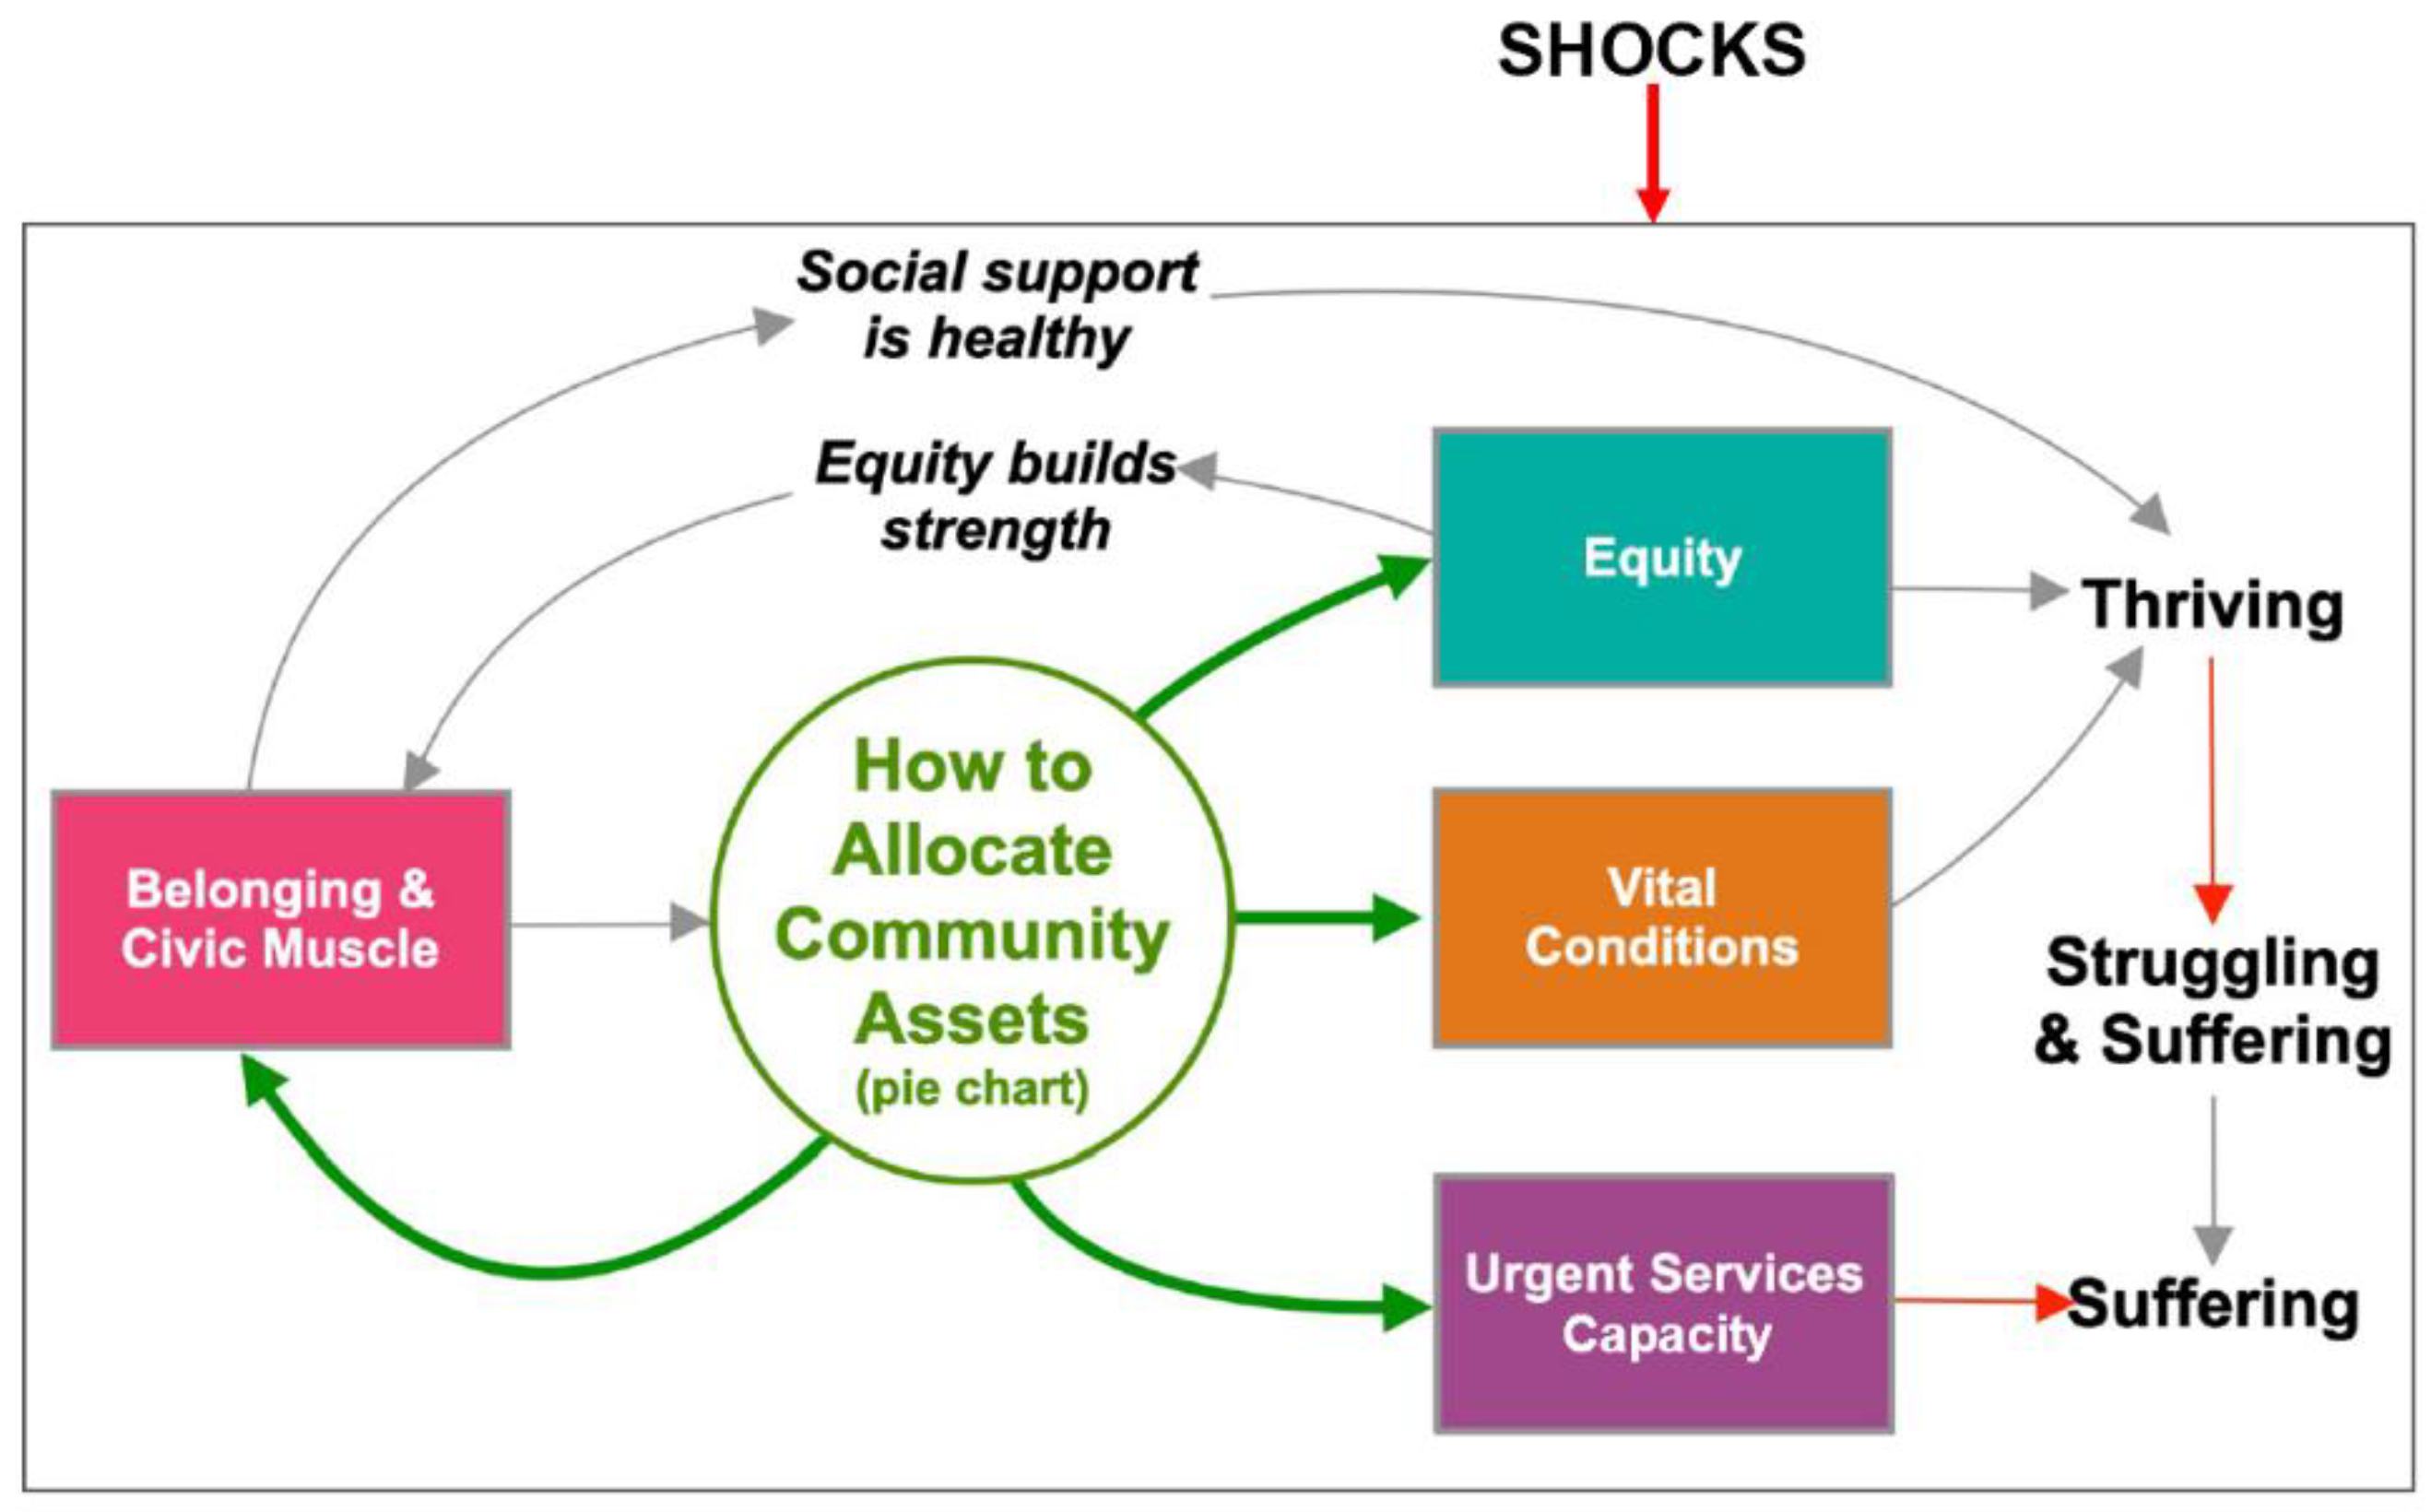
2.3. Model Structure

Figure 1 presents an overview of the causal logic of the TTM (see Supplementary File S1 for a complete list of equations).
On the right are sub-groups of people thriving, struggling, and suffering. There are three ways to increase the thriving percent: (a) expand vital conditions, (b) increase equity; and (c) strengthen social support (via higher levels of belonging and civic muscle). Those who are not thriving are struggling or suffering. Thus, one way to reduce suffering is to increase thriving. The other way is to increase urgent services capacity.
Vital conditions, equity, and belonging and civic muscle are all represented in the model as stock variables (rectangular boxes in Figure 1) measured as 0–1 indices. Vital conditions here refers to all of the vital conditions mentioned previously other than belonging and civic muscle, which is represented separately because of its distinct dynamic effects. The vital conditions index is initialized at Year 0 in the simulation as a weighted average of multiple indicators of household income, housing, education, physical activity, non-smoking, and health insurance across all US counties.
Belonging and civic muscle here describes the extent to which people feel they belong and have the power—as well as the practical capacity—to shape their common world. It is a shared community asset used to build all others. Additionally, as indicated in Figure 1, greater belonging and civic muscle not only increases community assets, but also drives peoples’ sense of social support, which, in turn, helps boost the percent of people thriving. In lieu of an established multivariate measure, the belonging and civic muscle index is initialized based on social associations per capita across all US counties (again from the US County Health Rankings (CHR) [9]).
Equity here refers to whether there is just and fair inclusion for everyone as opposed to systemic exclusion rooted in institutional policies, practices, programs, and priorities. In lieu of an established multivariate measure, the equity index is based on the Gini Index for the US, which measures how fairly income is distributed [11]. As indicated in Figure 1, greater equity not only improves the percent of people thriving, but also tends to boost belonging and civic muscle through wider inclusion of people in civic life.
Urgent services capacity is expressed as a percent of the population. If the capacity to deliver urgent services is less than the current urgent need percent (a portion, e.g., 20%, of non-thriving people), then its adequacy will be something less than 100%, and people will suffer accordingly for lack of urgent services. For example, if the urgent need percent is 9% (20% of 45% non-thriving) and urgent services capacity is 5.4%, then its adequacy will be 60% (=5.4/9%), and the suffering percent will be 3.6% (=9–5.4%).

2.4. Gathering Assets

It can be difficult for a community to spring forward from a severe shock using only its usual resources and funding. However, shocks often unleash the potential to acquire special resources and dedicated funding for some number of years after the shock. The extent to which these assets for renewal can be gathered depends on the community’s state of belonging and civic muscle: with greater belonging and civic muscle, community stewards can gather even more assets (e.g., through fundraising, grants, and in-kind support). Seeking assets beyond a certain point (or threshold) may impose obligations that begin to erode civic muscle. If that erosion is strong enough, it can counteract the benefit of the additional assets (creating a dysfunctional trap of depending on assets that also undermine their own capabilities). For the simulation analysis here, none of the scenarios exceed that threshold. Instead, this study explores what can happen with assets that can be gathered and managed relatively easily, without encumbering the community with onerous outside obligations or dependencies.

2.5. Allocating Assets

In the model, there are four distinct ways to allocate community assets. They can be used in various combinations to expand any of the four drivers of well-being (depicted as boxes in Figure 1): (1) vital conditions; (2) equity; (3) urgent services capacity; and/or (4) belonging and civic muscle. Any allocation scheme may be depicted as a pie chart dividing 100% of community assets among the four drivers. At any moment, available assets are finite, therefore a decision to prioritize one area of work necessarily means paying somewhat less attention to the others. Investments in belonging and civic muscle, however, can enable the community to gather even more assets over time, as shown in Figure 1. The overall resilience of a community after a shock depends on how effectively local stewards negotiate these four investment priorities over time.
How community assets are allocated among the four drivers of well-being is determined by the model’s initial assumptions at Year 0 and then, starting in Year 2, by the model user. The initial allocations in the model may be suboptimal and leave room for improvement. Model users can adjust this allocation every two years starting at Year 2 (immediately after the shock) and for the last time at Year 10 before the simulation ends at Year 12.
Each of the four stock variables is subject to gradual erosion if they are not continuously maintained, as well as the possibility of a sudden, unexpected, adverse shock. The shocks may reflect rapid external occurrences, such as a pandemic, or internal ones, such as the loss of organizational leaders.

2.6. Parametric Assumptions

The model is configured with several parametric assumptions we have set based on data for the US overall (see Supplementary File S2 for a complete list with sources). Some of the most prominent parameters include initial values for the population well-being and its four drivers. Those include the initial thriving percent (55%; Gallup 2019), suffering percent (3.5%; Gallup 2019), vital conditions index (0.80; CHR 2006–2012), equity index (0.52; Gini 2011–2017), belonging and civic muscle index (0.50; CHR social associations per capita 2014–2017), and social support index (0.80; BRFSS “have social/emotional support” 2006–2012).
Other parameter values were estimated more impressionistically with the help of ReThink Health collaborators across the country who evaluated the model as it was being developed. These include estimates of the initial adequacy of urgent services; the strengths of causal links in Figure 1; the natural erosion rates of the four stock variables in Figure 1; and the initial allocation of community assets to those same four stocks.
To enhance clarity when interpreting simulated results, all variables in the model start in a dynamic equilibrium, unchanging over time absent any shock. This means that initially (prior to any shock) the normal erosion outflow for each of the four stock variables is exactly offset by a corresponding inflow which replenishes the stock.
Together, the model’s parameters determine not only how well the community is doing initially, but also how close to optimal its starting priorities are, in terms of its ability to spring forward after a shock. A community that begins with suboptimal starting priorities will have to shift its priorities more dramatically to spring forward. Because of the model’s complexity and nonlinearity, the optimal set of investment priorities is not directly calculable but can only be determined by testing the simulator under different conditions.
Any of the four allocation areas may be shocked; these shocks occur during Year 1 and take one year to have their full effect. For all tests described below, we used the same set of relative shock values: vital conditions (−12.5%), equity (−11.5%), urgent services capacity (−5.8%), belonging and civic muscle (0%). We configured these parameters to approximate what occurred in the US during March to April 2020, as COVID-19 swept through the country, a time when Gallup reported that the percent of Thriving adults in the US dropped sharply [12]. The decision not to alter the level of belonging and civic muscle was informed by observations that people and organizations were simultaneously separating and coming together.

2.7. Summary Measures

The model calculates several summary measures of cumulative performance. First is the change in average life expectancy, measured relative to Year 0. In line with national data, we assume that struggling (relative to thriving) reduces life expectancy by three years, while suffering reduces life expectancy by 20 years [13].
We also calculate a “renewal score” determined by cumulative changes in thriving and suffering over a decade relative to where those well-being metrics were at Year 2, immediately after the shock. If either metric moves in the wrong direction, a double penalty is applied. This renewal score starts at zero, with a minimum value of −100 and a maximum value of +100.

2.8. Illustrative Model Tests

We have performed hundreds of model tests, varying uncertain parameters as well as allocation decisions. Here, we present six tests that illustrate noteworthy dynamics of renewal. Each scenario is based on a particular allocation of community assets to the model’s four drivers of well-being (i.e., vital conditions, equity, urgent services capacity, belonging and civic muscle).
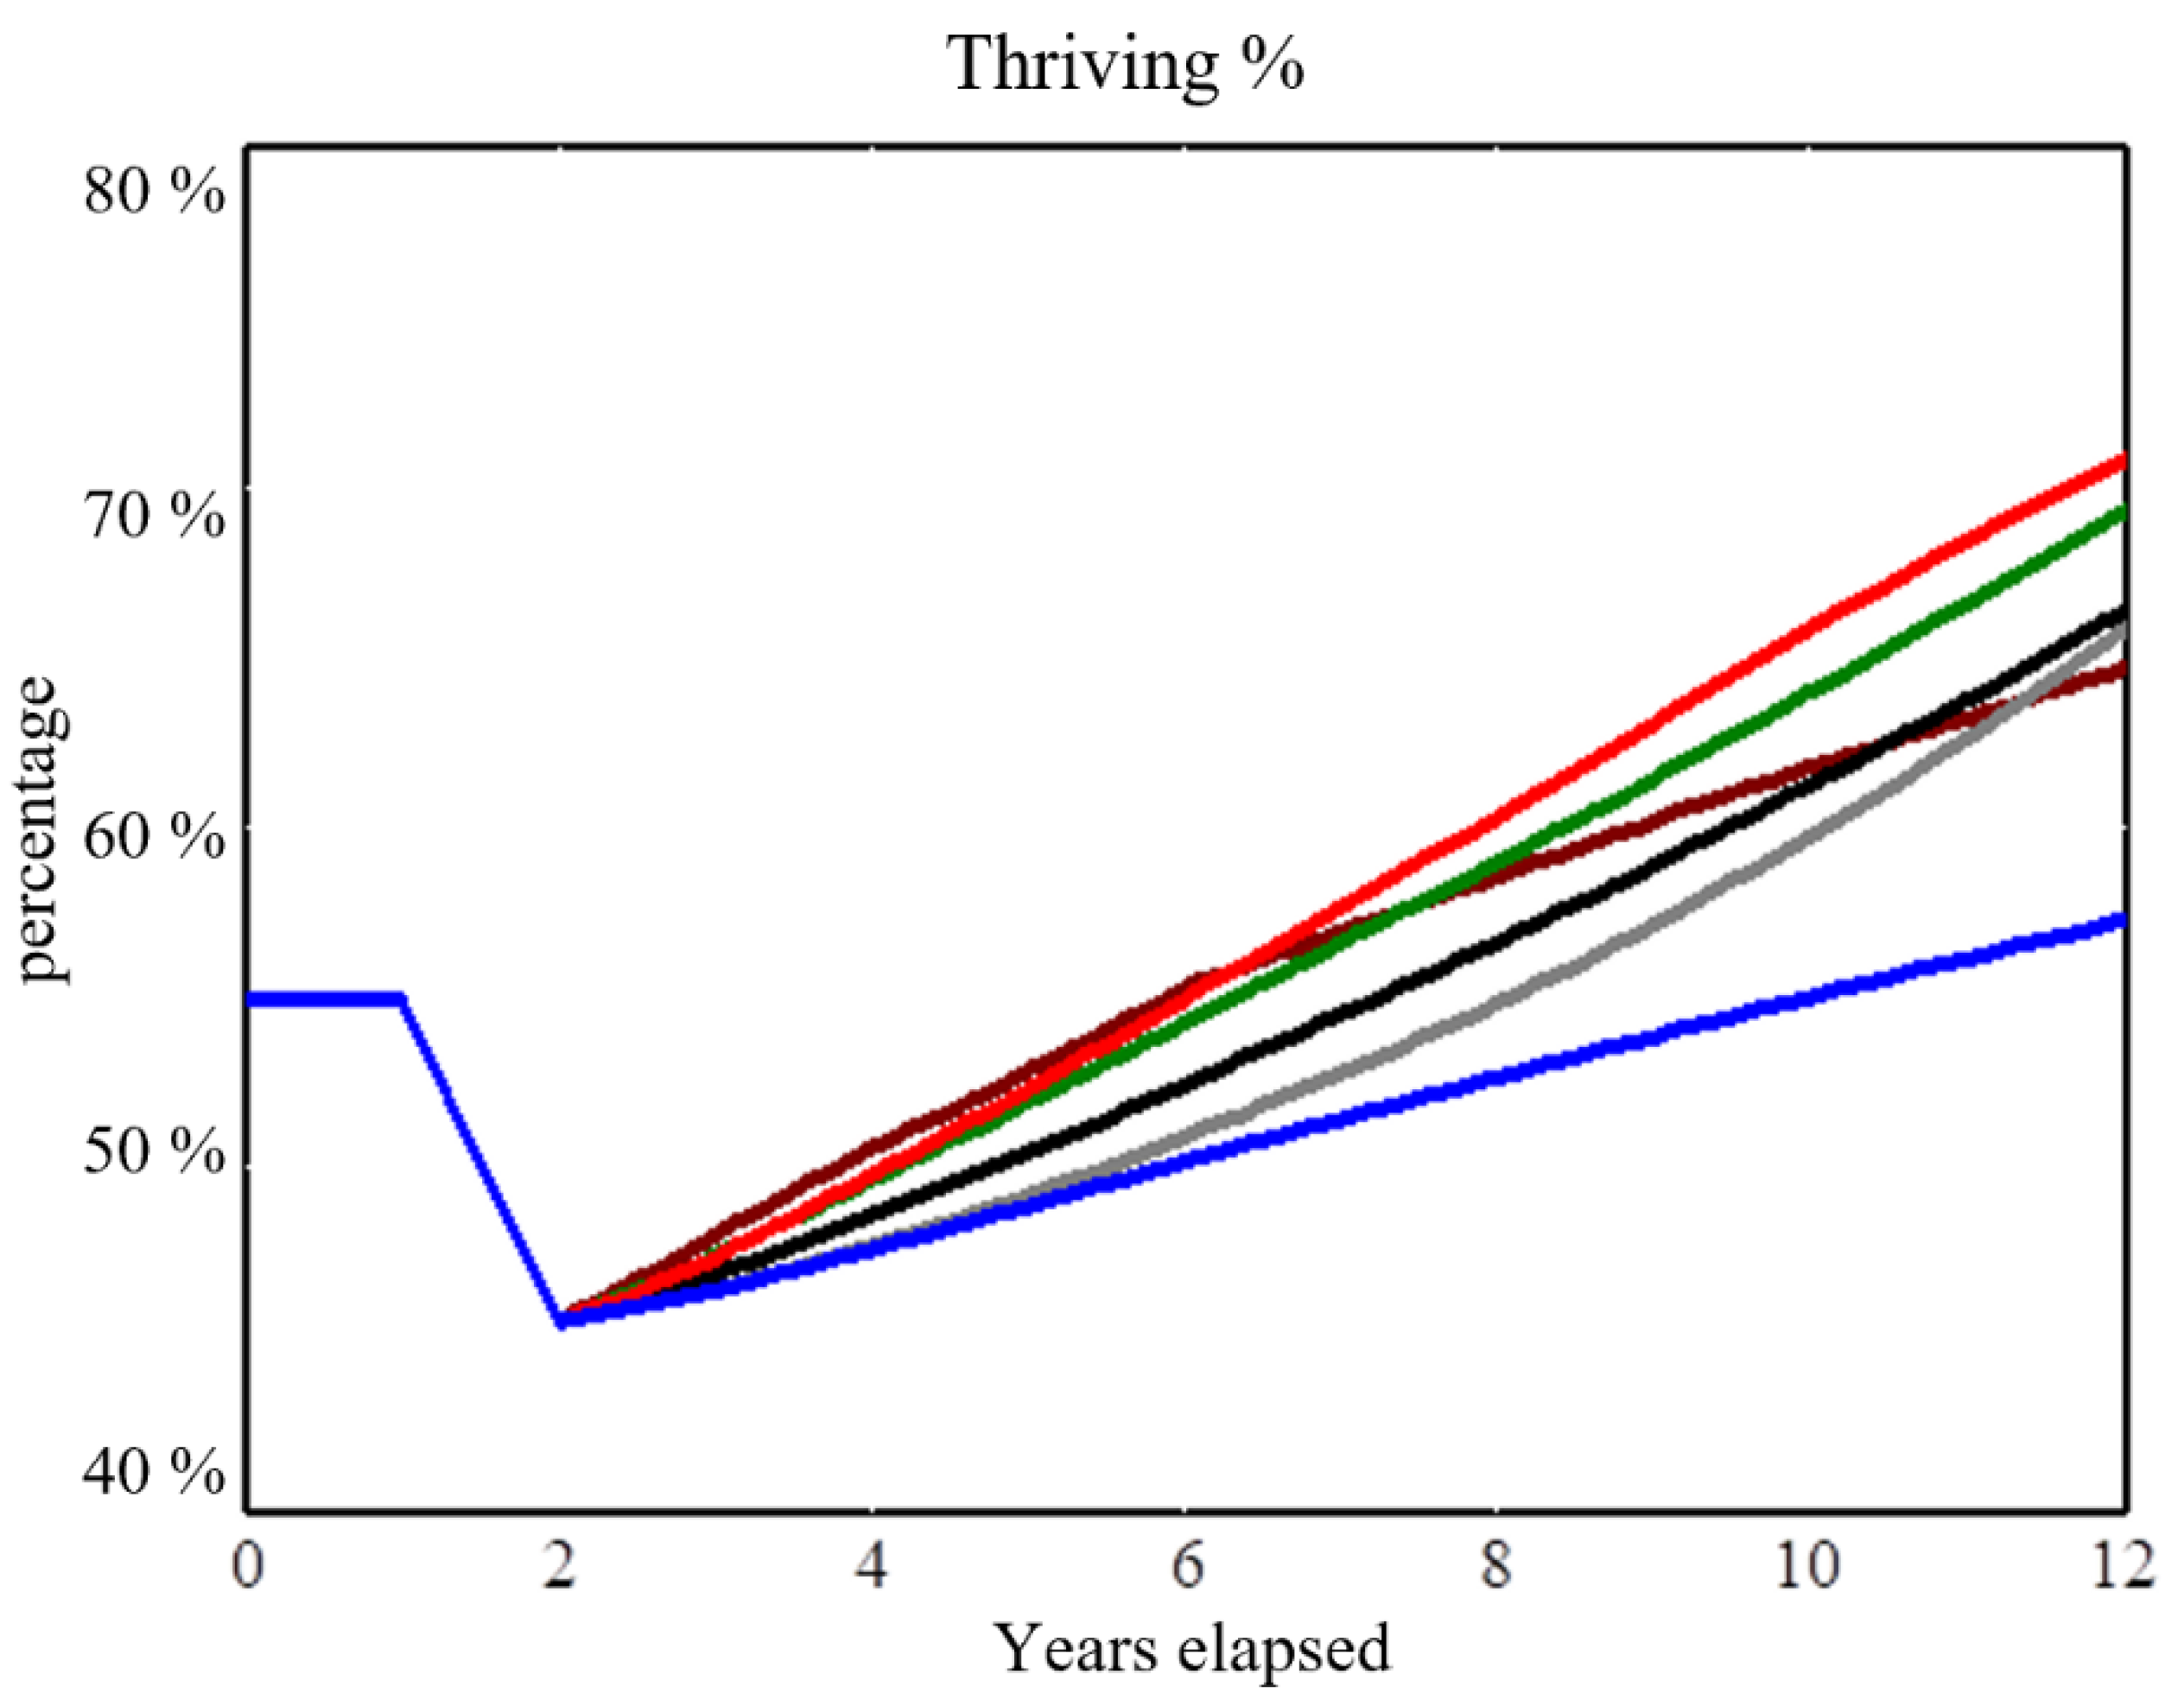
  • Status Quo: continue the historical, pre-shock allocation, which gives greatest priority to urgent services capacity (40%) and vital conditions (30%), and far less to equity (15%) and belonging and civic muscle (15%).
  • Vital Conditions 40%: switch at Year 2 to a new stable allocation emphasizing vital conditions (40%), with the other three at 20%.
  • Equity 40%: switch at Year 2 to a new stable allocation emphasizing equity (40%), with the other three at 20%.
  • Belonging and Civic Muscle 40%: switch at Year 2 to a new stable allocation emphasizing belonging and civic muscle (40%), with the other three at 20%.
  • Even Balance 25%: switch at Year 2 to a new stable allocation with all four at 25%.
  • Best Pivot: switch at Year 2 to emphasize equity first (65%) and belonging and civic muscle (25%), with the other two at 5% each; then, from Years 4–6, pivot back toward urgent services and vital conditions, for an eventual stable allocation at Year 6 of urgent services (45%), vital conditions (35%), belonging and civic muscle (15%), and equity (5%).

2.9. Tests in a More Disorganized Community

In addition to tests using community settings based on US national averages, we also conducted the same battery of simulated scenarios using settings that portray a more disorganized community. Relative to the baseline assumptions above, we used an alternative setup to explore the potential for renewal in a community that begins with twice as many people suffering, as well as half as much equity, social support, and belonging and civic muscle. See Supplementary File S3 for parameter assumptions and results of those alternative tests.

3. Results

The six illustrative renewal strategies result in different outcome trajectories for thriving and suffering and consequently average life expectancy. See Figure 2, Figure 3 and Figure 4.
Vital conditions and equity are the strongest drivers of thriving (Figure 2). Throughout Vital Conditions 40% (red line) and Equity 40% (green line), the sum of the asset allocations to vital conditions and equity is a strong 60%; accordingly, thriving rises the farthest in these two runs. Thriving also rises strongly at first in Best Pivot (brown line), but slows after Year 6, as the sum of the allocations to vital conditions and equity declines from 70% in Year 2, to 60% in Year 4, and finally to 40% in Years 6 and beyond. Both Even Balance 25% (black line) and Belonging and Civic Muscle 40% (grey line) initially have modest effects, but by Year 12, both produce slightly better results for Thriving than Best Pivot.
When attempting to reduce the suffering percent (Figure 3), the two most influential forces are the size of the thriving percent and urgent services capacity. Because Status Quo devotes a large 40% allocation to urgent services capacity, suffering declines consistently throughout. In all other runs, suffering rises at first (even with the increases in thriving seen in Figure 2) because there is less allocation to urgent services capacity. However, the trajectory is very different in Best Pivot, where suffering falls rapidly after Year 6—declining below Status Quo by Year 9. This turnaround occurs for two reasons. First, the allocation to urgent services capacity in Best Pivot starts at only 5% in Year 2 but rises to 45% in Years 6 and beyond. Second, thriving is much greater in Best Pivot than it is in Status Quo.
The trajectories for the change in life expectancy (Figure 4) (measured relative to Year 0) all show rebound after the shock, but with significant differences in magnitude and timing.
Status Quo looks best for the first several years. With its heavy emphasis on urgent services capacity, it is the only strategy that avoids a further rise in suffering after the shock. However, Status Quo is also the worst strategy for increasing the thriving percent; as a result, it is the worst of the six investment scenarios on life expectancy by Year 12. Runs with a fixed emphasis on drivers other than urgent services capacity (Vital Conditions 40%, Equity 40%, Belonging and Civic Muscle 40%, Even Balance 25%) all do better on thriving but not as well on suffering, ultimately producing modest net gains in life expectancy.
The clear winner on this metric, from Year 7 onward, is Best Pivot. This strategy allocates 65% of assets to equity in Year 2, and then pivots decisively to urgent services capacity and vital conditions. The early emphasis on equity works because it activates a virtuous reinforcing feedback loop (designated in Figure 1 as “equity builds strength”): equity helps build belonging and civic muscle, which builds more community assets, which, in turn, help expand equity even more—as well as all other drivers of well-being.
Although Best Pivot does worse on life expectancy than most of the other strategies immediately after the shock, it establishes equity as an immediate priority and builds a reservoir of belonging and civic muscle, both of which continue to yield benefits for years even after attention pivots back to expanding urgent services capacity and vital conditions–both of which become stronger and more equitable than under the other strategies. By concentrating first on equity and belonging and civic muscle, Best Pivot prepares the ground for building adequate urgent services but without sacrificing vital conditions and thriving (as occurs in Status Quo and Belonging and Civic Muscle 40%).
Furthermore, tests using alternative initial conditions (described in Supplementary File S3) show that (1) a more disorganized community would have a harder time recovering; but (2) even a community with twice as many suffering people and half the amount of equity, social support, and belonging and civic muscle can still recover fully and reach greater levels of equitable well-being within a decade if they commit to the Best Pivot strategy.

4. Discussion

4.1. Tentative Strategic Implications

The results above illustrate dynamics that we have seen consistently from the Thriving Together Model. Although the model is still exploratory, we hypothesize that the basic logic of the Springboard (e.g., the idea that belonging and civic muscle is a critical, yet constrained and contested resource) may lead to the following conclusions:
  • The best resilience strategy may require decisive shifts from historical priorities.
  • The best strategy requires investing early in both equity and belonging and civic muscle so that one may build on those assets later: a kind of self-reinforcing, asset-building maneuver. The value of those early investments is not only because they support thriving by helping people connect and heal through collective trauma. It is also because they support the infrastructure needed for shared stewardship. In a diverse and divided community, it takes dedicated resources to establish greater interdependence and enable stewards to work across differences, devise shared plans, gather and manage assets, and adapt to challenges over time.
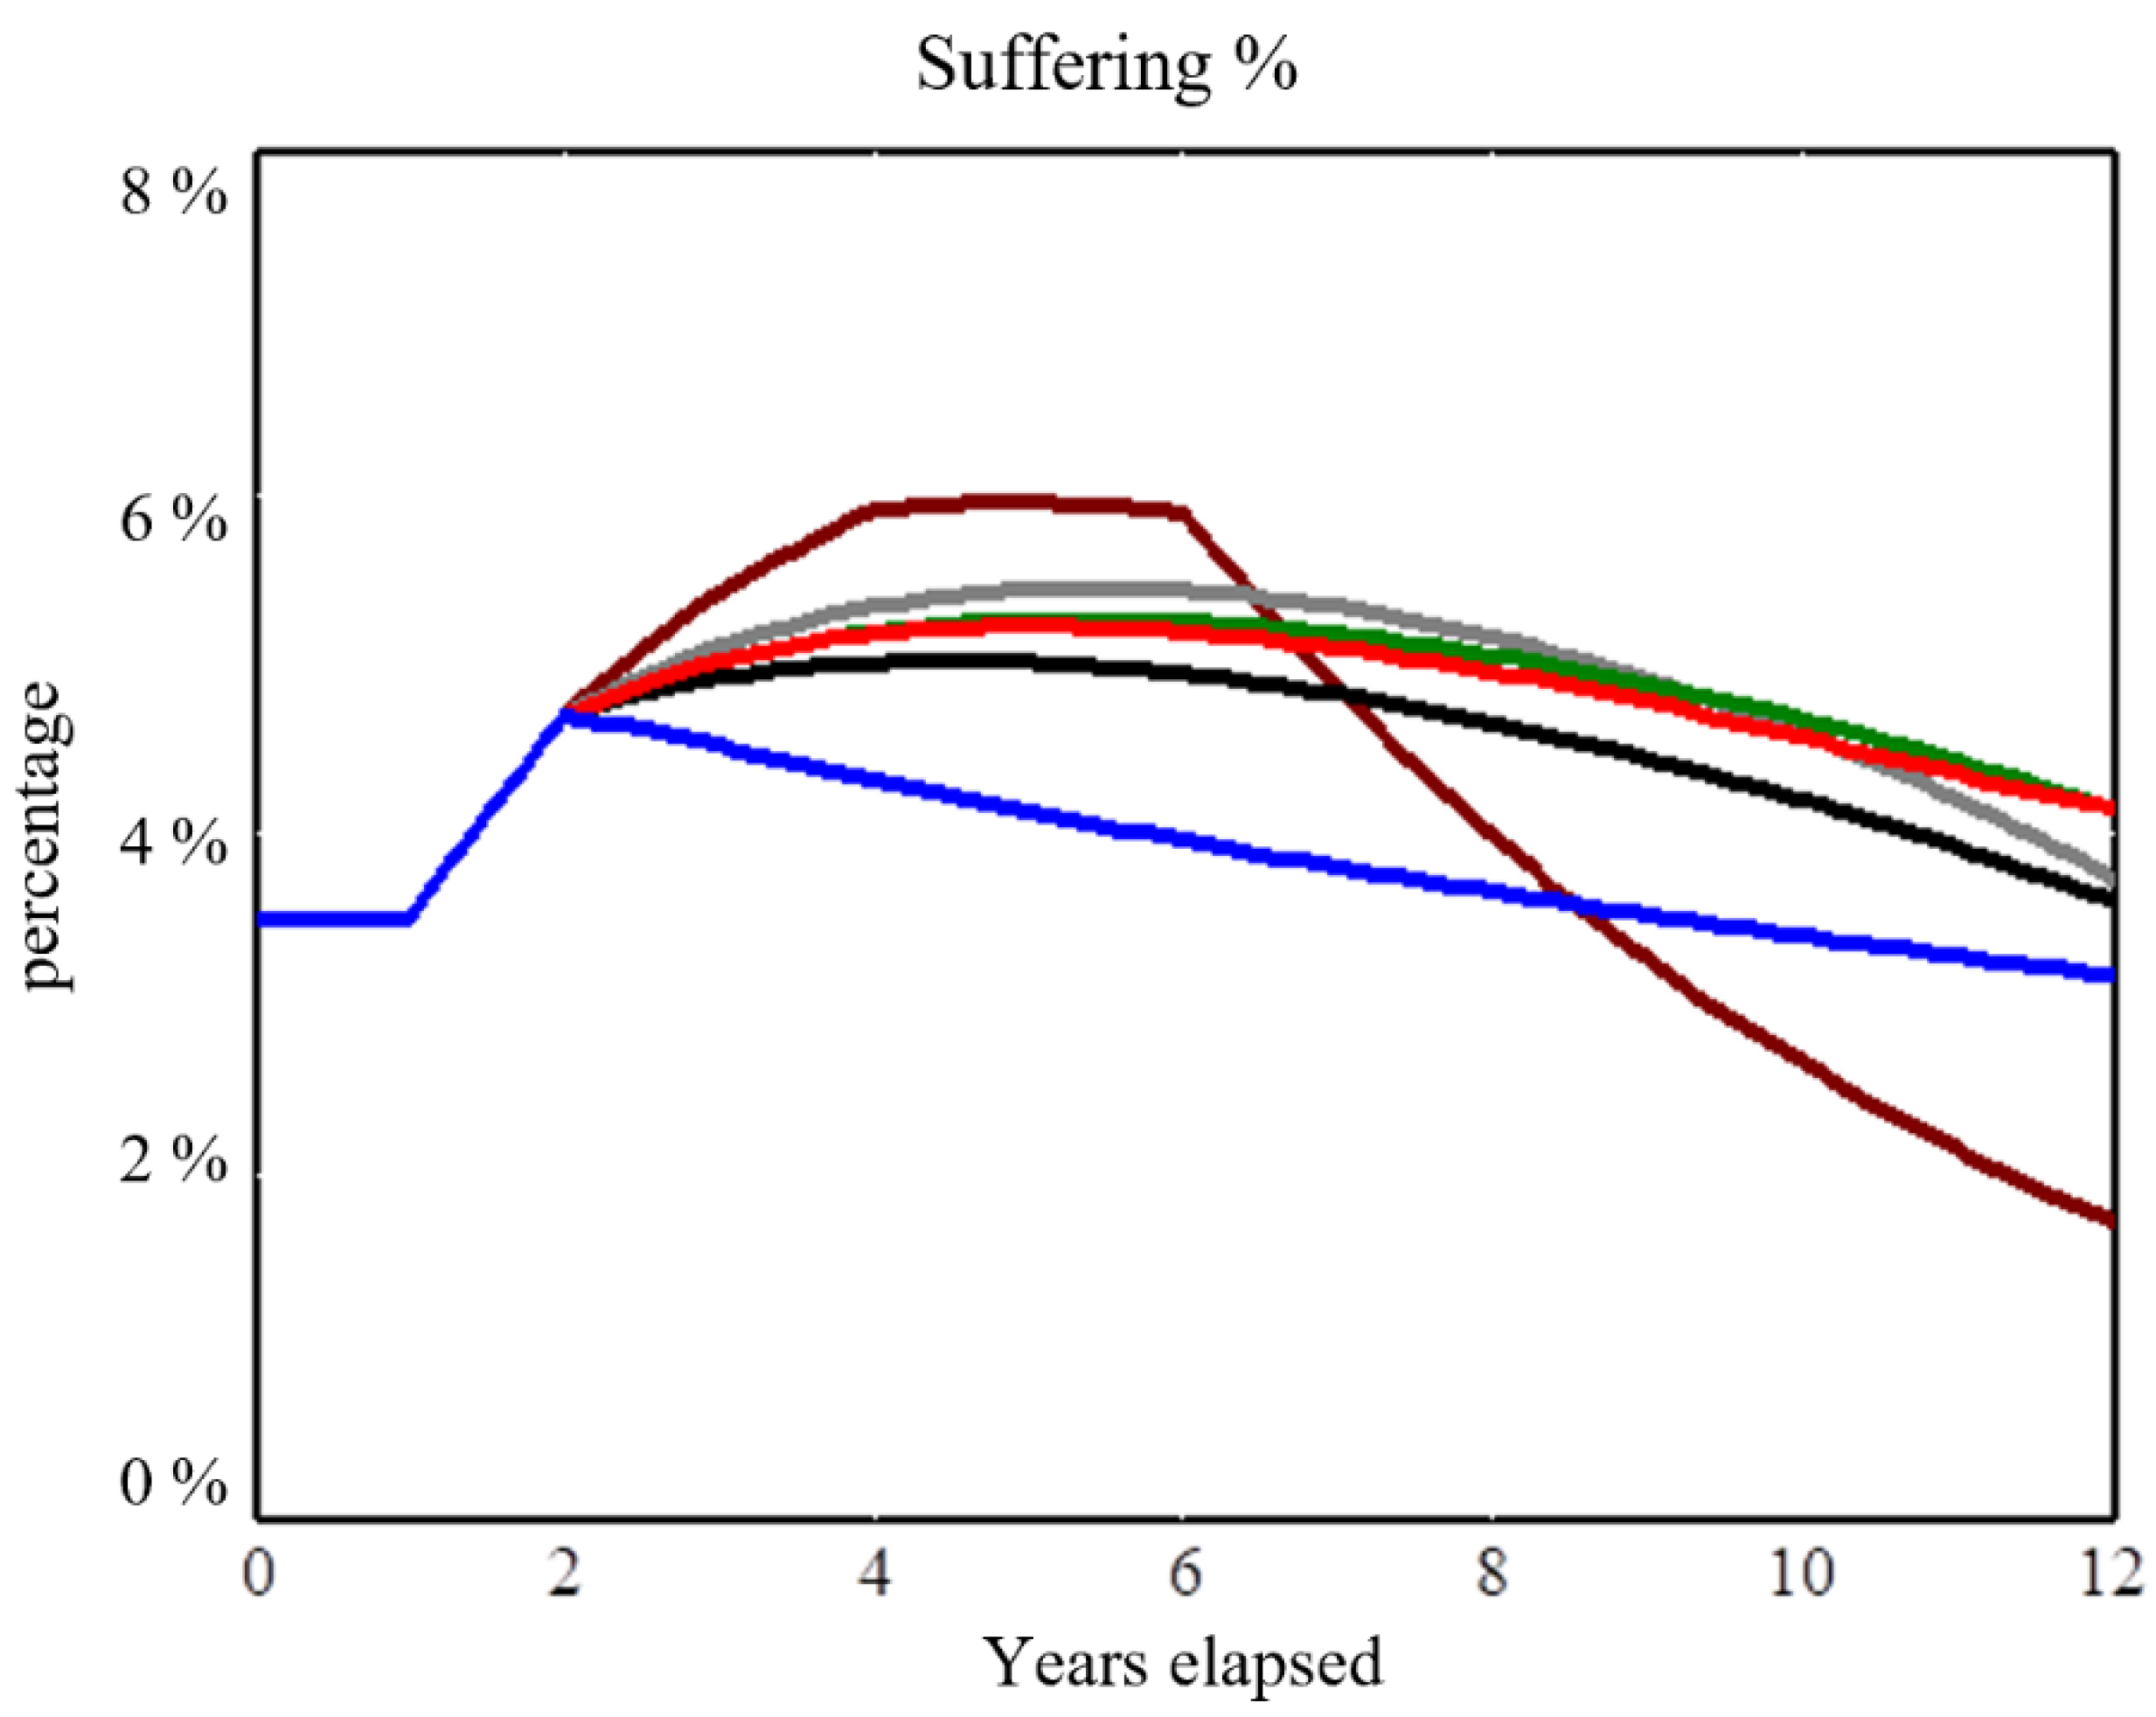
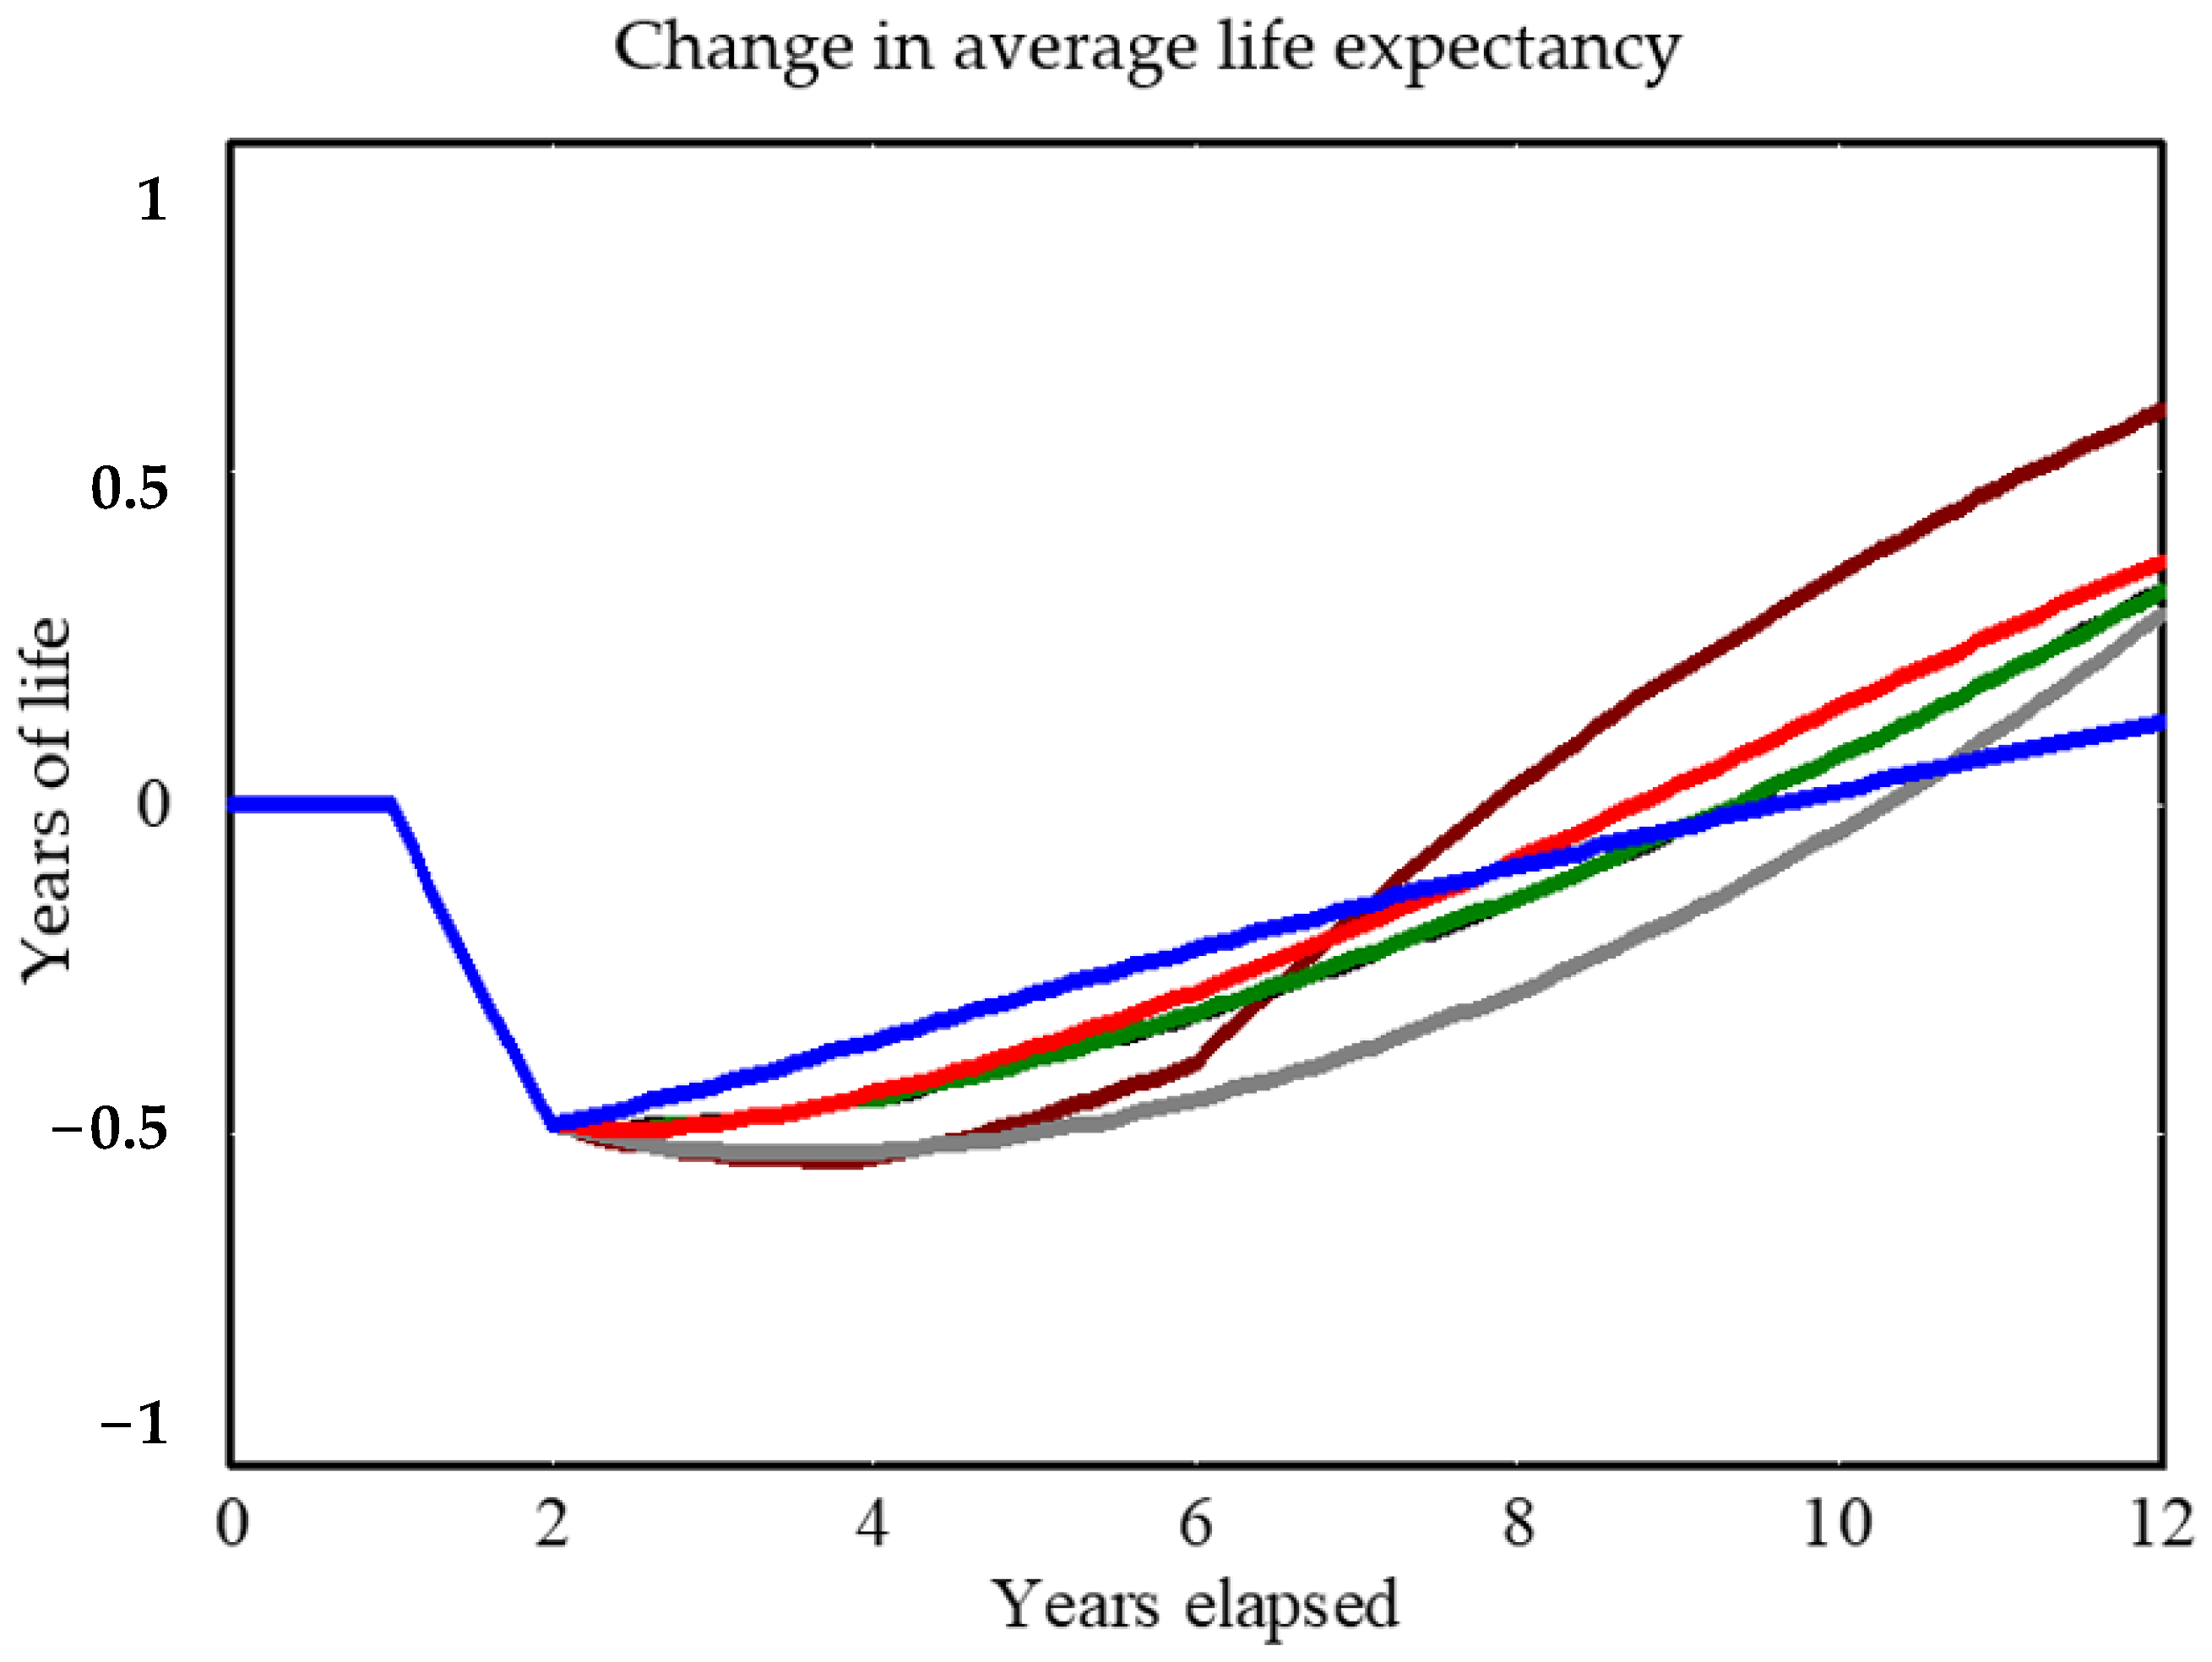
  • Efforts to transition toward an equitable, thriving future may involve some inevitable sacrifice of greater suffering in the shorter term; a “worse before better” dynamic. This dynamic has been described previously with respect to downstream and upstream health investments [14], as well as business process improvements and the concept of the “capability trap” [15].
  • A risk-averse approach (changing priorities little from the status quo and leaving them fixed over time) may avoid the worse-before-better pattern, but the lack of a decisive pivot will result in a mediocre trajectory over time. Safe, static allocation avoids sacrifice, but it does not build the reservoirs of equity or belonging and civic muscle needed to both boost thriving and drive down suffering.
  • A community that can pivot strongly toward building equity and belonging and civic muscle after a severe shock may be best positioned to spring forward and maximize well-being over time. Although that maneuver is superior in principle (under the conditions of this analysis), it may be perceived as infeasible in practice–especially if it entails somewhat greater suffering immediately after a shock. Actual feasibility, however, depends on how effectively community stewards make the case for equitable system change [16]. For instance, savvy casemakers could portray long-overdue investments in equity and belonging and civic muscle as a decisive break from a status quo that for generations has caused far greater unjust suffering and would otherwise continue to leave the entire community weaker and more vulnerable.

4.2. Contributions

The Thriving Together Springboard [7] lays out clear goals and principles but does not provide a detailed strategy for allocating assets over time. To help community stewards play out investment scenarios, we developed the Thriving Together Model as an exploratory tool that puts the Springboard concepts into motion. As far as we know, this is the first formal simulation model to represent dynamic connections among equity, belonging and civic muscle, vital conditions, and urgent services capacity as drivers of population levels of thriving, struggling, and suffering over a multiyear time horizon. This project also builds on Elinor Ostrom’s Nobel Prize-winning work on shared stewardship [17] by developing a general explanation about how a divided community can heal through a traumatic shock and spring forward toward a future with greater well-being and justice. The practical contributions of the TTM include:
  • A focus on summary measures of population-level health and well-being, as opposed to focusing only on a particular subset of health or social outcomes. The model’s main outcome measures (i.e., the Cantril categories of people thriving, struggling, and suffering) are routinely tracked across the US and around the world, allowing standardized comparisons over time and geography.
  • Representation of equity as a structural driver affecting the entire system, as opposed to only accounting for differences among certain subpopulations (e.g., by race, gender, or income).
  • Broad analytic boundary, encompassing concepts of well-being, vital conditions, urgent services, equity, and belonging and civic muscle and portraying their dynamic interactions.
  • Ability to explore alternative paths toward equitable renewal over a decade. The model does not tell leaders what to do, but rather strengthens their ability to interpret local data and negotiate local priorities, spot opportunities, weigh tradeoffs, and think creatively about navigating a multiyear path from crisis to renewal.
  • Ability to explain the dynamics of shock and renewal by tracking a suite of interacting variables and outcome metrics over time.
ReThink Health also used the TTM to create the Thriving Together Theater [18]. Guided by input from several hundred contributors, this interactive experience combines dynamic simulation, powered by the TTM, with dramatic role-play to explore how a group of community stewards can spring forward through an unjust shock. It is an immersive experience in shared stewardship that asks, “How will you and your fellow stewards exercise civic muscle while looking for an equitable path from crisis to renewal?” As in real life, the story depends on who shows up. The experience helps stewards rehearse high-stakes negotiations and play out potential consequences of their own investment priorities. Participants learn for themselves how to weigh tradeoffs and navigate the dynamics of equitable well-being in a community experiencing unjust adversity. The Thriving Together Theater has provoked creative conversations with hundreds of changemakers across the country, including community-led multisector partnerships, government agencies, and graduate schools. It is a reliable way to surface participants’ mental models about equitable long-term resilience, while also emphasizing the importance of adaptive, shared stewardship.

4.3. Limitations and Extensions

The TTM incorporates multiple sources of available evidence, but it requires further development and validation in line with system dynamics modeling best practice [19,20] to generate more definitive insights. This would likely entail working closely with colleagues in several communities that have experienced shock and attempts at renewal. Data collection and group model building with community leaders would inform a new iteration of the TTM that is more historically grounded and usefully detailed. This enhanced model would likely have more precise and operational measures for concepts such as equity as well as belonging and civic muscle. Ideally, it would also have a straightforward data-driven method for calibration to represent characteristics of any given community as they explore their own path toward an equitable, thriving future.

Supplementary Materials

The following supporting information can be downloaded at: https://www.mdpi.com/article/10.3390/systems10050158/s1, Supplementary File S1: Equation List; Supplementary File S2: Parameter Assumptions; Supplementary File S3: Tests in a more disorganized community.

Author Contributions

Conceptualization and design, J.H., B.M., and C.S.; data acquisition and analysis, J.H.; data visualization, J.H., B.M., and C.S.; writing—original draft preparation, J.H. and B.M.; writing—review and editing, J.H., B.M., and C.S. All authors have read and agreed to the published version of the manuscript.

Funding

The Rippel Foundation supported this work through the ReThink Health initiative.

Data Availability Statement

All data are publicly available. Simulated scenarios can be explored with our free online interface at: http://tiny.cc/thriving-dynamics (accessed on 13 September 2022).

Acknowledgments

This study was inspired by 100+ fellow contributors to the Thriving Together Springboard. We are grateful for early guidance from colleagues at ReThink Health (Laura Landy, Anna Creegan, Ella Auchincloss), Community Initiatives Network (Monte Roulier, Elizabeth Hartig, Stacy Wegley); as well as the Well Being in the Nation (WIN) Network (Somava Saha and the WIN Measurement and Research Collaborative).

Conflicts of Interest

The author declares no conflict of interest.

References

  1. Botchwey, N.; Dannenberg, A.; Frumkin, H. Making Healthy Places: Designing and Building for Well-Being, Equity, and Sustainability, 2nd ed.; Island Press: Washington, DC, USA, 2022. [Google Scholar]
  2. Braveman, P.; Cubbin, C.; Egerter, S.; Pedregon, V. Neighborhoods and Health; Robert Wood Johnson Foundation: Princeton, NJ, USA, 2011; Available online: https://www.rwjf.org/en/library/research/2011/05/neighborhoods-and-health-.html (accessed on 5 August 2022).
  3. Milstein, B. Thriving Together through Shared Stewardship. ReThink Health. 2021. Available online: http://tiny.cc/SharedStewardshipVideo (accessed on 5 August 2022).
  4. Rethink Health. Vital Conditions for Well-Being and Justice. 2022. Available online: http://www.rethinkhealth/about/#1 (accessed on 5 August 2022).
  5. Institute of Medicine. Healthy, Resilient, and Sustainable Communities after Disasters: Strategies, Opportunities, and Planning for Recovery; National Academies Press: Washington, DC, USA, 2015; Available online: https://nap.nationalacademies.org/catalog/18996/healthy-resilient-and-sustainable-communities-after-disasters-strategies-opportunities-and (accessed on 5 August 2022).
  6. Walpole, E.H.; Loerzel, J.; Dillard, M. A Review of Community Resilience Frameworks and Assessment Tools: An Annotated Bibliography; National Institute for Standards and Technology: Washington, DC, USA, 2021. Available online: https://nvlpubs.nist.gov/nistpubs/TechnicalNotes/NIST.TN.2172.pdf (accessed on 5 August 2022).
  7. Milstein, B.; Roulier, M.; Hartig, E.; Kelleher, C.; Wegley, S. (Eds.) Thriving Together: A Springboard for Equitable Recovery and Resilience in Communities across America; Well Being Trust: Oakland, CA, USA, 2020; Available online: http://www.thriving.us (accessed on 5 August 2022).
  8. Milstein, B.; Homer, J. Which Priorities for Health and Well-Being Stand out after Accounting for Tangled Threats and Costs? Simulating Potential Intervention Portfolios in Large Urban Counties. Milbank Q. 2020, 98, 372–398. [Google Scholar] [CrossRef] [PubMed]
  9. University of Wisconsin Population Health Institute. County Health Rankings & Roadmaps; University of Wisconsin Population Health Institute: Madison, WI, USA, 2022; Available online: http://www.countyhealthrankings.org (accessed on 5 August 2022).
  10. Gallup. Understanding How Gallup Uses the Cantril Scale: Development of the “Thriving, Struggling, Suffering” Categories. 2020. Available online: https://news.gallup.com/poll/122453/understanding-gallup-uses-cantril-scale.aspx (accessed on 5 August 2022).
  11. World Bank. Gini Index for the United States. Available online: https://fred.stlouisfed.org/series/SIPOVGINIUSA (accessed on 5 August 2022).
  12. Witters, D.; Harter, J. In U.S., Life Ratings Plummet to 12-Year Low. Gallup. 2020. Available online: https://news.gallup.com/poll/308276/life-ratings-plummet-year-low.aspx (accessed on 5 August 2022).
  13. Arora, A.; Spatz, E.; Herrin, J.; Riley, C.; Roy, B.; Kell, K.; Coberley, C.; Rula, E.; Krumholz, H.M. Population Well-Being Measures Help Explain Geographic Disparities in Life Expectancy at the County Level. Health Aff. 2016, 35, 2075–2082. Available online: http://content.healthaffairs.org/content/35/11/2075.abstract (accessed on 5 August 2022). [CrossRef] [PubMed]
  14. Homer, J.B.; Hirsch, G.B. System Dynamics Modeling for Public Health: Background and Opportunities. Am. J. Public Health 2006, 96, 452–458. [Google Scholar] [CrossRef] [PubMed]
  15. Repenning, N.P.; Sterman, J.D. Nobody Ever Gets Credit for Fixing Problems That Never Happened: Creating and Sustaining Process Improvement. Calif. Manag. Rev. 2001, 43, 64–88. [Google Scholar] [CrossRef]
  16. Manuel, T.; Milstein, B. To Catalyze System Change, Become a Better Casemaker. ReThink Health, 10 March 2020. Available online: https://rethinkhealth.org/blog/Resource/to-catalyze-system-change-become-a-better-casemaker/ (accessed on 5 September 2022).
  17. Ostrom, E. Beyond Markets and States: Polycentric Governance of Complex Economic Systems. Stockholm, Sweden: Nobel Prize Lecture, 2009. Available online: http://www.nobelprize.org/nobel_prizes/economic-sciences/laureates/2009/ostrom-lecture.html (accessed on 5 August 2022).
  18. Milstein, B.; Homer, J.; Soderquist, C.; Belsky, M. Playbill for the Thriving Together Theater. ReThink Health. Available online: http://tiny.cc/thriving-playbill (accessed on 5 August 2022).
  19. Sterman, J.D. Business Dynamics: Systems Thinking and Modeling for a Complex World; Irwin McGraw-Hill: Boston, MA, USA, 2000. [Google Scholar]
  20. Homer, J. Best Practices in System Dynamics Modeling, Revisited: A Practitioner’s View. Syst. Dyn. Rev. 2019, 35, 177–181. [Google Scholar] [CrossRef]
Figure 1. Structural logic of the Thriving Together Model (TTM).
Systems 10 00158 g001
Figure 2. Thriving percent under six allocation scenarios. Blue = Status Quo, Red = Vital Conditions 40%, Green = Equity 40%, Grey = Belonging and Civic Muscle 40%, Black = Even Balance 25%, Brown = Best Pivot.
Systems 10 00158 g002
Figure 3. Suffering percent under six allocation scenarios. Blue = Status Quo, Red = Vital Conditions 40%, Green = Equity 40%, Grey = Belonging and Civic Muscle 40%, Black = Even Balance 25%, Brown = Best Pivot.
Systems 10 00158 g003
Figure 4. Change in average life expectancy under six allocation scenarios. Blue = Status Quo, Red = Vital Conditions 40%, Green = Equity 40%, Grey = Belonging and Civic Muscle 40%, Black = Even Balance 25%, Brown = Best Pivot. Note the black line is nearly indistinguishable from the green line here.
Systems 10 00158 g004
Publisher’s Note: MDPI stays neutral with regard to jurisdictional claims in published maps and institutional affiliations.

