Article

Network Formation and Financial Inclusion in P2P Lending: A Computational Model

by
Evangelos Katsamakas
1 and
J. Manuel Sánchez-Cartas
2,*
1
Gabelli School of Business, Fordham University, 140 W. 62nd Street, New York, NY 10023, USA
2
Campus de Montegancedo, Universidad Politécnica de Madrid, 28223 Madrid, Spain
*
Author to whom correspondence should be addressed.
Systems 2022, 10(5), 155; https://doi.org/10.3390/systems10050155
Submission received: 16 August 2022 / Revised: 3 September 2022 / Accepted: 11 September 2022 / Published: 15 September 2022
(This article belongs to the Special Issue Computational Modeling Approaches to Finance and Fintech Innovation)

Abstract

:
What characteristics of fintech lending platforms improve access to funding and increase financial inclusion? We build a computational model of platform lending that is used to study the endogenous loan network formation process on the platform. Given the multidimensional nature of financial inclusion, we address what factors influence the number of loans, the level of investment/debt, and how those relate to the distribution of investment/debt across agents. We find that platform scale and SME reach are essential in determining the number of loans on the platform. However, the willingness to accept risks is the main driver behind the value of those loans. We also find that increased platform scale, high-risk thresholds, and low-interest rates lead to more evenly distributed investments. Moreover, we find that large platforms help increase diversity and lead to a more evenly distributed power among peers. We conclude that digital platforms increase financial inclusion, helping to foster investment and achieve a more egalitarian allocation of resources. These results can guide new theory development about the impact of P2P lending on inequality as well as help platforms to promote financial inclusion.

1. Introduction

A lending platform is a new digital platform business model [1,2] that challenges bank incumbents because it provides an alternative to traditional bank loans. Instead of borrowing from a single bank, SMEs and entrepreneurs borrow from several sources through the platform. Lending platforms create two-sided platform markets that facilitate matching borrowers and lenders.
Borrower firms have investment opportunities but may lack funds (liquidity), while lenders have the liquidity to lend to borrowers as an investment that earns interest. Loans on the platform create a loan network, in which the nodes are SMEs (agents), and the links are loans. Network formation is crucial in a lending platform because the agent features key to matching (investment opportunities and liquidity) are not fixed. Over time, firms may come up with investment ideas and seek funds, or they may get access to liquidity and seek to provide loans to earn income.
One of the main objectives of this research is to understand this endogenous loan network formation on the platform and its implications. How egalitarian is the network when each SME pursues its own interest? What network features influence the allocation of investment? In this work, we aim to study financial inclusion understood as how investment and loans are distributed in the network based on multiple interconnected factors, such as size, risk, or network topology.
To do so, we build and simulate an agent-based model of endogenous network formation that represents the SME interactions on a P2P lending platform. We pay attention to “governance tools”, such as platform size, availability of insurance or risk curation, that the platform can use to influence the network formation process (number of loans, average investment, distribution of debt, and others). Those metrics provide a multidimensional view of financial inclusion, considering barriers, usage, and access to funding [3] at the platform level. Although the study of inequality using computational methods is not novel [4,5], to the best of our knowledge, no previous work has addressed financial inclusion in P2P networks. Modeling the effects of platform lending on financial inclusion is crucial, given the fintech promises of democratization of access to funding.
We find that larger platforms facilitate access to financing, leading to a more equal distribution of investment. Moreover, risk and interest rates are also key determinants of financial inclusion. In a period of low interest rates, lending platforms may appear more inclusive than in a period of high interest rates. Another factor that helps financial inclusion is the possibility of offering in-platform insurance that may reduce the risk of some SMEs, which would allow them to access funding. Finally, we find that bigger platforms tend to be less tight-knit and have fewer central players, which makes them more resilient.
The following section reviews related literature. The model is presented in Section 3, followed by simulation results and discussion.

2. Materials and Methods

2.1. Literature Review

Fintech adoption, driven by unmet needs [6], is transforming the financial services industry [7,8]. This research focuses on platform lending, or P2P (platform) lending, an important theme within the vast fintech landscape. We provide a background on platform lending and then connect it with financial inclusion issues.

2.1.1. Platform Lending

Platforms lending refers to digital platforms that provide fast and convenient access to loans for borrowers and a new investment opportunity for lenders. Platform lending is a type of fintech lending [9]. Ref. [10] defines fintech lending as using technology to provide lending products that improve the customer experience or the lenders’ screening and monitoring of borrowers.
P2P lending is sometimes called debt crowdfunding or crowdlending [11], a type of crowdfunding [12,13]. In this context, platforms are essential because they help internalize several externalities across and within groups [14].
Ref. [15] provides an early comprehensive survey on P2P lending. They attempt a classification of platforms (e.g., general vs. niche, for-profit vs. not-for-profit, for personal vs. business loans, trading mechanisms), open research issues (pricing of loans, risk management, privacy, and personalization), and research approaches (economics vs. data-driven). Many data-driven papers focus on predicting borrowers’ default risk [16,17,18] and credit scoring [19]. However, researchers must pay more attention to their models’ goals, explainability, and interpretability [20].
Another review article finds that the literature is skewed towards the US and China, and the use of AI techniques is increasing [21]. They identify an intense debate about platform regulation and a need to understand the interaction between platform lending (alternative finance) and traditional finance [22] argues that P2P lending is fundamentally complementary to, and not competitive with, conventional banking.
However, there is little research focusing on platform lending for SMEs. SMEs and entrepreneurs can use platform lending to start and grow ventures [23]. Ref. [24] uses an OECD dataset to show that P2P lending platforms increase SMEs’ access to finance. It recommends that SME managers should make more use of P2P lending platforms. However, P2P lending brings new regulation challenges [25]. Ref. [26] studies marketplace lending for SMEs and finds that platforms should offer simple ratings to influence investor behavior. Refs. [27,28] conducted a case study of Tuodao, one of China’s leading P2P lending platforms, to understand how to develop a digital platform. They propose a three-stage sequential qualitative process: leverage partnerships, subsidize lenders, and facilitate borrowers.
Moreover, social networks play an important role in P2P lending [29,30]. Ref. [31] finds that borrowers with social ties are more likely to have their loans funded and receive lower interest rates, but they are also more likely to pay late or default. Similarly, Ref. [32] studied a Korean P2P lending platform for individuals, finding evidence of herding behavior. Ref. [33] studies how lenders change their decisions as creditworthiness inference becomes increasingly possible through the accumulation of transaction history. They find that lenders seek the wisdom of crowds when information on creditworthiness is limited but switch to their judgment in the presence of more market signals [34] comparing first-time and repeated borrowing behavior. In this regard, previous evidence highlights that it is essential to consider not only customer behavior, but also network aspects, as we do in our model.

2.1.2. Financial Inclusion and Platform Lending

According to the World Bank, financial inclusion means that individuals and businesses have access to useful and affordable financial products and services (transactions, payments, savings, credit, and insurance) that meet their needs, delivered in a responsible way [35]. Financial inclusion is a crucial enabler of poverty reduction and inclusive growth. The research interest in financial inclusion is growing [36,37], including the construction of country-level financial inclusion indexes [38].
Ref. [3] considers three dimensions of financial inclusions: access, usage, and barriers. Access is a supply-side dimension measured by the availability of access points to financial services, e.g., ATMs, bank branches, and others. Usage and barriers are demand-side dimensions. Barriers to inclusion, such as affordability, distance, and lack of trust, drive involuntary exclusion from financial services. The authors construct a composite financial inclusion index. The degree of financial inclusion is positively correlated with a country’s economic development (GDP growth), education, and stability and efficiency of the financial system.
The literature provides several encouraging findings about the relationship between fintech innovation and financial inclusion. Digital technologies reduce the cost of financial intermediation, creating an opportunity for broadly shared welfare benefits, but changes in policy/regulation may be necessary to achieve the full benefit [39]. Ref. [40] posits that fintech is the key driver for financial inclusion, which drives sustainable development. Ref. [41] discusses the importance of digital-based financial inclusion in international development interventions. Ref. [42] defines financial inclusion as the access to and use of financial services by individuals or firms and finds that digital financial services increase financial inclusion. Ref. [43] finds that financial inclusion is a crucial channel through which fintech reduces income inequality, while [44] proposes a theory linking financial inclusion to income inequality. Ref. [45] underscores the importance of financial literacy in the era of fintech and digital financial inclusion. Ref. [46] discusses how blockchain may help resolve challenges of financial inclusion in India. Mobile money is the most impactful fintech innovation increasing financial inclusion in Africa [47]. Fintech firms can serve the unbanked or those in remote locations, but a supportive public policy is needed [48]. Ref. [49] finds that banking digitalization has not substantially improved financial inclusion in India. Moreover, a good understanding of user behavior is key to increasing financial inclusion through fintech [50], as user behavior changes when P2P lending platforms use AI technologies, such as robo-advisors [51]. However, risks to financial inclusion remain due to unequal access to digital infrastructure, digital financial fraud, and potential biases are amplified by data and analytics.
If we focus on P2P lending, current research emphasizes several potential benefits. Ref. [52] investigate how P2P lending enhances financial inclusion in the US. Ref. [53] explores how a lending platform can fight poverty in India. Using an analytical model of P2P lending, [54] considers altruistic investors’ effects on financial inclusion.
However, platforms intended to promote access to finance do not necessarily lead to desirable economic and social outcomes. Ref. [55] finds that formal finance exerts a crowding-out effect on the P2P lending market, explaining failures in China’s P2P lending industry. Platform default risk may increase due to intense competition (Yoon et al. 2019) or a gap between lender preferences and platform offerings [56].
Several studies find bias in lending [57,58]. Other research finds that P2P lending does not equalize economic opportunities globally, rejecting a flat-world hypothesis [59]. Over-indebtedness aggravates poverty and is a potential unintended consequence of a push to increase financial inclusion in Africa [60]. Ref. [61] shows that crowdfunding provides higher benefits in wealthier countries with higher levels of education, thus exacerbating inequalities. Ref. [62] finds that lending platforms should function as gatekeepers of social impact and cannot outsource social impact evaluation to retail investors. Overall, those studies are relevant to inequality and financial inclusion issues in the context of platform lending. However, there is a need for computational modeling research that will clarify the mechanisms behind those effects.

2.2. Computational Model

We build an agent-based computational model of a lending platform for SMEs. Agent-based modeling is a powerful method with many applications in business [63,64,65,66,67] and computational economics research [68,69,70]. One of their advantages is the possibility of addressing complex frameworks with different interrelated dynamics that are normally studied in isolation. In the case of financial inclusion and P2P lending, and to the best of our knowledge, no work explicitly considers corporate inequality, patterns of local interaction, and asymmetric information and risk.
Our agent-based model considers the behavior of N agents representing SMEs on a P2P lending platform, where N is the scale of the platform. At each iteration, some SMEs will find investment opportunities while others will obtain liquidity that can invest in peers’ projects. This assumption aims to reproduce the fact that, at a specific point in time, some SMEs have idle resources while other need investment. Once an SME has found an investment opportunity, it will invest its idle liquidity (if any), but if that is not enough, it will ask for more resources from its peers on the P2P platform, who will only lend it money if the return is greater than or equal to the market return. This assumption is intended to represent the fact that there is always an external opportunity, and SMEs may prefer to use their idle liquidity elsewhere. At the end of each iteration, each SME calculates its total assets as the sum of its initial assets, plus the income it earns as a lender, and its liabilities (sum of its debts as borrower). Then, the platform calculates the SME risk metric for each SME. Figure 1 shows the model flowchart.
Moreover, the platform may offer an insurance product. When insurance is available, if at some point in time, a borrower becomes riskier than when the loan contract was signed, the lender may contract insurance with another peer on the platform [71]. In our analysis, we compare insurance and no insurance cases to explore the impact of insurance on the platform’s performance.

SMEs Characteristics

However, not all SMEs are equal. We assume SMEs are heterogeneous in three dimensions: resources, reach, and riskiness.
To represent prior inequalities that may exist before participating on the lending platform, we assume each SME possesses some assets, which are log-normally distributed (with μ   =   1 ,   σ   =   0.5 ). This assumption allows us to reflect “corporate inequality” that, in recent years, has attracted the attention of researchers given that the gap between the most productive firms and the rest is growing [72].
Additionally, each SME can reach only a subset of other SMEs on the platform. This assumption allows us to consider patterns of local interaction [73]. Intuitively, firms tend to interact with those that are close to or those they know. Platforms play a significant role here by controlling the interactions among firms using tools such as recommendation systems. In our work, we consider this feature by assuming that the size of the subset is equal to the SME reach, defined as a percent of platform scale N. In our experiments, the SME reach ranges from 10% to 100%. The SME reach reflects the quality of the platform’s recommendation and matching technology. As the quality of platform technology improves over time, the SME reach increases. The SME reach plays a crucial role in our analysis because it limits the set of peers with whom a SME can transact (lend or borrow). Intuitively, with 100% reach, it is possible to find the best match between lenders and borrowers, but pairs may be suboptimal with lower reach values.
We also assume each SME has a different risk threshold that reflects the level of risk the SME is willing to accept and limits the agent’s exposure to other SMEs. Moreover, the platform can impose a maximum risk threshold as an instrument for screening SMEs (a kind of curation). For example, if the maximum risk threshold is 70%, only lower than 70% risk threshold SMEs will be active on the platform. In other words, the platform will not allow firms to expose themselves to risky SMEs above the maximum risk threshold.
In particular, an SME will only consider giving loans to SMEs that have a risk lower than the SME’s risk threshold. The SME’s risk threshold is randomly distributed between 0 and X, where X     [ 0.5 ;   0.7 ;   1 ] is the maximum risk threshold set by the platform (a conceptually similar application is found in opinion dynamics, see [74]). Because of the inherent information asymmetry, lenders rely on information about the borrowers that the platform provides. Thus, the platform calculates and publishes each SME’s risk, defined as the SME’s total assets over its liabilities.
Table 1 summarizes key model attributes.

3. Results

Financial inclusion refers to the possibility of accessing financial products on equal terms. However, defining financial inclusion is easier than measuring it, as it involves numerous dimensions. Therefore, to provide a multidimensional view of financial inclusion in the form of access to funding (loans) at the platform level, our computational experiments focus on the platform’s performance in terms of number of loans, average loan interest rate, average investment, distribution of debt and investment, and network characteristics.
We explore the performance of the platform under various scenarios. We run three sets of scenarios for platform scale N equal to 50, 100 and 150 firms (SMEs). We considered the number of firms fixed for simplicity. Considering a market with endogenous entry may enrich the model, but the basic dynamics can be difficult to detect. The interest rate of the external market is exogenously determined, ranging from 0.5% up to 8.5% in steps of 0.5 percent points. We make this assumption for simplicity too. Intuitively, interest may vary depending on who lends and borrows, but to capture the essence of how the endogenous network formation leads to specific distributions of debt and investment, we assume interest is constant and exogenously fixed. The SME reach will range from 10% to 100%. In each iteration, at most 5% of all the agents find an investment opportunity (log-normally distributed with μ   =   0 ,   σ   =   1 ) and another 5% of agents obtain liquidity (a maximum of 30% of their current assets). In all cases, we let the firms interact for 100 periods, which is enough to reach a stationary state in all the simulations. For each combination of N and SME, we run 100 simulations to mitigate any stochastic noise. The results presented hold for other parameter combinations that we tested.

3.1. Number of Loans, Average Interest and Investment

The larger the number of SMEs participating on the platform or the greater their reach, the more loans are generated (Table 2). This reflects the power of network effects, which are fueled by the total number of SMEs, or by increasing their exposure to other peers. This is a fairly intuitive result that shows us that the model behaves reasonably and highlights a first insight. Size matters. However, it says little about how that translates into a more egalitarian distribution of investment or debts, although as we will see in the next section, it has relevant implications.
We also considered three different risk thresholds, although they play an insignificant role. In all cases, there is no significant difference between the number of loans at different risk thresholds. This suggests that SMEs can always find a partner. In other words, the number of loans is not an indicator of how well the fintech platform performs. In this sense, we have no way of knowing how optimal this match is. However, if we continue to lower the threshold, it is likely that most loans will be blocked due to their inherent risk of loans at some point. Nonetheless, as we observe, risk thresholds do not influence the number of loans for moderate levels. This result reinforces the necessity of looking at multiple dimensions when addressing the impact of fintech platforms because their aggregate number of transactions says little about their performance.
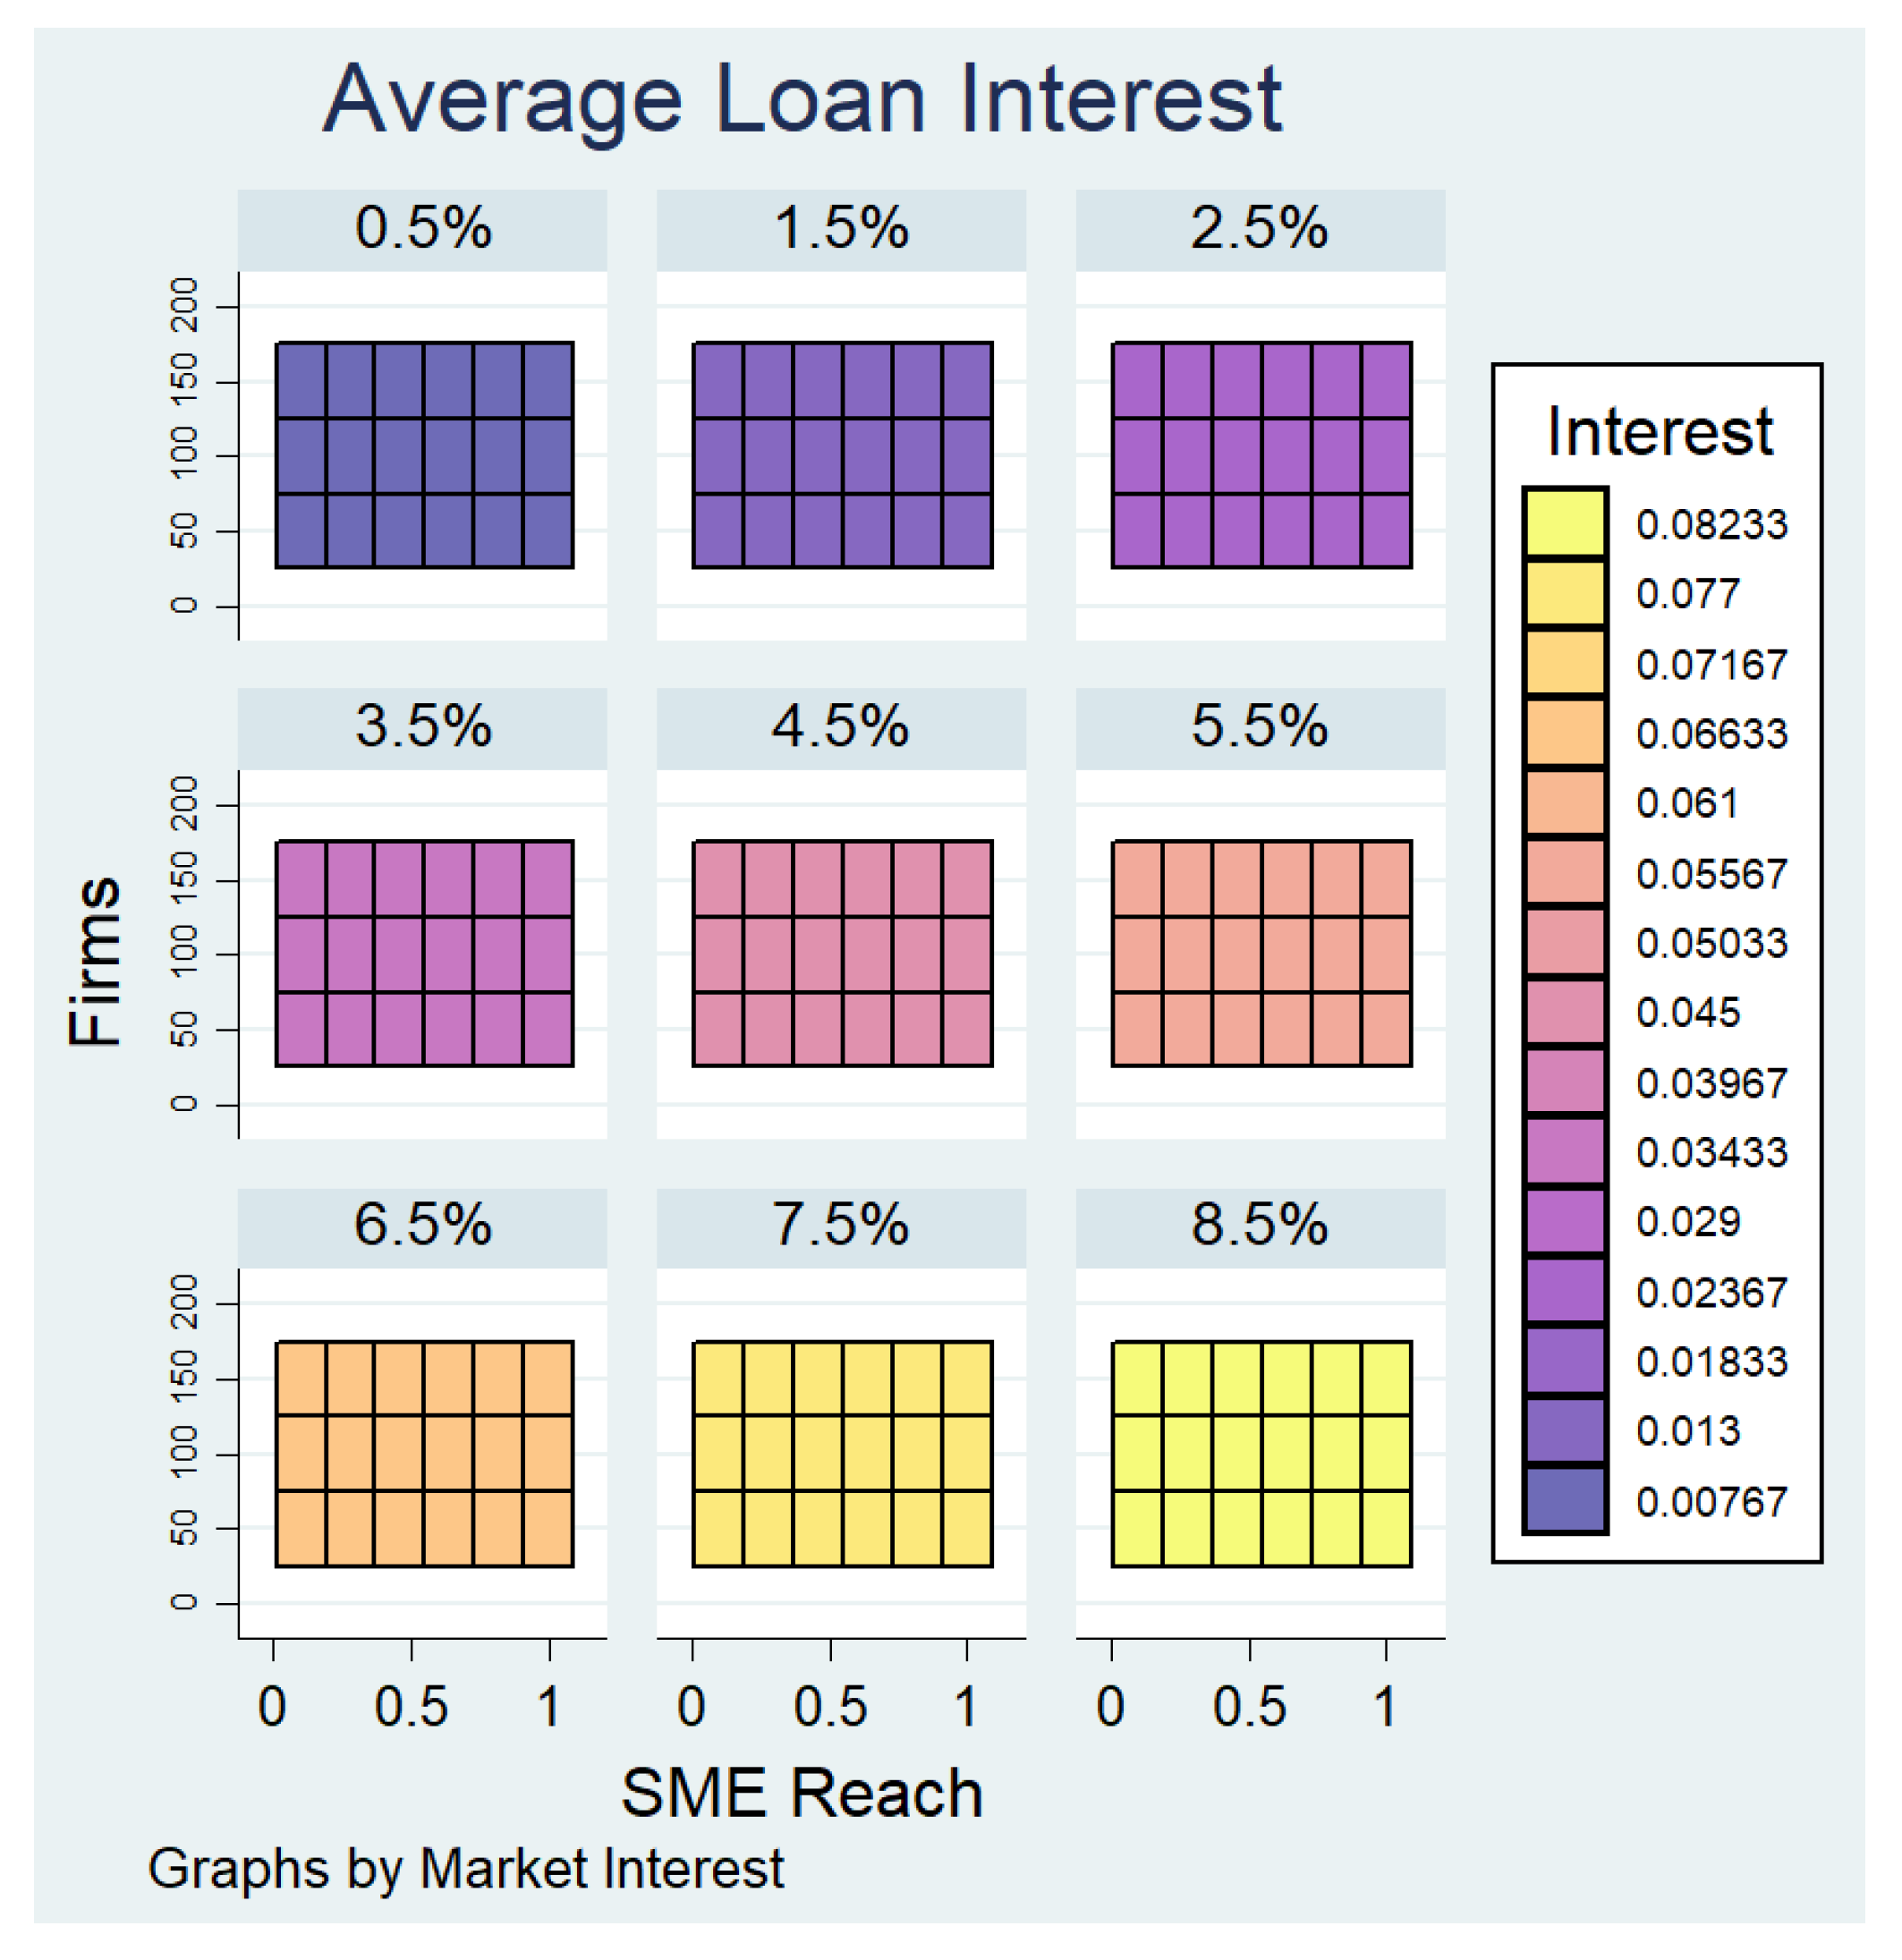
If we pay attention to interest rates, in all cases, the average lending rate on the platform converges to the external market interest that we initially assumed. Intuitively, a Bertrand solution emerges because SMEs choose to invest in their peers or outside the platform, and there is no other differentiation (Figure 2). This result is also due to the assumption that an SME cannot influence the external market interest. Consequently, it allows us to address the isolated effect that governance tools (such as curation) have on financial inclusion.
Although neither the number of SMEs nor their reach influence the market interest, they impact the investment level. Previously, we argued that looking at the number of loans only was not enough to understand the impact of fintech platforms. If we look at the investment level generated by those loans, we observe that a key variable is risk. As we observe in Figure 3, the higher the risk threshold, the higher the investments. Similarly, as we increase the number of SMEs or their reach, there is a small increase in the investment levels. However, it is the risk threshold that has the greatest impact. Previously, we observed that the risk threshold had little impact on the number of loans, but now we observe that it affects the average investment. This suggests that a higher platform threshold (less screening) could be positive. Other research on seller curation on platforms highlights a similar insight using an analytical model [75].
This result implies that trust in peers is key to fostering platform growth because SMEs will be willing to take large risks to support other peers. Current empirical evidence highlights that SME attitudes toward equity financing are directly related to trust [76]. This statement is best represented on the right-hand side of Figure, where we observe how the increase in the risk threshold implies that the ratio between the number of loans and the number of insurance contracts decreases. In other words, these large risks taken are also compensated by the signing of insurance contracts on the platform. Relatedly, the level of exogenous interest has an impact on this ratio. As we can see in Figure 4, the ratio is slightly higher at higher interest levels. This is a consequence of the risks being partially offset by higher profitability, which reduces the need to take out insurance. These results show that risk thresholds and interest rates have a major role in SME funding in a lending platform by influencing the level of the investment and the kind of contract signed. However, our initial question remains: Is the creation of this additional investment or loans evenly distributed among peers or concentrated in those with more assets or better investment opportunities?

3.2. Financial Inclusion: Distribution of Debts and Investment and Network Characteristics

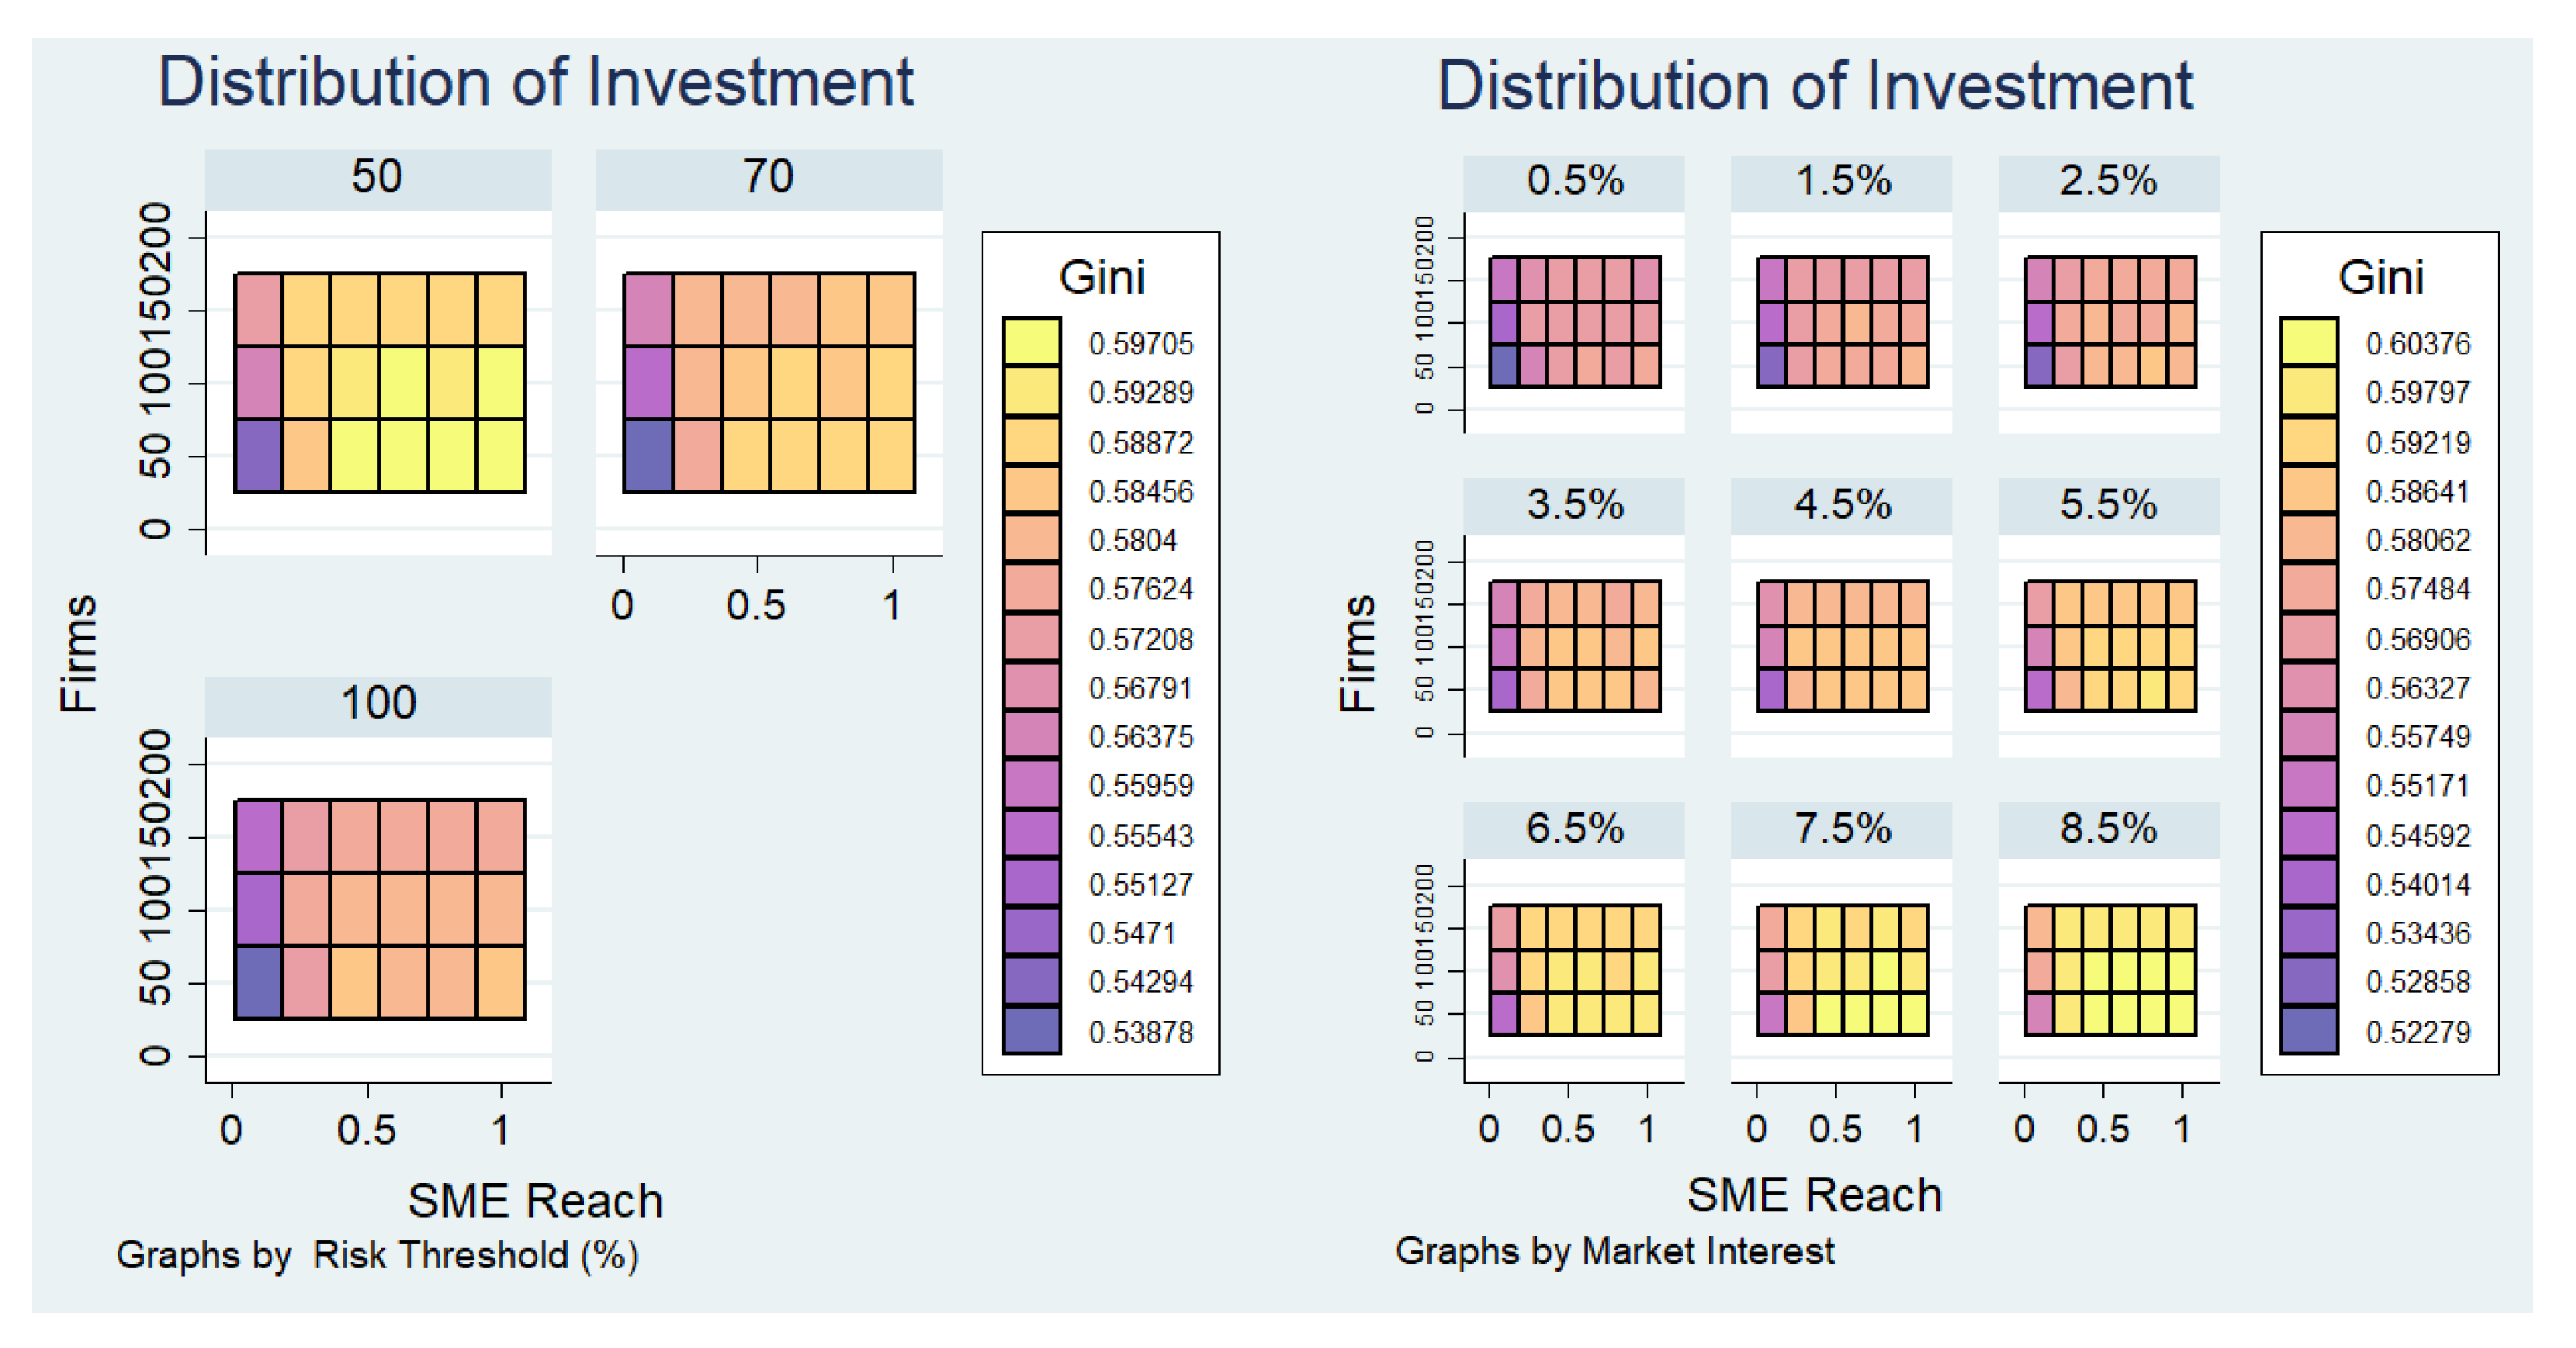
Figure 5 shows that as platform scale or SME reach increases, debts and investment become more evenly distributed among peers, as measured by the Gini index [77]. This result suggests that the bigger lending platform facilitates more inclusive access to funding.
Nonetheless, it is interesting to highlight that the number of SMEs is not the leading force in driving the market towards a more egalitarian distribution of investments. As we have seen previously, risk thresholds and the exogenous market interest rate play a significant role in different dimensions.
It is surprising that at lower interest rates, the distribution of investment is more egalitarian. This suggests that monetary policies that influence interest rates may unintentionally impact lending platforms. Moreover, the macroeconomic environment matters when studying lending platforms. In a period of low interest rates, lending platforms may appear more inclusive than in a period of high interest rates.
We also find that introducing insurance reduces inequality compared to the no-insurance case (Figure 6). Therefore, more diverse P2P platforms that offer a variety of contracts or financing solutions may lead to a more egalitarian distribution of investments. However, platform scale and SME reach matter. When there are just a few SMEs, and their reach is low, then insurance does not matter. As we increase the number of SMEs or their reach, we observe a significant drop in the Gini index. This is analogous to the phenomenon found in social networks regarding the Hirsch index [78]. Nevertheless, such an effect is not apparent in terms of investments. In conclusion, insurance allows for a more egalitarian distribution of debts, but it does not affect the allocation of investment resources.
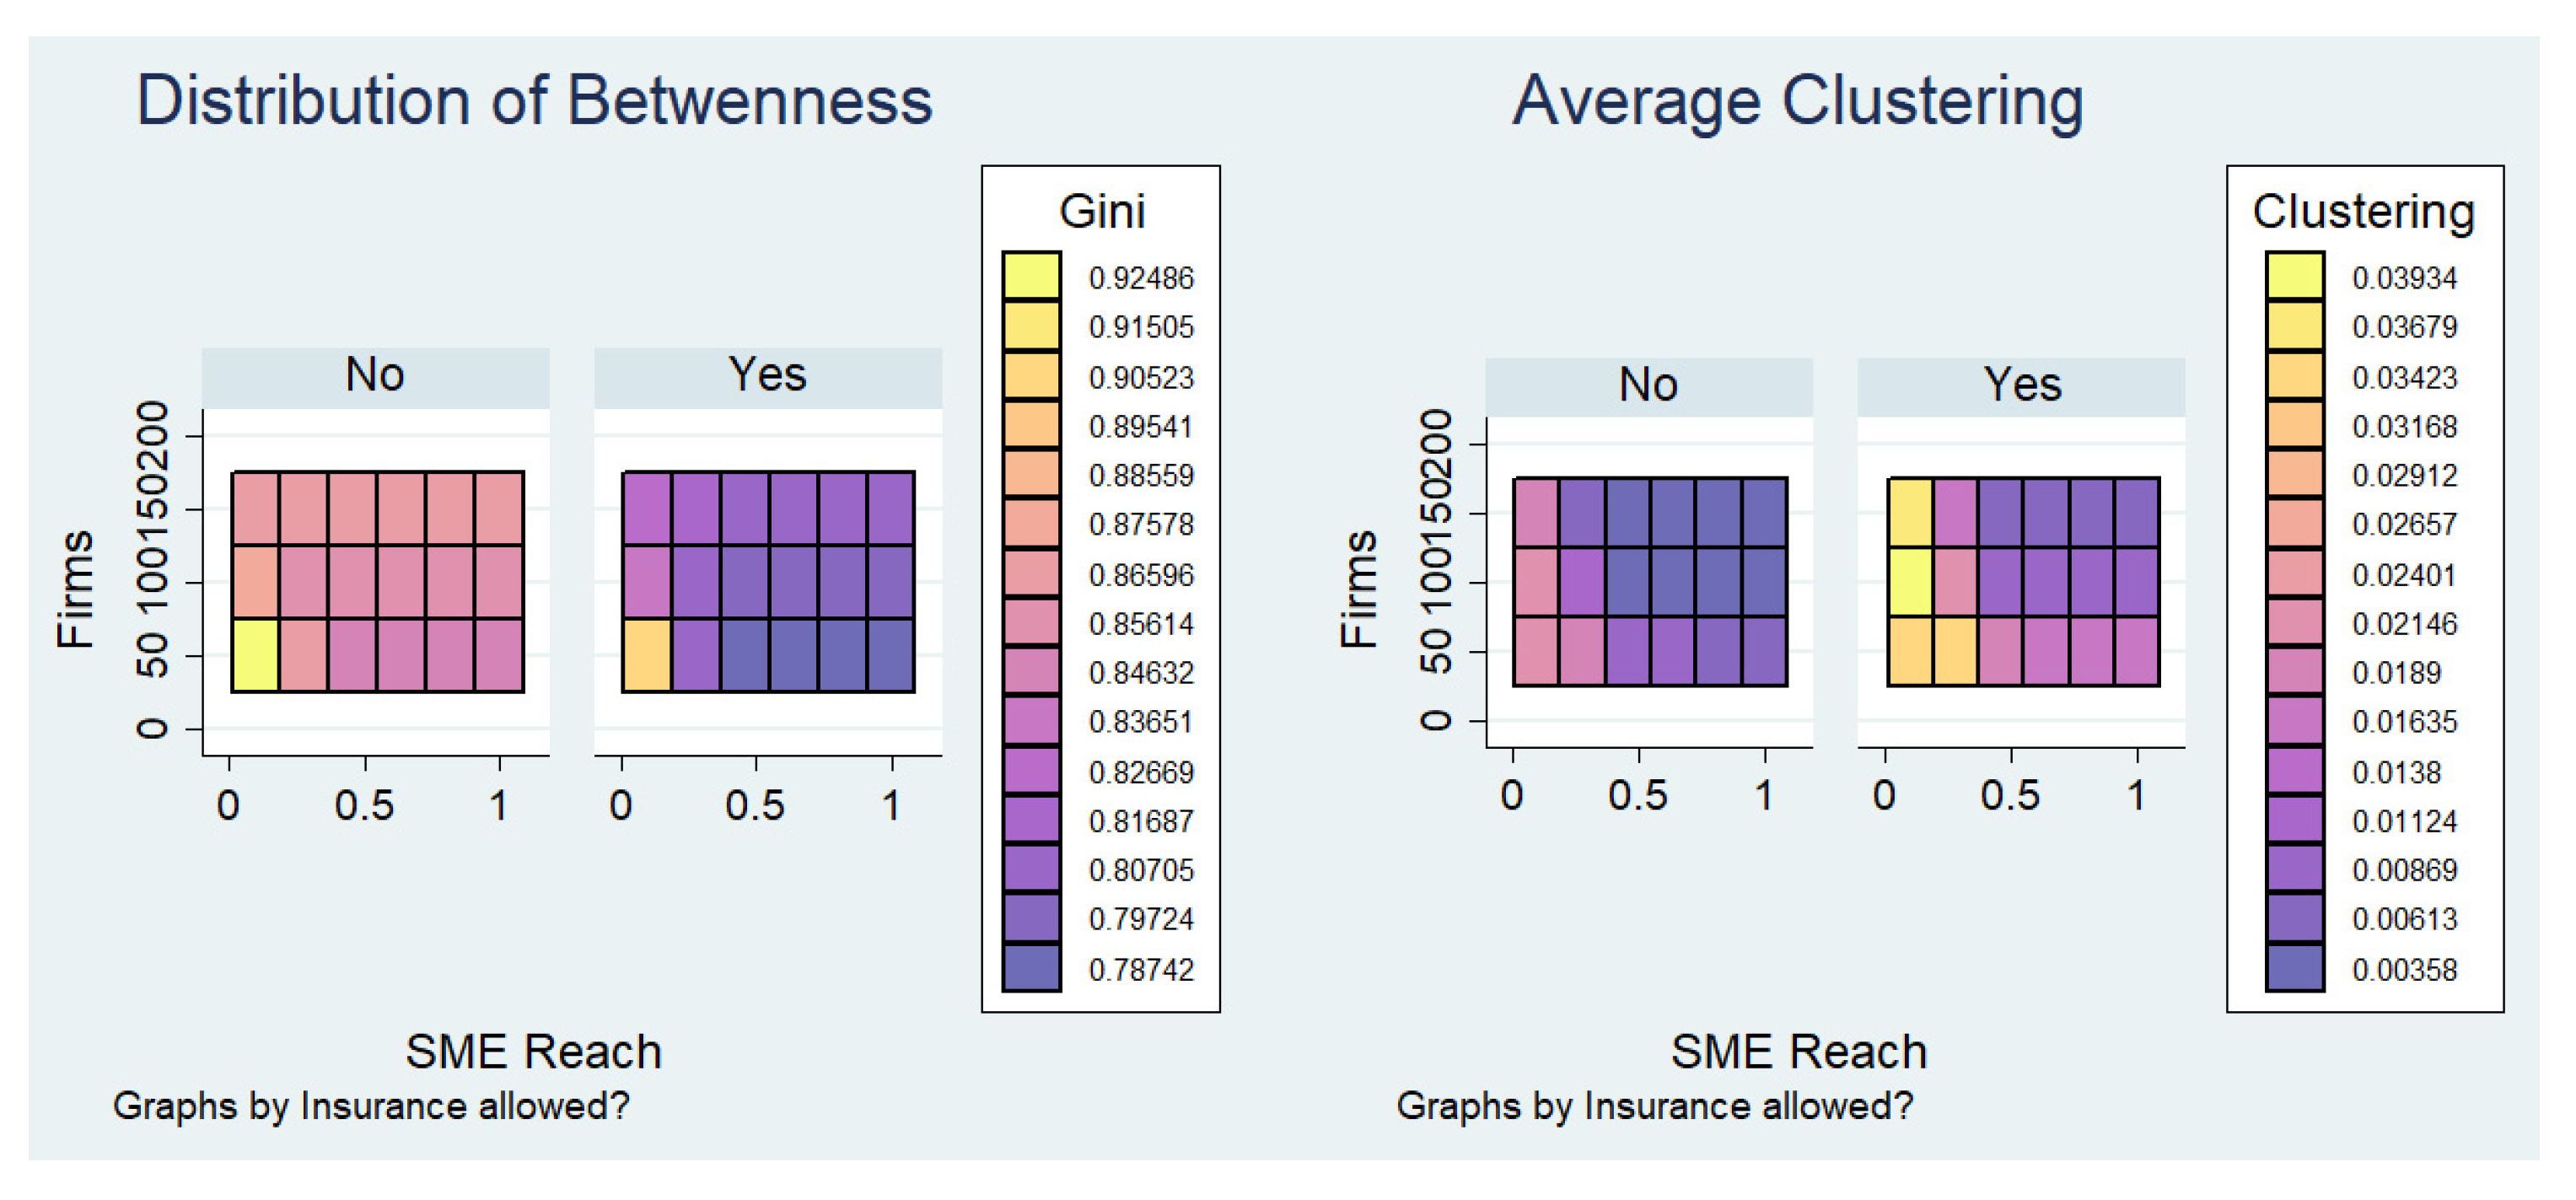
We would like to know more about the characteristics of the endogenously created lending network to understand what happens on the platform. We use two useful network metrics, distribution of betweenness and average clustering, depicted in Figure 7. We analyze the network in two cases, with and without insurance contracts. Note that insurance contracts create a new insurance network that consists of all the insurance links.
We observe that either increasing the platform scale or increasing the reach implies that centrality is more evenly distributed. Intuitively, it implies that, in larger networks, some peers are less likely to become central or essential to the network. Instead, larger networks tend to distribute the relevance of each peer more evenly. This result complements what we have observed in the previous figures and highlights that evenly distributed opportunities may also be a consequence of this spontaneously emerging network topology. Moreover, allowing insurance contracts strengthens these effects. Indeed, the insurance role seems to be more relevant than the number of SMEs or their reach.
As we increase the number of firms, we would expect the average clustering to increase. However, that only happens when the reach is small (10%). In the rest of the scenarios, we observe that either increasing the number of firms or their reach reduces the clustering. In other words, as platform scale increases, the lending network seems to be less closely knit. The same pattern appears with or without insurance contracts. However, with insurance contracts, it is more pronounced. Combining both results, we conclude that as platform scale increases, the communities on the platform are less tight-knit, but the presence of central players becomes less common.
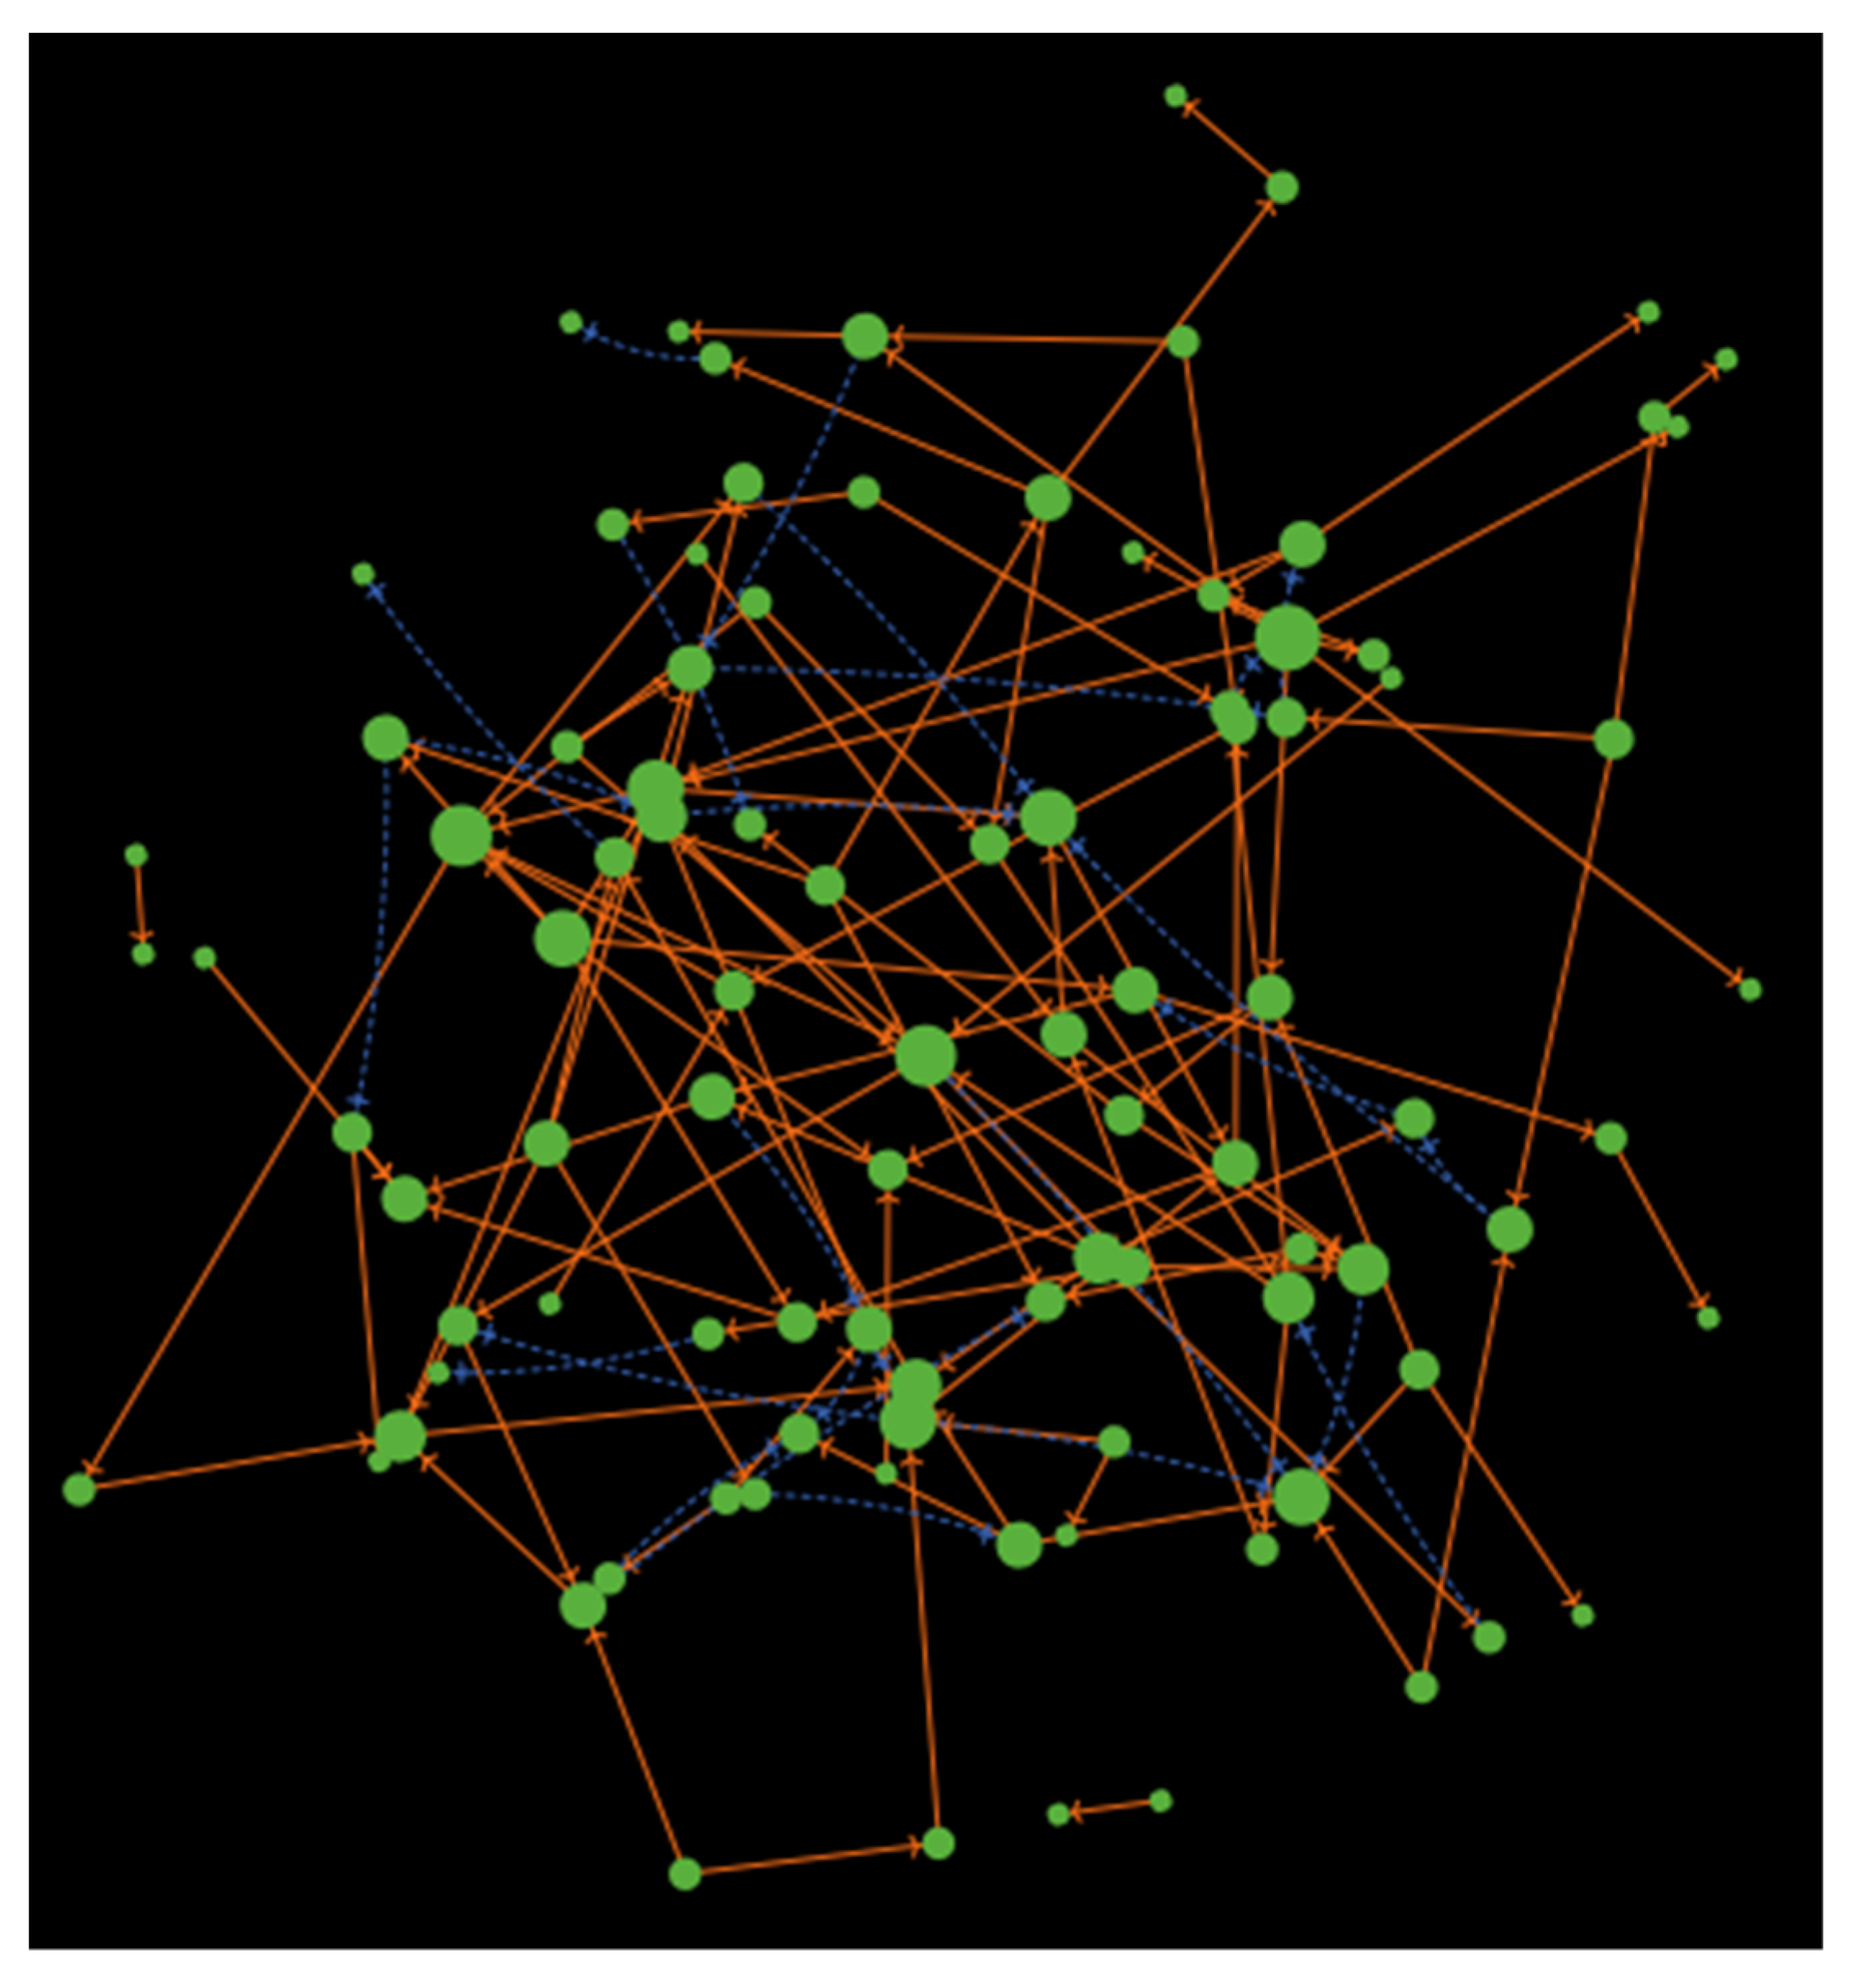
In Figure 8, we visualize a network of 100 SMEs and SME reach at 40% when insurance is allowed. Although it does not represent all the cases documented in this paper, it illustrates the network topology, which is likely a crucial driver of the evenly distributed investment opportunities.

4. Discussion: Limitations and Future Steps

A key limitation of our approach is its complexity, which makes analytical tools unsuitable to address the problem at hand. However, relying on computation methods creates other limitations. Given the interconnectedness between several variables, addressing the role of specific cases requires numerous simulations and exploring large parameter spaces. This aspect limits the number of experiments that can be carried out despite the apparent flexibility of the approach. Finally, it is important to impose some restriction on the model when the problem has multiple interrelated variables, the universe of parameters is large, and the problem is complex. This self-imposed constraint is to ensure that our ambition does not introduce errors when building the model, as small errors can inadvertently influence the results.
Changing some of our research assumptions could be the basis for future research. First, experimenting with other rules of agent behavior and platform governance could lead to more insights about network formation and platform performance. Moreover, our setup is equivalent to having a monopoly platform charging a fixed access fee. Another setup could consider a platform charging a transaction fee for each loan or platform competition. In addition, our model has some innovative features, such as the concept of agent reach, that could be adopted in future research. Another interesting topic to address is the possibility of SME interacting in more than one unique context (lending), i.e., addressing multiplexity could enhance our understanding of business relationships among SMEs. Lastly, our work suggests a potential starting point for future research on decentralized lending platforms [79] that could facilitate the borrowing and lending of crypto assets, a theme within decentralized finance (Defi).

5. Conclusions

This research uses a computational modeling approach to contribute to the understanding of fintech for SMEs and entrepreneurs. In particular, it builds an agent-based model of a P2P lending platform to understand the impact of several platform’s characteristics on financial inclusion measured by different metrics that relate to the distribution of investment/debts as well as the topology of the loan network.
We summarize research insights, managerial implications, and suggestions for future research.

5.1. Research Contributions

A key contribution of this research is that we build a computational model that provides a multidimensional view of financial inclusion in the form of access to funding (loans) at the platform level. The lending network’s performance is defined by the number of loans, average loan interest rate, average investment, distribution of debts and investment, and network characteristics. Intuitively, financial inclusion increases when the number of loans and the average investment increase, the average loan interest decreases, and the distribution of debt and investment becomes more egalitarian. In contrast, most prior research focuses on financial inclusion indexes at a country level [3,38,42].
A crucial insight of this research is that when analyzing P2P platforms, it is essential to consider the endogenous network creation process determined by platform choices and SMEs’ behavior. SMEs follow simple rules that drive this process. At the same time, other external factors, such as liquidity shocks or random discovery of investment opportunities, influence the network and complicate its analysis. Complex networks and behavior patterns can emerge from simple specifications.
The primary network formed on the platform is a loan network (loan is a link between two firms, a borrower and a lender). An insurance network is also formed (insurance is a link between two firms), when insurance is allowed on the platform. We find stable networks for both types of networks when simulation runs are completed.
P2P lending platforms rely on network effects to sustain their operations. However, network effects are not only fueled by the number of SMEs, but also by increasing the SMEs’ exposure to other peers on the platform.
Interestingly, if the SME’s risk threshold increases, the number of loans does not change, but the investment levels increase. Investment levels also increase in the number of SMEs or their reach, but surprisingly not as markedly. This result implies that trust in peers is key to fostering platform growth because SMEs will be willing to take large risks to support other peers. Nonetheless, the expansion of the P2P networks has effects beyond the number of loans or the investment levels. As P2P expands, debts and investment become more evenly distributed among peers, increasing financial inclusion.
Insurance allows for a more egalitarian distribution of debts, but it has a low impact on how resources are allocated to investments. In this regard, it is surprising that, at lower interest rates, the distribution of investment is more egalitarian. This suggests that monetary policies that influence interest rates may unintentionally impact SME lending platforms.
Finally, we observe that either increasing the network or increasing the reach implies that centrality is more evenly distributed, and the lending network seems to be less closely knit. Intuitively, it implies that, in large P2P networks, platforms create less tight-knit communities, which foster diversity and where the presence of key or central players is less common.
This research focuses on the non-pricing properties of platforms (platform scale, agent reach, insurance, or screening). It is crucial to analyze such properties before and beyond pricing behavior considerations. Moreover, there is relatively little literature on the non-pricing features of platforms [80,81,82], and our work adds to that stream.
Our article also highlights the importance of trust in platform lending. This insight is supported by other articles emphasizing the issue of trust for the success of the platform [83,84]. Moreover, Ref. [85] find that social underwriting by a third-party trustee and information in the description texts fostering the investors’ trust are the main predictors of successful funding.
Overall, our work adds to understanding the relationship between fintech, platforms, and financial inclusion [86,87]. Moreover, we contribute to understanding the social value of digital platforms [88,89] in financial services.
Connecting our work with platform ecosystems [90,91], we can say that the platform creates and orchestrates an SME funding ecosystem. This ecosystem is precisely captured by the loan network (and the insurance network, when present), so we can understand the ecosystem characteristics as a network (network structure and metrics). The implication for platforms is that the best way to orchestrate their platform ecosystem is to understand the network formation process within that ecosystem.
Lastly, methodologically our work demonstrates the value of agent-based modeling in understanding platform lending as a complex adaptive system. It adds to many other recent business applications of agent-based modeling [92,93,94] and other simulation research [95,96,97,98,99].
The Appendix A and Appendix B provides additional results and insights. We run experiments that consider increasing the number of large firms on the platform. We also analyze an endogenous external market interest rate setup.

5.2. Implications for Managers

This research provides several practical insights for designers and managers of lending platforms. Platform scale is important to fuel network effects. However, agent reach, which reflects peer visibility, should not be ignored as it may be equally important.
Our work suggests that a higher platform risk threshold (less screening) could be positive. Similarly, trust is also essential, as it is an important driver to encourage investment. In this regard, managers need to keep an adequate level of curation that guarantees that trust. This trust may increase the risk that peers are willing to take, thus increasing the investment levels on the platform. One way to support this trust will be by allowing them to sign insurance contracts. Insurance helps to build trust, reduce risk, and distribute debts evenly.
Similarly, depending on the manager’s objectives, the control of interest rates on the platform may help achieve more egalitarian outcomes, which could help attract more SMEs. In this regard, increasing the number of SMEs will also make a more resilient network. As the network grows, managers will observe the agents’ influence on the network become more evenly distributed. Increased platform scale may also help managers achieve other objectives, such as more diversity or inclusive opportunities for SMEs and entrepreneurs.
As lending and other fintech platforms seek innovative ideas to compete effectively, we show that agent-based simulation modeling can provide novel insights into platform design and innovation. An important recommendation is to analyze the network of SMEs on the lending platform. Moreover, fintech platforms should consider offering insurance because such services benefit the lending platform.

Author Contributions

Conceptualization, E.K. and J.M.S.-C.; methodology, E.K. and J.M.S.-C.; software, J.M.S.-C.; validation, E.K. and J.M.S.-C.; formal analysis, E.K. and J.M.S.-C.; investigation, E.K. and J.M.S.-C.; resources, E.K. and J.M.S.-C.; data curation, E.K. and J.M.S.-C.; writing—original draft preparation, E.K. and J.M.S.-C.; writing—review and editing, E.K. and J.M.S.-C.; visualization, E.K. and J.M.S.-C.; supervision, E.K. and J.M.S.-C.; project administration, E.K. and J.M.S.-C.; funding acquisition, E.K. and J.M.S.-C. All authors have read and agreed to the published version of the manuscript.

Funding

This research received no external funding.

Data Availability Statement

All data and software are available upon request.

Conflicts of Interest

The authors declare no conflict of interest.

Appendix A. Additional Computational Experiments: Increasing the Number of Large Firms (LFs)
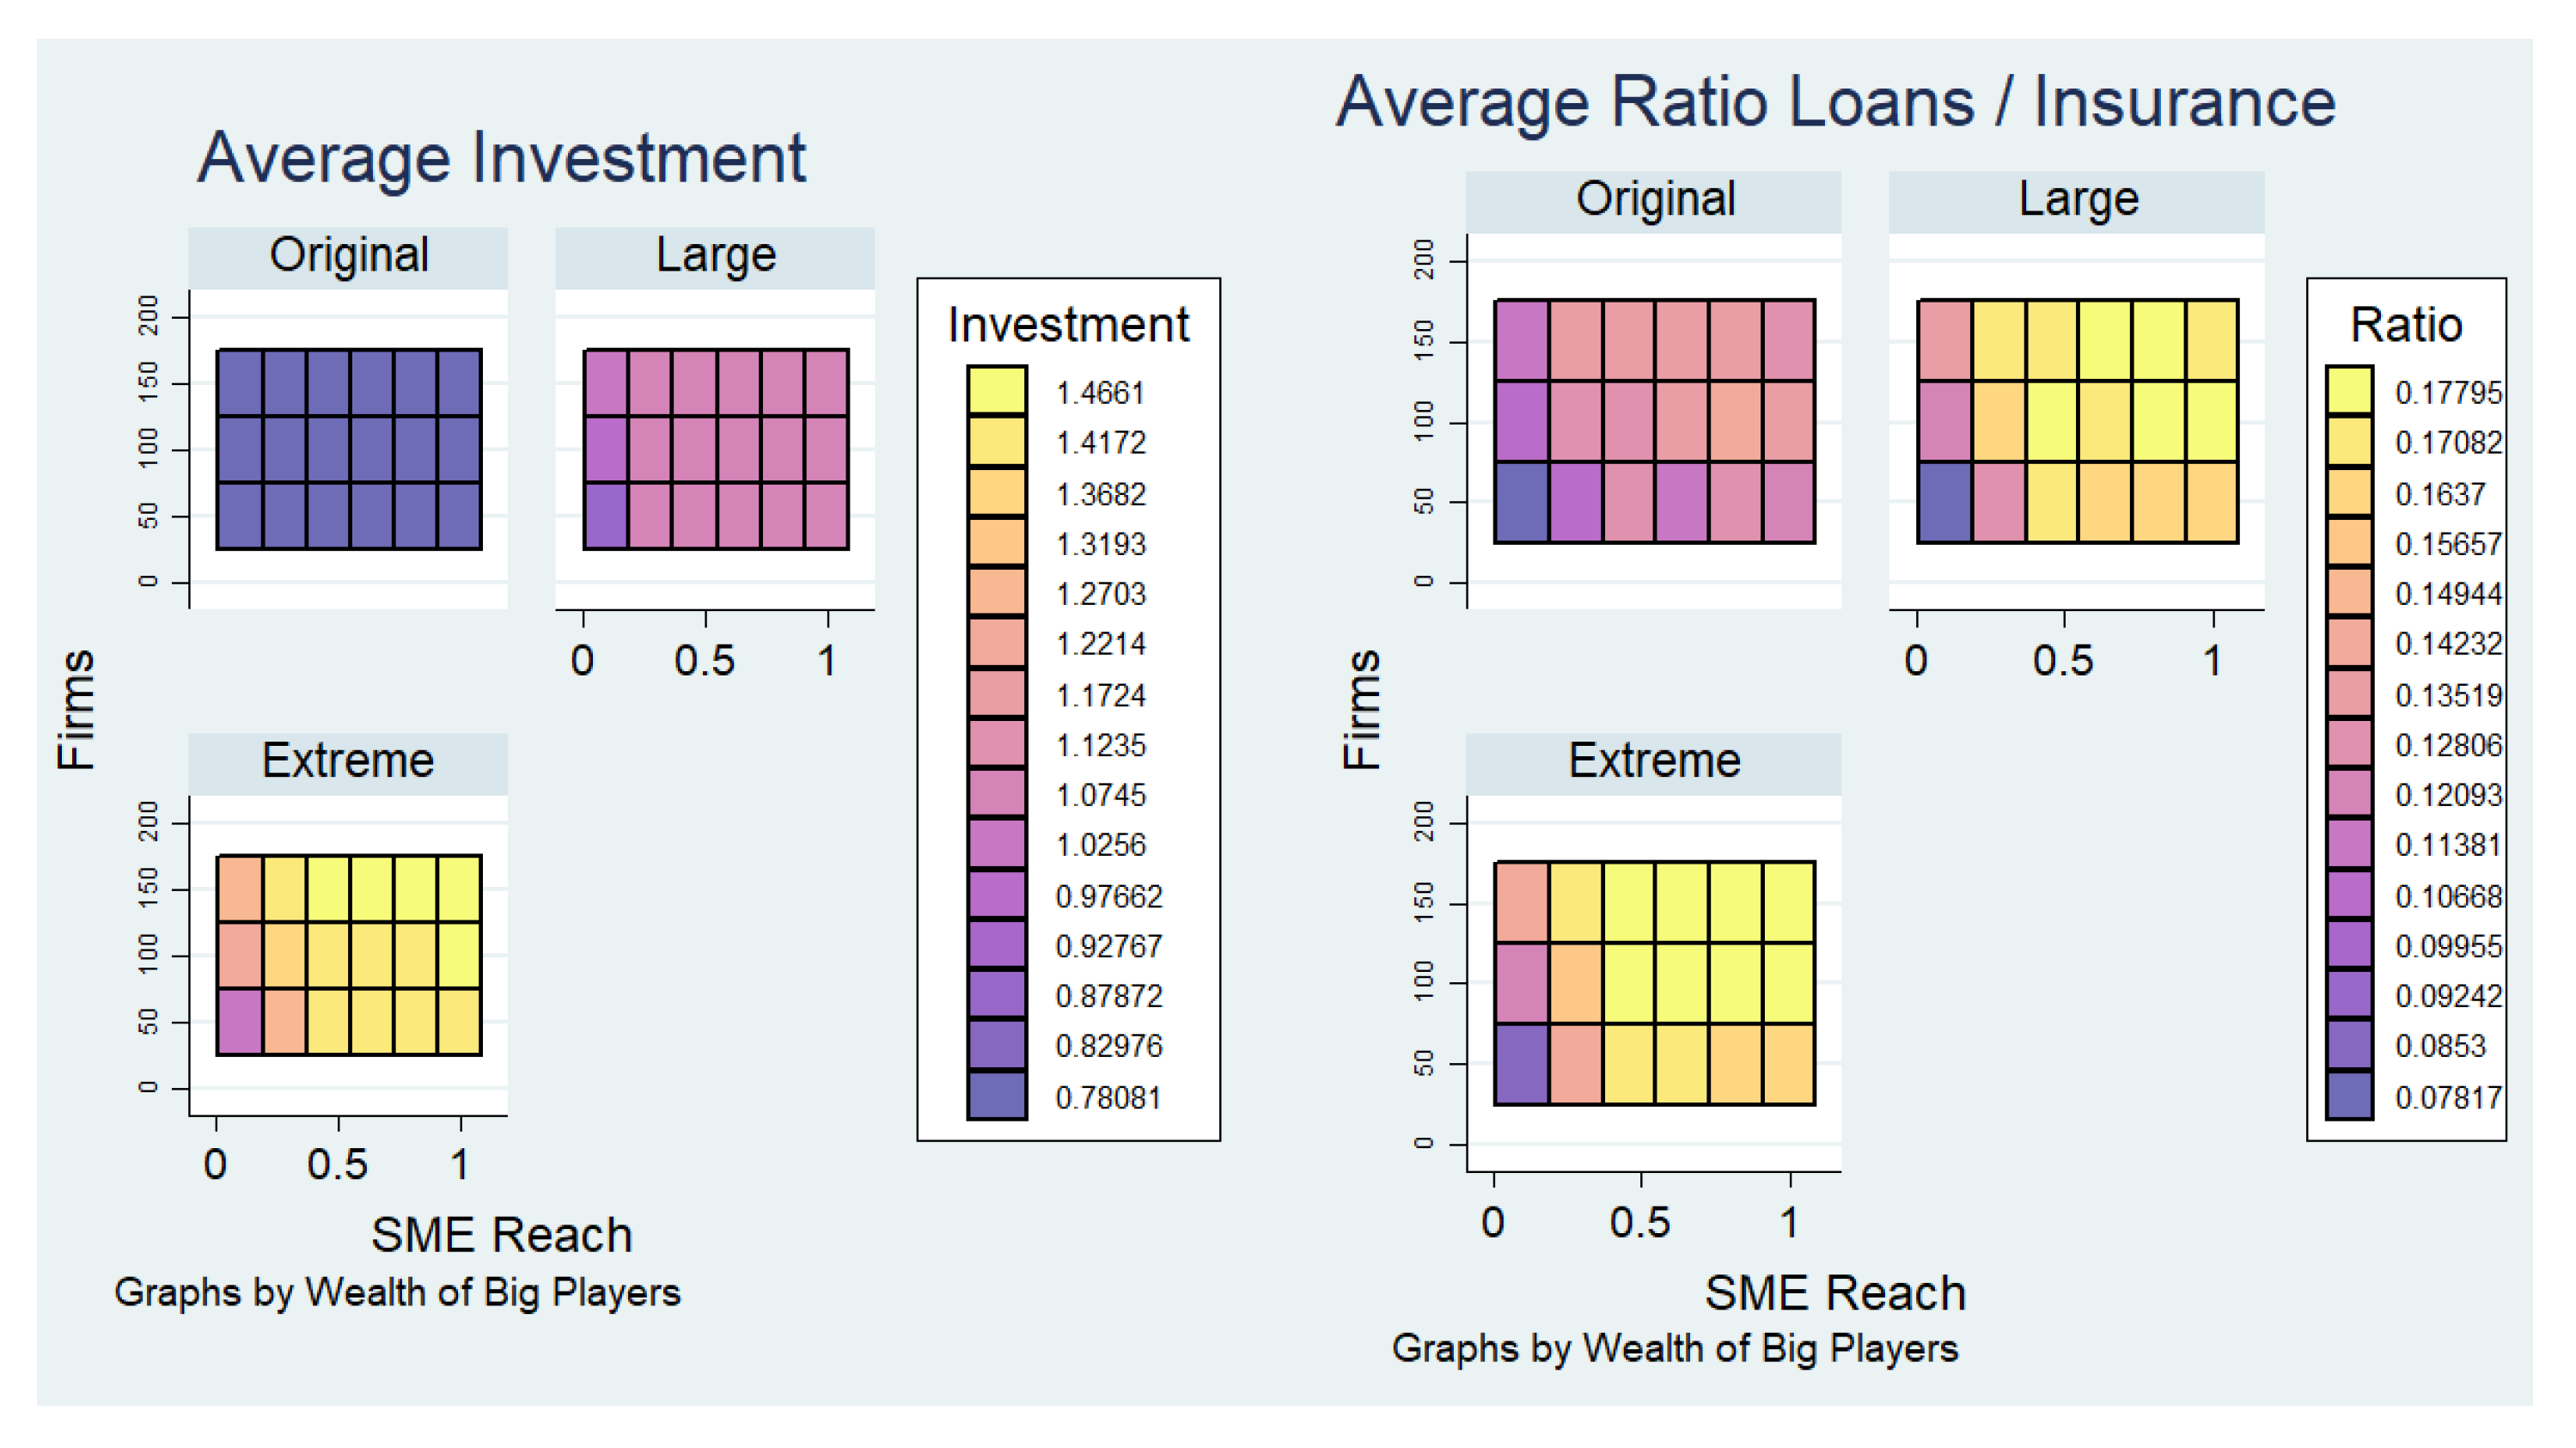
The main case analyzed earlier assumes a log-normal distribution ( μ   =   1 ,   σ   =   0.5 ) of assets among the firms that ensured that asset differences were not extreme. However, some of the participants in lending marketplaces may be institutional investors or large firms (LFs) with many assets (deep pockets). How does the presence of LFs affect the platform performance? To answer this question, we now examine two new cases with σ   =   1 and σ   =   2 , which we call Large and Extreme, respectively, and compare them with the Original case.
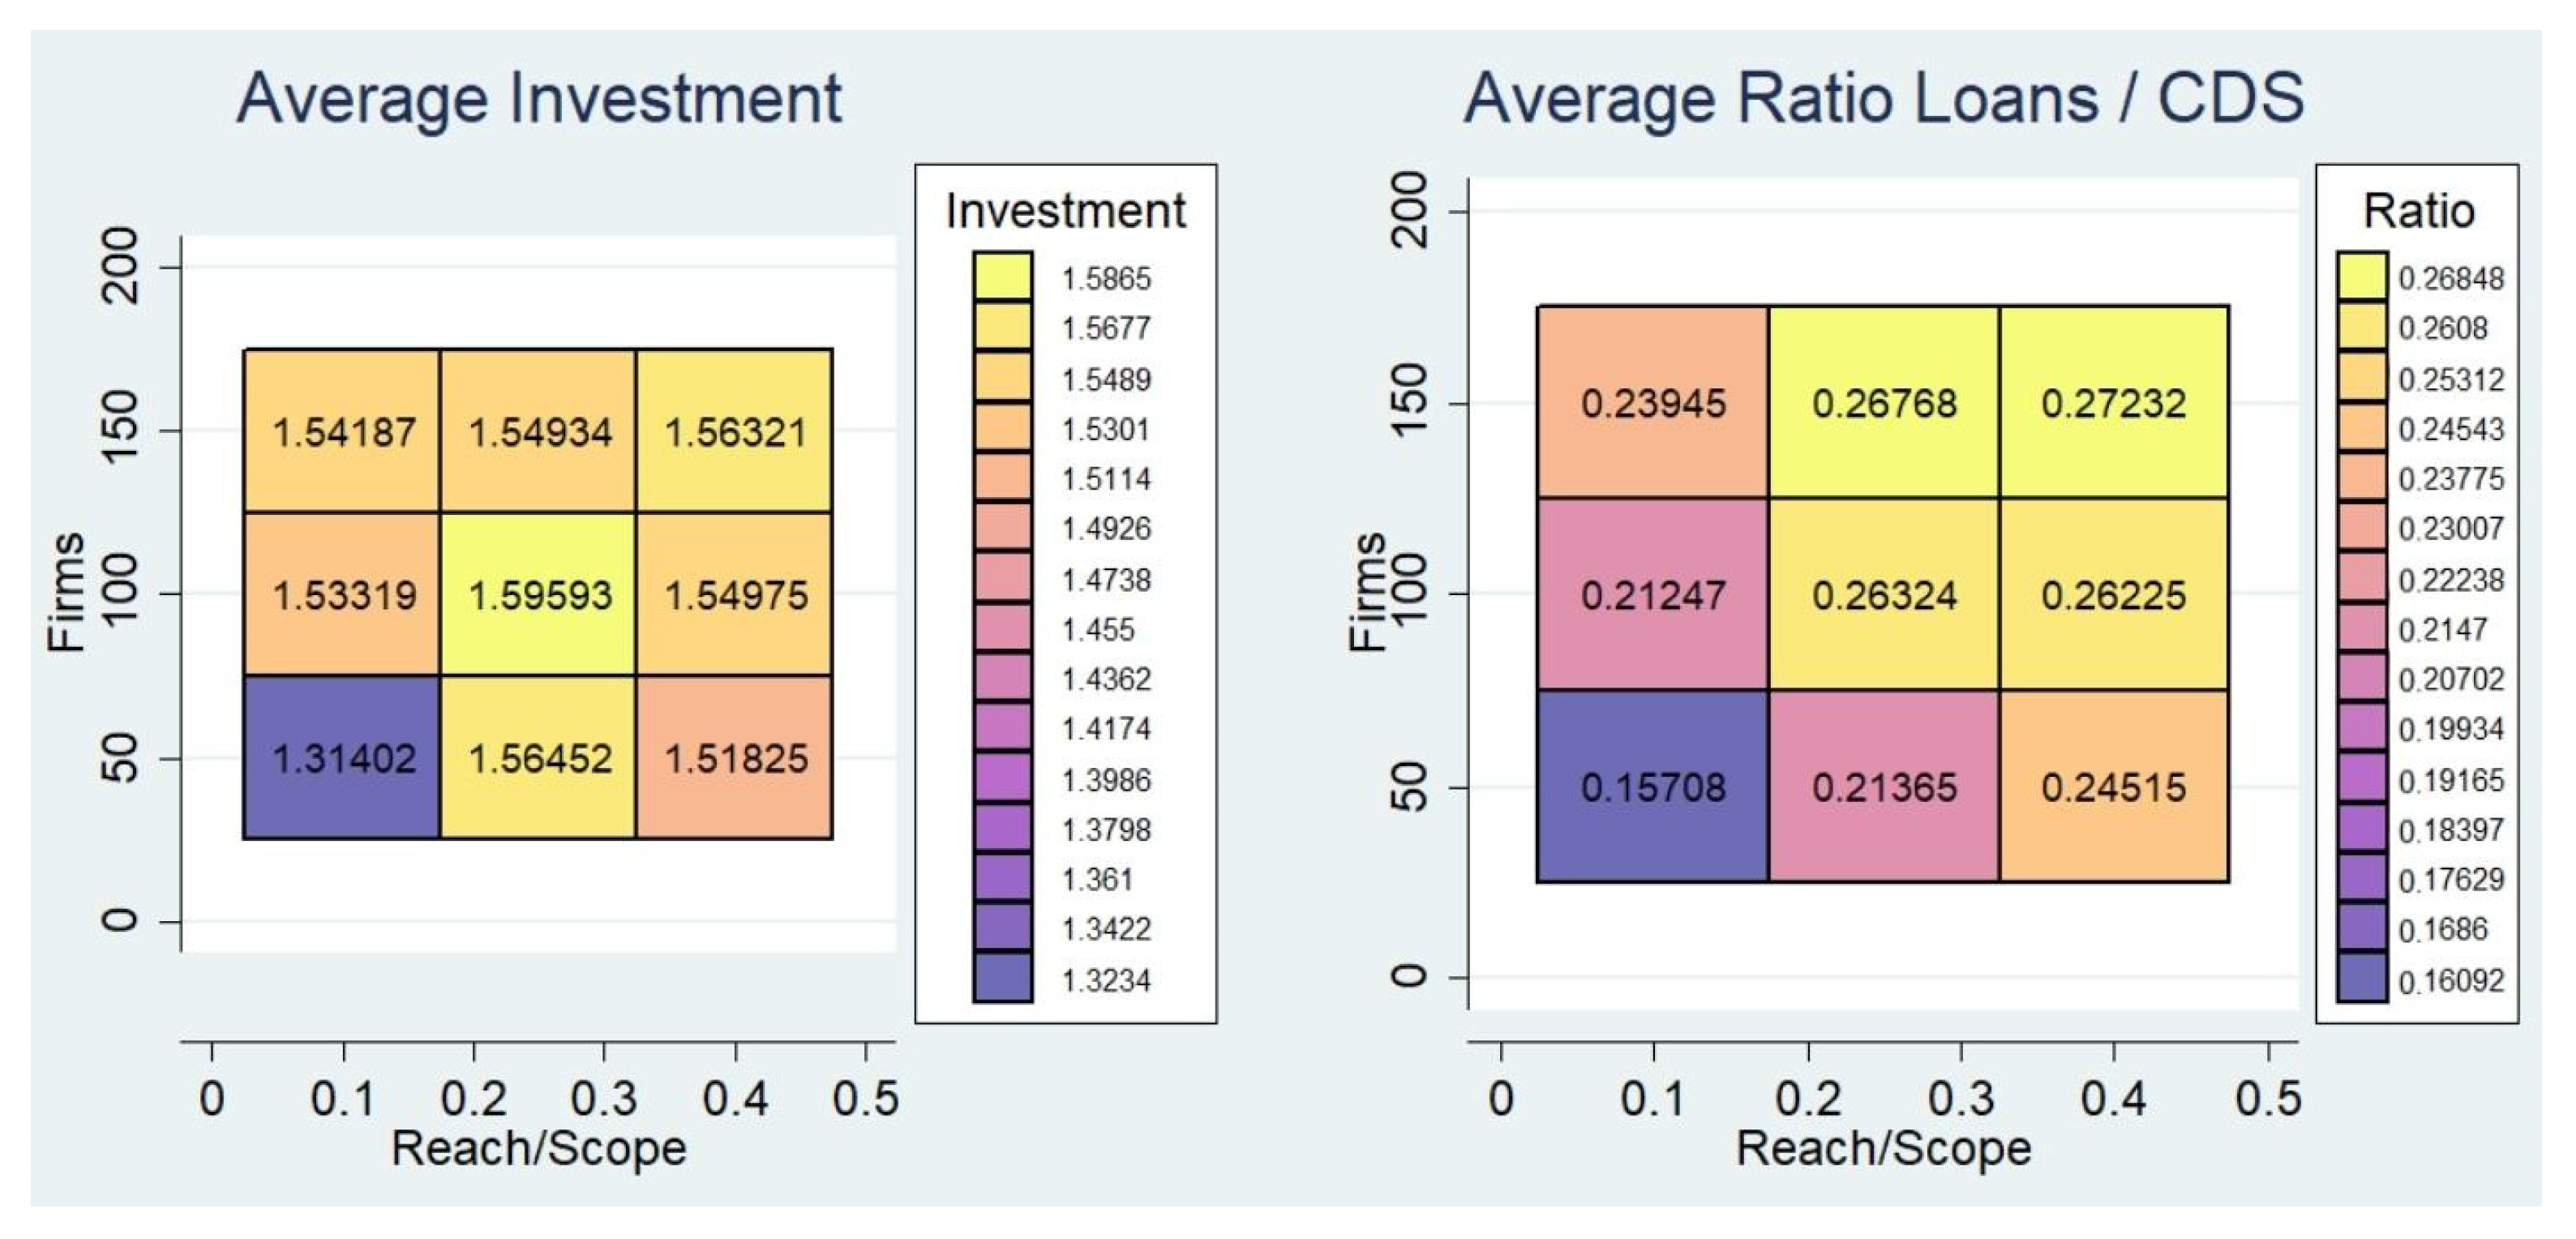
The inclusion of LFs has an immediate effect on investments and loans. It leads to higher levels of investment and a lower ratio of loans to insurance (Figure A1). The presence of LFs facilitates the investment required by other companies, leading to the creation of more loans and relatively less insurance.
Figure A1. Investment and Loans Ratio with LFs (big players).
Systems 10 00155 g0a1
The presence of LFs implies that they can invest in more firms than other players. This characteristic has two consequences. First, it modifies the distribution of debt in the network because these LFs can finance more projects than SMEs. Second, firms may get expelled by these LFs when investing in other peers. Intuitively, a LF can offer all the financing needed in one loan rather than several loans from small players.
Moreover, although debts are more evenly distributed, the effect on how resources are allocated (investment) is less clear (Figure A2). In fact, in the Original case with low reach, we can find more evenly distributed investments than in any other case. These results suggest that the presence of LFs helps finance different projects, with leads to a more evenly distributed set of debts. However, if we take into account the debts and own resources, we observe that LFs do not help distribute the overall investment. In other words, more projects are financed (more evenly distributed debts), but SMEs keep their resources because they are expelled by the LFs. They re-invest in their own projects instead of others, which need not be socially optimal.
Figure A2. Distribution of debts and investment with LFs (big players).
Systems 10 00155 g0a2
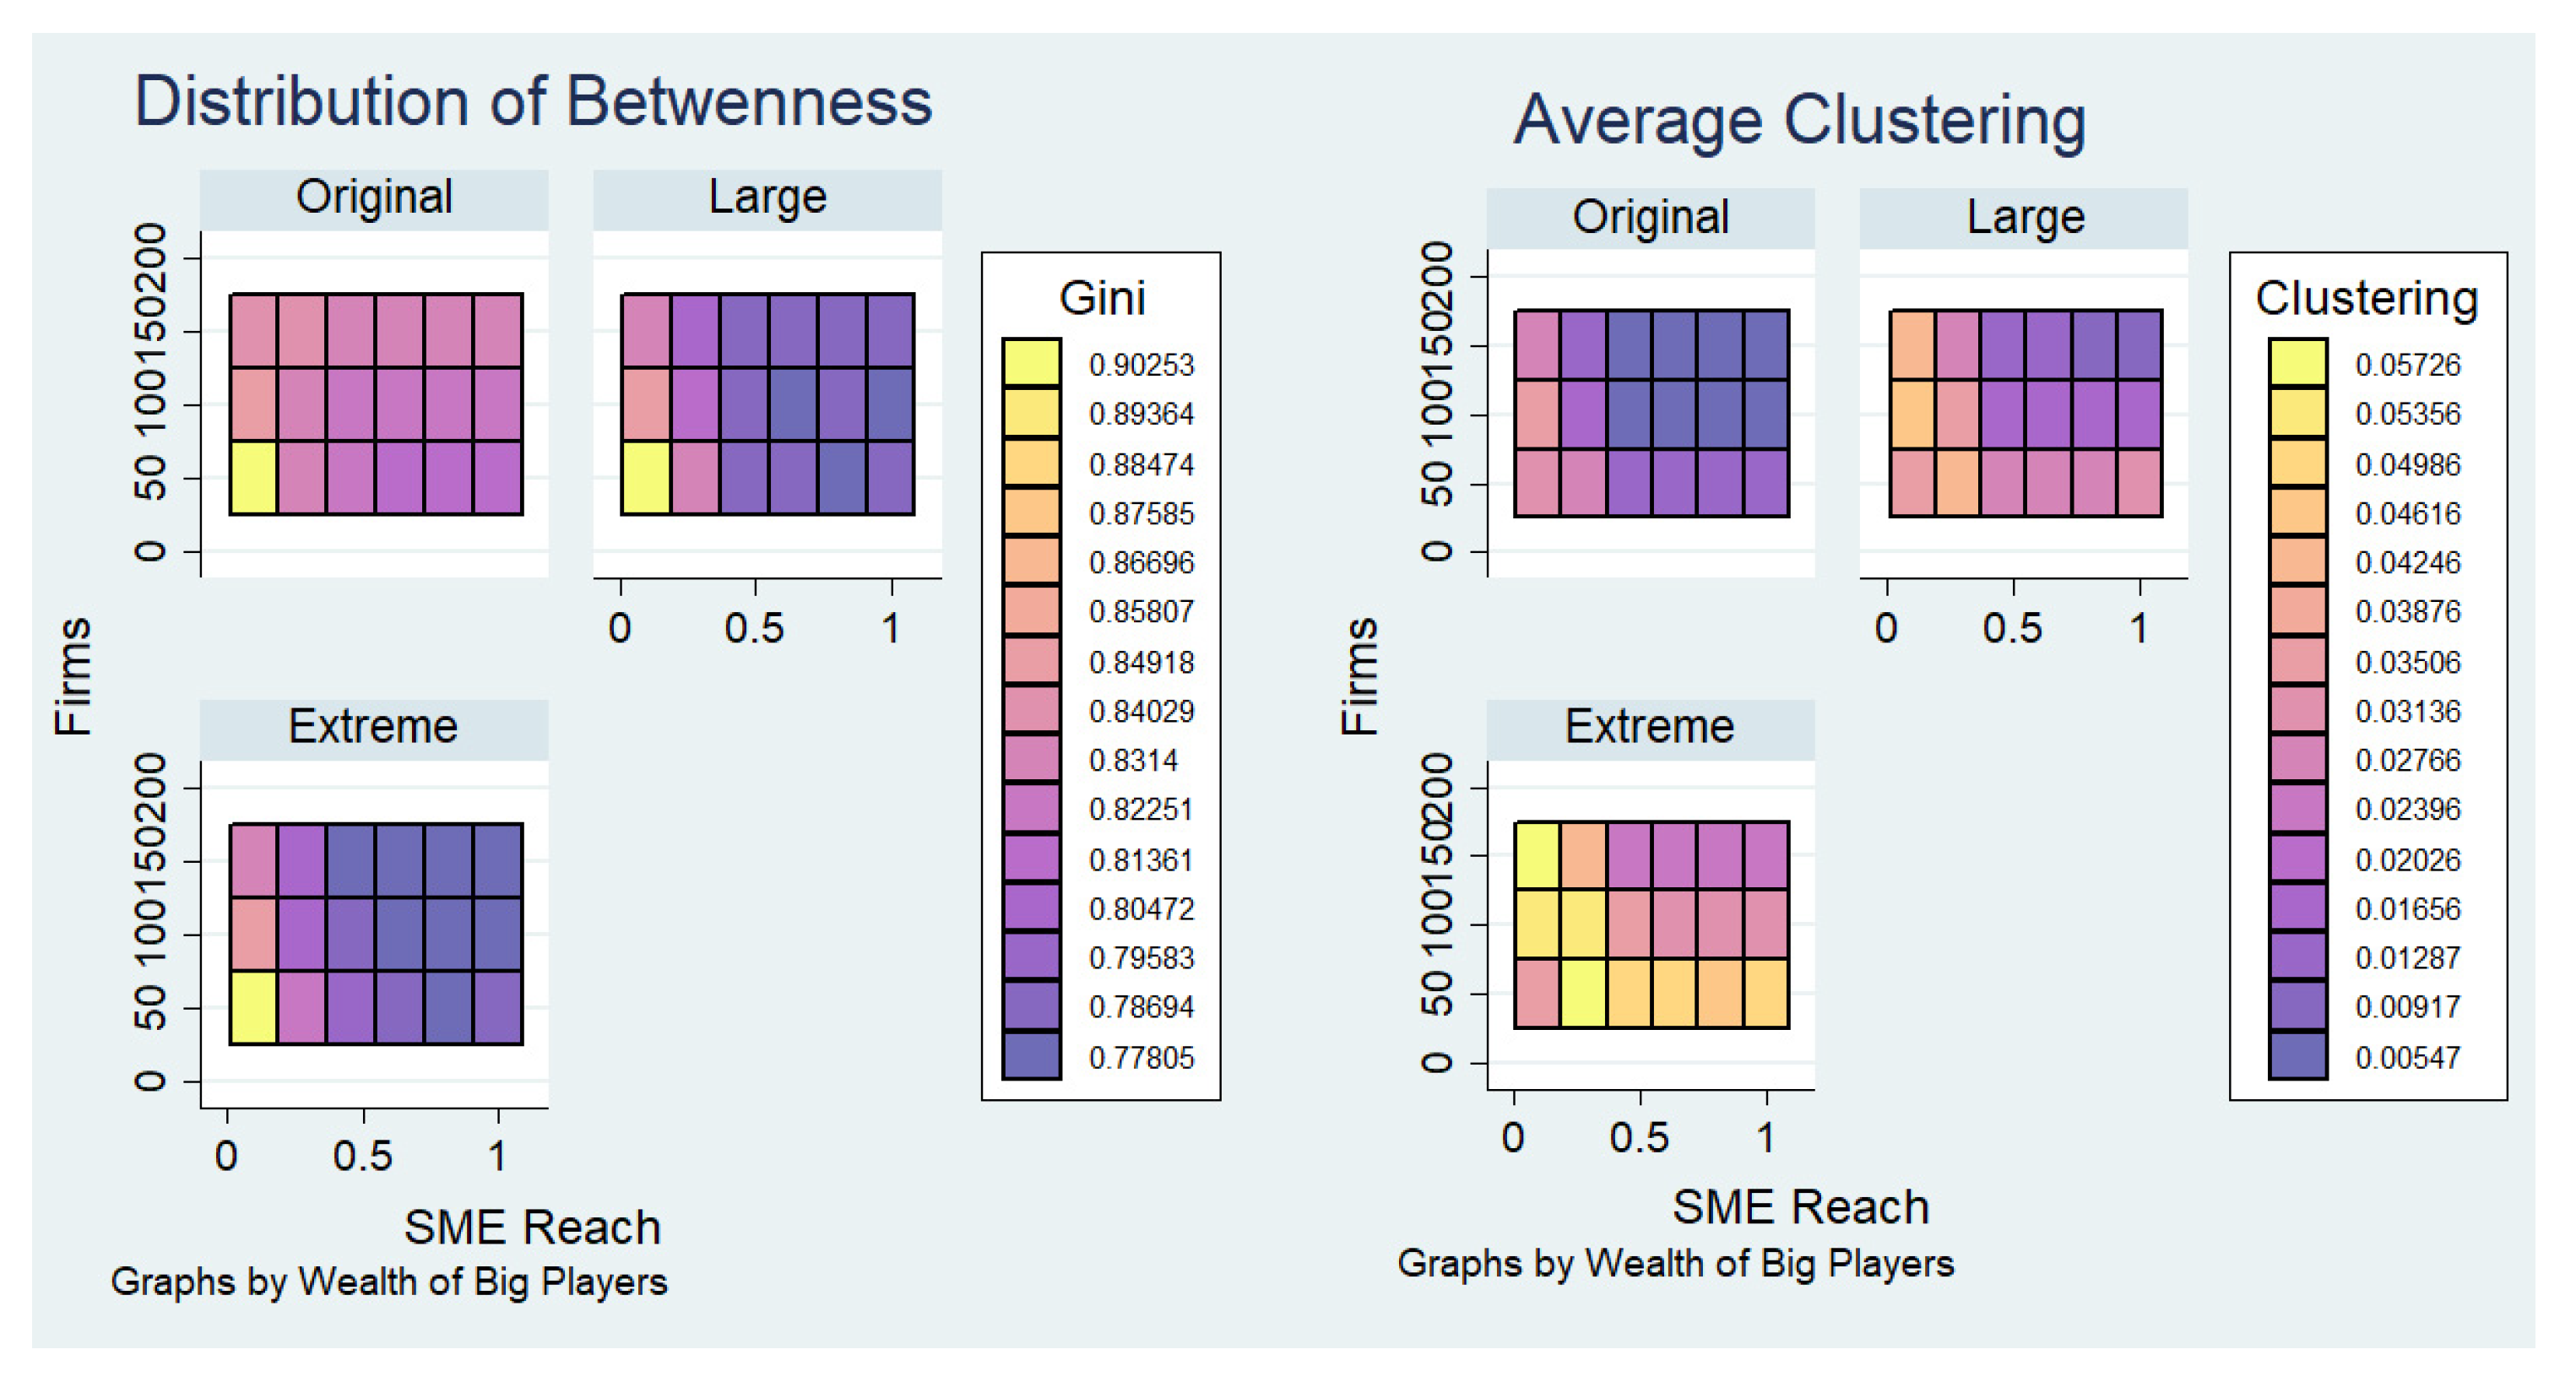
Lastly, the presence of LFs alters the network structure (Figure A3). Counterintuitively, the presence of LFs does not lead to a network topology in which there are few more central players. On the other hand, we observe how the distribution of centrality is more uniform with the presence of LFs. This effect becomes stronger as the platform scale increases. Intuitively, the presence of LFs allows companies to finance their projects more easily than when they need to rely on different peers, which implies that they may have free resources that they can allocate to invest in themselves or others later on. However, when we look at the average clustering, we observe that the presence of LFs leads to a more closely-knit network. The lenders of a given firm are more likely to have lending relationships with each other. In other words, although LFs do not become central, they may create communities around them.
Figure A3. Network characteristics with LFs (big players).
Systems 10 00155 g0a3

Appendix B. Model Extension. External Market Interest Rate Is Endogenous

In this model extension, the interest rate of the external market is determined by a simple linear function of the available liquidity. This assumes that the platform affects the external market. Formally, i = a + b L c , where “L” is the total liquidity of the market, with a = 0, b = 1, c = −1. The extension provides some new results and insights.
The creation of more loans impacts those involved in the transaction and the market on and off the platform. As more firms rely on P2P lending, more resources become available, which reduces the interest on those contracts, as shown on the right side of Figure A4. The same effect occurs in the external market (left side), but what is more interesting is that interests are higher within the platform (right side). This is a consequence of two assumptions. First, firms in the P2P network can only use their liquidity to invest in other peers or the external market. A necessary condition to invest in other peers is that they provide a higher return than the open market. On the other hand, we assume that to find resources for their investment opportunities, firms can only rely on their peers because those investments are too risky for other players outside the platform (e.g., banks).
Figure A4. Market interest (outside the platform), and Loan Interest on the P2P lending platform.
Systems 10 00155 g0a4
As the platform grows, this reduction of interest implies more loans and more investment on the platform (Figure A5). In Figure A5 (right), we observe that the increase in the number of firms or their reach implies an increase in the ratio of loans to insurance. In other words, as interest rates are reduced, exposure to external risks is reduced, which limits the extent to which companies use insurance. These results suggest that a P2P lending network not only reduces the funding costs of its peers, but also fosters the creation of more loans and higher levels of investment.
Figure A5. Business opportunities created by the platform.
Systems 10 00155 g0a5
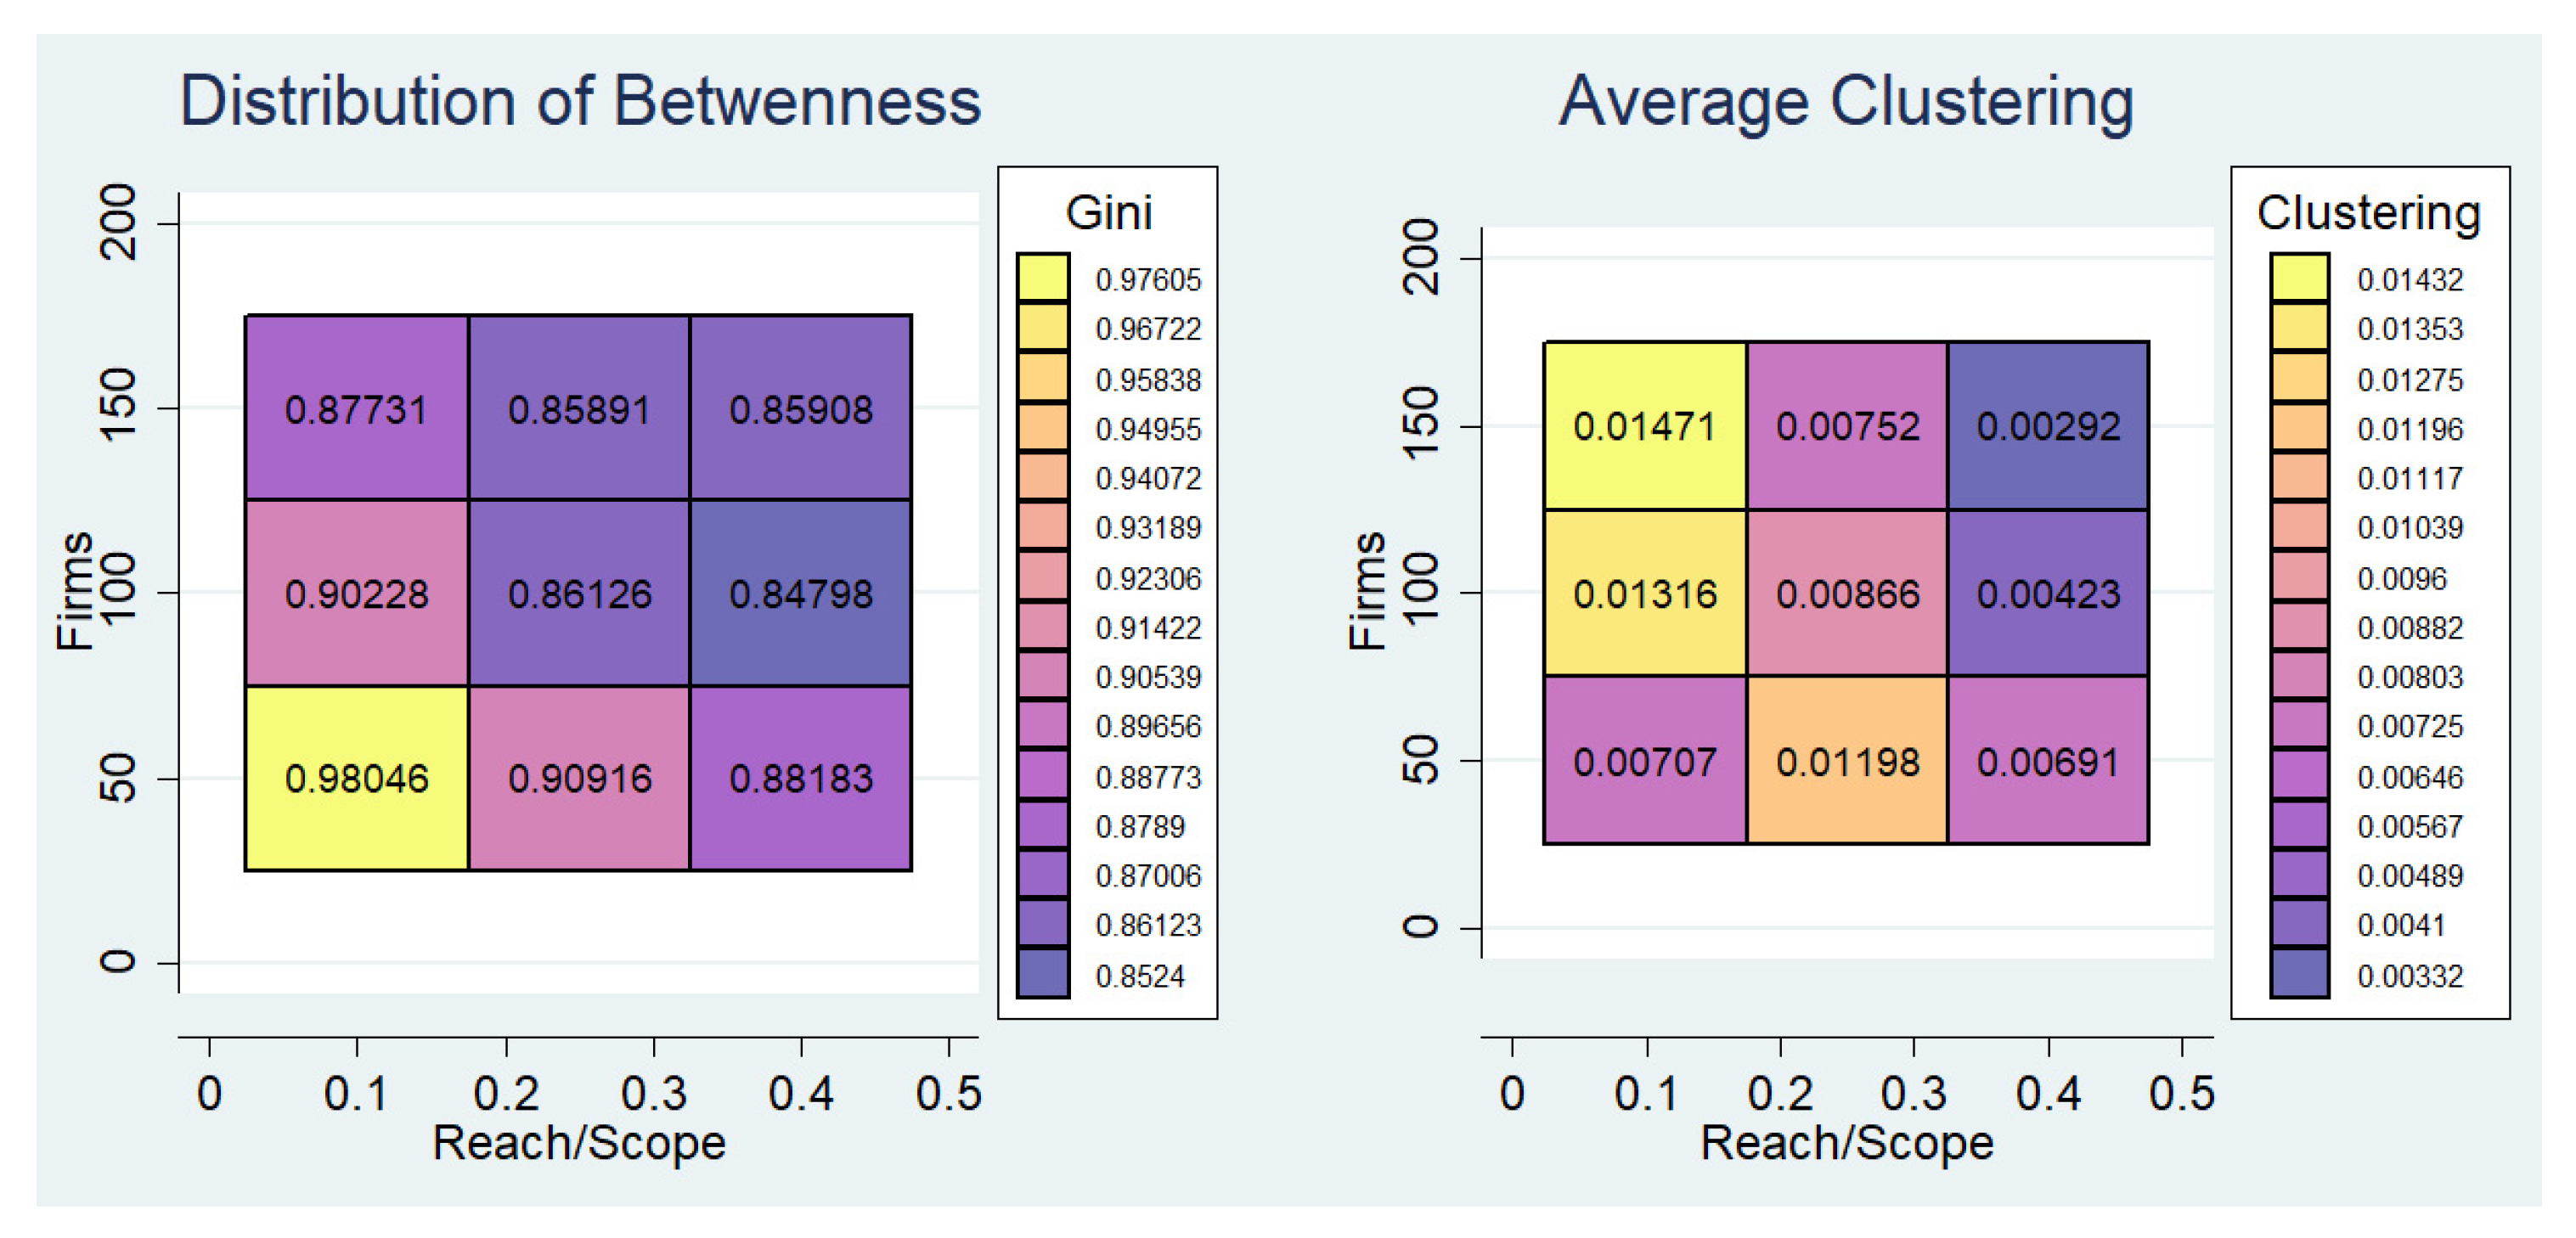
As platform scale and agent reach increase, debts and investment become more evenly distributed among peers (Figure A6). Nonetheless, it is interesting to highlight that the number of firms would be the leading force driving the market towards a more egalitarian share of investments. Figure A7 summarizes the two network metrics that help characterize the endogenous networks formed on the platform. We observe that either increasing the platform scale or increasing the SME reach makes centrality more evenly distributed.
Figure A6. Endogenous inequality created by the platform.
Systems 10 00155 g0a6
Figure A7. Loan network characteristics.
Systems 10 00155 g0a7

References

  1. Alt, R.; Zimmermann, H.-D. Electronic Markets on platform competition. Electron. Mark. 2019, 29, 143–149. [Google Scholar] [CrossRef]
  2. Parker, G.; Van Alstyne, M.; Choudary, S. Platform Revolution; W.W. Norton & Company: New York, NY, USA, 2016; ISBN 9780393249132. [Google Scholar]
  3. Cáamara, N.; Tuesta, D. Measuring Financial Inclusion: A Multidimensional Index; BBVA Research Working Paper; BBVA: Bilbao, Spain, 2014. [Google Scholar]
  4. Grow, A.; Van Bavel, J. Assortative mating and the reversal of gender inequality in education in Europe: An agent-based model. PLoS ONE 2015, 10, e0127806. [Google Scholar] [CrossRef] [PubMed]
  5. Cardaci, A.; Saraceno, F. Inequality, Financialisation and economic crises: An agent-based model. Work. Pap. 2015. [Google Scholar]
  6. Frost, J. The Economic Forces Driving Fintech Adoption across Countries; Bank for International Settlements (“BIS”): Basel, Switzerland, 2020. [Google Scholar]
  7. Gomber, P.; Kauffman, R.J.; Parker, C.; Weber, B.W. On the Fintech Revolution: Interpreting the Forces of Innovation, Disruption, and Transformation in Financial Services. J. Manag. Inf. Syst. 2018, 35, 220–265. [Google Scholar] [CrossRef]
  8. Gomber, P.; Kauffman, R.J.; Parker, C.; Weber, B.W. Special Issue: Financial Information Systems and the Fintech Revolution. J. Manag. Inf. Syst. 2018, 35, 12–18. [Google Scholar] [CrossRef]
  9. Jagtiani, J.; Lemieux, C. Fintech Lending: Financial Inclusion, Risk Pricing, and Alternative Information Federal Reserve Bank of Philadelphia; Working Paper; Federal Reserve Bank of Philadelphia: Philadelphia, PA, USA, 2017. [Google Scholar]
  10. Berg, T.; Fuster, A.; Puri, M. Fintech Lending; NBER Working Paper Series; NBER: Cambridge, MA, USA, 2021. [Google Scholar]
  11. Ribeiro-Navarrete, S.; Piñeiro-Chousa, J.; Ángeles López-Cabarcos, M.; Palacios-Marqués, D. Crowdlending: Mapping the core literature and research frontiers. Rev. Manag. Sci. 2021, 1–31. [Google Scholar] [CrossRef]
  12. Katsamakas, E.; Sun, H. Machine Learning Crowdfunding. Int. J. Knowl.-Based Organ. 2020, 10, 1–11. [Google Scholar] [CrossRef]
  13. Belleflamme, P.; Lambert, T.; Schwienbacher, A. Crowdfunding: Tapping the right crowd. J. Bus. Ventur. 2014, 29, 585–609. [Google Scholar] [CrossRef]
  14. Belleflamme, P.; Omrani, N.; Peitz, M. Understanding the Strategies of Crowdfunding Platforms; Leibniz-Institut für Wirtschaftsforschung an der Universität München: Munich, Germany, 2016; Volume 2. [Google Scholar]
  15. Zhao, H.; Ge, Y.; Liu, Q.; Wang, G.; Chen, E.; Zhang, H. P2P lending survey: Platforms, recent advances and prospects. ACM Trans. Intell. Syst. Technol. 2017, 8, 1–28. [Google Scholar] [CrossRef]
  16. Serrano-Cinca, C.; Gutiérrez-Nieto, B.; López-Palacios, L. Determinants of Default in P2P Lending. PLoS ONE 2015, 10, e0139427. [Google Scholar] [CrossRef]
  17. Chen, Y.-R.; Leu, J.-S.; Huang, S.-A.; Wang, J.-T.; Takada, J.-I. Predicting Default Risk on Peer-to-Peer Lending Imbalanced Datasets. IEEE Access 2021, 9, 73103–73109. [Google Scholar] [CrossRef]
  18. Zeng, X.; Liu, L.; Leung, S.; Du, J.; Wang, X.; Li, T. A decision support model for investment on P2P lending platform. PLoS ONE 2017, 12, e0184242. [Google Scholar] [CrossRef]
  19. Wang, C.; Han, D.; Liu, Q.; Luo, S. A Deep Learning Approach for Credit Scoring of Peer-to-Peer Lending Using Attention Mechanism LSTM. IEEE Access 2019, 7, 2161–2168. [Google Scholar] [CrossRef]
  20. Ariza-Garzón, M.J.; Camacho-Miñano, M.D.M.; Segovia-Vargas, M.J.; Arroyo, J. Risk-return modelling in the p2p lending market: Trends, gaps, recommendations and future directions. Electron. Commer. Res. Appl. 2021, 49, 101079. [Google Scholar] [CrossRef]
  21. Basha, S.A.; Elgammal, M.M.; Abuzayed, B.M. Online peer-to-peer lending: A review of the literature. Electron. Commer. Res. Appl. 2021, 48, 101069. [Google Scholar] [CrossRef]
  22. Milne, A.; Parboteeah, P. The Business Models and Economics of Peer-to-Peer Lending. SSRN Electron. J. 2016. [Google Scholar] [CrossRef]
  23. Bruton, G.; Khavul, S.; Siegel, D.; Wright, M. New financial alternatives in seeding entrepreneurship: Microfinance, crowdfunding, and peer-to-peer innovations. Entrep. Theory Pract. 2015, 39, 9–26. [Google Scholar] [CrossRef]
  24. Abbasi, K.; Alam, A.; Brohi, N.A.; Brohi, I.A.; Nasim, S. P2P lending Fintechs and SMEs’ access to finance. Econ. Lett. 2021, 204, 109890. [Google Scholar] [CrossRef]
  25. Nemoto, N.; Huang, B.; Storey, D.J. Optimal Regulation of P2P Lending for Small and Medium-Sized Enterprises. SSRN Electron. J. 2019. [Google Scholar] [CrossRef]
  26. Cumming, D.J.; Hornuf, L. Marketplace Lending of SMEs. SSRN Electron. J. 2021. [Google Scholar] [CrossRef]
  27. Au, C.H.; Sun, Y. The development of P2P lending platforms: Strategies and implications. In Proceedings of the 40th International Conference on Information Systems, ICIS 2019, Munich, Germany, 15–18 December 2019. [Google Scholar]
  28. Au, C.H.; Tan, B.; Sun, Y. Developing a P2P lending platform: Stages, strategies and platform configurations. Internet Res. 2020. ahead-of-print. [Google Scholar] [CrossRef]
  29. Lin, M.; Prabhala, N.R.; Viswanathan, S. Judging borrowers by the company they keep: Friendship networks and information asymmetry in online peer-to-peer lending. Manag. Sci. 2013, 59, 17–35. [Google Scholar] [CrossRef]
  30. Liu, D.; Brass, D.J.; Lu, Y.; Chen, D. Friendships in online peer-to-peer lending: Pipes, prisms, and relational herding. MIS Q. 2015, 39, 729–742. [Google Scholar] [CrossRef]
  31. Freedman, S.; Jin, G.Z. The information value of online social networks: Lessons from peer-to-peer lending. Int. J. Ind. Organ. 2017, 51, 185–222. [Google Scholar] [CrossRef]
  32. Lee, E.; Lee, B. Herding behavior in online P2P lending: An empirical investigation. Electron. Commer. Res. Appl. 2012, 11, 495–503. [Google Scholar] [CrossRef]
  33. Yum, H.; Lee, B.; Chae, M. From the wisdom of crowds to my own judgment in microfinance through online peer-to-peer lending platforms. Electron. Commer. Res. Appl. 2012, 11, 469–483. [Google Scholar] [CrossRef]
  34. Cai, S.; Lin, X.; Xu, D.; Fu, X. Judging online peer-to-peer lending behavior: A comparison of first-time and repeated borrowing requests. Inf. Manag. 2016, 53, 857–867. [Google Scholar] [CrossRef]
  35. Worldbank Financial Inclusion Overview. Available online: https://www.worldbank.org/en/topic/financialinclusion/overview (accessed on 16 August 2022).
  36. Ozili, P.K. Financial inclusion research around the world: A review. Forum Soc. Econ. 2021, 50, 457–479. [Google Scholar] [CrossRef]
  37. Gálvez-Sánchez, F.J.; Lara-Rubio, J.; Verdú-Jóver, A.J.; Meseguer-Sánchez, V. Research Advances on Financial Inclusion: A Bibliometric Analysis. Sustainability 2021, 13, 3156. [Google Scholar] [CrossRef]
  38. Tram, T.X.H.; Lai, T.D.; Nguyen, T.T.H. Constructing a composite financial inclusion index for developing economies. Q. Rev. Econ. Financ. 2021, in press. [Google Scholar] [CrossRef]
  39. Philippon, T. On Fintech and Financial Inclusion; NBER Working Paper Series; NBER: Cambridge, MA, USA, 2019. [Google Scholar]
  40. Arner, D.W.; Buckley, R.P.; Zetzsche, D.A.; Veidt, R. Sustainability, FinTech and Financial Inclusion. Eur. Bus. Organ. Law Rev. 2020, 21, 7–35. [Google Scholar] [CrossRef]
  41. Gabor, D.; Brooks, S. The digital revolution in financial inclusion: International development in the fintech era. New Polit. Econ. 2017, 22, 423–436. [Google Scholar] [CrossRef]
  42. Sahay, R.; von Allmen, U.E.; von Lahreche, A.; Khera, P.; Ogawa, S.; Bazarbash, M.; Beaton, K. The Promise of Fintech: Financial Inclusion in the Post COVID-19 Era; International Monetary Fund: Wasington, DC, USA, 2020. [Google Scholar]
  43. Demir, A.; Pesqué-Cela, V.; Altunbas, Y.; Murinde, V. Fintech, financial inclusion and income inequality: A quantile regression approach. Eur. J. Financ. 2020, 28, 86–107. [Google Scholar] [CrossRef]
  44. Kling, G.; Pesqué-Cela, V.; Tian, L.; Luo, D. A theory of financial inclusion and income inequality. Eur. J. Financ. 2022, 28, 137–157. [Google Scholar] [CrossRef]
  45. Panos, G.A.; Wilson, J.O.S. Financial literacy and responsible finance in the FinTech era: Capabilities and challenges. Eur. J. Financ. 2020, 26, 297–301. [Google Scholar] [CrossRef]
  46. Schuetz, S.; Venkatesh, V. Blockchain, adoption, and financial inclusion in India: Research opportunities. Int. J. Inf. Manag. 2020, 52, 101936. [Google Scholar] [CrossRef]
  47. Makina, D. The Potential of FinTech in Enabling Financial Inclusion. In Extending Financial Inclusion in Africa; Academic Press: Cambridge, MA, USA, 2019; pp. 299–318. ISBN 9780128142035. [Google Scholar]
  48. Joia, L.A.; Cordeiro, J.P.V. Unlocking the potential of fintechs for financial inclusion: A delphi-based approach. Sustainability 2021, 13, 11675. [Google Scholar] [CrossRef]
  49. Kanungo, R.P.; Gupta, S. Financial inclusion through digitalisation of services for well-being. Technol. Forecast. Soc. Chang. 2021, 167, 120721. [Google Scholar] [CrossRef]
  50. Senyo, P.; Osabutey, E.L.C. Unearthing antecedents to financial inclusion through FinTech innovations. Technovation 2020, 98, 102155. [Google Scholar] [CrossRef]
  51. Ge, R.; Zheng, Z.; Tian, X.; Liao, L. Human-robot interaction: When investors adjust the usage of robo-advisors in peer-to-peer lending. Inf. Syst. Res. 2021, 32, 774–785. [Google Scholar] [CrossRef]
  52. Maskara, P.K.; Kuvvet, E.; Chen, G. The Role of P2P Platforms in Enhancing Financial Inclusion in US—An Analysis of Peer-to-Peer Lending Across the Rural-Urban Divide. Financ. Manag. 2020, 50, 747–774. [Google Scholar] [CrossRef]
  53. Ravishankar, M.N. Social innovations and the fight against poverty: An analysis of India’s first prosocial P2P lending platform. Inf. Syst. J. 2021, 31, 745–766. [Google Scholar] [CrossRef]
  54. Berentsen, A.; Markheim, M. Peer-to-Peer Lending and Financial Inclusion with Altruistic Investors. Int. Rev. Financ. 2021, 21, 1407–1418. [Google Scholar] [CrossRef]
  55. Deng, J. The crowding-out effect of formal finance on the P2P lending market: An explanation for the failure of China’s P2P lending industry. Financ. Res. Lett. 2022, 45, 102167. [Google Scholar] [CrossRef]
  56. Klein, G.; Shtudiner, Z.; Zwilling, M. Why do peer-to-peer (P2P) lending platforms fail? The gap between P2P lenders’ preferences and the platforms’ intentions. Electron. Commer. Res. 2021. [Google Scholar] [CrossRef]
  57. Burtch, G.; Ghose, A.; Wattal, S. Cultural Differences and Geography as Determinants of Online Prosocial Lending. MIS Q. 2014, 38, 773–794. [Google Scholar] [CrossRef]
  58. Lin, M.; Viswanathan, S. Home Bias in Online Investments: An Empirical Study of an Online Crowdfunding Market. Manag. Sci. 2015, 62, 1393–1414. [Google Scholar] [CrossRef]
  59. Singh, P.; Uparna, J.; Karampourniotis, P.; Horvat, E.-A.; Szymanski, B.; Korniss, G.; Bakdash, J.Z.; Uzzi, B. Peer-to-peer lending and bias in crowd decision-making. PLoS ONE 2018, 13, e0193007. [Google Scholar] [CrossRef] [PubMed]
  60. Fanta, A.B.; Makina, D. Unintended Consequences of Financial Inclusion. In Extending Financial Inclusion in Africa; Academic Press: Cambridge, MA, USA, 2019; pp. 231–256. ISBN 9780128142035. [Google Scholar]
  61. Igra, M.; Kenworthy, N.; Luchsinger, C.; Jung, J.K. Crowdfunding as a response to COVID-19: Increasing inequities at a time of crisis. Soc. Sci. Med. 2021, 282, 114105. [Google Scholar] [CrossRef] [PubMed]
  62. Kollenda, P. Financial returns or social impact? What motivates impact investors’ lending to firms in low-income countries. J. Bank. Financ. 2021, 136, 106224. [Google Scholar] [CrossRef]
  63. Haki, K.; Beese, J.; Aier, S.; Winter, R. The evolution of information systems architecture: An agent-based simulation model. MIS Q. Manag. Inf. Syst. 2020, 44, 155–184. [Google Scholar] [CrossRef]
  64. Zhang, M.; Chen, H.; Lyytinen, K. Validating the coevolutionary principles of business and IS alignment via agent-based modeling. Eur. J. Inf. Syst. 2020, 30, 496–511. [Google Scholar] [CrossRef]
  65. Fischbach, K.; Marx, J.; Weitzel, T. Agent-based modeling in social sciences. J. Bus. Econ. 2021, 91, 1263–1270. [Google Scholar] [CrossRef]
  66. Macal, C.M. Everything you need to know about agent-based modelling and simulation. J. Simul. 2016, 10, 144–156. [Google Scholar] [CrossRef]
  67. Rand, W.; Stummer, C. Agent-based modeling of new product market diffusion: An overview of strengths and criticisms. Ann. Oper. Res. 2021, 305, 425–447. [Google Scholar] [CrossRef]
  68. Arthur, W.B. Foundations of complexity economics. Nat. Rev. Phys. 2021, 3, 136–145. [Google Scholar] [CrossRef]
  69. Axtell, R.L.; Farmer, J.D. Agent-Based Modeling in Economics and Finance: Past, Present, and Future; Working Paper GMU and SFI; Institute for New Economic Thinking at the Oxford Martin School, University of Oxford: Oxford, UK, 2018. [Google Scholar]
  70. Tesfatsion, L. Agent-based computational economics: Modeling economies as complex adaptive systems. Inf. Sci. 2003, 149, 263–269. [Google Scholar] [CrossRef]
  71. Wu, S.; Mu, P.; Shen, J.; Wang, W. An incentive mechanism model of credit behavior of SMEs based on the perspective of credit default swaps. Complexity 2020, 2020, 6639636. [Google Scholar] [CrossRef]
  72. Frick, W. Corporate Inequality Is the Defining Fact of Business Today. Available online: https://hbr.org/2016/05/corporate-inequality-is-the-defining-fact-of-business-today (accessed on 16 August 2022).
  73. Armstrong, M.; Vickers, J. Patterns of Competitive Interaction. Econometrica 2022, 90, 153–191. [Google Scholar] [CrossRef]
  74. Shang, Y. An agent based model for opinion dynamics with random confidence threshold. Commun. Nonlinear Sci. Numer. Simul. 2014, 19, 3766–3777. [Google Scholar] [CrossRef]
  75. Casner, B. Seller curation in platforms. Int. J. Ind. Organ. 2020, 72, 102659. [Google Scholar] [CrossRef]
  76. Dowling, M.; O’Gorman, C.; Puncheva, P.; Vanwalleghem, D. Trust and SME attitudes towards equity financing across Europe. J. World Bus. 2019, 54, 101003. [Google Scholar] [CrossRef]
  77. Farris, F.A. The Gini index and measures of inequality. Am. Math. Mon. 2010, 117, 851–864. [Google Scholar] [CrossRef]
  78. Shang, Y. A note on the H index in random networks. J. Math. Sociol. 2018, 42, 77–82. [Google Scholar] [CrossRef]
  79. Identity Review Top Six Decentralized Lending Platforms. Available online: https://identityreview.com/top-six-decentralized-lending-platforms/ (accessed on 17 March 2022).
  80. Veiga, A.; Weyl, E.G.; White, A. Multidimensional Platform Design. Am. Econ. Rev. 2017, 107, 191–195. [Google Scholar] [CrossRef]
  81. Teh, T.-H. Platform Governance. Am. Econ. J. Microecon. 2021, 14, 213–254. [Google Scholar] [CrossRef]
  82. Valletti, T.; Prat, A. Attention oligopoly. Am. Econ. J. Microecon. 2021, 14, 530–557. [Google Scholar]
  83. Yan, Y.; Lv, Z.; Hu, B. Building investor trust in the P2P lending platform with a focus on Chinese P2P lending platforms. Electron. Commer. Res. 2018, 18, 203–224. [Google Scholar] [CrossRef]
  84. Chen, D.; Lai, F.; Lin, Z. A trust model for online peer-to-peer lending: A lender’s perspective. Inf. Technol. Manag. 2014, 15, 239–254. [Google Scholar] [CrossRef]
  85. Dorfleitner, G.; Oswald, E.M.; Zhang, R. From Credit Risk to Social Impact: On the Funding Determinants in Interest-Free Peer-to-Peer Lending. J. Bus. Ethics 2019, 170, 375–400. [Google Scholar] [CrossRef]
  86. Lagna, A.; Ravishankar, M.N. Making the world a better place with fintech research. Inf. Syst. J. 2022, 32, 61–102. [Google Scholar] [CrossRef]
  87. Croxson, K.; Frost, J.; Gambacorta, L.; Valletti, T. Platform-Based Business Models and Financial Inclusion; BIS Working Papers; BIS: Basel, Switzerland, 2022. [Google Scholar]
  88. Katsamakas, E.; Miliaresis, K.; Pavlov, O. V Digital Platforms for the Common Good: Social Innovation for Active Citizenship and ESG. Sustainability 2022, 14, 639. [Google Scholar] [CrossRef]
  89. Bonina, C.; Koskinen, K.; Eaton, B.; Gawer, A. Digital platforms for development: Foundations and research agenda. Inf. Syst. J. 2021, 31, 869–902. [Google Scholar] [CrossRef]
  90. MacCrory, F.; Katsamakas, E. Competition of Multi-Platform Ecosystems in the IoT. SSRN Electron. J. 2021, 1–52. [Google Scholar] [CrossRef]
  91. Jacobides, M.G.; Cennamo, C.; Gawer, A. Towards a theory of ecosystems. Strateg. Manag. J. 2018, 39, 2255–2276. [Google Scholar] [CrossRef]
  92. Liu, J.; Dong, J. A multi-agent simulation of investment choice in the P2P lending market with bankruptcy risk. J. Simul. 2022, 16, 32–146. [Google Scholar] [CrossRef]
  93. Sanchez-Cartas, J.M.; Katsamakas, E. Artificial Intelligence, Algorithmic Competition and Market Structures. IEEE Access 2022, 10, 10575–10584. [Google Scholar] [CrossRef]
  94. Sanchez-Cartas, J.M.; Katsamakas, E. Effects of Algorithmic Pricing on Platform Competition. SSRN Electron. J. 2022. [Google Scholar] [CrossRef]
  95. Beese, J.; Haki, M.K.; Aier, S.; Winter, R. Simulation-Based Research in Information Systems: Epistemic Implications and a Review of the Status Quo. Bus. Inf. Syst. Eng. 2019, 61, 503–521. [Google Scholar] [CrossRef]
  96. Pavlov, O.V.; Katsamakas, E. Will colleges survive the storm of declining enrollments? A computational model. PLoS ONE 2020, 15, e0236872. [Google Scholar] [CrossRef]
  97. Georgantzas, N.C.; Katsamakas, E. Information systems research with system dynamics. Syst. Dyn. Rev. 2008, 24, 274–284. [Google Scholar] [CrossRef]
  98. Georgantzas, N.C.; Katsamakas, E.G. Performance effects of information systems integration: A system dynamics study in a media firm. Bus. Process Manag. J. 2010, 16, 822–846. [Google Scholar] [CrossRef]
  99. Rahmandad, H.; Sterman, J. Heterogeneity and Network Structure in the Dynamics of Diffusion: Comparing Agent-Based and Differential Equation Models. Manage. Sci. 2008, 54, 998–1014. [Google Scholar] [CrossRef] [Green Version]
Figure 1. Agent behavioral rules model flowchart.
Systems 10 00155 g001
Figure 2. Average loan interest on the platform.
Systems 10 00155 g002
Figure 3. Business opportunities created by the platform.
Systems 10 00155 g003
Figure 4. Ratio Loans/Insurance at different interest levels.
Systems 10 00155 g004
Figure 5. Endogenous inequality created by the platform.
Systems 10 00155 g005
Figure 6. Inequality of access to funding (comparing cases of insurance allowed or not).
Systems 10 00155 g006
Figure 7. Loan network characteristics (comparison of cases with insurance allowed or not).
Systems 10 00155 g007
Figure 8. Network simulation visualization with loans in orange and insurance in blue. The size of a node represents its network degree (number of neighbors). (100 SMEs, 3.5% market interest rate, SME reach at 40%).
Systems 10 00155 g008
Table 1. Selected platform and SME (agent) model attributes.
Platform Attributes
Platform ScaleNNumber of agents (SMEs) on the platform
SME ReachR% of other agents reachable by an SME
Maximum Risk ThresholdXMaximum loan risk allowed on the platform
Insurance The platform may offer an insurance product
Loans{Lij}Set of all loans created on the platform (a loan is from agent i to agent j)
SME (agent i) attributes
Investment opportunity An agent may come up with an investment idea during the simulation, and may need to borrow through the platform
Liquidity An agent may acquire liquidity during the simulation, which may be given to another agent as a loan that earns income
Risk thresholdriMaximum risk the agent i is willing to accept as a lender
SME Risk Metric
(Platform calculates and makes visible to all agents on the platform)
RMitRiskiness of agent i as a borrower in period t
(TotalAssetsit/TotalLiabilitiesit)
Table 2. Average number of loans (= lending network links) per case. Standard deviation in parenthesis.
Risk Threshold (%) and SME ReachPlatform Scale (N)
50100150
Risk Threshold: 0.5
0.137.90 (5.03)99.29 (9.08)160.62 (12.79)
0.253.21 (7.68)113.69 (12.70)172.82 (15.72)
0.456.66 (9.40)115.52 (13.70)173.78 (16.27)
0.656.97 (9.54)115.58 (13.10)173.55 (16.46)
0.857.12 (9.36)115.46 (13.82)173.78 (16.05)
156.78 (9.27)115.84 (13.02)174.02 (16.67)
Risk Threshold: 0.7
0.139.83 (5.44)104.75 (9.99)170.87 (14.55)
0.257.40 (8.76)122.61 (13.99)185.97 (18.12)
0.461.20 (10.35)123.97 (14.93)186.92 (18.86)
0.661.22 (10.78)124.63 (15.18)187.00 (18.55)
0.860.88 (10.62)124.93 (15.90)187.11 (18.79)
161.37 (10.75)124.00 (15.50)185.67 (18.46)
Risk Threshold: 1
0.140.84 (5.61)108.85 (10.49)178.80 (15.10)
0.259.72 (9.18)129.09 (15.16)195.90 (20.00)
0.464.73 (11.38)131.73 (16.35)197.66 (20.32)
0.664.81 (11.79)131.81 (17.12)198.09 (20.36)
0.864.57 (11.67)132.26 (16.70)197.35 (21.00)
164.64 (11.73)132.36 (16.68)197.76 (21.16)
Publisher’s Note: MDPI stays neutral with regard to jurisdictional claims in published maps and institutional affiliations.