1. Introduction
Since the reform and opening up, China’s economy has achieved rapid development and people’s living standards have been generally improved. However, high-speed growth economic development has been achieved at the expense of high-efficiency resource utilization and the sustainable development of the environment; as a result, economic development problems with unbalanced economic structure development, relatively low quality and efficiency, and insufficient innovation drive have emerged under this economic development model, forcing economic development to transform into a high-quality development direction [
1,
2]. High-quality economic development, as a new multidimensional and comprehensive development concept integrating innovation, coordination, greenness, openness, and sharing, emphasizes the quality, high efficiency, and sustainable development of economic development behavior, which plays a vital role in promoting the construction of the modern economic system and modern industrial system [
3,
4,
5,
6,
7]. The transition from a high growth rate to a high-quality economic development is the sign that a country has entered a new stage of development, which is also the stage that China’s economic development is going through [
8]. High-quality economic development is not only a strategic goal for China’s economic development, but also a future direction of economic development that the world needs to consider.
The quality of economic development involves three levels: micro (product quality, enterprise quality), meso (industrial development quality, industrialization quality), and macro (economic development quality, national economic operation quality), and since enterprises are the micro main body of macro economy and also the basic organization of meso industrial development, therefore, high-quality economic development is the high-quality development of enterprises. Enterprises play a leading role in the transformation process of economic structure, quality and efficiency, and innovation power, and are the key elements to achieve high-quality economic development. However, at present, most of the research on high-quality economic development is focused on the macro level, such as the analysis of value theory, institutional logic, basic characteristics, and supporting elements of high-quality economic development, but there is a lack of in-depth investigation on the micro level, the complete system of high-quality development and the influence mechanism of high-quality economic development [
5,
9,
10,
11,
12,
13,
14,
15,
16]. As a carrier of high-quality economic development, the characteristics of enterprises are important factors influencing their high-quality development. Therefore, exploring the influence mechanism of an enterprise’s characteristics on its high-quality development and providing strong support for the high-quality economic development is an important issue that needs to be solved in China and the world at present.
The property structure of an enterprise is an important indicator that affects its high-quality development, and the value of an enterprise will be affected by factors such as its management capability, innovation capability, and external environment [
15]. Chinese enterprises can be divided into two categories according to their nature, state-owned enterprises and private enterprises, and there are large essential differences in their property structures, thus requiring the construction of different evaluation methods for the high-quality development of enterprises and revealing the key factors affecting their high-quality development. Traditional methods for constructing association models between enterprise characteristics and their high-quality development are mainly based on linear or functional analysis [
17,
18,
19]. Although this method can visualize the degree of influence of each factor, the regression accuracy is not good for large sample data, and thus the research results will have some deviation from the actual situation. Recently, machine learning techniques can accurately explore the intrinsic correlation between independent variables and dependent variables based on the available sample data, and can make systematic classification and accurate predictions, which are widely used in the fields of engineering, economics, and sociology [
20,
21,
22]. Especially in the field of economics, for the basis of easily available large sample data, machine learning has its unique advantages over traditional econometric methods and has significantly improved the regression effect and prediction performance. For example, some scholars have applied machine learning techniques to the analysis of securities trading, venture capital markets, and stock forecasting in the field of economics [
23,
24,
25]. It can be seen that it is feasible and effective to use machine learning methods to construct evaluation and prediction models for the high-quality development of enterprises.
It is evident that the green and high-quality development ability of enterprises is influenced by numerous factors including property structure and innovation ability, and there is still a lack of systematic analysis and demonstration and effective evaluation methods. Based on this, to explore the core indicators affecting the high-quality development of Chinese enterprises, reveal their operation mechanism, and realize the effective evaluation of the high-quality development of enterprises, this paper attempted to use the typical characteristic covariates of environmental concern, environmental investment, and environmental advantage as enterprise high-quality development alternative indicators from two dimensions of Chinese state-owned enterprises and private enterprises. A random forest algorithm, combined with a genetic algorithm for optimization, is used to establish a correlation model between enterprise property rights structure and enterprise high-quality development evaluation indexes to analyze the key property rights structure indexes affecting enterprise high-quality development and provide an effective prediction of enterprise high-quality development capability.
2. Research Hypotheses
This paper takes the influencing factors of the green and high-quality development of enterprises as the starting point to establish a more comprehensive prediction model of enterprise development. However, due to the non-disclosure of data on the green and high-quality development of Chinese enterprises, and the empirical research on green and high-quality development of enterprises in the existing literature in China being insufficient, there are generally insufficient explanatory variables and sample numbers in these studies. Therefore, to establish an effective evaluation model for the green and high-quality development of enterprises, it is necessary to conduct a comprehensive and systematic analysis of its evaluation indicators and influencing factors.
It is not difficult to find that the evaluation index system of green and high-quality development consists of five major aspects: high-quality green development, green innovative development, green coordinated development, green open development, and green shared development. The second-level indicators are further refinements of the first-level indicators based on the scientific connotation of green and high-quality development. High-quality green development is divided into three parts: green production mode, green lifestyle, and green development performance. Green production mode mainly reflects the contribution of producers in a region to high-quality green development; green lifestyle mainly measures the degree to which the behavior of residents in a region is compatible with high-quality green development; green development performance describes the green and high-quality economic development of a region’s efficiency. The development of green innovation is carried out from the two dimensions of green technology, innovation investment and green innovation capability. Green coordinated development consists of two secondary indicators: urban–rural green development differences and inter-city green development differences. Green open development is divided into two parts: green FDI and green trade. Green shared development has two components: sharing green achievements and co-constructing green achievements. Among them, the evaluation indicators related to enterprises can be summarized into three aspects: environmental concern, environmental investment, and environmental advantage. There are many factors affecting the green and high-quality development of enterprises, but there are few commonalities in the data that have been published so far. To this end, combined with previous research, the data were sorted and screened, and after eliminating invalid data, a total of seven common influencing factors were obtained. However, the previous research conclusions of these seven influencing factors on the green and high-quality development of enterprises were not the same, so it is necessary to study them one by one. Simultaneously, for the factors affecting the green and high-quality development of enterprises, it is necessary to classify and discuss them according to the nature of the enterprise. There are mainly two categories, state-owned enterprises and private enterprises. The shared influencing factors of state-owned enterprises and private enterprises include equity balance, industry, risk management, type of equity in the top ten shareholders, patents (including the number of patents, green patents, and patent citations), digital transformation degree, total factor productivity (including OP method and LP method). Regarding the influencing factors of the green and high-quality development of enterprises, this paper mainly puts forward assumptions from the following aspects:
The status of shareholders will directly affect the development of enterprises, and the degree of equity checks and balances, closely related to shareholders, also plays an important role in the green and high-quality development of enterprises. Cai and Luo et al. [
26] conducted a related study on the proportion of executives’ equity and equity incentives on the quality of enterprise development. The research results show that there is a convex relationship between executives’ equity and the quality of enterprise development, which is too high or too low. The equity of the enterprise will affect the development of the enterprise; that is, the degree of equity balance will affect the quality of the green development of the enterprise. Similarly, Ni [
27] studied the market value of listed commercial banks using the equity balance as a variable, and found that China’s listed commercial banks appropriately reducing the state-owned shareholding ratio or seeking more control chains will help increase the bank’s market value. That is to say, a reasonable equity balance is very beneficial to the green and high-quality development of enterprises. In addition, the different nature of equity will also have an impact on the degree of equity checks and balances. Therefore, the following assumptions are made regarding the degree of equity checks and balances and the nature of equity:
Hypothesis 1. There is a convex correlation between the degree of equity checks and balances and the green and high-quality development of enterprises; that is, the lower or higher the degree of equity checks and balances is not conducive to the development of enterprises.
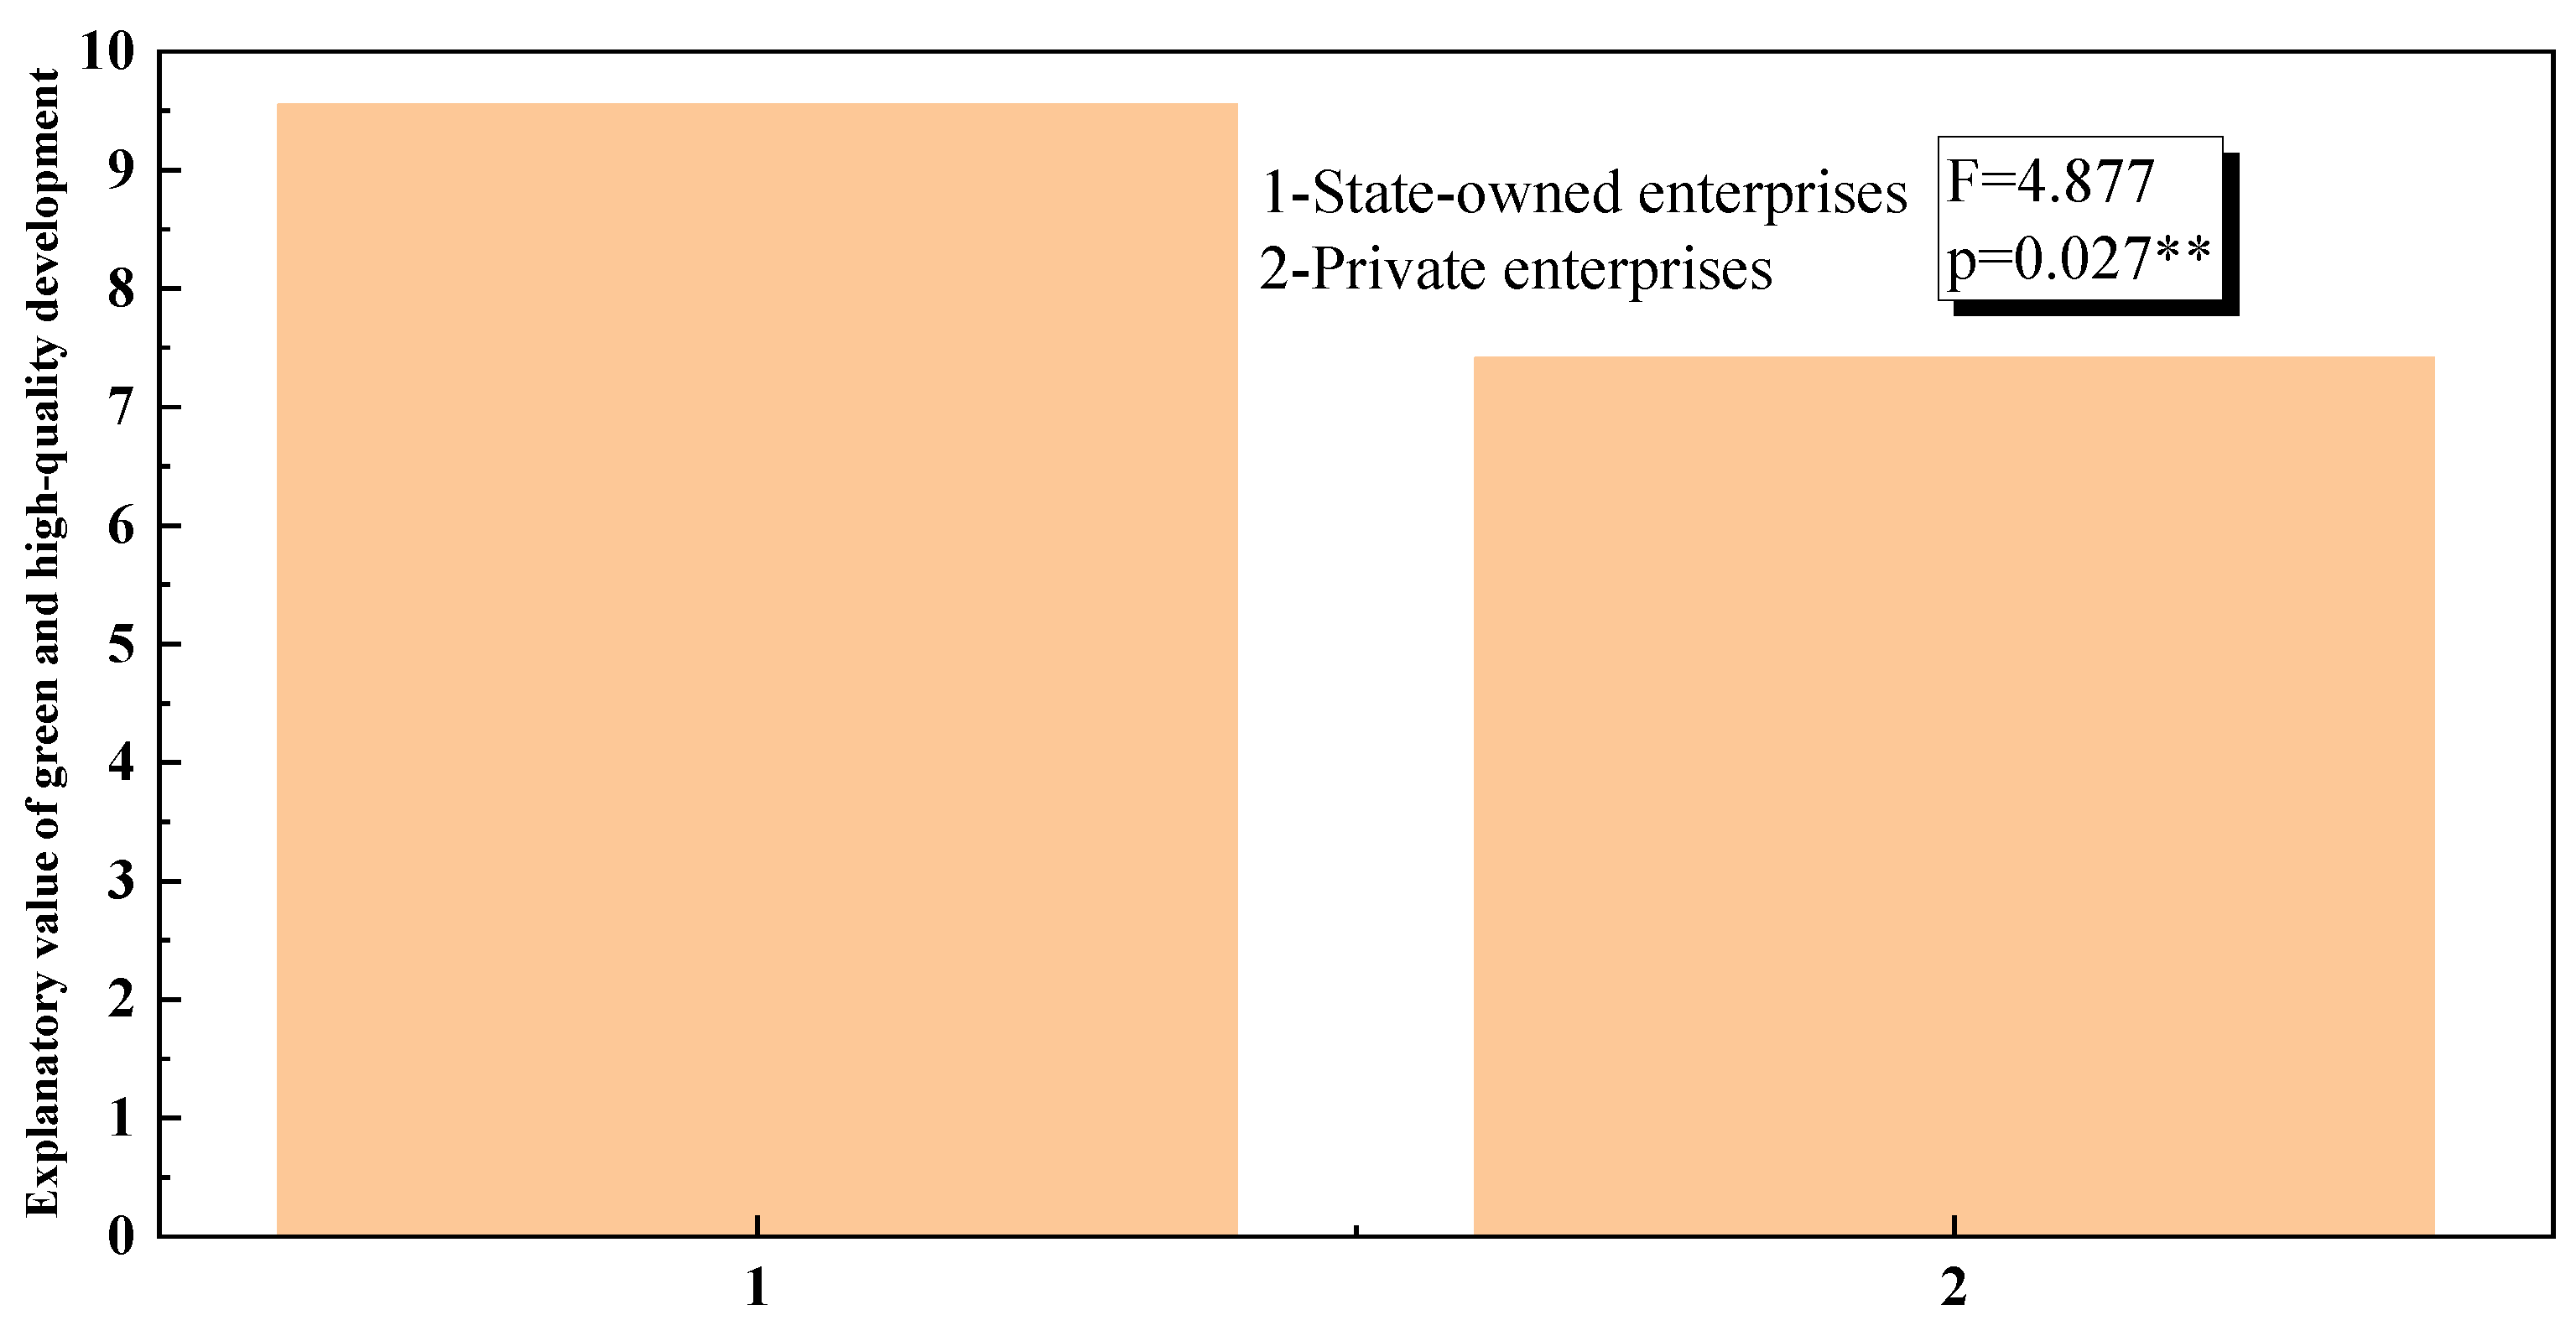
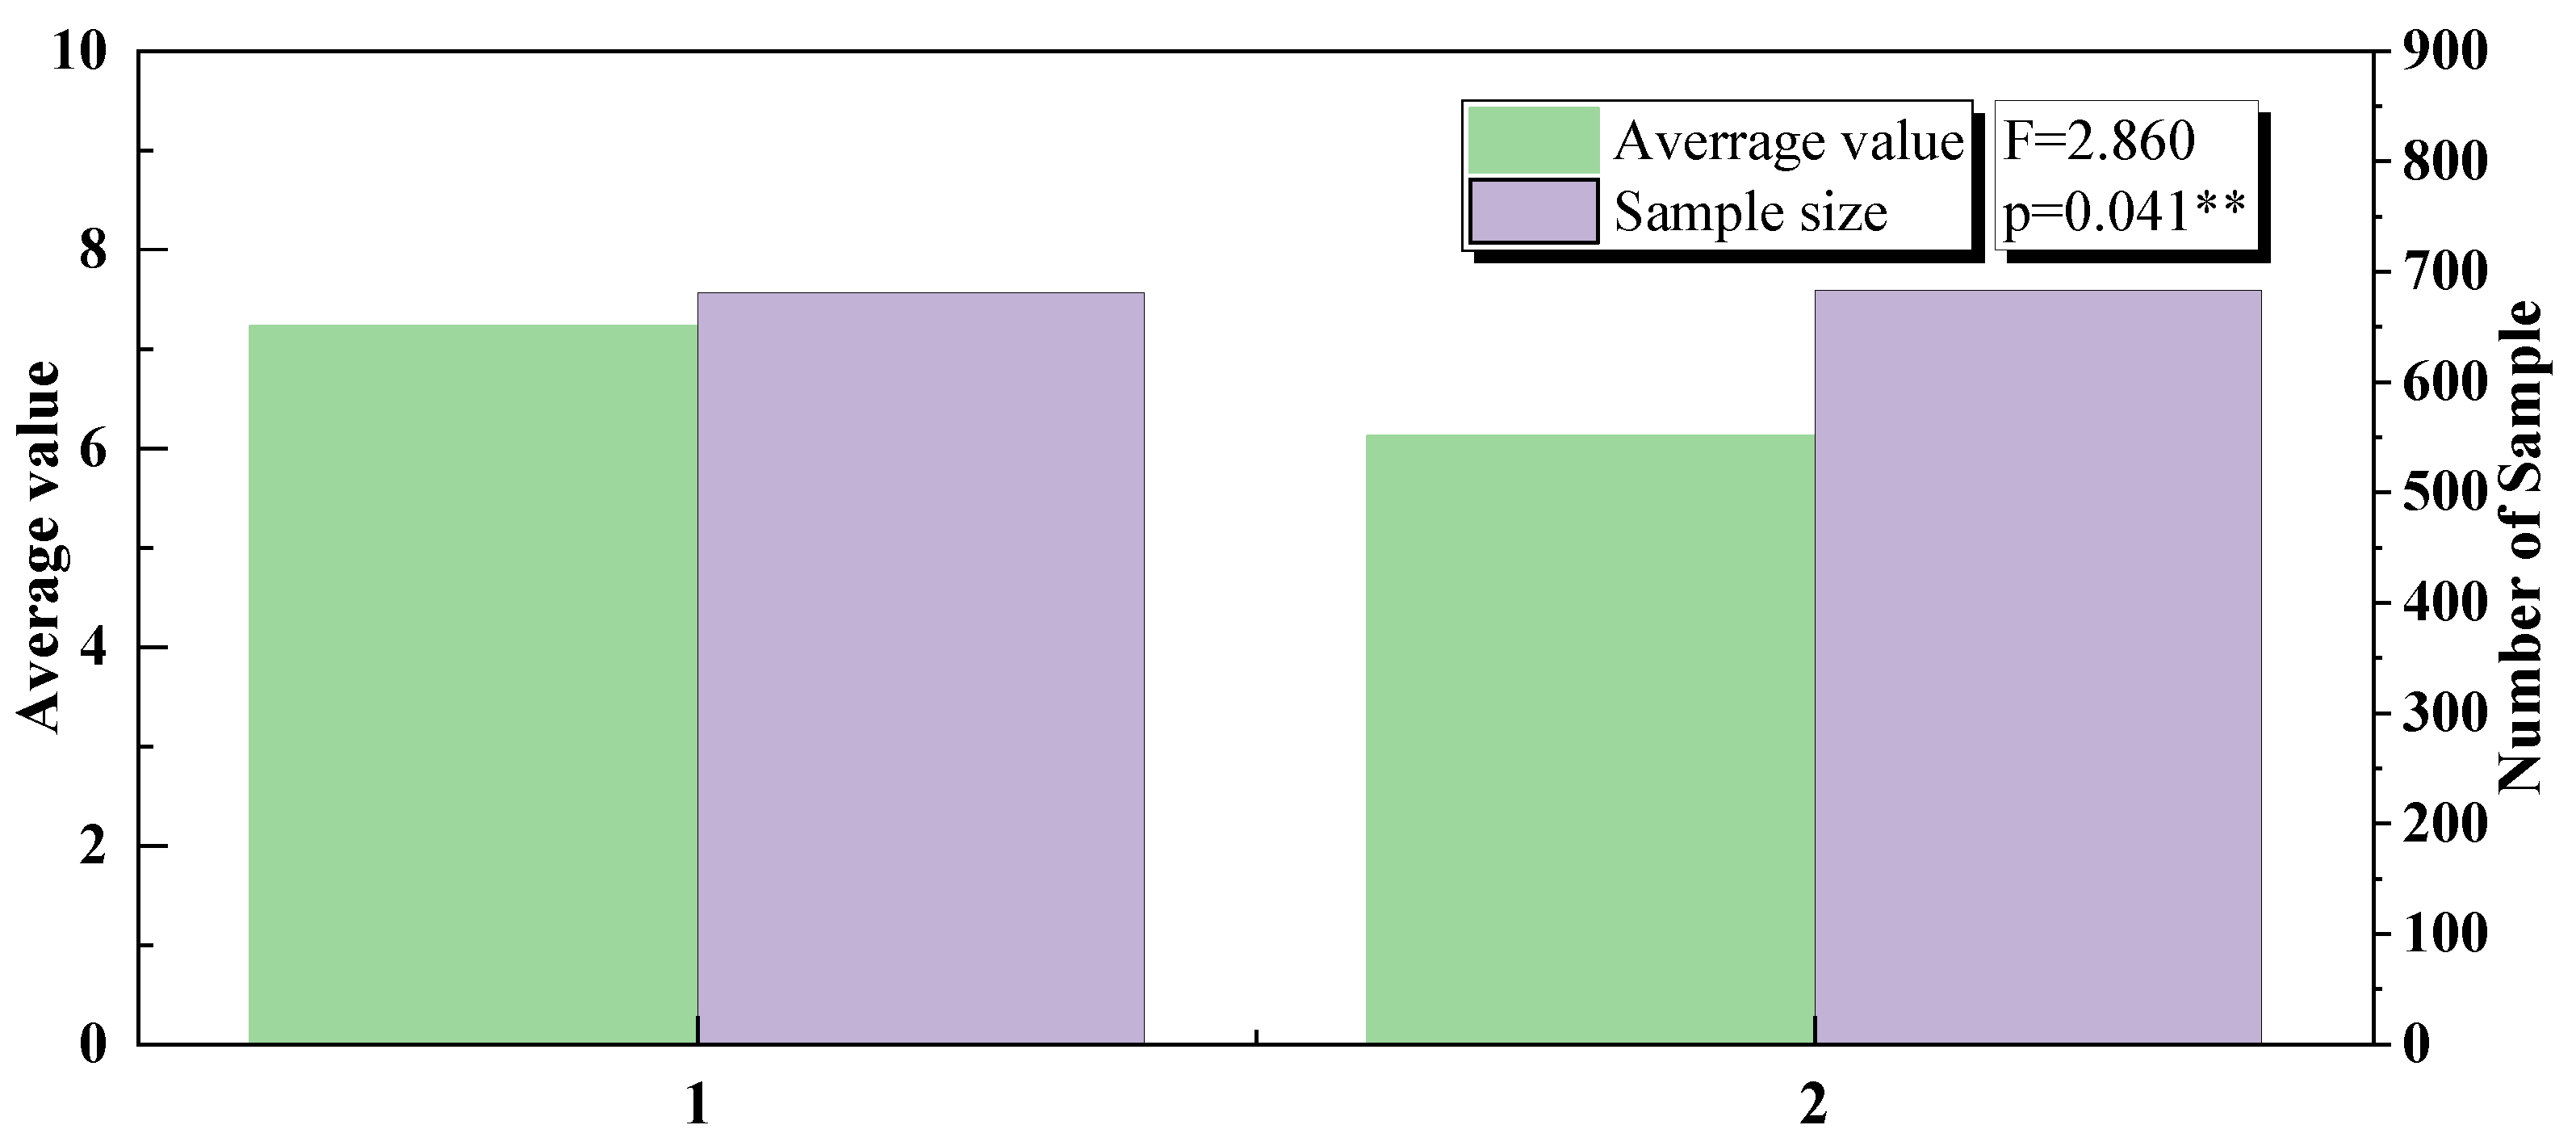
Hypothesis 2. There is a significant impact between the nature of equity and the green and high-quality development of enterprises; that is, the development quality of private enterprises and state-owned enterprises will also be inconsistent.
Between different industries, the development of enterprises will also be different, and the differences between industries often limit the development of enterprises. Xu Li [
28], Li Zhiqin [
29], Liu Dan [
30], and others have studied the development status of enterprises in the passenger car industry, the traditional brewing industry, and the emerging communication industry, respectively. Using emerging technologies to improve the development quality of enterprises, it is more difficult for traditional industries to apply emerging technologies. Therefore, it can be speculated that the difficulty of achieving high-quality development in different industries will also be different. Coincidentally, Wei [
31] and Lu Yi et al. [
32] studied the methods of promoting the high-quality development of industries such as manufacturing and light industry, and found that the same method will have inconsistent effects on promoting the high-quality development of different industries. The above results show that the different industries in which enterprises are located have a great impact on the green and high-quality development of enterprises. Therefore, the following assumptions are made about the industry in which the company operates:
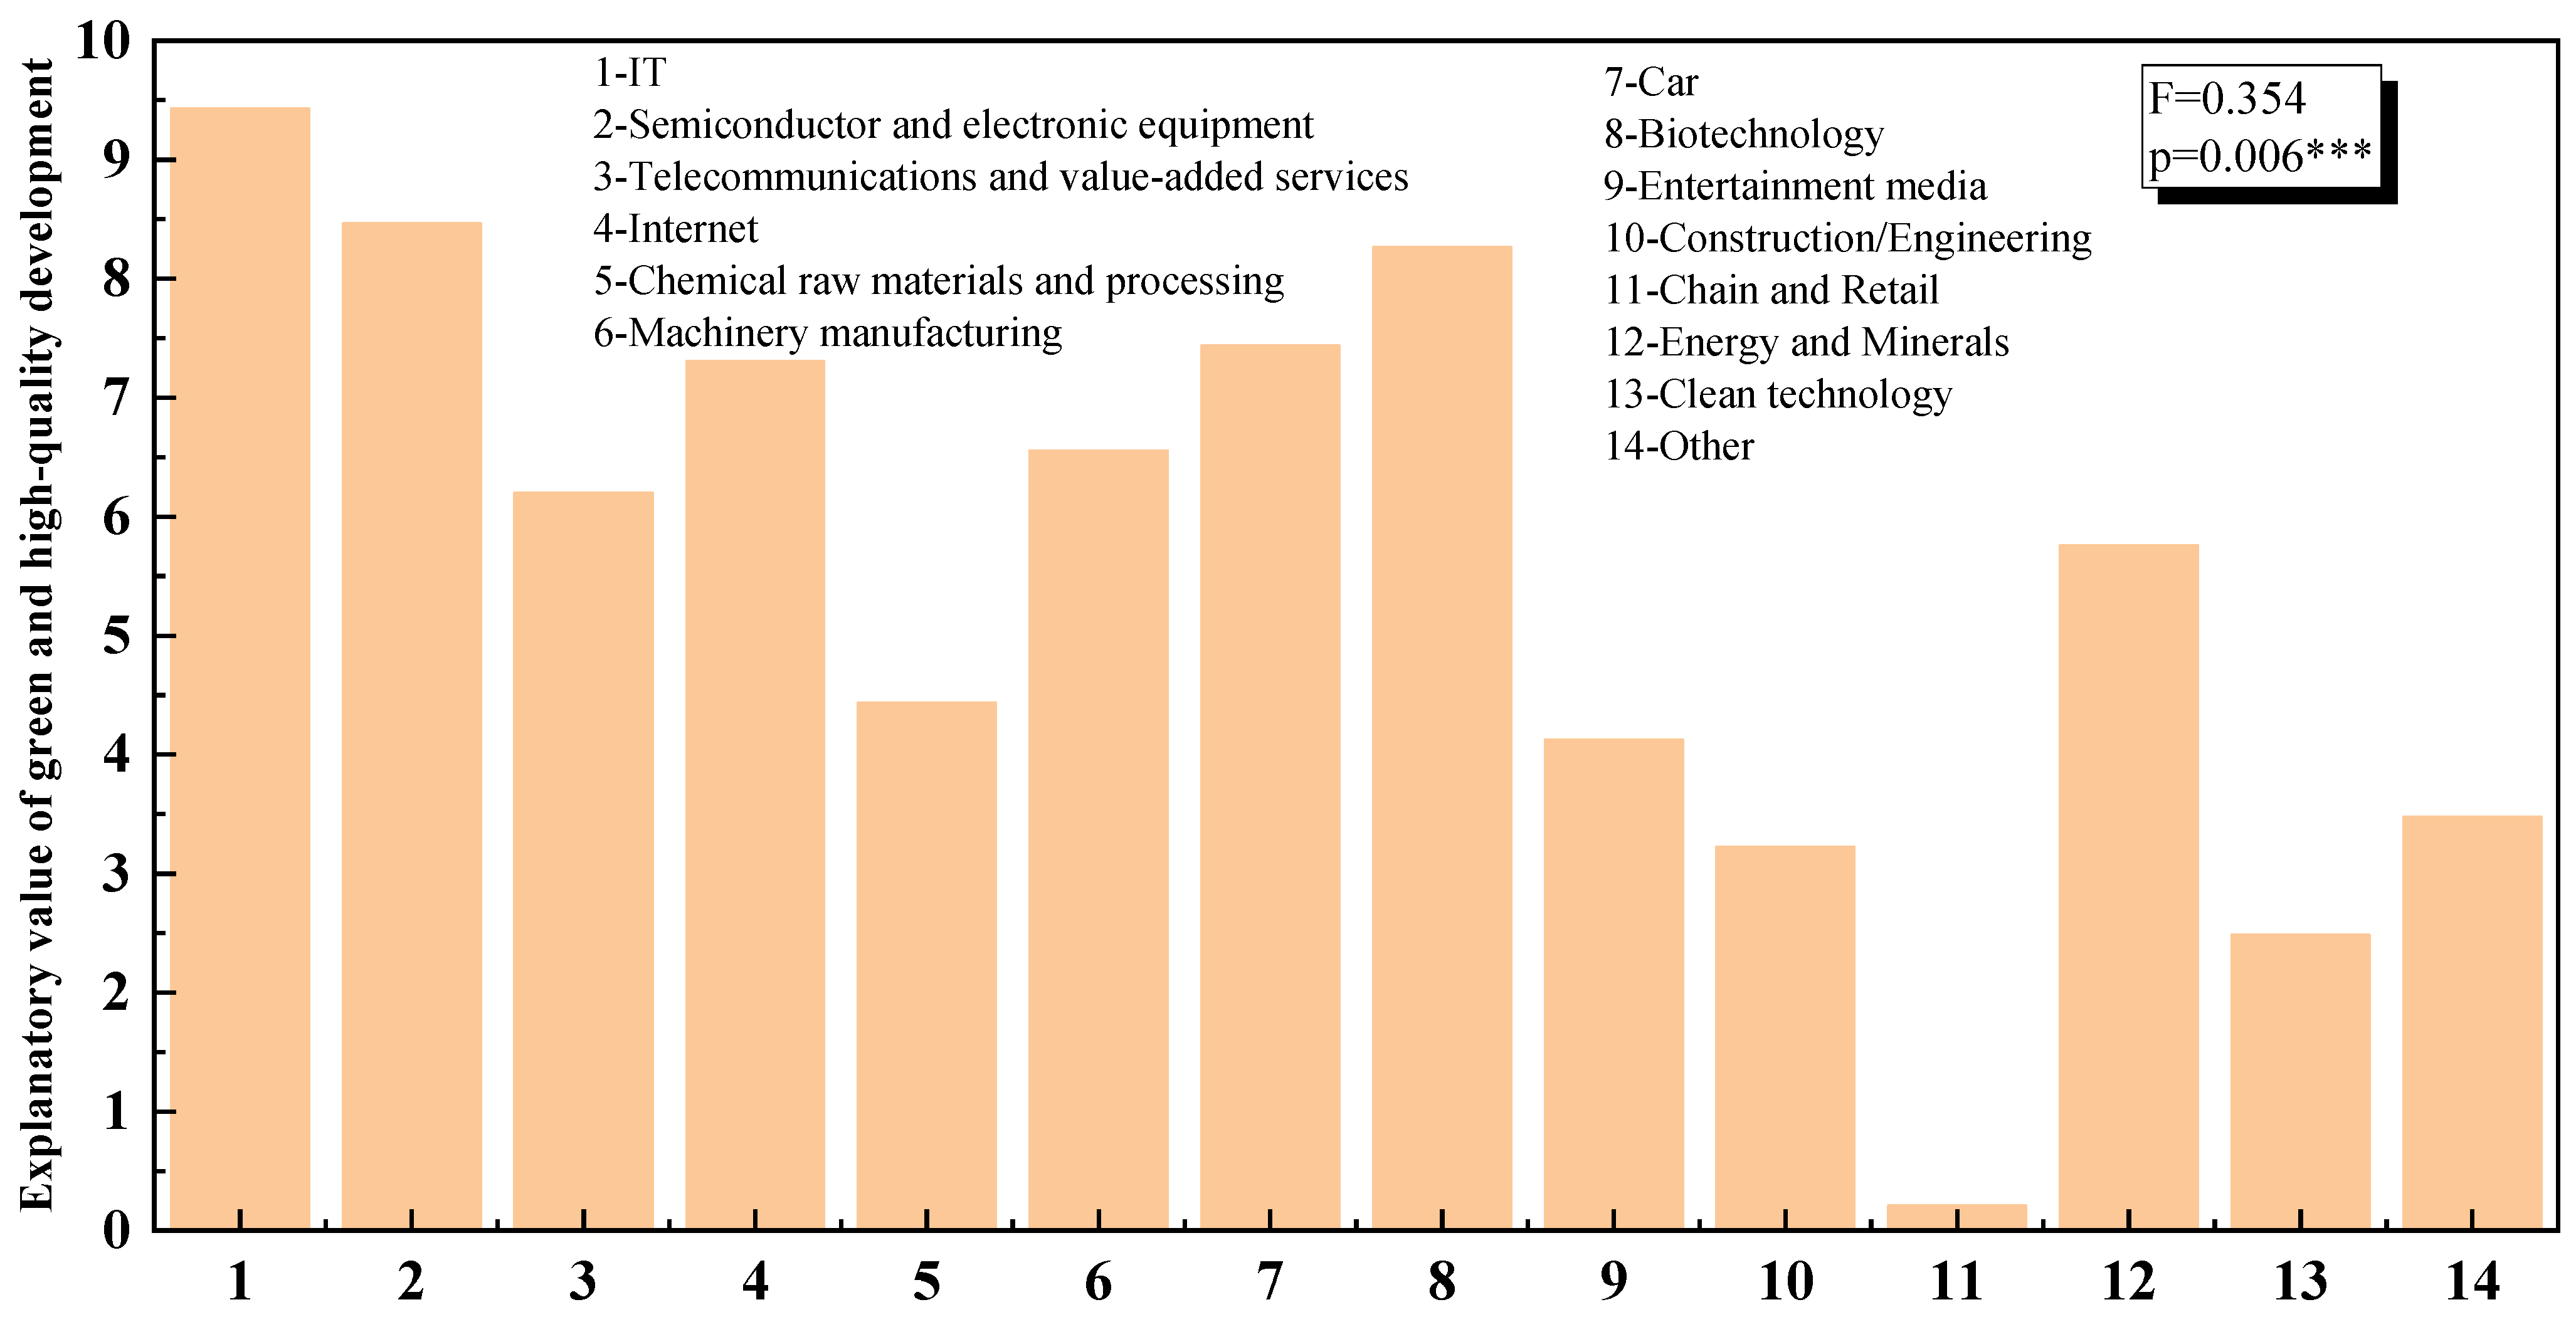
Hypothesis 3. There is a correlation between the industry and the green and high-quality development of enterprises, and it is easier for emerging high-tech industries to achieve a high-quality development of enterprises.
All organizations, regardless of their size, industry, or customer base, must face some level of risk. Therefore, risk management is seen as a management response to an unstable environment. Serebryakova et al. [
33] discussed the relationship between risk management and enterprise sustainable development, and demonstrated the necessity of establishing a risk management system for enterprise sustainable development. The study found that reasonable risk management is conducive to promoting the sustainable, stable, and healthy development of enterprises. In other words, risk management is conducive to the realization of the green and high-quality development of enterprises. Similarly, domestic scholars Mai Xiaomin [
34] and Zhang Ya [
35] also found that reasonable and effective risk management plays an important role in promoting the financial management and green and high-quality development of enterprises when they studied the green and high-quality development of the tobacco industry. Therefore, the following assumptions are made about risk management:
Hypothesis 4. Risk management has a significant impact on the green development of enterprises, and reasonable and effective risk management is conducive to the realization of the green and high-quality development of enterprises.
There are usually five types of shares, including state-owned shares, legal person shares, foreign shares, employee shares, and public shares. However, due to the particularity of foreign shares, the published data are usually incomplete. Therefore, this category was excluded from the follow-up study of this paper. In addition, in the companies studied, the top ten shareholders often accounted for more than 60% or even higher shareholdings. Therefore, this paper only studies the types of equity of the top ten shareholders. Fan Yuxian and Zhang Zhanjun [
36] studied the high-quality development of enterprises in terms of ownership structure and corporate governance, and found that the impact of ownership structure on the output quality of enterprises is complex. Lie [
37] studied the influence of the type of stock issuance on the business performance of the enterprise, and the results showed that the appropriate type of stock can increase the equity value, thus obtain more investment, and improve the development quality of the enterprise. It can be seen from the above results that a reasonable equity structure is conducive to attracting investment and improving the quality of enterprise development, thus forming a virtuous circle and green development. Therefore, the following assumptions are made regarding the types of equity in the top ten shareholders:
Hypothesis 5. The type of equity in the top ten shareholders has a significant impact on the green and high-quality development of the enterprise. The more complete the type of equity, the more conducive to the green and high-quality development of the enterprise.
A large part of the green and high-quality development of enterprises is green innovation and development, and patents can just represent the innovation ability of enterprises, but the relationship between patents and green and high-quality development of enterprises is not clear enough, especially for invention patents, utility models, appearance, and the impact of design, green invention patents, green utility models, and patent citations on the green and high-quality development of enterprises. For this reason, this paper obtains comprehensive patent factors after processing the above factors, and uses them to study the relationship between them and the green and high-quality development of enterprises. Huang Dongbing, Wang Lingjun, Zhou Chengxu, Liu Jun [
38], Meng Mengmeng, Lei Jiangsu, Jiao Jie et al. [
39] studied the impact of patents on enterprises in the manufacturing industry, and the research results show the theory of the impact of patent quality on the high-quality development of enterprises. The framework provides empirical evidence for understanding the connotation of the “more efficient and sustainable” high-quality development of enterprises; that is, improving the quality of patents is conducive to the green and high-quality development of enterprises, but the quality of patents is often based on a sufficient number of patents. Therefore, the following assumptions are made for the patent:
Hypothesis 6. There is a positive correlation between patents and the green and high-quality development of enterprises; that is, the greater the number of patents, the better the green and high-quality development of enterprises.
Digital transformation is a high-level transformation that further touches the company’s core business and aims to create a new business model based on digital transformation and digitalization. Wang Xiaohong, Li Na, Chen Yu, et al. [
40] studied the impact of digital transformation on the high-quality development of polluting enterprises from the perspective of environmental performance. Their research results show that there is a U-shaped relationship between digital transformation and the high-quality development of enterprises. Margarita [
41] studied the role of digital transformation in entrepreneurial enterprises, and the research results show that the higher the degree of digital transformation of entrepreneurial enterprises, the more likely they are to embark on a path of steady growth. To sum up, it can be seen that digital transformation has a significant impact on the high-quality development of enterprises, but there is no unified conclusion on what impact it will have on the green and high-quality development of enterprises. Therefore, the following assumptions are made for digital transformation:
Hypothesis 7. There is a positive correlation between the degree of digital transformation and the green and high-quality development of enterprises; that is, the higher the degree of digital transformation of enterprises, the greater the possibility of green and high-quality development.
In previous studies [
42,
43], total factor productivity was more used as an evaluation index for the high-quality development of enterprises, but the process of the high-quality development of enterprises may be unsustainable; that is, green and high-quality cannot be achieved. The green and high-quality development of enterprises refers more to the green total factor productivity. Compared with total factor productivity, which only considers expected output, green total factor productivity, which incorporates undesired outputs such as pollutant emissions into the indicator system is more comprehensive. Therefore, this paper studies total factor productivity as one of the factors affecting the green and high-quality development of enterprises. Guan Yuhang, Shi Yishuai, Li Li, et al. [
44] took enterprises in low-carbon cities as research objects, and found that the improvement of the total factor productivity of low-carbon city policies would promote the high-quality development of enterprises. However, when the follow-up policies cannot keep up in time, the development and improvement of the enterprise will gradually disappear; that is, when the total factor productivity is not improved, the high-quality development of the enterprise will also be limited, making it difficult for the green and high-quality development of the enterprise to break through the bottleneck. Therefore, the following assumptions are made about total factor productivity:
Hypothesis 8. There is a positive correlation between total factor productivity and the green and high-quality development of enterprises; that is, the improvement of total factor productivity helps to improve green total factor productivity.
In addition to the above common explanatory variables, state-owned enterprises and private enterprises also have their own unique influencing factors. Among them, Chinese enterprises involve the enterprise level, the shareholding ratio of the largest non-state-owned shareholder among the top ten shareholders, and the largest non-state-owned shareholder, whether it is the controlling shareholder, and the sum of the shareholding ratios of all non-state-owned shareholders among the top ten shareholders. The private enterprise involves the shareholding ratio of the largest state-owned shareholder among the top ten shareholders, the total shareholding ratio of all state-owned shareholders among the top ten shareholders, the total number of shares, and the number of state-owned shares. However, to unify the research object, this part of explanatory variables is not considered. The green and high-quality development of enterprises studied in this paper is not considered from the perspective of the sustainability of the enterprise, but is based on a large amount of enterprise data, to find the influencing factors of the green and high-quality development of enterprises, using different methods for modeling, with a view to return to the future green and high-quality development of enterprises.
While studying the factors affecting the green and high-quality development of these enterprises, this paper also studies the model for solving the problem. The traditional method is usually linear regression, but using the linear regression method to build a model usually needs to satisfy multiple classical assumptions, and in most cases, the above-mentioned influencing factors and the green and high-quality development of enterprises do not show a linear relationship. Therefore, the use of linear regression modeling to study the green and high-quality development of enterprises will have certain limitations. To better solve such nonlinear problems, the rapid development of machine learning technology in recent years has provided solutions for such problems. This technology has great advantages in the regression and prediction of results. Learning technology is applied to the return of green and high-quality development of enterprises. To sum up, based on the analysis of influencing factors, this paper will use machine learning technology to establish a regression model of enterprise green and high-quality development under the influence of multiple factors, and then compare the prediction effects and explanatory power of different models, to obtain the optimal regression prediction model, and conduct further research on that basis. The regression algorithms finally selected in this paper are: multiple regression algorithm [
45], random forest regression algorithm [
46], random forest algorithm optimized by genetic algorithm [
47], support vector machine regression algorithm [
48], and support vector machine optimized by genetic algorithm [
49].
3. Research Design
3.1. Data Processing and Variable Definition
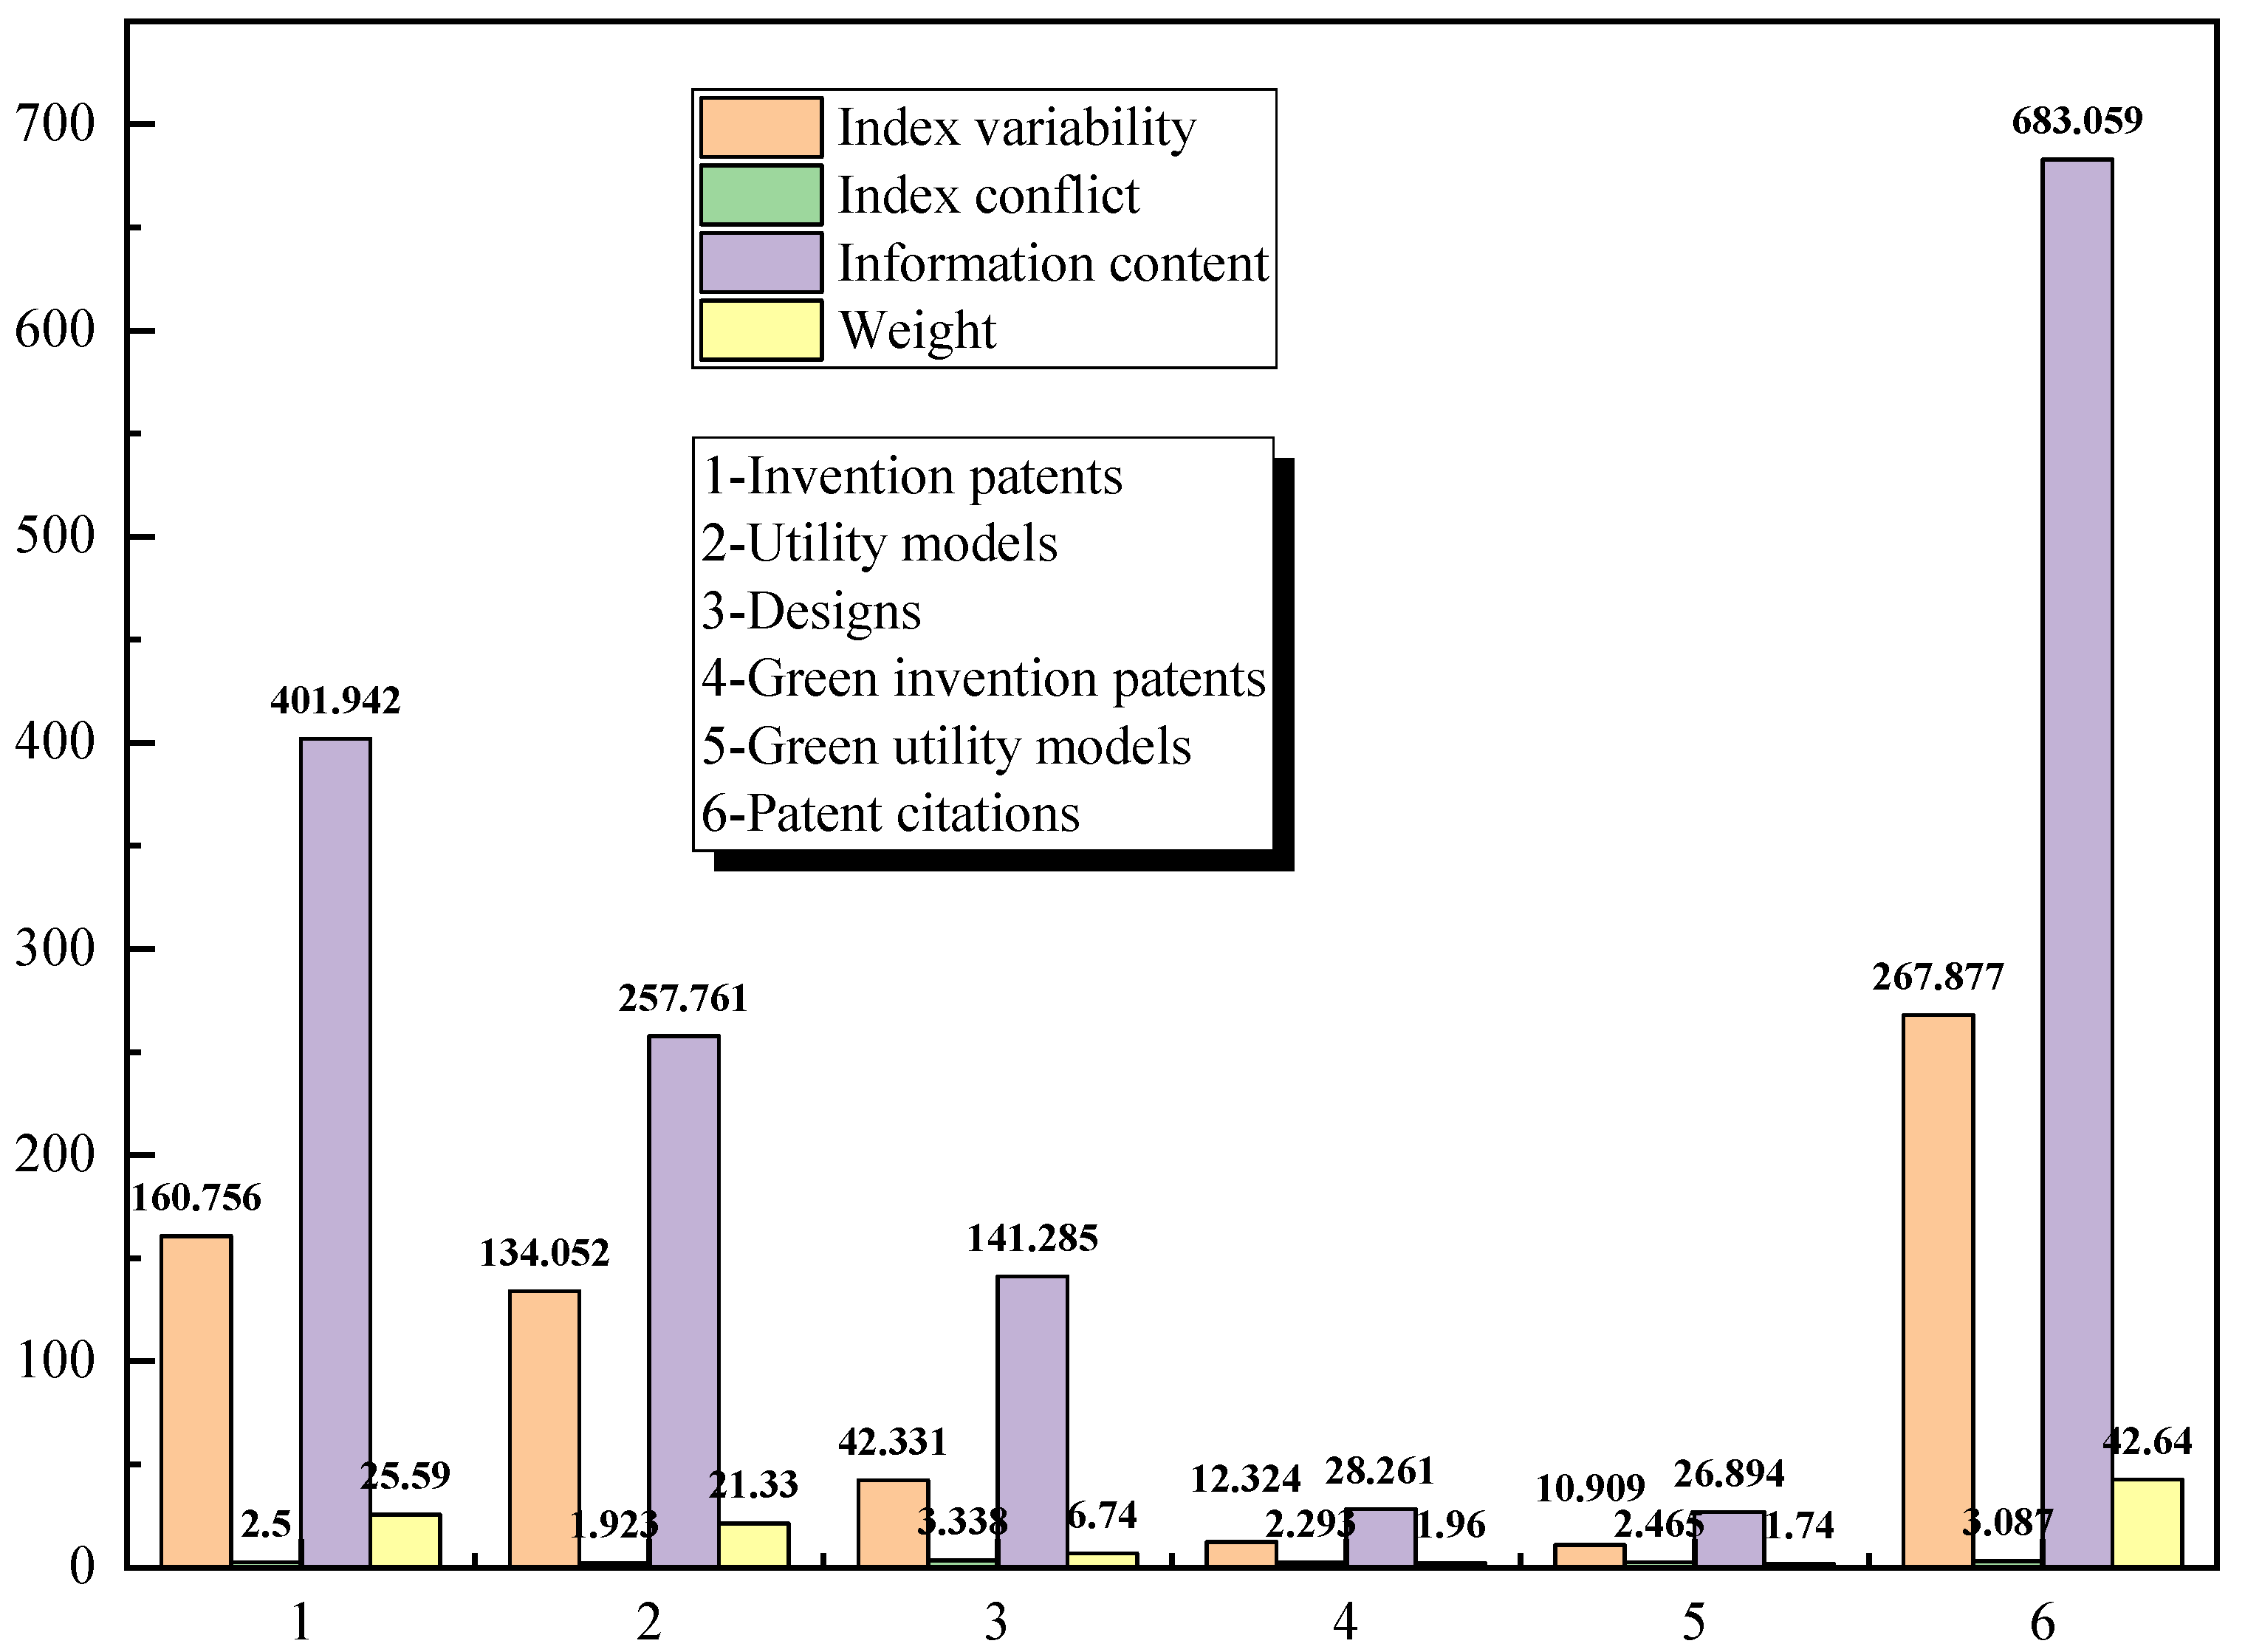
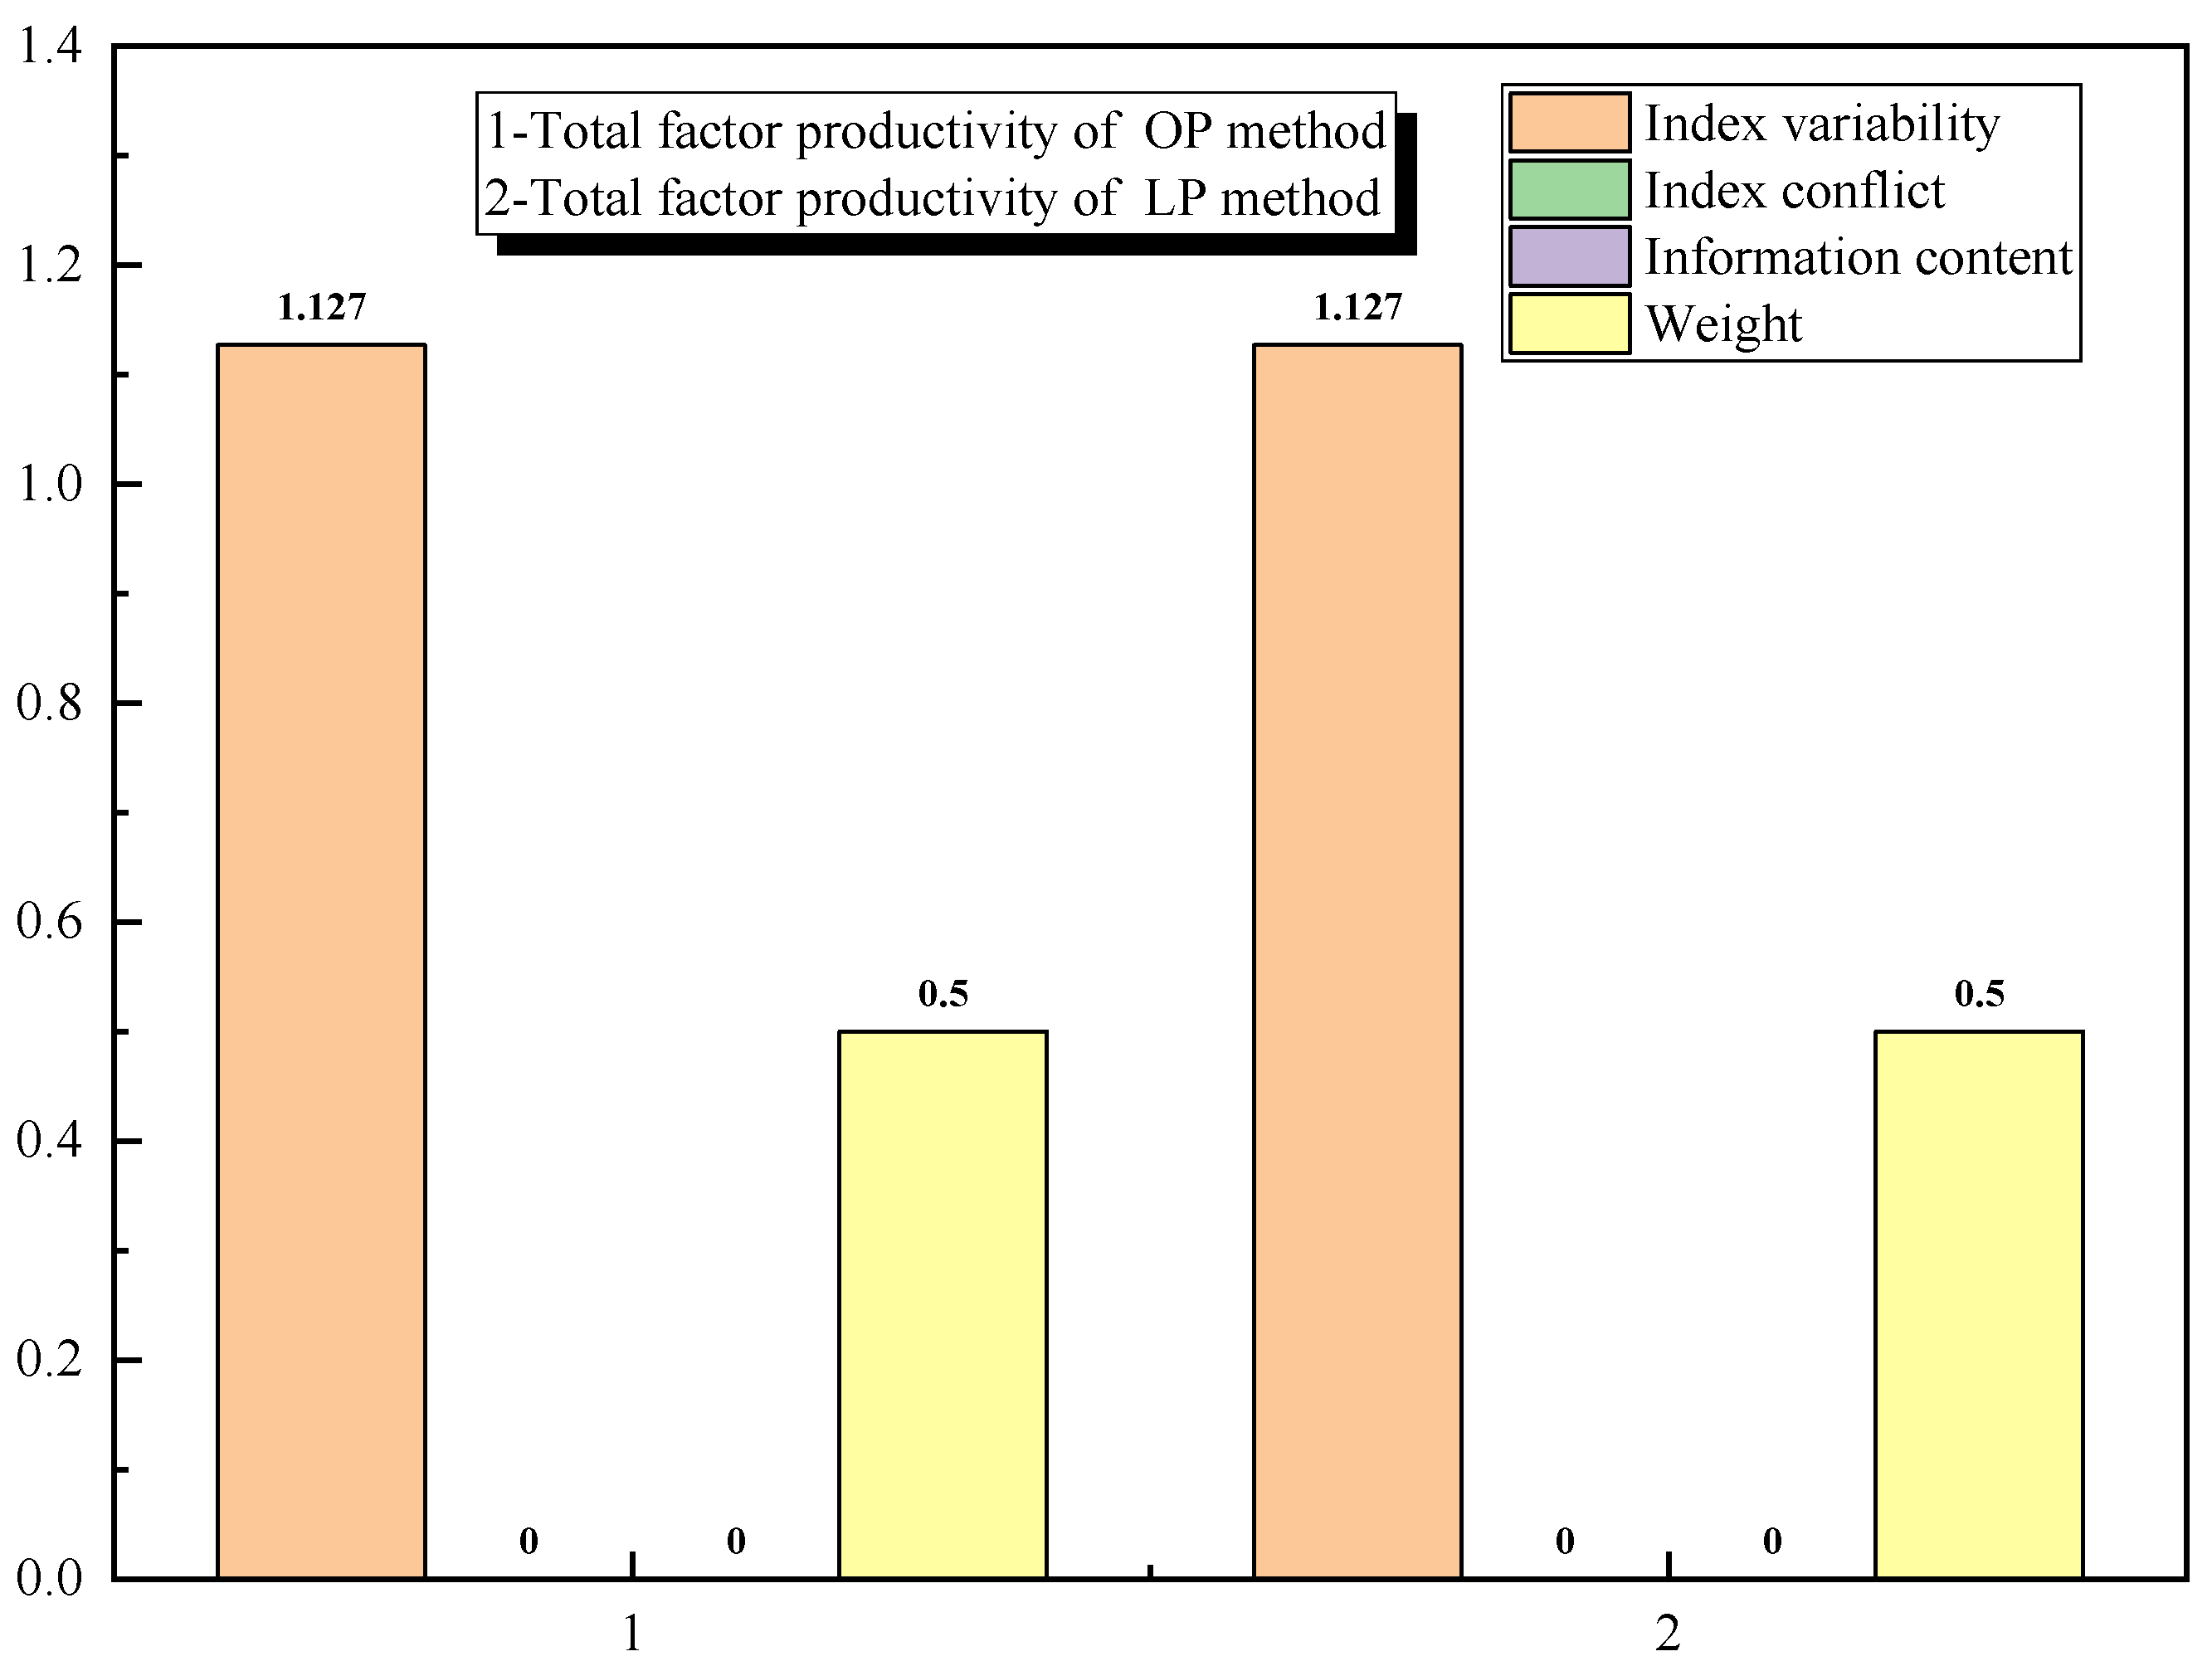
The data source of this paper is 1588 sets of data of two types of state-owned and private enterprises from 2008 to 2020 in the Green Patent Application and Authorization Data Encyclopedia of Chinese Listed Companies. After excluding invalid data, there were 1364 sets of empirical data remaining. Among the above explanatory variables, patents and total factor productivity are composed of multiple factors. According to the characteristics of these data (the standard deviation is close), the CRITIC weight method was used to obtain the proportion of each factor. The solution formula is as follows:
In the formula, m is the number of objects to be evaluated and n is the number of evaluation indicators.
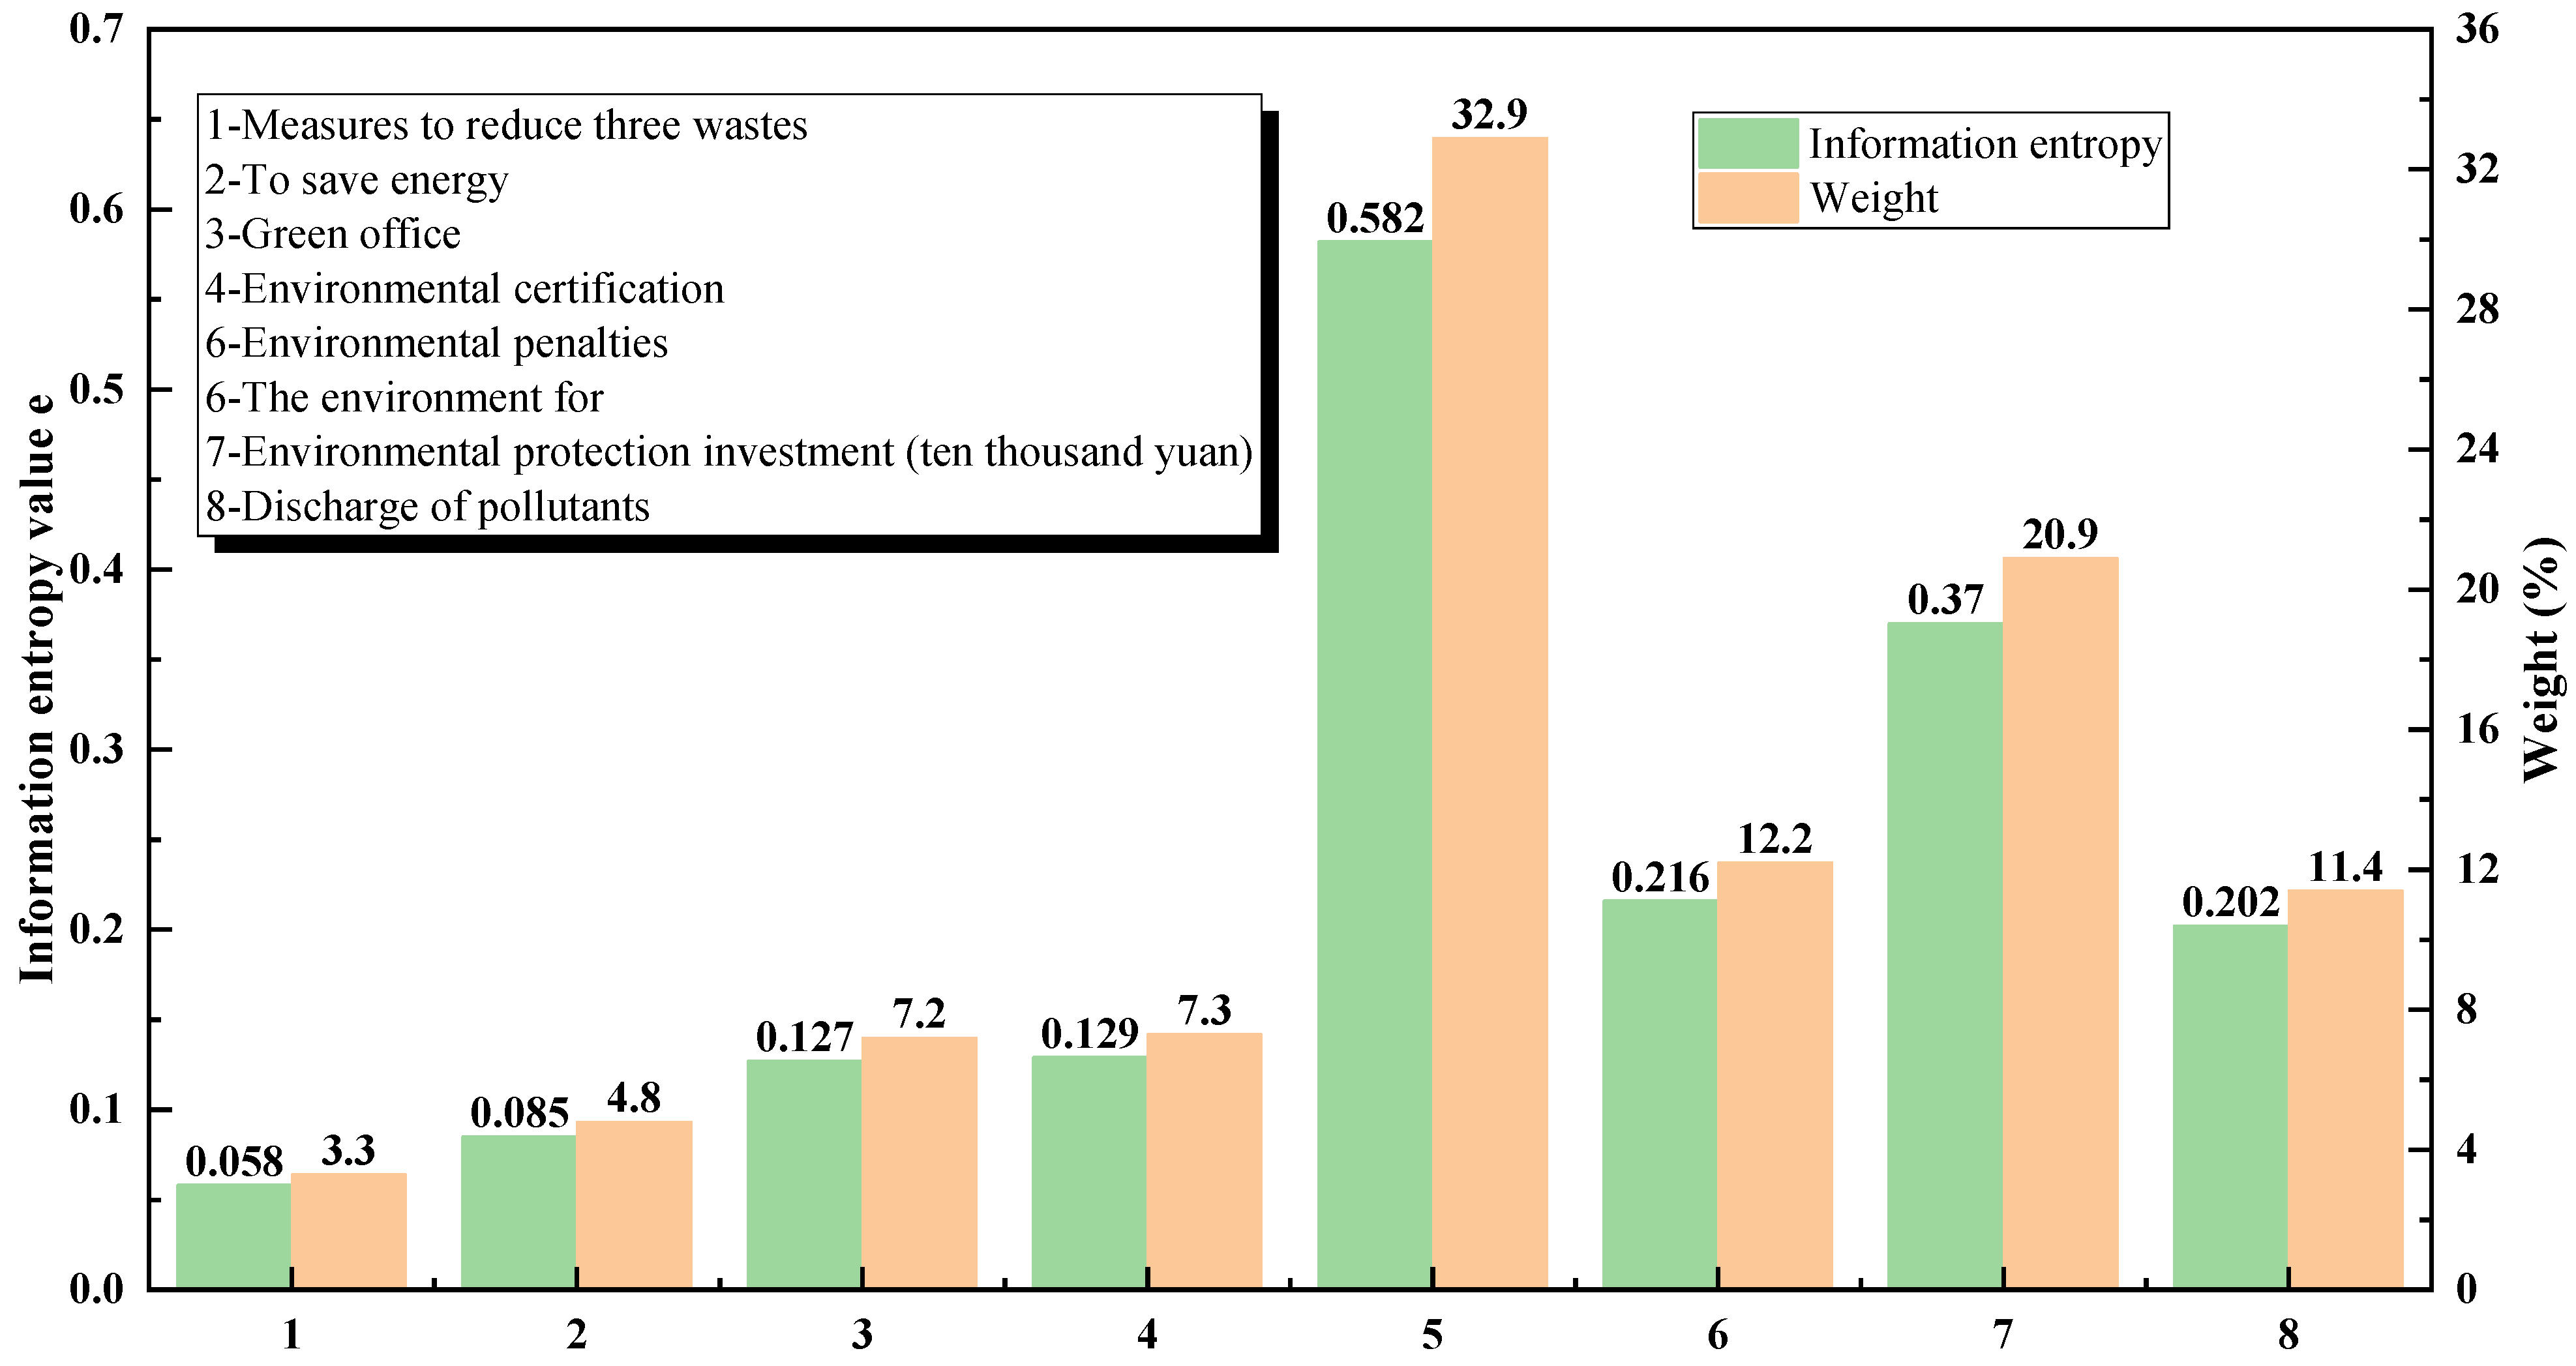
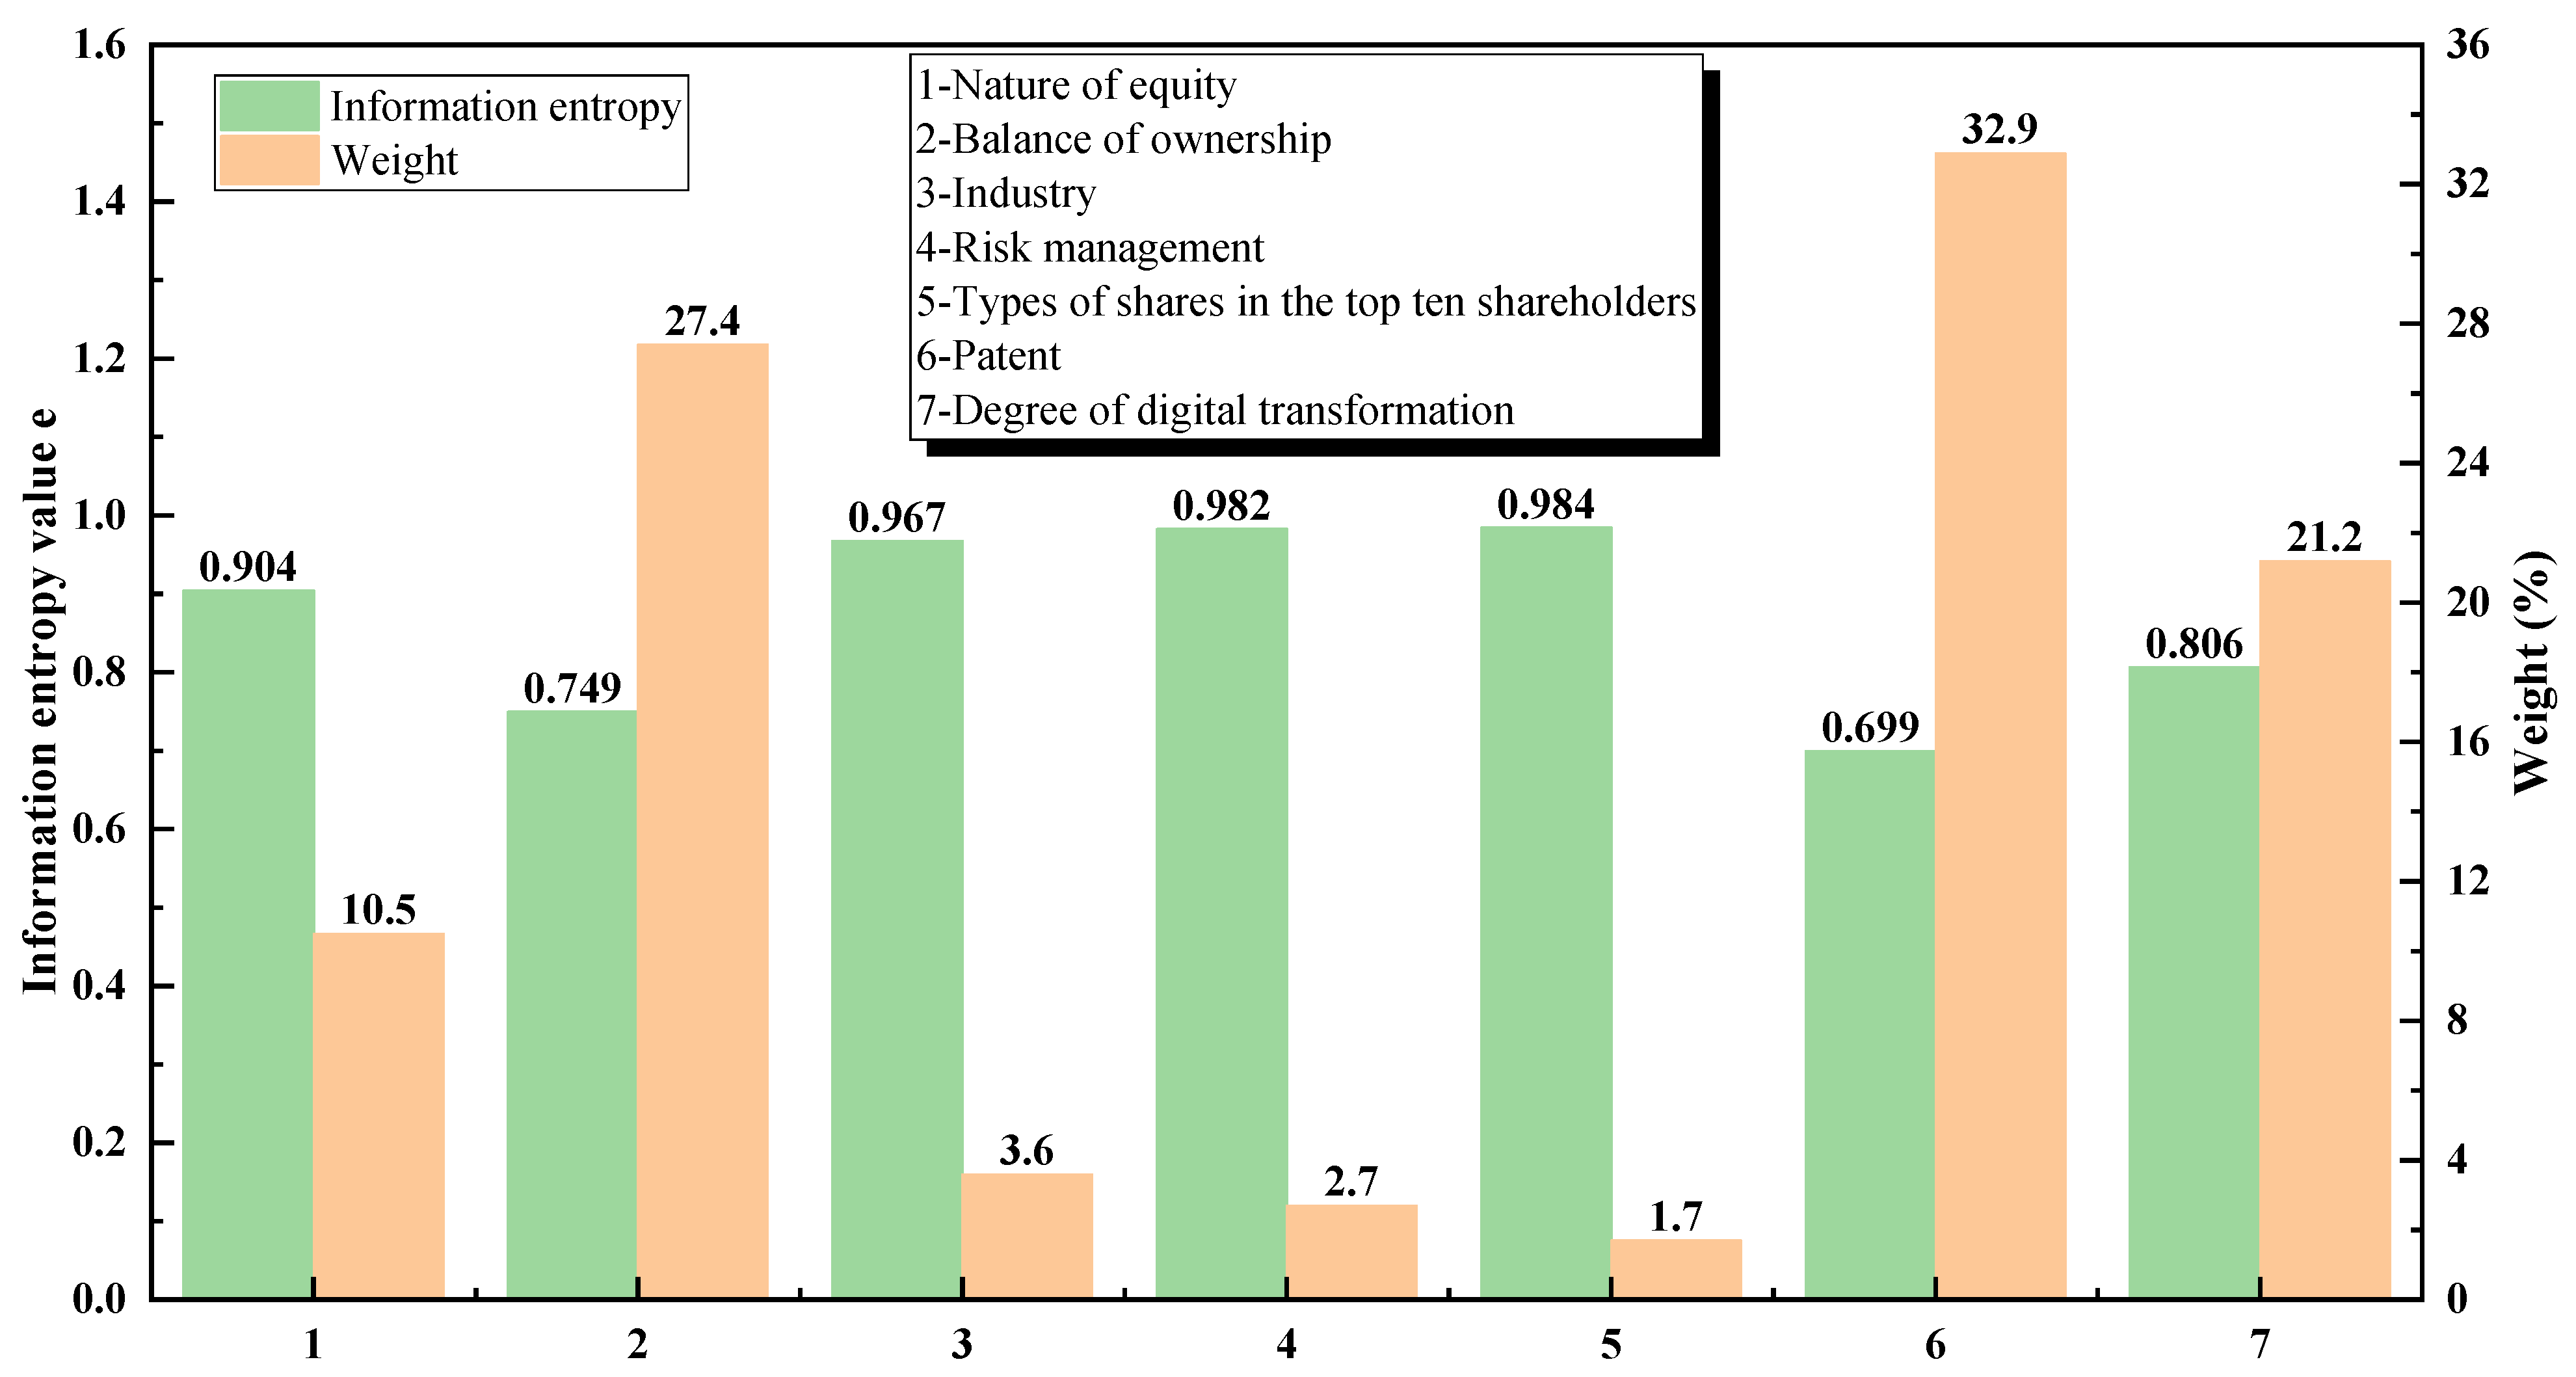
In addition to the above-mentioned explanatory variables and control variables, this paper considers the evaluation indicators of the green and high-quality development of enterprises from the perspectives of environmental concerns, environmental investment, and environmental advantages. The weight of each evaluation index cannot be effectively solved by the CRITIC weight method, so the entropy method was used to solve its weight, and the solution formula is as follows:
In the formula: n is the number of indicators and is the value of the j-th indicator of the i-th sample
After the data processing was completed, the explained variables and explanatory variables were extracted. All the variables involved in this paper are shown in
Table 1.
- (1)
Explained variable
The green high-quality development evaluation index system includes a total of 5 first-level indicators, 11 second-level indicators, and 28 third-level indicators. As can be seen from the previous article, the evaluation indicators related to enterprises can be summarized into three aspects: environmental concern, environmental investment, and environmental advantages. Among them, environmental concerns mainly refer to environmental starting and pollutant discharge, and environmental investment refers more to environmental protection investment. Environmental advantages mainly include measures to reduce three wastes, energy conservation, green office, environmental certification, and environmental recognition. The data composition of the above variables is not consistent, the differences between the variables are large, and the standard deviations between the data are not in the same order of magnitude, so the CRITIC weight method cannot obtain the weight of each indicator. For this purpose, the entropy method was used to solve it.
- (2)
Explanatory variables
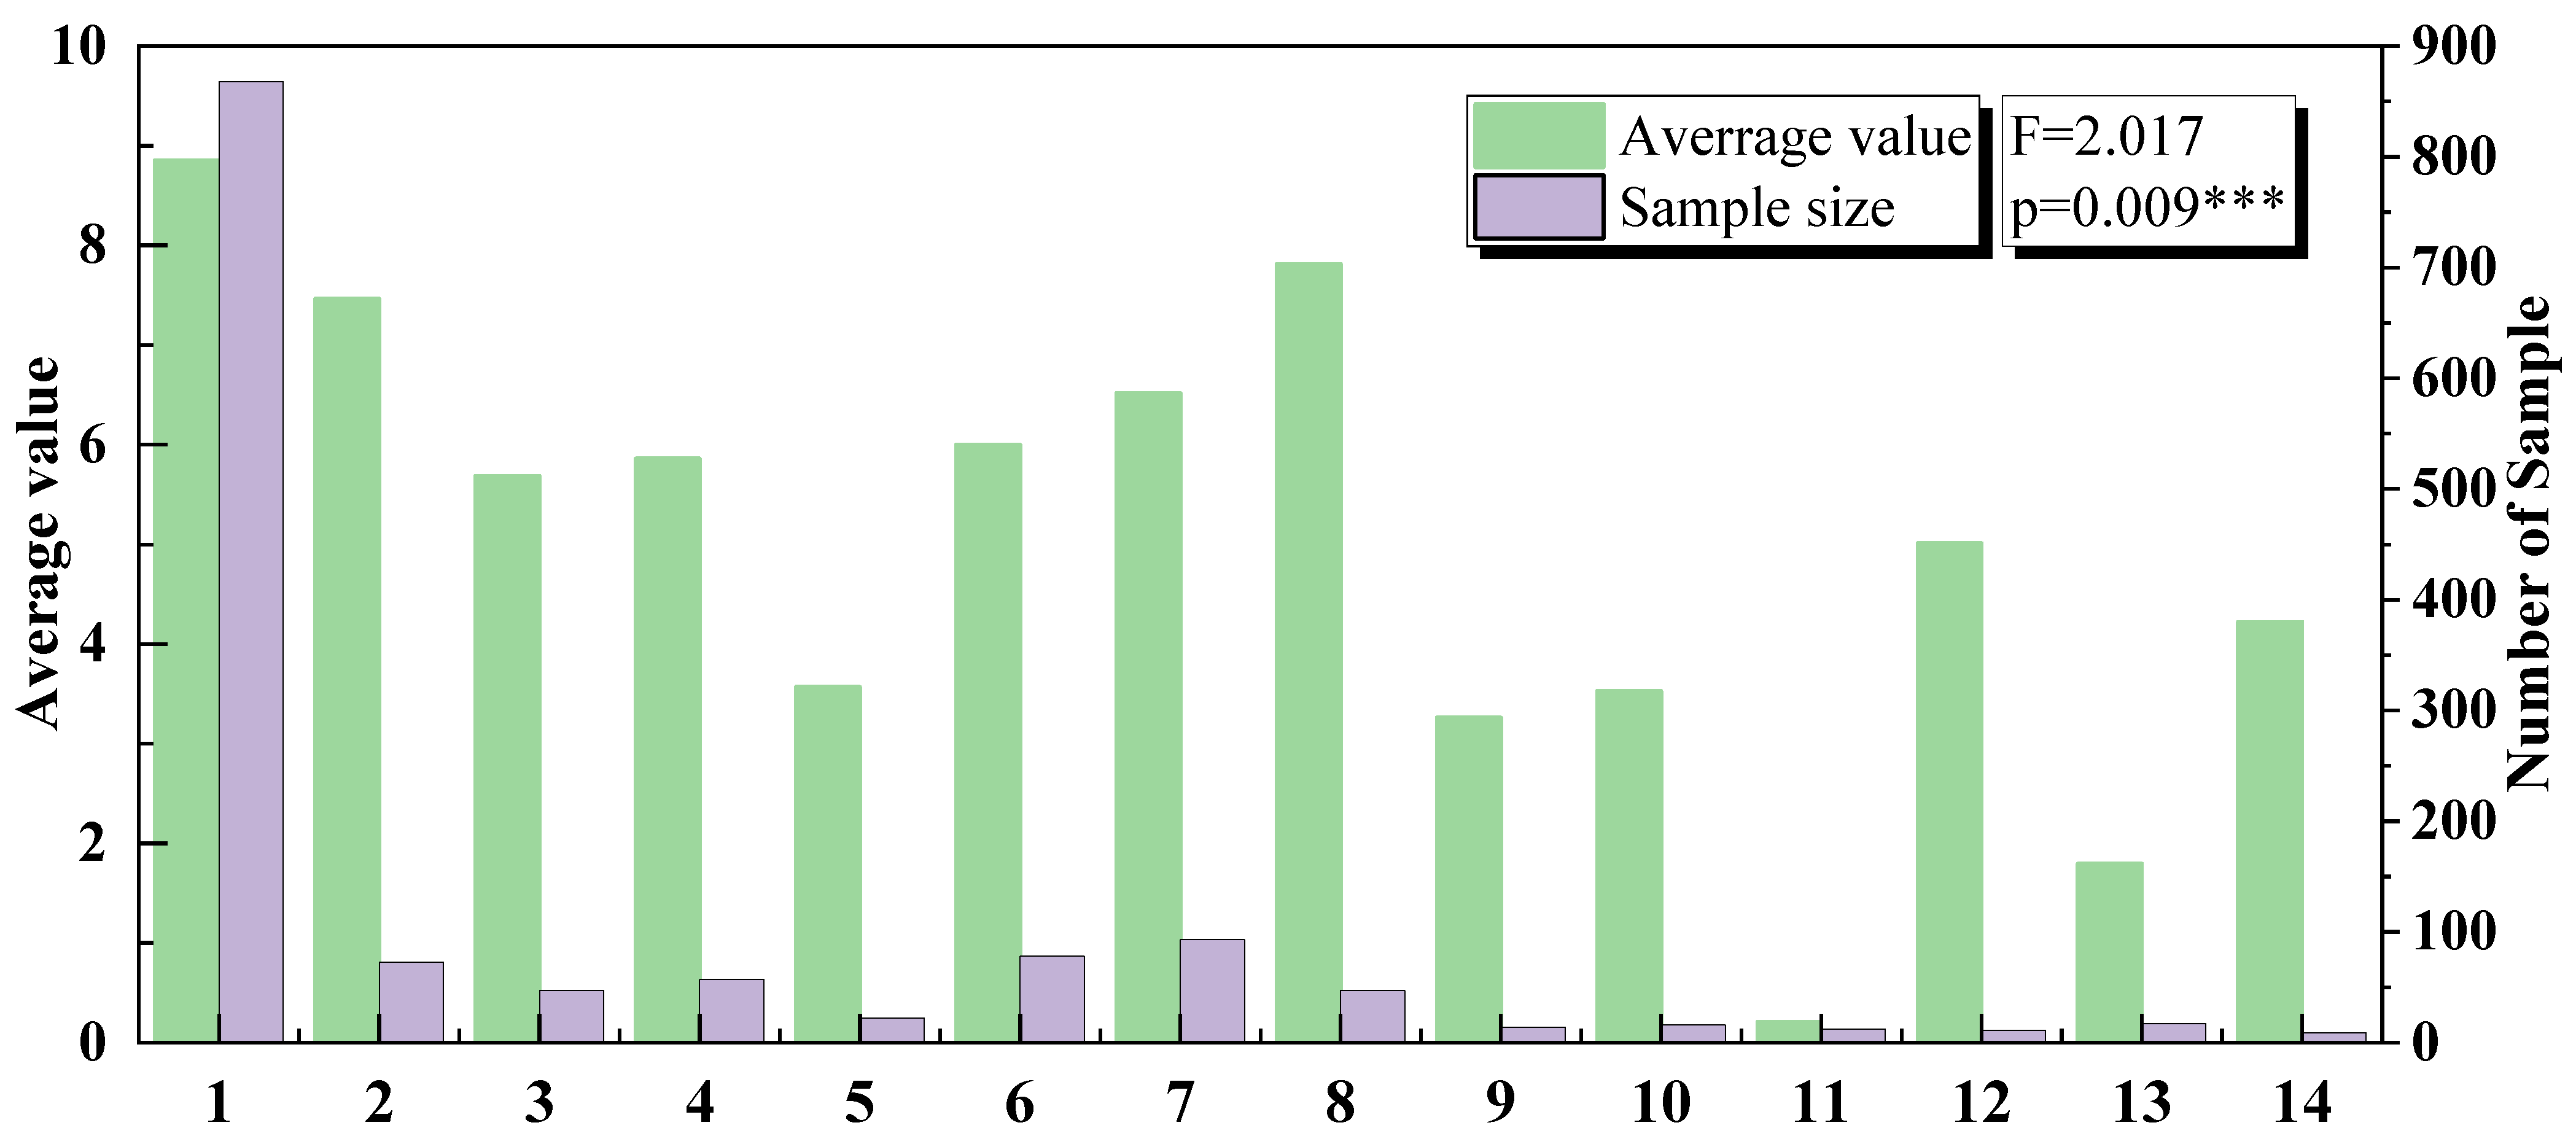
In terms of the selection of explanatory variables, this paper selects the following explanatory variables from the perspectives of equity and innovation, mainly including the degree of equity checks and balances, industry, risk management, types of equity in the top ten shareholders, patents, degree of digital transformation, overall factor productivity, and the nature of equity. Among them, the equity check and balance degree is the ratio between the proportion of one type of equity in a state-owned or private enterprise and another type of equity, which is a dimensionless value. In this paper, the degree of equity checks and balances in state-owned enterprises is the ratio of the total shareholding ratio of non-state-owned shareholders among the top ten shareholders to the total shareholding ratio of the top ten shareholders, the ratio between the sum of the proportion of shares and the sum of the proportion of non-state-owned shares among the top ten shareholders. The industry is the industry where the company’s main business is located, including IT, semiconductor and electronic equipment, telecommunications and value-added services, radio and television and digital television, Internet, chemical raw materials and processing, machinery manufacturing, construction/engineering, chain and retail, energy, and minerals. There are 15 major categories, such as automobile, clean technology, biotechnology, entertainment media, agriculture, forestry, animal husbandry, and fishery. However, because the data volume of some industries (two industries, including: radio and television and digital television; and agriculture, forestry, animal husbandry, and fishery) is too small (less than five groups), this paper will name the industries with data volume lower than five groups as other industries; the remaining 13 categories and other industries are numbered from 1 to 14 in the subsequent regression model. Risk management is actually a company’s risk level, which is formed by the product of the probability of an event and the severity of the consequences after the event occurs. The types of equity in the top ten shareholders refer to one or more of state-owned shares, legal person shares, employee shares, and public shares. The reason for excluding foreign-invested shares is that most companies do not disclose the data of foreign-invested shares, and it is impossible to carry out generalization research. Patents are composed of invention patents, utility models, design, green invention patents, green utility models, and patent citations. The types of equity in the top ten shareholders refer to one or more of state-owned shares, legal person shares, employee shares, and public shares. The total factor productivity fully combines the advantages of the OP method and the LP method, and solves the weights of the two in various ways, to determine a more reasonable weight allocation ratio, and on this basis, obtain a comprehensive total factor productivity evaluation value. In addition to the above common variables, the nature of equity in this paper mainly includes two categories: state-owned enterprises and private enterprises. In previous studies, only one of them is usually studied, and the two are not used as input to study the impact of equity nature. In this paper, the influence of equity nature is studied separately. In addition, in terms of the impact of time, this paper found, when collating the data, if adding the time line requirement, between 2008 and 2020, there were only 29 companies with complete data, and this number itself cannot be further studied. Although the above samples can carry out further research from the timeline, it is only limited to this. Because many of the above-mentioned explanatory variables have too few sample data at this time, the conclusions of the study will not have universal significance. Therefore, the time aspect is not considered in this paper for the time being.
3.2. Model Specification
The solving algorithms used in this paper include a multiple linear regression algorithm and a machine learning regression algorithm. Among them, the linear regression algorithm was used to study the impact of numerical variables on the green and high-quality development of enterprises, while for text-type variables, one-way ANOVA was used.
3.2.1. Influence Factor Analysis Model
- (1)
Linear regression model
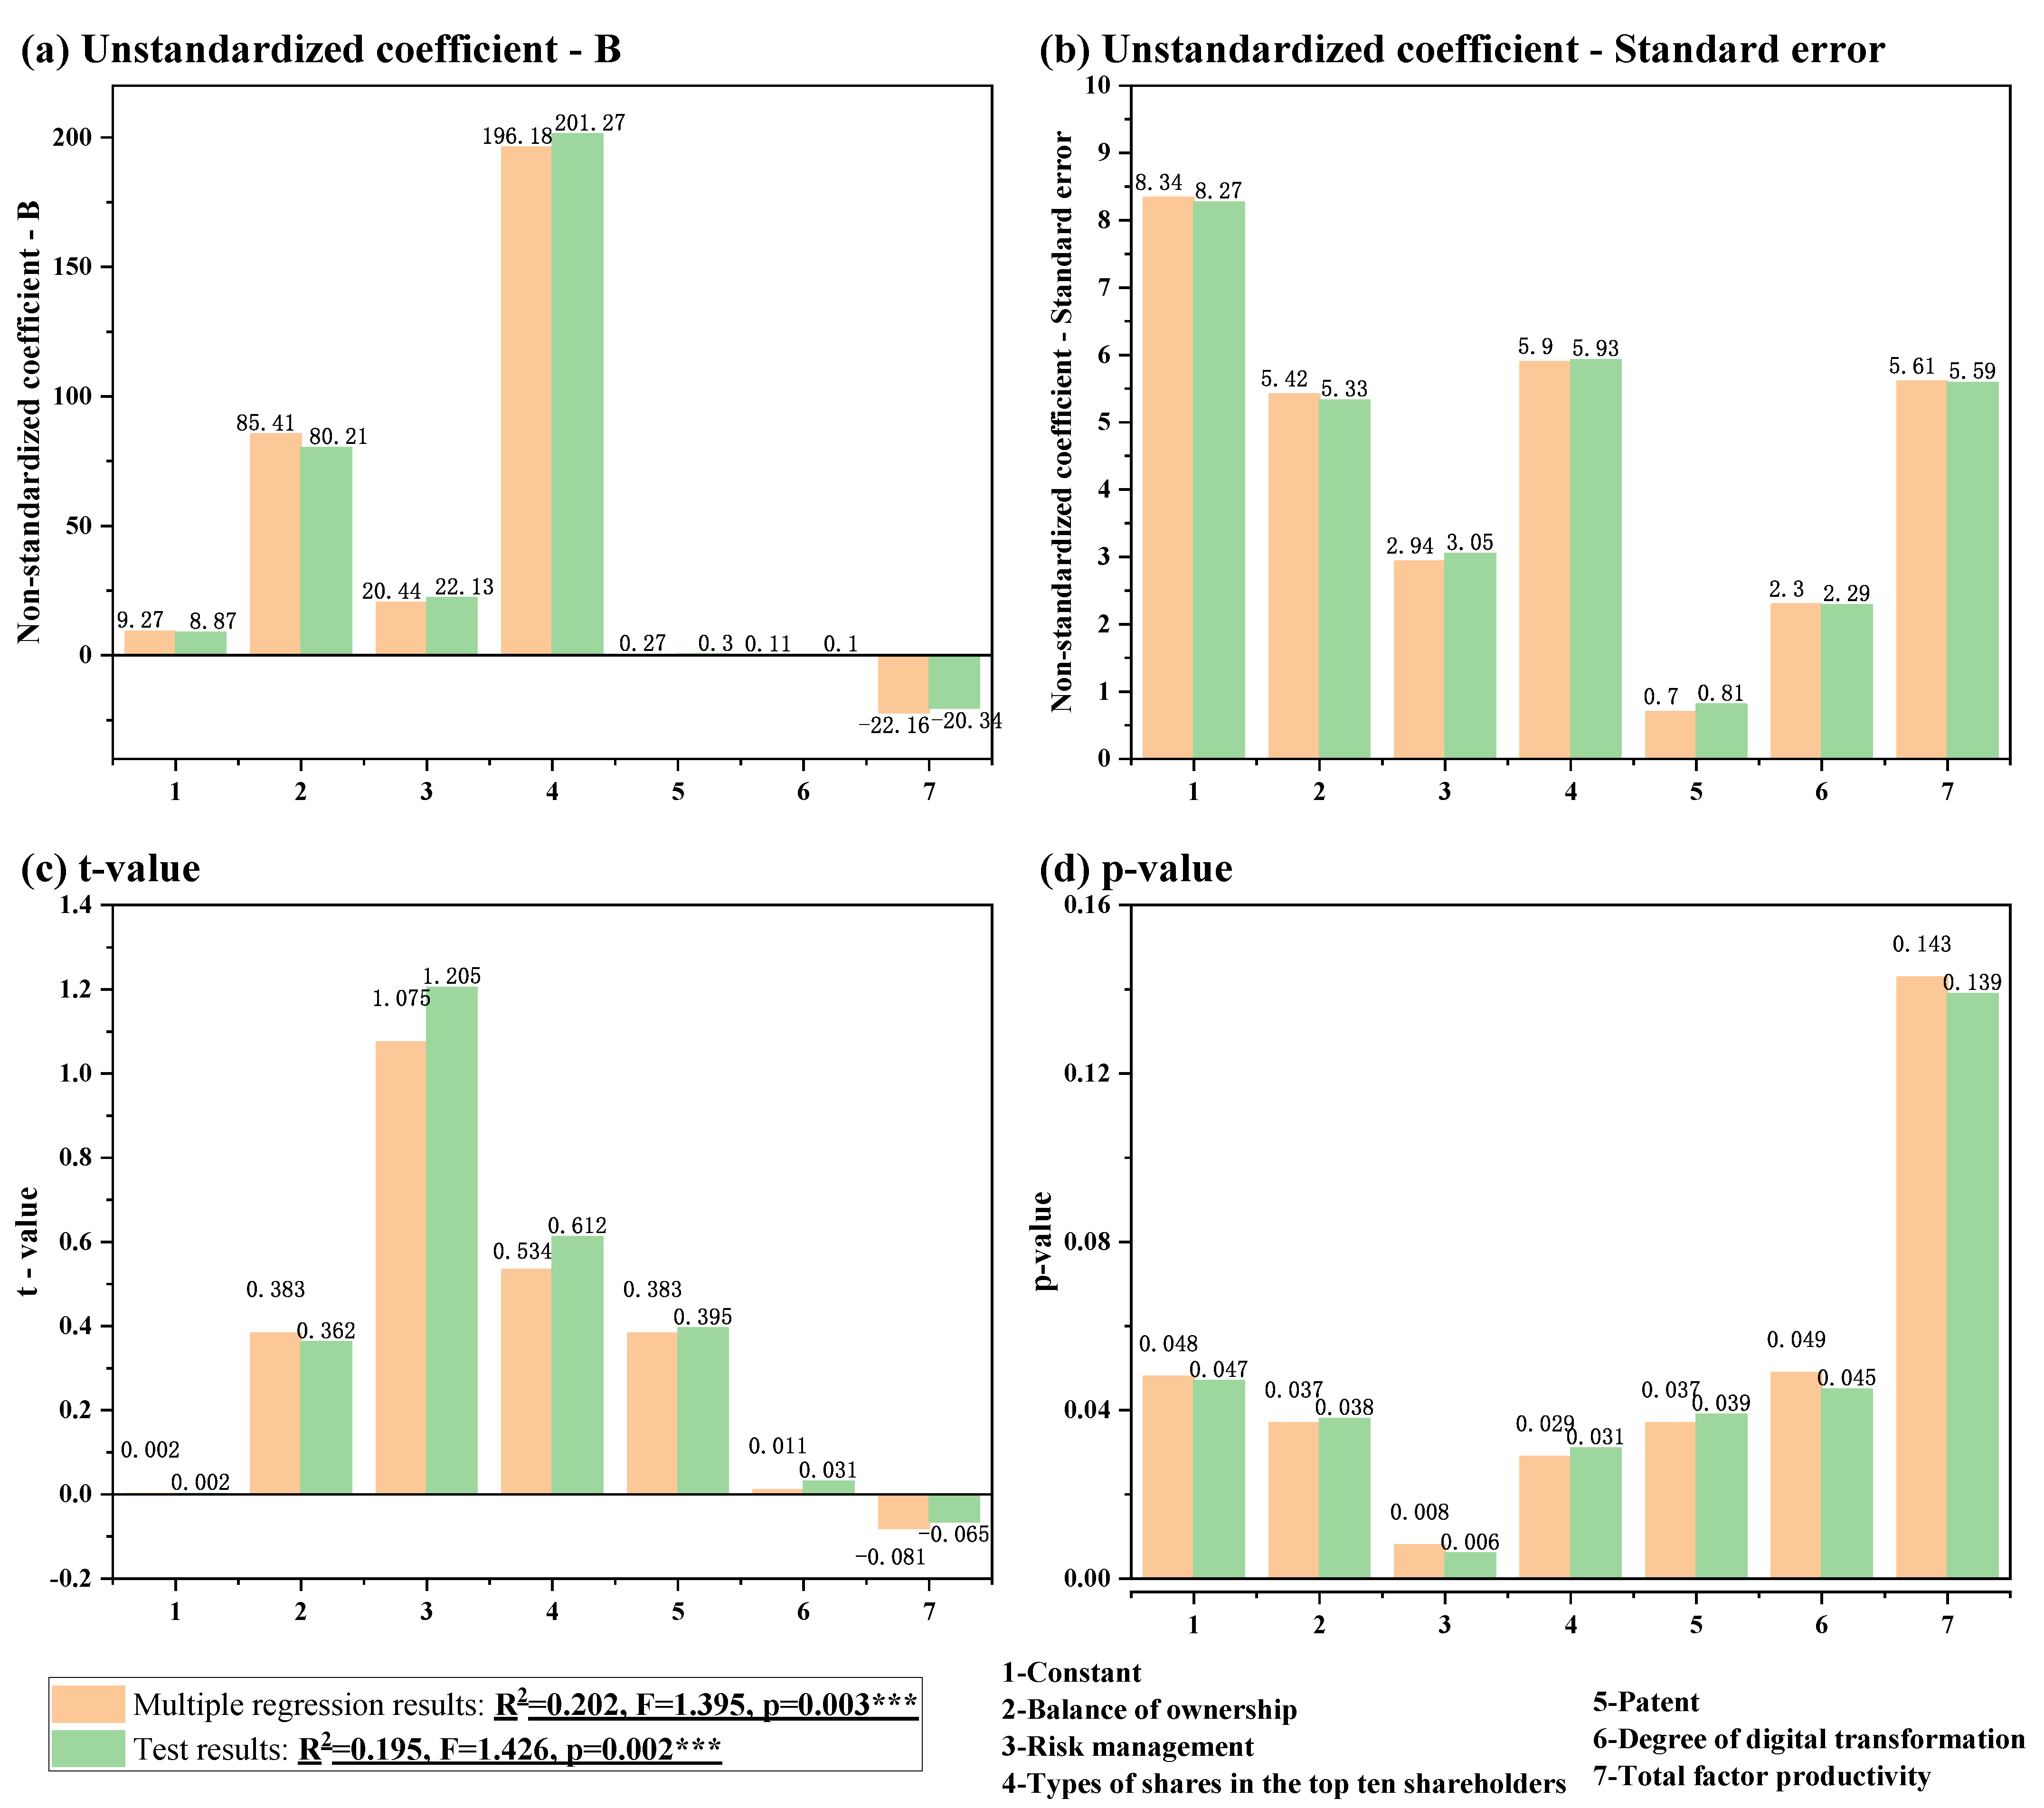
The multiple linear regression algorithm was mainly used to analyze the impact of six variables, including the degree of equity checks and balances, risk management, the type of equity in the top ten shareholders, patents, the degree of digital transformation, and total factor productivity, on the green and high-quality development of enterprises. To unify each variable, the logarithm of each variable was taken and then regression was performed. The specific model is as follows:
where:
εi is the error. To verify the robustness of the model, this paper uses the explanatory value
y1 of the green and high-quality development of enterprises obtained by principal component analysis instead of
y to perform multiple linear regression on the entire sample data again. If the results of the two are consistent, it can be proved that the model is robust. The stability test model is as follows:
- (2)
One-way ANOVA
One-way ANOVA, also known as the “
F-test”, aims to verify the significance of the mean difference between multiple samples (two or more). The main idea is to make statistics on the contribution of control factors and random factors to the overall change; that is, to compare the different contributions between different groups, to clarify the contribution of control factors (different groups) to the overall change. Among them, the analysis of the variance of a single factor is mainly to examine the average effect of each factor in the case of more than two factors of a certain factor. The establishment of the
F-statistic is an important step. The calculation method of the
F-statistic is:
where
MSA was the between-group mean square with
k − 1 degrees of freedom and
MSE was the mean square within groups with
n − k degrees of freedom.
3.2.2. ML Prediction Models
For multi-feature models, using traditional linear regression methods will have great drawbacks, because the larger the number of features, the weaker the linear relationship of the model will be. After modeling, the effect will be worse. If the classification method is used to process the data, the subjectivity of the established model will be strong, and the general performance of the model will be reduced. Therefore, the use of machine learning algorithms is more advantageous. However, using ordinary machine learning algorithms will have parameters such as initial weights and thresholds that randomize factors. Therefore, using the data itself, parameters such as initial weights and thresholds are obtained from the data through a genetic algorithm. Thus, the data is analyzed using machine learning combined with genetic algorithm optimization.
To solve the nonlinear problem of influencing factors, the random forest regression algorithm, the random forest regression algorithm optimized by genetic algorithm, the support vector machine regression algorithm, and the support vector machine regression algorithm optimized by the genetic algorithm are used in this paper. Breiman introduced a new CART decision tree in 2001. The main idea is to use randomization to generate a forest containing multiple independent CART decision trees, and the final regression prediction is performed through all decision trees [
50]. Due to the existence of two random variables in the random forest method, the accuracy of the established mathematical modeling is affected to a certain extent, so it is necessary to optimize the two parameters. On this basis, the genetic algorithm is used to optimize the two types of indicators. The optimization contents include: firstly, optimizing the number of attribute variables of the tree node reflecting the state of a single decision tree; and secondly, optimizing the number of attribute variables representing the size of the entire random forest. The number of trees was optimized [
51]. The model constructed by using the random forest method can not only obtain the expected effect, but also rank the importance of each factor, so that different types of remodeling can be compared intuitively. A measure of this degree is the average drop precision. The basic idea is to add interference noise to all the features of the sample, and evaluate the importance of the features through the change in the model accuracy. If the value is larger, the importance of the feature is higher [
52].
In recent years, neural network algorithms in machine learning have been widely used in various industries [
53,
54]. The prototype of a neural network is a perceptron. A single perceptron has a strong ability to solve linear problems. A neural network is a model that combines multiple perceptual machines. The advantage is that the output layer can be a single layer or multiple layers [
55]. Therefore, it is very suitable for regression and classification. Common neural networks include the BP neural network, extreme learning machine, etc. Among them, the extreme learning machine has more advantages in small sample processing [
56]. With support vector machine algorithms, neural networks can learn and discover hidden mappings without explicit mathematical equations. Random parameters also exist in support vector machines. The weights and thresholds for each input are random. This will cause the model built to be random, and the predictions to be random. To solve this kind of problem, this paper uses a genetic algorithm to optimize the support vector machine algorithm, establishes the optimization model, and compares the results of the two models.
For the above different regression models, this paper intends to evaluate the results of the training model through the goodness of fit
R2. The calculation formula is:
After establishing the model, the established model was used to predict the performance. The prediction performance of each model was evaluated by
MAE,
MAPE,
MSE, and
RMSE. The solution formula of the evaluation index was as follows.
5. Performance Forecasting Model
After obtaining 1364 groups of samples, it was observed that the variables have great differences in units and values. The ordinary logarithm method still cannot eliminate the gap between the variable values. Therefore, the normalization method was adopted. Here, modeling was carried out based on standardization. All the functions in this article were implemented by SPSS and Python software. The core idea of normalization is to scale all data between 0 and 1 through the maximum and minimum values. This method is not only conducive to data operations, but it can also improve the accuracy of the model and improve the speed of calculation. The normalized data was randomly divided into test sets and training set. Due to a large amount of data, the proportions of the test set and training set are about 0.9 and 0.1, respectively. For the convenience of calculation, 130 groups were randomly selected as the test set, and the rest were used as the training set, and the random grouping was used for all subsequent comparisons between models. It should be noted that the variables that have an impact on the green and high-quality development of enterprises have been obtained in the previous article. Therefore, only the nature of equity, the degree of equity checks and balances, industries, risk management, and the top ten that have an impact on the green and high-quality development of enterprises were selected in the modeling. There are seven variables including the type of equity, patents, and the degree of digital transformation among shareholders.
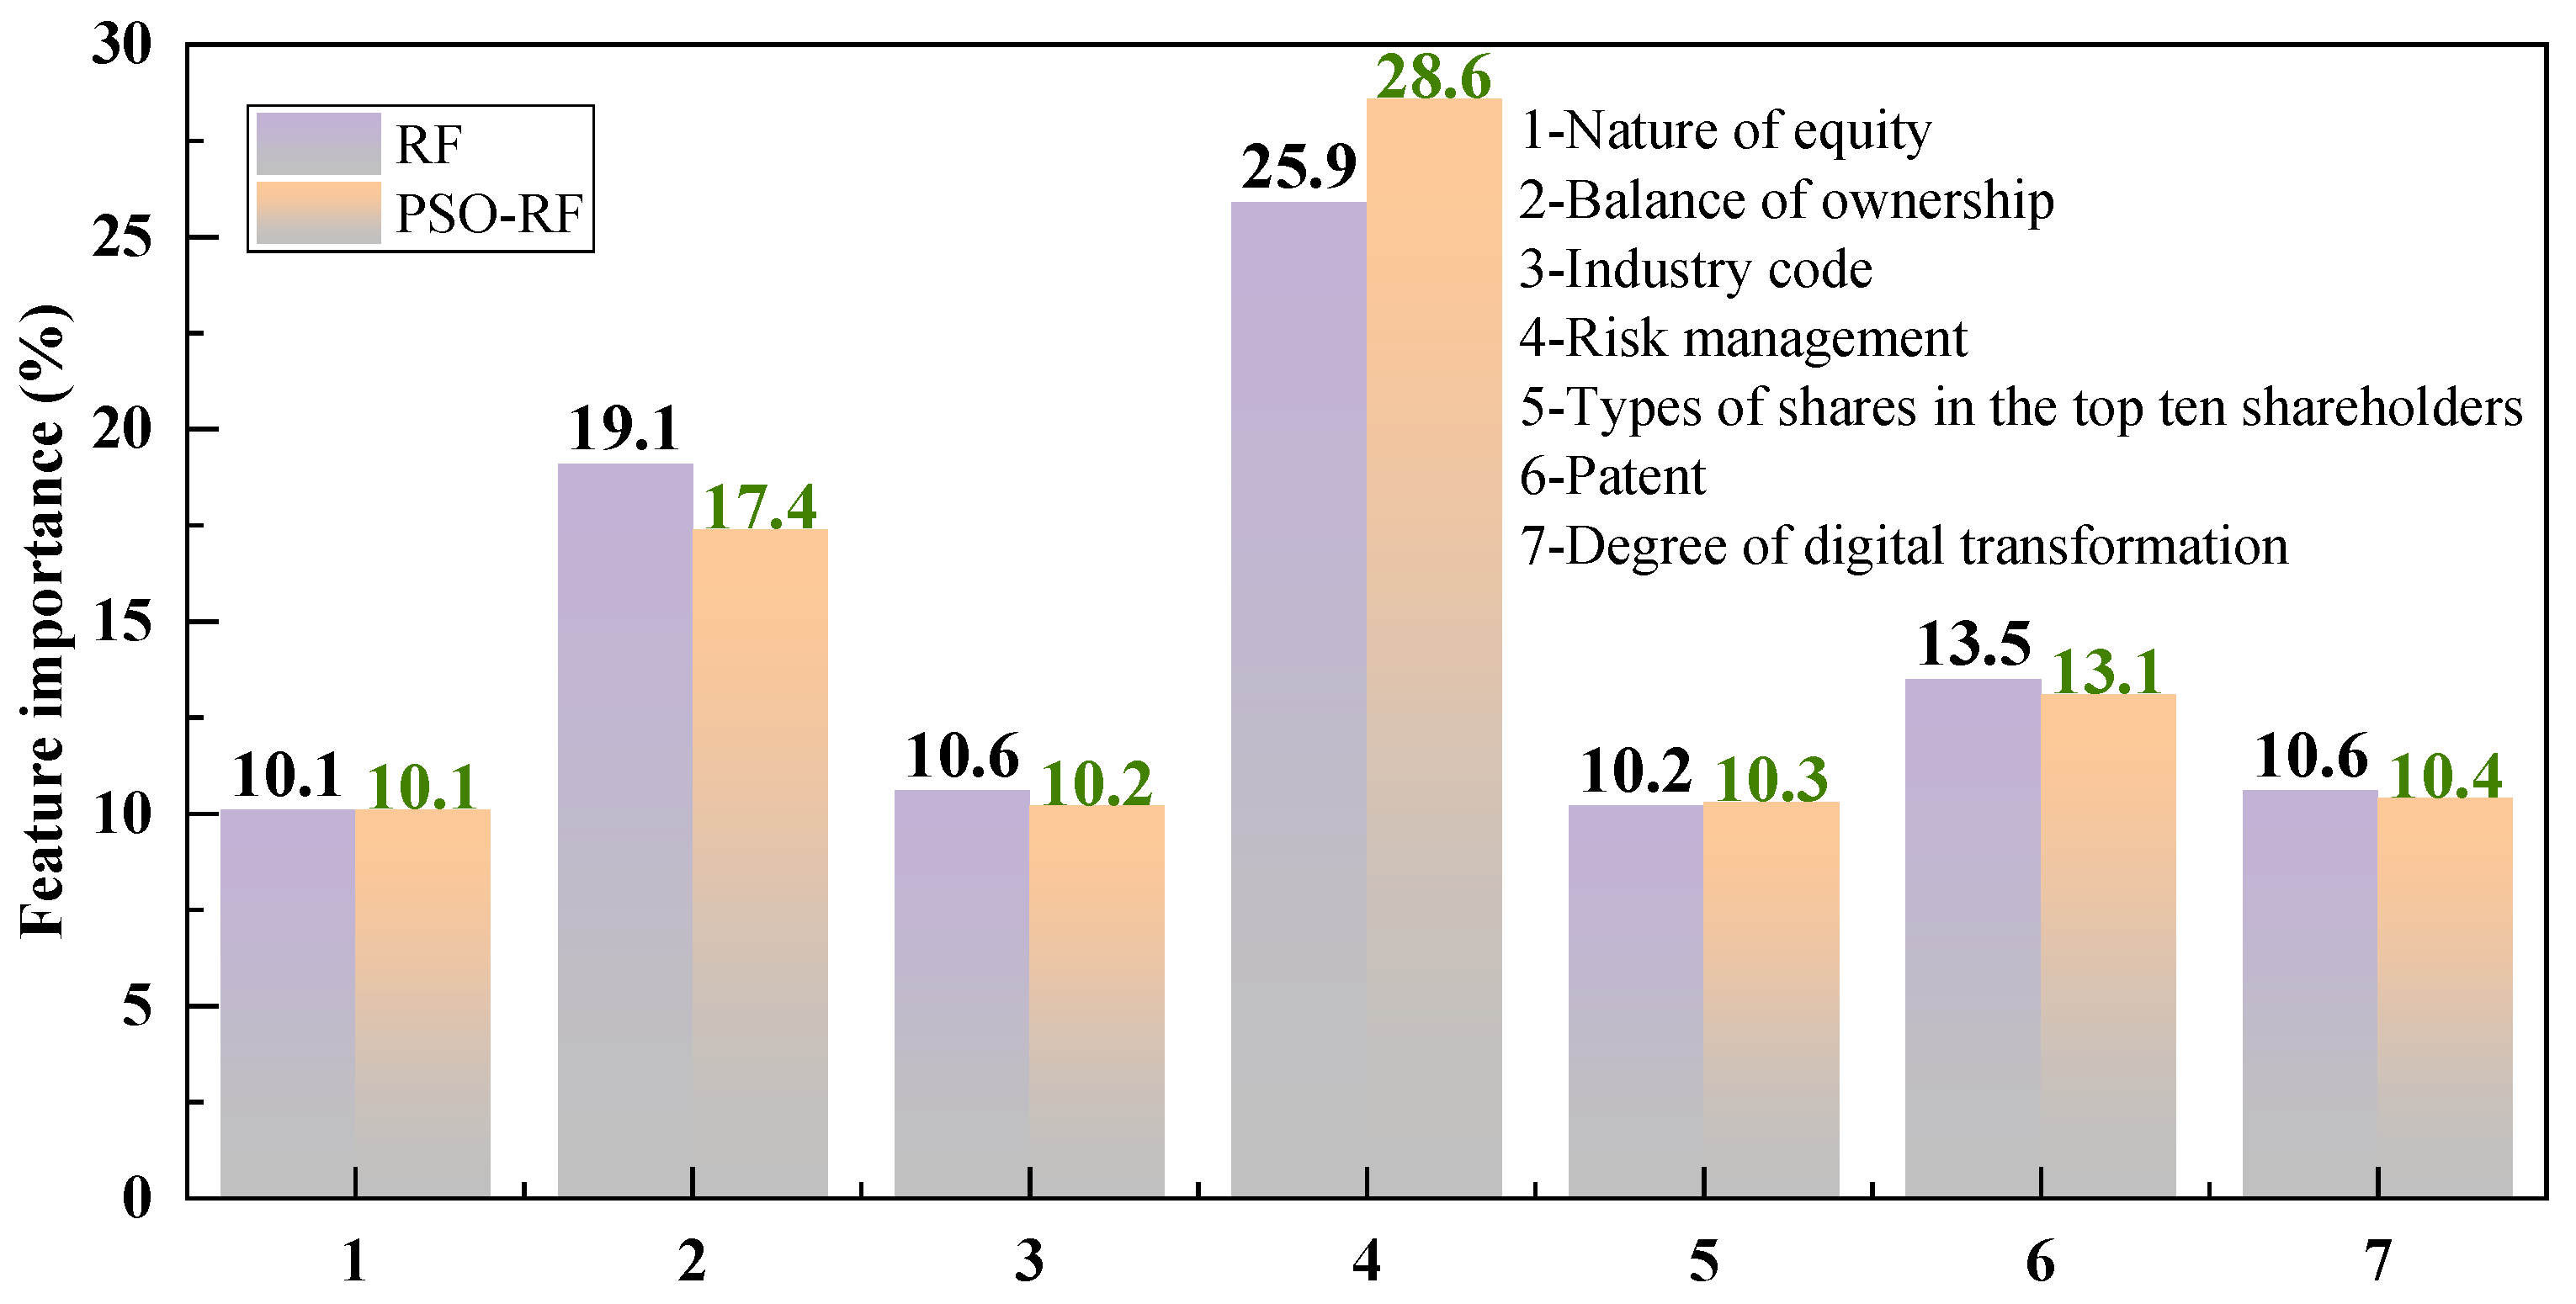
The research results in the existing literature show that the traditional multiple linear regression is not effective in solving problems such as multi-characteristics and nonlinearity, so it cannot accurately predict the green and high-quality development status of enterprises in the future. To find a better regression prediction model for the green and high-quality development status of enterprises, this paper compares a variety of machine learning algorithms. Among them, the random forest algorithm has its particularity. While obtaining the regression prediction results, it can also obtain the importance ranking of variables, which can help us analyze the importance and influence of variables on the green and high-quality development of enterprises from a nonlinear perspective. The importance of variables in the regression model established by the random forest algorithm is shown in
Figure 10.
From a nonlinear perspective, it is not difficult to see that risk management has the greatest impact on the green and high-quality development of enterprises, reaching 25.9%; followed by equity checks and balances, patents, etc.; the nature of equity has the lowest impact on the green and high-quality development of enterprises, only 10.1%. It shows that from a nonlinear perspective, whether an enterprise can achieve green and high-quality development, the first thing to consider is the enterprise’s risks. An enterprise that cannot take risks and reasonably reduce risks will not be able to develop sustainably and healthily, let alone achieve green development. In addition, the next thing companies need to consider is equity integration and innovation. However, on the whole, compared with the linear perspective, the importance distribution of different influencing factors is more balanced, and the weights do not appear to be concentrated in a few variables. After comparing linear and nonlinear structures, it is not difficult to find that the importance rankings obtained by building models in different ways are quite different. However, in the two methods, the equity balance and patents are in the top three in the importance ranking, indicating that no matter whether a linear or nonlinear algorithm is used for modeling, the equity structure and innovation are both factors that enterprises need to consider if they want to achieve green and high-quality development. At this time, the number of feature variables and the number of trees in the random forest model are random, which will lead to uncertainty in the results. Therefore, the genetic algorithm was used to optimize these two values. The importance of variables in the optimized model is shown in
Figure 10.
After comparing the feature importance of each variable before and after optimization, it is not difficult to find that on the whole, the feature importance ranking and proportion of each variable are the same, and only some variables have slight changes, which proves that the model based on the random forest algorithm has certain characteristics of stability. In addition, compared with the relative average variable weights before optimization, the weights of variables after optimization are more prominent, which proves that the optimization has a certain effect, but the specific effect still needs to be further studied. Although random forest can solve the problem of regression prediction, it cannot solve the problem of result prediction outside the scope, and a support vector machine can handle this problem better. In addition, this paper also uses a genetic algorithm to optimize the support vector machine algorithm. The explanatory power of each regression model established with the training set data is shown in
Figure 11.
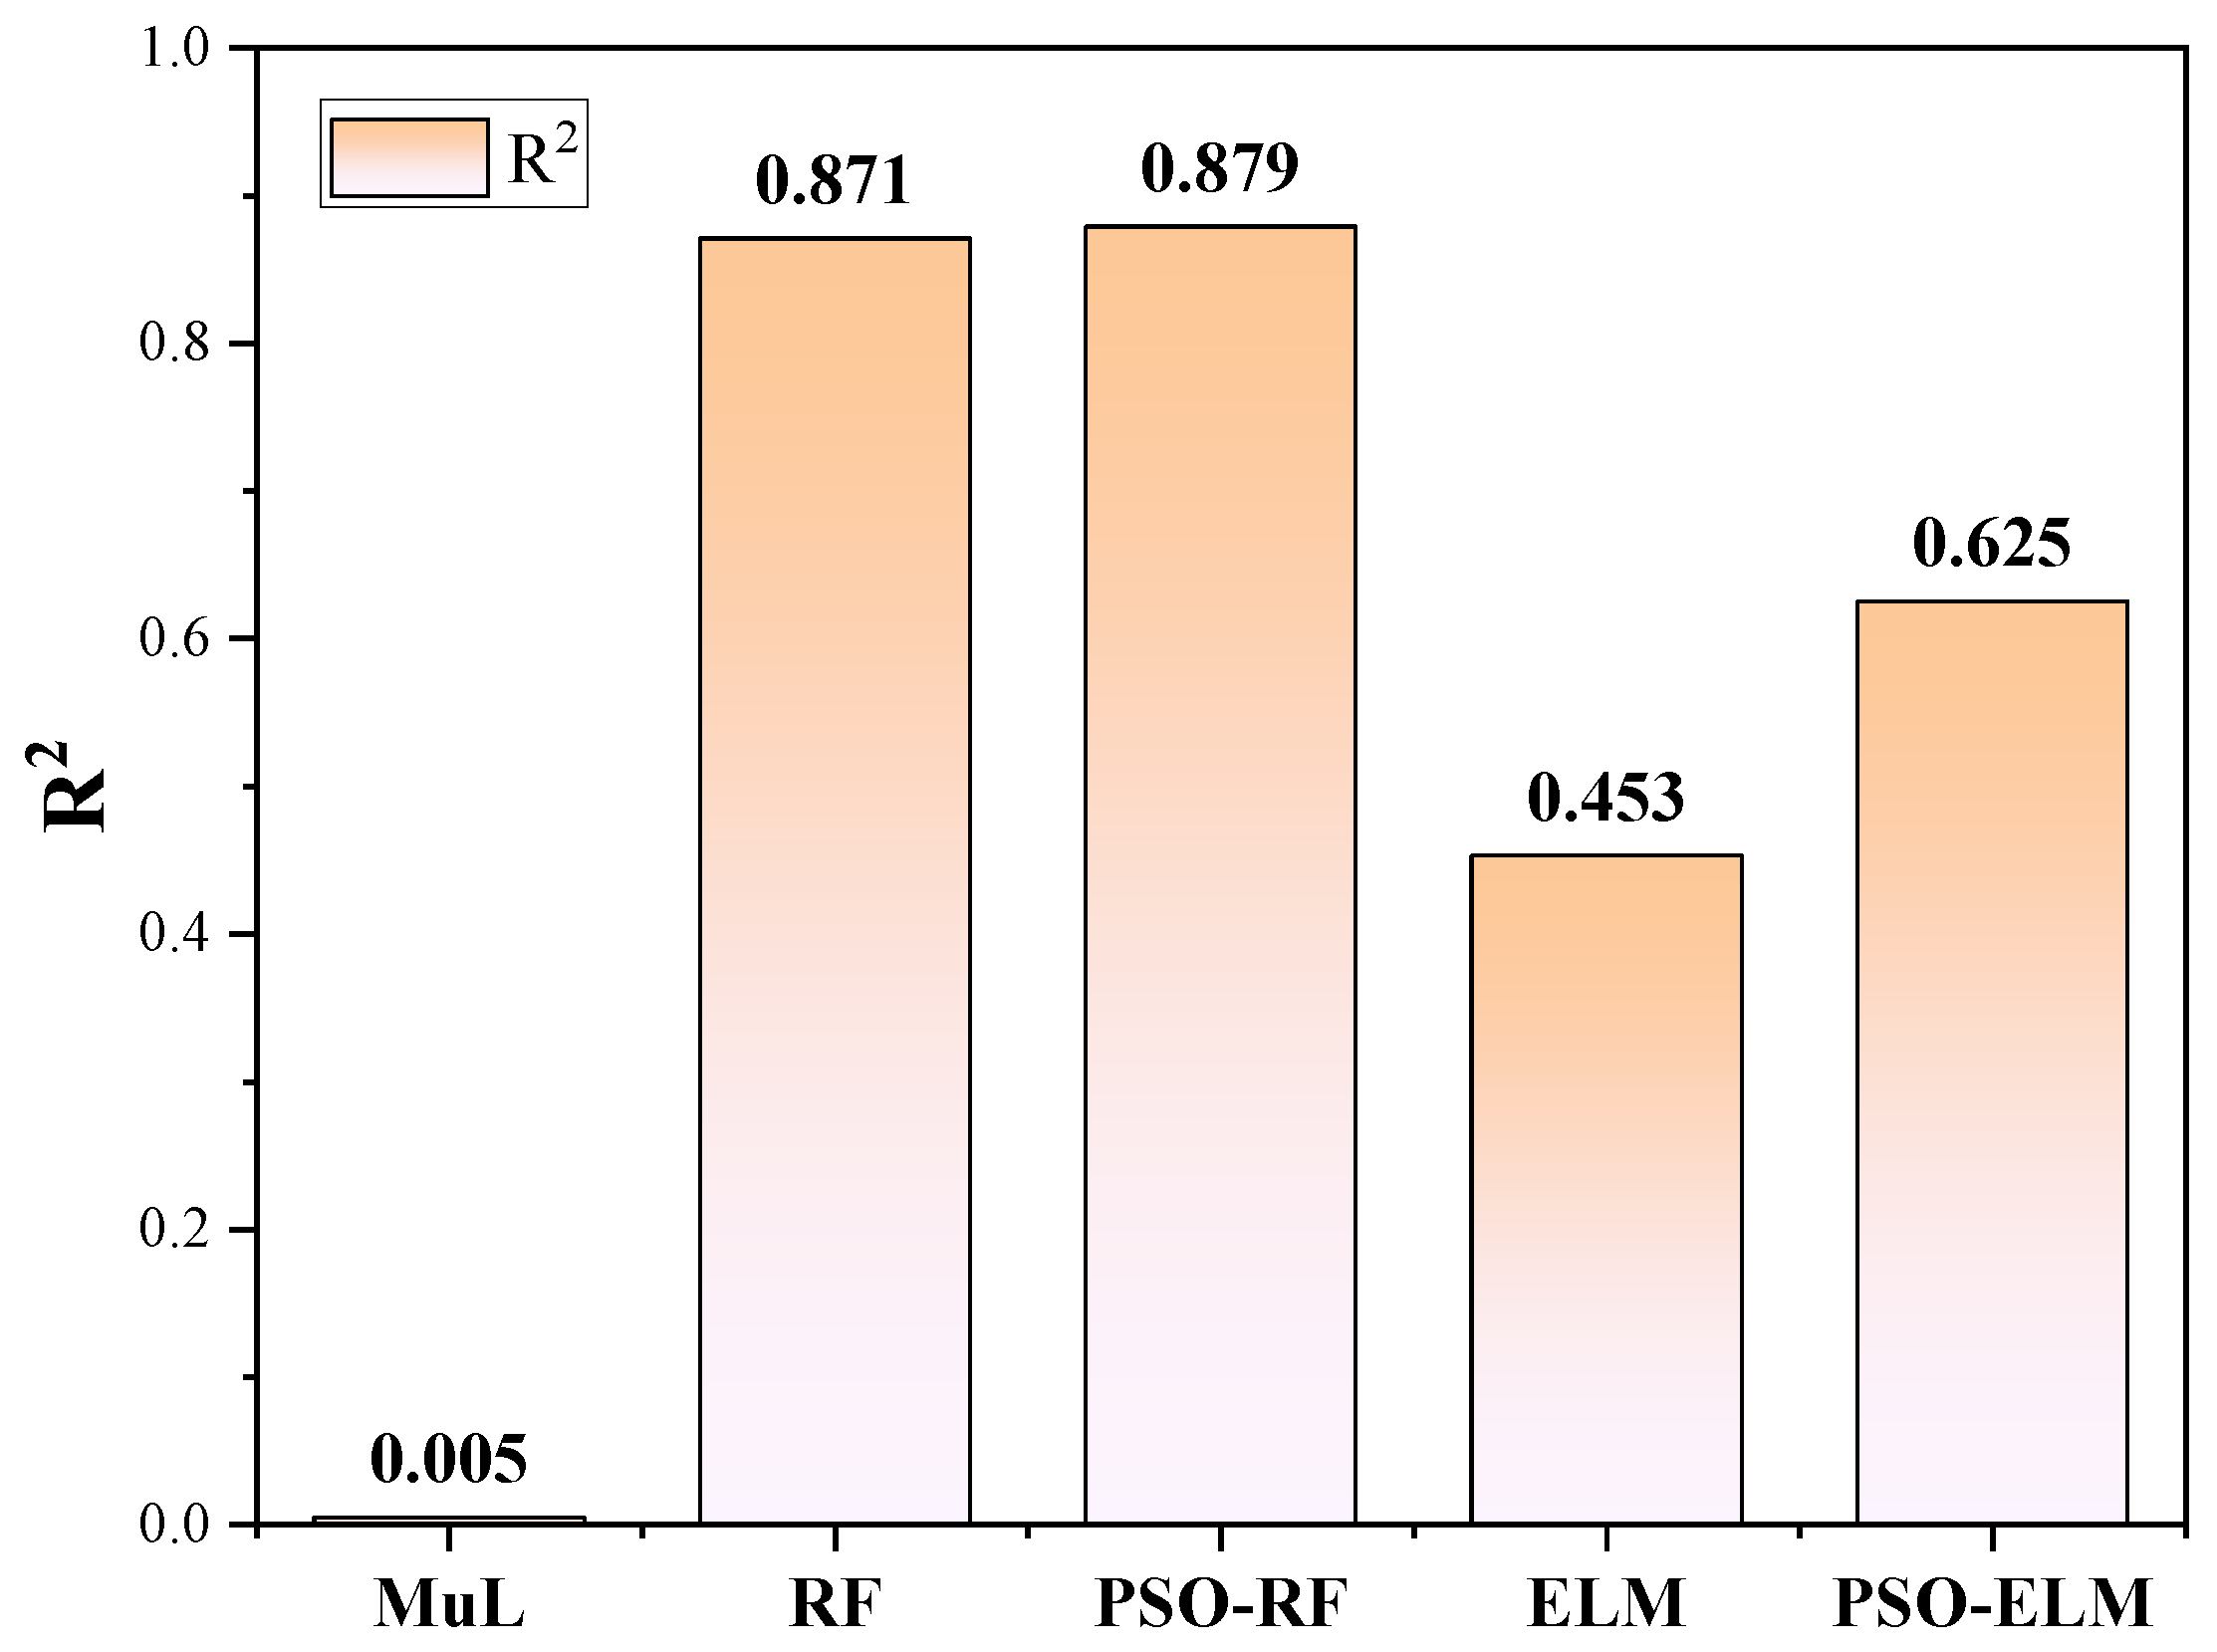
As can be seen from
Figure 11, among the five regression models, the random forest algorithm based on genetic algorithm optimization has the best effect, with R2 reaching 0.879; that is, the training model can explain 87.9% of the performance of venture capital funds. Similarly, although the regression effect of the support vector machine algorithm is not as good as that of the random forest algorithm, it is also better than the traditional linear regression algorithm. The above results show that in the training model, nonlinear regression has a good explanatory effect on the green and high-quality development of enterprises. After the above work is completed, we used the previously divided test set data to verify the five regression models established. The regression effects of different models are characterized by four quantitative evaluation indicators: MSE, RMSE, MAE, and MAPE. The evaluation indicators of each model are as follows.
It can be seen from
Table 4 that among the five regression models, the linear regression has the worst effect, which proves that the influencing factors of the green and high-quality development of enterprises are nonlinear. The error of the support vector machine model and its optimization model can also reflect that it has a certain regression prediction ability, but the accuracy and stability are slightly lower than those of the random forest and random forest optimization models. In contrast, all errors of the proposed GA–RF model are the smallest among all models, but there is still room for improvement, indicating that the factors affecting the green and high-quality development of enterprises are still incomplete and further research is needed.
On the whole, the green and high-quality development of Chinese enterprises is still at a relatively low level. Compared with developed countries, there is still a long way to go. However, with the opening and transparency of information in recent years, the trend of green and high-quality development of enterprises has accelerated, and in high-tech and high-value-added industries, the trend of green and high-quality development of enterprises is faster. This shows that Chinese enterprises are moving in the direction of green and high-quality development, the government needs to strengthen guidance, and enterprises themselves need to pay enough attention.
The research of this paper shows that the nature of equity and innovation ability play a crucial role in the image of green and high-quality development of enterprises, and empirical analysis was carried out through the data of Chinese enterprises. The industry in which the company operates has a significant impact on the development of the company. The more high-tech or high-value-added industries are, the more likely they are to achieve green and high-quality development, which is consistent with the view held by most scholars. This paper uses various methods such as linear regression, one-way analysis of variance, and machine learning to determine which influencing factors have the greatest impact on the green and high-quality development of enterprises, and which factors are more conducive to the realization of green and high-quality development of enterprises. This paper analyzes all the features that can be extracted from the current public data, which can help us comprehensively understand the impact of industries and influencing factors on the development of enterprises, rather than a single study of a single factor. It is worth noting that the green and high-quality development status of enterprises will continue to change with the changes in the general environment. Therefore, relevant institutions need to understand the development status of enterprises in real-time, and formulate a series of policies to achieve the correct guide.
To further study the relationship between the influencing factors and the green and high-quality development of enterprises, this paper selects the multiple linear regression algorithm and different machine learning algorithms for discussion. There may be better models in terms of green high-quality development and the characterization of feature importance, but under the premise of considering multiple features at the same time, the results of the model are sufficient to satisfy our hypothesis; that is, the nature of equity and innovation ability are important to corporate green high-quality development and have a significant impact.
6. Conclusions
There are many methods for evaluating the green and high-quality development of enterprises, and each enterprise and government agency may have its own set of solutions. Starting from the universal applicability, this paper discusses the influencing factors of the green and high-quality development of enterprises from the nature of equity and innovation ability, and makes an empirical analysis based on it again. The research results show that the machine learning model has good robustness in solving the problem of the green and high-quality development of enterprises, so it can be used as a reference for enterprise development planning and government policy formulation. This paper takes the relevant enterprise data in China from 2008 to 2020 as the research object, deeply discusses the influencing factors of the green and high-quality development of Chinese enterprises from a linear and nonlinear perspective, and further uses machine learning algorithms to establish a regression model for the green and high-quality development of enterprises, to provide advice for enterprise planning and development and government policy formulation. The main research conclusions are as follows:
There is a convex correlation between the equity balance of an enterprise and green and high-quality development. The transition of equity is not conducive to the decision-making of the enterprise, which will hinder the development of the enterprise; the transition of equity concentration can easily cause a situation of dominance, which is not conducive to the full. The use of shareholders’ resources will hinder the development of the enterprise. There is a significant relationship between the nature of equity and the green and high-quality development of enterprises. The explanatory value of the green and high-quality development of state-owned enterprises is much higher than that of private enterprises, indicating that the nature of enterprises will affect the green and high-quality development of enterprises. Therefore, the government can formulate relevant guiding policies according to the status quo, to promote the high-quality development of enterprises, especially private enterprises. There is a significant correlation between the green and high-quality development of industries and enterprises, and industries with high technology and high added value are more likely to achieve green and high-quality development. Therefore, it is necessary to strengthen guidance for some traditional industries and promote upgrading and transformation. There is a convex correlation between risk and green and high-quality development. Too low a risk is not conducive to stimulating the innovation and development potential of enterprises, but too high a risk will bring huge unstable factors to the enterprise, which is not conducive to the company’s sustainable development. Therefore, enterprises need to learn to control risks, to form a virtuous circle and promote the green and high-quality development of enterprises. The type of equity has a significant impact on the green and high-quality development of an enterprise. The more complete the type of equity, the richer the experience shareholders can provide, and the more conducive to the realization of green and high-quality development of the enterprise. There is a positive correlation between patents and the green and high-quality development of enterprises. Patents reflect the innovation ability of enterprises. The stronger the innovation ability of enterprises, the easier it is for enterprises to achieve green and high-quality development. The impact of the degree of digital transformation on the green and high-quality development of enterprises is similar to that of patents. The higher the degree of digital transformation, the more conducive to the green and high-quality development of enterprises.
This paper proposes a regression prediction method for establishing the green and high-quality development of enterprises using machine learning algorithms. It is proposed to use a random forest algorithm, support vector machine algorithm, and a hybrid algorithm optimized by a genetic algorithm to establish a prediction model, train the model, and use the prediction set for regression on this basis. A total of 1364 sets of data were used to establish the training set and prediction sum of the model, 130 sets of data were randomly selected as prediction samples, and the rest were used as training samples. The reliability and accuracy of linear regression and the above four models were compared. The results show that the proposed GA–RF hybrid model has excellent performance in predicting the green and high-quality development of enterprises, because the R2 value of the training set is high, and the error of the test set is low. In contrast, the models established by traditional linear regression algorithms are inaccurate and unstable. Therefore, it is of great significance to apply machine learning to the green and high-quality development of enterprises.
In addition, due to the limitations of the currently published data, there are still some influencing factors that are not covered in this paper. Therefore, this study did not incorporate these characteristics into the explanatory variables, which is also one of the focuses of the follow-up research work. In addition, the influence of the unique characteristics of private and state-owned enterprises on enterprises will be further explored in the follow-up research work. The results of this paper are based on data from state-owned enterprises and private enterprises in China, and the variability of business environments and government policies in different countries may have some impact on the results, but the general operating mechanism is close, especially the evaluation method constructed in this paper, which can be used as a basis for research on enterprise quality development systems in other countries.


