Research on the Evolutionary Path of Eco-Conservation and High-Quality Development in the Yellow River Basin Based on an Agent-Based Model
Abstract
:1. Introduction
2. Literature Review
- (1)
- a set of agents, including their attributes and behaviors;
- (2)
- a set of agent relationships, i.e., an underlying topology of connections that determines which agents interact with each other;
- (3)
- the agents’ environment, with which they can also interact.
3. Analysis of the Composite System
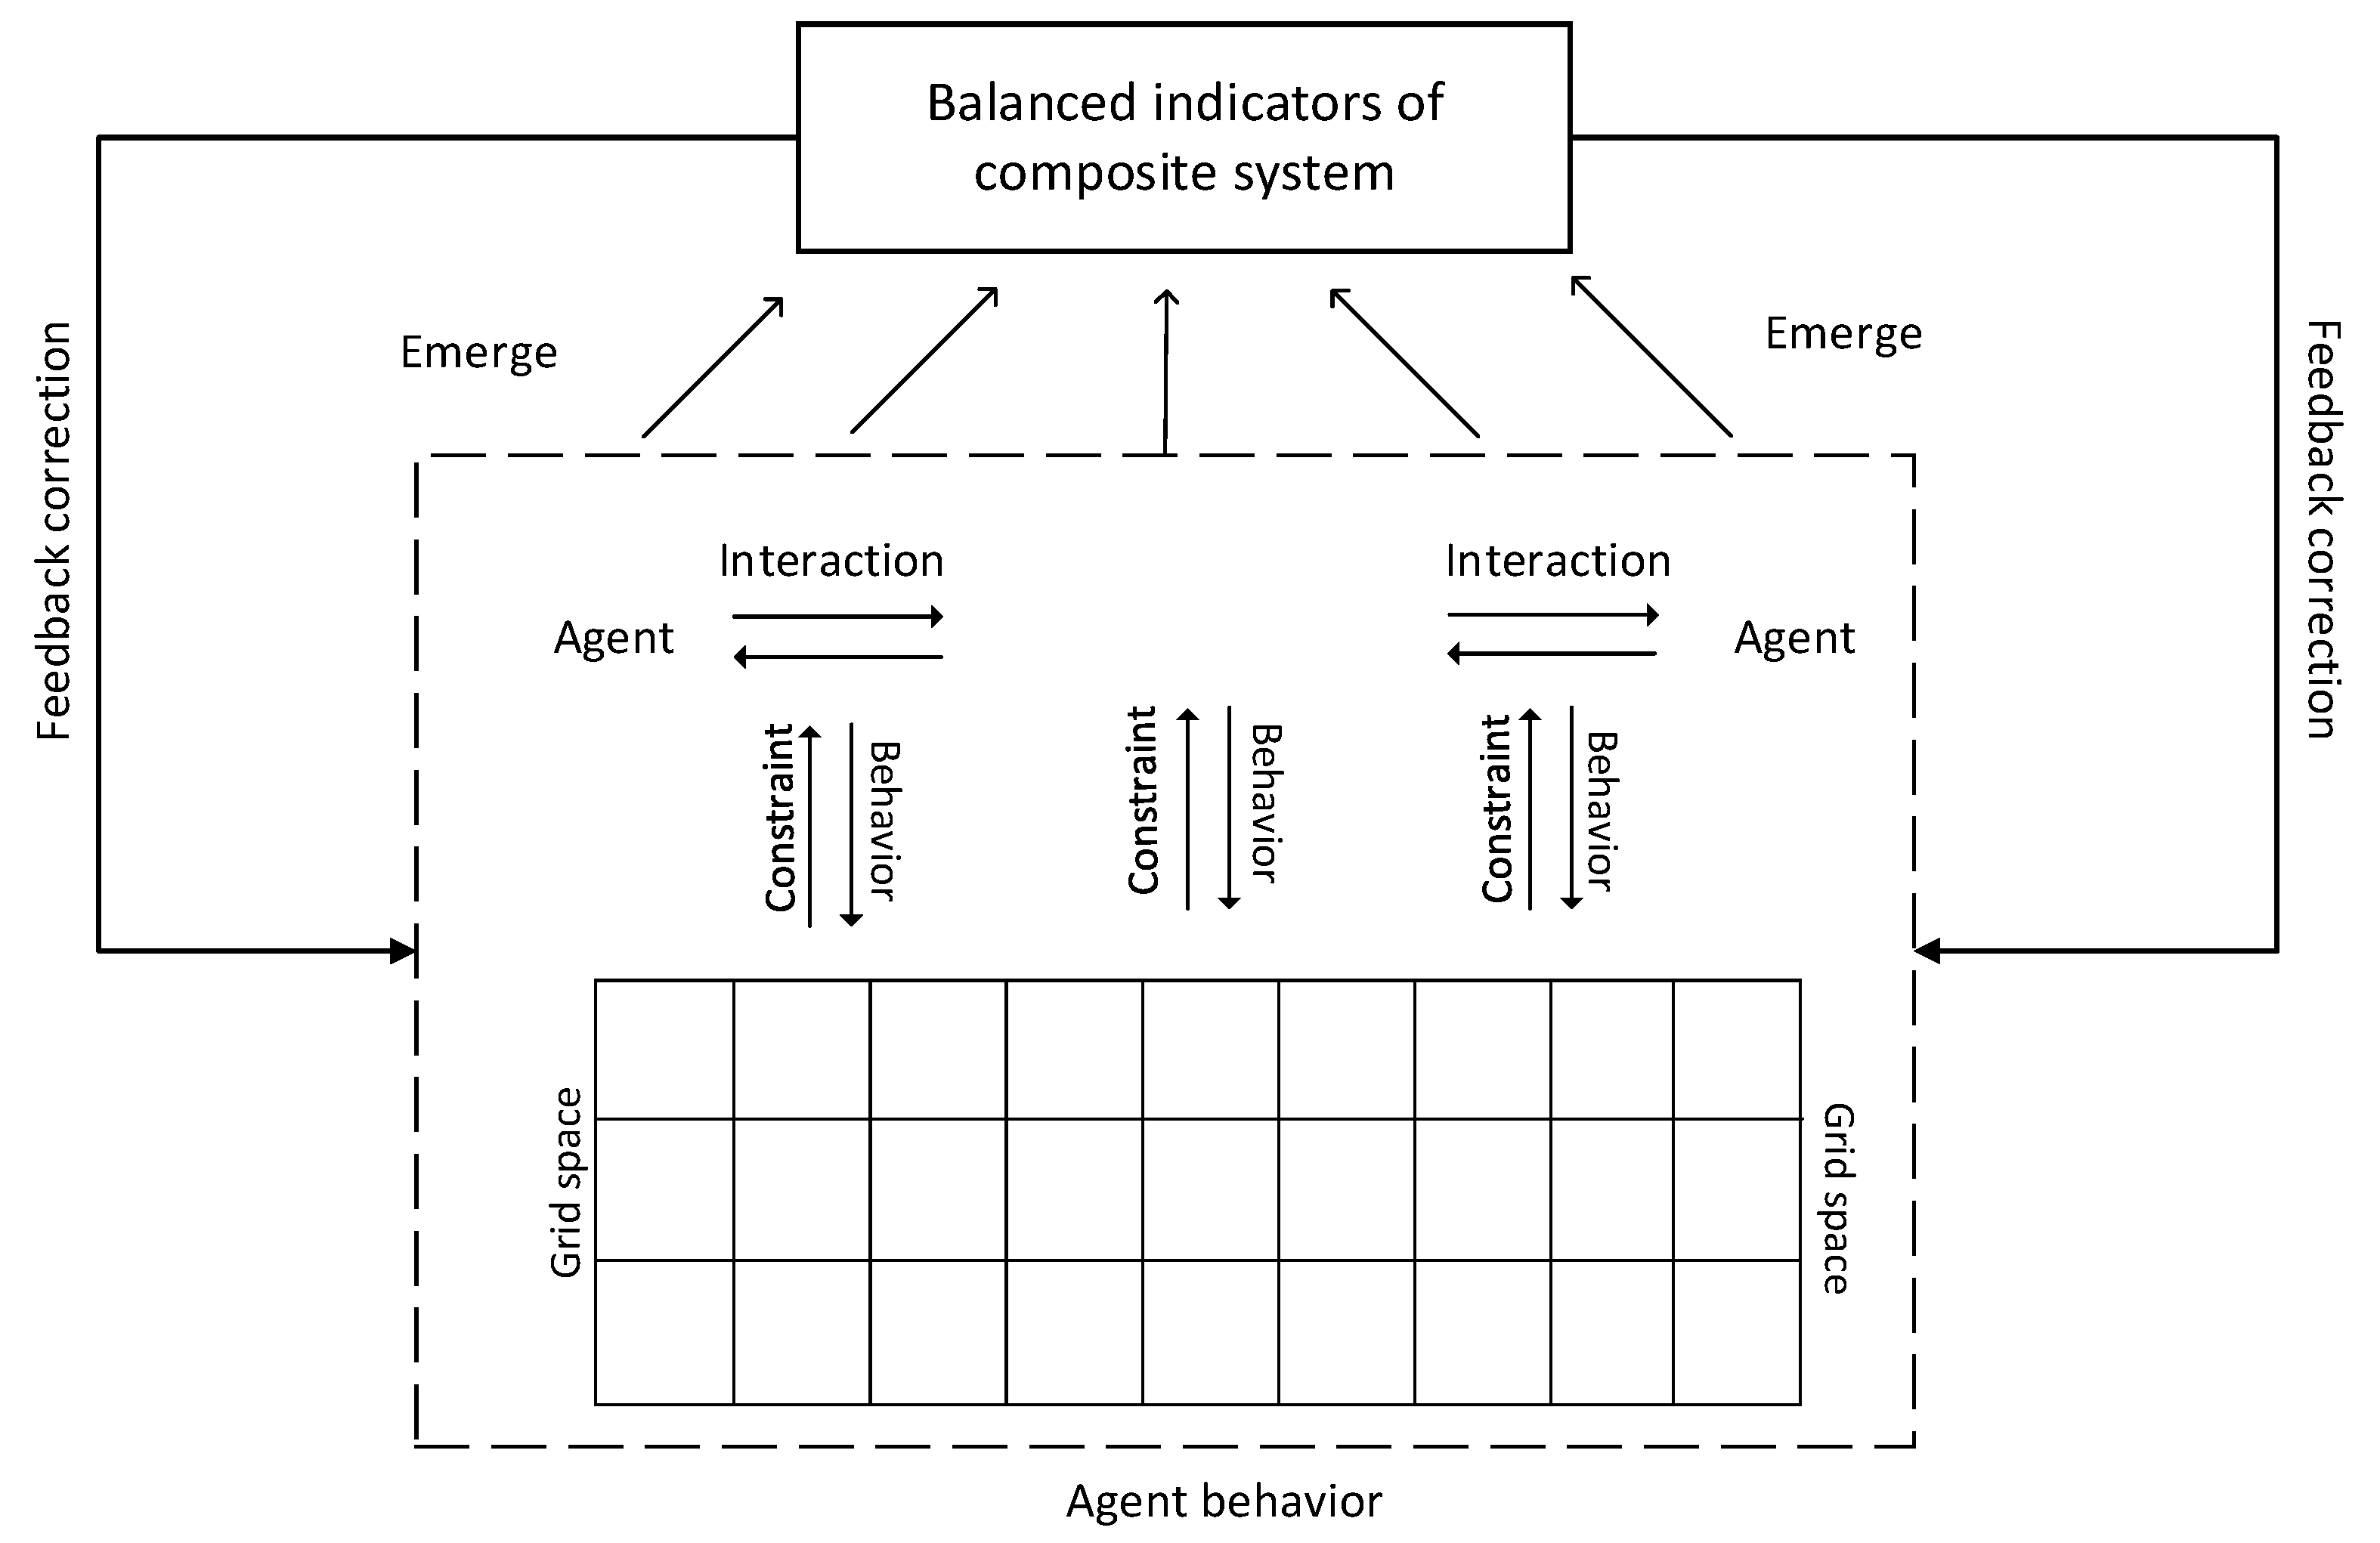
4. Construction of the Agent-Based Model
4.1. Agent Properties and Evolutionary Rules
4.2. Parameter Setting
5. Simulation of High-Quality Development Evolution under Different Scenarios
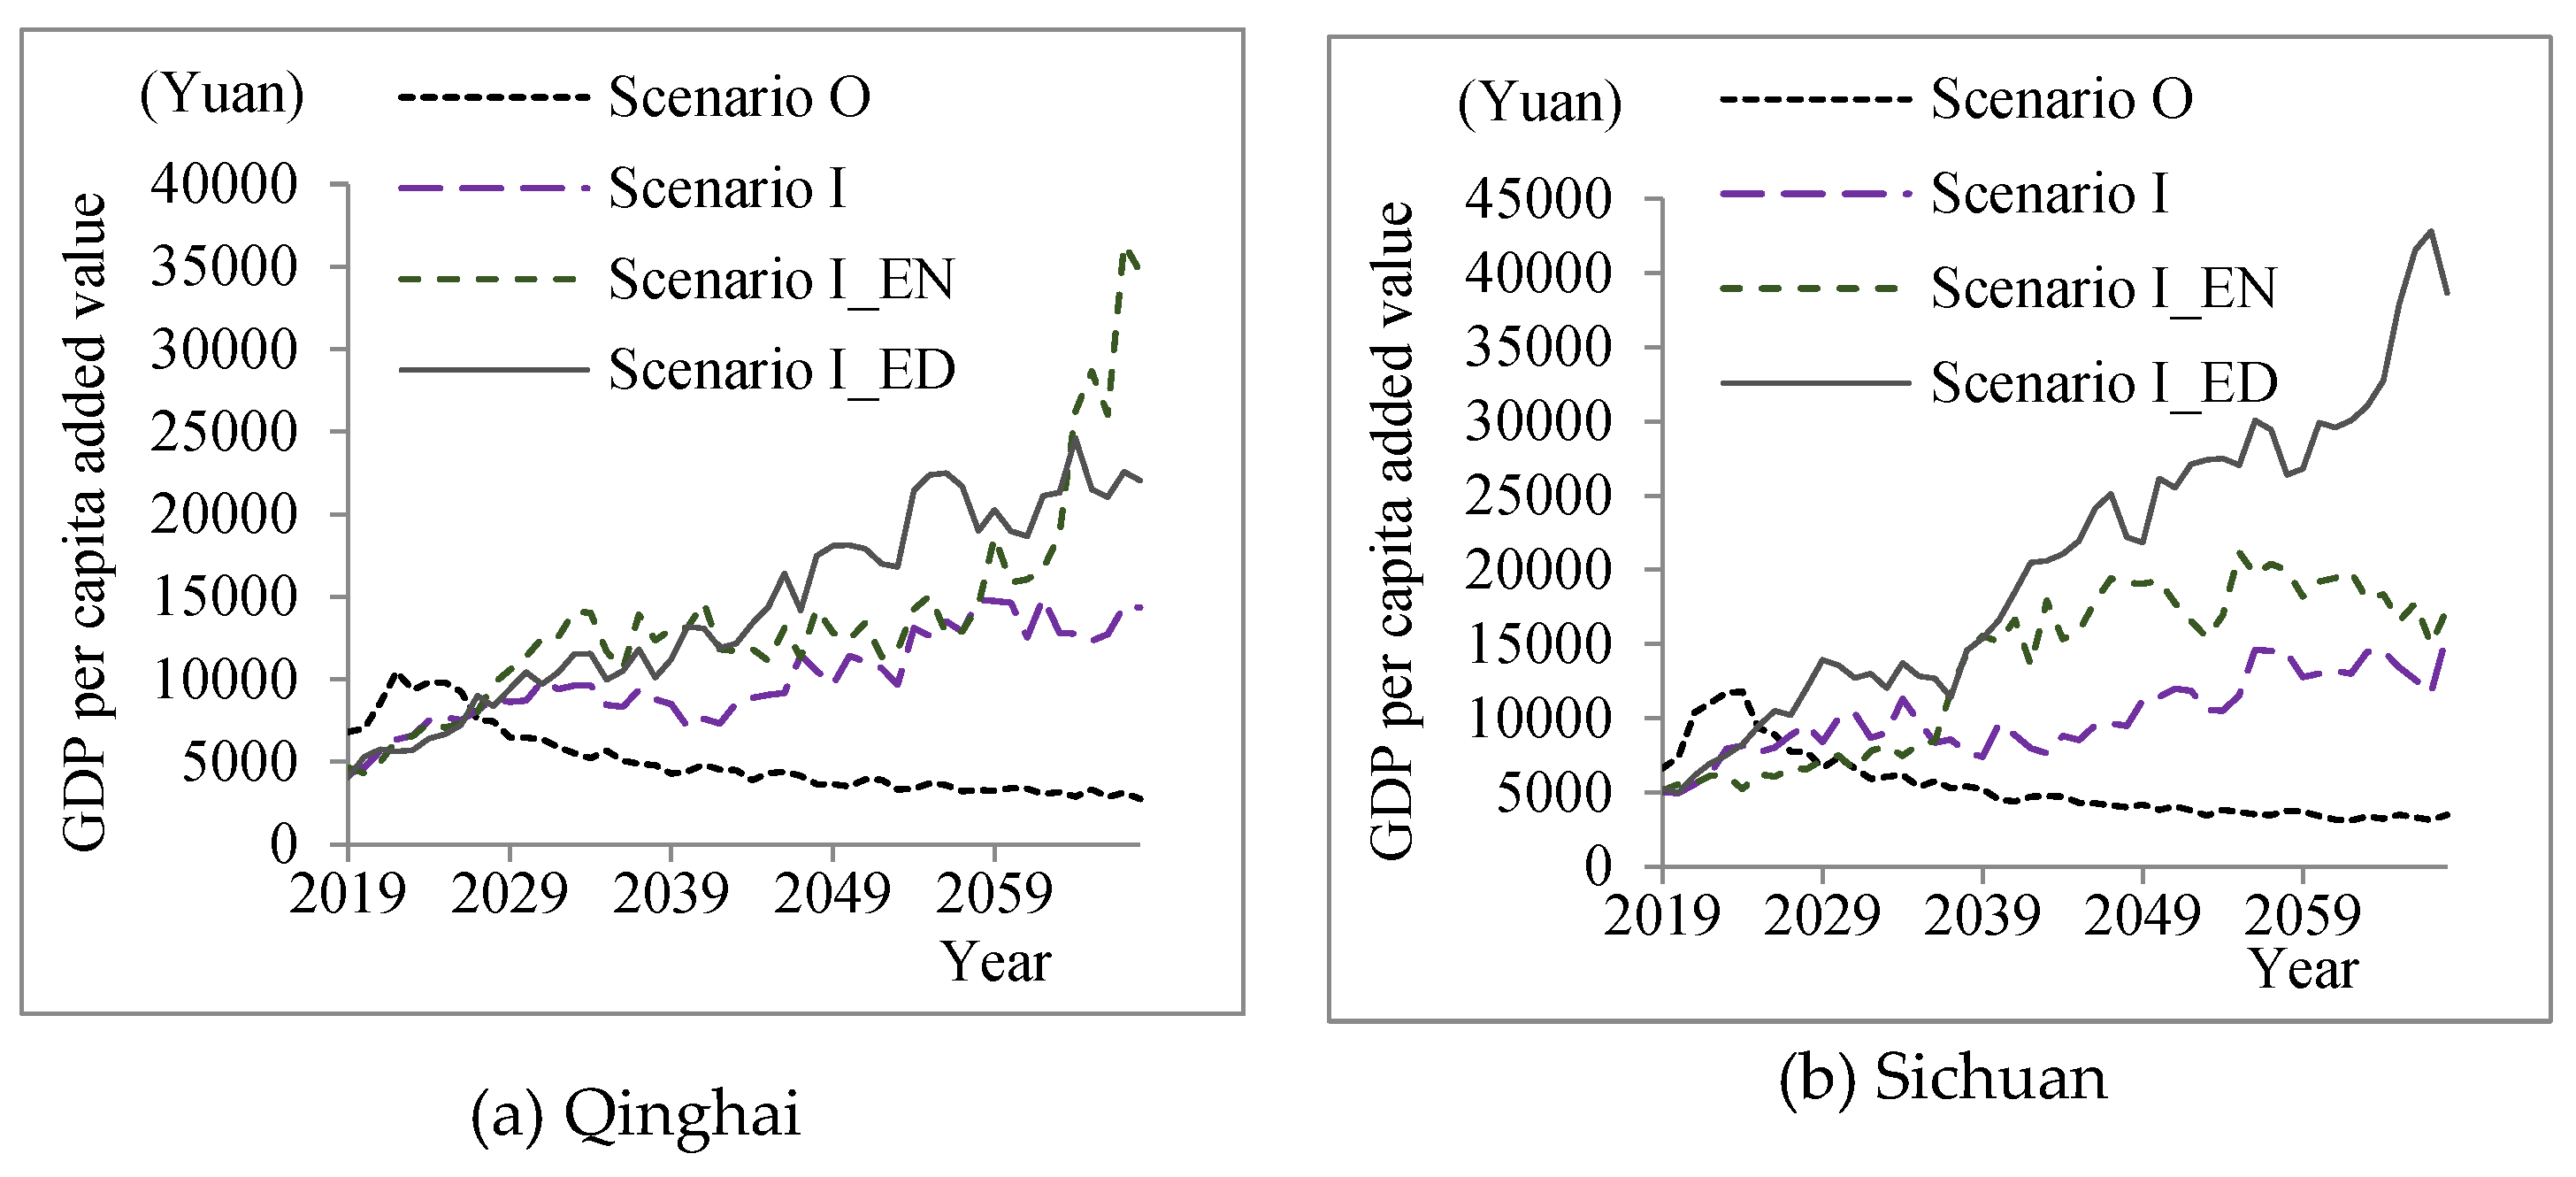
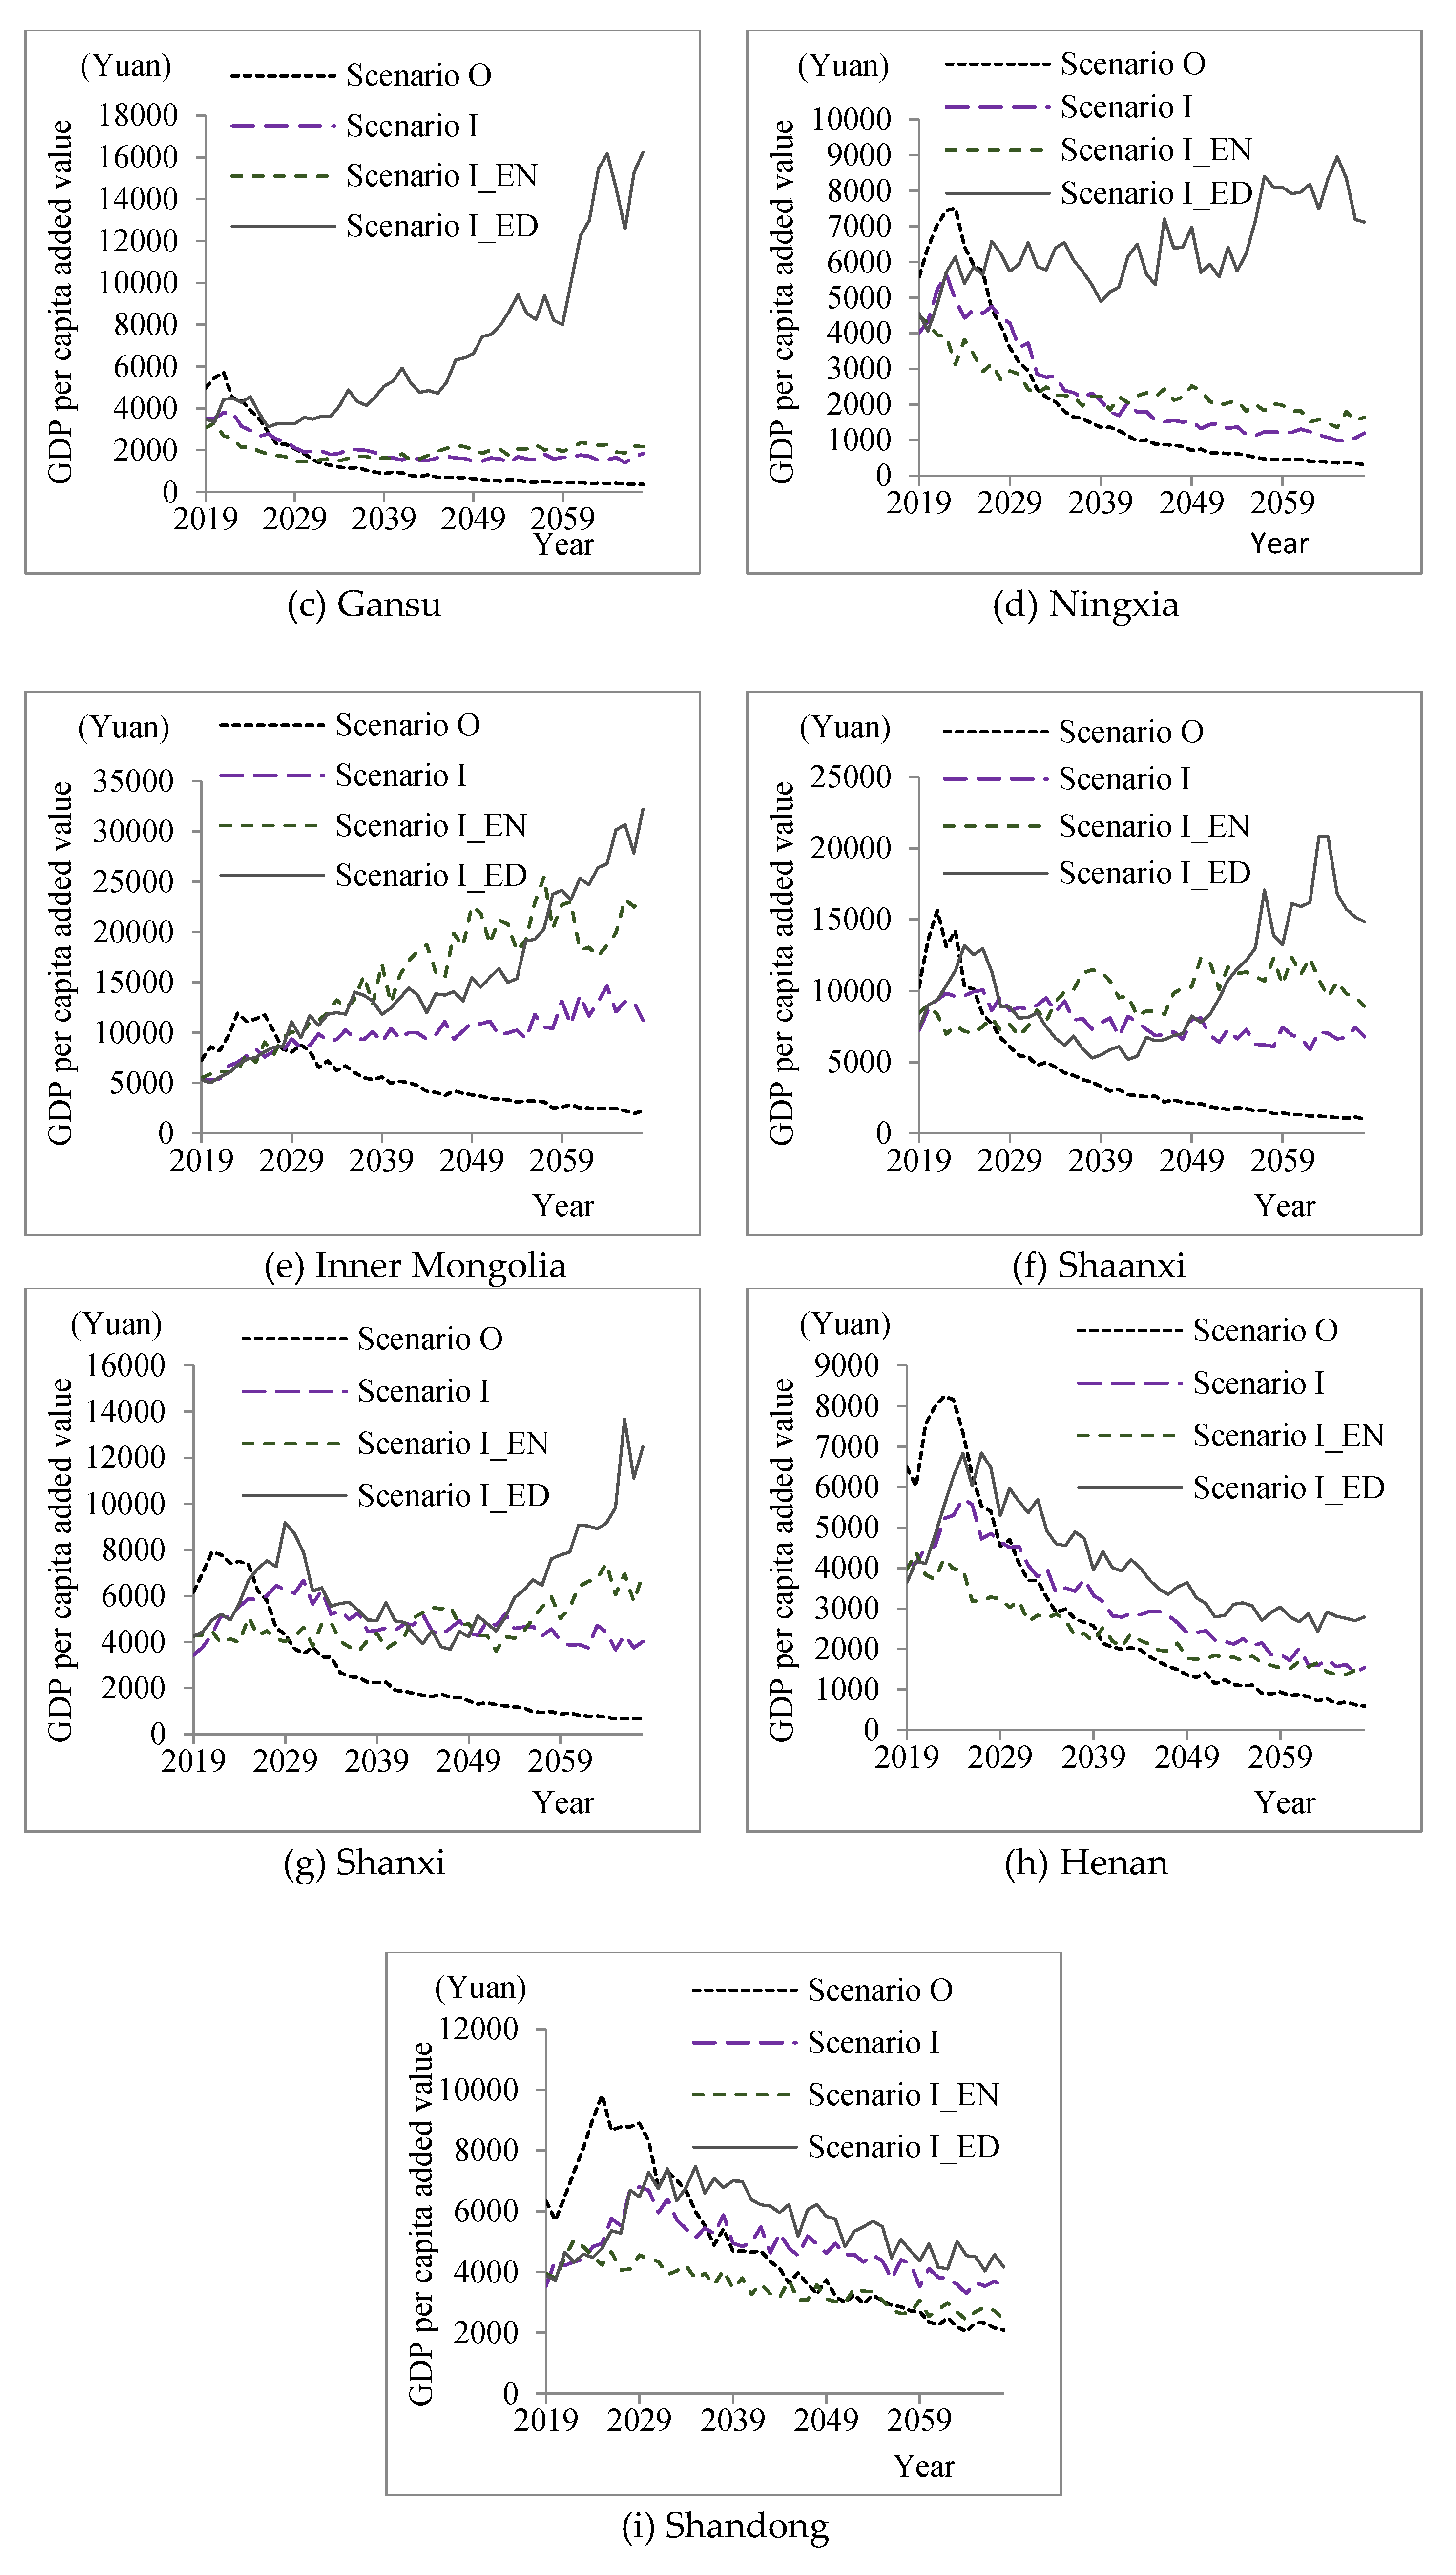
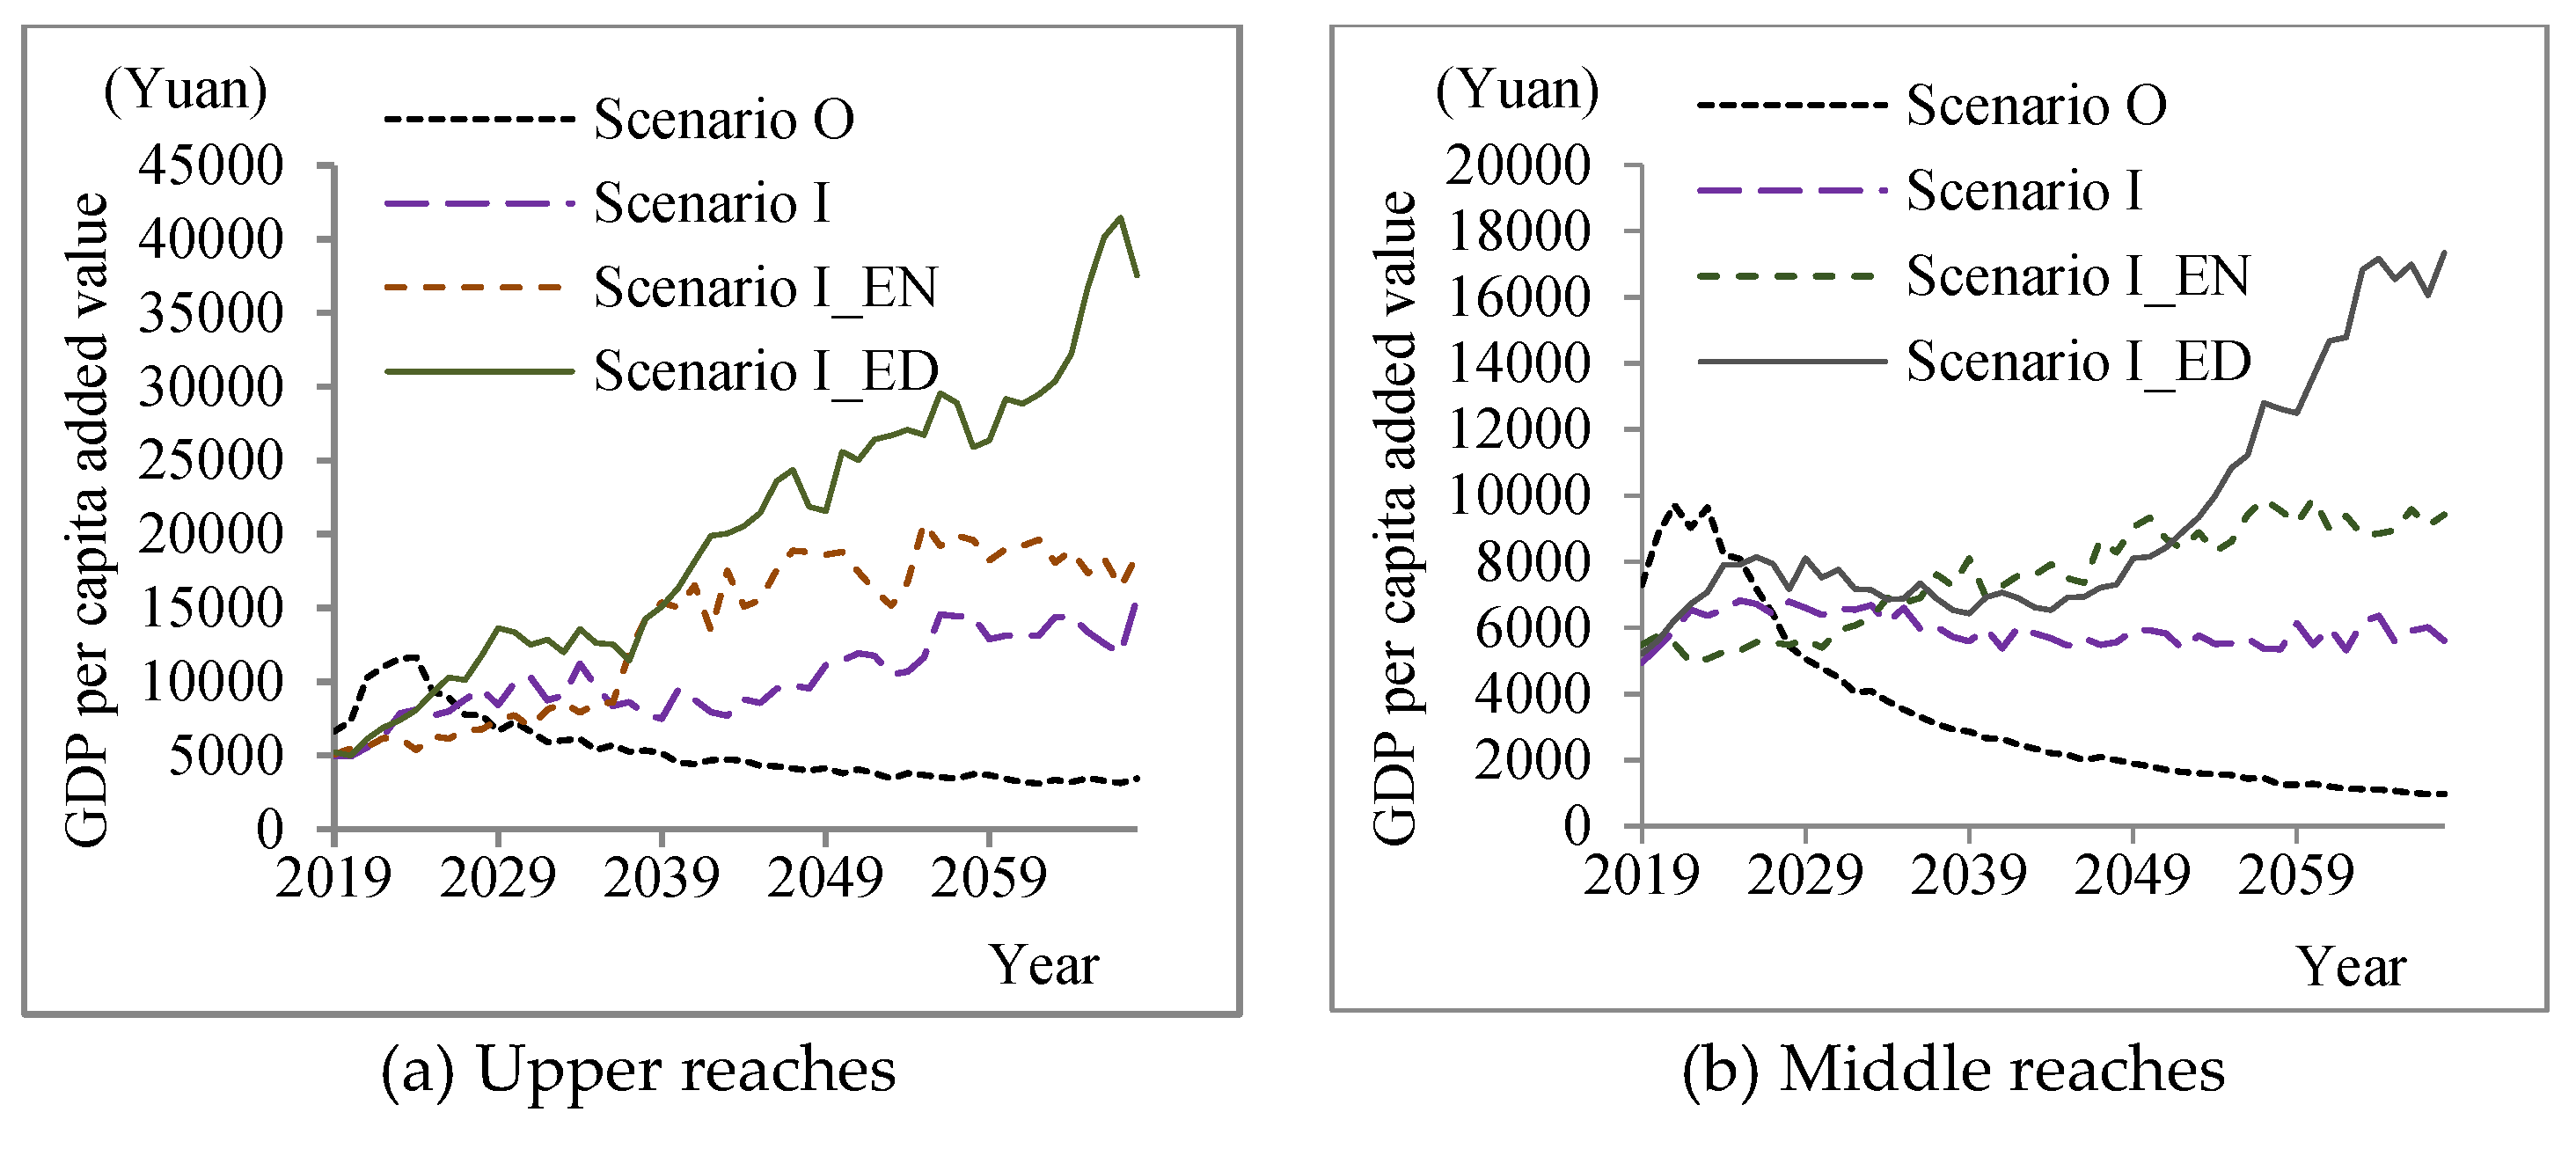
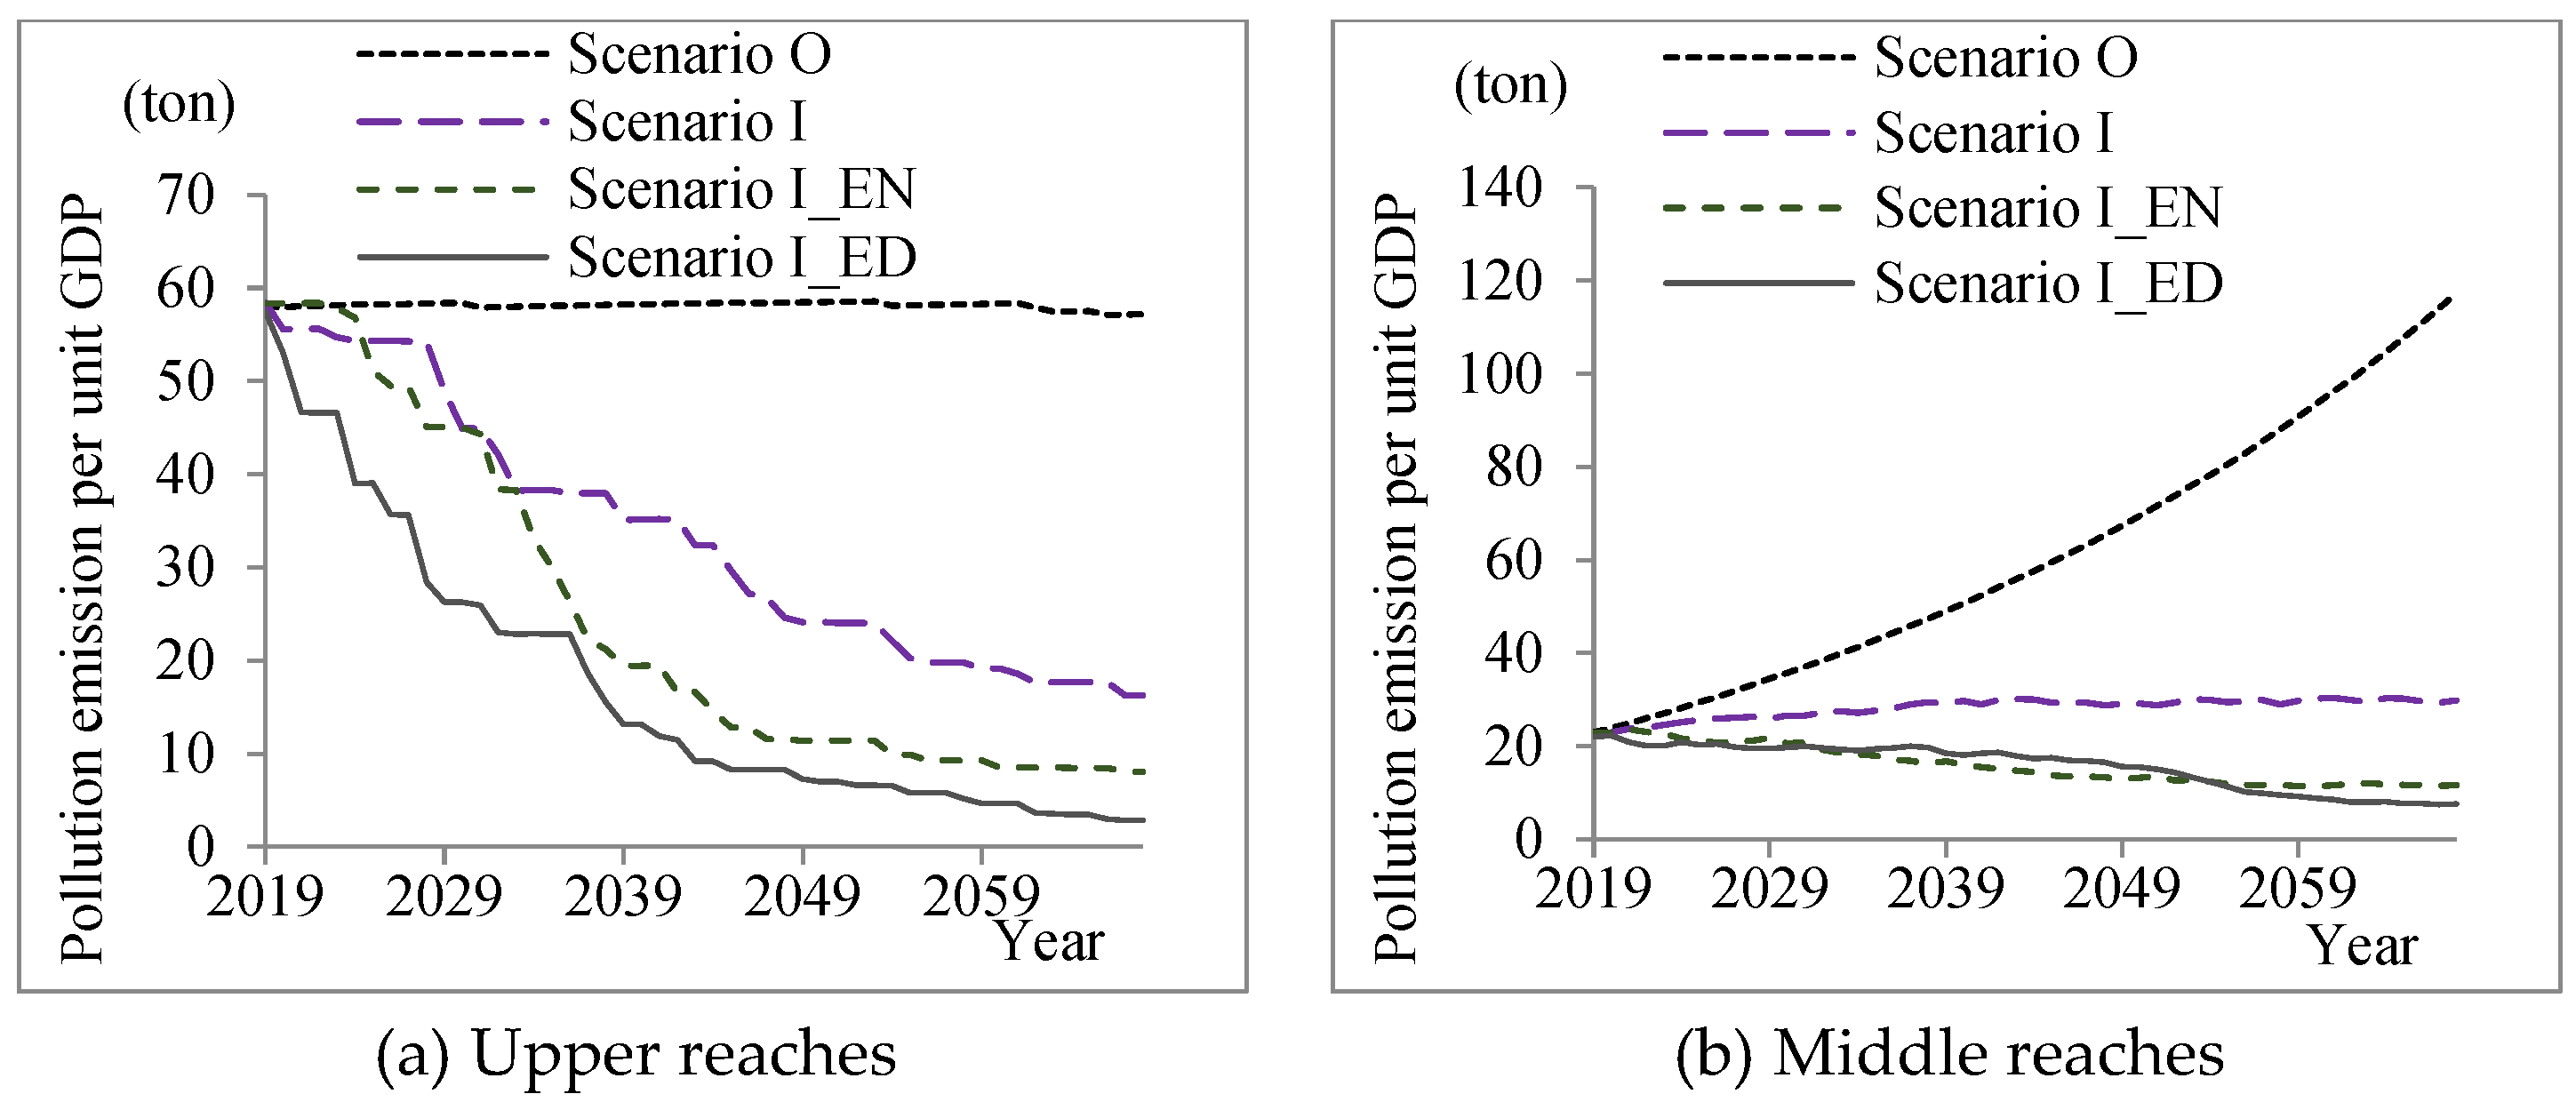
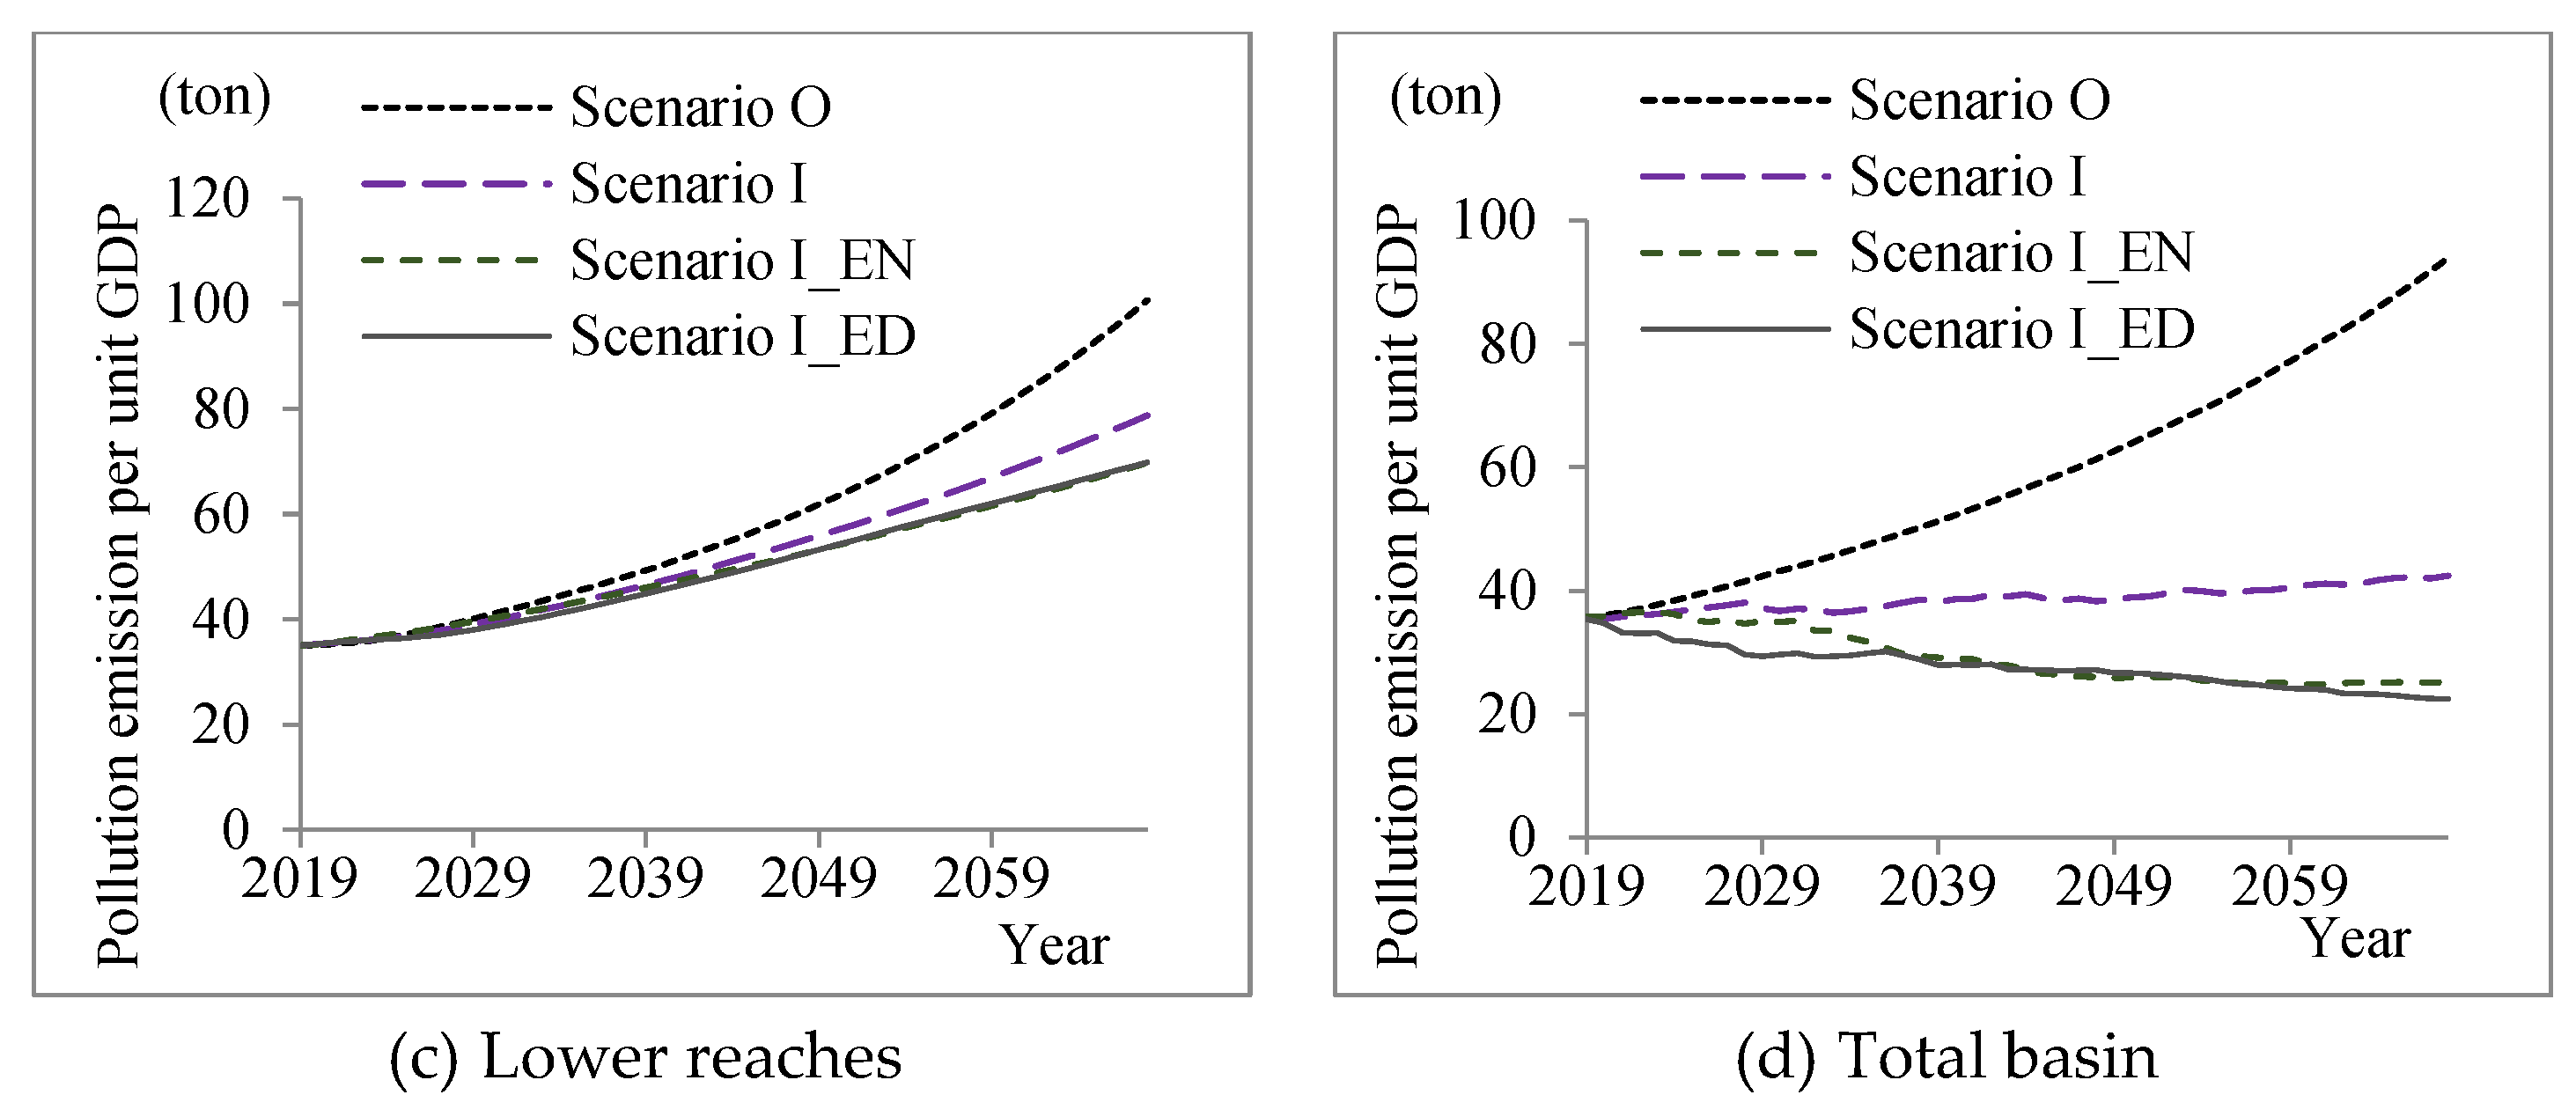
- O: The economic development model without policy instrument intervention. According to the profit-maximization principle, industries conduct their economic activities, and R&D investments are focused on improving production efficiency and reducing production costs.
- I: Economic policy development model related to green innovation. This promotes the high-quality development of green innovation through economic incentives.
- I_EN: The combined development model of green innovation with no different ecological environment constraints throughout the whole basin. On the one hand, it promotes green innovation through economic incentives and other means, and on the other hand, it adopts indiscriminate ecological and environmental protection constraints in all provinces in the Yellow River Basin.
- I_ED: A combined development model of green innovation and differentiated ecological and environmental constraints in the upper, middle, and lower reaches. On the one hand, green innovation is promoted through economic incentives and other means. On the other hand, differentiated ecological and environmental protection constraints are applied to the provinces in the upper, middle, and lower reaches of the Yellow River Basin, with the lower reaches being compensated according to the ecological and environmental level of the upper reaches.
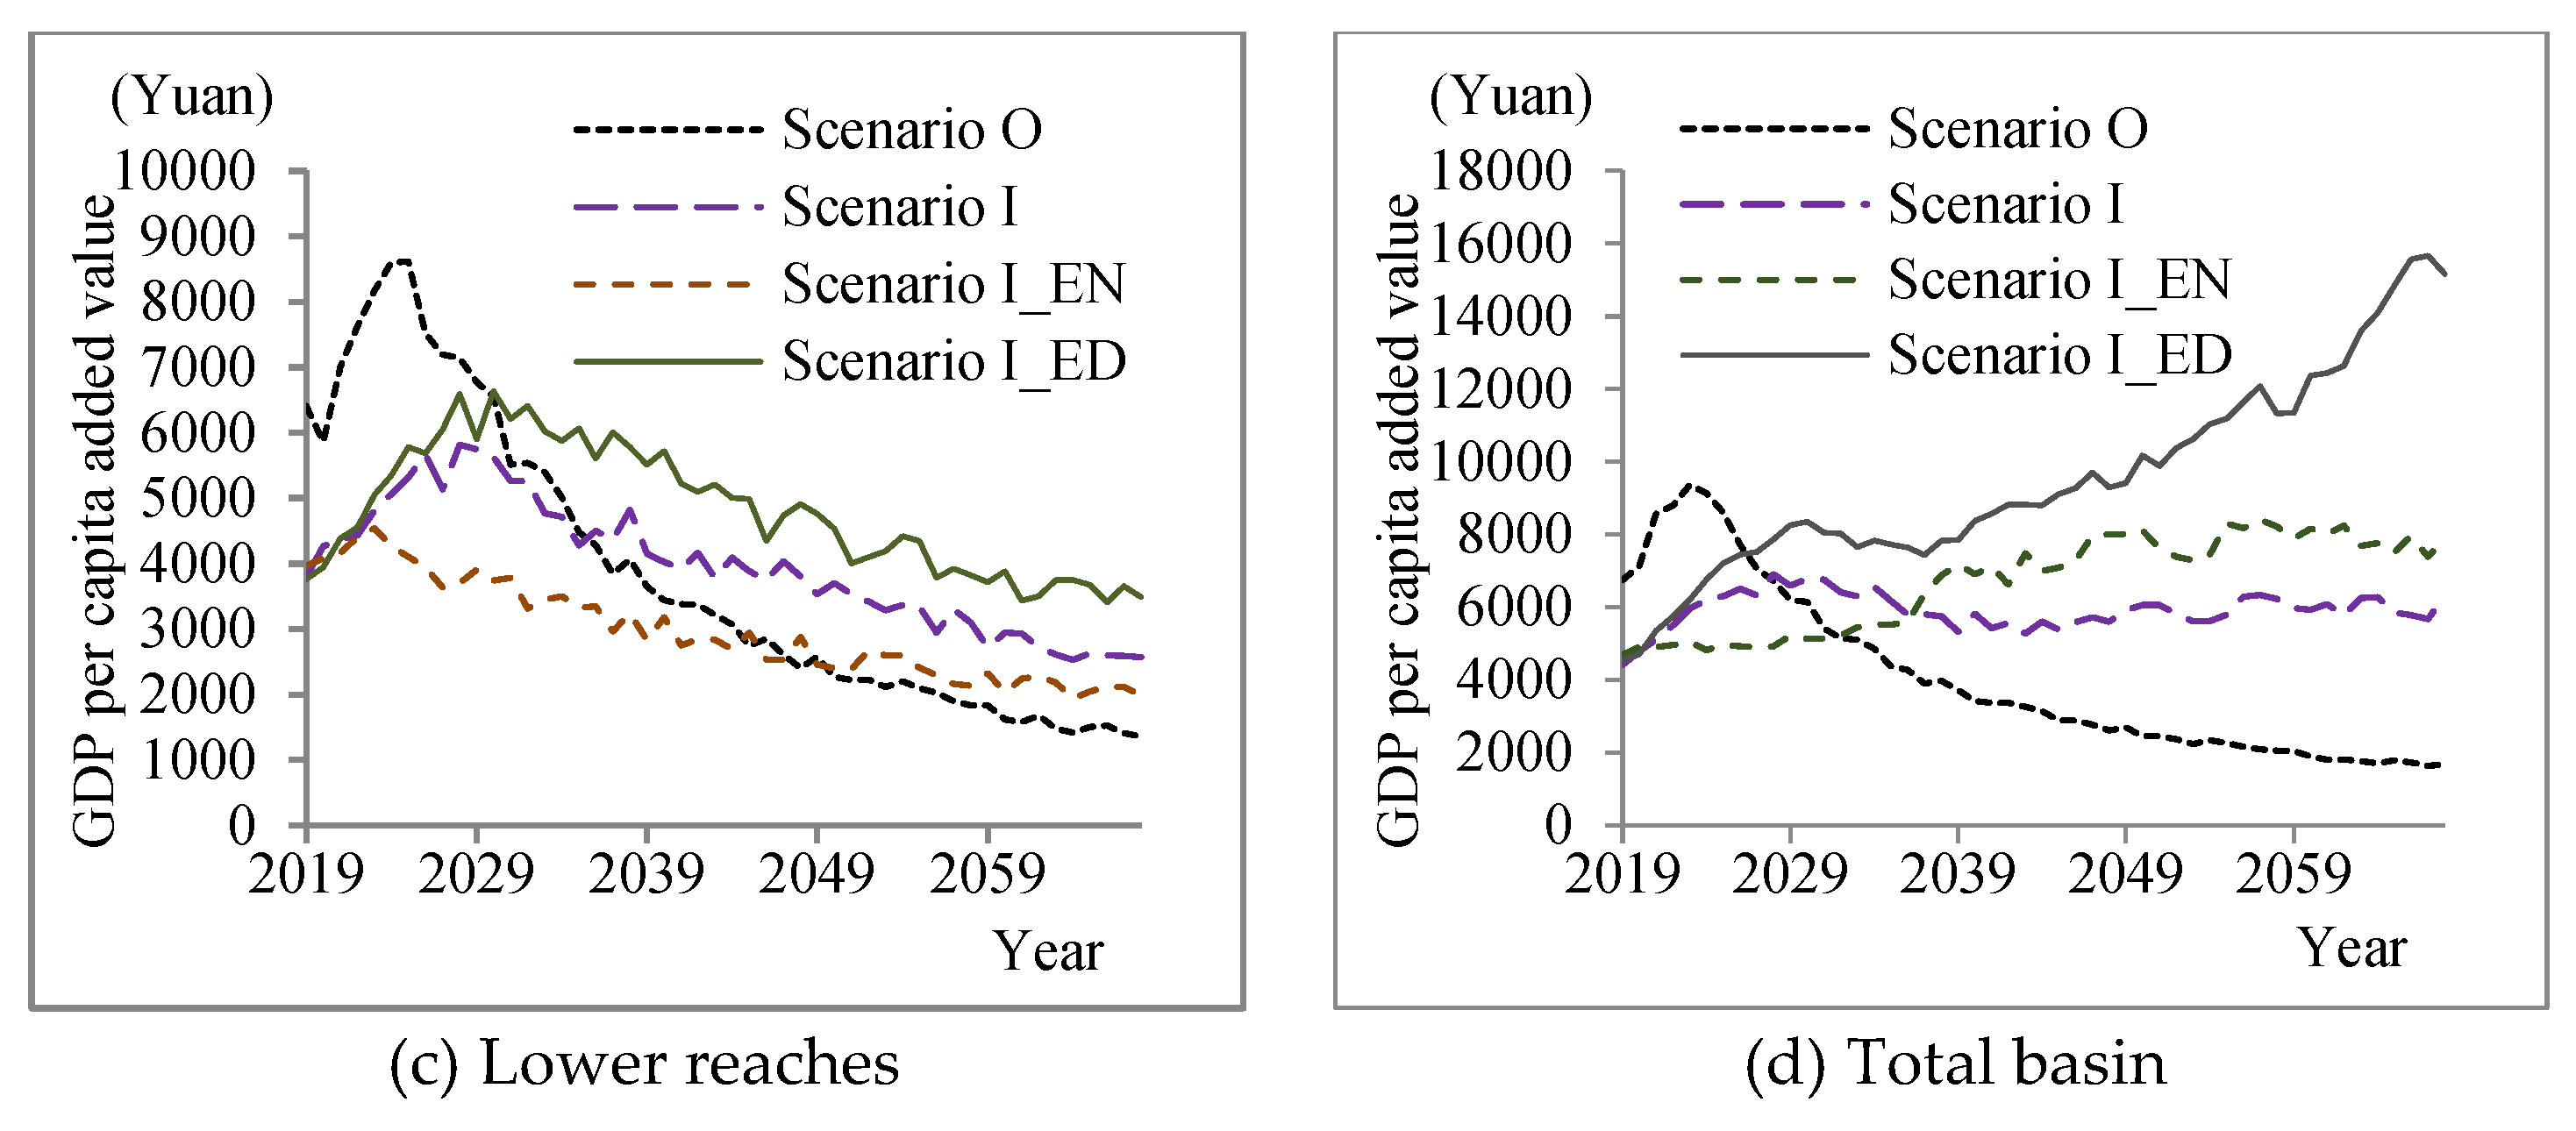
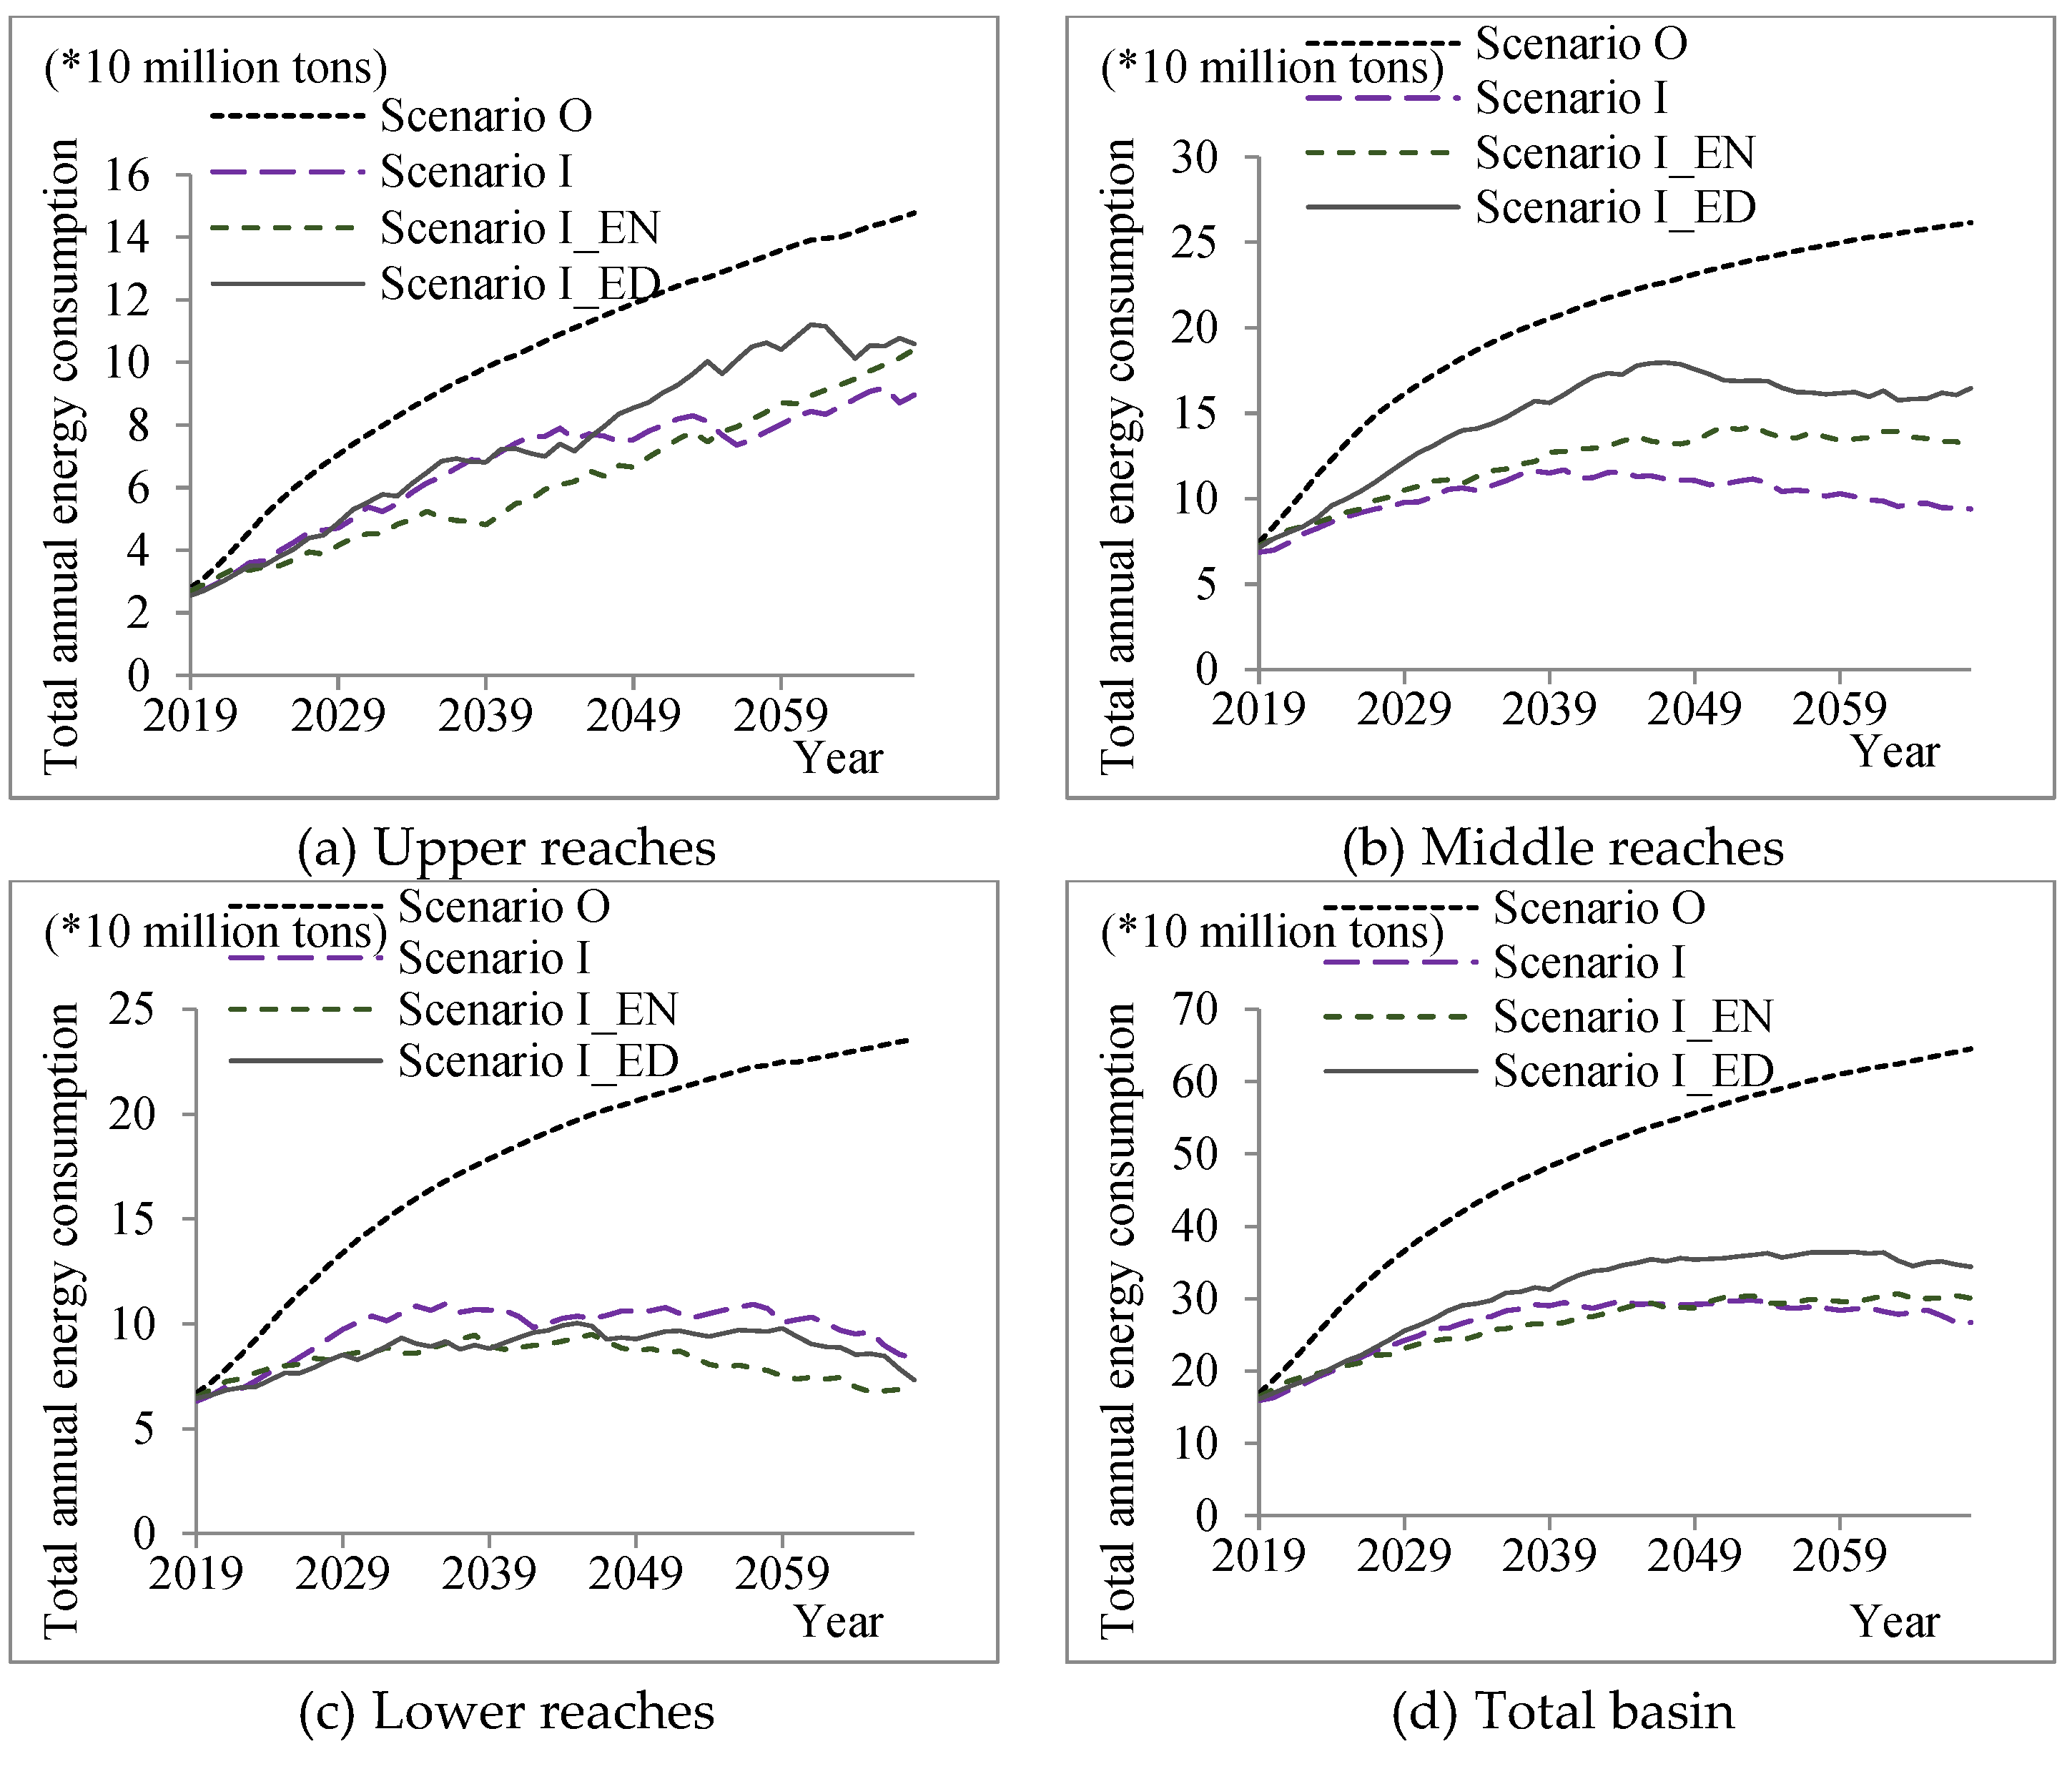
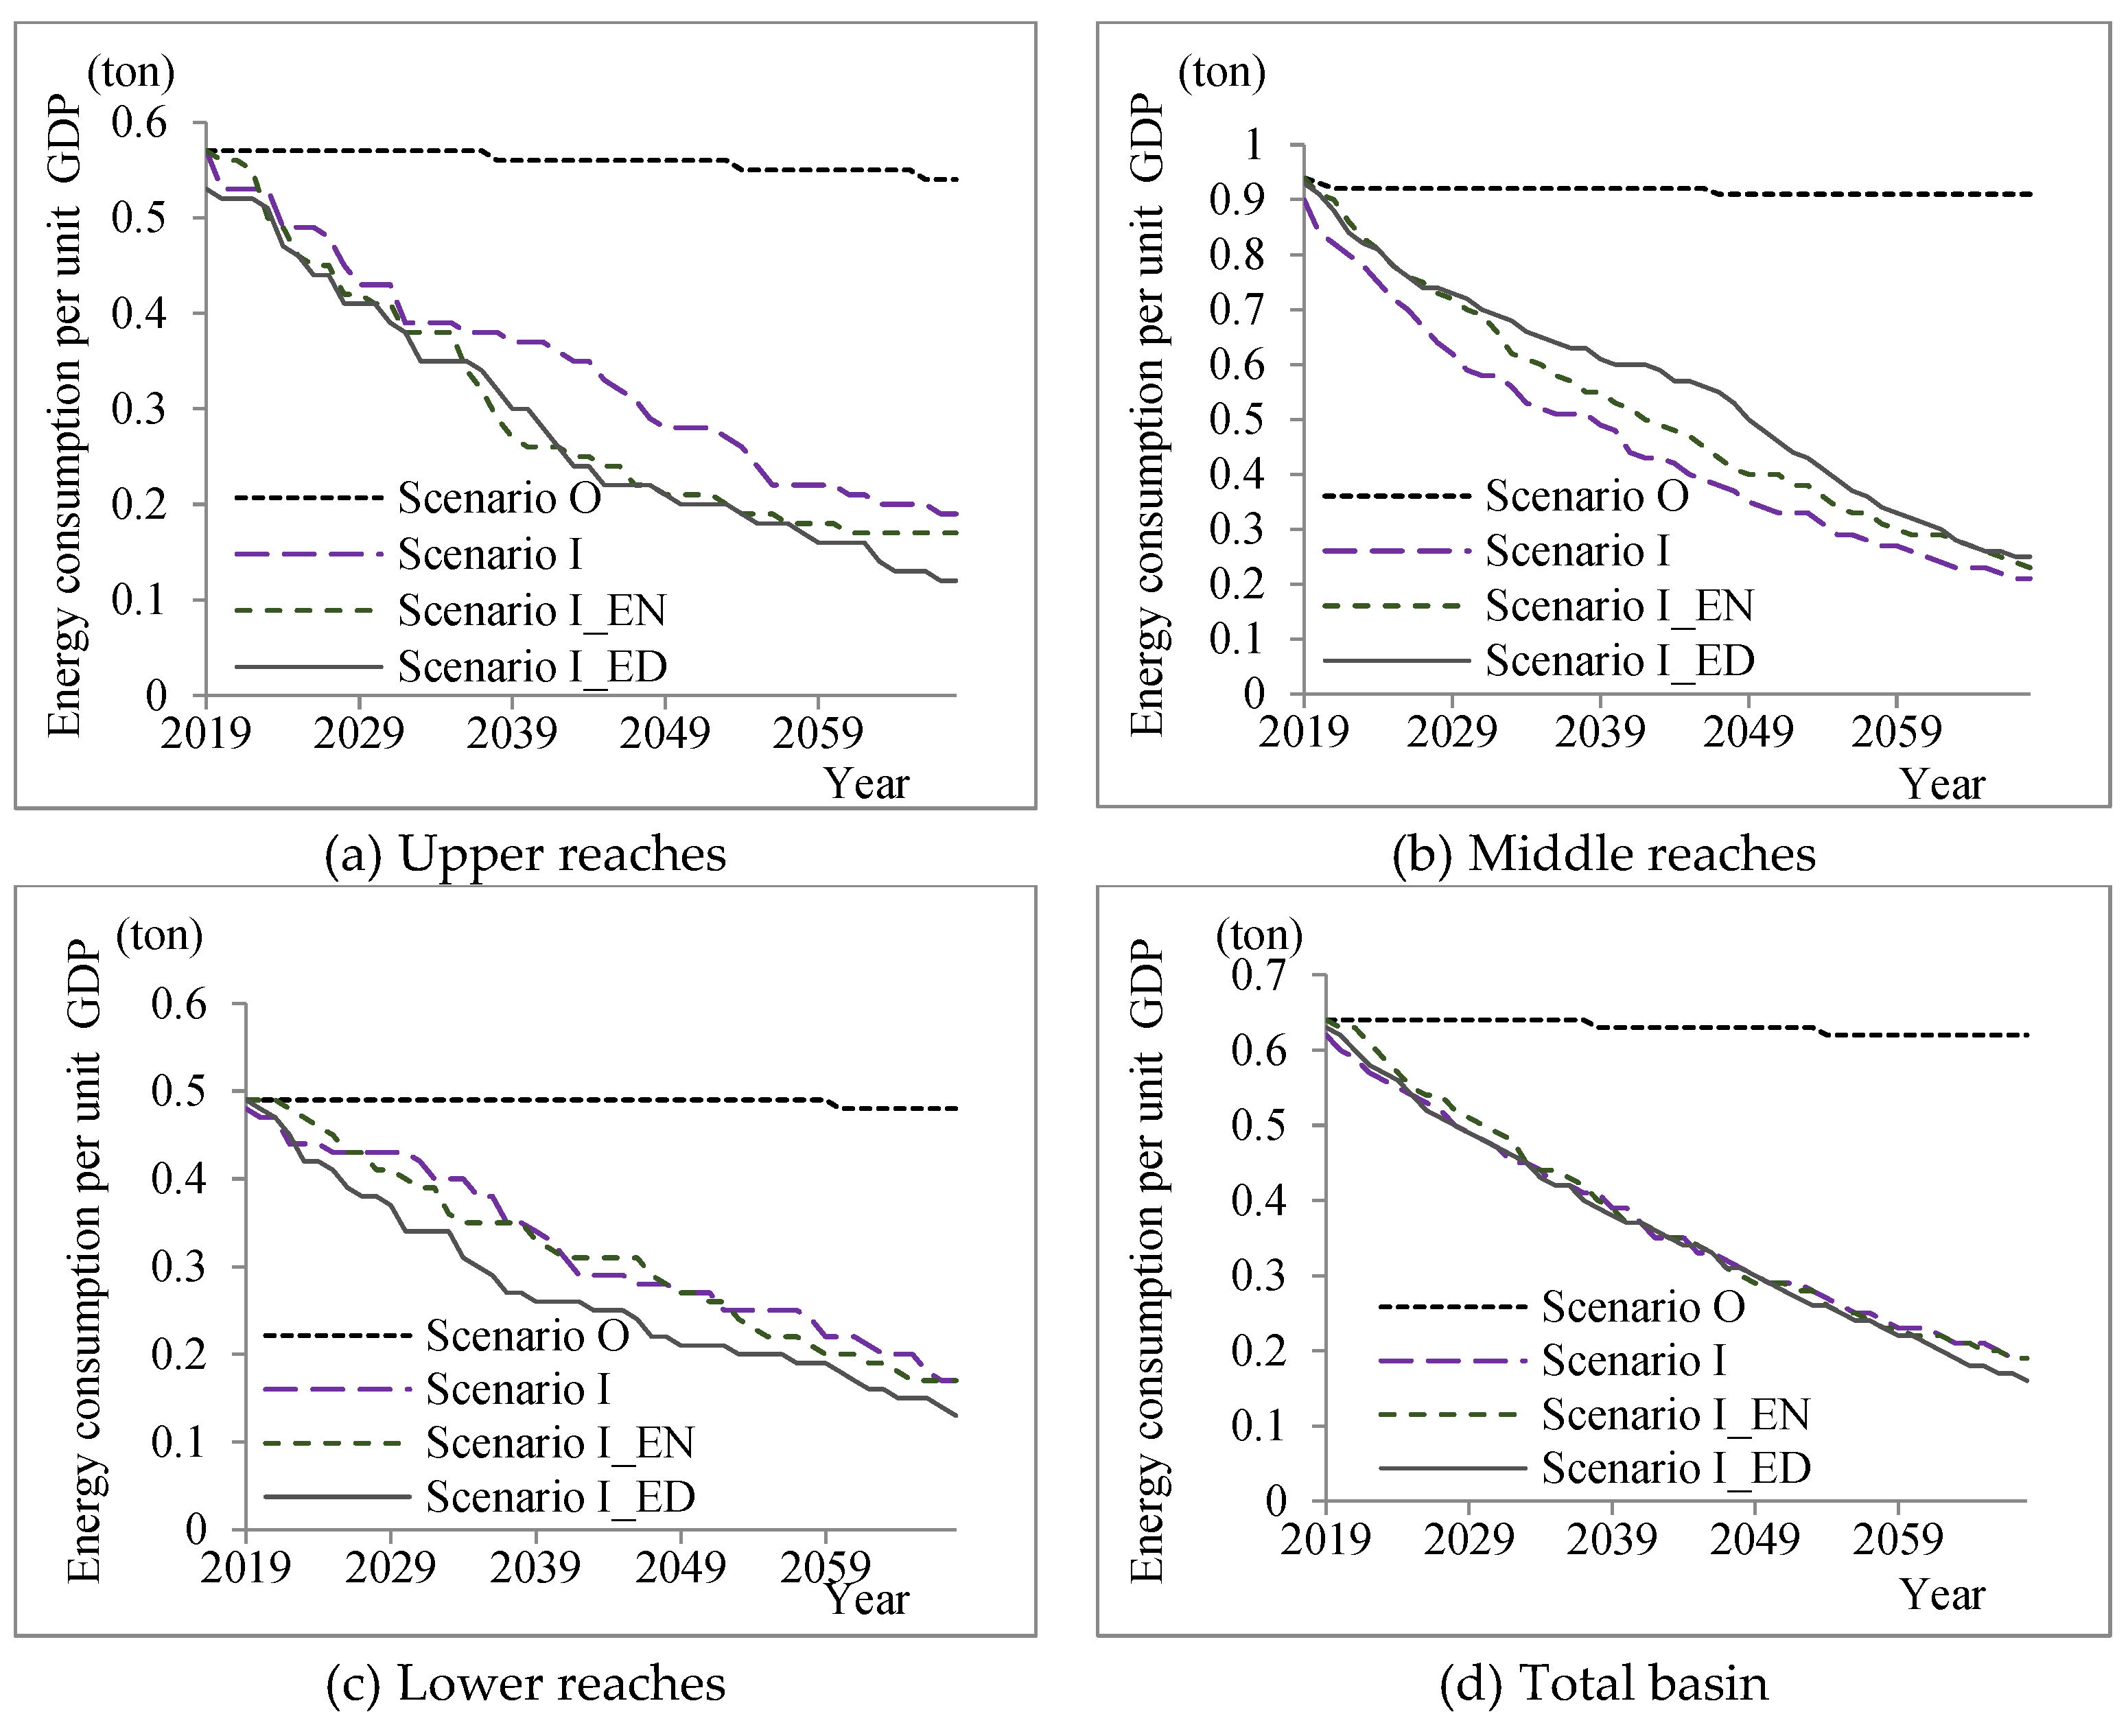
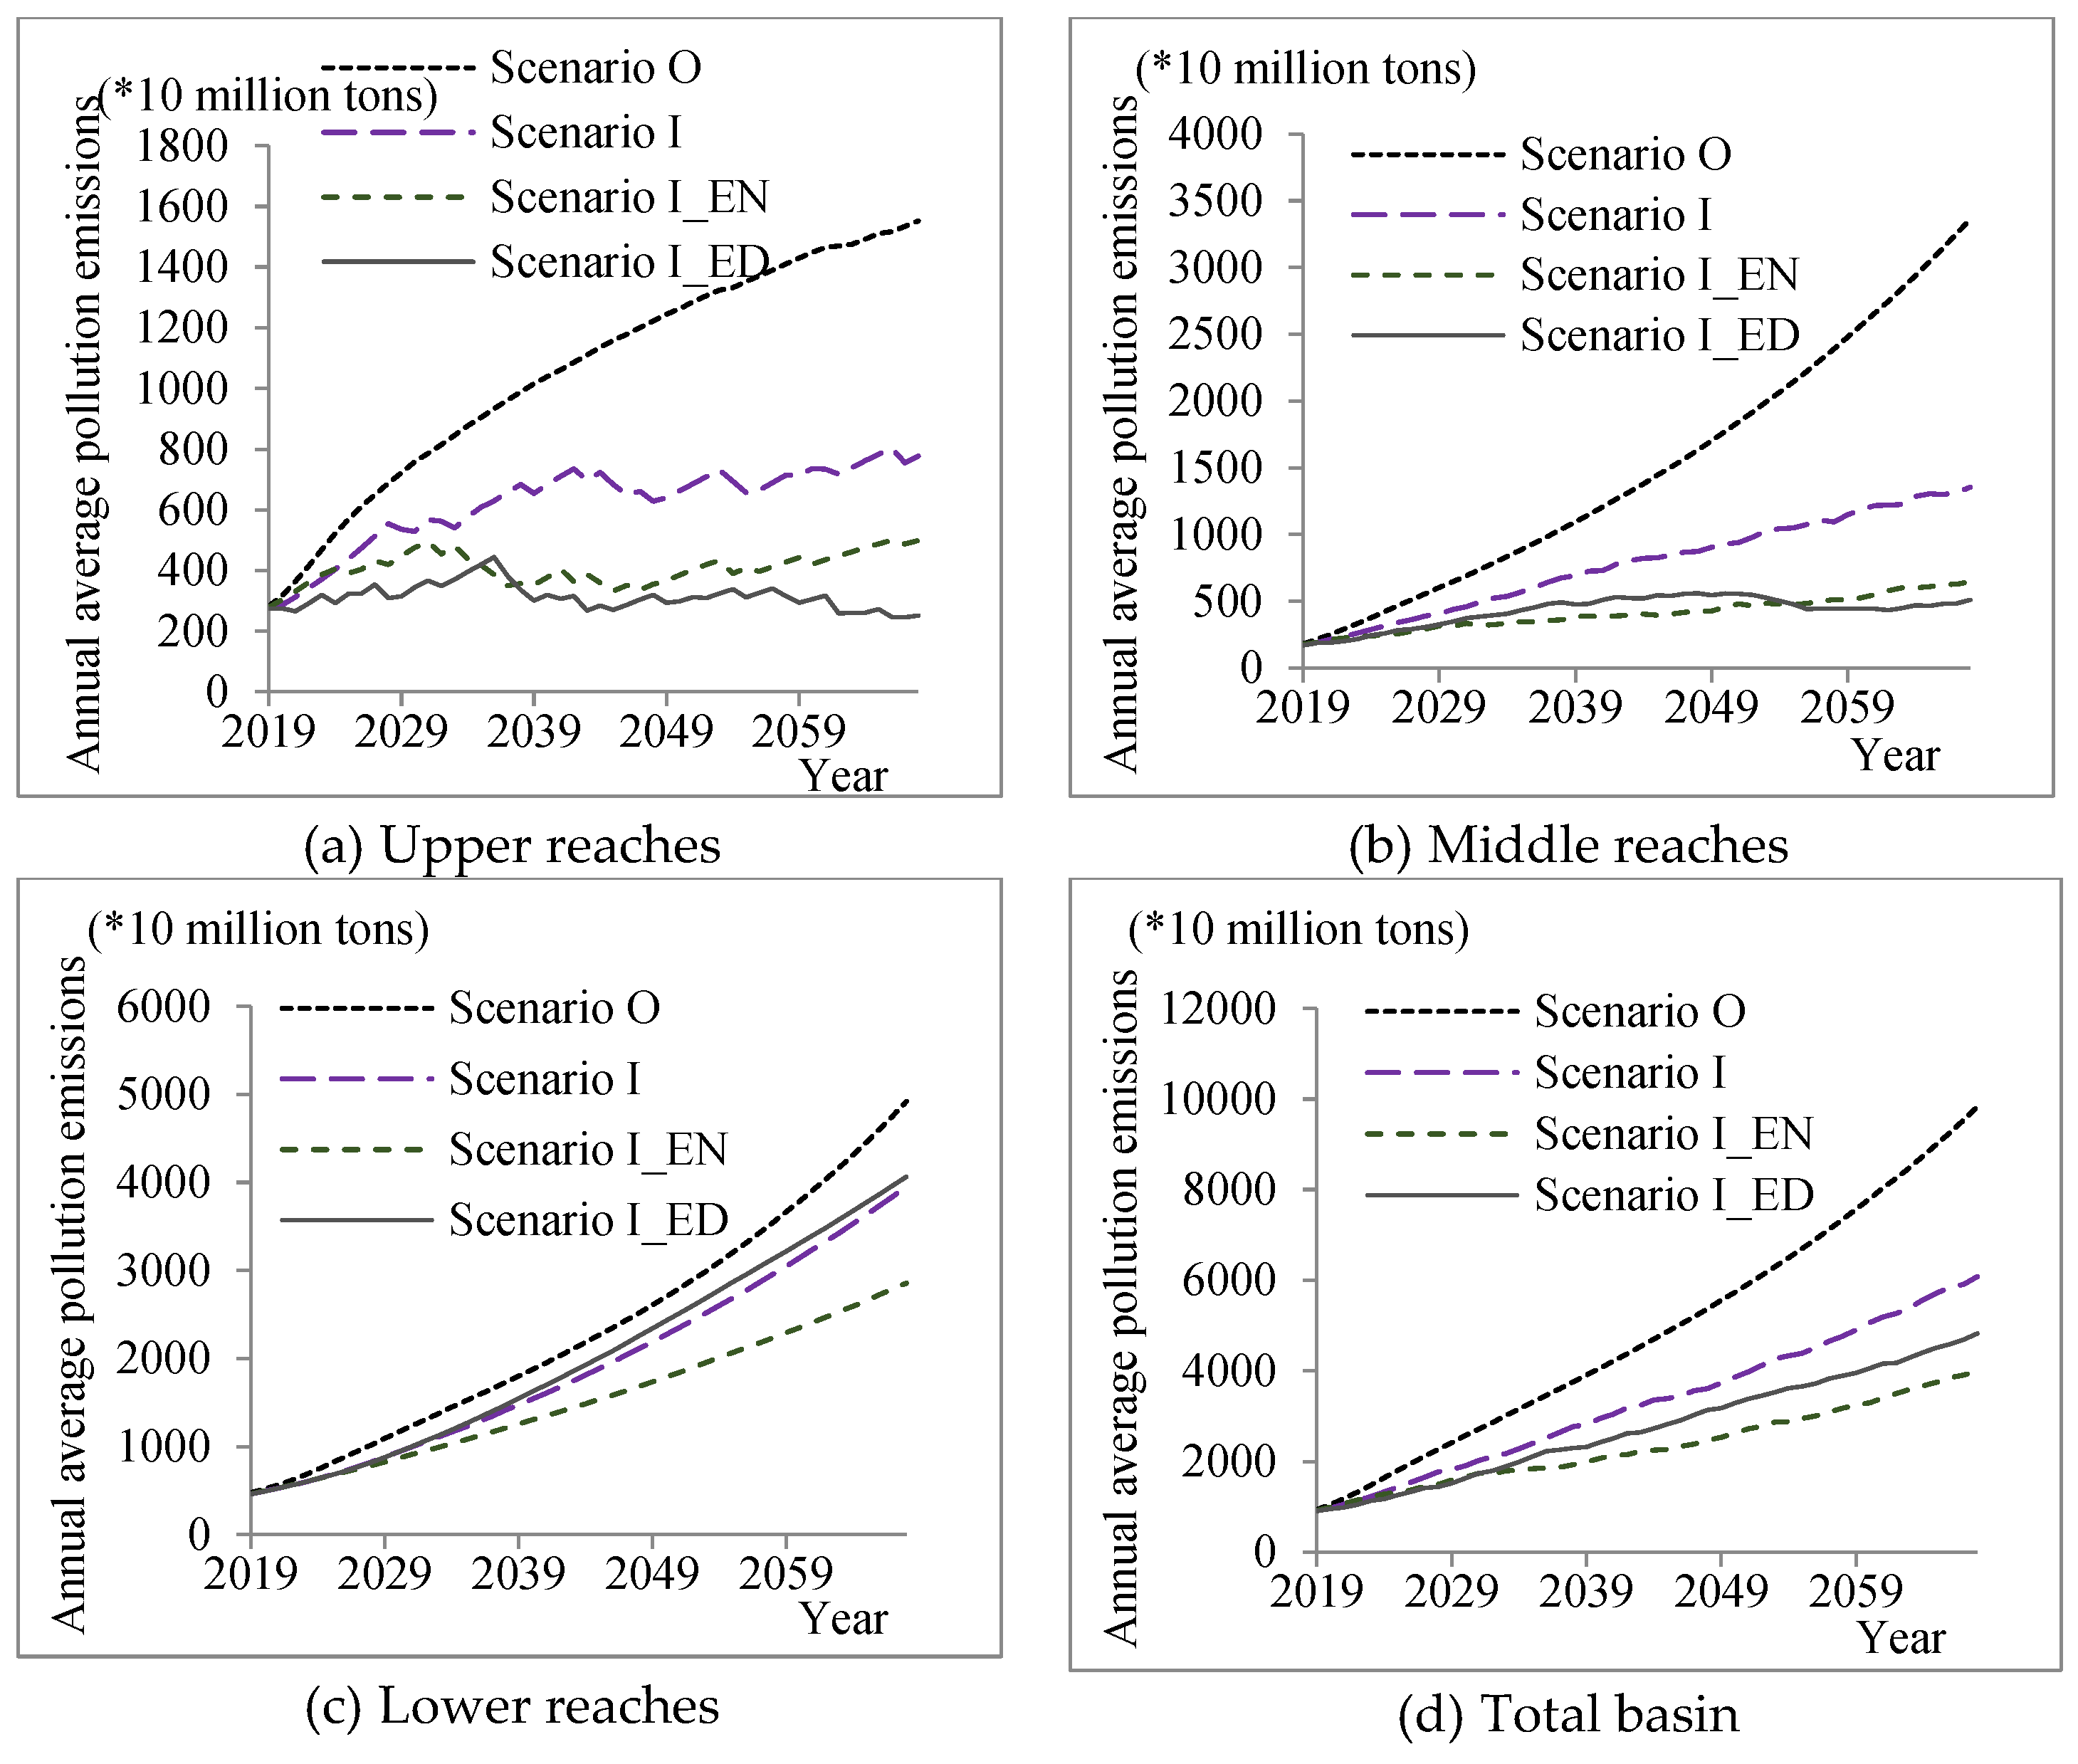
5.1. Analysis of the Evolution Path of the Economic Development Trend in the Yellow River Basin under Different Scenarios
5.2. Scenario-Based Comparative Analysis of the Development of the Yellow River Basin by Province
5.3. Comparative Analysis of the Overall Evolutionary Trends in the Yellow River Basin under Different Scenarios
5.4. Policy Implications of the Research Results
6. Conclusions and Discussion
Author Contributions
Funding
Institutional Review Board Statement
Informed Consent Statement
Data Availability Statement
Conflicts of Interest
References
- Sun, Q.; Zhang, X.; Zhang, H.; Niu, H. Coordinated development of a coupled social economy and resource environment system: A case study in Henan Province, China. Environ. Dev. Sustain. 2018, 20, 1385–1404. [Google Scholar] [CrossRef]
- Ma, H.M.; Ding, Y.; Yang, Q. Regional Ecology-Economy-Society Coordinated Development Evaluation Model and Application. Stat. Decis. 2019, 35, 75–79. [Google Scholar] [CrossRef]
- Shi, B. Study on the development path of central cities in the Yellow River Basin. J. Humanit. 2020, 1, 5–9. [Google Scholar] [CrossRef]
- Ren, B.P.; Zhang, Q. The Strategic Design and Supporting System Construction of High-quality Development in the Yellow River Basin. Reform 2019, 10, 26–34. [Google Scholar]
- Wang, Y.Q.; Li, G.P. Sustainable simulation of ecological environment and socio-economic development in the Yellow River Basin based on the SD model. Arid Land Geogr. 2022, 45, 901–911. [Google Scholar]
- Geng, Y.W.; Chen, W.Q.; Zhang, J.X.; Wang, K.; Zhang, F.; Ma, Y.H. Evolution Characteristics and Scenario Simulation of Social-Ecological-Productional Landscape Resilience in Areas Along Mainstream of Yellow River in He’nan Province. Bull. Soil Water Conserv. 2021, 41, 181–190. [Google Scholar] [CrossRef]
- Fang, C.; Liu, H.; Li, G. International progress and evaluation on interactive coupling effects between urbanization and the eco-environment. J. Geogr. Sci. 2016, 26, 1081–1116. [Google Scholar] [CrossRef]
- Sun, Z.; Zhu, X.; Pan, Y.; Zhang, J.; Liu, X. Drought evaluation using the GRACE terrestrial water storage deficit over the Yangtze River Basin, China. Sci. Total Environ. 2018, 634, 727–738. [Google Scholar] [CrossRef]
- Srinivasan, V.; Seto, K.C.; Emerson, R.; Gorelick, S.M. The impact of urbanization on water vulnerability: A coupled human-environment system approach for Chennai, India. Glob. Environ. Chang. 2013, 23, 229–239. [Google Scholar] [CrossRef]
- Ma, T.; Chen, M.; Wang, C.; Mao, Z.; Jiang, M. Study on the environment-resource-economy comprehensive efficiency evaluation of the biohydrogen production technology. Int. J. Hydrog. Energy 2013, 38, 13062–13068. [Google Scholar] [CrossRef]
- Bastianoni, S.; Coscieme, L.; Pulselli, F.M. The input-state-output model and related indicators to investigate the relationships among environment, society and economy. Ecol. Model. 2016, 325, 84–88. [Google Scholar] [CrossRef]
- Estoque, R.C.; Murayama, Y. Social-ecological status index: A preliminary study of its structural composition and application. Ecol. Indic. 2014, 43, 183–194. [Google Scholar] [CrossRef]
- Li, Y.; Li, Y.; Zhou, Y.; Shi, Y.; Zhu, X. Investigation of a coupling model of coordination between urbanization and the environment. J. Environ. Manag. 2012, 98, 127–133. [Google Scholar] [CrossRef] [PubMed]
- Aldieri, L.; Vinci, C.P. Climate change and knowledge spillovers for cleaner production: New insights. J. Clean. Prod. 2020, 271, 122729. [Google Scholar] [CrossRef]
- Zhao, Y.; Wang, S.; Zhou, C. Understanding the relation between urbanization and the eco-environment in China’s Yangtze River Delta using an improved EKC model and coupling analysis. Sci. Total Environ. 2016, 571, 862–875. [Google Scholar] [CrossRef]
- Xing, L.; Xue, M.; Hu, M. Dynamic simulation and assessment of the coupling coordination degree of the economy–resource–environment system: Case of Wuhan City in China. J. Environ. Manag. 2019, 230, 474–487. [Google Scholar] [CrossRef]
- Shi, Y.; Zhu, X.; Sun, X.; Li, Y.; Wei, T. A dynamic assessment for the coordination between economic development and the environment: A case study of Lianyungang, China. Acta Ecol. Sin. 2010, 30, 4119–4128. [Google Scholar] [CrossRef]
- Han, R.; Tong, L.; Zhu, S.; Lu, Z. The Coordinated Development of Economy and Environment Based on ARMA Model in Shenyang Economic Zone. Sci. Geogr. Sin. 2014, 34, 32–39. [Google Scholar] [CrossRef]
- Li, Y.; Wu, Y.X.; Zeng, Z.X.; Guo, L. Research on Forecast Model for Sustainable Development of Economy-Environment System Based on PCA and SVM. In Proceedings of the 2006 International Conference on Machine Learning and Cybernetics, Dalian, China, 13–16 August 2006; pp. 3590–3593. [Google Scholar] [CrossRef]
- Turner, K. Economics and wetland management. Ambio 1991, 20, 59–63. [Google Scholar]
- Zhao, L.; Zhang, G. Evaluation and welfare effect of coordinated ecological development of the Beijing–Tianjin–Hebei region. Chin. J. Popul. Resour. 2021, 19, 283–290. [Google Scholar] [CrossRef]
- Deng, C.; Li, H.; Peng, D.; Liu, L.; Zhu, Q.; Li, C. Modelling the coupling evolution of the water environment and social economic system using PSO-SVM in the Yangtze River Economic Belt, China. Ecol. Indic. 2021, 129, 108012. [Google Scholar] [CrossRef]
- Kaplan, R.S.; Norton, D.P. The Balanced Scorecard—Measures that Drive Performance. Harv. Bus. Rev. 1992, 70, 71–79. [Google Scholar] [PubMed]
- Kaplan, R.S.; Norton, D.P. The Execution Premium: Linking Strategy to Operations for Competitive Advantage; Harvard Business School Press: Boston, MA, USA, 2008; ISBN 9781422121160. [Google Scholar]
- Kaplan, R.S.; Norton, D.P. Using the balanced scorecard as a strategic management system. Harv. Bus. Rev. 1996, 74, 75–85. [Google Scholar]
- Ahn, H. Applying the balanced scorecard concept and experiential report. Long Range Plan. 2001, 34, 441–461. [Google Scholar] [CrossRef]
- Acosta, L.A.; Rounsevell, M.; Bakker, M. An Agent-Based Assessment of Land Use and Ecosystem Changes in Traditional Agricultural Landscape of Portugal. Int. J. Inf. Manag. 2015, 6, 55–80. [Google Scholar] [CrossRef] [Green Version]
- Xu, Q.; Yang, K.; Wang, G.; Yang, Y. Agent-based modeling and simulations of land-use and land-cover change according to ant colony optimization: A case study of the Erhai Lake Basin, China. Nat. Hazards 2015, 75, 95–118. [Google Scholar]
- Liu, R.; Jiang, D.; Shi, L. Agent-based simulation of alternative classroom evacuation scenarios. Front. Archit. Res. 2016, 5, 111–125. [Google Scholar] [CrossRef] [Green Version]
- Zhang, N.; Lu, Y.; Chen, J.; Hwang, B. An agent-based diffusion model for residential photovoltaic deployment in Singapore: Perspective of consumers’ behavior. J. Clean. Prod. 2022, 367, 132793. [Google Scholar] [CrossRef]
- Macal, C.M.; North, M.J. Tutorial on agent-based modelling and simulation. J. Simul. 2010, 4, 151–162. [Google Scholar] [CrossRef]
- Jiang, L.; Zuo, Q.; Ma, J.; Zhang, Z. Evaluation and prediction of the level of high-quality development: A case study of the Yellow River Basin, China. Ecol Indic. 2021, 129, 107994. [Google Scholar] [CrossRef]

| Variable/Parameter | Assignment Interval | Meaning | Assignment Rule |
|---|---|---|---|
| T | 50 | Simulation cycle | Fixed value |
| 0.01 | Speed control parameter of scientific and technological progress | Training value | |
| 0.01 | Speed control parameter of technical improvement | Training value | |
| 0.01 | Control parameter of GDP growth rate | Training value | |
| 0.01 | Speed control parameter for energy consumption reduction per unit output value | Training value | |
| 0.01 | Control parameter of pollutant reduction rate per unit output value | Training value | |
| 5 | Distance decay function factor | Training value | |
| 0.05 | The proportion of R&D investment in GDP | Empirical value | |
| 0.2 | The maximum growth rate of GDP | Empirical value | |
| 0.2 | Maximum reduction rate of energy consumption per unit output value | Empirical value | |
| 0.2 | Maximum reduction rate of pollutant discharge per unit output value | Empirical value | |
| 0.2 | Maximum speed of technical improvement | Empirical value |
| Province | Economic Growth | Resources Consumption | Ecology Environment | Impact Lower Reaches | ||||
|---|---|---|---|---|---|---|---|---|
| Periodic Mean | Mean Sort | Periodic Mean | Mean Sort | Periodic Mean | Mean Sort | Periodic Mean | Mean Sort | |
| Qinghai | 11,650.25 | 4 | 16,460.93 | 4 | 140,490.11 | 4 | 7356.87 | 4 |
| Sichuan | 170,335.71 | 4 | 85,103.21 | 4 | 10,430,415 | 4 | 66,880.01 | 4 |
| Gansu | 21,328.36 | 3 | 19,184.24 | 4 | 2,128,716.6 | 4 | 49,712.45 | 4 |
| Ningxia | 8929.3 | 2 | 15,311.95 | 4 | 1,009,006.5 | 4 | 52,867.58 | 4 |
| Inner-Mongolia | 59,270.51 | 4 | 66,669.79 | 4 | 2,942,370.4 | 4 | 153,081.69 | 4 |
| Shaanxi | 80,319.17 | 4 | 41,108.57 | 4 | 4,578,867.4 | 4 | 157,932.48 | 4 |
| Shanxi | 51,381.14 | 4 | 60,608.01 | 4 | 4,287,611.2 | 4 | 224,095.52 | 4 |
| Henan | 141,309.92 | 2 | 66,852.93 | 4 | 5,981,967.5 | 4 | 297,824.63 | 4 |
| Shandong | 223,396.87 | 1 | 111,192.29 | 4 | 17,217,165 | 4 | - | - |
| Province | Economic Growth | Resources Consumption | Ecology Environment | Impact Lower Reaches | ||||
|---|---|---|---|---|---|---|---|---|
| Periodic Mean | Mean Sort | Periodic Mean | Mean Sort | Periodic Mean | Mean Sort | Periodic Mean | Mean Sort | |
| Qinghai | 15,450.36 | 3 | 11,799.64 | 2 | 75,008.79 | 3 | 3926.87 | 3 |
| Sichuan | 219,439.4 | 3 | 54,970.65 | 2 | 6,135,319.7 | 3 | 36,179.37 | 3 |
| Gansu | 22,694.15 | 2 | 8846.17 | 1 | 1,013,780.4 | 3 | 22,271.67 | 3 |
| Ningxia | 8869.36 | 3 | 10,245.05 | 2 | 469,406.02 | 3 | 24,594.85 | 3 |
| Inner-Mongolia | 71,990.12 | 3 | 35,578.52 | 1 | 1,709,489.1 | 3 | 89,057.09 | 3 |
| Shaanxi | 102,047.13 | 3 | 17,895.28 | 1 | 2,537,886 | 3 | 84,071.45 | 3 |
| Shanxi | 62,569.09 | 2 | 28,929.15 | 1 | 2,030,434.5 | 3 | 106,122.33 | 3 |
| Henan | 136,472.67 | 3 | 36,077.92 | 2 | 4,254,877.6 | 3 | 211,837.88 | 3 |
| Shandong | 201,533.46 | 3 | 61,046.84 | 3 | 14,936,784 | 2 | - | - |
| Province | Economic Growth | Resources Consumption | Ecology Environment | Impact Lower Reaches | ||||
|---|---|---|---|---|---|---|---|---|
| Periodic Mean | Mean Sort | Periodic Mean | Mean Sort | Periodic Mean | Mean Sort | Periodic Mean | Mean Sort | |
| Qinghai | 18,451.96 | 2 | 9064.92 | 1 | 56,192.16 | 2 | 2937.88 | 2 |
| Sichuan | 258,358.59 | 2 | 53,122.8 | 1 | 4,010,785.9 | 2 | 21,964.45 | 2 |
| Gansu | 20,989.1 | 4 | 9271 | 2 | 593,202.26 | 2 | 13,340.78 | 2 |
| Ningxia | 8324.35 | 4 | 7876.64 | 1 | 243,600.44 | 2 | 12,763.61 | 2 |
| Inner-Mongolia | 94,928.05 | 1 | 44,085.16 | 2 | 787,153.95 | 1 | 40,579.8 | 1 |
| Shaanxi | 108,755.5 | 1 | 20,922.59 | 2 | 1,349,889.5 | 1 | 39,129.28 | 1 |
| Shanxi | 57,418.3 | 3 | 38,773.23 | 2 | 1,095,447.9 | 1 | 57,254.48 | 1 |
| Henan | 115,455.25 | 4 | 35,022.77 | 1 | 3,056,135.4 | 1 | 152,156.02 | 1 |
| Shandong | 172,713.63 | 4 | 46,903.43 | 1 | 12,232,450 | 1 | - | - |
| Province | Economic Growth | Resources Consumption | Ecology Environment | Impact Lower Reaches | ||||
|---|---|---|---|---|---|---|---|---|
| Periodic Mean | Mean Sort | Periodic Mean | Mean Sort | Periodic Mean | Mean Sort | Periodic Mean | Mean Sort | |
| Qinghai | 19,018.51 | 1 | 12,941.77 | 3 | 32,695.17 | 1 | 1712.49 | 1 |
| Sichuan | 342,864 | 1 | 61,524.9 | 3 | 3,088,360.3 | 1 | 21,516.52 | 1 |
| Gansu | 40,393.65 | 1 | 12,357.85 | 3 | 436,312.02 | 1 | 9024.54 | 1 |
| Ningxia | 13,645.62 | 1 | 11,461.19 | 3 | 176,289.76 | 1 | 9236.82 | 1 |
| Inner-Mongolia | 88,228.44 | 2 | 52,568.74 | 3 | 817,342.66 | 2 | 42,530.06 | 2 |
| Shaanxi | 108,517.61 | 2 | 29,579.6 | 3 | 1,430,490.5 | 2 | 49,998.64 | 2 |
| Shanxi | 69,682.36 | 1 | 40,420.05 | 3 | 1,412,879.9 | 2 | 73,845.33 | 2 |
| Henan | 156,672.64 | 1 | 38,999.83 | 3 | 4,162,523.9 | 2 | 207,239.86 | 2 |
| Shandong | 217,203.87 | 2 | 48,659.22 | 2 | 15,923,150 | 3 | - | - |
Publisher’s Note: MDPI stays neutral with regard to jurisdictional claims in published maps and institutional affiliations. |
© 2022 by the authors. Licensee MDPI, Basel, Switzerland. This article is an open access article distributed under the terms and conditions of the Creative Commons Attribution (CC BY) license (https://creativecommons.org/licenses/by/4.0/).
Share and Cite
Zhao, A.; Wang, J.; Sun, Z.; Guan, H. Research on the Evolutionary Path of Eco-Conservation and High-Quality Development in the Yellow River Basin Based on an Agent-Based Model. Systems 2022, 10, 105. https://doi.org/10.3390/systems10040105
Zhao A, Wang J, Sun Z, Guan H. Research on the Evolutionary Path of Eco-Conservation and High-Quality Development in the Yellow River Basin Based on an Agent-Based Model. Systems. 2022; 10(4):105. https://doi.org/10.3390/systems10040105
Chicago/Turabian StyleZhao, Aiwu, Jingyi Wang, Zhenzhen Sun, and Hongjun Guan. 2022. "Research on the Evolutionary Path of Eco-Conservation and High-Quality Development in the Yellow River Basin Based on an Agent-Based Model" Systems 10, no. 4: 105. https://doi.org/10.3390/systems10040105
APA StyleZhao, A., Wang, J., Sun, Z., & Guan, H. (2022). Research on the Evolutionary Path of Eco-Conservation and High-Quality Development in the Yellow River Basin Based on an Agent-Based Model. Systems, 10(4), 105. https://doi.org/10.3390/systems10040105


