Article

Effectiveness of Virtual Reality on Attention Training for Elementary School Students

Institute of Learning Sciences and Technologies, National Tsing Hua University, Hsinchu 30013, Taiwan
*
Author to whom correspondence should be addressed.
Systems 2022, 10(4), 104; https://doi.org/10.3390/systems10040104
Submission received: 4 July 2022 / Revised: 22 July 2022 / Accepted: 23 July 2022 / Published: 26 July 2022

Abstract

:
This study is aimed at investigating the effectiveness of virtual reality (VR) on attention training for elementary school students. A pre-test and post-test design of the quasi-experimental method was adopted and 66 third and fourth graders from an elementary school in Hsinchu, Taiwan were used as experimental subjects, divided into a control group and experimental group. The former used the computerized Attention Process Training (APT) system and the latter used the proposed VR system for attention training, both for two weeks. The attention scale for elementary school children was used to evaluate the participant’s attention before and after training, including the dimensions of focused attention, sustained attention, selective attention, alternating attention, and divided attention. A questionnaire survey was conducted to measure the learning anxiety and cognitive load during the training process. The experimental results indicated: (1) The overall attention was significantly improved after the training process for both groups, and the VR system was more effective than the computerized APT in improving children’s attention. (2) The questionnaire results showed that the experimental group had lower learning anxiety and cognitive load than the control group. According to the experimental results, VR training is more effective in improving the attention of participants while reducing their learning anxiety and cognitive load. Therefore, it is a useful tool for attention training in elementary schools.

1. Introduction

“Attention” refers to the ability that an individual can concentrate and persist in a particular activity. In education, children’s attention has always been an essential concern for parents and teachers [1]. Attention usually affects children’s learning in three ways: (1) the motivation before learning, (2) the level of engagement during learning, and (3) the effectiveness after learning. It was reported by Grills-Taquechel et al. [2] that attention deficits affect children’s reading and math skills. Vartak et al. [3] suggested that the level of sustained attention in preschoolers could be an indicator of later academic achievement. Many studies confirmed that attention has a significant impact on children’s academic performance [4,5,6]. As described above, attention is closely related to learning and it is a key factor affecting learning performance. If attention is properly developed and utilized, children will be more concentrated and focused on their studies.
In the past, people thought that “attention” meant concentrating on a certain thing. Over time, many experts have come to believe that attention does not represent just a single item, but rather a series of actions to accomplish one or multiple tasks. Until now, there is still no consensus on the exact definition of attention. The clinical model of attention proposed by Sohlberg and Mateer [7] forms the main theoretical basis for this study. This model classifies attention into five dimensions:
  • Focused attention: The ability of an individual to focus on a task and respond directly to specific visual or auditory stimuli. This is the most basic type of attention.
  • Sustained attention: The ability of an individual to maintain consistent responses and behaviors over time while performing a task.
  • Selective attention: The ability of an individual to select a particular object when faced with a stimulus or interfering objects and to continue completing the task without being affected by the interfering objects.
  • Alternating attention: The ability of an individual to change the target of attention and alternate attention between tasks. For example, students need to switch their attention between listening to lectures and taking notes during class.
  • Divided attention: The ability of an individual to use appropriate attention for multiple tasks simultaneously. Divided attention is used when performing multiple tasks are required at the same time.

1.1. Attention Training

Sohlberg and Mateer developed Attention Process Training (APT) based on their clinical model to address the five types of attention. The APT has been used in various medical and rehabilitation fields to provide specific training for patients with attention problems. Park and Ingles [8] noted that the APT is the simplest, most convenient, and most effective tool for attention training in clinical trials. As described previously, students have improved attention in the classroom after performing APT. Therefore, it is used in this study with the training content adapted from YouTube’s public resources. The E-prime system [9] was used to reprogram the questions by choosing one question for each type of attention.
With the advance of information technology and the increasing popularity of digital media, distracting products are becoming widely prevalent. As a result, researchers are discovering more and more students with inattention problems [10]. Some scholars reported that children have difficulty concentrating during their learning processes. They are not able to perform a specific task for a period of time, and the problems are often related to the ability to allocate their attention [11]. Many elementary and middle school teachers believe that young students generally have insufficient attention, and lacking attention has a serious impact on their learning, a problem that cannot be underestimated. For school-age children, attention affects not only learning performance but also social functioning [12]. If the inattention problem is continuously ignored, it will bring a great crisis to the education system. In order to enhance students’ learning effectiveness, teachers and parents must be active in getting their attention back. In knowing the causes of this problem as early as possible, preventive interventions can be provided.
According to Betts et al. [13], sustained attention for children grows rapidly from the ages of eight to ten and stabilizes after that. Therefore, the earlier a child’s attention deficit is identified, the more attention deficit can be prevented from causing learning difficulty and inefficiency during the school years. Consequently, how to improve or cultivate children’s attention has become an important issue for parents and teachers. For example, Tang and Posner [14] divided attention training into a cognitive functional process and a state-of-mind orientation. The cognitive functional process requires the repetition of specific training activities to enhance the working memory and attention of the trainees. Many scholars conducted research on the topic of attention training and they incorporated different media into the design of attention training programs, such as applying music training to enhance attention and combining games or classroom teaching materials in attention training [15,16]. Their findings showed improvements and positive effects on attention problems after proper training. With the assistance of modern technologies, there were some successful cases using the digital training method reported by Steiner et al. [17] and Papanastasiou et al. [18], and their results showed that attention could be improved but the training effectiveness varied depending on the treatment.
In recent years, many brain neurologists suggested that the brain is plastic and can be activated through training. Current research trends in children’s attention training can be divided into two strategies: cognitive load training and mental or physical state training [14]. The strategy for training cognitive load is to have the trainees perform some tasks related to executive functions. Working memory and conflict resolution are the abilities required to perform these tasks, so this study is focused on the strategy for training cognitive load. Another type of training is mental state training, which uses different sensory stimuli to change the trainee’s physical and mental states.
As game-based learning technology evolves, many researchers have combined game elements with attention training in a digital way [19]. Green and Bavelier [20] confirmed in their research that action video games could greatly enhance the perceptual ability and improve concentration, resulting in a positive impact on learning effectiveness. Lim et al. [16] used brain waves combined with speed-based digital games to remedy attention deficit hyperactivity disorder (ADHD) problems. Green et al. [21] suggested four common features of digital attention training: (1) Extraordinary speed: fast switching of objects during training, (2) cooperation between perception, cognitive and motor: players need to use both perception, cognitive and motor in the training of movement types, (3) unpredictability: the ability to concentrate on the training while paying attention to the unexpected events, and (4) emphasis on peripheral processing: the ability to focus on the screen center while dealing with the tasks around the screen.

1.2. Virtual Reality

Virtual Reality (VR) is a virtual 3D space generated by the computer interface and immersive instruments. In addition to providing a new visual and auditory experience, the user can also interact with others in the virtual world. The sense of immersion makes people feel like they are situated in the real world filled with imagination and creativity for them to explore. Burdea and Coiffet [22] proposed that virtual reality has three characteristics: interaction, immersion, and imagination, called the three I’s of VR. Interaction means that users can interact with the objects and avatars in the virtual environment and receive responses in real-time; immersion means the 3D virtual world provides users with the immersive feeling as if they were in the real world; imagination means that there are all kinds of possibilities in the virtual world, where the virtual characters and objects can be created even if they do not exist in the real world.
VR technology is widely used in various fields, such as gaming, medical training, travel, and education, and it is an image synthesis technology combining sound effects to create a virtual world. In addition, the users can interact with the virtual world through devices such as head-mounted displays (HMDs), position trackers, and data gloves to experience the feelings of immersion and participation. Virtual reality can be divided into the following four types according to different equipment used:
  • Desktop VR: Also known as non-immersive virtual reality, it is the cheapest and easiest way of VR, which requires only a regular computer, the VR software, a mouse, and a keyboard to interact with the computer. Although a joystick can enhance interactivity, it is less immersive than a data glove [23].
  • Simulator VR: Also known as vehicle-based VR, it is the first VR system developed for the purpose of simulation. Simulator VR allows the user to operate in a specific hardware environment to perform flying or driving training. Simulator VR is designed with an operating interface and scenery equipment to simulate a real-life situation, e.g., a pilot training system [24].
  • Immersive VR: With specific input and output devices, such as stereo sound devices, HMDs, and handsets, the user can receive feedback stimuli in real-time. The sensation and interaction allow full immersion and isolation from the outside world [25].
  • Projection VR: Using a projector with stereo sound effects, images are projected onto the screen to create a three-dimensional scene. Users can experience virtual reality with 3D glasses, just like watching a 3D movie in a theater [26].
    Depending on how the models of objects and virtual scenes are developed, VR can also be divided into the following three types:
  • Geometry-based VR: Also known as geometric virtual reality. The objects in the virtual scene can be created by 3D modeling software, e.g., 3D Studio Max, Cinema 4D, AutoCAD, and Maya. Designers can control the orientation of 3D objects with different viewing angles, and they can also add programs to these objects for setting different characteristics [27,28].
  • Image-based VR: It is designed using photo synthesis technology by the following two methods: The first is to use a camera as the axis and rotate it at a fixed angle to take images from the surrounding environment. Then, the image processing software is used to combine the images for creating the virtual scene without spending a lot of time. This method is often used in developing virtual museums or art galleries. The second method is to surround the object with one or several cameras and shoot the object at a fixed distance around the circle. This method is suitable for displaying an object, and the audience can observe it from different angles [29].
  • Hybrid VR: Combining object-based VR and image-based VR, the first step is to take multiple images of a real scene, and then create a panoramic environment as the virtual background. The 3D virtual objects can be added to the scene and their characteristics are controlled by the program to achieve desired interaction [30].
Virtual reality has been applied in many research fields, including science, military training, medical experiments, and entertainment, and also brings a substantial contribution to education. When applied in education, VR can simulate various situations and provide immersive contexts for learners to interact with. It is a new form of educational medium which makes learning easier, more enjoyable, and more effective. Many universities are looking for a new learning environment that allows students to experience real-life processes without facing the risks, such as anatomy, and they found VR capable of solving this problem [31]. As shown above, using VR technology has become an important trend in the development of education. In addition, researchers engaged in combining VR with learning content to achieve better effectiveness [32,33,34,35].
Jung et al. [36] investigated the impacts of VR and augmented reality (AR) in the context of visiting the museum by applying social presence theory and experience economy theory. Jiménez [37] used VR and AR technologies in teaching chemistry at high schools and colleges to convey the idea that these technologies can help students learn more actively and independently. Based on the important characteristics of VR and the advantages of combining VR with education, this study aims at applying VR technology in attention training for the following reasons:
  • Immersive training: Because VR can provide 3D visualization to enhance immersion and isolate external distractions, users can focus on attention training more easily.
  • Bringing fun to learning: Integrating VR into teaching can reduce the rejection of learning contents and enhance concentration. VR creates a virtual learning environment for students to interact with and learn from. This new approach can also bring fun to learning and reduce the problem of inattention caused by boring courses.
  • Combining multimedia: VR systems combine 3D models, stereo sounds, and animation with learning content to present more diverse stimulus effects.
  • Direct interaction: VR systems provide the most direct interaction for users, without complicated training instructions and explanations, so elementary school students can operate it easily and concentrate on attention training.
  • Integration of physical application: Since children with attention deficits are liable to distraction, training should not be done by oral instruction only. The VR system provides an immersive experience and multiple types of sensory stimulation, so it is considered a suitable tool for attention training.
  • Automatic recording of the learning process: The VR system can record the user’s training process, which not only facilitates the subsequent analysis but also allows the adjustment of training difficulty according to different users and their ages.
In recent years, VR technology has been widely applied in education because it can break through limitations in traditional education by allowing learners to go beyond the scope of a classroom or textbook, making difficult knowledge easier and more interesting. Virtual reality not only gives students an immersive experience but also enhances their willingness and enthusiasm to conduct learning through repetitive practice. Virtual reality provides new perspectives for teaching materials and activities. The teachers can also investigate students’ participation and learning status in the course, and then modify the content to meet their requirements based on learning portfolios [38]. As mentioned by Loeffler and Anderson [39], virtual reality can present educational content in a more realistic way than textbooks, and people are able to process visual information better than text. Therefore, incorporating virtual reality into teaching can enhance students’ learning motivation and performance more effectively.
Virtual reality not only contributes to school education but also excels in various types of teaching and learning activities. The study by Carbonell-Carrera and Saorin [40] showed that the virtual learning environment created using Google Street View and VR glasses could improve students’ spatial orientation skills. From the literature review, it can be seen that virtual reality has been widely applied in education and has brought about a significant impact. In addition to enhancing students’ motivation in learning and prolonging their attention span, many studies have shown that integrating VR technology into teaching can increase the effectiveness of learning.
Cho et al. [41] developed some cognitive training tasks using VR technology to validate the possibility of virtual reality for attention enhancement in a cognitive training program. They found that immersive VR with cognitive training is effective for attention enhancement, and they also confirmed that cognitive training could improve the attention span of children and adolescents with behavioral problems. Mei et al. [42] proposed a joint attention training approach using Customizable Virtual Human (CVH) and a VR game to assist with joint attention training. Their study revealed insights into how the user interacted with the CVH and how these interactions affected joint attention. The results showed that the CVH made participants gaze less at the irrelevant area in the VR game. Based on the definitions and theories discussed above, a VR attention training system is designed in this study and the objective is to enrich the traditional APT training method, improve the attention of elementary school students, and provide them a more interesting and effective training experience.

1.3. Cognitive Load and Learning Anxiety

Cognitive load is the amount of effort placed on an individual’s cognitive system when performing a specific task [43]. If the amount of information exceeds the capacity of the working memory, it can have a negative impact on the learner, such as affecting their learning comprehension or problem-solving ability. The cognitive load can be categorized as: intrinsic cognitive load, extraneous cognitive load, and germane cognitive load as described in the following:
  • Intrinsic cognitive load: The intrinsic cognitive load relates to the difficulty of learning content and the prior knowledge of learners rather than the teaching method or how the material is presented. Usually, the same content will produce a lower intrinsic cognitive load for learners with more prior knowledge, and a higher intrinsic cognitive load for learners with less prior knowledge.
  • Extraneous cognitive load: Extraneous cognitive load is related to external elements such as instructional design, presentation of materials, and teaching activities. Therefore, the extraneous cognitive load of a learner can be reduced through appropriate instructional design and teaching processes.
  • Germane cognitive load: Germane cognitive load is related to the extraneous cognitive load. Through the design of appropriate teaching materials and teaching activities, the extraneous cognitive load can be reduced and motivation and concentration can be increased, which can help construct an effective learning model to achieve learning goals more easily.
Learning anxiety means that students may feel nervous, fearful, or challenged in learning, and it may affect their academic performance. Learning anxiety is also an important factor causing negative attitudes and less confidence in learning. Many students are affected by academic pressure or learning anxiety because it may decrease the quality of sleep, diet, and the ability to focus on learning, resulting in lower learning outcomes. Learning anxiety is more common in a second foreign language or math studies. In order to reduce the source of stress during learning, designing good teaching materials and activities is an important task for instructors. Therefore, this study has investigated the effects of different training methods on learning anxiety for improvement.
The purpose of this research is to develop a VR training system for improving the attention of elementary school students. With the 3D interactive user interface, the students can conduct attention training in an immersive environment isolated from the outside world. This study also investigates whether the VR system performs better than the computerized APT in improving their attention. Based on the above research objectives, the following questions are to be answered in this study.
(1)
Does the VR training system improve the attention of elementary school students?
(2)
What is the effectiveness of the VR training system on different types of attention for elementary school students?
(3)
Is the VR training system more effective than the computerized APT?
(4)
Are there improvements in cognitive load and learning anxiety by the VR training system as compared to the computerized APT?

2. VR Training System Design

There are different types of VR devices on the market. This study used HTC VIVE for the PC-based VR and HTC VIVE Focus Plus for all-in-one VR. To develop VR software on a computer, it is required to download Steam VR and connect the VR devices to the computer. To use Unity3D for VR development, it is necessary to download two plug-ins, i.e., Steam VR and VIVE Input Utility for Unity3D to integrate with the VR devices. When using HTC VIVE Focus Plus, the designer must download VIVE Wave SDK instead of the above two plug-ins. Unity3D is a game engine for developing virtual scenes and 3D objects. The games developed by Unity3D can be executed on many platforms such as Android, iOS, Windows, and Wii. Unity3D has a hierarchical and integrated development environment to facilitate visual editing using detailed attribute editors and dynamic game previews. The Unity3D development environment consists of a scene view, an object hierarchy, a project area, and an inspector area as shown in Figure 1.
This study used Unity3D to design two VR games for attention training based on the clinical model proposed by Sohlberg and Mateer [7]. The VR games are “Electrical Maze” and “Matching Shape or Color”. The former is designed for training sustained attention, selective attention, and divided attention, and the latter is designed for training focused attention, selective attention, and alternate attention. The game rules and training contents for the VR games are described as follows.

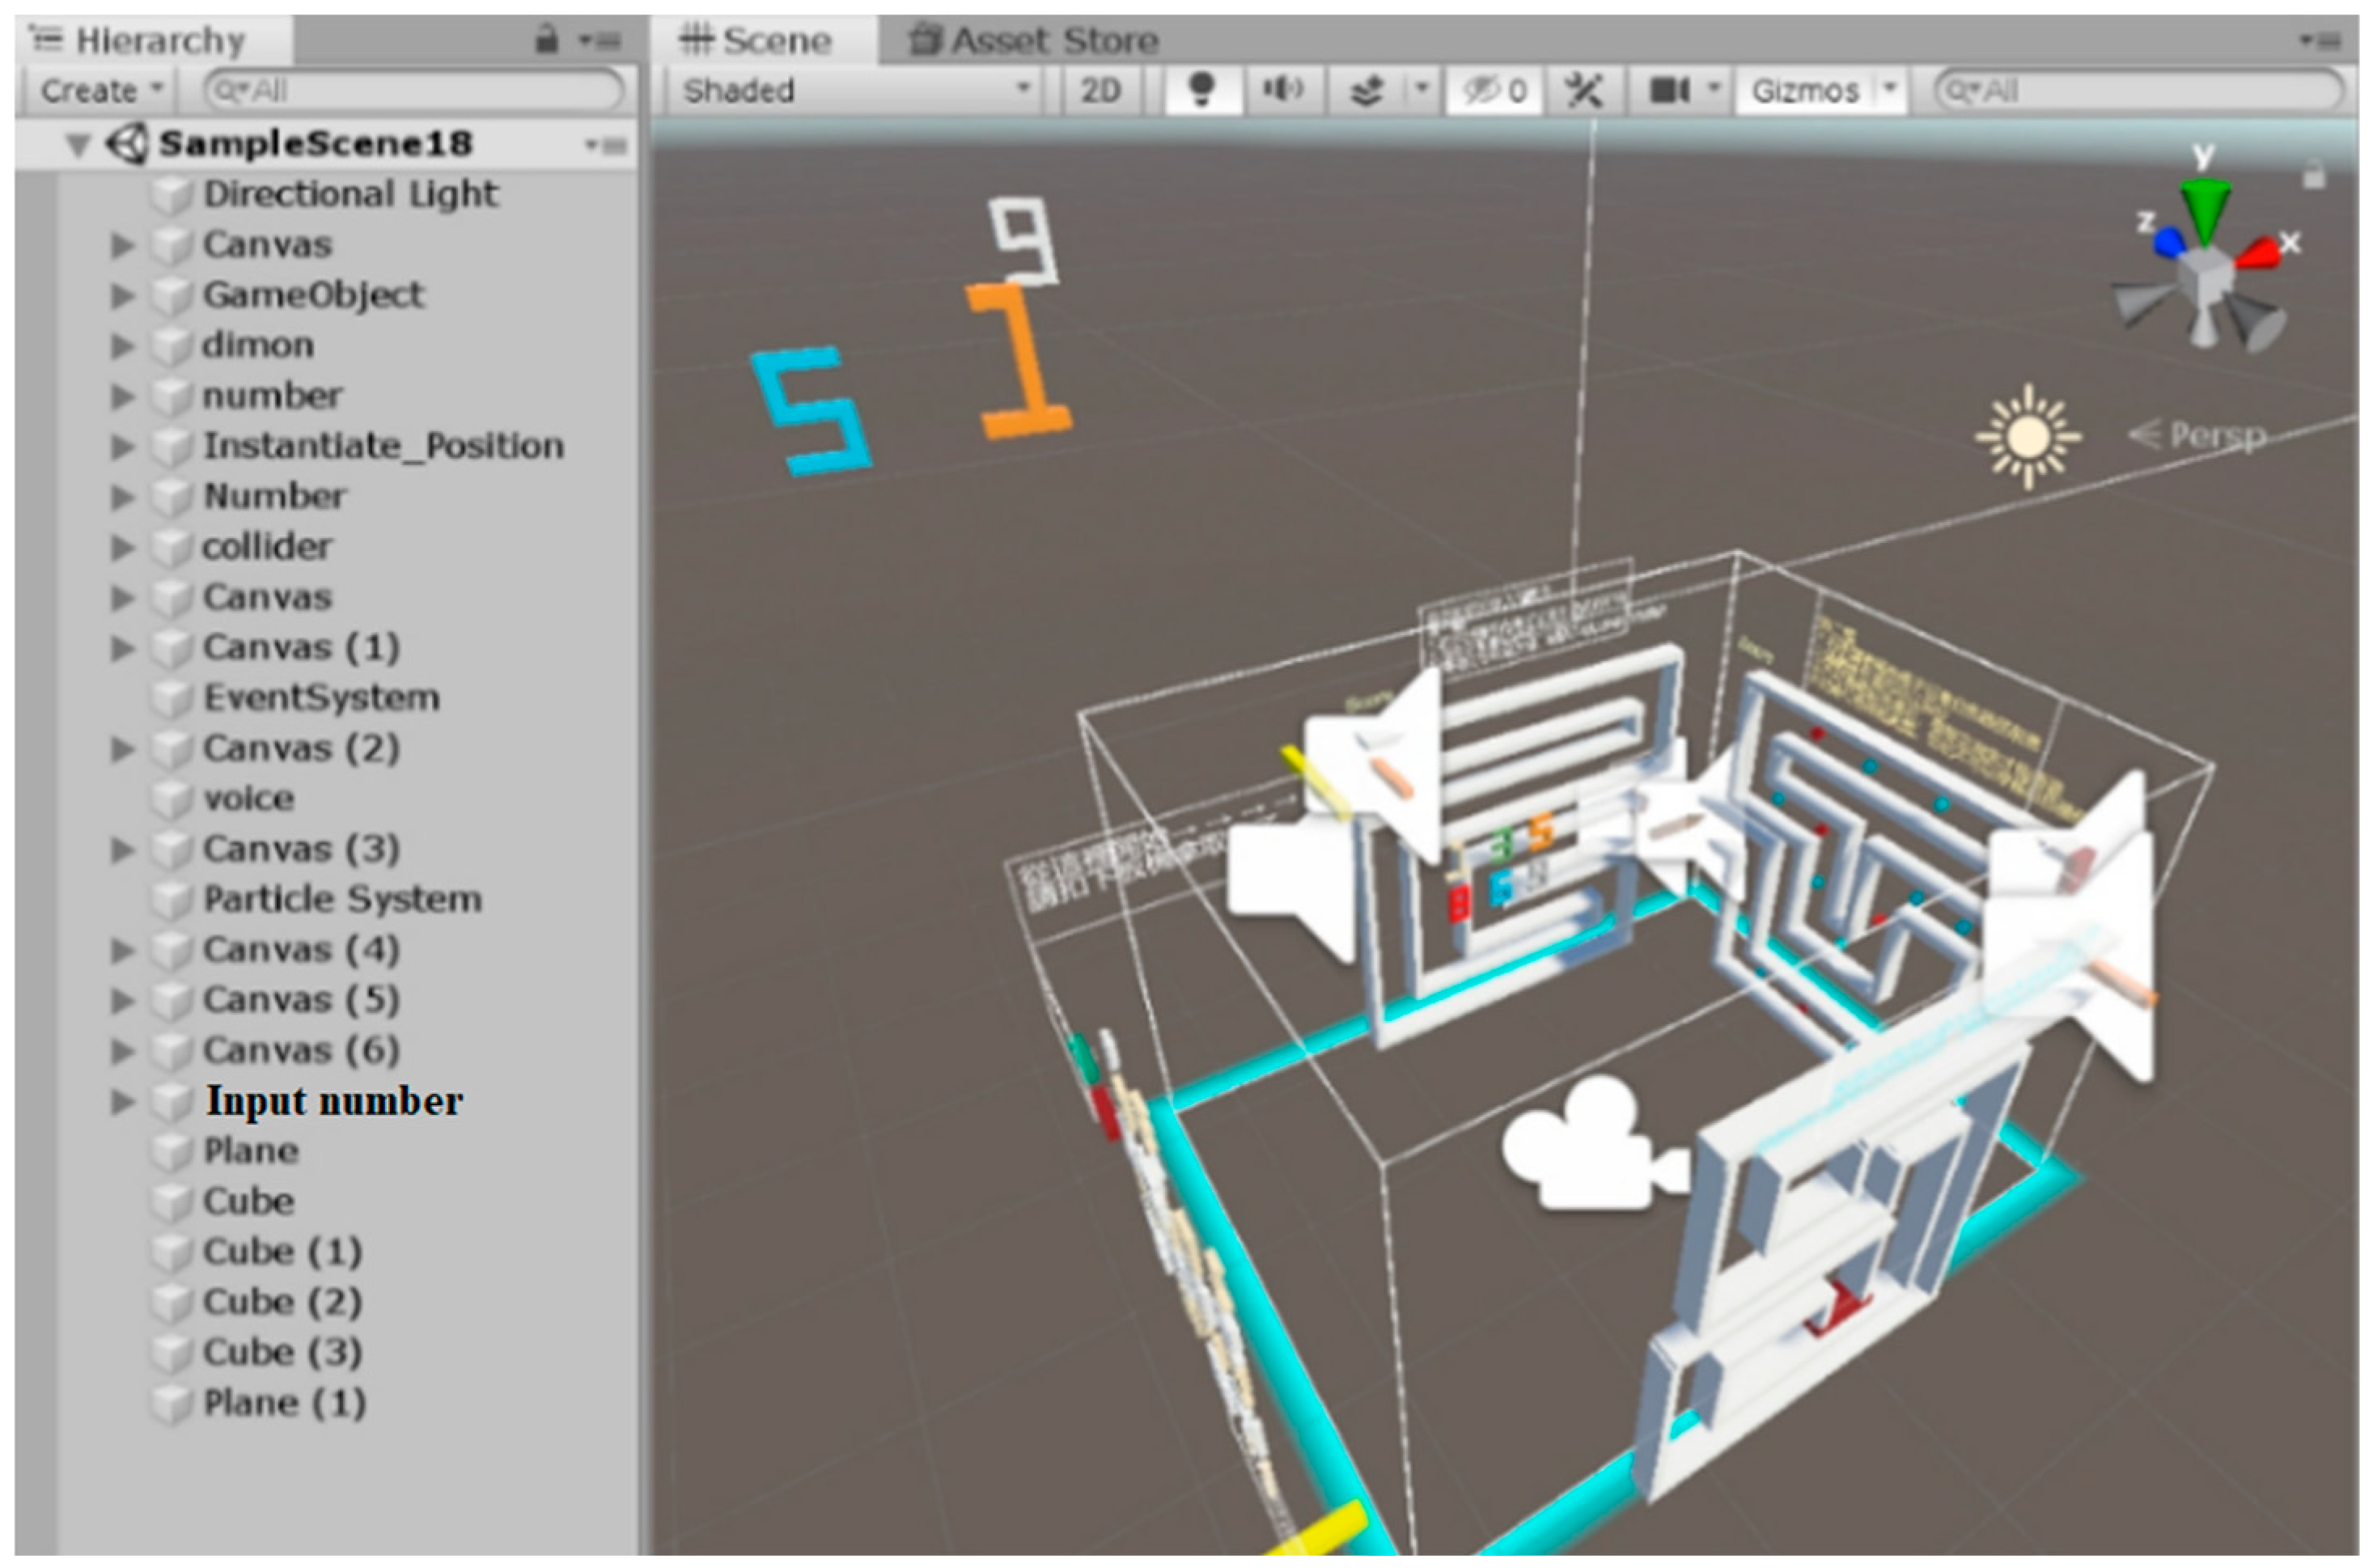
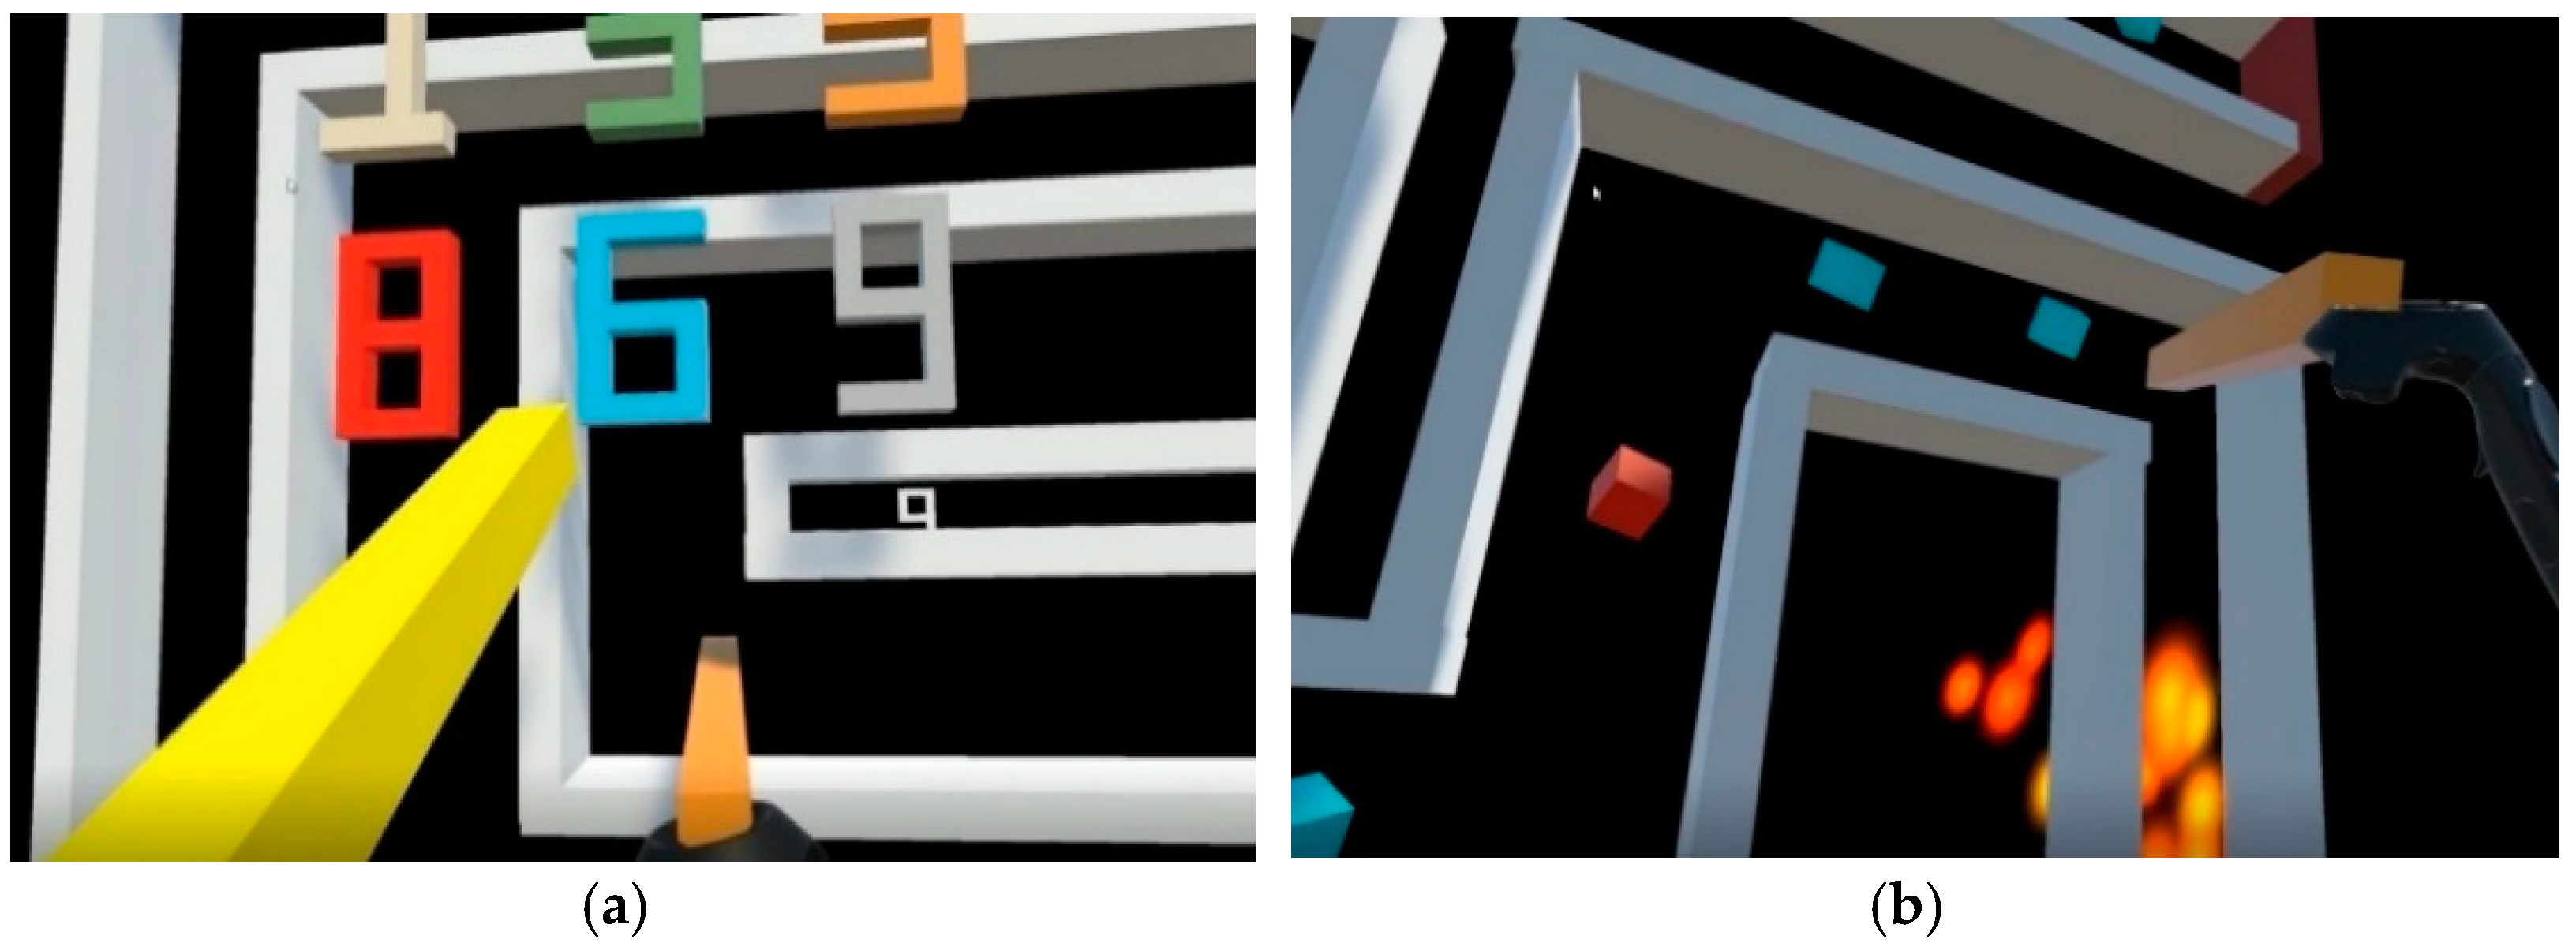
2.1. Electrical Maze

The user can play the “Electrical Maze” game using the HTC VIVE headset and controller to immerse in the virtual world for training attention (Figure 2). This VR game is similar to the fire electric pen, a traditional game in which the player must hold a charged stick in his or her hand and move forward through the path without touching the border. If the player touches the border too many times, the game will return to the origin and start again. There are three stages for training different types of attention. Each stage has a timer and a scorer to record the time spent and the score obtained, which can be used to determine the player’s attention ability.
  • Improving divided attention: To improve the ability of divided attention, this stage requires the player to perform two different tasks at the same time by appropriately distributing their attention. The player must use the right hand to hold the orange stick and move along the path, where numbers will appear randomly in the distance. The player must use the yellow stick in the left hand to click on the numbers as they appear and pay attention not to touch the border. In this way, the player is trained to allocate attention to different tasks separately, which cannot be completed without paying attention. If the player touches the border too many times or fails to click on the correct number, it means allocative attention is insufficient and therefore needs to be improved.
  • Improving selective attention: To improve selective attention, distractors are added in this stage to lead the player away from choosing the correct objects. Squares with different colors will appear on the way forward to influence judgment. Green squares are the target objects and they can add points whereas red squares are distractors to deduct points, so the player should avoid choosing red squares. In this stage, the player must choose the correct objects (green squares) and avoid touching distracting objects (red squares). If the player touches the border or distractors too many times, it means the selective attention is insufficient and needs to be enhanced.
  • Improving sustained attention: To improve sustained attention, the overall training process lasts about six minutes. This stage requires the player to be careful and not to touch the border. After the first two stages, it is not easy for the player to maintain attention during the third stage for a long period of time. To complete the six-minute training, the player must be fully concentrated but may still touch the border accidentally. Touching the border too many times in this stage means that attention cannot be maintained until the end and thus sustained attention needs to be strengthened.

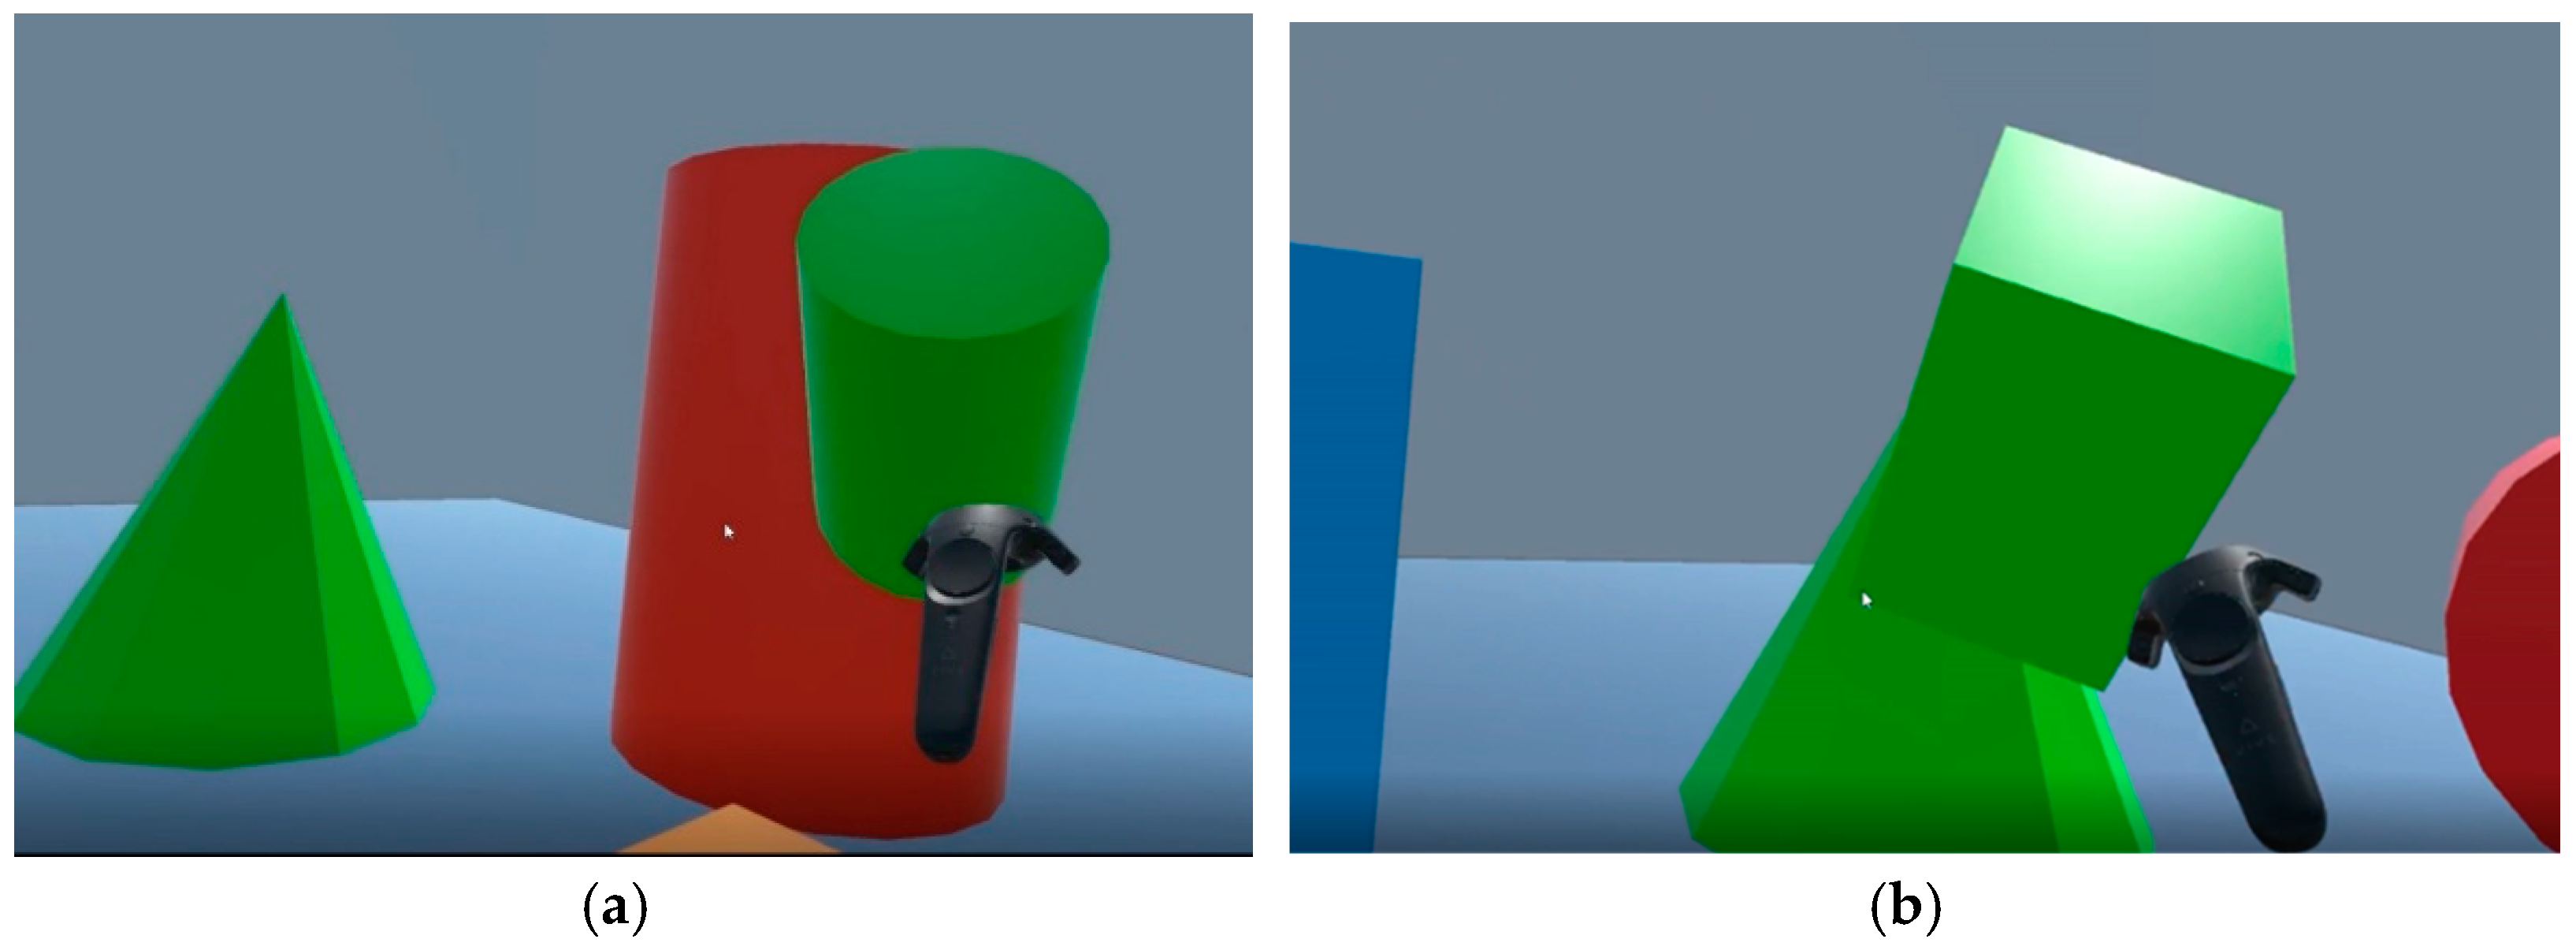
2.2. Matching Shape or Color

In this game, a virtual space and geometric objects with different shapes or colors are created for the player to match the correct object within a short time (Figure 3). There are four stages in this game, the first two in the same scene and the last two in another. The first and third stages are to match the shape of an object, using the colors and similar shapes as the interference. The game rule is to pick up the small object near the player and throw it at the large object of the same shape regardless of its color. The second and fourth stages are just the opposite, with the shape being used as the interference. The player needs to judge the color of an object and pick up the small object and throw it at the large object with the same color. If the judgment is correct, the player will receive ten points and the small object will disappear; otherwise, ten points will be deducted. The training time in this game takes about two minutes with 30 s in each stage. The left picture in Figure 3 shows the screen of matching the shape of the small object by throwing it at a large object with the same shape. The right picture shows the screen matching the color of the small object by throwing it at a large object of the same color.
  • Improving focused attention: In order to improve the ability of focused attention, the player must respond directly to what he or she sees immediately and make the right decision. “Response time” is a very important factor, so the player’s response time and correctness of selection are recorded during the training process. Under the pressure of 30 s per stage, the player has to judge the color and shape of an object in a very short time. If the number of objects correctly chosen within the time is too small, it means the focused attention is insufficient and therefore needs to be improved.
  • Improving selective attention: In order to improve selective attention, the player must ignore the interference of distracting objects and select the correct object to gain points. In the process of matching the color or shape of an object, there are objects with different colors or similar shapes to interfere with the player’s judgment. If there are too many errors within this stage, it means the player is easily disturbed and therefore selective attention needs to be enhanced.
  • Improving alternating attention: In order to improve alternating attention, the player must switch between selecting the color and the shape of an object. The first and third stages are designed for judging the shape of an object, whereas the second and fourth stages are designed for judging the color of an object. If incorrect selections are made due to wrong judgment, the player is unable to switch attention properly and therefore alternating attention needs to be improved.

3. Materials and Methods

In this study, a VR attention training system is designed to investigate whether the VR technology is effective in improving the attention of elementary school students and how it affects each type of attention. A training experiment was conducted with 66 students at an elementary school in Hsinchu, Taiwan as experimental subjects. One class of third-grade and one class of fourth-grade students were used as the experimental group with a total of 34 students. Another two classes (third and fourth graders) were used as the control group with a total of 32 students. Because the participants were underage, the researchers must obtain the consent of their parents, and the “Parental Consent Form” had to be signed before the experiment was conducted to guarantee no physical or psychological harm to their children. During the experiment, the control group used the APT tool and the experimental group used the VR system to investigate the effectiveness of different training methods on the five types of attention.

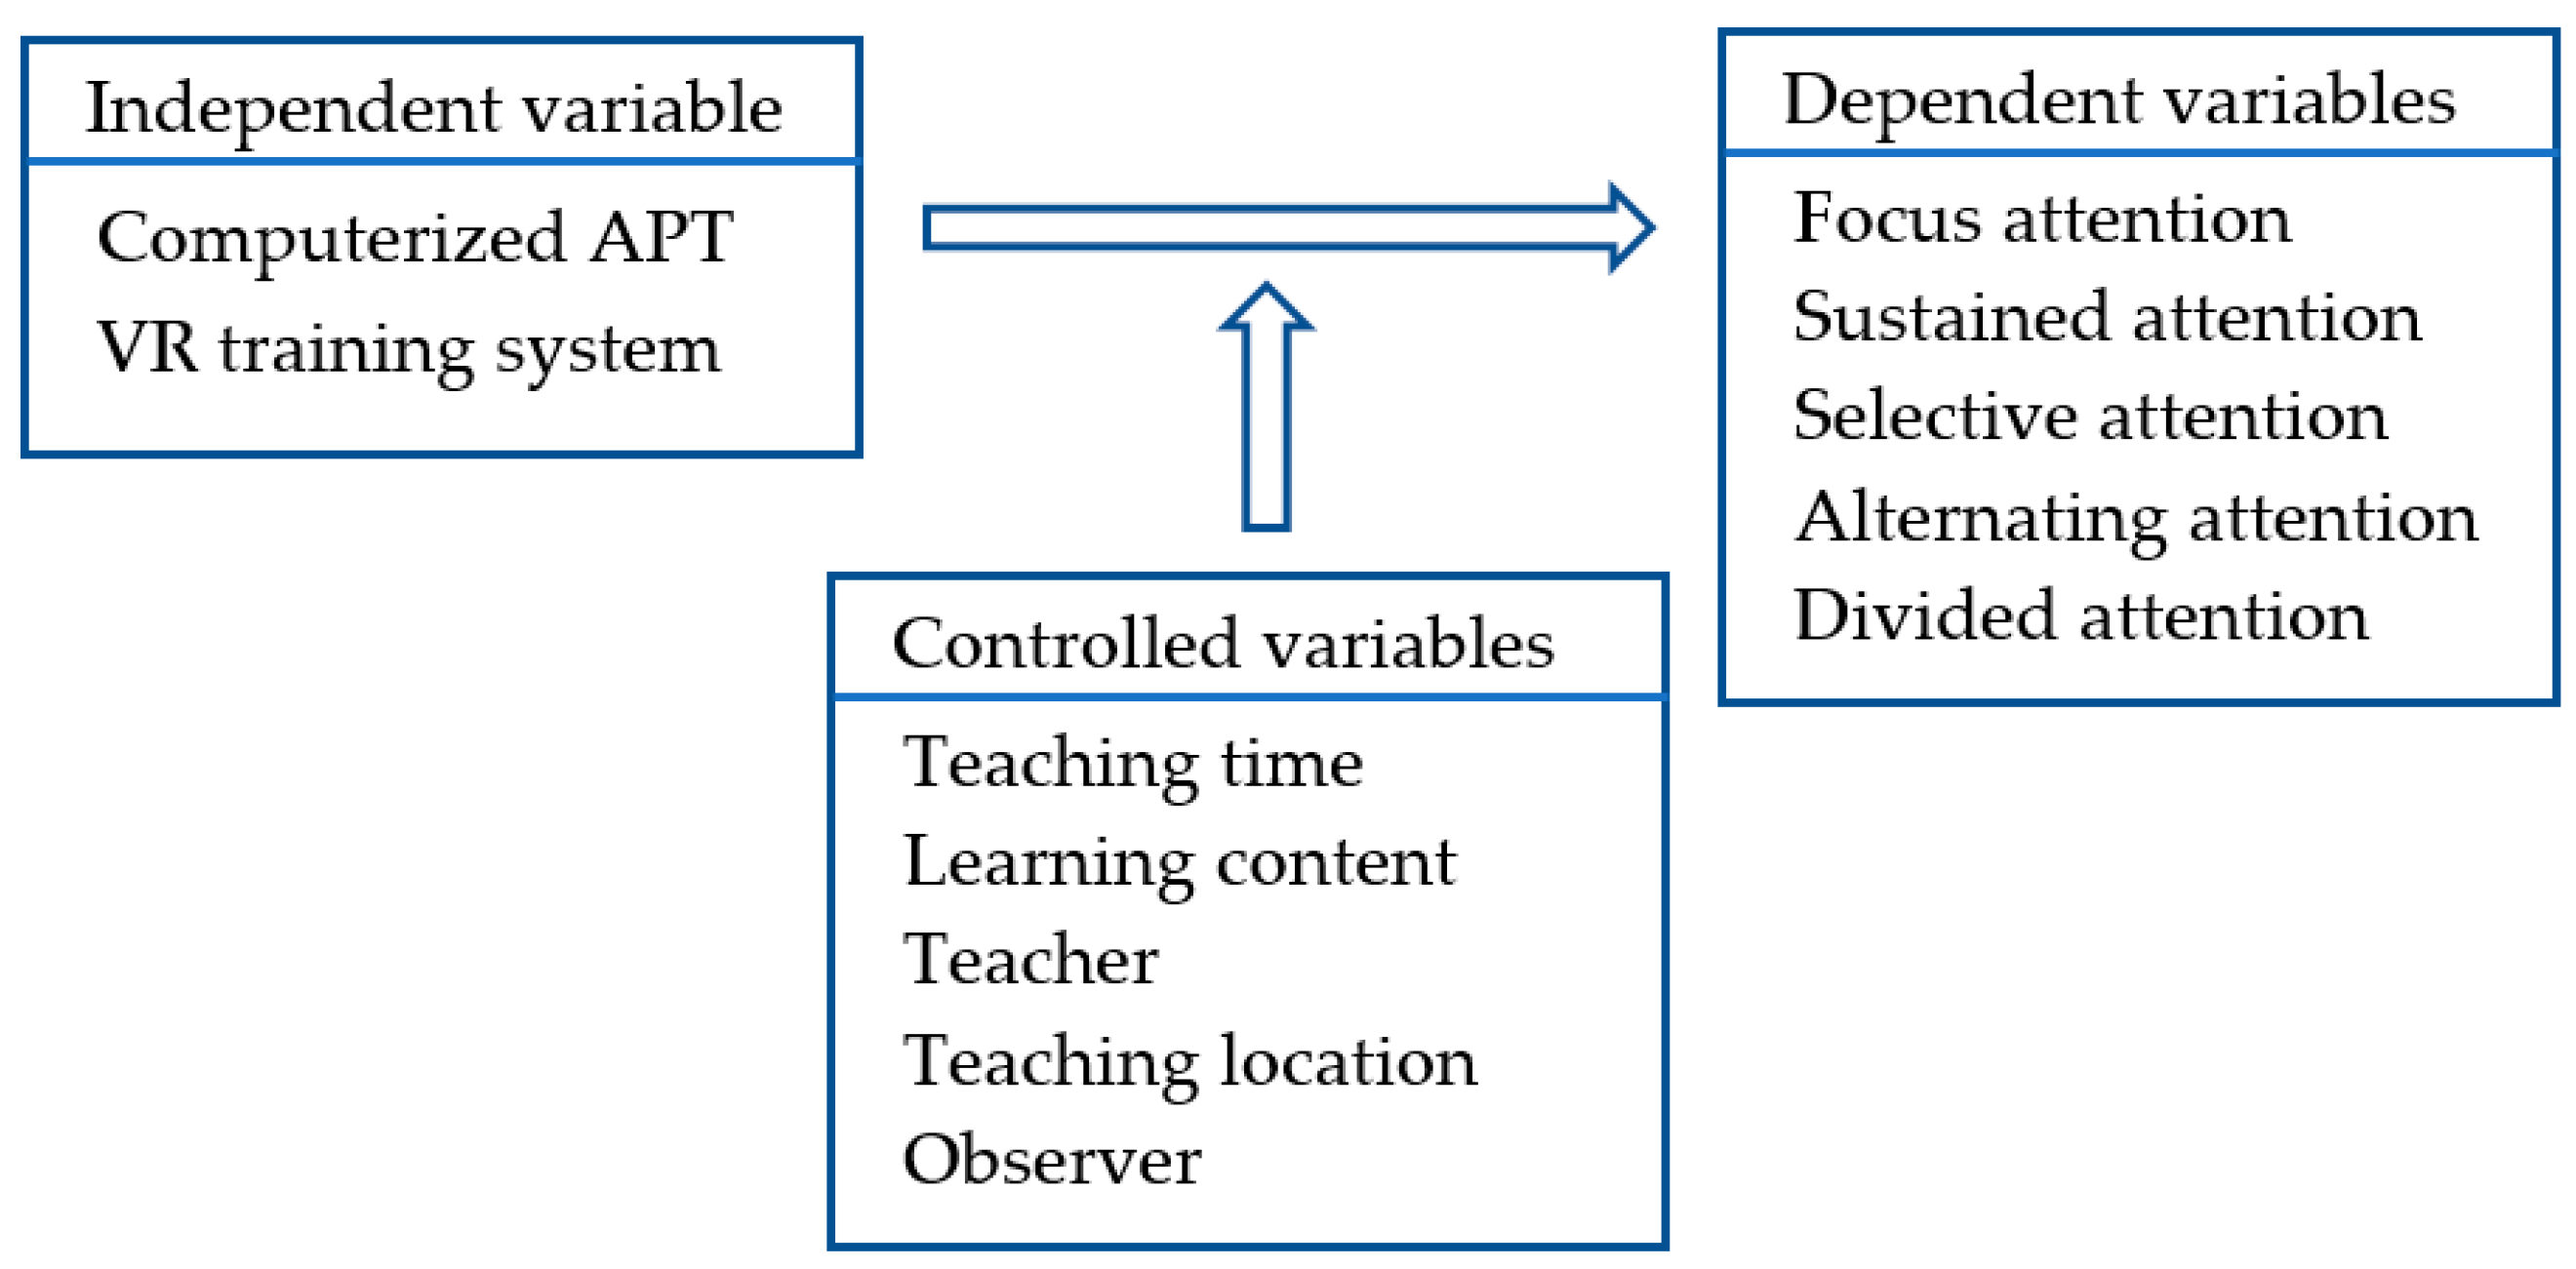
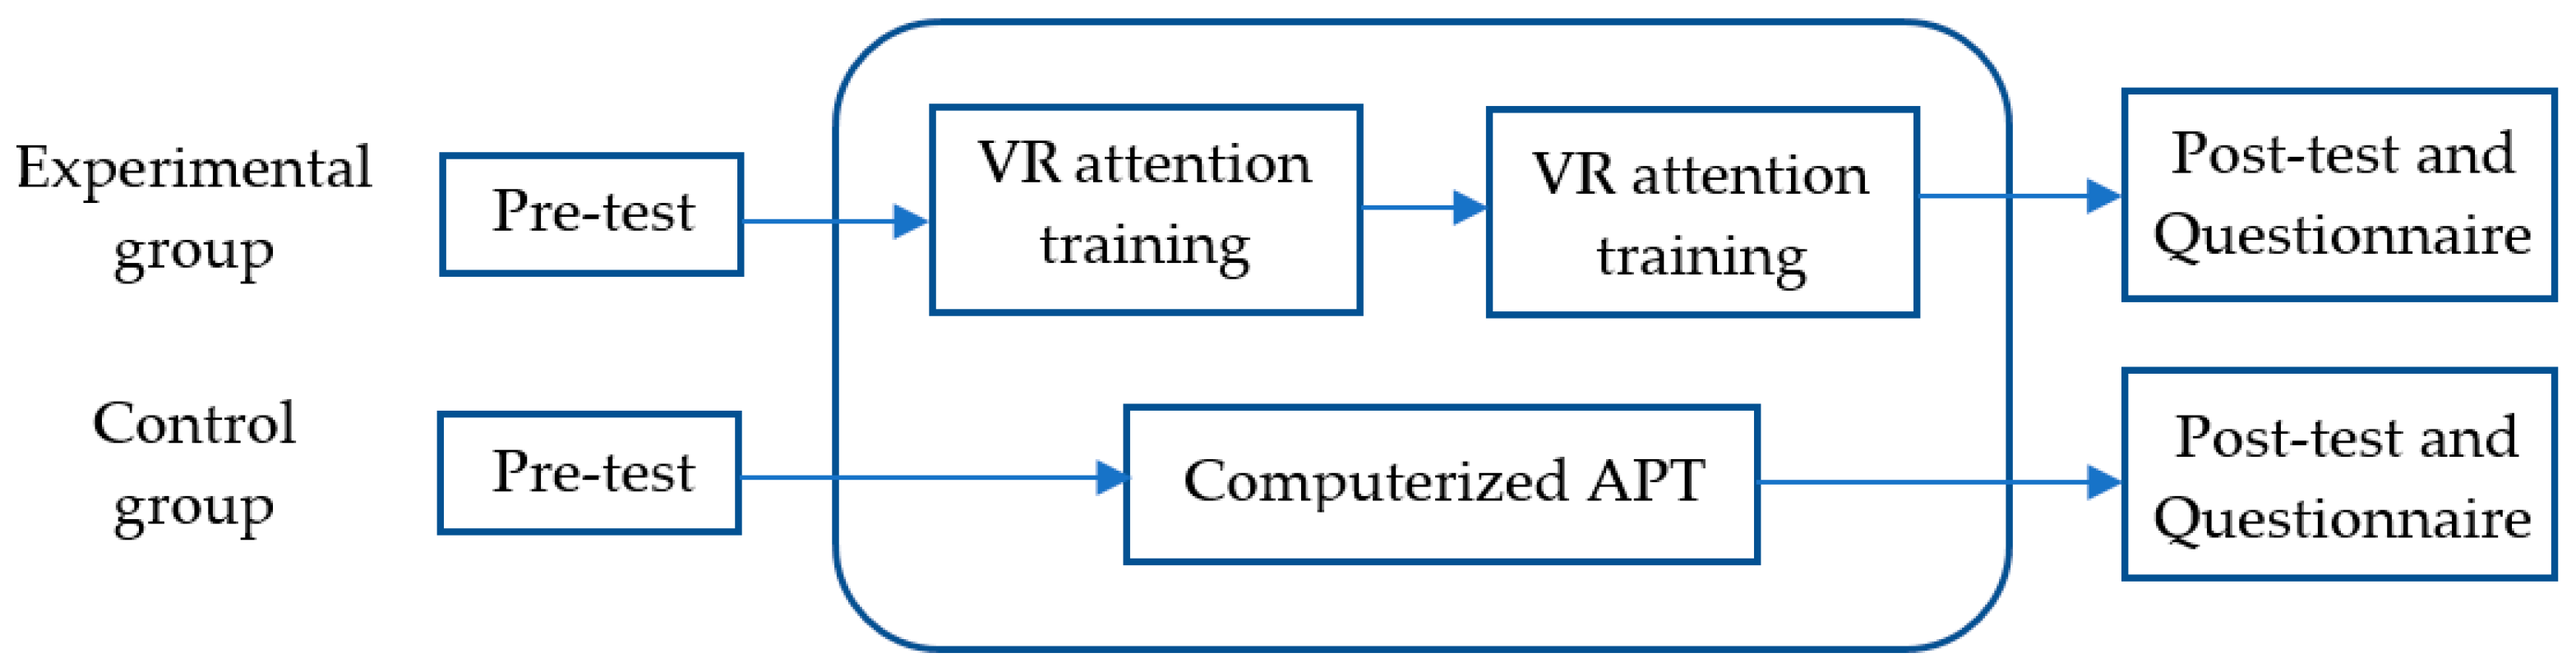
3.1. Experimental Design

A pre-test and post-test design of the quasi-experimental method was adopted in this study. The experimental group performed VR training and the control group performed the APT. Both groups took the pre-test and post-test of the “Attention scale for elementary school children” before and after the training, respectively. The experimental design is shown in Table 1, where the codes of the tests and attention training for the experimental and control groups are listed below. The independent variable, dependent variables, and controlled variables in the experiment are shown Figure 4.
  • O1, O2: The pre-test before receiving attention training. The test instrument is the “Attention scale for elementary school children”.
  • O3, O4: The post-test after receiving attention training. The test instrument is the “Attention scale for elementary school children”.
  • X1: The experimental group performed VR attention training.
  • X2: The control group performed computerized APT.
Figure 5 shows the flowchart of the attention training experiment. First, the experimental group and the control group took the pre-test of “Attention scale for elementary school children” to measure their attention ability before training. After that, the control group performed attention training using the computerized APT. The APT training was not limited by equipment, so only one session was needed to include all participants and the training time was 40 min. Because the number of HMDs was not enough, the participants had to be trained in two sessions, each lasting for 20 min. Finally, both groups took the post-test of “Attention scale for elementary school children” and then performed the questionnaire survey on cognitive load and learning anxiety.

3.2. Research Tools

The research tools used in this study include the computerized APT, the VR training system, the attention scale for elementary school children, and the questionnaires to measure the learning anxiety and cognitive load for attention training.

3.2.1. APT Tool

The APT tool covers the five dimensions of attention: focused attention, sustained attention, selective attention, alternating attention, and divided attention. It can be used to provide specific training to address different types of attention problems. This training tool has been used in various medical and rehabilitation settings, and many case studies showed that children after APT improved not only their attention but also their learning abilities. The computerized APT tool used in this study was adapted from the APT tool, a public resource from YouTube [44]. One question was selected from each of the five attention domains and the selected questions were reformatted using the E-prime system [9] as listed in Table 2. In this study, the purpose of APT was to improve the focused, sustained, selectivity, alternating, and divided attention of the participants. The total training time was approximately 10 min.

3.2.2. VR Training Games

In this study, two VR training games were designed to improve the attention of elementary school students, namely, “Electrical Maze” and “Matching Shape or Color”, and the design concept is based on the five types of attention (Table 3). The former can improve sustained attention, selective attention, and divided attention; the latter can improve focused attention, selective attention, and alternating attention. The total training time of the VR system is approximately 10 min (Figure 6).

3.2.3. Attention Scale for Elementary School Children

The “Attention scale for elementary school children” was developed by Lin [45], and it consists of five types of attention and 10 test items based on the attention dimensions: focused, sustained, selectivity, alternating, and divided attention (Table 4). It can be used to screen children with attention deficits and analyze their attention problems according to the test results, and then implement a follow-up attention training program according to the problems detected. The test has good reliability and validity. The reliability of the test includes construction reliability and internal validity, and the validity is based on expert validation and approval by various scholars. The full scale was consistently correlated with each of the attention subscales and subtests.

3.2.4. Questionnaire Survey

A questionnaire survey was conducted to measure the learning anxiety and cognitive load during the training process.
  • Cognitive load scale: In this study, the cognitive load in attention training was measured by self-assessment using the scale of cognitive load inventory proposed by Sweller [42]. It is composed of two components: mental effort and mental load. This scale consists of four questions to measure the cognitive load on training content. The first question is the degree of difficulty in performing the training; the second question is the degree of effort in understanding the training material; the third question is the degree of concentration; the fourth question is the degree of stress.
  • Learning anxiety scale: In order to understand the learning anxiety during the training process, a learning anxiety scale was designed to measure the anxiety level in attention training using the five-point Likert scale, with a higher score indicating more learning anxiety.

4. Experimental Results and Discussion

The experimental results were processed and analyzed after attention training. There were five subscales in the attention test for both groups. The pre-test and post-test scores were used to observe the performance of the subjects on the five types of attention. The statistical software SPSS was used to analyze the test data. The results of the attention test for elementary school children in both groups were analyzed by paired sample t-test and ANCOVA to examine whether the computerized APT and the VR training system were effective in improving students’ attention and the difference in training effectiveness between the two groups. For the questionnaire results, the mean, standard deviation, reliability, and t-test significance were calculated to investigate the differences in cognitive load and learning anxiety between the two groups.

4.1. Effectiveness on Attention Training

In order to understand the effectiveness of different training methods in improving children’s attention, the pre-test and post-test of “Attention scale for elementary school children” were taken by both groups before and after the attention training. The total score of the test is 190 points, with 38 points allocated to each of the five attention dimensions. In the following, the attention scores are calculated for both groups, and the differences between the pre-test and post-test for both groups are analyzed.
Table 5 shows that the mean scores of the post-test for both groups are higher than those of the pre-test, indicating that participants have improved their attention after the training. The t-test results of the experimental group (Table 6) reveal that the difference between pre-test and post-test scores reaches a significant level (p < 0.001), indicating the VR training system had a significant impact on improving children’s attention. The t-test results of the control group show that the difference between pre-test and post-test scores reaches a significant level (p < 0.001), so the computerized APT could also improve children’s attention. Because the p-values for both groups are significant, the analysis of covariance (ANCOVA) is used to compare the training effectiveness between the two groups.
The test results of intra-group homogeneity by regression analysis (Table 7) reveal that the p-value is higher than the significant level (p = 0.637 > 0.05). Therefore, the ANCOVA can be conducted to compare the difference in post-test scores between the two groups. According to the ANCOVA results (Table 8), there is a significant difference in the training effectiveness between the two groups (p < 0.001), and the experimental group performed better than the control group because the former made more progress (25.235) than the latter (9.906) according to the results in Table 5.

4.2. Dimensional Effectiveness

In this section, the training effectiveness of dimensional attention, i.e., focused attention, sustained attention, selective attention, alternating attention, and divided attention is analyzed for both groups to evaluate the performance of the VR system.

4.2.1. Focused Attention

Table 9 shows the descriptive statistics of focused attention scores before and after training for the two groups. According to the results of paired sample t-test (Table 10), the experimental group achieved a highly significant level (p < 0.001), but the control group did not (p = 0.350 > 0.05). It is inferred that virtual reality is immersive and interactive, allowing participants to focus on responding to the visual and auditory stimuli during the training process without being disturbed by the outside world. In addition, the VR games require participants to respond to the stimulation within a short time, which is effective in training immediate reaction and focused attention.
The test results of intra-group homogeneity by regression analysis (Table 11) reveal that the p-value has not reached a significant level (p = 0.299 > 0.05). Therefore, the ANCOVA can be conducted to compare the training effectiveness of the two groups. The ANCOVA results (Table 12) show a significant difference in the training effectiveness between the two groups (p < 0.001). Because the progress between the pre-test and post-test by the experimental group is greater than that of the control group, the VR system was more effective than the computerized APT in terms of focused attention.

4.2.2. Sustained Attention

Table 13 shows the descriptive statistics of sustained attention scores for both groups. From the results of paired sample t-test (Table 14), the experimental group achieved a significant level (p < 0.001), and the control group also achieved a significant level (p < 0.001). Therefore, it is required to compare their training effectiveness using ANCOVA.
The test results of intra-group homogeneity by regression analysis (Table 15) reveal that the p-value has not reached a significant level (p = 0.841 > 0.05). Therefore, the ANCOVA can be conducted for analysis. According to the ANCOVA results (Table 16), there is a significant difference in the effectiveness of the two groups (p = 0.016 < 0.05). Because the progress between the pre-test and post-test by the experimental group is greater than that of the control group, the experimental group performed better than the control group, indicating that the VR training system was more effective than the computerized APT in terms of sustained attention. It is inferred that the VR games allowed participants to focus on the training content for a long time, which was helpful in improving sustained attention. For example, in the “Electrical Maze” game, participants had to maintain attention to avoid touching the border during the task while selecting correct objects.

4.2.3. Selective Attention

Table 17 shows the descriptive statistics of selective attention scores for both groups. From the results of the paired sample t-test (Table 18), the experimental group achieved a higher significant level of selective attention (p < 0.001), and the control group achieved a lower significant level (p = 0.046 < 0.05). Thus, the ANCOVA is conducted to compare the effectiveness of attention training between the two groups.
The test results of intra-group homogeneity by regression analysis (Table 19) reveal that the p-value has not reached a significant level (p = 0.893 > 0.05). Therefore, the ANCOVA can be conducted to compare the difference of training scores between the two groups.
According to the ANCOVA results (Table 20), there is a significant difference in the training effectiveness of the two groups (p < 0.001) and the progress between the pre-test and post-test by the experimental group is greater than that of the control group, indicating that the VR training system was more effective than the computerized APT on selective attention. It is inferred that adding distractors to the VR games was useful in improving participants’ selective attention. Compared to the computerized APT, the VR training system enabled more direct interaction with participants. For example, the “Matching Shape or Color” game allowed participants to focus on the task of selecting correct objects while distracted to achieve the goal of training selective attention.

4.2.4. Alternating Attention

Table 21 shows the descriptive statistics of alternating attention scores for both groups. According to the results of the paired sample t-test (Table 22), the experimental group achieved a significant level (p < 0.001) and the control group also achieved a significant level (p = 0.008 < 0.01). Therefore, it is required to compare the training effectiveness of the two groups on alternating attention using ANCOVA.
The test results of intra-group homogeneity by regression analysis (Table 23) reveal that the p-value has not reached a significant level (p = 0.491 > 0.05), so the ANCOVA can be conducted for analysis. The ANCOVA results (Table 24) show a significant difference in the training effectiveness of the two groups (p = 0.016 < 0.05) and the progress between the pre-test and post-test by the experimental group is greater than that of the control group, indicating that the VR training system was more effective than the computerized APT on alternating attention. It is inferred that the VR games allowed participants to allocate different attention abilities alternately. In the “Matching Shape or Color” game, participants could correctly switch their focus between different types of attention by interleaving the color and the shape of objects, which was helpful for enhancing their alternating attention.

4.2.5. Divided Attention

Table 25 shows the descriptive statistics of divided attention for the two groups. According to the results of paired sample t-test (Table 26), the experimental group achieved a significant level of progress on divided attention (p < 0.001) and the control group also achieved a significant level (p = 0.001 < 0.01), so it is required to compare the training effectiveness of the two groups on divided attention using ANCOVA.
The test results of intra-group homogeneity by regression analysis (Table 27) reveal that the p-value has not reached a significant level (p = 0.112 > 0.05). Therefore, the ANCOVA can be conducted for analysis. According to the ANCOVA results (Table 28), there is no significant difference in distributive attention between the two groups (p = 0.078 > 0.05), indicating that the experimental group and the control group had similar training effectiveness on distributive attention. Although there is no significant difference in divided attention between the two groups, the experimental group still made more progress (3.706) than the control group (2.094). In the “Electrical Maze” game, participants were trained to handle two tasks at the same time (clicking the target object and avoiding collision with the border), and they had to allocate their attention to different tasks to complete the mission, which was helpful for improving divided attention.

4.3. Cognitive Load Analysis

The questionnaire on cognitive load is divided into two parts, mental effort and mental load. Each part contains four questions, using a scale of 1 to 9, and a higher score means more cognitive load. It was used to measure participants’ difficulty, effort, concentration, and stress levels during attention training. Table 29 shows the t-test results of the overall cognitive load for both groups. It can be seen that the VR training system caused less cognitive load for participants, indicating that the immersive nature of virtual reality allowed them to focus on the training and thus reduced their cognitive load.
Table 30 shows the questionnaire results on cognitive load for the two groups. The scores of the experimental group are lower than those of the control group in all items, and a significant difference exists in the fourth question “The level of stress caused by the attention training” (p = 0.028 < 0.05). It can be inferred that the VR training system was less stressful for participants because they could experience the fun of playing VR games during the training process, which was useful for reducing the psychological stress caused by attention training. In addition, the score of the third question “Concentration level of attention training” is the lowest among all questions, indicating that both groups maintained good concentration during the training process.

4.4. Learning Anxiety Analysis

The questionnaire on learning anxiety contains ten questions, implemented by the 5-point Likert scale. It was used to investigate participants’ learning anxiety and preference for attention training. According to the t-test results (Table 31), there is a significant difference in the level of learning anxiety between the two groups (p = 0.001 < 0.01). The score of the experimental group is lower than that of the control group, indicating that the VR games created a relaxing and enjoyable training environment to reduce the learning anxiety of the experimental group during the training process.
Table 32 compares the questionnaire results on learning anxiety between the two groups, and the questions with a higher significance are listed in the following. It is noted that items 5, 6, 8, and 10 are inverted questions and rescaling must be done when calculating the average score in the t-test.
  • “I often feel nervous during attention training” (p = 0.018 < 0.05 *)
The VR training was less likely to bring tension to participants because it was more relaxing and enjoyable than the computerized APT, which was mostly numerical and textual training.
  • “I want to do attention training every day” (p < 0.001 ***)
The experimental group was more willing to perform attention training because the VR games were more interesting than the computerized APT. Therefore, the experiment group had a higher intention than the control group.
  • “I like to do attention training” (p < 0.001 ***)
The participants’ preference for VR training was higher than for the computerized APT because the former was immersive and interactive, allowing them to play fun games in the training process.
  • “I think the content of attention training is interesting” (p = 0.005 < 0.01 **)
The computerized APT contained monotonous questions and mouse-click responses, which were boring to participants. The VR games were immersive and required participants to complete exciting tasks during attention training.

4.5. Discussion

A VR system has been developed in this study for training the attention of elementary school students. The 3D interactive user interface and interesting VR games allowed the students to conduct attention training in an immersive environment isolated from the outside world. The training effectiveness on overall and different types of attention by the VR system and the computerized APT were compared by statistical analysis. A questionnaire survey was also conducted to measure the learning anxiety and cognitive load during the training process. According to the experimental results, the research questions are answered as follows.
(1)
Does the VR training system improve the attention of elementary school students?
According to the results of paired sample t-test, the experimental group achieved a highly significant level of progress after attention training. The ANCOVA result also shows a significant difference in the training effectiveness between the two groups. Therefore, the VR training system is more effective than the computerized APT in improving the attention of elementary school students.
(2)
What is the effectiveness of the VR training system on different types of attention for elementary school students?
The training effectiveness on different types of attention is analyzed for both groups to evaluate the performance of the VR training system. According to the experimental results, the significance of training effectiveness on individual attention is: focused attention (p < 0.001), sustained attention (p < 0.001), selective attention (p < 0.001), alternating attention (p = 0.016 < 0.05), and divided attention (p = 0.078), indicating that the VR training system is effective in most types of attention training.
(3)
Is the VR training system more effective than the computerized APT?
The experimental group performed better than the control group in attention training, especially sustained attention, because the VR training system allowed participants to play interesting games but the computerized APT was boring and it contained only text and pictures. The VR training system is immersive and required participants to complete the tasks with interference. Therefore, it is more effective than the computerized APT in attention training for elementary school students.
(4)
Are there better improvements in cognitive load and learning anxiety by the VR training system as compared to the computerized APT?
The questionnaire results showed that the experimental group had lower learning anxiety and cognitive load than the control group. Therefore, there are improvements in reducing cognitive load and learning anxiety by the VR training system as compared to the computerized APT.

5. Conclusions

The purpose of this study is to investigate the effectiveness of VR attention training and the computerized APT on elementary school students as well as their anxiety and cognitive load in the training process. A training experiment was conducted, where the experimental group conducted VR training and the control group received the computerized APT. The experimental results showed that both groups achieved significant progress after the training. The results of statistical analysis indicated that VR training was more effective than the computerized APT in improving participants’ attention. It is inferred that the immersive nature of virtual reality allowed participants to focus on training without being affected by external distractions and therefore could achieve better results.

5.1. Research Findings

The experimental group performed better than the control group in most types of attention training, especially sustained attention, because VR training allowed participants to focus on a specific task for a longer period of time. The result is the same as that obtained by Cho et al. [24] because VR training can improve the attention span of children and adolescents with behavioral problems. Sustained attention is a significant factor in school learning, and children with good sustained attention are able to focus on learning without being distracted by interference, thus more sustained attention can also improve learning performance. The computerized APT was less effective in selective and focused attention. The interference from neighboring participants and monotonous training content might be the reasons for the ineffectiveness. Similar results were obtained by Mei et al. [25] where the customizable virtual human made the participants focus on the VR game and gaze less at the irrelevant area of the game’s background.
The questionnaire results show that the control group had incurred more learning anxiety and cognitive load than the experimental group. It is inferred that the contents of APT training were mostly numbers and mouse-clicking responses, which were monotonous and boring to the participants, and could reduce their willingness to conduct attention training. In contrast, the VR training was immersive and interactive, which was useful in reducing participants’ cognitive load and anxiety.
The experimental results revealed that many elementary school students had attention deficits, and the stage of elementary school is a critical time for attention development. If teachers understand the situation, they can deal with this problem by providing students with suitable training content to reduce their attention deficits. The experimental results show that attention could be improved through proper training and that the VR training system is more effective than the computerized APT. Therefore, teachers can perform attention training by allowing students to play VR games to strengthen their attention ability and thereby enhance their learning effectiveness.

5.2. Limitations and Future Works

(1) Limitations: Although VR training is effective for improving children’s attention, there are some limitations for extending the findings and applications of VR training, including research subjects, experimental equipment, and research variables as described below:
  • Research subjects: This study was conducted only with third- and fourth-grade students in an elementary school in Hsinchu, Taiwan as the research subjects. Therefore, the findings cannot be extrapolated to other graders or areas in the country. If researchers need more representative results, they may need to select a wider area or different grades as the target population when performing the training experiment.
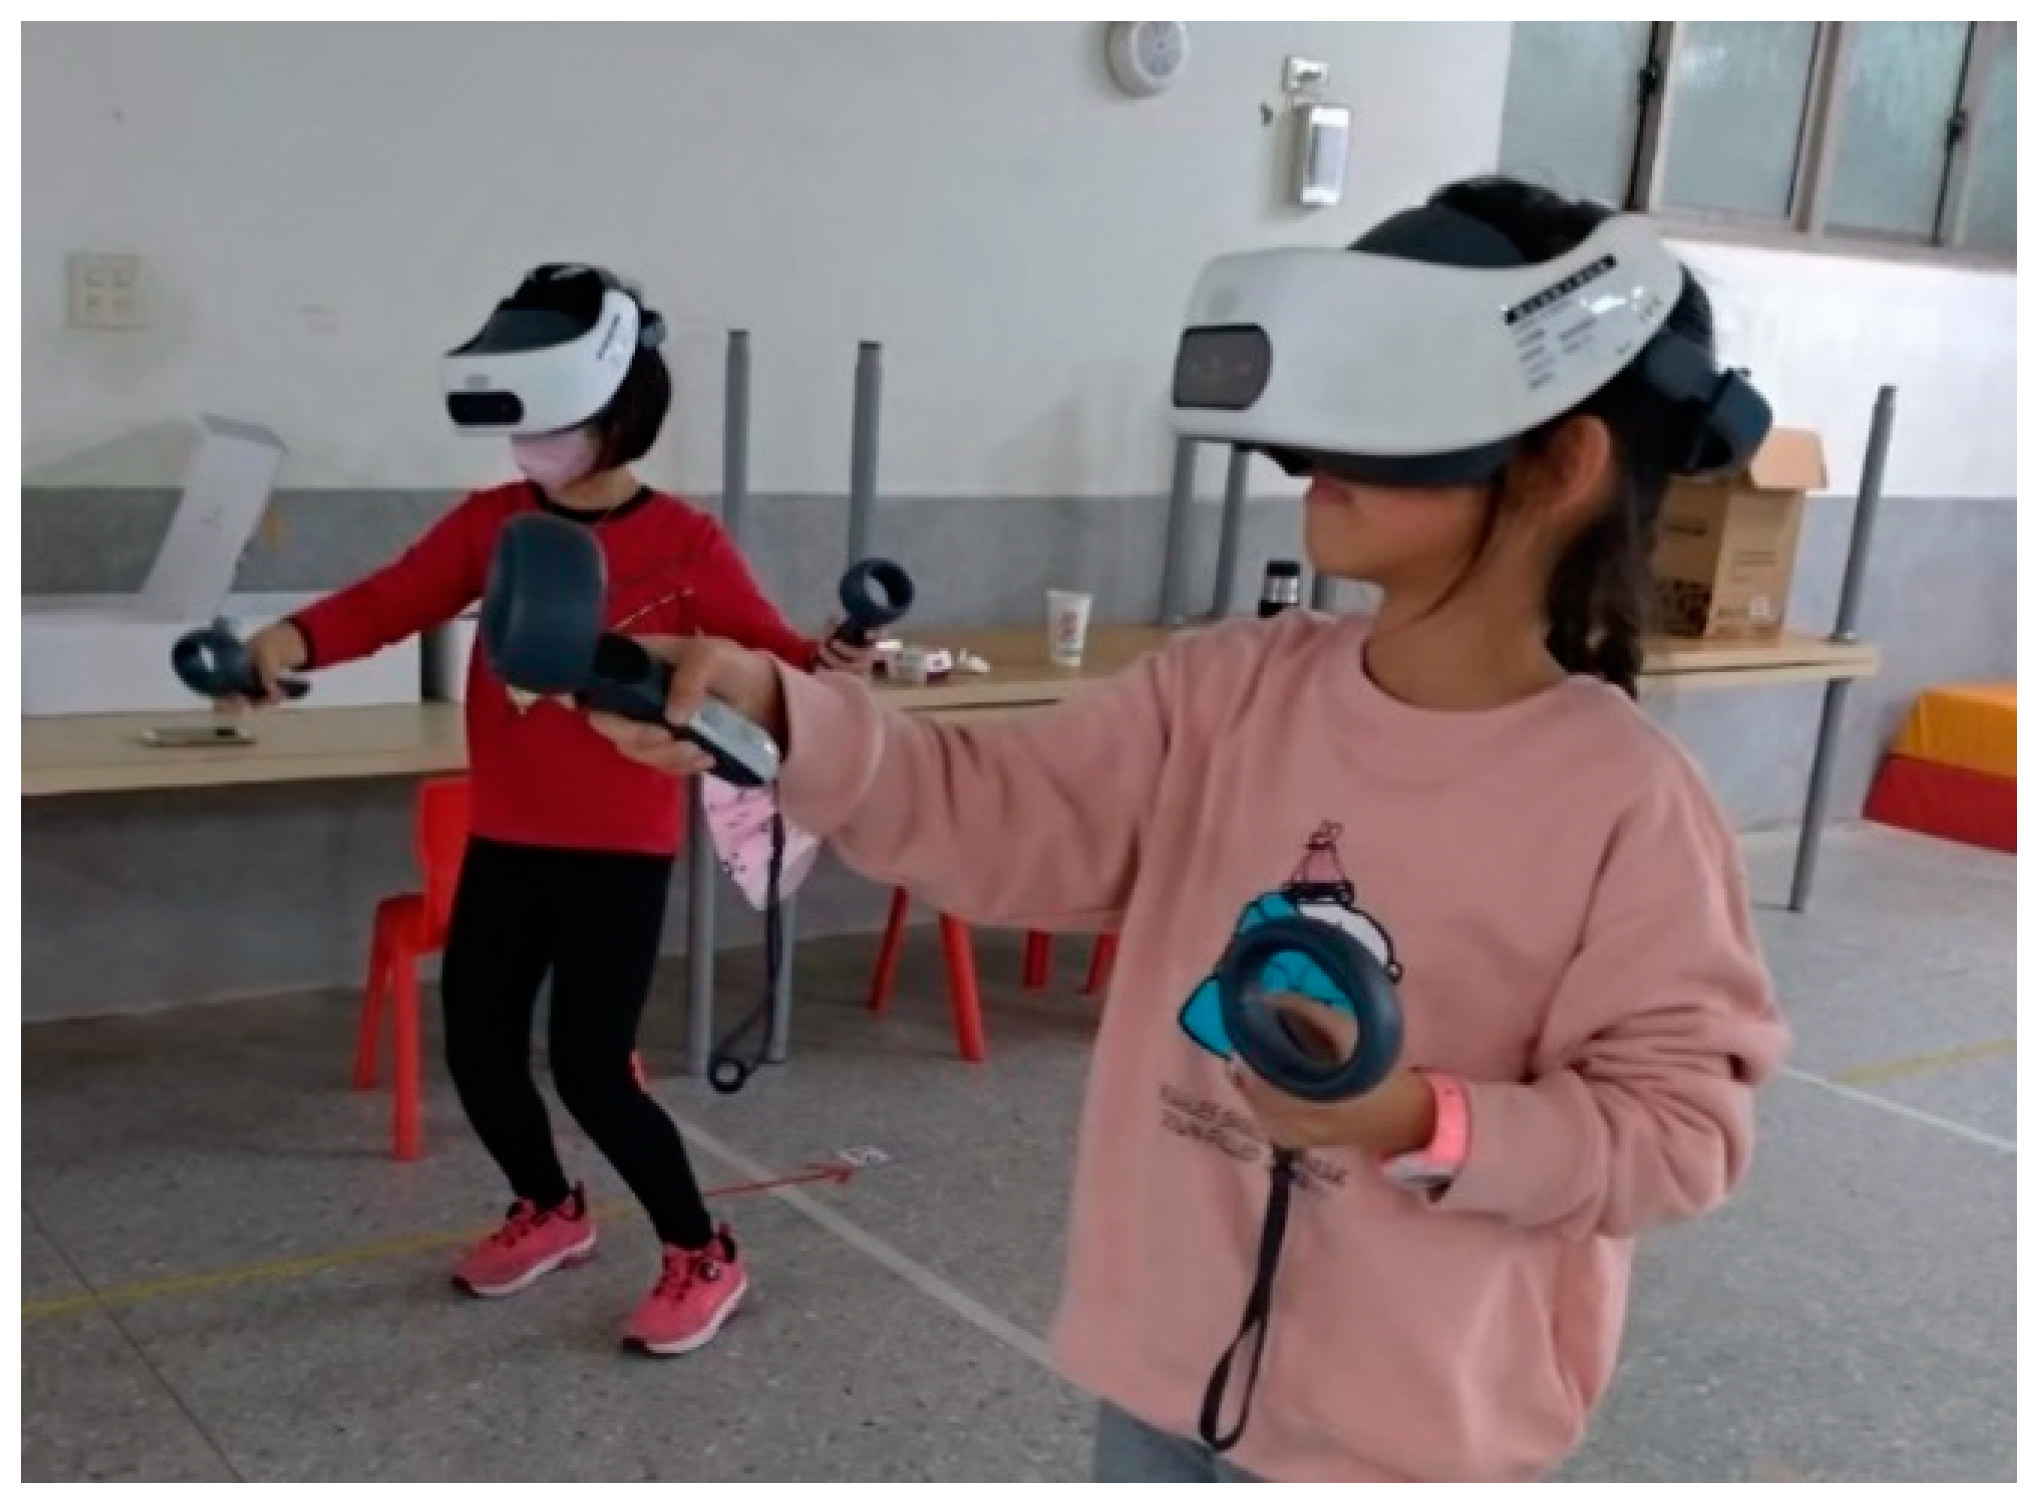
  • Experimental equipment: This study required the use of HTC VIVE and controllers as the research equipment. Due to the number of VR devices available, it was not possible for all participants to perform training at the same time. With the limited time for conducting the training experiment, only a short-term training effect was observed, and it could not be interpreted as long-term training effect.
  • Research variables: Because the family background, learning environment, and personal characteristics may affect the training effectiveness of individual students, it is suggested to add more variables to this study in the future, such as urban/rural disparity, familiarity with information technology, and physiological factors such that more in-depth investigation and findings can be obtained. In addition, VR training may not be suitable for those students suffering from physical discomfort due to the symptoms of dizziness and nausea when wearing the HMD, so it is required to reduce the training time, especially for young children, to avoid motion sickness.
(2) Future works: There are three directions for future works:
  • This study used quantitative data as the analysis tool. It is suggested that future studies may include qualitative data, and interviews could be used to understand more about the reasons behind the results of quantitative analysis or to understand the students’ feelings and emotions during the training process.
  • This study was focused on the results after training because the retention effect and follow-up test were not included due to the available experimental time. Future studies can perform a long-term observation to explore the follow-up effect.
  • The test in this study was a paper-and-pencil test, which required much labor to record test data and calculate the scores for analysis. Future studies can adopt computerized tests to reduce the effort and time of collecting data and calculating the scores. An online questionnaire survey can also be implemented to provide immediate response and more direct feedback.

Author Contributions

Investigation and formal analysis: I.-C.P.; investigation and methodology: K.-L.O.; investigation, writing–review and editing: W.T. All authors have read and agreed to the published version of the manuscript.

Funding

This research was funded by the Ministry of Science and Technology (MOST), Taiwan under the grant number MOST 109-2511-H-007-001-MY2 and MOST 109-2511-H-007-006-MY3.

Informed Consent Statement

Informed consent was obtained from all subjects involved in the study.

Conflicts of Interest

The authors declare no conflict of interest.

References

  1. Lodge, J.M.; Harrison, W.J. The role of attention in learning in the digital age. Yale J. Biol. Med. 2019, 92, 21–28. [Google Scholar] [PubMed]
  2. Grills-Taquechel, A.E.; Fletcher, J.M.; Vaughn, S.R.; Denton, C.A.; Taylor, P. Anxiety and inattention as predictors of achievement in early elementary school children. Anxiety Stress Coping 2013, 26, 391–410. [Google Scholar] [CrossRef] [PubMed] [Green Version]
  3. Vartak, D.; Jeurissen, D.; Self, M.W.; Roelfsema, P.R. The influence of attention and reward on the learning of stimulus-response associations. Sci. Rep 2017, 7, 9036. [Google Scholar] [CrossRef] [PubMed] [Green Version]
  4. Ahissar, M.; Hochstein, S. Attentional control of early perceptual learning. Proc. Natl. Acad. Sci. USA 1993, 90, 5718–5722. [Google Scholar] [CrossRef] [Green Version]
  5. Jiang, Y.; Chun, M.M. Selective attention modulates implicit learning. Q. J. Exp. Psychol. Sect. A Hum. Exp. Psychol 2001, 54, 1105–1124. [Google Scholar] [CrossRef]
  6. Trabasso, T.; Bower, G. Attention in Learning: Theory and Research; Krieger Publishing Company: Malabar, FL, USA, 1975. [Google Scholar]
  7. Sohlberg, M.M.; Mateer, C.A. Effectiveness of an attention-training program. J. Clin. Exp. Neuropsychol. 1987, 9, 117–130. [Google Scholar] [CrossRef]
  8. Park, N.W.; Ingles, J.L. Effectiveness of attention rehabilitation after an acquired brain injury: A meta-analysis. Neuropsychology 2001, 15, 199–210. [Google Scholar] [CrossRef]
  9. The E-Prime System. Available online: https://pstnet.com/products/e-prime (accessed on 4 July 2022).
  10. Ng, B.D.; Wiemer-Hastings, P. Addiction to the internet and online gaming. Cyberpsychol. Behav. 2005, 8, 110–113. [Google Scholar] [CrossRef] [Green Version]
  11. López, F.; Menez, M.; Hernández-Guzmán, L. Sustained attention during learning activities: An observational study with pre-school children. Early Child Dev. Care 2005, 175, 131–138. [Google Scholar] [CrossRef]
  12. Spira, E.G.; Fischel, J.E. The impact of preschool inattention, hyperactivity, and impulsivity on social and academic development: A review. J. Child Psychol. Psychiatry Allied Discip. 2005, 46, 755–773. [Google Scholar] [CrossRef]
  13. Betts, J.; McKay, J.; Maruff, P.; Anderson, V. The development of sustained attention in children: The effect of age and task load. Child Neuropsychol.: A J. Norm. Abnorm. Dev. Child. Adolesc. 2006, 12, 205–221. [Google Scholar] [CrossRef]
  14. Tang, Y.Y.; Posner, M.I. Attention training and attention state training. Trends Cogn. Sci. 2009, 13, 222–227. [Google Scholar] [CrossRef] [PubMed]
  15. Robb, S.L. Music interventions and group participation skills of preschoolers with visual impairments: Raising questions about music, arousal, and attention. J. Music Ther. 2003, 40, 266–282. [Google Scholar] [CrossRef]
  16. Lim, C.G.; Lee, T.S.; Guan, C.; Fung, S.S.; Zhao, Y.; Teng, S.W.; Zhang, H.; Krishnan, K.R. Effectiveness of a Brain-Computer Interface Based Programme for the Treatment of ADHD: A Pilot Study. Psychopharmacol. Bull. 2010, 43, 73–82. [Google Scholar]
  17. Steiner, N.J.; Sheldrick, R.C.; Gotthelf, D.; Perrin, E.C. Computer-based attention training in the schools for children with attention deficit/hyperactivity disorder: A preliminary trial. Clin Pediatr (Phila) 2011, 50, 615–622. [Google Scholar] [CrossRef]
  18. Papanastasiou, G.; Drigas, A.; Skianis, C.; Lytras, M. Brain computer interface-based applications for training and rehabilitation of students with neurodevelopmental disorders. A literature review. Psychol. Med. Heliyon 2020, 9, e04250. [Google Scholar] [CrossRef] [PubMed]
  19. Lumsden, J.A.; Edwards, E.A.; Lawrence, N.S.; Coyle, D.; Munafò, M.R. Gamification of cognitive assessment and cognitive training: A systematic review of applications and efficacy. JMIR Serious Games 2016, 4, e11. [Google Scholar] [CrossRef] [Green Version]
  20. Green, C.S.; Bavelier, D. Learning, attentional control, and action video 130 games. Curr. Biol. 2012, 22, 197–206. [Google Scholar] [CrossRef] [PubMed] [Green Version]
  21. Green, C.S.; Li, R.; Bavelier, D. Perceptual learning during action video game playing. Top. Cogn. Sci. 2010, 2, 202–216. [Google Scholar] [CrossRef]
  22. Burdea, G.; Coiffet, P. Virtual Reality Technology; Wiley IEEE-Press: London, UK, 2003. [Google Scholar]
  23. Lee, E.; Wong, K.W.; Fung, C.C. How does desktop virtual reality enhance learning outcomes? A structural equation modeling approach. Comput. Educ. 2010, 55, 1424–1442. [Google Scholar] [CrossRef] [Green Version]
  24. Grabowski, A.; Jankowski, J. Virtual reality-based pilot training for underground coal miners. Saf. Sci. 2015, 72, 310–314. Available online: http://www.sciencedirect.com/science/article/pii/S0925753514002276 (accessed on 4 July 2022). [CrossRef]
  25. Wang, Y.; Liu, W.; Meng, X.; Fu, H.; Zhang, D.; Kang, Y.; Feng, R.; Wei, Z.; Zhu, X.; Jiang, G. Development of an immersive virtual reality head-mounted display with high performance. Appl. Opt. 2016, 55, 6969–6977. [Google Scholar] [CrossRef]
  26. Muhanna, M.A. Virtual reality and the CAVE: Taxonomy, interaction challenges and research directions. J. King Saud Univ. Comput. Inf. Sci. 2015, 27, 344–361. [Google Scholar] [CrossRef] [Green Version]
  27. Tarng, W.; Liu, C.L.; Lee, C.Y.; Lin, C.M.; Lu, Y.C. A virtual laboratory for learning fullerene production and nanostructure analysis. Comput. Appl. Eng. Educ. 2018, 27, 472–484. [Google Scholar] [CrossRef]
  28. Ou, K.L.; Liu, Y.H.; Tarng, W. Development of a virtual ecological environment for learning the Taipei Tree Frog. Sustainability 2021, 13, 5911. [Google Scholar] [CrossRef]
  29. Wu, W.L.; Hsu, Y.; Yang, Q.-F.; Chen, J.J. A spherical video-based immersive virtual reality learning system to support landscape architecture students’ learning performance during the COVID-19 Era. Land 2021, 10, 561. [Google Scholar] [CrossRef]
  30. Teo, T.; Norman, M.; Lee, G.A.; Billinghurst, M.; Adcock, M. Exploring interaction techniques for 360 panoramas inside a 3D reconstructed scene for mixed reality remote collaboration. J. Multimodal. User Interfaces 2020, 14, 373–385. [Google Scholar] [CrossRef]
  31. Luo, H.; Li, G.; Feng, Q.; Yang, Y.; Zuo, M. Virtual reality in K-12 and higher education: A systematic review of the literature from 2000 to 2019. J. Comput. Assist. Learn. 2021, 37, 887–901. [Google Scholar] [CrossRef]
  32. Ayman, F.A. Comparing the use of virtual and conventional light microscopy in practical sessions: Virtual reality in Tabuk University. J. Taibah Univ. Med. Sci. 2017, 12, 183–186. [Google Scholar]
  33. Bakas, C.; Mikropoulos, T. Design of virtual environments for the comprehension of planetary phenomena based on students’ ideas. Int. J. Sci. Educ. 2003, 25, 949–967. [Google Scholar] [CrossRef]
  34. Lee, E.A.; Wong, K.W. Learning with desktop virtual reality: Low spatial ability learners are more positively affected. J. Comput. Educ. 2014, 79, 49–58. [Google Scholar] [CrossRef] [Green Version]
  35. Wang, T.-L.; Tseng, Y.-K. The comparative effectiveness of physical, virtual, and virtual-physical manipulatives on third-grade students’ science achievement and conceptual understanding of evaporation and condensation. Int. J. Sci. Math. Educ 2018, 16, 203–219. [Google Scholar] [CrossRef]
  36. Jung, T.; Dieck, M.C.; Lee, H.; Chung, N. Effects of virtual reality and augmented reality on visitor experiences in Museum. In Information and Communication Technologies in Tourism; Springer: Berlin/Heidelberg, Germany, 2016; pp. 621–635. [Google Scholar]
  37. Jiménez, Z.A. Teaching and learning chemistry via augmented and immersive virtual reality. In Technology Integration in Chemistry Education and Research (TICER); American Chemical Society: Washington, DC, USA, 2020; Chapter 3; pp. 31–52. [Google Scholar]
  38. Hubbard, R.; Sipolins, A.; Zhou, L. Enhancing learning through virtual reality and neurofeedback: A first step. In Proceedings of the Seventh International Learning Analytics & Knowledge Conference, Vancouver, BC, Canada, 13–17 March 2017. [Google Scholar]
  39. Loeffler, C.E.; Anderson, T. (Eds.) The Virtual Reality Casebook; Van Nostrand Reinhold: New York, NY, USA, 1994. [Google Scholar]
  40. Carbonell-Carrera, C.; Saorin, J.L. Virtual learning environments to enhance spatial orientation. Eurasia J. Math. Sci. Technol. Educ. 2017, 14, 709–719. [Google Scholar] [CrossRef]
  41. Cho, B.H.; Ku, J.; Jang, D.P.; Kim, S.; Lee, Y.H.; Kim, I.Y.; Lee, J.H.; Kim, S.I. The effect of virtual reality cognitive training for attention enhancement. CyberPsychology Behav. 2002, 5, 129–137. [Google Scholar] [CrossRef]
  42. Mei, C.; Zahed, B.T.; Mason, L.L.; Quarles, J. Towards Joint Attention Training for Children with ASD—A VR Game Approach and Eye Gaze Exploration. In Proceedings of the 2018 IEEE Conference on Virtual Reality and 3D User Interfaces (VR), Tuebingen/Reutlingen, Germany, 18–22 March 2018; pp. 289–296. [Google Scholar]
  43. Sweller, J. Cognitive load during problem solving: Effects on learning. Cogn. Sci. 1988, 12, 257–285. [Google Scholar] [CrossRef]
  44. Attention Process Training III Demo. 2011. Available online: https://www.youtube.com/watch?v=bRRM4yhqRiI (accessed on 4 July 2022).
  45. Lin, H.Y.; Hsieh, H.C.; Lee, P.; Hong, F.Y.; Chang, W.D.; Liu, K.C. Auditory and visual attention performance in children with ADHD: The attentional deficiency of ADHD is Modality Specific. J. Atten. Disord. 2021, 21, 856–864. [Google Scholar] [CrossRef]
Figure 1. Designing the VR training system using Unity3D.
Systems 10 00104 g001
Figure 2. Playing the “Electrical Maze” game for attention training: (a) clicking on the target number; (b) moving along the path without touching the border.
Systems 10 00104 g002
Figure 3. Playing the “Matching Shape or Color” game for attention training: (a) matching the shape of the small object; (b) matching the color of the small object.
Systems 10 00104 g003
Figure 4. Independent variable, dependent variables, and controlled variables in the experiment.
Systems 10 00104 g004
Figure 5. Flowchart of the attention training experiment for both groups.
Systems 10 00104 g005
Figure 6. Students performing attention training with the VR games.
Systems 10 00104 g006
Table 1. Attention training and achievement tests for both groups.
GroupPre-TestTrainingPost-Test
Experimental groupO1X1O3
Control groupO2X2O4
Table 2. Training questions of the APT tool for each type of attention.
AttentionTrainingDescription
Focused attentionAboveClick the left mouse button if the meaning of the word matches the position (e.g., “Above” is above the line). Click the right mouse button if the meaning of the word does not match the position (e.g., “Above” is below the line).
Sustained attention9Click the left mouse button if the number on the screen is a multiple of 3, but do not respond if it is not a multiple of 3.
Selective attention Systems 10 00104 i001If the black inequality in the middle is correct, click the left mouse button. If the inequality is incorrect, no response is needed. Please ignore the numbers in other colors and blocks.
Alternating attention Systems 10 00104 i002Click the left mouse button if the meaning of the word matches the outline font (e.g., “Hollow” for hollow fonts). Do not respond if the meaning of the word does not match the outline font (e.g., “Solid” for hollow fonts). Click the left mouse button if you see the wrong outline font, and do not respond when it is correct.
Divided attention5 17 14At the beginning, you will hear and see a series of numbers. When the numbers disappear, read the series of numbers backwards and click the left mouse button when you are done.
Table 3. Training tasks of the VR games for different types of attention.
VR GamesAttentionDescription
Electrical MazeSustained attentionTrainees were required to maintain their attention to avoid touching the border within a period of time.
Selective attentionWhen encountering distractors, trainees need to stay undisturbed and choose the correct objects.
Divided attentionTrainees need to move forward without touching the border and click on the numbers they see.
Matching Shape or ColorFocused attentionUnder time pressure, the trainee has to determine the color or shape of the object immediately.
Selective attentionTrainees should choose the target object without being disturbed by the color or shape of other objects.
Alternating attentionTrainees are required to alternate between matching color or shape when selecting the target object.
Table 4. Test items of the attention scale for elementary school children.
AttentionTest ItemDescription
Focused attentionNumber guided testThe numbers from one to nine are arranged randomly and the subject must circle as many target numbers as possible within one minute.
Text-oriented testThe text is randomly arranged and the subject has to delete as much of the target text as possible within one minute.
Sustained attentionPetal contrast testA flower with two layers of petals is placed on the screen. The subject must remove as many flowers with different petals as possible within five minutes.
Digital circle testThe numbers from one to nine are arranged randomly and the subject must circle the numbers smaller than the previous number within five minutes.
Selective attentionMap search testThe background is a subway map, and the paths and stations on the map are used as distractors. The subject has to circle as many target objects as possible within one minute without being disturbed by the distractors.
Symbol detection testOverlaying different shades of note symbols as distractors, the subject must circle as many target symbols as possible within one minute without being distracted by the shallower note symbols.
Alternating attentionAlternating symbols testTwo simple shapes are randomly arranged, and the subject must alternate circling the specific shape as many times as possible within one minute.
Alternate number testGiven two single-digit numbers randomly arranged, the subject must alternate circling as many specific numbers as possible within one minute.
Divided attentionCircle combined with monophonic testThe test is combined with auditory stimulation. In addition to the digital circle test, the subject must listen for the presence of a specific single tone and check the box on the test sheet immediately when a single tone is heard. The score of the digital circle test will be deducted from the score of the single-tone error.
Contrast combined with monophonic testThe subject must listen for the presence of a specific single tone and check the box on the test sheet immediately when a single tone is heard. The petal contrast test score will be deducted from the single-tone check mark score.
Table 5. Descriptive statistics of the training effectiveness for both groups.
GroupTestSamplesMeanS.D.S.E.
Experimental groupPre-test34100.0883.40819.877
Post-test34125.3233.97023.151
Control groupPre-test32107.6563.23818.320
Post-test32117.5623.40919.288
Table 6. Results of paired sample t-test on attention training for both groups.
GroupMeanS.D.TD.F.p
Experimental group−25.23512.002−12.259330.000 ***
Control group−9.9069.198−6.092310.000 ***
*** p < 0.001.
Table 7. Results of the intra-group homogeneity test for both groups.
ResourceS.S.D.F.M.S.Fp
group*pre26.564126.5640.2250.637
error7322.99162118.113
Table 8. ANCOVA results on training effectiveness for the two groups.
ResourceS.S.D.F.M.S.Fp
group3599.27213599.27230.8530.000 ***
error7349.55563116.660
*** p < 0.001.
Table 9. Descriptive statistics of focused attention for both groups.
GroupTestSamplesMeanS.D.S.E.
Experimental groupPre-test3419.0295.5780.956
Post-test3424.4705.2870.906
Control groupPre-test3219.6254.4770.791
Post-test3220.2814.9130.868
Table 10. Results of paired sample t-test of focused attention for both groups.
GroupTD.F.p
Experimental group−5.975330.000 ***
Control group−0.948310.350
*** p < 0.001.
Table 11. Results of the intra-group homogeneity test for both groups.
ResourceS.S.D.F.M.S.Fp
group*pre19.372119.3721.0960.299
error1096.1036217.679
Table 12. ANCOVA results of focused attention for the two groups.
ResourceS.S.D.F.M.S.Fp
group337.8421337.84219.0810.000 ***
error1115.4756317.706
*** p < 0.001.
Table 13. Descriptive statistics of sustained attention for both groups.
GroupTestSamplesMeanS.D.S.E.
Experimental groupPre-test3418.5885.2400.898
Post-test3425.0886.6751.144
Control groupPre-test3220.5314.5930.811
Post-test3224.2815.7141.010
Table 14. Results of paired sample t-test sustained attention for both groups.
GroupTD.F.p
Experimental group−8.157330.000 ***
Control group−5.847310.000 ***
*** p < 0.001.
Table 15. Results of the intra-group homogeneity test for both groups.
ResourceS.S.D.F.M.S.Fp
group*pre0.72910.7290.0410.841
error1113.5216217.960
Table 16. ANCOVA results of sustained attention for the two groups.
ResourceS.S.D.F.M.S.Fp
group109.4021109.4026.1860.016 *
error1114.2506317.687
* p < 0.05.
Table 17. Descriptive statistics of selective attention for both groups.
GroupTestSamplesMeanS.D.S.E.
Experimental groupPre-test3424.9705.3960.925
Post-test3430.1765.4740.938
Control groupPre-test3227.1874.2680.754
Post-test3228.5004.6900.829
Table 18. Results of paired sample t-test of selective attention for both groups.
GroupTD.F.p
Experimental group−8.170330.000 ***
Control group−2.075310.046
*** p < 0.001.
Table 19. Results of the intra-group homogeneity test for both groups.
ResourceS.S.D.F.M.S.Fp
group*pre0.22510.2250.0180.893
error770.2336212.423
Table 20. ANCOVA results of selective attention for the two groups.
ResourceS.S.D.F.M.S.Fp
group178.7851178.78514.6190.000 ***
error770.4586312.229
*** p < 0.001.
Table 21. Descriptive statistics of alternating attention for both groups.
GroupTestSamplesMeanS.D.S.E.
Experimental groupPre-test3418.4415.9501.020
Post-test3423.1175.6280.965
Control groupPre-test3218.9375.0410.891
Post-test3221.0624.4490.786
Table 22. Results of paired sample t-test of alternating attention for both groups.
GroupTD.F.p
Experimental group−6.036330.000 ***
Control group−2.835310.008 **
** p < 0.01, *** p < 0.001.
Table 23. Results of the intra-group homogeneity test for both groups.
ResourceS.S.D.F.M.S.Fp
group*pre7.17217.1720.4800.491
error925.4766214.927
Table 24. ANCOVA results of alternating attention for the two groups.
ResourceS.S.D.F.M.S.Fp
group91.442191.4426.1770.016 *
error932.6486314.804
* p < 0.05.
Table 25. Descriptive statistics of divided attention for both groups.
GroupTestSamplesMeanS.D.S.E.
Experimental groupPre-test3419.0584.7280.810
Post-test3422.7646.1741.058
Control groupPre-test3221.0625.7131.009
Post-test3223.1565.5240.976
Table 26. Results of paired sample t-test of divided attention for both groups.
GroupTD.F.p
Experimental group−6.183330.000 ***
Control group−3.895310.001 **
** p < 0.01, *** p < 0.001.
Table 27. Results of the intra-group homogeneity test for both groups.
ResourceS.S.D.F.M.S.Fp
group*pre27.426127.4262.5980.112
error654.4886210.556
Table 28. ANCOVA results of divided attention for the two groups.
ResourceS.S.D.F.M.S.Fp
group34.673134.6733.2040.078
error681.8746310.823
Table 29. Results of one-sample t-test on cognitive load for both groups.
GroupSamples MeanS.D.Tp
Experimental group3312.3937.097−2.0790.042 *
Control group3216.0006.876
* p < 0.05.
Table 30. Questionnaire results on cognitive load for both groups.
QuestionsExperimental GroupControl GroupTp
MeanS.D.MeanS.D.
  • Difficulty of attention training content.
4.0002.7504.3432.088−0.5660.573
2.
Effort level of attention training content.
3.1812.4554.1562.424−1.6100.112
3.
Concentration level of attention training.
2.4241.6772.9062.100−1.0420.310
4.
Stress level of attention training.
3.0602.4484.5933.014−2.2540.028 *
* p < 0.05.
Table 31. Results of one-sample t-test on learning anxiety for the two groups.
GroupSamples MeanS.D.Tp
Experimental Group3320.33336.03462−3.3290.001 **
Control Group3225.757.05737
** p < 0.01.
Table 32. Questionnaire results of learning anxiety for both groups.
QuestionsExperimental GroupControl GroupTp
MeanS.D.MeanS.D.
  • I will not be able to sleep because I have to do the attention training tomorrow.
2.0001.0301.8431.1940.5650.574
2.
I often feel nervous during attention training.
2.6061.5603.4681.294−2.4220.018 *
3.
I can’t relax after doing attention training.
2.1511.2772.2811.142−0.4310.668
4.
I hate to do attention training.
1.7871.1922.0001.244−0.7020.485
5.
I want to do attention training every day. (inverse)
2.1211.3173.3431.515−3.4740.000 ***
6.
I feel relaxed and happy during attention training. (inverse)
2.4841.4812.9681.121−1.4810.143
7.
I often feel my heart beat faster during attention training.
2.7871.4082.9371.412−0.4270.670
8.
I like to do attention training. (inverse)
1.6360.8952.6251.338−3.5110.000 ***
9.
I feel bored during attention training.
1.6660.9571.9061.117−0.9290.356
10.
I find the content of attention training interesting. (inverse)
1.5450.8692.4371.543−2.8820.005 **
* p < 0.05, ** p < 0.01, *** p < 0.001.
Publisher’s Note: MDPI stays neutral with regard to jurisdictional claims in published maps and institutional affiliations.

