Article

A Study of Factors Influencing the Continuance Intention to the Usage of Augmented Reality in Museums

1
School of Design, Jiangnan University, Wuxi 214122, China
2
College of Management, Shih Chien University, Taipei 10478, China
3
Department of Culture and Arts Management, Honam University, Gwangju 62399, Korea
*
Author to whom correspondence should be addressed.
Systems 2022, 10(3), 73; https://doi.org/10.3390/systems10030073
Submission received: 2 May 2022 / Revised: 28 May 2022 / Accepted: 30 May 2022 / Published: 1 June 2022
(This article belongs to the Special Issue Extended Reality Application and Management Systems)

Abstract

:
Augmented reality (AR) technology has rapidly developed in recent years. This technology is widely used in various fields, including museum exhibitions, where people use it to experience art in a new way. While AR aims to realize the interaction between the virtual world and the real world, museums use AR to develop new digital artwork from artifacts. When text descriptions are no longer attractive to the audience, museums need to add more sound effects to images and video dynamics to develop a sustainable way for the industry’s future. For the continued use of such technology and the better development of the museum industry, this study used a structural equation model to explore the influences on the continuance intention of museum AR technology through experiments and questionnaires. Furthermore, it established a model with six dimensions: interaction quality, information quality, information richness, satisfaction, perceived playfulness, and continuance intention. Moreover, the results of this study can serve as a reference for managers to promote the extensive application of AR technology in museum construction, thereby providing visitors with better experiences and satisfying their needs.

1. Introduction

Information dissemination has changed owing to the development of information technology [1], with digital media information gradually replacing traditional printed materials. Currently, there is a prominent trend where museums are changing visiting experiences from traditional guided tours to innovative visits supported by virtual technology and exhibiting their collections in the form of digital arts [2,3,4]. Such virtual technologies are collectively known as Extended Reality (XR). Virtual reality (VR), augmented reality (AR), and mixed reality (MR) all belong to the XR technology category. XR technologies immerse users through visual, audio, and potentially olfactory and haptic touch cues [5]. VR can create a virtual scene from the perspective of the first person, so that users can perceive interactive behavior in the virtual environment [6]. However, AR can enable users to perceive virtual objects in a real environment [7]. MR combines the advantages of VR to make users feel that the interactive experience of MR is more realistic [5]. In other words, MR can create interactive visualization environments in which life-like 3D virtual design objects are displayed in the real world [8].
VR and MR technologies provide 3D virtual simulations, which are better representations of construction information and built environments than traditional two-dimensional (2D) media [9]. Users can interact with virtual objects and environments, enabling them to experience the built environment better and comprehend information [9,10]. VR has been successfully employed in various fields, including engineering, medicine, mental health, design, architecture, construction, education and training, arts, entertainment, business, communication, marketing, military, and travel [5]. At present, the application of VR in the field of education is still in the exploratory stage, but more learning modes in museums or at other tourist attractions should be implemented in the future [11]. On the other hand, AR is a new digital visualization technology that is not only recognized by scholars in education [12,13,14], but also valued and used in tourism, cultural heritage, and experiencing museums [15,16,17].
Recently, this technology has been considered an innovative guiding tool that can improve visitors’ experiences in museums [18] because of its unique ability to superimpose virtual information on physical objects and real environments [19]. In addition, it can bring real-world objects into virtual environments and vice versa [20]. Furthermore, scholars have suggested that AR’s unique functions and visual interactivity can be an alternative to traditional text guides, even attracting new audiences [21]. Hassan and Ramkissoon [22] mentioned in their research that AR devices can attract different visitor groups. Meanwhile, the Franklin Institute in Philadelphia used AR to present soldiers and their weapons to visitors to the Terracotta Warriors exhibit. On the other hand, Ding [23] designed and developed AR devices in his study that allowed for interactive entertainment between visitors and museums to improve visitors’ learning experiences. Ryffel et al. designed an AR system that attracts users to interact with it by manipulating the colors of paintings [24].
It was found in studies ranging from cultural heritage to museums that virtual technology can help visitors interact with museum collections in the real environment. More importantly, the application of AR can help the public fully understand a large amount of information on famous collections without additional information provided by museums [25,26,27]. It has been mentioned in two pieces of research that interactive behaviors combining experiential learning with innovative entertainment activities, other unusual narrative modes, and immersive experiences can improve the exhibition value of museums [17,28]. Other scholars have assessed the actual experiences of AR in museums from the perspective of user experience and behavior, including the fact that the adoption of AR devices in museums can improve visitors’ user experience [27,29], a study of users’ satisfaction with AR, their intention to recommend AR applications [30,31,32], and a study of users’ satisfaction with AR devices and their behavioral intentions [33,34,35].
Although scholars have explored how to better design interactive AR devices for museums [36] to improve visitors’ experiences [15], this study suggests that understanding the information of artifacts in museums through AR devices is significant for interactive experiences and the continuance intention of users. Therefore, by establishing and studying the hypothesis model, this study further verifies how the interaction quality between users and AR devices affects user satisfaction and perceived playfulness, especially users’ continuance intention, in terms of information quality (including dynamic visual effects and dynamic audio prompts) and information richness (including dynamic visual content).
Based on the above discussion, we carried out the following research process. Firstly, the research dimensions are established in consideration of the literature, and the research hypotheses are proposed in Section 2. In Section 3, the questionnaire is designed based on references. Then, the respondents were recruited to visit the museum exhibits with AR equipment, and data were collected. The data from the questionnaire in Section 3 are analyzed in Section 4, and the research hypotheses are verified in Section 5. Finally, Section 6 summarizes the research results and discussion, and puts forward future research and suggestions.

2. Literature Review and Hypotheses Development

2.1. Satisfaction and Continuance Intention

Satisfaction is a key factor in measuring the success and effectiveness of an information system [37]. The operational definition refers to the degree to which people believe that a certain experience can evoke positive emotions. In particular, the success of a museum depends on visitors’ needs, and satisfaction is a key factor [38]. It has also been pointed out that visitors’ satisfaction is affected by the service quality of museums, technical aspects (such as touch screens, audio guides, and visual media), and overall visiting experiences [39]. Hence, using an AR guide system not only receives visitors’ positive responses and acceptance [40], but also makes them feel satisfied with AR devices [41]. Previous scholars have pointed out that visitor satisfaction has a strong impact on individuals’ behavioral willingness to recommend AR applications [30] and has positive effects on usage intention [33]. Therefore, this study proposes the following hypothesis:
Hypothesis 1 (H1).
Satisfaction has positive effects on continuance intention.

2.2. Perceived Playfulness and Continuance Intention

Moon and Kim [42] found in their study that perceived playfulness is a key factor affecting behavioral intentions. Roca and Gagné [43] mention that perceived playfulness has positive effects on learners’ continuous use of e-learning systems. In addition, visitors indicated that using AR applications to admire paintings makes the whole experience more personal, attractive, and interesting. In fact, visitors using AR applications spend more time admiring paintings [17]. Therefore, this study proposes the following hypothesis:
Hypothesis 2 (H2).
Perceived playfulness has positive effects on continuance intention.

2.3. Information Quality and Information Richness

AR can perfectly present various museum collections, such as painting guides [23,44], narrative interactions, stories behind statues [45], and learning experiences of historical artifacts [46]. Research on art museums mentions that AR applications could provide more information on paintings, through which visitors can have a deeper understanding of the rich information on paintings [17]. Compared to traditional guides, AR applications satisfy visitors with rich information and better information quality. For instance, visitors with AR guides are more focused and involved in the paintings and artworks of museums than visitors with audio guides or no guides. In addition, their learning efficiency and flow experience were found to improve [40]. However, some studies mention that the visual effects of museum collections designed by AR may not necessarily bring better interaction experiences to visitors who pay more attention to information [15]. Additionally, visitors expressed that AR devices should bring more information quality and pleasant interactive learning experiences. Therefore, this study proposes the following hypothesis:
Hypothesis 3 (H3).
Information quality has positive effects on satisfaction.
Hypothesis 4 (H4).
Information quality has positive effects on perceived playfulness.
Hypothesis 5 (H5).
Information richness has positive effects on information quality.
Hypothesis 6 (H6).
Information richness has positive effects on perceived playfulness.

2.4. Interaction Quality

AR technology can be used with digital projection in museums to attract visitors, enhance their interests, and provide them with opportunities to engage in usability and usefulness [47]. In web-based interactive guided tours, visitors need to use AR devices to scan the QR codes of corresponding pictures to learn about the architectural information of the World Cultural Heritage site [48]. Research on museums with interactive guides mentions that visitors could use AR devices to scan QR codes where museum collections are presented to perform human–computer interactions (3D models can be zoomed in, zoomed out, and rotated) [41,46]. The interaction quality of AR mobile applications can effectively help users to explore historical relics, and the diversified information of text images can enhance the interaction quality and information richness. Therefore, this study proposes the following hypothesis:
Hypothesis 7 (H7).
Interaction quality has positive effects on information quality.
Hypothesis 8 (H8).
Interaction quality has positive effects on information richness.
Based on the above, we confirmed eight relevant hypotheses with six dimensions: interaction quality, information quality, information richness, satisfaction, perceived playfulness, and continuance intention. The hypothesized model is shown in Figure 1.

3. Research Design and Method

3.1. Experiment and Questionnaire Design

This study used a handheld AR device developed by a Chinese company, as shown in Figure 2. By focusing its camera on images or exhibits, this device can present predesigned AR effects, including animation, audio explanation, and text information. This study arranged an empty room at the host university (see Appendix A) to simulate the museum environment. Participants with museum visiting experiences were recruited through online recruitment from June to November 2021. They were required to experience this mock museum for over fifteen minutes with only the knowledge of tool introduction and no expiation of other parts. Subsequently, they were asked to complete the questionnaire anonymously. Item setting and optimization of the measurement indicators used in this study were carried out according to the questionnaire items in existing references (see Table 1). All items were measured on a 7-point Likert scale (1 = Strongly disagree, 7 = Strongly agree).

3.2. Data Collection

The descriptive statistics are shown in Table 2. A total of 203 subjects participated in this study (no invalid questionnaires), and the sample size was ten times the number of analyzed items (18), meeting the SEM’s requirements for sample size. Among the enrolled subjects, males accounted for 32.02% and females accounted for a higher proportion (67.98%), which is close to the subject ratio of Pallud’s research on museum learning stimulated by interactive technology [59].
The data from the 2020 Chinese Museums Market Analysis Report-Industry Competition Landscape and Future Business Opportunities Analysis reported that the audience of Chinese museums in 2019 was dominated by females. The age of subjects was concentrated mainly in the range of 18 to 34 years, accounting for 84.23% of all subjects, consistent with the survey data of the Research Center of Cheetah Mobile on museum visitors. This survey pointed out that visitors were mainly students, accounting for a higher proportion of the population (51.72%) in this study. Therefore, the subjects of this study were representative.

4. Data Analysis

4.1. Reliability Test

Reliability refers to the degree of consistency or stability of a scale’s measurement results. SPSS software was used to calculate Cronbach’s α for each measurement variable. The results of the variable measurements were higher than 0.6. Cronbach’s α values for all dimensions were not significantly higher than the current results after deleting a random item. Thus, this finding indicates that the item should not be deleted, and that the scale used in this study has good reliability, as shown in Table 3.

4.2. Factor Analysis

SPSS software was used to test the construct validity and factor analyses to analyze the 18 items, and the varimax rotation method was used for the factor analyses, the results are shown in Table 4 and Table 5. Table 4 shows that the cumulative percentage of the variance is 68.803%, indicating that the six extracted factors can extract 68.803% of the information of 18 items, and the percentage of the variance (the amount of information extracted) of the six factors is 14.331%, 14.082%, 12.988%, 10.484%, 8.791%, and 8.127%, respectively. The amount of information extracted was evenly distributed, which comprehensively showed that the results of this factor analysis were satisfactory. In addition, the six factors extracted by the factor analyses corresponded to the six dimensions set by this study, indicating that the questionnaire had good structural validity, and that further analyses could be carried out.

4.3. Confirmatory Factor Analysis

AMOS software was used to analyze the convergent and discriminant validity of the scale, as shown in Table 6. The factor loading of each item corresponding to all measurement variables was greater than 0.6, and the average variance extracted (AVE) value of each variable was greater than 0.36, indicating the scale’s good convergent validity. Furthermore, the square root of the AVE value of each variable (values on the diagonal) is greater than the correlation coefficients between this variable and other variables, indicating the scale has good discriminant validity, as shown in Table 7.

4.4. Model Tests

The AMOS software was used to verify the relationships between each variable and test the hypotheses of the model. As shown in Table 8, the test results of the model fit measures, namely χ²/df, RMSEA, CFI, NNFI, TLI, IFI, and SRMR, are all within the ideal range, indicating that the hypothesis model established in this study has a good fit. The path analysis results shown in Table 9 and Figure 3 indicate that seven of the eight hypotheses in this study were supported. However, H6 was not supported, indicating that the effects of information richness on perceived playfulness were not significant.

5. Discussion

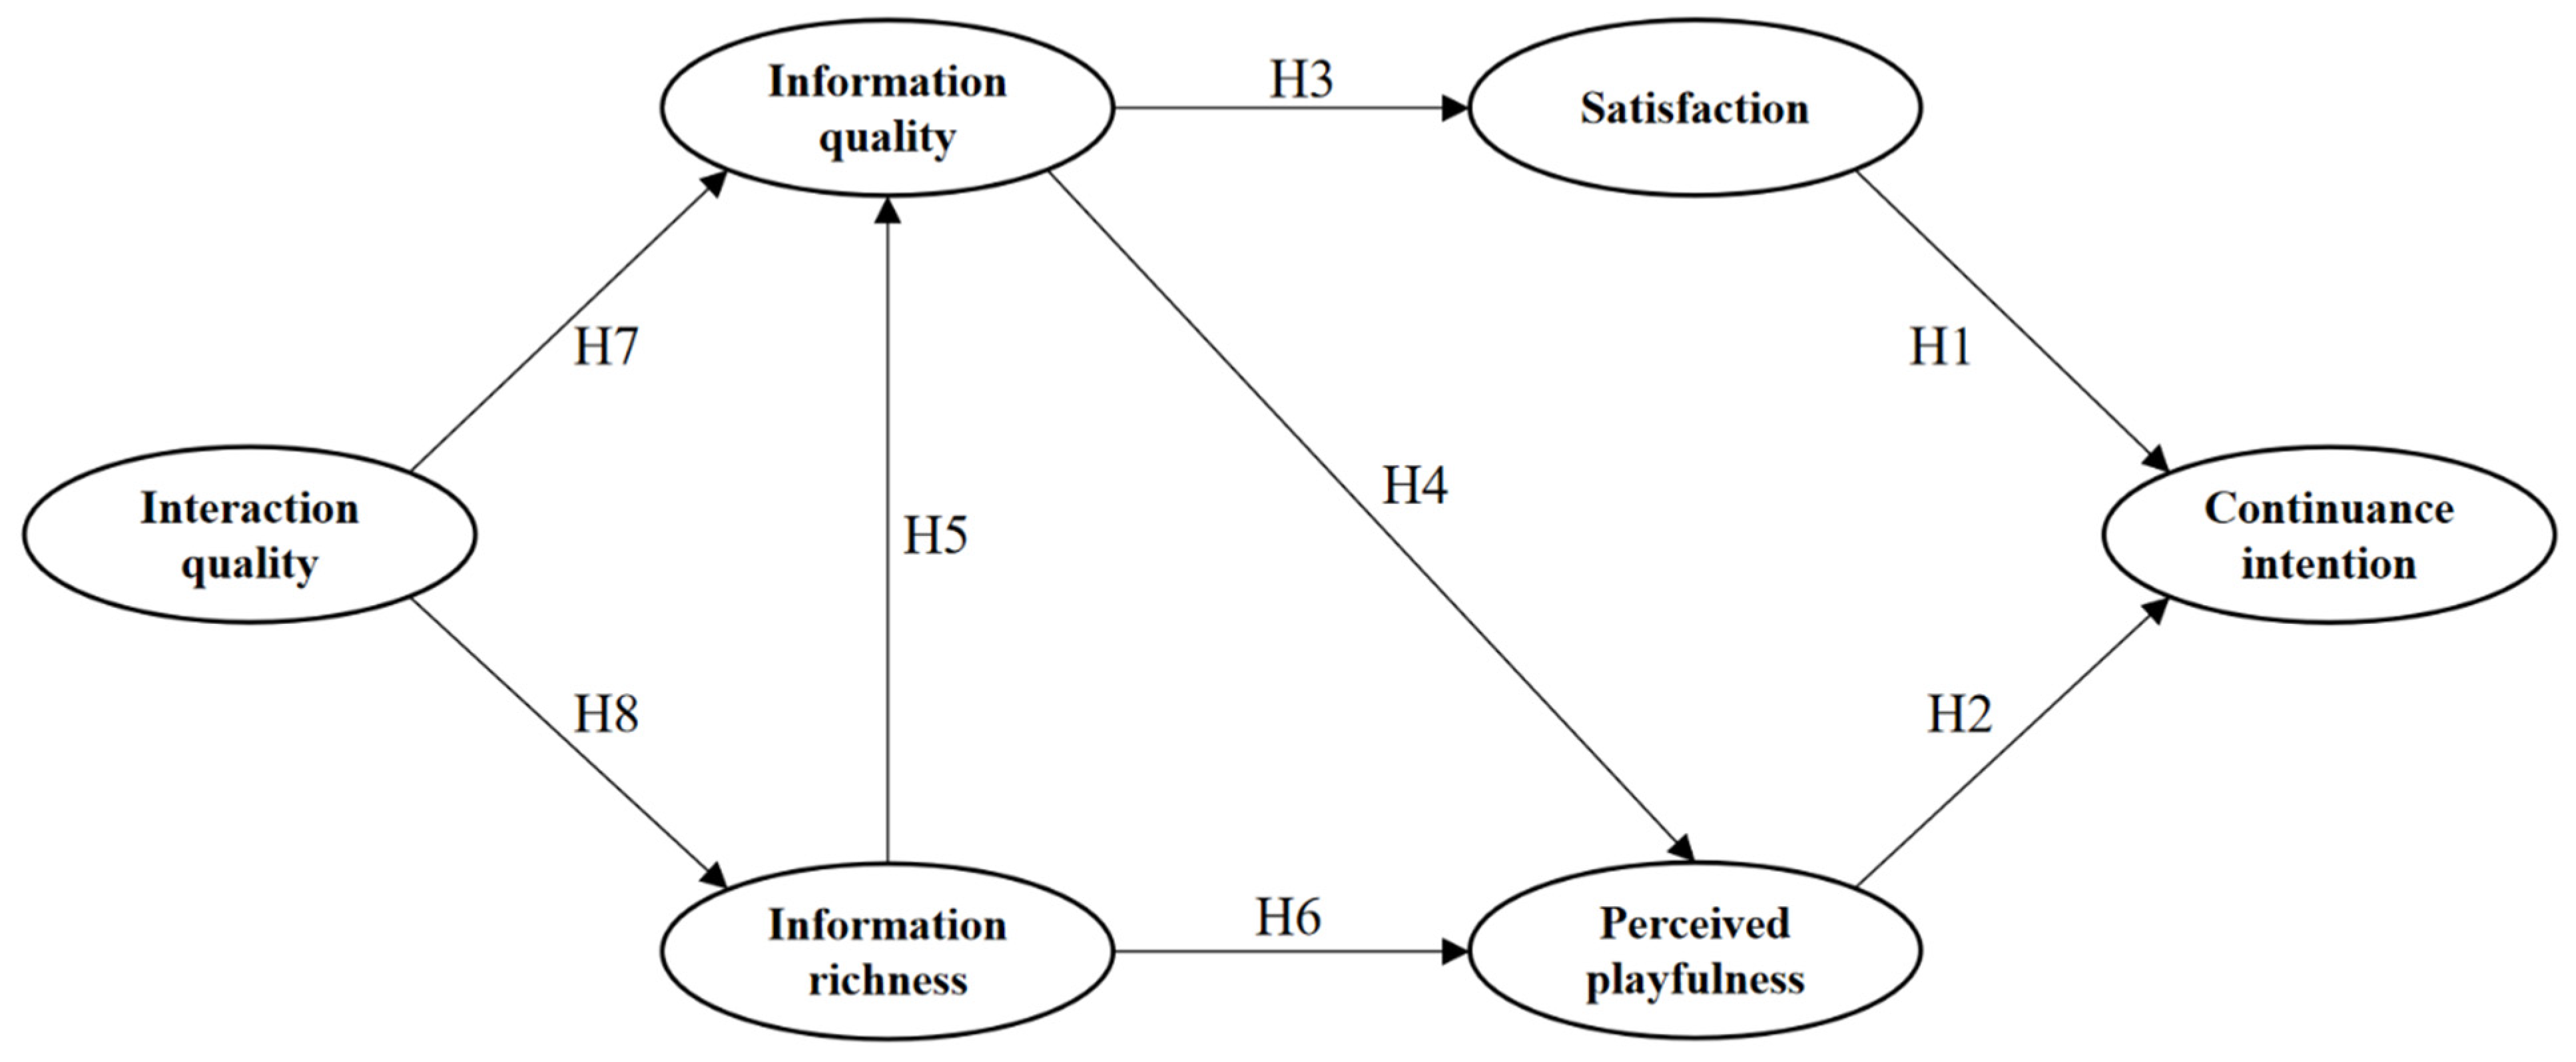
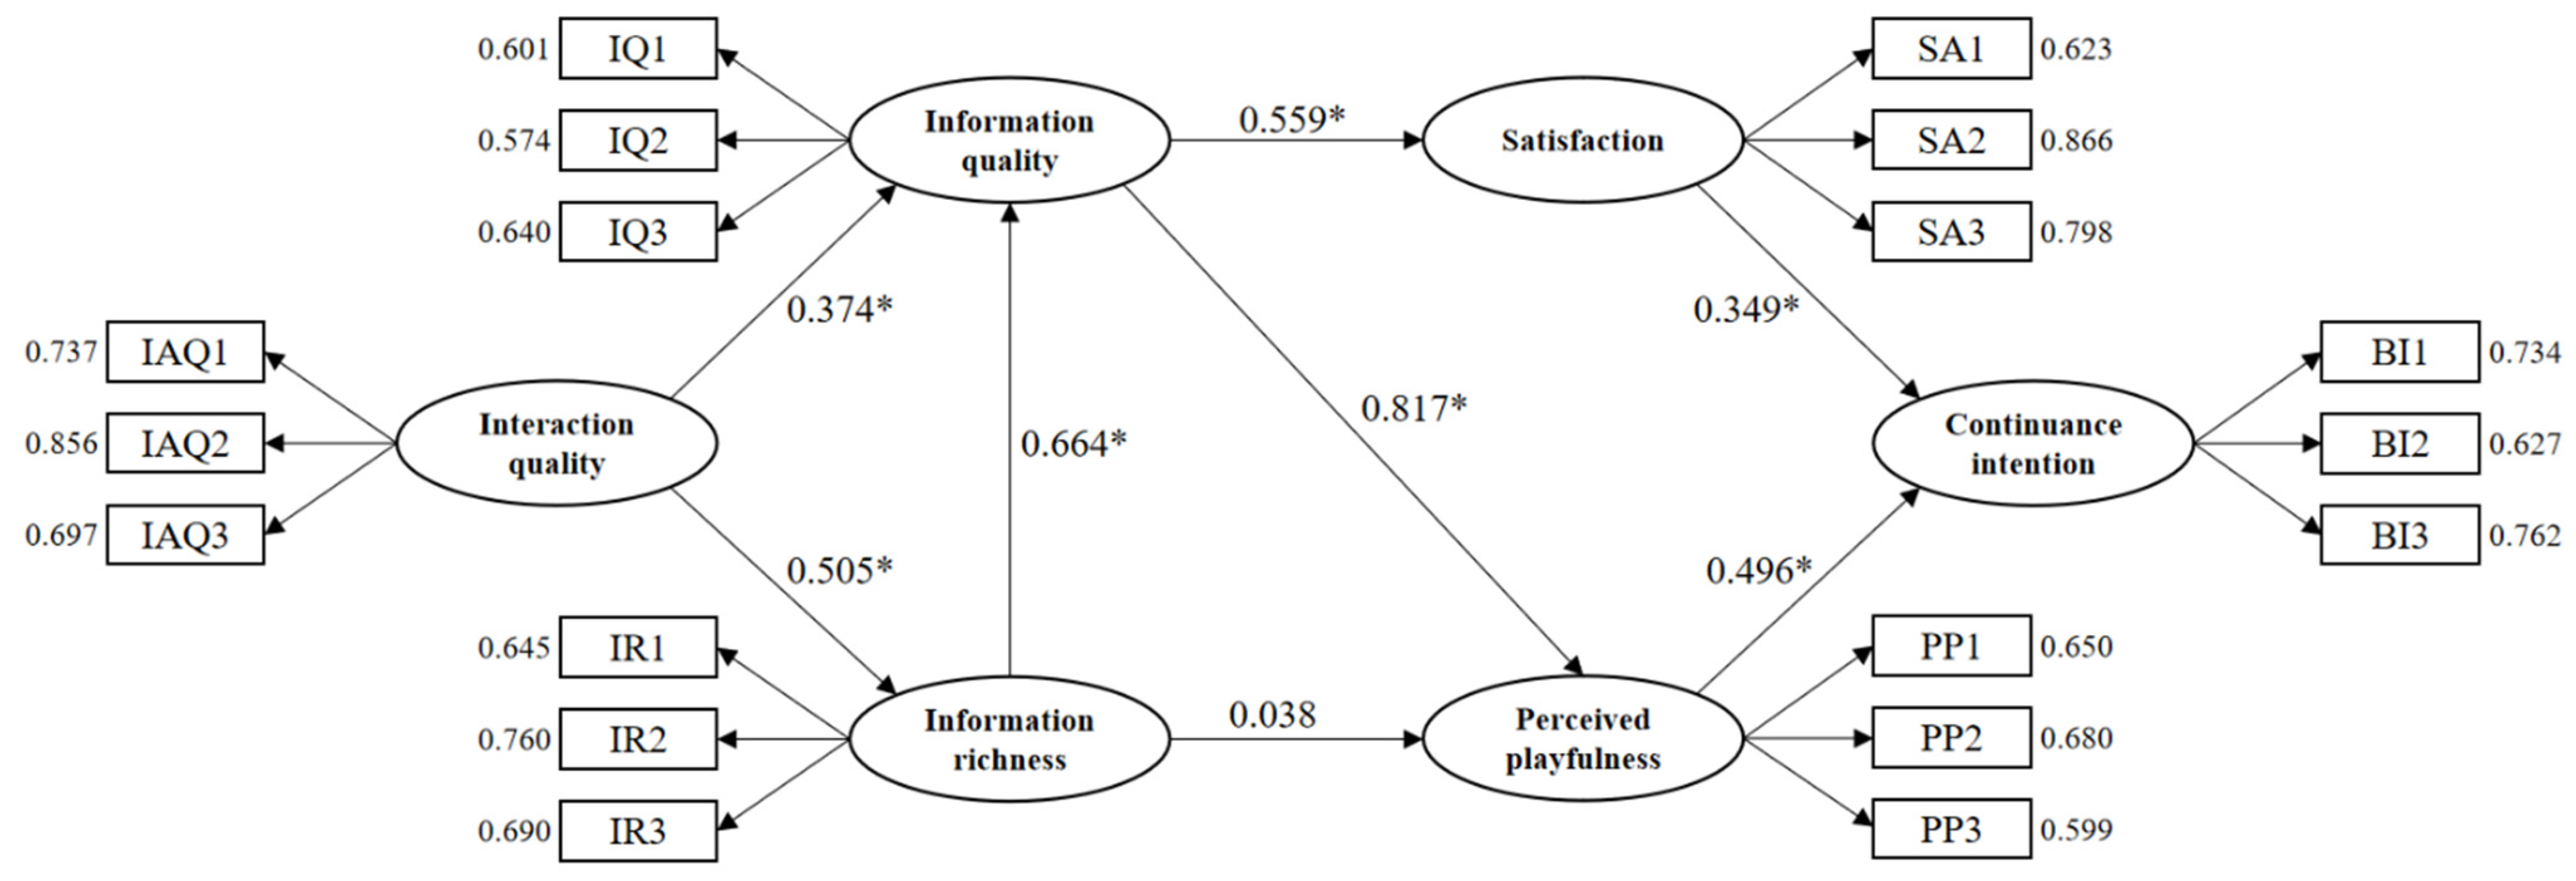
The results indicate that satisfaction and perceived playfulness have significant and positive effects on continuance intention (H1 and H2 are supported), among which playfulness plays a greater role, indicating that visitors have a strong sense of freshness and curiosity toward the AR experience during museum visits, and that they are more likely to give a positive evaluation of the information provided by this system. The pleasure generated when using AR can effectively improve hedonic needs and further increase continuance intentions. In addition, the higher the users’ information satisfaction with AR, the more likely they are to believe that AR experiences can give them more benefits during museum visits, enhancing their willingness to continue using the technology. The establishment of the hypothesis of this study is consistent with scholars’ research that satisfaction affects the behavioral intention of visitors using AR [33].
Second, information quality has positive effects on satisfaction and perceived playfulness (H3 and H4 are supported), among which perceived playfulness plays a greater role. Evidently, information quality reflects the value of users’ needs. For instance, scholars mention that the users appreciated more audio-visual augmentations than the ones based on the use of text only; the AR function can enrich visitors’ visual sense and emotional participation [60]. Thus, high-level information quality (e.g., efficient, accurate, real, and available) output by AR can provide users with convenient use and promote knowledge understanding, thereby increasing experience satisfaction in museum visits. In addition, an audience using AR can have a richer and more interesting experience, dramatically enhancing their psychological expectations by admiring artifacts from diverse angles, breaking the one-way understanding of the text, and inspiring more intuitive historical imaginations. This result proves that information quality presented by high-tech means plays an important role in the enhancement of perceived playfulness.
Moreover, although information richness had positive effects on information quality (H5 was supported), its effect on perceived playfulness was not significant (H6 was not supported). Presenting artifacts through various channels of the AR technology may have resulted in transmitting information in a way that led to misunderstanding, making the visitors feel anxious, and creating a sense of loss of control when using AR. Consequently, the playfulness experience is affected.
Furthermore, interaction quality has positive effects on information quality and richness (H7 and H8 are supported). Given AR’s unique feature of AR in superimposing such graphics over real-world objects, visitors can interact with museum culture through AR devices [41,46]. These findings highlight the importance of generating stimulating and interactive museum experiences [61]. The results show that AR technology can provide visitors with more opportunities for interaction or contact with cultural relics through diversified services during museum visits, thereby enhancing information richness. It can also help visitors obtain feedback that is highly related to their knowledge needs during use, which creates positive effects on their perception of information quality.

6. Conclusions and Future Research

It can be concluded from the results of this study that AR technology, like other technologies, has no internal value, carries information, and conveys developers’ intentions. The results on museum satisfaction indicate that the finding that visitors considered the interaction quality of AR to be closely related to information quality and satisfaction was based on the overall visiting experiences of visitors (interpretation of collections and interactive plots). Nevertheless, collections presented in the form of digital art by AR allow visitors to better understand and perceive artifact information. It also confirms the importance of visitors’ interactive experience provided by AR technology in museums, which helps visitors express their emotions about museum exhibits.
The extensive and in-depth research on the interaction quality of AR, the presentation of system information, and the relationship between user satisfaction and perceived playfulness provides important insights for museum staff, system developers, and managers, as follows: (1) The effective means to meet users’ psychological expectations in actual use is improving the interactive quality of AR, absorbing advanced information technology, continuously improving use functions, and designing a personalized experience environment and a technology system with better interaction; (2) The diversified presentation of artifacts should consider playfulness, as it is an influencing factor that cannot be ignored in improving users’ continuance intention. In actual construction, advanced technologies such as big data and artificial intelligence should be used reasonably, and interactive factors such as human–computer interaction and interpersonal interaction should be added to increase the playfulness of the system.
Although this study promotes the interactive experience of museum artifacts through visitors’ use of AR devices and analyzes the factors that influence the intention of continuous use, there are still some limitations that need to be considered in future studies. As for future research, first, it is necessary to start with immersive XR technology (VR/MR/AR), in addition to discussing the factors influencing visitors’ continuous use of AR devices. After understanding the situation of the target museum, it is necessary to consider the technology that can truly achieve an immersive visiting experience. For example, scholars have questioned whether MR substitutes or integrates cultural experience, preserving the authenticity and sense of a place [28]. Second, considering the user’s convenience, is it more important to develop museum AR applications based on smartphones than hand-held AR devices or even wearable AR smart devices specially provided by museums? This satisfies the needs of visitors but raises a question, for example, what is the meaning of physical museums? Can digital technology really take its position? This question is worth considering. In addition, will the difference in AR equipment between planar and three-dimensional exhibits in museums affect visitors’ continuous use of AR equipment? Finally, comparative studies of different age groups are also of great importance, such as samples of children using AR devices to learn about museums, to allow developers and researchers to configure AR applications that are capable of effectively facilitating experiential learning for school children of all ages in museums.

Author Contributions

Conceptualization, Q.J. and C.G.; methodology, Q.J. and J.C.; formal analysis, Q.J.; investigation, J.C.; data curation, Y.W.; writing—original draft preparation, Q.J.; writing—review and editing, J.C.; visualization, J.S.; supervision, C.G.; and project administration, Q.J. All authors have read and agreed to the published version of the manuscript.

Funding

The found number is 2021M701460 from China Postdoctoral Science Foundation.

Institutional Review Board Statement

Not applicable.

Informed Consent Statement

Not applicable.

Data Availability Statement

Not applicable.

Conflicts of Interest

The authors declare no conflict of interest.

Appendix A

Figure A1. Images used in the mock museum.
Systems 10 00073 g0a1aSystems 10 00073 g0a1bSystems 10 00073 g0a1c

References

  1. Damiani, L.; Demartini, M.; Guizzi, G.; Revetria, R.; Tonelli, F. Augmented and virtual reality applications in industrial systems: A qualitative review towards the industry 4.0 era. IFAC-PapersOnLine 2018, 51, 624–630. [Google Scholar] [CrossRef]
  2. Poce, A.; Amenduni, F.; De Medio, C.; Valente, M.; Re, M.R. Adopting Augmented Reality to Engage Higher Education Students in a Museum University Collection: The Experience at Roma Tre University. Information 2019, 10, 373. [Google Scholar] [CrossRef] [Green Version]
  3. Hogsden, C.; Poulter, E.K. The real other? Museum objects in digital contact networks. J. Mater. Cult. 2012, 17, 265–286. [Google Scholar] [CrossRef]
  4. Capuano, N.; Gaeta, A.; Guarino, G.; Miranda, S.; Tomasiello, S. Enhancing augmented reality with cognitive and knowledge perspectives: A case study in museum exhibitions. Behav. Inf. Technol. 2016, 35, 968–979. [Google Scholar] [CrossRef]
  5. Alizadehsalehi, S.; Hadavi, A.; Huang, J.C. From BIM to extended reality in AEC industry. Autom. Constr. 2020, 116, 103254. [Google Scholar] [CrossRef]
  6. Han, I. Immersive virtual field trips and elementary students’ perceptions. Br. J. Educ. Technol. 2021, 52, 179–195. [Google Scholar] [CrossRef]
  7. Azuma, R.T. A survey of augmented reality. Presence Teleoperators Virtual Environ. 1997, 6, 355–385. [Google Scholar] [CrossRef]
  8. Dan, Y.; Shen, Z.; Zhu, Y.; Huang, L. Using mixed reality (MR) to improve on-site design experience in community planning. Appl. Sci. 2021, 11, 3071. [Google Scholar] [CrossRef]
  9. Yang, F.; Goh, Y.M. VR and MR technology for safety management education: An authentic learning approach. Saf. Sci. 2022, 148, 105645. [Google Scholar] [CrossRef]
  10. Huang, Y.; Shakya, S.; Odeleye, T. Comparing the functionality between virtual reality and mixed reality for architecture and construction uses. J. Civ. Eng. Archit. 2019, 13, 409–414. [Google Scholar]
  11. Loureiro, S.M.C.; Guerreiro, J.; Ali, F. 20 years of research on virtual reality and augmented reality in tourism context: A text-mining approach. Tour. Manag. 2020, 77, 104028. [Google Scholar] [CrossRef]
  12. Chen, J.-J.; Hsu, Y.; Wei, W.; Yang, C. Continuance Intention of Augmented Reality Textbooks in Basic Design Course. Educ. Sci. 2021, 11, 208. [Google Scholar] [CrossRef]
  13. Yip, J.; Wong, S.-H.; Yick, K.-L.; Chan, K.; Wong, K.-H. Improving quality of teaching and learning in classes by using augmented reality video. Comput. Educ. 2019, 128, 88–101. [Google Scholar] [CrossRef]
  14. Lu, S.-J.; Liu, Y.-C.; Chen, P.-J.; Hsieh, M.-R. Evaluation of AR embedded physical puzzle game on students’ learning achievement and motivation on elementary natural science. Interact. Learn. Environ. 2020, 28, 451–463. [Google Scholar] [CrossRef]
  15. He, Z.; Wu, L.; Li, X. When art meets tech: The role of augmented reality in enhancing museum experiences and purchase intentions. Tour. Manag. 2018, 68, 127–139. [Google Scholar] [CrossRef]
  16. Serravalle, F.; Ferraris, A.; Vrontis, D.; Thrassou, A.; Christofi, M. Augmented reality in the tourism industry: A multi-stakeholder analysis of museums. Tour. Manag. Perspect. 2019, 32, 100549. [Google Scholar] [CrossRef]
  17. Tom Dieck, M.C.; Jung, T.H.; tom Dieck, D. Enhancing art gallery visitors’ learning experience using wearable augmented reality: Generic learning outcomes perspective. Curr. Issues Tour. 2018, 21, 2014–2034. [Google Scholar] [CrossRef]
  18. Schavemaker, M. Is augmented reality the ultimate museum app? Some strategic considerations. In Mobile Apps for Museums: The AAM Guide to Planning and Strategy; American Alliance of Museums: Washington, DC, USA, 2011. [Google Scholar]
  19. Chung, N.; Han, H.; Joun, Y. Tourists’ intention to visit a destination: The role of augmented reality (AR) application for a heritage site. Comput. Hum. Behav. 2015, 50, 588–599. [Google Scholar] [CrossRef]
  20. Milgram, P.; Takemura, H.; Utsumi, A.; Kishino, F. Augmented reality: A class of displays on the reality-virtuality continuum. In Telemanipulator and Telepresence Technologies; SPIE Press: Bellingham, WA, USA, 1995; pp. 282–292. [Google Scholar]
  21. Damala, A.; Cubaud, P.; Bationo, A.; Houlier, P.; Marchal, I. Bridging the gap between the digital and the physical: Design and evaluation of a mobile augmented reality guide for the museum visit. In Proceedings of the 3rd International Conference on Digital Interactive Media in Entertainment and Arts, Athens, Greece, 10–12 September 2008; pp. 120–127. [Google Scholar]
  22. Hassan, A.; Ramkissoon, H. Augmented reality application to museum visitor experiences. Visit. Manag. Tour. Destin. 2016, 3, 117. [Google Scholar]
  23. Ding, M. Augmented reality in museums. In Museums & Augmented Reality—A Collection of Essays from the Arts Management and Technology Laboratory; Arts Management and Technology Laboratory: Pittsburgh, PA, USA, 2017; pp. 1–15. [Google Scholar]
  24. Ryffel, M.; Zünd, F.; Aksoy, Y.; Marra, A.; Nitti, M.; Aydın, T.O.; Sumner, B. AR Museum: A mobile augmented reality application for interactive painting recoloring. ACM Trans. Graph. (TOG) 2017, 36, 19. [Google Scholar]
  25. Hinrichs, U.; Schmidt, H.; Carpendale, S. EMDialog: Bringing information visualization into the museum. IEEE Trans. Vis. Comput. Graph. 2008, 14, 1181–1188. [Google Scholar] [CrossRef] [PubMed]
  26. Hornecker, E.; Stifter, M. Learning from interactive museum installations about interaction design for public settings. In Proceedings of the 18th Australia Conference on Computer-Human Interaction: Design: Activities, Artefacts and Environments, Sydney, Australia, 20–24 November 2006; pp. 135–142. [Google Scholar]
  27. Gong, Z.; Wang, R.; Xia, G. Augmented Reality (AR) as a Tool for Engaging Museum Experience: A Case Study on Chinese Art Pieces. Digital 2022, 2, 2. [Google Scholar] [CrossRef]
  28. Trunfio, M.; Campana, S. A visitors’ experience model for mixed reality in the museum. Curr. Issues Tour. 2020, 23, 1053–1058. [Google Scholar] [CrossRef]
  29. Jung, T.; tom Dieck, M.C.; Lee, H.; Chung, N. Effects of Virtual Reality and Augmented Reality on Visitor Experiences in Museum. In Information and Communication Technologies in Tourism; Springer: Cham, Switzerland, 2016; pp. 621–635. [Google Scholar]
  30. Jung, T.; Chung, N.; Leue, M.C. The determinants of recommendations to use augmented reality technologies: The case of a Korean theme park. Tour. Manag. 2015, 49, 75–86. [Google Scholar] [CrossRef]
  31. Trunfio, M.; Lucia, M.D.; Campana, S.; Magnelli, A. Innovating the cultural heritage museum service model through virtual reality and augmented reality: The effects on the overall visitor experience and satisfaction. J. Herit. Tour. 2020, 17, 1–19. [Google Scholar] [CrossRef]
  32. Marto, A.; Gonçalves, A.; Sousa, A. DinofelisAR: Users’ Perspective About a Mobile AR Application in Cultural Heritage. In Proceedings of the International Conference on VR Technologies in Cultural Heritage, Brasov, Romania, 29–30 May 2018; pp. 79–92. [Google Scholar]
  33. Chung, N.; Lee, H.; Kim, J.-Y.; Koo, C. The Role of Augmented Reality for Experience-Influenced Environments: The Case of Cultural Heritage Tourism in Korea. J. Travel Res. 2018, 57, 627–643. [Google Scholar] [CrossRef]
  34. Siang, T.G.; Ab Aziz, K.B.; Ahmad, Z.B.; Suhaifi, S.B. Augmented reality mobile application for museum: A technology acceptance study. In Proceedings of the 2019 6th International Conference on Research and Innovation in Information Systems (ICRIIS), Johor Bahru, Malaysia, 2–3 December 2019; pp. 1–6. [Google Scholar]
  35. Nizar, N.N.M.; Rahmat, M.K. Examining the museum visitors’ use of mobile technology through technology acceptance model (TAM). J. Tour. Hosp. Environ. Manag. 2018, 3, 14–24. [Google Scholar]
  36. Damala, A.; Marchal, I.; Houlier, P. Merging augmented reality based features in mobile multimedia museum guides. In Proceedings of the Anticipating the Future of the Cultural Past, CIPA Conference 2007, Athens, Greece, 1–6 October 2007; pp. 259–264. [Google Scholar]
  37. Zviran, M.; Glezer, C.; Avni, I. User satisfaction from commercial web sites: The effect of design and use. Inf. Manag. 2006, 43, 157–178. [Google Scholar] [CrossRef]
  38. Bigné, J.E.; Mattila, A.S.; Andreu, L. The impact of experiential consumption cognitions and emotions on behavioral intentions. J. Serv. Mark. 2008, 22, 303–315. [Google Scholar] [CrossRef]
  39. Martín-Ruiz, D.; Castellanos-Verdugo, M.; Oviedo-García, M.d.l.Á. A visitors’ evaluation index for a visit to an archaeological site. Tour. Manag. 2010, 31, 590–596. [Google Scholar] [CrossRef]
  40. Chang, K.-E.; Chang, C.-T.; Hou, H.-T.; Sung, Y.-T.; Chao, H.-L.; Lee, C.-M. Development and behavioral pattern analysis of a mobile guide system with augmented reality for painting appreciation instruction in an art museum. Comput. Educ. 2014, 71, 185–197. [Google Scholar] [CrossRef]
  41. Kyriakou, P.; Hermon, S. Can I touch this? Using Natural Interaction in a Museum Augmented Reality System. Digit. Appl. Archaeol. Cult. Herit. 2019, 12, e00088. [Google Scholar] [CrossRef]
  42. Moon, J.-W.; Kim, Y.-G. Extending the TAM for a World-Wide-Web context. Inf. Manag. 2001, 38, 217–230. [Google Scholar] [CrossRef]
  43. Roca, J.C.; Gagné, M. Understanding e-learning continuance intention in the workplace: A self-determination theory perspective. Comput. Hum. Behav. 2008, 24, 1585–1604. [Google Scholar] [CrossRef]
  44. Tillon, A.B.; Marchal, I.; Houlier, P. Mobile augmented reality in the museum: Can a lace-like technology take you closer to works of art? In Proceedings of the 2011 IEEE International Symposium on Mixed and Augmented Reality—Arts, Media, and Humanities, Basel, Switzerland, 26–29 October 2011; pp. 41–47. [Google Scholar]
  45. Keil, J.; Pujol, L.; Roussou, M.; Engelke, T.; Schmitt, M.; Bockholt, U.; Eleftheratou, S. A digital look at physical museum exhibits: Designing personalized stories with handheld Augmented Reality in museums. In Proceedings of the 2013 Digital Heritage International Congress (DigitalHeritage), Marseille, France, 28 October–1 November 2013; pp. 685–688. [Google Scholar]
  46. Khan, M.A.; Israr, S.; Almogren, A.S.; Din, I.U.; Almogren, A.; Rodrigues, J.J.P.C. Using augmented reality and deep learning to enhance Taxila Museum experience. J. Real-Time Image Process. 2021, 18, 321–332. [Google Scholar] [CrossRef]
  47. Yoon, S.A.; Elinich, K.; Wang, J.; Steinmeier, C.; Tucker, S. Using augmented reality and knowledge-building scaffolds to improve learning in a science museum. Int. J. Comput.-Support. Collab. Learn. 2012, 7, 519–541. [Google Scholar] [CrossRef]
  48. Fino, E.R.; Martín-Gutiérrez, J.; Fernández, M.D.M.; Davara, E.A. Interactive Tourist Guide: Connecting Web 2.0, Augmented Reality and QR Codes. Procedia Comput. Sci. 2013, 25, 338–344. [Google Scholar] [CrossRef] [Green Version]
  49. Pandey, A.; Sahu, R. Modeling the relationship between service quality, destination attachment and eWOM intention in heritage tourism. Int. J. Tour. Cities 2020, 6, 769–784. [Google Scholar] [CrossRef]
  50. Wu, Y.; Jiang, Q.; Liang, H.E.; Ni, S. What Drives Users to Adopt a Digital Museum? A Case of Virtual Exhibition Hall of National Costume Museum. SAGE Open 2022, 12. [Google Scholar] [CrossRef]
  51. Roca, J.C.; Chiu, C.-M.; Martínez, F.J. Understanding e-learning continuance intention: An extension of the Technology Acceptance Model. Int. J. Hum.-Comput. Stud. 2006, 64, 683–696. [Google Scholar] [CrossRef] [Green Version]
  52. Oh, S.H.; Kim, Y.M.; Lee, C.W.; Shim, G.Y.; Park, M.S.; Jung, H.S. Consumer adoption of virtual stores in Korea: Focusing on the role of trust and playfulness. Psychol. Mark. 2009, 26, 652–668. [Google Scholar] [CrossRef]
  53. Otondo, R.F.; Van Scotter, J.R.; Allen, D.G.; Palvia, P. The complexity of richness: Media, message, and communication outcomes. Inf. Manag. 2008, 45, 21–30. [Google Scholar] [CrossRef] [Green Version]
  54. Wu, Y.; Jiang, Q.; Ni, S.; Liang, H.e. Critical Factors for Predicting Users’ Acceptance of Digital Museums for Experience-Influenced Environments. Information 2021, 12, 426. [Google Scholar] [CrossRef]
  55. Hsu, M.-H.; Chiu, C.-M. Predicting electronic service continuance with a decomposed theory of planned behaviour. Behav. Inf. Technol. 2004, 23, 359–373. [Google Scholar] [CrossRef]
  56. Mathwick, C.; Malhotra, N.; Rigdon, E. Experiential value: Conceptualization, measurement and application in the catalog and Internet shopping environment. J. Retail. 2001, 77, 39–56. [Google Scholar] [CrossRef]
  57. Jiang, Q.; Sun, J.; Yang, C.; Gu, C. The Impact of Perceived Interactivity and Intrinsic Value on Users’ Continuance Intention in Using Mobile Augmented Reality Virtual Shoe-Try-On Function. Systems 2021, 10, 3. [Google Scholar] [CrossRef]
  58. Bhattacherjee, A. Understanding information systems continuance: An expectation-confirmation model. MIS Q. 2001, 25, 351–370. [Google Scholar] [CrossRef]
  59. Pallud, J. Impact of interactive technologies on stimulating learning experiences in a museum. Inf. Manag. 2017, 54, 465–478. [Google Scholar] [CrossRef]
  60. Fenu, C.; Pittarello, F. Svevo tour: The design and the experimentation of an augmented reality application for engaging visitors of a literary museum. Int. J. Hum.-Comput. Stud. 2018, 114, 20–35. [Google Scholar] [CrossRef]
  61. Moorhouse, N.; tom Dieck, M.C.; Jung, T. An experiential view to children learning in museums with Augmented Reality. Mus. Manag. Curatorship 2019, 34, 402–418. [Google Scholar] [CrossRef]
Figure 1. Hypothesis model diagram.
Systems 10 00073 g001
Figure 2. Experimental devices.
Systems 10 00073 g002
Figure 3. Path analysis results. (“*” means significant).
Systems 10 00073 g003
Table 1. Measurement scale.
ConstructCodingItemSource
Interaction qualityIAQ1The device’s augmented reality features provided me with a high standard of interaction.[49]
IAQ2The device’s augmented reality features responded quickly to my actions.
IAQ3Generally, the quality of interaction provided by the device’s augmented reality features is very good.
Information qualityIQ1The information and content provided by the device’s augmented features is easy to understand.[50,51]
IQ2The device’s augmented reality features provide clear information and content.
IQ3The device’s augmented reality features present information in the form of an appropriate interface.
Information richnessIR1The device’s augmented reality features can deliver information in a number of ways.[50,52,53]
IR2The augmented reality features of the device allowed me to understand the symbolic meaning of the exhibits in addition to displaying them.
IR3Overall, the device’s augmented reality features provide me with a wealth of information about exhibits.
SatisfactionSA1I was satisfied with the amount of knowledge or information I gained from a museum visit using the device’s augmented reality features.[54,55]
SA2I was satisfied with the experience of visiting a museum using the device’s augmented reality features.
SA3For me, the decision to use the device’s augmented reality features for a museum visit was a smart one.
Perceived playfulnessPP1I didn’t feel the passage of time during a museum visit using the device’s augmented reality features[54,56,57]
PP2I was curious about using the device’s augmented reality features for museum tours.
PP3Museum tours using the device’s augmented reality features were fun for me.
Continuance intentionCI1I plan to continue to use the device’s augmented reality features for museum visits instead of stop using them.[51,58]
CI2I will often use the device’s augmented reality features for museum visits.
CI3I highly recommend that others use the device’s augmented reality features to visit the museum.
Table 2. Descriptive statistics results.
SampleCategoryNumberPercentage
GenderMale6532.02%
Female13867.98%
Age18–2511657.14%
26–345527.09%
35–542813.79%
55–6441.97%
EducationHigh school degree or below188.87%
Bachelor’s degree11054.19%
Master’s degree6532.02%
Doctoral degree104.93%
OccupationStudent10551.72%
Research scholar7235.47%
Others2612.81%
Table 3. Reliability analysis results.
ConstructItemCorrected Item-to-Total CorrelationCronbach’s α after DeletionCronbach’s α
Interaction qualityIAQ10.6370.7440.803
IAQ20.7170.656
IAQ30.5960.784
Information qualityIQ10.5110.5020.658
IQ20.4550.582
IQ30.4450.592
Information richnessIR10.5280.6900.736
IR20.6160.580
IR30.5430.673
SatisfactionSA10.5310.8230.794
SA20.7290.624
SA30.6720.688
Perceived playfulnessPP10.4450.6140.666
PP20.5260.506
PP30.4670.589
Continuance intentionCI10.5860.6280.740
CI20.4900.746
CI30.6310.588
Table 4. % of the variance in factor analysis.
UnrotatedRotated
Eigenvalue% of VarianceEigenvalue% of Variance
Factor 16.40535.5852.58014.331
Factor 21.87510.4152.53514.082
Factor 31.3637.5702.33812.988
Factor 41.1296.2711.88710.484
Factor 50.8284.6001.5828.791
Factor 60.7854.3621.4638.127
Table 5. Factor loading (rotated).
ItemFactor LoadingCommonality
Factor 1Factor 2Factor 3Factor 4Factor 5Factor 6
IAQ1 0.803 0.718
IAQ2 0.836 0.788
IAQ3 0.730 0.655
IQ1 0.755 0.699
IQ2 0.623 0.696
IQ3 0.512 0.563
IR10.704 0.604
IR20.768 0.677
IR30.735 0.653
SA1 0.644 0.591
SA2 0.827 0.761
SA3 0.839 0.793
PP1 0.4060.603
PP2 0.6690.719
PP3 0.7000.685
CI1 0.828 0.788
CI2 0.486 0.640
CI3 0.787 0.750
Table 6. Analysis results of convergent validity.
ConstructItemUnstd.S.E.CRpStd.AVECR
Interaction qualityIAQ11.000---0.7380.5900.810
IAQ21.1640.11410.2170.0000.854
IAQ30.9040.1009.0840.0000.698
Information qualityIQ11.000---0.6230.3910.657
IQ20.8340.1236.8030.0000.602
IQ30.9790.1367.1740.0000.648
Information richnessIR11.000---0.6500.4920.742
IR21.1790.1448.1950.0000.758
IR30.9340.1217.7250.0000.688
SatisfactionSA11.000---0.6220.6010.814
SA21.4340.1638.7850.0000.859
SA31.5700.1828.6470.0000.804
Perceived playfulnessPP11.000---0.6180.4040.669
PP21.1690.1567.4860.0000.687
PP31.0840.1596.8070.0000.601
Continuance intentionCI11.000---0.7330.4990.749
CI20.8770.1137.7890.0000.634
CI30.9130.1038.8650.0000.761
Table 7. Analysis results of discriminant validity.
IAQIQIRSAPPCI
Interaction quality0.768
Information quality0.4920.626
Information richness0.4070.5920.701
Satisfaction0.3760.3960.3540.775
Perceived playfulness0.4700.5300.5370.4660.635
Continuance intention0.3790.3730.3340.5310.5240.707
Note: The items on the diagonal in bold represent the square roots of the AVE.
Table 8. Model fit measures.
Common Indicesχ²dfχ²/dfRMSEACFINNFITLIIFISRMR
Judgment criteria--<3<0.10>0.9>0.9>0.9>0.9<0.1
Value221.5031271.7440.0610.9290.9140.9140.930.067
Table 9. Model path analysis results.
DVIVUnstdS.E.CRpStd.R2
SatisfactionInformation quality0.6430.1225.2540.0000.5590.313
Information richnessInteraction quality0.4090.0805.1170.0000.5050.255
Information qualityInteraction quality0.2920.0743.9320.0000.3740.831
Information richness0.6400.1205.3460.0000.664
Perceived playfulnessInformation quality0.8640.2593.3320.0010.8170.721
Information richness0.0390.2280.1700.8650.038
Continuance intentionSatisfaction0.4230.1163.6590.0000.3490.532
Perceived playfulness0.6530.1404.6520.0000.496
Publisher’s Note: MDPI stays neutral with regard to jurisdictional claims in published maps and institutional affiliations.

