Article

Enhancing Digital Innovation for the Sustainable Transformation of Manufacturing Industry: A Pressure-State-Response System Framework to Perceptions of Digital Green Innovation and Its Performance for Green and Intelligent Manufacturing

1
College of Economics and Management, Hebei Agricultural University, Baoding 071001, China
2
School of Marxism, Hebei Agricultural University, Baoding 071001, China
3
Department of Mathematics, Lahore Campus, Riphah International University, Lahore 54000, Pakistan
4
School of Economics and Business Administration, Heilongjiang University, Harbin 150080, China
*
Author to whom correspondence should be addressed.
Systems 2022, 10(3), 72; https://doi.org/10.3390/systems10030072
Submission received: 12 May 2022 / Revised: 25 May 2022 / Accepted: 26 May 2022 / Published: 27 May 2022
(This article belongs to the Special Issue Decision-Making Process and Its Application to Business Analytic)

Abstract

:
Low carbon and digitalization are the general trends of manufacturing upgrading and transformation. Digital technology enables the whole process of green manufacturing and breaks down the spatial barrier. To achieve the dual carbon goals, the pressure-state-response (PSR) model, in which digital technology enables the green innovation of the manufacturing industry, was theoretically analyzed in this study. The measurement system of the digital green innovation (DGI) in the manufacturing industry was constructed according to the PSR framework. An evaluation model based on the analytic hierarchy process and the deviation maximization technique for order preference by similarity to an ideal solution method was constructed to measure the level of DGI. The results of this study from Chinese manufacturing are as follows. (i) The measurement system of the level of DGI in manufacturing industry includes a pressure system, state system and response system. (ii) In the past five years, the comprehensive index of the DGI in manufacturing industry has generally shown a trend of fluctuating rise. There are overall low and unbalanced phenomena in all regions. The gap decreased from 0.1320 to 0.1187, showing a gradually narrowing trend. (iii) Compared with other regions, the composite index of DGI is generally higher in the regions with a better ecological environment in the east and a more developed economy in the north. State parameters are higher than pressure and response parameters in most areas. (iv) Compared with other regions, the composite index of DGI in western and southern regions is lower, and the parameters of pressure, status and response are basically coordinated. (v) The application degree of digital technology, the emission intensity of waste water/exhaust gas of output value of one hundred million yuan and the expenditure intensity of digital technology adopted by enterprises are the key influencing factors of DGI in the manufacturing industry. This study not only proposed an evaluation index system of the digital green innovation level, but also puts forward policy guidance and practical guidance of digital technology to accelerate the green and intelligent manufacturing industry.

1. Introduction

As carbon dioxide emissions rise year by year, countries around the world have agreed to reduce greenhouse gases. Green development is the fundamental way to achieve advanced production, livable life and beautiful ecology, as well as the key to achieve carbon peak and carbon neutrality [1]. At present, China is in a special period of “dual carbon” goals, the implementation of innovation-driven development strategy and “Made in China 2025” to drive economic development. The manufacturing industry is the main support of the real economy and the engine of the high-quality development of China’s real economy [2]. However, at present, the gap between China’s regional economic development continues to expand; a manufacturing industry appearing “big but not strong” situation. Resource exhaustion, environmental deterioration and other problems are becoming increasingly serious. The adjustment of economic structure and transformation and upgrading of the manufacturing industry are imminent [3]. The green development of the manufacturing industry has formed a consensus, which is also the need of its high-quality development [4]. Under the background of carbon peak and carbon neutral, low-carbon and energy-saving are the general trends of manufacturing upgrading and transformation and also the inevitable result of the high-quality development of the manufacturing industry [5]. How to achieve green and low-carbon development while reducing costs and increasing efficiency in the manufacturing industry has become the focus of enterprises’ survival and competition. “Green + intelligent” is an important link to enhance the competitiveness of digital green manufacturing enterprises [6]. Digital technology empowerment is the key point to accelerate the greening and intellectualization of the manufacturing industry [7].
At present, digital technology is widely permeated in production and life, and the digital economy is booming. Digital industrialization and industrial digitization are accelerating. The deep integration of the digital economy and real economy has become an important path to promote the green and high-quality development of the manufacturing production mode [8]. On the one hand, the digital economy can effectively not only improve the production process and improve the efficiency of equipment operation, but also improve the accuracy of production process management. Production efficiency and energy saving and emission reduction are improved through intelligent collaborative management [9]. On the other hand, the digital economy can effectively optimize the pattern of resource allocation. Digital infrastructure in the industrial Internet, big data, artificial intelligence and other fields can realize the integration and sharing of various resource elements in different industries and enterprises. Resource allocation efficiency helps to be further enhanced through digital technology [10]. In addition, the core production factor of the digital economy is data. Data have the characteristics of high efficiency, cleanliness, low cost and replicability [11]. Therefore, the traditional industrial structure and ecosystem can be optimized only when data elements are well utilized to accelerate the deep integration of the digital economy and real economy.
The continuous emergence of digital technology innovation has accelerated the digital transformation and upgrading of the traditional manufacturing industry and the quality improvement and upgrading of the modern manufacturing industry [12]. Traditional manufacturing is gradually shifting to digital manufacturing. Data as a new production factor and other factors into the manufacturing industry chain. Data elements not only improve the industry integration efficiency of the whole industry chain, but also improve the efficiency of resource allocation among traditional elements such as labor, capital, technology and land [13,14]. At this point, traditional manufacturing gradually moves to an intelligent manufacturing transformation. Digital technology enables the whole process of traditional manufacturing and breaks down the spatial barrier between industries. Digital technology not only improves the cooperation efficiency between manufacturing and producer services, but also accelerates the rise of strategic emerging industries, such as the information industry and advanced equipment manufacturing [15]. Some possible problems are predicted in advance by manufacturing enterprises through real-time aggregation analysis of massive data. The production process continues to be optimized, and the supply quality of manufacturing products is comprehensively improved [16]. Digital technology intelligent scenarios are widely used in manufacturing. The application value of digital technology is mainly reflected in the reduction in manufacturing cost, the optimization of the production process and organizational form. With the wide application of digital technology, many new industries, new forms of business and new models have been created. Digital technology has brought many benefits to enterprises, including the maximum benefit with the smallest cost, and the economic benefit of enterprises has been significantly improved [17]. Digital technology has brought many benefits to the government and society, including green manufacturing, green supply and green payment. Although reducing environmental pollution, digital technology can not only reduce resource consumption, but also increase social benefits [18]. Manufacturing sustainability has been significantly enhanced through digital technology.
Over the past decade, digital technologies such as big data, cloud computing, artificial intelligence and the Internet of Things have flourished. The research on the application of digital technology in various fields has been warmly welcomed by the academic world and the industry. The problem of digital innovation has been widely concerning researchers. At present, the connotation, denotation and implementation framework of digital innovation are widely discussed in academic circles. Theoretical derivation and case analysis are the main research methods.
In terms of the connotation of digital innovation, scholars mainly expound its connotation from two perspectives: process and result. Some scholars believed that the process performance of enterprise innovation can be improved by digital resources, and other scholars believed that existing non-digital products and services are endowed with new attributes through digital resources [19,20,21,22]. With the integration of these two perspectives, the connotation of digital innovation should break through the shackles of process and result perspectives. How digital innovation is realized should be discussed comprehensively from a theoretical perspective [23].
In terms of the epitaxial aspect of digital innovation, the characteristics of digital innovation mainly include convergence (fuzzy boundary and low importance) [24] and self-growth (continuous improvement and change) [25]. According to the realization mode, digital innovation can be divided into digital product innovation, digital process innovation, digital organization innovation and digital business model innovation [26,27,28]. Digital product innovation is the combination of new products or services containing digital technologies, namely information, computing, communication and connectivity technologies, or supported by such digital technologies [29]. Digital process innovation is the application of digital technology to improve or even reconstruct the original innovation process framework [30]. Digital organizational innovation means that digital technology changes the form or governance structure of an organization [31]. Digital business model innovation is the embedding of digital technology that changes the original business model [32]. Digital infrastructure is the basic support for realizing digital innovation, as well as the digital technology, organizational structure and related service facilities that support the operation of an enterprise or industry [33]. Formally, digital infrastructure refers to shared, unbounded, heterogeneous and open systems. Based on digital infrastructure, the multi-agent cooperative digital platform has gradually become the center of innovation activities of many enterprises due to its flexibility, openness and availability [34]. Existing research on multi-agent cooperation digital platforms mainly include technology management perspective, industrial organization perspective and strategic management perspective [35,36]. Although these studies adopt different research perspectives, they are generally similar to those on digital infrastructure, including the construction, evolution and governance of multi-agent cooperative digital platforms.
As for the realization of digital innovation, the representative frameworks are those of Desouza et al. (2009) [37] and Kohli & Melville (2019) [38]. The framework shows that the realization of digital innovation needs to go through three stages: digital innovation initiation, digital innovation development and digital innovation application. The start-up process of digital innovation is the process by which enterprises identify digital innovation opportunities and prepare for digital innovation. Developing digital strategy, structuring digital resources, enhancing digital innovation capacity and constructing digital innovation-oriented culture is an important step for organizations to launch digital innovation [38,39,40]. Digital innovation development is a process in which an enterprise develops an innovative idea generated at the start-up stage into a digital innovation that can be applied. Digital innovation development process is a dynamic interactive process that emphasizes design logic, open innovation, situational integration and continuous iteration [41]. Digital innovation application is the application process of developing digital innovation, which involves a series of complex organizational changes [38]. The application process of digital innovation requires organizations to continuously redefine value networks and carry out organizational structure changes [42]. In addition, many scholars believed that the realization of digital innovation is mainly reflected in operational efficiency and organizational performance. On the one hand, the advantages of digital technology itself can greatly improve operational efficiency through the optimization of products, processes, organizations and business models. On the other hand, digital innovation can help enterprises improve organizational performance. Digital product innovation creates new value for customers and improves the dynamic capability of enterprises [8,18,21]. Moreover, it also changes the original way of enterprise value acquisition and value creation.
In terms of green innovation, the research on green innovation in the manufacturing industry involves the relevant factors affecting green innovation and the evaluation of green innovation. In terms of relevant factors, Karakaya et al. (2014) believed that one of the important elements of the industrial green progress is to combine technological innovation with ecological protection, namely green innovation [43]. Weber et al. (2014) argued that green innovation should aim at producing significant environmental benefits rather than reducing the environmental burden [44]. Fernando et al. (2019) proposed that service innovation capability plays a mediating role in the relationship between sustainable organizational performance and environmental innovation [45]. Xie et al. (2019) found that both green process innovation and green product innovation can improve the financial performance of enterprises [46]. Fujii & Managi (2019) found that sustainable green patent publications increased due to increased efficiency, increased share of R&D spending and economic growth [47]. In terms of relevant evaluation, Lin et al. (2018) believed that the overall efficiency of green innovation in the manufacturing industry is low, declining first, then rising and then declining [48]. Lee & Choi (2019) believed that innovation effect leads the environmental productivity of South Korea’s manufacturing industry [49]. Nie & Qi (2019) measured the two-stage green innovation efficiency of industrial enterprises under resource and environment constraints [50]. Yin et al. (2020) studied the impact of environmental regulation and government R&D funding on green innovation [51]. Yin et al. (2021) measured four dimensions of regional green innovation input capacity, green innovation output capacity, green innovation environment capacity and green diffusion input capacity [52].
The high-quality manufacturing industry based on green innovation mainly has the characteristics of strong innovation ability, high resource allocation efficiency, high product quality, high economic benefits and good ecological and environmental benefits [51,52]. Scholars conducted in-depth research on this topic from the following five aspects. As for the connotation research of high-quality development of manufacturing industry, Yu (2020) believed that high-quality development of manufacturing industry refers to the realization of high-level sustainable development with low input of production factors, high efficiency of resource allocation, strong strength of quality improvement, excellent ecological environment quality and good economic and social benefits in the whole process of production, manufacturing and sales [53]. As for the research on the evaluation system of the high-quality development of the manufacturing industry, Jiang et al. (2019) constructed an evaluation index system of the high-quality development of the manufacturing industry from six aspects: economic benefit, technological innovation, green development, quality brand, integration of industrialization and industrialization and high-end development [54]. Research on the high-quality development of the manufacturing industry in different regions mainly includes macro, medium and micro perspective. Deng et al. (2020) believed that the Internet plays a significant role in promoting the development of the manufacturing industry, and different manufacturing industries have different degrees of influence [55]. Pei et al. (2019) believed that brand’s synergistic technological progress can promote the high-quality development of China’s manufacturing industry [56]. Ren (2019) proposed six strategies to promote the high-quality development of China’s manufacturing industry from a strategic perspective [57]. Chen (2020) focused on the quality reform strategy and put forward a path to promote the manufacturing quality reform [58]. In addition, Sturgeon (2021) analyzed the influence of the digital economy level on the optimization and upgrading of the manufacturing industrial structure [59]. Liu et al. (2022) analyzed the mechanism and path of the high-quality development of the manufacturing industry in the digital economy [60]. A large number of theoretical achievements on economic growth and the quality of economic growth provide enlightenment for the research on the high-quality development of the manufacturing industry.
In addition, some scholars have studied the impact of the Internet, Internet+, Internet of Things, big data and other information technologies on industrial innovation and development. For example, Munín-Doce et al., (2020) pointed out that intelligent products developed by “Internet+” have been widely applied in industrial production [61]. Li & Zhang (2021) believed that big data can enable enterprises to achieve outstanding performance beyond their competitors [62]. Sundarakani et al. (2021) analyzed the instrumental application of big data resources and technologies to promote the formation of the “big data” industrial chain from a three-dimensional perspective [63]. Matarazzo et al. (2021) believed that using big data can help enterprises reshape the value creation process in their business models [64]. Fang et al. (2022) believed that “Internet+” can promote high-quality industrial development through the transmission mechanism of green development [65].
To sum up, existing studies focus on green innovation evaluation and the high-quality development of the manufacturing industry. There are very few pieces of research on the convergence of green innovation and digital innovation. There is a dearth of research on the effective integration of green and numbers. The related index systems and evaluation methods of digital green innovation in the manufacturing industry have been systematically explained. There is a lack of research on macro policies and micro countermeasures based on improving the development level of regional digital green innovation. Therefore, the development path of digital green innovation in the manufacturing industry will be analyzed in this study. The evaluation index system of digital green innovation level will be constructed. In theory, the research perspective and method of the digital green innovation evaluation will be established in this study. In practice, the policy guidance and practical guidance of digital technology to accelerate the green and intelligent manufacturing industry will also be put forward.
The rest of the structure of this study is as follows. The theoretical mechanism of digital green innovation in the manufacturing industry is analyzed, and its level evaluation system is established in Section 2. In Section 3, the evaluation model of the digital green innovation level is established. The empirical results and discussion are presented in Section 4. Section 5 summarizes the conclusion, enlightenment and future research direction.

2. Theoretical Basis and Evaluation System

2.1. Theoretical Basis

The “pressure-state-response” (PSR) model corresponds to “cause”, “effect” and “response”, respectively [66]. Human beings obtain resources from the natural environment and discharge the waste produced into the environment. At the same time, the change of the natural environment in turn has an impact on human activities. Therefore, human beings take corresponding measures to respond to its changes. This creates a PSR relationship between humans and the natural environment. At present, the PSR model is widely used to evaluate the status of environmental sustainable development in the fields of nature, economy and development. This model can be applied to reflect the interaction between the subject and the environment [67].
Data empowerment is an important driving force to promote the intelligent and green development of the manufacturing industry. At present, scholars have expounded the connotation of data empowerment from different angles. Kunyanti & Mujiono (2021) believed that data empowerment includes economic and social activities, which are realized through platforms such as the Internet, mobiles and sensor networks [68]. Sepahvand et al. (2022) believed that data empowerment is an economic activity carried out by network communication technology and data as the core production factors [69]. The basic structure of data empowerment consists of ICT industry, digital media and network platforms. In the era of digital economy, the boundaries of manufacturing industry chain organization are becoming increasingly networked, flat, platform-based, flexible and borderless [12]. As a new production factor, data are deeply embedded in the whole manufacturing industry chain by virtue of natural endowments such as replication, sharing and unlimited supply. Data empowerment brings profound changes to the whole process of manufacturing research and development, procurement, production, management, sales and related services [69]. Compared with traditional manufacturing, data resources, digital infrastructure, digital technology, industrial organization form and industrial integration are the core characteristics of data empowerment [17,18,24,42]. Disruptive innovations in the field of digital technology continue to emerge and rapidly penetrate into all aspects of the manufacturing industry. This not only extends to the whole industrial chain, breaking down the spatial barrier of the high-quality development of the manufacturing industry, but also meets the inherent requirements of upgrading the traditional manufacturing industry and upgrading the modern manufacturing industry in the new economic form [70]. The strategic layout and operation of new infrastructures, such as 5G networks, data centers and satellite Internet will reshape the innovation, manufacturing, sales, supply and service chains of the manufacturing industry. The wide application of digital technology promotes the precise docking of the innovation chain and industrial chain, which not only helps reduce R&D costs and improve R&D efficiency, but also enables the manufacturing industry to climb up the value chain [71]. Flexible production is the inevitable choice for the manufacturing industry to respond to diversified and personalized customer demand. The integration of digital technology into the manufacturing chain continues to optimize the manufacturing process. Supported by digital technology, Internet platforms have risen strongly. The new mode of offline and online integrated sales is born, which drives the upgrading of manufacturing products. The rapid development of intelligent supply through the integration of digital technology and supply chain, which helps accelerate the formation of a green and low-carbon supply system for the manufacturing industry [72]. The innovative integration of digital technology and service chain can stimulate service vitality and not only continuously improve the level of manufacturing input and output as services, but also promote the improvement of manufacturing efficiency [52,71]. Therefore, in this study, the manufacturing industry obtains resources from the environment of Internet big data to discharge production wastewater, waste gas and waste into the environment. At the same time, the environment is difficult to bear such changes, which in turn has an impact on manufacturing production activities. Therefore, the manufacturing industry takes corresponding measures to respond to environmental changes. This creates a PSR relationship between manufacturing and the environment.
(i) The pressure system (P) is mainly reflected by the manufacturing industry’s pressure on external ecological environment protection and internal performance improvement. The impact of social and economic activities in the manufacturing industry on the environment forms pressure on the ecological environment [73]. The degree of damage to the environment caused by the manufacturing industry in the research and development, production and sale of green products is also one of the reasons for the direct change of the environmental resource system [49,50]. At the same time, the economic characteristics of the manufacturing industry also become under pressure facing the development of the manufacturing industry [74]. The P system of digital green innovation development in the manufacturing industry is based on economic and social development, supplemented by energy consumption, output value and digital technology application.
(ii) The state system (S) is mainly reflected in the characteristics and changes of the manufacturing industry when its economic and social activities damage the ecological environment [75]. When the production and operation activities of the manufacturing industry damage the natural environment, the changes to the ecological environment affect the manufacturing economy. The production and operation activities of the manufacturing industry have positive and negative effects on the acquisition of environmental resources and the discharge of pollution [51,52]. From this point of view, this paper divides the S system index into the economic effect index and environmental effect index. The S system is represented by the state of innovation and development, supplemented by indicators, such as the ecological environment, scientific and technological innovation enterprises and achievements [76].
(iii) The response system (R) reflects the measures taken by the managers and decision-makers of digital green innovation development in the manufacturing industry to promote green development and innovation level [73,75]. The R system focuses on the application effect of innovation and development, supplemented by indicators of green development-related policies, investment and adoption of digital technologies [77]. Economic and social development will exert positive or negative pressure on the green innovation development system of the manufacturing industry [50,51,73,74,75]. Under the pressure, the system produces positive optimization feedback to the green innovation development of the manufacturing industry, and then promotes economic and social development [78]. Thus, the PSR system forms an effective dynamic cycle mechanism. Digital technologies such as the Internet, big data and artificial intelligence can enhance the speed and quality of cycles [69,70,71,72]. The development level measurement system of digital green innovation in the manufacturing industry based on the PSR model is proposed in this study, as shown in Figure 1.

2.2. Evaluation System

Based on the PSR model of digital green innovation, an evaluation index system for the development level of digital green innovation in the manufacturing industry was constructed. This process needs to follow the following principles [50,52,55,56,57,58,60].
(1) Scientific principle. Indicators should be fully integrated into the context of digital technologies such as artificial intelligence. From the perspective of the framework of the manufacturing green innovation system, the whole process of manufacturing green innovation should be presented scientifically. The level of green innovation in manufacturing can be shown in a very comprehensive way.
(2) Practical principle. The availability of data should be considered when establishing the indicator system of digital green innovation in manufacturing. These data can be obtained from the available statistics. The caliber of statistical data should be consistent to make the evaluation more operational and practical.
(3) Conducive to policy proposal. The purpose of this study is to find some problems existing in the process of the digital green innovation level of the manufacturing industry through evaluation, and according to the evaluation results, policy suggestions are put forward. The determination of evaluation indicators should be considered from the perspective of making policy suggestions.
(4) Principle of sustainable development. Sustainable development is a shift to cleaner, more efficient technologies that minimize the consumption of energy and other natural resources. The evaluation of manufacturing digital green innovation should be beneficial to the sustainable development of the manufacturing industry.
The whole process of digital green innovation in the manufacturing industry needs to be revealed in a circular perspective corresponding to PSR [79]. This cycle is a two-way interactive relationship among the dynamic mechanism, collaborative mechanism and safeguard mechanism of digital green innovation [73,74,75,76,80]. The dynamic mechanism of digital green innovation mainly induces the manufacturing industry to carry out digital green innovation activities [73]. The motivation involves the application degree of digital technology, the energy consumption structure and the regional economic level [80]. The collaborative mechanism of digital green innovation focuses on the development process of digital green innovation activities [74]. Digital green innovation should not only achieve high-level development at the technical level, but also take into account environmental regulation at the institutional level. To actively carry out the next digital green innovation activities, manufacturing enterprises must deal with the reasonable conversion between economic value, social value and ecological value in the safeguard mechanism [75,76]. Hence, the construction principles, theoretical analysis and literature review were combined to establish the evaluation index system in this study. The comprehensive evaluation index system of the digital green innovation level of the manufacturing industry based on the PSR model is shown in Table 1.
Table 1 shows pressure system indicators (dynamic mechanism), status system indicators (collaborative mechanism) and response system indicators (safeguard mechanism).
(1) Pressure system indicators (dynamic mechanism). In the pressure system, indicators related to the level of digital green innovation in the manufacturing industry were selected, including 5 indicators including per capital GDP, output value of comprehensive energy consumption, the application degree of artificial intelligence and other digital technologies. These indicators mainly represent the overall economic environment, resource environment, information environment and other conditions, which are all positive pressure indicators. The improvement of these factors can promote the development of digital green innovation in the whole manufacturing industry.
(2) Status system indicators (collaborative mechanism). The status system reflects the development status of digital green innovation in the manufacturing industry, including five secondary indicators, such as the number of patents applied per ten enterprises and the emission intensity of waste water/exhaust gas of 100 million yuan of output value. The emission intensity of waste water/waste gas of output value of 100 million yuan is a negative indicator, and the other three indicators are positive indicators. In the process of the transformation of innovation achievements, the manufacturing industry must solve the existing or potential environmental pollution problems and promote the high-quality development of regional economy and society by coordinating the relationship between manufacturing production activities and the environment.
(3) Response system indicators (safeguard mechanism). These indicators involve 5 indicators, including the full-time equivalent of R&D personnel, green development funds and the adoption of artificial intelligence and other digital technology funds, which are all positive indicators. Guided by government policies and financial support, it reflects the importance managers attach to the development of green innovation. This is helpful to reduce the energy consumption of the manufacturing industry and promote the improvement of the intelligent level of the manufacturing industry.

3. Methodology

3.1. Standardized Model

Due to the different trend of each evaluation index of green innovation level in the manufacturing industry, it is necessary to conduct a dimensionless standardized treatment for the index. x i j is the value of index j for region i . b i j represents the normalized, dimensionless standard data.
The original evaluation matrix R = ( x i j ) m × q should be normalized according to R , resulting in matrix R = ( b i j ) m × q .
For the benefit indicators, the standardization model of the indicator data is as follows:
b i j = x i j min { x 1 j , x 2 j , , x m j } max { x 1 j , x 2 j , , x m j } min { x 1 j , x 2 j , , x m j }
For the cost indicators, the standardization model of the indicator data is as follows:
b i j = max { x 1 j , x 2 j , , x m j } x i j max { x 1 j , x 2 j , , x m j } min { x 1 j , x 2 j , , x m j }

3.2. Weight Model

3.2.1. Deviation Maximization Model

Deviation maximization method is an objective method with the characteristics of focusing on the relationship between information. Under the condition that normalization and weight constraint principles are satisfied, dev ( b i j , b k j ) is set to represent the deviation between region b i and other regions for index b j . b i j and b k j are the j index value of the i and k region respectively. ω j is the weight of the j evaluation index. The deviation maximization method is used to calculate the index weight. The objective function is as follows:
dev ( ω j ) = i = 1 m k = 1 n dev ( b i j , b k j ) ω j
The determination of index weight is based on the principle of maximizing the total deviation of all regional evaluation indexes. The established linear programming model is as follows:
T : lop { maxdev ( ω ) = j = 1 q i = 1 m k = 1 m dev ( b i j , b k j ) ω j s . t . j = 1 q ω j 2 = 1 , ω j 0
The Lagrange function is used to solve T , and the result is as follows:
L ( ω j , ξ ) = j = 1 n i = 1 m k = 1 m dev ( b i j , b k j ) ω j + 1 2 ξ ( j = 1 n ω 2 1 )
Partial derivatives of ω j and ξ are solved, respectively, and the optimal solution ω of the model is obtained as follows:
ω = i = 1 m j = 1 q dev ( b i j , b k j ) j = 1 q [ i = 1 m k = 1 m dev ( b i j , b k j ) ] 2
Formula (6) is normalized and result ω j is as follows:
ω j = i = 1 m k = 1 m dev ( b i j , b k j ) j = 1 q i = 1 m k = 1 m dev ( b i j , b k j )

3.2.2. Analytic Hierarchy Process

The analytic hierarchy process (AHP) is a subjective weighting method with strong applicability and operability. In this study, the AHP method is used to compare various elements under the same criteria layer.
(1) The comparative judgment matrix of digital green innovation criteria can be expressed as follow:
A = [ a 11 a 12 a 13 L a 1 n a 21 a 22 a 23 L a 2 n a 31 a 32 a 33 L a 3 n M M M M M a n 1 a n 2 a n 3 L a n n ] = { a i j }
a i j ( a i j > 0 ) is the relative importance. Saaty 1–9 contrast scale was used to measure the significance of digital green innovation criteria. The ruler is shown in Table 2.
(2) The weight set was calculated and the consistency test was conducted. These steps are as follows.
(i) Each row element was multiplied separately. The results can be expressed as follows:
M i = j = 1 n a i j ,   i = 1 , 2 , , n
(ii) Taking the n -th root of M i , the results can be expressed as follows:
W i ¯ = M i n ,   i = 1 , 2 , , n
(iii) Performing consistency processing on W i ¯ , the results can be expressed as follows:
w i = W i ¯ i = 1 n W i ¯ ,   i = 1 , 2 , , n
w i is the weight of i .
(iv) Consistency test.
λ max = i = 1 n ( A W ) i n W i
C I = ( λ max n ) ( n 1 )
C I is the consistency criterion. It should be compared with random consistency criterion R I . Random consistency ratio can be expressed as follows:
C R = C I R I
R I values are shown in Table 3.
When C R   <   0.1 , the judgment matrix is consistent. Otherwise, it should be re-adjured.
(v) The consistency test steps of combined weights are as follows:
C I = j = 1 m W j C I j
W j is the weight set of the j t h criterion layer. C I j is the C I of the comparison judgment matrix corresponding to the index of the j t h criterion layer.
R I = j = 1 m W j R I j
R I j is the random consistency criterion corresponding to the j t h criterion layer. C R   <   0.1 means that the result is consistent. Otherwise, it should be re-adjured.

3.2.3. Combination Weighting Model

The index weight w j under AHP method and the index weight ω j under deviation maximization method are introduced into the two-parameter model to determine the comprehensive weight of the index. The Euclidean distance between subjective weight and objective weight is calculated as follows:
d = ( w j , ω j ) = j = 1 q ( w j ω j ) 2
α and β represent the weight preference coefficients of AHP method and deviation maximization method, respectively. The actual weight w after correction can be expressed as follows:
w j = α w j + β ω j
In Equation (18), α and β satisfy the following constraint conditions:
d 2 ( w j , ω j ) = ( α β ) 2
α + β = 1
Equations (19) and (20) satisfy α 0 and β 0 .

3.3. TOPSIS Model

The TOPSIS model is an evaluation method that is applicable to multiple indexes and compares multiple regions. The core of this method is to determine the positive ideal solution and negative ideal solution of each index. Positive ideal is the optimal value of the idea, and each attribute value meets the highest value of digital green innovation development. The negative ideal solution is the worst assumed value, and each attribute value satisfies the lowest value of digital green innovation development. Finally, the level of green innovation in manufacturing figures can be obtained according to the weighted Euclidean distance formula.
(i) Positive and negative ideal values of the digital green innovation level in the manufacturing industry can be expressed as follows:
Y j + = max 1 i m { w j × b i j } , Y j = min 1 i m { w j × b i j }
Thus, the positive ideal solution and the negative ideal solution of the development level of digital green innovation in the manufacturing industry can be expressed as Y + = ( Y 1 + , Y 2 + , , Y m + ) and Y = ( Y 1 , Y 2 , , Y m ) .
(ii) d i + and d i are the Euclidean distance between the score of region i and the positive ideal score and the negative ideal score can be expressed as follows:
d i + = ( Y 1 + Y 1 i ) 2 + + ( Y m + Y m i ) 2 , d i = ( Y 1 Y 1 i ) 2 + + ( Y m Y m i ) 2
(iii) The relative closeness between the development level score of manufacturing digital green innovation and the positive ideal score can be expressed as follows:
C i = d i / ( d i + + d i )
The higher the C i value is, the higher the level of digital green innovation in the manufacturing industry is.

4. Empirical Results and Discussion

4.1. Determination of Index Weight

As the core of the Beijing–Tianjin–Hebei coordinated development, Baoding’s high-quality development not only affects the transformation and upgrading of the region, but also plays a key role in building the Xiongan New Area. However, Baoding’s environmental pollution, such as dust and PM2.5, is still higher than the national average. The manufacturing industry in Baoding has some problems such as ecological environment pollution and resource waste. The comprehensive implementation of green manufacturing is one of the current important strategic tasks of Baoding city but is also the only way to develop into a strong manufacturing city. The implementation opinions of the Baoding Municipal People’s Government on promoting the integrated development of manufacturing and the Internet clearly points out that the development of digital technologies such as industrial Internet infrastructure, industrial Ethernet and 5G should be further strengthened. Enterprises should be supported to demonstrate the innovative application of the industrial Internet. However, there are still some problems in the green development of the manufacturing industry. In terms of energy consumption, although the proportion of new energy in Baoding increased somewhat in 2020, coal is still the main energy consumption, and strengthening the green and clean coal is an important means. Green development should be the top priority. How to improve the development level of digital green innovation of the manufacturing industry in Baoding is an urgent problem to be solved.
In this study, 21 districts, cities and counties under the jurisdiction of Baoding City (excluding other regions in consideration of the availability of data) were identified as research objects. The digital green innovation level of Baoding’s manufacturing industry from 2015 to 2019 was measured. Data for the study came from Baoding Economic Statistics Yearbook, Statistical Bulletin of National Economic and Social Development, and Baoding Environmental Quality Bulletin. Equations (3)–(20) were used to measure the weight of each index in the index system. The calculation results of the PSR index weight are shown in Table 4.
As shown in Table 4, the pressure system indicators, the output value of comprehensive energy consumption, the GDP per ten enterprises, and the application degree of 5G and other digital technologies in enterprises play a significant role. This shows that these three factors are important factors affecting the dynamic mechanism of digital green innovation in manufacturing enterprises. In particular, the degree of adoption of digital technology is very much in line with its current importance in green innovation activities in manufacturing. The emission intensity of waste water and exhaust gas with an output value of 100 million yuan are the important factors affecting the synergy of digital green innovation in manufacturing enterprises. The reason is that digital green innovation ultimately brings not only the improvement of enterprise performance, but also the improvement of the enterprise’s ecological environment. The results of environmental improvement can be measured in terms of the intensity of wastewater and waste discharge. Among the indicators of the response system, the expenditure on green development per 10 enterprises and the intensity of the expenditure on the adoption of 5G and other digital technologies play an important role. This indicates that manufacturing enterprises should actively carry out green innovation activities and apply digital technology to comply with the trend of the low carbon environment and digital environment. The improvement of these two factors will help manufacturing enterprises solve the pressure and coordination problems to provide guarantees for further digital green innovation.

4.2. Comprehensive Results and Discussion

The established method based on AHP, deviation maximization and TOPSIS was used to calculate the comprehensive evaluation results. The comprehensive evaluation results of the level of digital green innovation in Baoding’s manufacturing industry from 2015 to 2019 are shown in Table 5.
As can be seen from Table 5, from 2015 to 2019, the comprehensive index of the development level of digital green innovation in the manufacturing industry of Baoding generally showed a trend of fluctuating rise. However, Li, Shunping and Boye counties showed a trend of fluctuation and decline. The reason is that the innovation input and output of the manufacturing industry in these regions are less, which leads to the poor effect of innovation-driven development in these regions. Each region has an overall low and unbalanced phenomenon, but there is also a certain gap. However, the gap decreased from 0.1320 to 0.1187, showing a gradually narrowing trend. This shows that with the development of digital technology and the concept of green innovation in the manufacturing industry, the development strategy of digital green innovation in the manufacturing industry of Baoding has been deeply implemented and achieved initial results. From the perspective of development speed, the comprehensive index of digital green innovation in the manufacturing industry in Qingyuan District, Laishui County, Tang County, Yi County and Quyang County is rising rapidly. The development level of digital green innovation in the manufacturing industry has not only made great progress, higher than or close to the average level, but is also narrowing the gap with other regions.

4.3. PSR Results and Discussion

The calculation results of the pressure indicator index, status indicator index, response indicator index and composite indicator index of the digital green innovation in the manufacturing industry are shown in Table 6.
As shown in Table 6, the maximum value, minimum value and average value of the comprehensive index of the digital green innovation in the manufacturing industry in Baoding city are 0.6290, 0.1229 and 0.2907, respectively. Five districts were above average, and the remaining 16 were below average. There is a serious imbalance in the comprehensive development index of Baoding city. The comprehensive development index is the strongest in the Lianchi District, followed by Zhuozhou City and High-tech Zone. Qingyuan District, Quyang County and Mancheng District are in a backward position.
Pressure index (P) mainly reflects the influence of social and economic activities in Baoding on the development of the digital green innovation in the manufacturing industry in the context of 5G, artificial intelligence and other digital technologies. The pressure index of Lianchi District, Zhuozhou City, Anguo City, Gaobeidian City and High-tech Zone ranked first. These regions have developed economies and are typical regions of the digital green development and innovation capability enhancement in the manufacturing industry. In terms of GDP per capital, number of enterprises with R&D activities and GDP per ten enterprises, it has obvious advantages over the other regions, and the pressure index is relatively high.
Status index (S) reflects the status of the digital green innovation in the manufacturing industry in Baoding city. The state index ranks at the top of the Lianchi District, Xushui District, Zhuozhou City, Anguo City and High-tech Zone. Compared with other regions, these regions are located in economically developed regions with a higher overall level of green and innovative development. The improvement of the overall green environment in the region has attracted more high-tech enterprises and foreign-funded enterprises to invest here. This has led to a lot of R&D projects and patents, which have helped produce a lot of high-tech new products. The improvement of science and technology has improved the efficiency of resource use and reduced energy consumption per unit. This has enhanced the digital green innovation development capacity of the manufacturing industry in these regions.
Response index (R) reflects the measures taken by the green innovation managers and decision makers in Baoding to improve the natural environment, green development and the innovative development level of the manufacturing industry. Laishui County, Laishui County, Zhuozhou City and Hi-tech Zone are near the top of the response index. Although the economic level of some regions is not high, R&D expenditure, new product development expenditure and R&D personnel investment have been constantly increased to maintain strong economic growth and promote the development of green innovation. In addition, information infrastructure construction is vigorously promoted to promote green innovation activities in the manufacturing industry. This makes the response index of these areas relatively high.
Table 7 is the classification table of the comprehensive response index. Compared with other regions, the composite index of the regions with a better ecological environment in the east and a more developed economy in the north is generally higher. State parameters are higher than pressure and response parameters in most areas. The status index of Anguo City and High-tech Zone is 4.7 times and 2.5 times of the response index, respectively. The reason is that there is an imbalance between the emission intensity of waste water and the emission intensity of waste gas. Compared with other regions, the composite index of western and southern parts of Baoding city is lower, and the parameters of pressure, state and response are basically coordinated.

4.4. PSR Importance and Its Evolution

In this study, the optimization direction of the development of the digital green innovation in the manufacturing industry of Baoding should be clarified. In order to improve the optimization efficiency of the digital green innovation development of the manufacturing industry in Baoding city, the relative importance of PSR and its evolution of the digital green innovation development of the manufacturing industry in Baoding city are further revealed in this study. The importance and evolution of PSR from 2015 to 2019 are shown in Figure 2.
As can be seen from Figure 2, the pressure index (P) with the highest weight in PSR in 2015 reached 0.3440. The weight of status index (S) is 0.3297, and the proportion of response index (R) is the smallest. In 2019, the weight value of status index (S) became the maximum value in PSR, reaching 0.3414. Stress index (P) weight dropped to 0.3135, ranking last. The response index (R) rose to second place from third place in 2018. In recent years, policies related to the digital green innovation and development of the manufacturing industry, such as the 14th Five-Year Plan of National Economic and Social Development of Baoding city and the Outline of 2035 Vision Goal, 5G Development Plan of Baoding City and Eco-environmental Protection Plan of Beijing-Tianjin-Hebei Coordinated Development, have been put forward. In these policies, environmental quality, total quantity control, ecological construction, environmental facilities construction and other aspects are strengthened to enhance environmental protection. At the same time, all kinds of manufacturing enterprises in Baoding city combine digital technology to research and develop the existing green new products, and constantly increase and improve the quantity and quality of green new products. Based on the above analysis, the following countermeasures are put forward to promote the development of the digital green innovation in the manufacturing industry based on PSR.
(i) In terms of pressure index, the good development trend of digital green economy in the northern region should be maintained to continuously promote the construction of Xiongan New Area. Advanced manufacturing should be vigorously developed to promote the transformation and upgrading of traditional industries. A modern manufacturing system with distinctive features, reasonable structure, spatial intensiveness, environmental friendliness, interactive integration and high efficiency should be accelerated.
(ii) In terms of state index, air pollutants and greenhouse gases should be coordinated and promoted to achieve synergistic effects of pollution reduction and carbon reduction. This requires regional development to thoroughly implement the strategy of green innovation-driven green development and adhere to the transformation and application of scientific and technological achievements. Innovation ecology should be optimized to build a digital green innovation system with enterprises as the main body and the market as the guidance and the deep integration of enterprises, universities and research institutes.
(iii) In terms of response index, the construction of information infrastructure should be further strengthened. Policy preference should be given to technological innovation, education and green development. Manufacturing enterprises should be guided to actively develop green, innovative and high-tech projects. Government support is being used to try to compensate for the uneven development between the north and south. Digital industrialization and industry digitization should be promoted. The digitalization level of key manufacturing industries should be greatly enhanced to build digital green cities and achieve comprehensive index improvement.

5. Conclusions and Implication

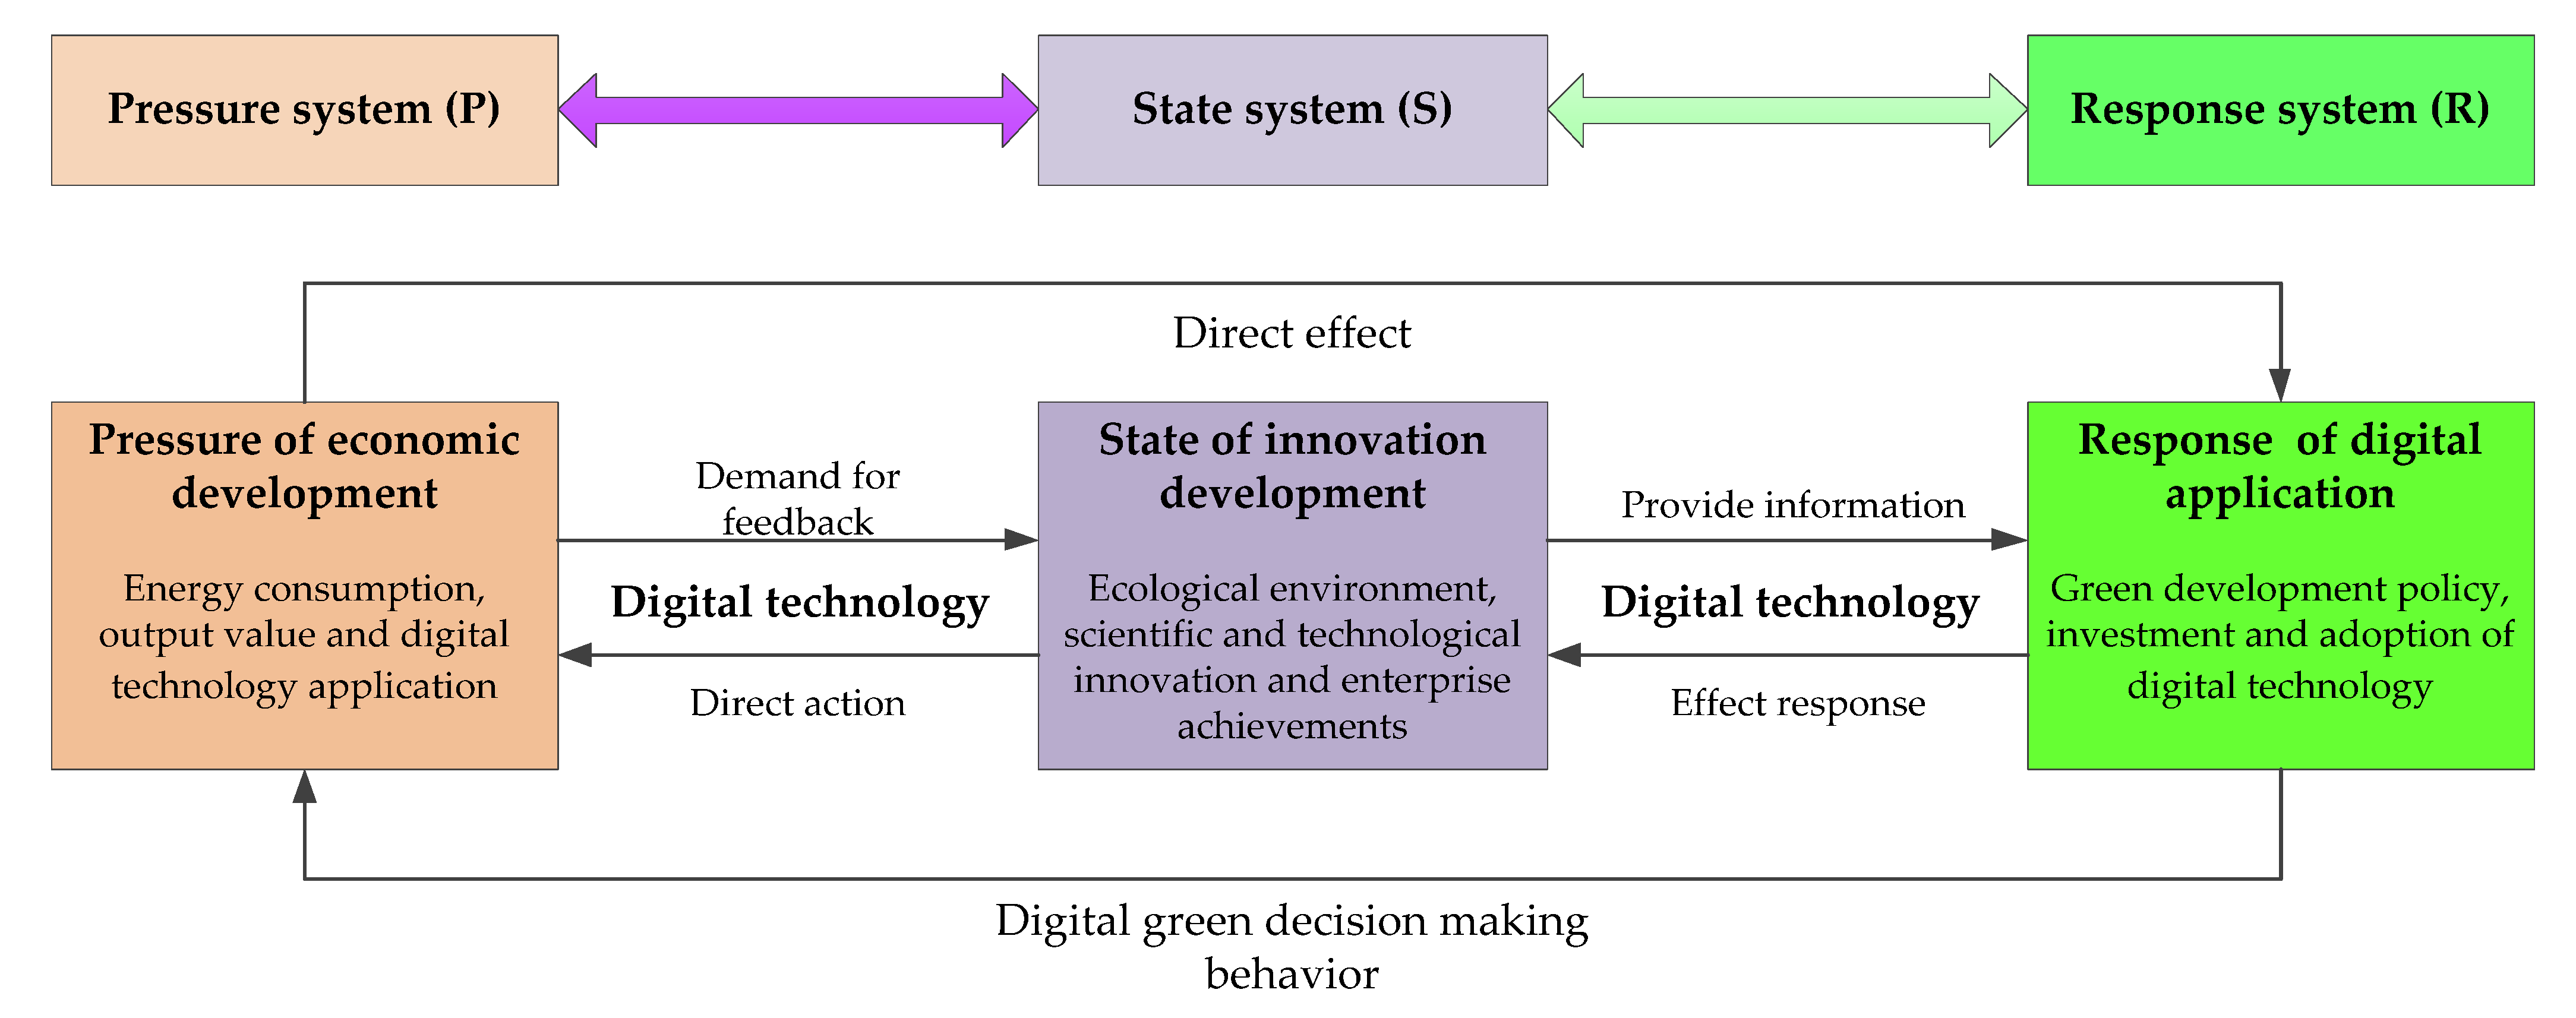
The development of intelligent and green manufacturing driven by digital innovation has become an important strategic support to promote high-quality economic development. The development capability and level of digital green innovation play an important role in promoting the high-quality development of the manufacturing industry. With the background of resource constraint tightening, ecological environment degradation and digital technology development, resource environment and digital technology are incorporated into manufacturing innovation systems to measure the quality of the digital green innovation in the manufacturing industry. In this study, the evaluation index system of the digital green innovation level in the manufacturing industry was constructed based on the PSR model framework. The 21 districts, cities and counties under the jurisdiction of Baoding city were selected as the research object to carry out quantitative evaluation and comprehensive comparative analysis. On this basis, specific policies and suggestions were put forward to comprehensively improve the development of the digital green innovation in Baoding’s manufacturing industry.
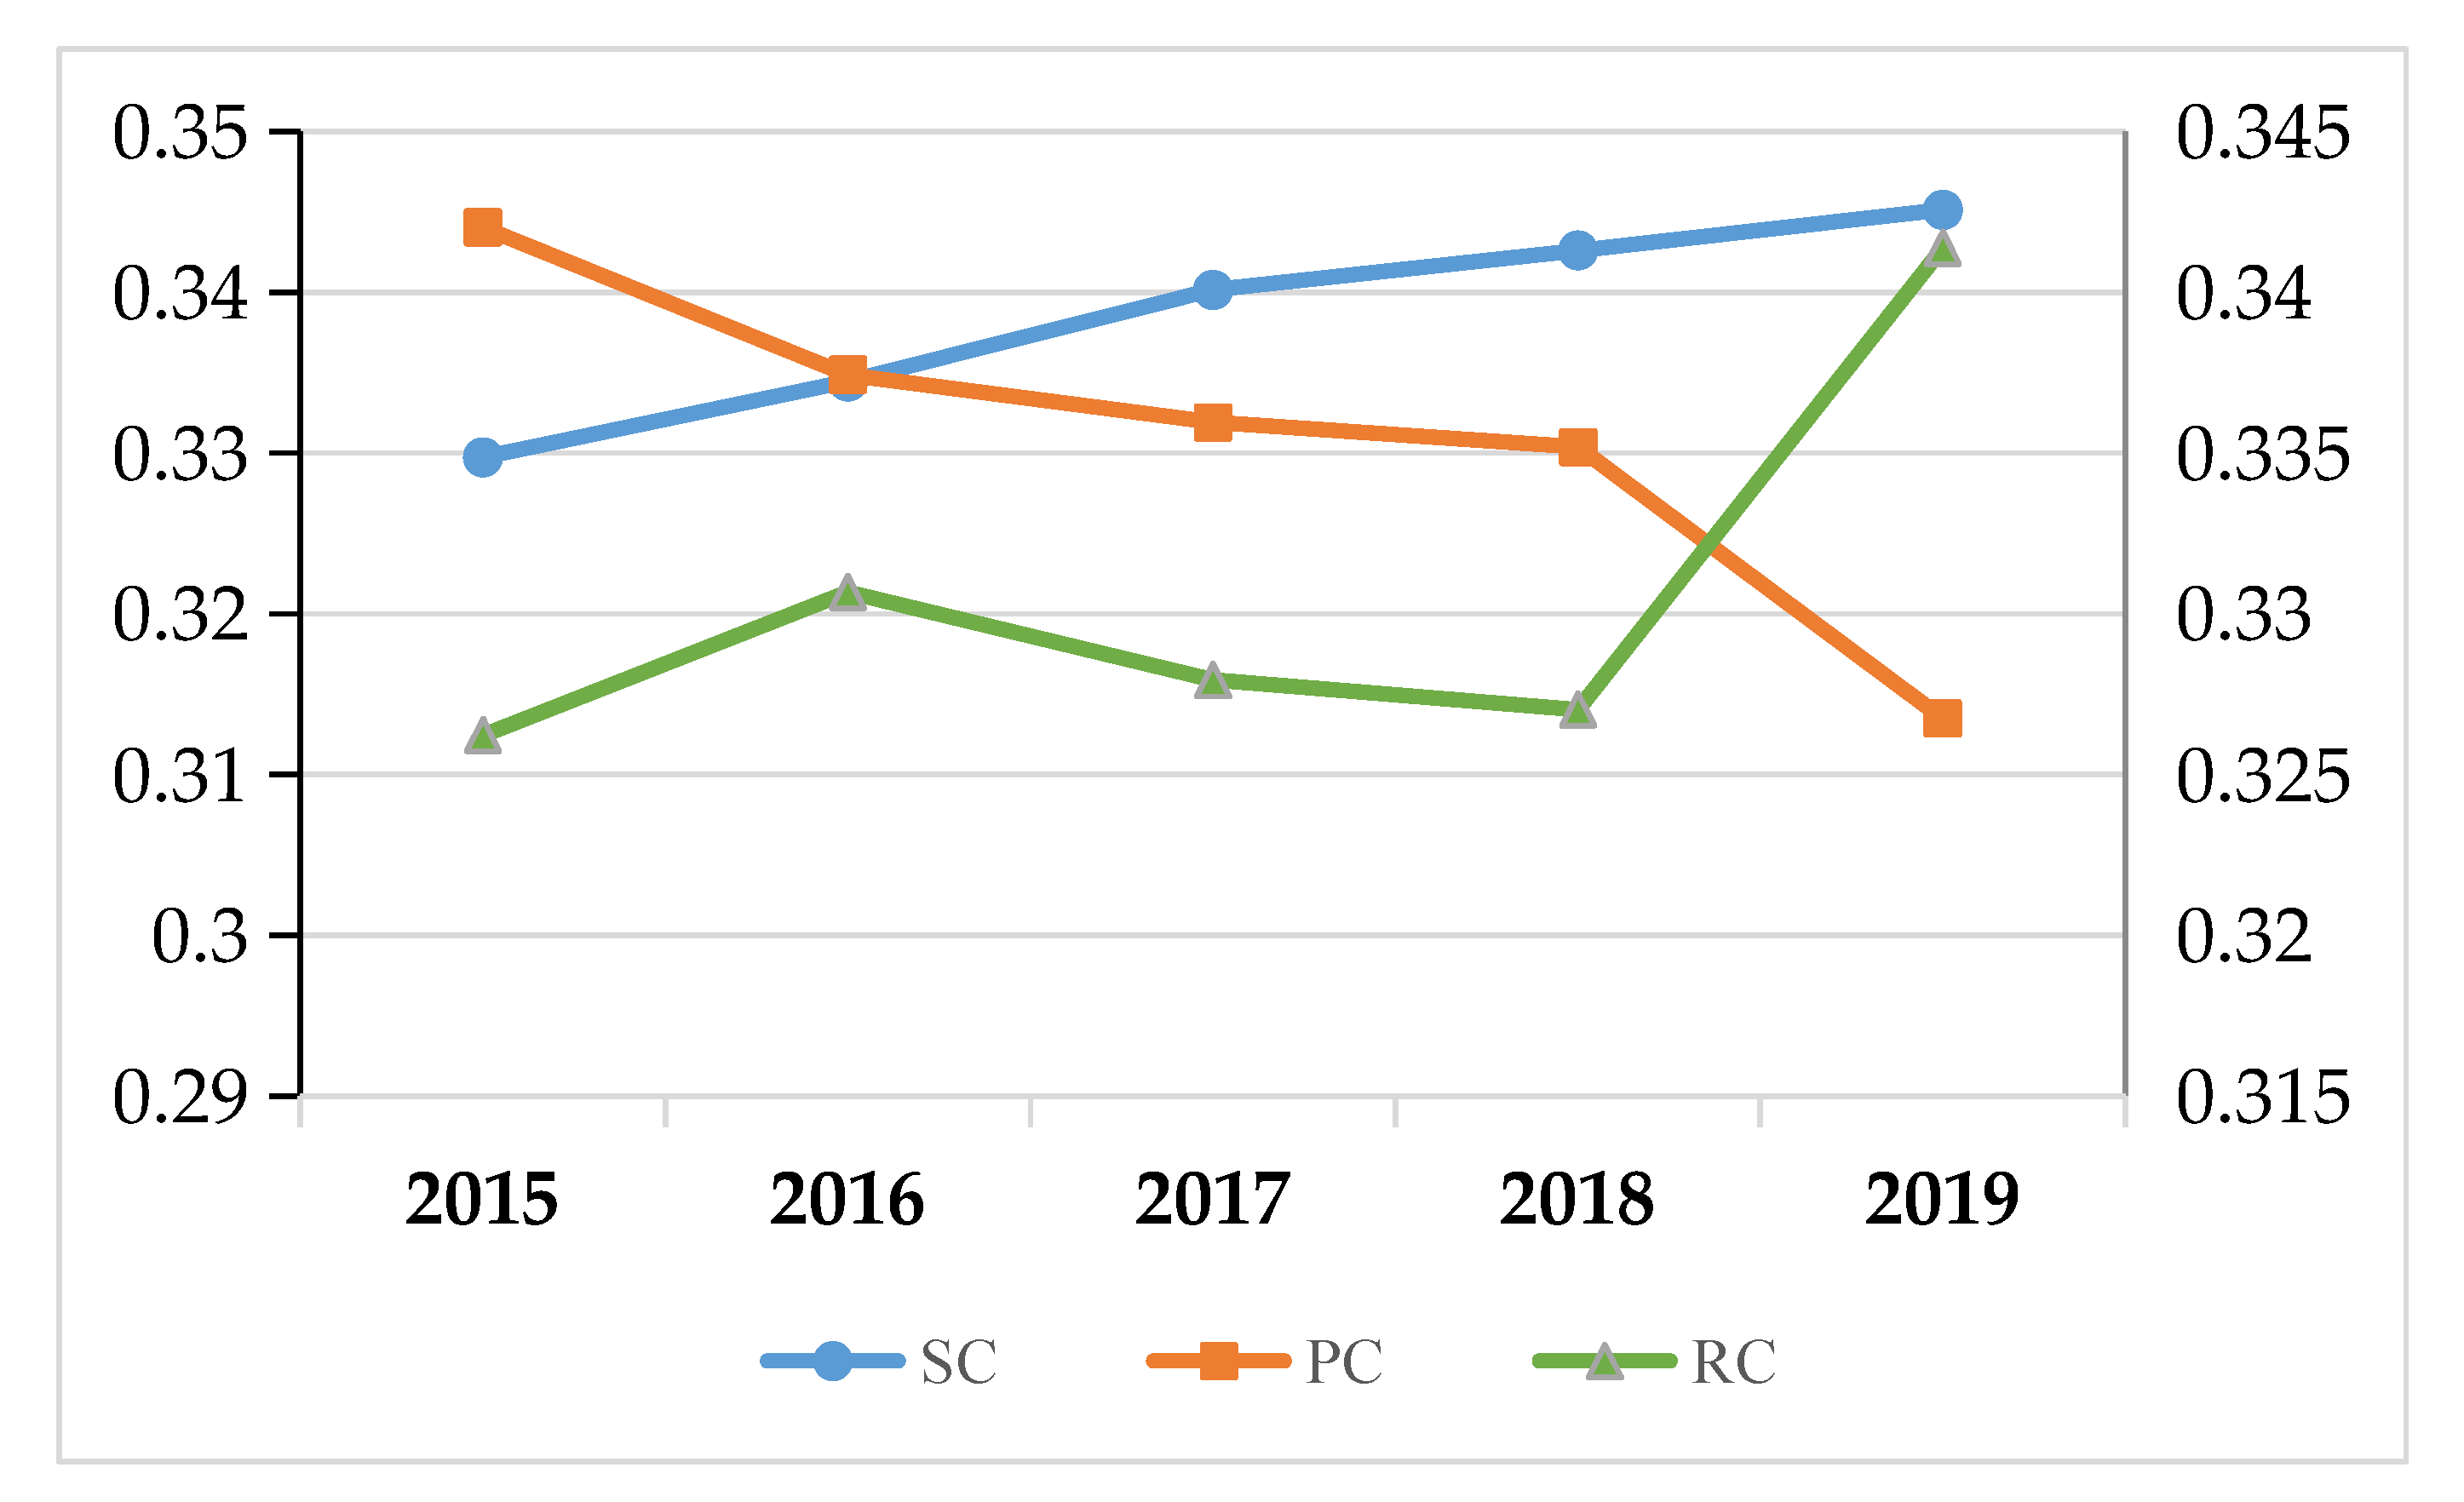
The results of this study are as follows. (i) The measurement system of the development level of the digital green innovation in the manufacturing industry includes pressure system (P), state system (S) and response system. This system can be widely applied to research on the development level of the digital green innovation in the manufacturing industry. (ii) From 2015 to 2019, the comprehensive index of the development level of the digital green innovation in the manufacturing industry generally showed a trend of fluctuating rise. Each region has an overall low and unbalanced phenomenon, but also there is a certain gap. However, the gap decreased from 0.1320 to 0.1187, showing a gradually narrowing trend. (iii) Compared with other regions, the composite index of the regions with better ecological environments in the east and more developed economies in the north is generally higher. State parameters are higher than pressure and response parameters in most areas. Compared with other regions, the composite index of the western and southern regions was lower. The parameters of pressure, state and response are basically coordinated. In the future, local governments should strengthen the indicators of the development status index of the digital green innovation in the manufacturing industry. (iv) The application degree of digital technology such as artificial intelligence, the emission intensity of waste water/exhaust gas of output value of one hundred million yuan, and the expenditure intensity of digital technology such as artificial intelligence adopted by enterprises are the key influencing factors of the digital green innovation in the manufacturing industry.
The academic contribution of this study are as follows. In this study, the measurement system of the digital green innovation level in the manufacturing industry based on the PSR model was proposed. The pressure system is based on economic and social development, supplemented by energy consumption, output value and digital technology application. The state system is represented by the state of innovation and development, supplemented by indicators such as ecological environment, scientific and technological innovation enterprises and achievements. The response system focuses on the application effect of innovation and development, supplemented by indicators of green development-related policies, investment and adoption of digital technologies. The whole process of the digital green innovation in the manufacturing industry needs to be revealed in a circular perspective corresponding to PSR. This cycle is a two-way interactive relationship among the dynamic mechanism, collaborative mechanism and safeguard mechanism of digital green innovation. The dynamic mechanism involves the application degree of digital technology, energy consumption structure and regional economic level. The collaborative mechanism should not only achieve high-level development at the technical level, but also take into account environmental regulation at the institutional level. Manufacturing enterprises must deal with the reasonable conversion between economic value, social value and ecological value in the safeguard mechanism.
The practical implications of this study are as follows. Advanced manufacturing should be vigorously developed to promote the transformation and upgrading of traditional industries. Innovation ecology should be optimized to build a digital green innovation system with enterprises as the main body and the market as the guidance and the deep integration of enterprises, universities and research institutes. Digital industrialization and industry digitization should be promoted by government support. The digitalization level of key manufacturing industries should be greatly enhanced to achieve comprehensive index improvement. This study verifies that the established evaluation index system and evaluation model of the digital green innovation development in the manufacturing industry are very scientific and reasonable and have practical application value.
Although this study achieves this goal, there is still room for improvement in the evaluation index system and evaluation methods. In terms of the evaluation index system, the digital transformation and globalization trend of the manufacturing industry have not been fully included in the evaluation index. Digital transformation not only emphasizes the application degree of digital technology, but also emphasizes the improvement of enterprise’s digital transformation performance. Therefore, performance related indicators brought by digital technology can be integrated into the evaluation index system in future research. At the same time, manufacturing globalization risk control should also be fully considered in the process of digital green innovation. In terms of evaluation methods, the evaluation method considering the order of pros and cons in this study is suitable for regional comparative evaluation. The evaluation of manufacturing digital green innovation based on time and space can be characterized by the kernel density function and spatial econometric model. In addition, artificial intelligence techniques such as data mining and fuzzy mathematics [82] can also be integrated into evaluation methods.

Author Contributions

Conceptualization, S.Y. and N.Z.; methodology, S.Y.; software, S.G.; validation, S.Y. and N.Z.; writing—original draft preparation, S.Y.; writing—review and editing, S.Y., N.Z. and K.U. All authors have read and agreed to the published version of the manuscript.

Funding

The authors are thankful to the office of Research, Innovation, and Commercialization (ORIC) of Riphah International University Lahore for supporting this research under the project: Riphah-ORIC-21-22/FEAS-20. This research was funded by Philosophy and Social Sciences Planning Project of the Ministry of Education grant number [21YJCZH203], Soft Science Special Project of Hebei Innovation Capability Enhancement Program grant number [21557635D], Social Science Fund project of Hebei Province grant number [HB21YJ003], Top Young Talents Scientific Research Project of Higher Education in Hebei Province grant number [BJ2021084], Baoding Philosophy and Social Science Planning Project grant number [2020047], Teaching and Research Project of Hebei Agricultural University grant number [2021C-39], and Scientific Research Foundation for the Talents of Hebei Agricultural University grant number [YJ2020017], Heilongjiang University Special Fund Project [2020-KYYWF-0969], Philosophy and Social Science research Planning project of Heilongjiang Province [20JYB030], Hebei Agricultural Industry System Project [HBCT2021230301].

Institutional Review Board Statement

Not applicable.

Informed Consent Statement

Not applicable.

Data Availability Statement

The data presented in this study are available on request from the corresponding author.

Conflicts of Interest

The authors declare no conflict of interest.

References

  1. Liu, D.; Yang, D.; Huang, A. Leap-based greenhouse gases emissions peak and low carbon pathways in China’s tourist industry. Int. J. Environ. Res. Public Health 2021, 18, 1218. [Google Scholar] [CrossRef] [PubMed]
  2. Li, B.; Yu, J.; Huang, L.; Li, J.; Luo, C. Coupling Development of Manufacturing Promotion and Innovation in China. SAGE Open 2021, 11, 21582440211047578. [Google Scholar] [CrossRef]
  3. Tian, H.N.; Li, J.B. Research on the evolution of green technology innovation capability in manufacturing industry based on industry heterogeneity: Also on the impact of R&D investment. Sci. Technol. Prog. Policy 2020, 37, 63–72. [Google Scholar]
  4. Cavalieri, A.; Reis, J.; Amorim, M. Circular economy and internet of things: Mapping science of case studies in manufacturing industry. Sustainability 2021, 13, 3299. [Google Scholar] [CrossRef]
  5. Du, X.; Shen, L.; Wong, S.W.; Meng, C.; Cheng, G.; Yao, F. MBO based indicator-setting method for promoting low carbon city practice. Ecol. Indic. 2021, 128, 107828. [Google Scholar] [CrossRef]
  6. Zhu, Y.; Du, W.; Zhang, J. Does industrial collaborative agglomeration improve environmental efficiency? Insights from China’s population structure. Environ. Sci. Pollut. Res. 2021, 29, 5072–5091. [Google Scholar] [CrossRef]
  7. Liang, Y.M. Optimization and Upgrading of traditional manufacturing industry: Review of the 13th Five-Year Plan and Prospect of the 14th Five-year Plan. Contemp. Econ. Manag. 2021, 43, 7–15. [Google Scholar]
  8. Kniazieva, O. Digital Development of economy and society under influence of COVID-19. Sci. Innov. 2021, 17, 42–53. [Google Scholar] [CrossRef]
  9. Liu, Q.; Leng, J.; Yan, D.; Zhang, D.; Wei, L.; Yu, A.; Chen, X. Digital twin-based designing of the configuration, motion, control, and optimization model of a flow-type smart manufacturing system. J. Manuf. Syst. 2021, 58, 52–64. [Google Scholar] [CrossRef]
  10. Pan, W.; Xie, T.; Wang, Z.; Ma, L. Digital economy: An innovation driver for total factor productivity. J. Bus. Res. 2022, 139, 303–311. [Google Scholar] [CrossRef]
  11. Yin, S.; Zhang, N.; Dong, H. Preventing COVID-19 from the perspective of industrial information integration: Evaluation and continuous improvement of information networks for sustainable epidemic prevention. J. Ind. Inf. Integr. 2020, 19, 100157. [Google Scholar] [CrossRef] [PubMed]
  12. Okano, M.T.; Antunes, S.N.; Fernandes, M.E. Digital transformation in the manufacturing industry under the optics of digital platforms and ecosystems. Indep. J. Manag. Prod. 2021, 12, 1139–1159. [Google Scholar] [CrossRef]
  13. El-Kassar, A.N.; Singh, S.K. Green innovation and organizational performance: The influence of big data and the moderating role of management commitment and HR practices. Technol. Forecast. Soc. Chang. 2019, 144, 483–498. [Google Scholar] [CrossRef]
  14. Yin, S.; Zhang, N.; Xu, J. Information fusion for future COVID-19 prevention: Continuous mechanism of big data intelligent innovation for the emergency management of a public epidemic outbreak. J. Manag. Anal. 2021, 8, 391–423. [Google Scholar] [CrossRef]
  15. Blichfeldt, H.; Faullant, R. Performance effects of digital technology adoption and product & service innovation–A process-industry perspective. Technovation 2021, 105, 102275. [Google Scholar] [CrossRef]
  16. He, B.; Bai, K.J. Digital twin-based sustainable intelligent manufacturing: A review. Adv. Manuf. 2021, 9, 1–21. [Google Scholar] [CrossRef]
  17. Srinivasan, N.; Eden, L. Going digital multinationals: Navigating economic and social imperatives in a post-pandemic world. J. Int. Bus. Policy 2021, 4, 228–243. [Google Scholar] [CrossRef]
  18. Feroz, A.K.; Zo, H.; Chiravuri, A. Digital transformation and environmental sustainability: A review and research agenda. Sustainability 2021, 13, 1530. [Google Scholar] [CrossRef]
  19. Yoo, Y.; Boland, R.J., Jr.; Lyytinen, K.; Majchrzak, A. Organizing for innovation in the digitized world. Organ. Sci. 2012, 23, 1398–1408. [Google Scholar] [CrossRef]
  20. Jahanmir, S.F.; Silva, G.M.; Gomes, P.J.; Gonçalves, H.M. Determinants of users’ continuance intention toward digital innovations: Are late adopters different? J. Bus. Res. 2020, 115, 225–233. [Google Scholar] [CrossRef]
  21. Wang, Q.; Su, M.; Zhang, M.; Li, R. Integrating digital technologies and public health to fight COVID-19 pandemic: Key technologies, applications, challenges and outlook of digital healthcare. Int. J. Environ. Res. Public Health 2021, 18, 6053. [Google Scholar] [CrossRef] [PubMed]
  22. Velez, F.F.; Colman, S.; Kauffman, L.; Ruetsch, C.; Anastassopoulos, K. Real-world reduction in healthcare resource utilization following treatment of opioid use disorder with reSET-O, a novel prescription digital therapeutic. Expert Rev. Pharm. Outcomes Res. 2021, 21, 69–76. [Google Scholar] [CrossRef] [PubMed]
  23. Ramdani, B.; Raja, S.; Kayumova, M. Digital innovation in SMEs: A systematic review, synthesis and research agenda. Inf. Technol. Dev. 2022, 28, 56–80. [Google Scholar] [CrossRef]
  24. Bogers, M.L.; Garud, R.; Thomas, L.D.; Tuertscher, P.; Yoo, Y. Digital innovation: Transforming research and practice. Innovation 2021, 24, 4–12. [Google Scholar] [CrossRef]
  25. Berger, E.S.; von Briel, F.; Davidsson, P.; Kuckertz, A. Digital or not-The future of entrepreneurship and innovation: Introduction to the special issue. J. Bus. Res. 2021, 125, 436–442. [Google Scholar] [CrossRef]
  26. Wiesböck, F.; Hess, T. Digital innovations. Electron. Mark. 2020, 30, 75–86. [Google Scholar] [CrossRef] [Green Version]
  27. Gil-Gomez, H.; Guerola-Navarro, V.; Oltra-Badenes, R.; Lozano-Quilis, J.A. Customer relationship management: Digital transformation and sustainable business model innovation. Econ. Res.-Ekon. Istraživanja 2020, 33, 2733–2750. [Google Scholar] [CrossRef] [Green Version]
  28. Jocevski, M. Blurring the lines between physical and digital spaces: Business model innovation in retailing. Calif. Manag. Rev. 2020, 63, 99–117. [Google Scholar] [CrossRef]
  29. Nagaraj, V. How Product Managers Use Senseshaping to Drive the Front-end of Digital Product Innovation: The five senseshaping practices presented here can help product managers recognize, interpret, and respond appropriately to new information in the front-end of digital innovation. Res.-Technol. Manag. 2022, 65, 29–40. [Google Scholar]
  30. Soluk, J. Organisations’ Resources and External Shocks: Exploring Digital Innovation in Family Firms. Ind. Innov. 2022, 1–33. [Google Scholar] [CrossRef]
  31. Zhen, Z.; Yousaf, Z.; Radulescu, M.; Yasir, M. Nexus of digital organizational culture, capabilities, organizational readiness, and innovation: Investigation of SMEs operating in the digital economy. Sustainability 2021, 13, 720. [Google Scholar] [CrossRef]
  32. Palmié, M.; Miehé, L.; Oghazi, P.; Parida, V.; Wincent, J. The evolution of the digital service ecosystem and digital business model innovation in retail: The emergence of meta-ecosystems and the value of physical interactions. Technol. Forecast. Soc. Chang. 2022, 177, 121496. [Google Scholar] [CrossRef]
  33. Caldera, S.; Mostafa, S.; Desha, C.; Mohamed, S. Exploring the Role of Digital Infrastructure Asset Management Tools for Resilient Linear Infrastructure Outcomes in Cities and Towns: A Systematic Literature Review. Sustainability 2021, 13, 11965. [Google Scholar] [CrossRef]
  34. Beltagui, A.; Rosli, A.; Candi, M. Exaptation in a digital innovation ecosystem: The disruptive impacts of 3D printing. Res. Policy 2020, 49, 103833. [Google Scholar] [CrossRef]
  35. Seitz, M.; Gehlhoff, F.; Cruz Salazar, L.A.; Fay, A.; Vogel-Heuser, B. Automation platform independent multi-agent system for robust networks of production resources in industry 4.0. J. Intell. Manuf. 2021, 32, 2023–2041. [Google Scholar] [CrossRef]
  36. Liu, Z.; Sampaio, P.; Pishchulov, G.; Mehandjiev, N.; Cisneros-Cabrera, S.; Schirrmann, A.; Bnouhanna, N. The architectural design and implementation of a digital platform for Industry 4.0 SME collaboration. Comput. Ind. 2022, 138, 103623. [Google Scholar] [CrossRef]
  37. Desouza, K.C.; Dombrowski, C.; Awazu, Y.; Baloh, P.; Papagari, S.; Jha, S.; Kim, J.Y. Crafting organizational innovation processes. Innovation 2009, 11, 6–33. [Google Scholar] [CrossRef]
  38. Kohli, R.; Melville, N.P. Digital innovation: A review and synthesis. Inf. Syst. J. 2019, 29, 200–223. [Google Scholar] [CrossRef] [Green Version]
  39. Majchrzak, A.; Shepherd, D.A. Can digital innovations help reduce suffering? A crowd-based digital innovation framework of compassion venturing. Inf. Organ. 2021, 31, 100338. [Google Scholar] [CrossRef]
  40. Antonopoulou, K.; Begkos, C. Strategizing for digital innovations: Value propositions for transcending market boundaries. Technol. Forecast. Soc. Chang. 2020, 156, 120042. [Google Scholar] [CrossRef]
  41. Nambisan, S.; Lyytinen, K.; Majchrzak, A.; Song, M. Digital Innovation Management: Reinventing innovation management research in a digital world. MIS Q. 2017, 41, 223–238. [Google Scholar] [CrossRef]
  42. Yeow, A.; Soh, C.; Hansen, R. Aligning with new digital strategy: A dynamic capabilities approach. J. Strateg. Inf. Syst. 2018, 27, 43–58. [Google Scholar] [CrossRef]
  43. Karakaya, E.; Hidalgo, A.; Nuur, C. Diffusion of eco-innovations: A review. Renew. Sustain. Energy Rev. 2014, 33, 392–399. [Google Scholar] [CrossRef]
  44. Weber, M.; Driessen, P.P.; Runhaar, H.A. Evaluating environmental policy instruments mixes; a methodology illustrated by noise policy in the Netherlands. J. Environ. Plan. Manag. 2014, 57, 1381–1397. [Google Scholar] [CrossRef]
  45. Fernando, Y.; Jabbour CJ, C.; Wah, W.X. Pursuing green growth in technology firms through the connections between environmental innovation and sustainable business performance: Does service capability matter? Resour. Conserv. Recycl. 2019, 141, 8–20. [Google Scholar] [CrossRef]
  46. Xie, X.M.; Huo, J.G.; Zou, H.L. Green process innovation, green product innovation, and corporate financial performance: A content analysis method. J. Bus. Res. 2019, 101, 697–706. [Google Scholar] [CrossRef]
  47. Fujii, H.; Managi, S. Decomposition analysis of sustainable green technology inventions in China. Technol. Forecast. Soc. Chang. 2019, 139, 10–16. [Google Scholar] [CrossRef] [Green Version]
  48. Lin, S.; Sun, J.; Marinova, D.; Zhao, D. Evaluation of the green technology innovation efficiency of China’s manufacturing industries: DEA window analysis with ideal window width. Technol. Anal. Strateg. Manag. 2018, 30, 1166–1181. [Google Scholar] [CrossRef]
  49. Lee, H.S.; Choi, Y. Environmental performance evaluation of the Korean manufacturing industry based on sequential DEA. Sustainability 2019, 11, 874. [Google Scholar] [CrossRef] [Green Version]
  50. Nie, M.H.; Qi, H. Can OFDI improve the efficiency of Green innovation in Chinese industry?: Based on the perspective of innovation value chain and spatial linkage. World Econ. Stud. 2019, 2, 111–122. [Google Scholar]
  51. Yin, S.; Zhang, N.; Li, B.Z. Enhancing the competitiveness of multi-agent cooperation for green manufacturing in China: An empirical study of the measure of green technology innovation capabilities and their influencing factors. Sustain. Prod. Consum. 2020, 23, 63–76. [Google Scholar] [CrossRef]
  52. Yin, S.; Zhang, N.; Li, B.; Dong, H. Enhancing the effectiveness of multi-agent cooperation for green manufacturing: Dynamic co-evolution mechanism of a green technology innovation system based on the innovation value chain. Environ. Impact Assess. Rev. 2021, 86, 106475. [Google Scholar] [CrossRef]
  53. Yu, D.H. Connotation, path and driving mechanism of high quality development of manufacturing industry. Rev. Ind. Econ. 2020, 36, 13–32. [Google Scholar]
  54. Jiang, X.G.; He, J.B.; Fang, L. Measurement of high quality development level of manufacturing industry, regional differences and improvement paths. Shanghai J. Econ. 2019, 7, 70–78. [Google Scholar]
  55. Deng, F.; Ren, Z.Z. Research on the Impact of Internet on high quality development of manufacturing industry. J. Cap. Univ. Econ. Bus. 2020, 3, 57–67. [Google Scholar]
  56. Pei, Q.R.; Lu, J.Y. Research on the promotion of high quality development of Chinese manufacturing industry by brand cooperation with technological progress. Mod. Manag. 2019, 4, 18–21. [Google Scholar]
  57. Ren, B.P. The high quality development of China’s manufacturing industry needs to adhere to six strategies in the new era. J. Humanit. 2019, 7, 31–38. [Google Scholar]
  58. Chen, X.W. Research on quality Reform strategy of Manufacturing industry in China. J. Macro-Qual. Res. 2020, 1, 124–128. [Google Scholar]
  59. Sturgeon, T.J. Upgrading strategies for the digital economy. Glob. Strategy J. 2021, 11, 34–57. [Google Scholar] [CrossRef]
  60. Liu, Y.; Yang, Y.; Li, H.; Zhong, K. Digital economy development, industrial structure upgrading and green total factor productivity: Empirical evidence from China’s cities. Int. J. Environ. Res. Public Health 2022, 19, 2414. [Google Scholar] [CrossRef]
  61. Munín-Doce, A.; Díaz-Casás, V.; Trueba, P.; Ferreno-González, S.; Vilar-Montesinos, M. Industrial Internet of Things in the production environment of a Shipyard 4.0. Int. J. Adv. Manuf. Technol. 2020, 108, 47–59. [Google Scholar] [CrossRef]
  62. Li, L.; Zhang, J. Research and analysis of an enterprise E-commerce marketing system under the big data environment. J. Organ. End User Comput. (JOEUC) 2021, 33, 1–19. [Google Scholar] [CrossRef]
  63. Sundarakani, B.; Ajaykumar, A.; Gunasekaran, A. Big data driven supply chain design and applications for blockchain: An action research using case study approach. Omega 2021, 102, 102452. [Google Scholar] [CrossRef]
  64. Matarazzo, M.; Penco, L.; Profumo, G.; Quaglia, R. Digital transformation and customer value creation in Made in Italy SMEs: A dynamic capabilities perspective. J. Bus. Res. 2021, 123, 642–656. [Google Scholar] [CrossRef]
  65. Fang, Z.; Razzaq, A.; Mohsin, M.; Irfan, M. Spatial spillovers and threshold effects of internet development and entrepreneurship on green innovation efficiency in China. Technol. Soc. 2022, 68, 101844. [Google Scholar] [CrossRef]
  66. de Oliveira, T.B. Developing indicators for environmental licensing the case of the Brazilian offshore oil and gas sector. Impact Assess. Proj. Apprais. 2020, 38, 427–440. [Google Scholar] [CrossRef]
  67. Boori, M.S.; Choudhary, K.; Paringer, R.; Kupriyanov, A. Eco-environmental quality assessment based on pressure-state-response framework by remote sensing and GIS. Remote Sensing Applications: Soc. Environ. 2021, 23, 100530. [Google Scholar] [CrossRef]
  68. Kunyanti, S.A.; Mujiono, M. Community Empowerment-based Corporate Social Responsibility Program in Panglima Raja Village. Int. J. Soc. Sci Econ. Art 2021, 11, 12–19. [Google Scholar]
  69. Sepahvand, R.; Mousavi, S.N.; Aref Negad, M.; Sepahvand, M. The impact of suppliers’ empowerment on innovative co-designs and the role of market intelligence: Analysis case study of beverage production companies in Iran. J. Bus. Adm. Res. 2022, 13, 371–394. [Google Scholar]
  70. Li, Y.J.; Han, P. Mechanism and path of high quality development of manufacturing industry under digital economy. Macroecon. Manag. 2021, 5, 36–45. [Google Scholar]
  71. Hensen, A.H.; Dong, J.Q. Hierarchical business value of information technology: Toward a digital innovation value chain. Inf. Manag. 2020, 57, 103209. [Google Scholar] [CrossRef]
  72. Muango, C.O.; Abrokwah, E.; Shaojian, Q. Revisiting the link between information technology and supply chain management practices among manufacturing firms. Eur. J. Int. Manag. 2021, 16, 647–667. [Google Scholar] [CrossRef]
  73. Beekaroo, D.; Callychurn, D.S.; Hurreeram, D.K. Developing a sustainability index for Mauritian manufacturing companies. Ecol. Indic. 2019, 96, 250–257. [Google Scholar] [CrossRef]
  74. Wang, F.; Lu, Y.; Li, J.; Ni, J. Evaluating environmentally sustainable development based on the PSR framework and variable weigh analytic hierarchy process. Int. J. Environ. Res. Public Health 2021, 18, 2836. [Google Scholar] [CrossRef]
  75. Karia, N.; Davadas Michael, R.C. Environmental Practices That Have Positive Impacts on Social Performance: An Empirical Study of Malaysian Firms. Sustainability 2022, 14, 4032. [Google Scholar] [CrossRef]
  76. Palumbo, R.; Casprini, E.; Montera, R. Making digitalization work: Unveiling digitalization’s implications on psycho-social risks at work. Total Qual. Manag. Bus. Excell. 2022, 1–22. [Google Scholar] [CrossRef]
  77. Waqas, M.; Honggang, X.; Ahmad, N.; Khan SA, R.; Iqbal, M. Big data analytics as a roadmap towards green innovation, competitive advantage and environmental performance. J. Clean. Prod. 2021, 323, 128998. [Google Scholar] [CrossRef]
  78. Zhang, L.; Mu, R.; Hu, S.; Zhang, Q.; Wang, S. Impacts of manufacturing specialized and diversified agglomeration on the eco-innovation efficiency—a nonlinear test from dynamic perspective. Sustainability 2020, 13, 3809. [Google Scholar] [CrossRef]
  79. Dou, Q.; Gao, X. The double-edged role of the digital economy in firm green innovation: Micro-evidence from Chinese manufacturing industry. Environ. Sci. Pollut. Res. 2022, 1–19. [Google Scholar] [CrossRef]
  80. Yang, H.; Li, L.; Liu, Y. The effect of manufacturing intelligence on green innovation performance in China. Technol. Forecast. Soc. Chang. 2022, 178, 121569. [Google Scholar] [CrossRef]
  81. Sun, Y.; Wu, L.; Yin, S. Green Innovation Risk Identification of the Manufacturing Industry under Global Value Chain Based on Grounded Theory. Sustainability 2020, 12, 10270. Available online: https://res.mdpi.com/d_attachment/sustainability/sustainability-12-00545/article_deploy/sustainability-12-00545-s001.pdf?version=1578669772 (accessed on 23 May 2022). [CrossRef]
  82. Ullah, K.; Mahmood, T.; Jan, N.; Broumi, S.; Khan, Q. On bipolar-valued hesitant fuzzy sets and their applications in multi-attribute decision making. Nucleus 2018, 55, 85–93. [Google Scholar]
Figure 1. “Pressure-state-response” model of digital green innovation in manufacturing industry.
Systems 10 00072 g001
Figure 2. PSR importance and its evolution in 2015–2019.
Systems 10 00072 g002
Table 1. Comprehensive evaluation index system of digital green innovation in manufacturing industry.
DimensionSerial NumberIndex LayerUnitIndex TrendMain References
Pressure system (PC)PC1Per capital GDPTen thousand yuanPositive (+)[1,43,44,45,66,75,76]
PC2Output value of comprehensive energy consumption Ten thousand yuanPositive (+)
PC3Number of enterprises with R&D activitiesNumberPositive (+)
PC4GDP per 10 Enterprises100 million yuanPositive (+)
PC5Degree of application of digital technology such as enterprise artificial intelligence%Positive (+)
State system (SC)SC1Number of R&D ProjectsItemsPositive (+)[6,45,49,60,77,79,80]
SC2Number of Patents per ten Enterprises PiecesPositive (+)
SC3Proportion of new product sales revenue in main business revenue%Positive (+)
SC4Wastewater discharge intensityTen thousand tons/one billion yuanNegative (−)
SC5Exhaust emission intensity of output value10 thousand cubic meters/100 million yuanNegative (−)
Response system (RC)RC1Proportion of R&D expenditure in main Business Income%Positive (+)[40,43,51,52,74,75,79,80]
RC2New product development expenditureTen thousand yuanPositive (+)
RC3R&D personnel equivalent to full-time equivalentPerson yearPositive (+)
RC4Green Development Expenditure per ten EnterprisesTen thousand yuanPositive (+)
RC5Enterprise adoption of digital technologies such as artificial intelligence%Positive (+)
Table 2. Saaty’s contrast ruler.
ScaleDefinition
1 C i   is   of   equal   importance   to   C j .
3 C i   is   slightly   more   important   than   C j .
5 C i   is   obviously   more   important   than   C j .
7 C i   is   more   important   than   identification   criterion   C j .
9 C i   is   absolutely   more   important   than   identification   criterion   C j .
2, 4, 6, 8 The   comparison   of   the   importance   of   C i   and   C j is in the middle position.
Reciprocal The   comparison   of   the   importance   of   C i   and   C j   is   the   reciprocal   of   C j   and   C i .
Table 3. RI values. [81].
n12345678910
RI000.580.961.121.241.321.411.451.49
Table 4. Weight results of PSR evaluation criterion.
P CriteriaWeightS CriteriaWeightR CriteriaWeight
PC10.1981SC10.1833RC10.2007
PC20.2191SC20.1361RC20.1135
PC30.2013SC30.1821RC30.0853
PC40.1849SC40.2659RC40.2314
PC50.2277SC50.2659RC50.2543
Table 5. Results of comprehensive index of the development level of green innovation in manufacturing industry from 2015 to 2019.
Region20152016201720182019
Jingxiu District0.27420.20740.18980.15790.3393
Lianchi District0.65000.63890.60080.59130.6638
Mancheng District0.11620.20980.20210.19440.1655
Qingyuan District0.09280.08870.13440.12920.1697
Xushui District0.33400.34580.36260.29600.3344
Laishui County0.22040.29950.22960.25640.3600
Dingxing County0.24990.26990.26080.27040.3140
Tang County0.19400.23750.22780.27110.3253
Gaoyang County0.19330.27670.27610.28500.1989
Laiyuan County0.30600.31180.26550.22510.2596
Wangdu County0.26480.29220.24800.30640.2954
Yi County0.24760.24570.24100.23880.3481
Quyang County0.16180.16780.09520.10090.2627
Li County0.24800.27370.27230.26590.2176
Shunping County0.28470.26240.24510.26730.1803
Boye County0.26750.26890.27750.30020.1838
Zhuozhou City0.29860.39660.36500.40350.3960
Anguo City0.32260.26280.25280.28810.2846
Gaobeidian City0.27150.32160.30240.35880.3351
Baigou New City0.22770.27350.29630.29130.3042
High-tech Zone0.60470.63810.62640.60710.5183
Average index0.27760.29950.28440.29070.3075
Table 6. Results of the evaluation index of the development level of digital green innovation in manufacturing industry in 2019.
RegionIndexRanking
PSRComposite
Jingxiu District0.08240.12070.03060.233718
Lianchi District0.20710.27120.15070.62901
Mancheng District0.05520.10850.01390.177619
Qingyuan District0.05860.03780.02650.122921
Xushui District0.09020.17170.07270.33464
Laishui County0.07590.03960.15770.273210
Dingxing County0.06880.15640.04780.273011
Tang County0.05210.12150.07760.251215
Gaoyang County0.08360.13420.02820.246017
Laiyuan County0.06130.11010.10220.27369
Wangdu County0.06320.13750.08070.28147
Yi County0.07280.13500.05640.264212
Quyang County0.03570.05800.06390.157720
Li County0.07780.13890.03880.255514
Shunping County0.06180.12660.05950.248016
Boye County0.06170.13260.06530.259613
Zhuozhou City0.10250.18280.08670.37203
Anguo City0.09170.15750.03300.28226
Gaobeidian City0.09260.15540.06990.31795
Baigou New City0.08840.14600.04420.27868
High-tech Zone0.25950.24290.09660.59892
Average index0.27760.29950.28440.2907-
Table 7. Comprehensive response index classification.
ClassificationRegion
Category 1Lianchi District and High-tech Zone
Category 2Zhuozhou City, Xushui District, Gaobeidian City
Category 3Anguo City, Wangdu County, Baigou New City, Laiyuan County, Laishui County, Dingxing County, Yi County, Boye County, Li County, and Tang County
Category 4Shunping County, Gaoyang County, and Jingxiu District
Category 5Mancheng District, Qingyuan District, and Quyang County
Publisher’s Note: MDPI stays neutral with regard to jurisdictional claims in published maps and institutional affiliations.

