Article

Feasibility Analysis of a Mobile Microgrid Design to Support DoD Energy Resilience Goals

by
Daniel W. Varley
,
Douglas L. Van Bossuyt
* and
Anthony Pollman
Department of Systems Engineering, Naval Postgraduate School, Monterey, CA 93943, USA
*
Author to whom correspondence should be addressed.
Systems 2022, 10(3), 74; https://doi.org/10.3390/systems10030074
Submission received: 3 May 2022 / Revised: 26 May 2022 / Accepted: 27 May 2022 / Published: 3 June 2022

Abstract

:
This research investigates the feasibility of using mobile hybrid microgrids to increase energy resilience in DoD Installations. The primary question examined is whether a standardized mobile microgrid, constrained within an International Standards Organization (ISO) Triple Container (TriCon) and not to exceed 10,000 lbs (approximately 4535 kg), can provide the necessary power for small critical sites with an average 10 kW load on DoD installations with similar resilience to a customized single load microgrid or emergency backup generator. Key assumptions for this research are that power outages may be accompanied by a fuel constrained environment (e.g., natural disaster that restricts fuel transport), an existing installation microgrid is in place, and the risk of outages does not warrant the development of redundant customized single load microgrids for each critical load. The feasibility of a mobile hybrid microgrid is investigated by constructing an architectural design that attempts to find a satisfactory combination of commercial off-the-shelf components for battery energy storage, photovoltaic power, and generator power within the constraints of an 8 ft × 6 ft 5 in × 8 ft (approximately 2.4 m × 2 m × 2.4 m) shipping container. The proposed design is modeled and simulated over a two-week period using Global Horizontal Index solar irradiance data, and a randomized average 10 kW load. Results of the model are used to analyze the feasibility of the system to meet the load while reducing dependency on fuel resources. Trade-offs between a customized single load microgrid and standardized mobile microgrid are discussed. The result of this research indicates that a standardized mobile microgrid holds significant promise for DoD and other potential users (public safety, private industry, etc.) in having a rapidly deployable solution to bring critical loads back online during an emergency situation that reduces generator usage.

1. Introduction

Continuous, reliable power is becoming increasingly critical in supporting the modern world’s infrastructure, which many people have come to take for granted. People expect reliable power in their critical infrastructure such as hospitals and transportation networks (e.g., stop lights, subways, and lighted road signs), and also in the other more mundane aspects of their daily lives such as internet access, interior lighting, and air-conditioning. This increased reliance on reliable power drives a need for increased energy resilience.
This paper investigates the feasibility of a mobile microgrid, housed in an International Standards Organization (ISO) Triple Container (TriCon), to support critical infrastructure power needs and provide a flexible solution for backup power to critical loads following an outage. Power density of both generation and storage within this size constraint is examined to provide a proposed mobile hybrid power solution to support energy resilience and quickly restore power following a disruption event. The proposed solution also offers a tool for providing power where there is no preexisting infrastructure such as an emergency relief medical site or establishment of a refugee camp [1]. The intent of this research is to support the quick restoration of power for defense as well as public infrastructure, or areas absent of infrastructure, to bolster energy resilience.
For the Department of Defense (DoD), mobile microgrids provide a solution to support DoD energy resilience goals following a power outage. The DoD increasingly relies on continuous, uninterrupted electrical power to successfully execute its many missions [2,3]. This drives the DoD to increase standards for energy resilience. Energy resilience is the ability to prevent power disruptions, and in the event of a power outage, restore electricity as quickly as possible to minimize the consequences of the outage [4]. For DoD installations, the consequences of a long-term power outage may equate to a failure of mission critical functions such as current communications with deployed forces or command and control of deployed assets [5]. Not all power outages effect mission critical functions, but when they do, it can impact national security.
To increase energy resilience, many DoD installations are building microgrids, which are electrical grid networks that have clear boundaries that lie within the installation and provide their own sources of power generation such as emergency diesel generators (EDGs) or photovoltaic arrays (PVs). A microgrid can work in conjunction with the private electric utility provider’s host domestic grid and provide supplemental power to the installation or power back to the host domestic grid much like solar panels on a home. In the event of a host domestic grid failure, a microgrid can provide backup power to ensure the installation performs mission critical functions.
In the past, most installations relied on EDGs to provide power to the installation microgrid in the event of an outage. However, as the DoD realizes the risks associated with supply chain networks (SCNs) and diesel supply for long term outages, EDGs become a less reliable option [6]. The DoD is implementing policies to move toward more renewable power generation. To align with risk levels and DoD policy, installation microgrids are combining renewable sources of power, such as PV and wind turbines, with EDGs to create hybrid power solutions that reduce fuel consumption and reliance on SCNs for power.
An installation microgrid that incorporates renewable energy has multiple benefits, but the primary benefit is the microgrid’s ability to increase energy resilience for the installation and reduce the risk associated with SCNs. Some researchers have recommended further levels of redundancy to support energy resilience by implementing single load microgrids (sometimes referred to as “nanogrids”) for loads deemed critical by the installation [7]. In such single load microgrids, critical loads have their own dedicated microgrids in case both the host domestic grid and installation microgrid fail.
Single load microgrids for critical loads may provide increased energy resilience, but the resources associated with designing and building single load microgrids customized for specific loads is substantial, especially if they incorporate renewable power generation. Previous research recommends that critical loads and potential microgrid solutions are modeled and simulated during design and prior to implementation [6,7,8]. The number of critical loads across DoD installations varies but designing customized single load microgrids for each critical load may not be worth the time or cost. This paper proposes a standardized mobile microgrid solution to increase energy resilience for installation critical loads. A mobile microgrid, housed in a standard shipping container and incorporating both renewable and diesel power generation as well as power storage, can be moved to the point of need during a power outage.
This paper discusses and analyzes the potential for mobile microgrids to reduce the burden on installations to increase energy resilience. The research attempts to answer two primary questions:
  • Can mobile microgrids (one size fits all) effectively meet an average 10 kW critical load while reducing the reliance on diesel fuel for power generation?
  • What are the trade-offs between a mobile microgrid and a single load-specific microgrid (e.g., resilience, time, over or under utilization, load shedding)?
In order to answer the above questions, a mobile microgrid, constrained by the size of an ISO Tricon Container, is designed, and an experimental use case is modeled to gather data that informs the trade-offs between a single customized load specific microgrid and the designed mobile microgrid.

1.1. Motivation and Need

Potential threats to power supplies for critical defense, government, and economic infrastructure drive the need for increased energy resilience [2,9]. Secure access to energy and the ability to quickly recover after a power outage is critical to national security [2]. Without power, many national security activities either operate at a greatly reduced level of effectiveness or cannot operate at all until power is restored.
DoD installations throughout the world rely on host domestic grids for power to conduct critical missions that support national security. Installation-wide microgrids provide a layer of redundancy to host domestic grids and can operate in a standalone or “islanded” mode for specified periods of time based on mission requirements [3]. Typically, the larger a microgrid, the more vulnerable the microgrid is to malicious attacks and natural disasters (e.g., tornadoes, hurricanes, earthquakes). This correlates directly to microgrid size, networking, and complexity.
EDGs have long been the solution for redundant power during a prolonged outage at many DOD and national security facilities [3]. However in the situation where an adversary launches a malicious attack against a microgrid involved in national security, a disruption to fuel supply chains serving the microgrid diesel generators may also occur [6,8]. Similarly, fuel supply lines can be disrupted during regional natural disasters. Thus, while many microgrids currently expect uninterrupted diesel fuel deliveries in order to sustain operations, this may not be a valid assumption.
Previous research demonstrated increased energy resilience by augmenting critical loads with their own dedicated microgrids [7]. This provides a second layer of redundant power beyond the installation microgrid for specific critical loads on the DoD installation. That same research proposed the use of hybrid power generation to reduce the dependency on outside fuel resources [7]. Static customized single load microgrids for critical loads require a significant amount of time and resources to implement. Not all critical loads will get their own single load microgrid, but this still constitutes a significant level of effort and resources.
The DoD requires a faster, less resource intensive, solution that also reduces reliance on fossil fuels to provide backup power to critical loads. An alternate solution to increase energy resilience is mobile microgrids, which are designed for a generic load using hybrid power generation and are capable of being moved to the point of installation microgrid failure to quickly connect and restore power to the critical load. This solution offers installation energy managers flexibility to restore power where needed without requiring the critical load infrastructure that previous research has offered.
Mobile microgrids have the potential to be used as a tool for DoD installations in the event of a power failure or outage, but their use also extends as a possible solution for contingency operations and large-scale combat operations (LSCO). In the event of a natural disaster, a mobile microgrid could be placed into contingency operations using rotary wing airlift assets to provide hybrid power generation where needed and when needed. Other possible uses for a mobile microgrid could be in the extreme rear echelons during LSCO to reduce fuel consumption at more static operating positions.
Mobile microgrids that have the ability to network can be used to meet varying scales of power demands across the spectrum of previously mentioned uses but networking the mobile microgrids is beyond the scope of this research.

1.2. Specific Contribution

This research explores the potential of mobile power generation and energy storage packaged into an ISO TriCon shipping container of dimensions 8 ft × 6 ft 5 in × 8 ft (approximately 2.4 m × 2 m × 2.4 m) to improve resilience of national security electrical energy loads. The proposed mobile microgrid is modeled against an average 10 kW load during low solar irradiation time periods. The research provides insight into the feasibility of packaging power generation and energy storage into a form factor that is easily transported with common DoD installation resources and within the DoD transportation infrastructure. This research provides insight into generator usage as a corollary to fuel consumption and compares mobile microgrid generator usage versus an EDG for power generation to inform system feasibility when fuel SCNs are restricted. The period of analysis for the feasibility study is 14 days based on current DoD planning guidance for long term power outages. While the remainder of this article focuses on DoD installations, this research is applicable to many national security missions that many countries may conduct in addition to civilian critical electrical loads such as hospitals, vaccine storage facilities, and the like.

2. Background and Related Research

This section provides background on key concepts, terminology, DoD intentions, and related work necessary to propose an architectural design for a mobile microgrid and assess its feasibility in supporting a DoD installation critical load. While this section focuses on DoD energy security needs, the information below is relevant to national security and civilian critical loads.

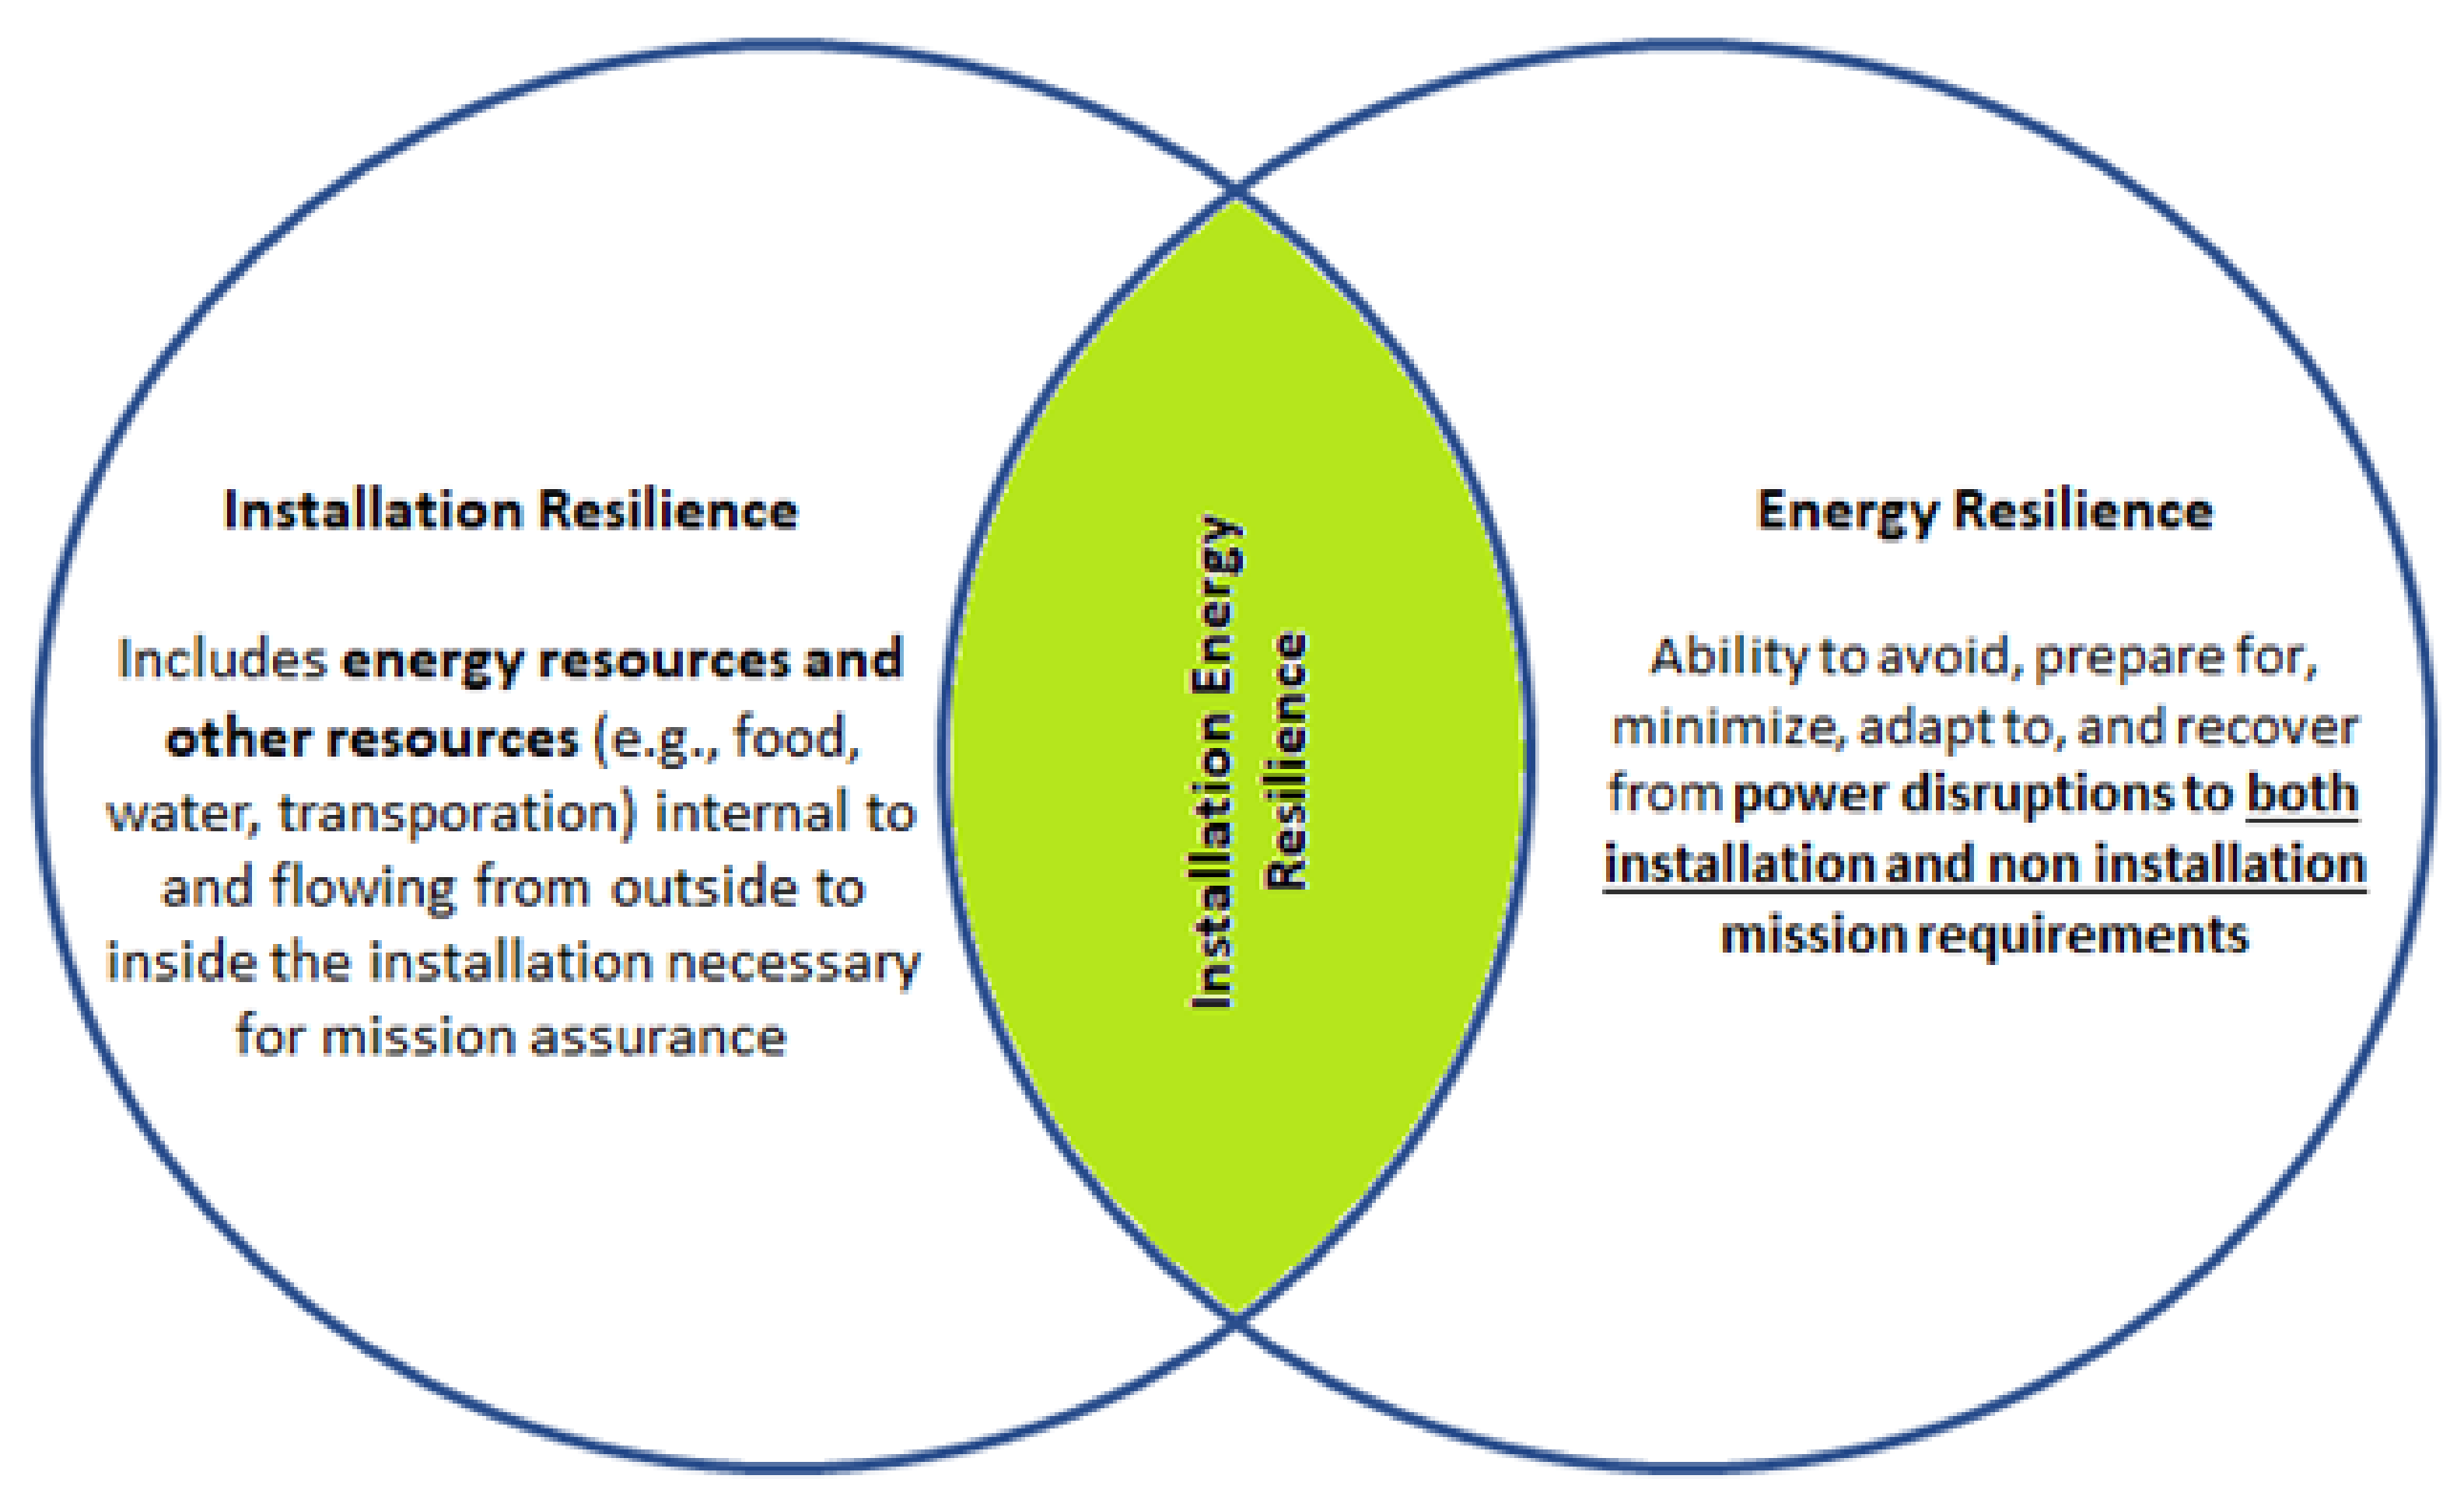
2.1. DoD Installation Energy Resilience

Energy resilience is a critical concept when discussing electrical power for DoD Installations. Resilience has numerous definitions that generally follow the same theme: an ability to survive damage and an ability to quickly recover from damage [10,11]. Energy resilience is the ability to assure access to reliable energy supplies and protect and deliver sufficient energy to meet operational needs [12]. This includes the prevention of power disruptions, and in the event of an outage, restoration of electricity as quickly as possible to mitigate consequences of an outage [4,13].
Government policy reflects the demand for increased energy resilience. The United States Code (USC) incorporates the concept of energy resilience and defines energy resilience for the DoD as “the ability to avoid, prepare for, minimize, adapt to, and recover from anticipated and unanticipated energy disruptions in order to ensure energy availability and reliability sufficient to provide for mission assurance and readiness, including mission essential operations related to readiness, and to execute or rapidly reestablish mission essential requirements” [14]. This definition is inclusive of DoD energy needs both on and off DoD installations.
The definition for military installation resilience is “the capability of a military installation to avoid, prepare for, minimize the effect of, adapt to, and recover from extreme weather events, or from anticipated or unanticipated changes in environmental conditions, that do, or have the potential to, adversely affect the military installation or essential transportation, logistical, or other necessary resources outside of the military installation that are necessary in order to maintain, improve, or rapidly reestablish installation mission assurance and mission-essential functions” [15]. This definition includes both internal and external resources necessary for installation mission assurance and mission-essential functions and, in this definition, energy is just one of many resources needed.
By combining these two definitions, as seen in Figure 1 the concept of Installation Energy Resilience is revealed. Installation Energy Resilience is focused only on the energy resources needed for the installation to conduct mission assurance and mission essential functions. Likewise, it is only focused on energy resilience as it relates to the installation.
Installation Energy Resilience is the ability to avoid, prepare for, minimize, adapt to, and recover from anticipated and unanticipated installation energy disruptions. These disruptions can be both internal and external to the installation and arise from a number of causations, such as extreme weather, natural disasters, climate change, or adversary threats (e.g., physical or cyber attacks).
Congress gives the Secretary of Defense guidance and authority to pursue energy resilience for the DoD [16]. The Secretary of Defense has authority to establish and maintain installation energy security and resilience plans and implement those plans to increase the energy resilience of DoD installations. The Secretary of Defense also has authority to select projects that use renewable energy sources and give favor to energy resilience projects that provide power directly to the installation electrical network versus selling power back to grid [16]. These authorities speak to a movement, when and where possible, to reduce the reliance on fossil fuels and reliance on host domestic grids.

2.2. Why Does the DoD Care about Energy Resilience?

The DoD’s focus on energy resilience comes from its reliance on assured energy to conduct mission essential functions [5,17]. Mission essential functions can vary widely from installation to installation, but ultimately those functions lend some level of support to national security operations. In recent years, the focus on energy resilience in reality is a focus on national security from the perspective of energy. In many cases having energy available equates to the ability to defend the nation [17].
As with any increased reliance, energy presents a point of vulnerability for the DoD. If energy is cut off, those reliant functions are degraded or stopped. To mitigate this vulnerability, the DoD is calling for continual improvements that increase its energy resilience.
The threats to host domestic grids include natural disasters, severe weather, and deliberate attacks [8,18]. Among these threats lies the risk of SCN disruption and manipulation. DoD Installation energy systems rely heavily on diesel fuel for primary and backup power [19]. The SCNs that provide this fuel are susceptible to the same threats as the host domestic grid [6]. In the case of a deliberate attack on a DoD installation energy system, the threat could also choose to target the SCNs to exacerbate the impacts of the attack on the host domestic grid or microgrid, slowing or cutting off critical fuel supplies needed for backup power generation [18,20]. In the case of a natural disaster or extreme weather event, those same SCNs are potentially disrupted as roadways, railways, shipping lanes, and ports are disrupted.

2.3. DoD Installation Microgrids

The DoD is building installation level microgrids as the more common and accepted approach to increase installation energy resilience [3,21,22]. Microgrids provide opportunities for increased energy security, resilience, reliability, and renewable power generation [23]. They can vary in size and form, but microgrids have common attributes such as acting as a sub-system to the host domestic grid, offering a mitigation during a host domestic grid failure, providing power generation to support all or a portion of the local load demand, and the ability to operate in a grid connected or islanded mode [24,25]. A DoD specific definition applicable to this research is provided by Lincoln Labs during their analysis of power resilience and cost relating to DoD installations. Lincoln Labs defines DoD microgrids as “an integrated energy system consisting of interconnected loads and energy resources which, as an integrated system, can island from the local utility grid and function as a stand-alone system” [26]. For the DoD, the microgrid acts as the first layer of power redundancy to increase energy resilience for the installation [21]. The microgrid is clearly bounded to include mission critical loads necessary to sustain operations in the event of a host domestic grid outage for a specified period of time without the need for outside resources [3].
The scale of installation microgrids makes them susceptible to many of the same threats posed to the host domestic grid. Smart grid technologies help to mitigate the impact of threats by allowing one area of the microgrid to be isolated from another, but multiple critical loads will often be impacted [27]. A consideration of smart grids is the “where to island” challenge to support as much of the load across the grid as possible while minimizing overall load shedding; progress is being made in overcoming this challenge to improve power resilience under catastrophic events [28]. The standard period of operation for installation microgrids varies but the metric prescribed for installation resilience is days-of-autonomy [29]. The Army and Marines prescribe 14 days [30,31] and the Navy requires seven days-of-autonomy [32]. For this research, 14 days-of-autonomy is the standard period of operation considered without outside resources.

2.4. Single Load Microgrids

Microgrids are becoming more realistic, cost-effective solutions to providing power, especially in the last several years as technology improves and component costs decrease [18]. Single load microgrids, which are smaller scale microgrids that are designed to serve a specific single load, are finding applications in providing power in rural, non-grid connected areas, backup power for conventional home usages, disaster mitigation, and hybrid power in a grid connected configuration to reduce energy costs [33,34,35,36]. Applications that network single load microgrids to form larger microgrids have also become an area of increasing interest in an attempt to magnify the benefits to growing communities and infrastructure [37,38,39]. Networking allows single load microgrids to share excess energy and take advantage of different power generation techniques during periods of low-power generation for differing renewable energy sources.

2.5. Mobile Microgrids

The focus of this research is mobile microgrids and their feasibility in meeting the energy needs of DoD installation critical loads. For this research, a mobile microgrid is a single load microgrid designed and packaged in a modular configuration for a specified threshold average load which is capable of being transported or relocated, and deployed within an operationally relevant amount of time. Previous research demonstrated increased DoD installation energy resilience with static customized single load microgrids that incorporated highly localized power generation and storage around a critical load [7]. As previously mentioned, the methodologies for implementing these static single load microgrids are resource intensive and the risk posed at that level of redundancy may not warrant the resources to design and build a single load microgrid customized for a specific load. This research proposes a mobile microgrid, designed for a specific shipping container size constraint and a predesignated average load. The mobile microgrid incorporates a EDG, PV array, and battery energy storage system (BESS).

2.6. Related Research/Gap

Other researchers have investigated mobile microgrids for more flexible applications during contingency operations and disaster relief. For instance, one effort provided a mobile package about the size of a large Pelican Case (e.g., 1 ft × 2 ft × 3 ft) that offers a reactive capability (rapid deployment) of very small power generation (∼1.9 kW) [35]. On a larger scale, but still proposed as mobile, other research examined hybrid mobile microgrids to support military operations and forward basing, scalable for between approximately 150 (∼225 kW) and 1500 (∼2250 kW) personnel [40]. Although existing research into mobile microgrids has similarities to the intent of this research, the scaling is significantly different, and the trade-off analysis related to military installation power does not exist in the literature. The commercial market is starting to flourish with containerized power solutions, but that marketplace does not provide solutions that account for DoD specific objectives and requirements for use across an array of operating environments and military constraints [41,42,43,44]. The research presented in this paper was pursued because of this gap. Critical to the research in this paper is understanding the trade-offs between standardized mobile microgrids and load specific customized microgrid implementations for military installations.

3. Mission Sets

The mobile microgrid design proposed in this paper is targeted to support three mission sets: backup power for DoD installation critical loads (PRIMARY), contingency operations (SECONDARY), and rear-echelon LSCO (SECONDARY). This section describes each mission set in detail.

3.1. Backup Power for DoD Installation Critical Loads

Providing backup power to DoD installation critical loads is the primary mission set for the proposed mobile microgrid. The typical resilience curve shown in Figure 2 helps demonstrate the potential for a mobile microgrid to support DoD installation energy resilience. In the event of a power disruption, the mobile microgrid is moved to the power outage at a critical load to restore power and provide up to 14 days-of-autonomy. As a tool for installation energy managers, mobile microgrids may allow for a quick reaction time to put backup power in place, shortening the time associated with the “Respond, Adapt” phase and “Recover” phase of the resilience curve seen in Figure 2.
A use case for the Backup Power Mission might look something like a severe weather event that knocks out power to the host domestic grid and causes failures at a critical load on the DoD installation microgrid due to tree falls and powerline damage. The contractor support for the installation microgrid is not available to restore power because they are working in the local community to bring critical civilian services back online. Mobile microgrids are stored in a grid connected mode to maintain a minimum 80% charge level of their BESS but with their PV arrays stowed [1]. In this case, the installation energy manager can use internal installation resources, such as a 10 K forklift, to move one or multiple mobile microgrids to the critical load that is lacking power. Once the mobile microgrid is in place at the critical load, it is connected through a low voltage connection and the critical load can immediately begin running off the mobile microgrid BESS [1]. Once power is restored using the BESS, the EDG is brought online, and the PV array is deployed out of the TriCon and connected to the mobile microgrid. During the initial period of operation, the mobile microgrid powers the critical load from the BESS. The PV array and EDG work in conjunction to charge the BESS and power the critical load with the goal of reduced generator usage to reduce the reliance on resources outside the installation. It is beyond the scope of this research, but installation infrastructure changes may be needed at critical load sites to allow for expedient low voltage connections. Figure 3 provides a concept of operations (CONOPS) for the Backup Power for DoD Installation Critical Loads Mission.
Note that the DoD installation and CONOPS are representative of what may occur to supply backup power to DoD installation critical loads. However, the details have been intentionally altered.
This research will only analyze the feasibility of this mission set but will discuss the feasibility considerations for contingency operations and LSCO.

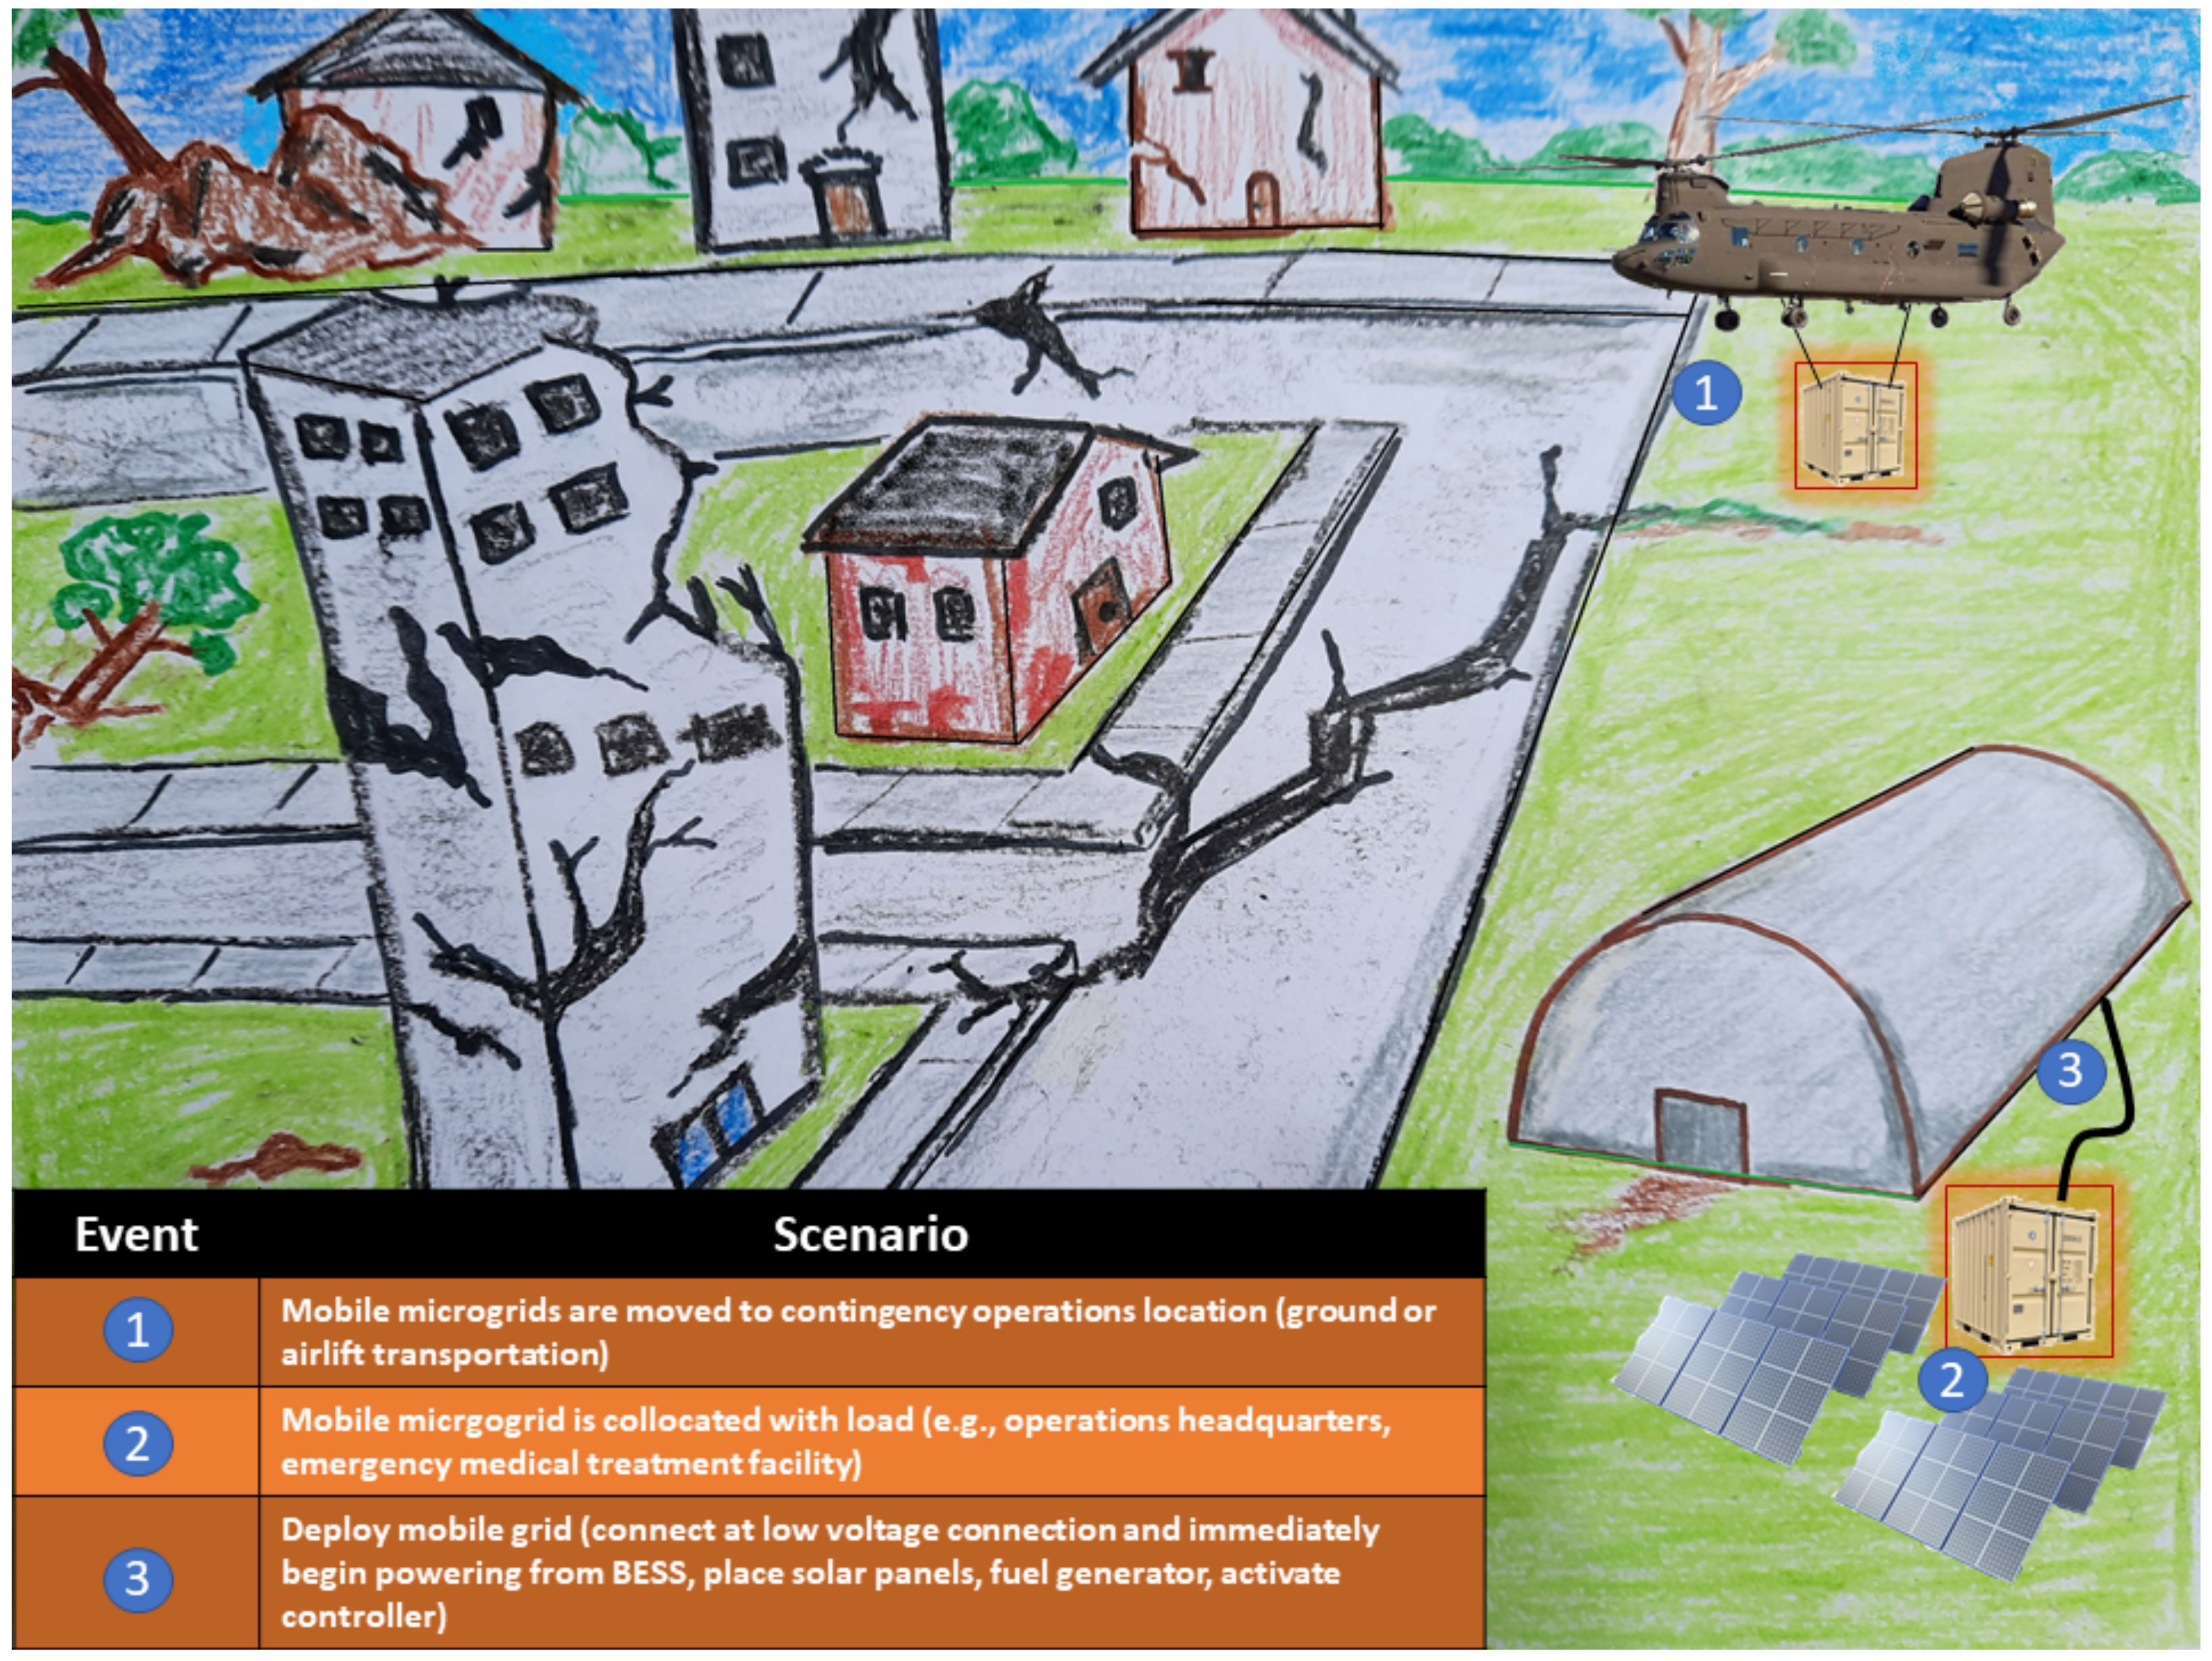
3.2. Contingency Operations

The use case for contingency operations could include response to a natural disaster or severe weather event where power is required to bring critical assets such as hospitals or response coordination centers back online. The mobile microgrid is stored in an ISO standard shipping container and designed for airlift using helicopter lift assets. The mobile microgrid is shipped using conventional transportation as close to the contingency operations site as possible using resources such as a flatbed truck, railway, or military fixed wing cargo aircraft. The mobile microgrid can then be airlifted with rotary wing assets such as a CH-47 Chinook and placed at the contingency operations site to provide immediate power from the BESS [1]. Once power is restored using the BESS, the EDG is brought online, and the PV array is placed and connected to the mobile microgrid. It is beyond the scope of this research, but the low voltage connection to the load will need to be developed to support a wide array of connections to support contingency operations. Figure 4 shows a CONOPS for a contingency operations mission.

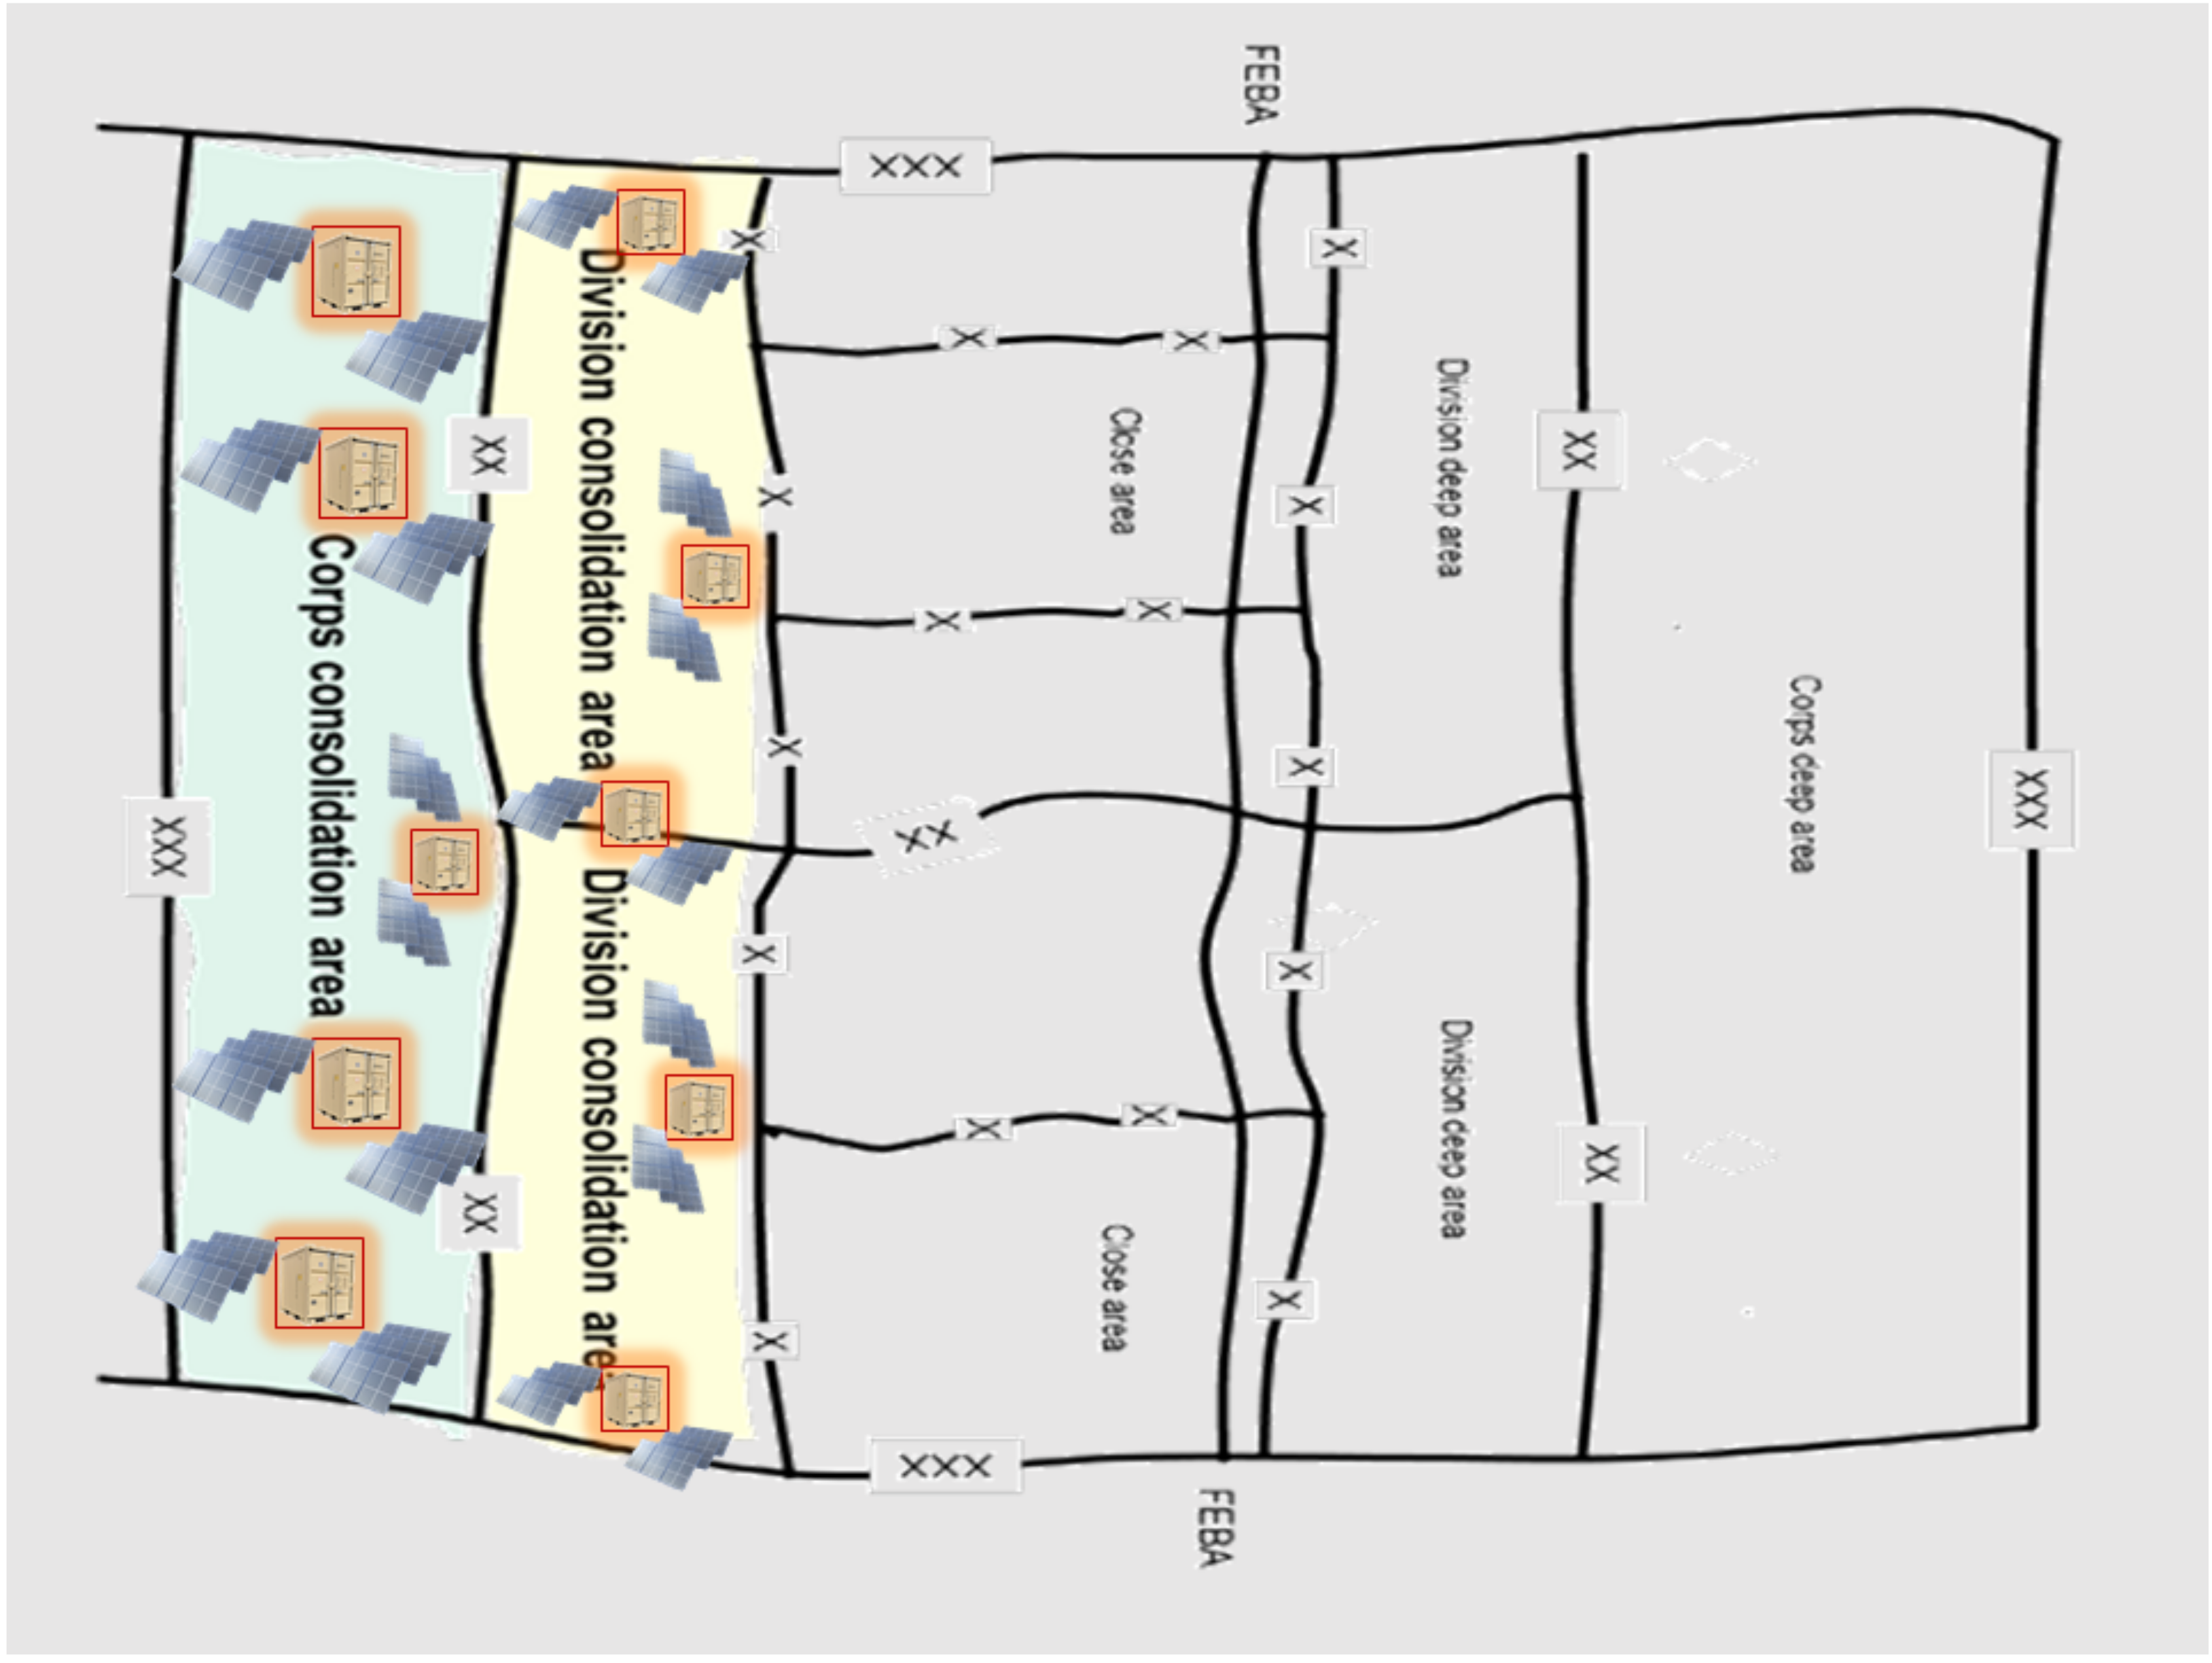
3.3. Large Scale Combat Operations
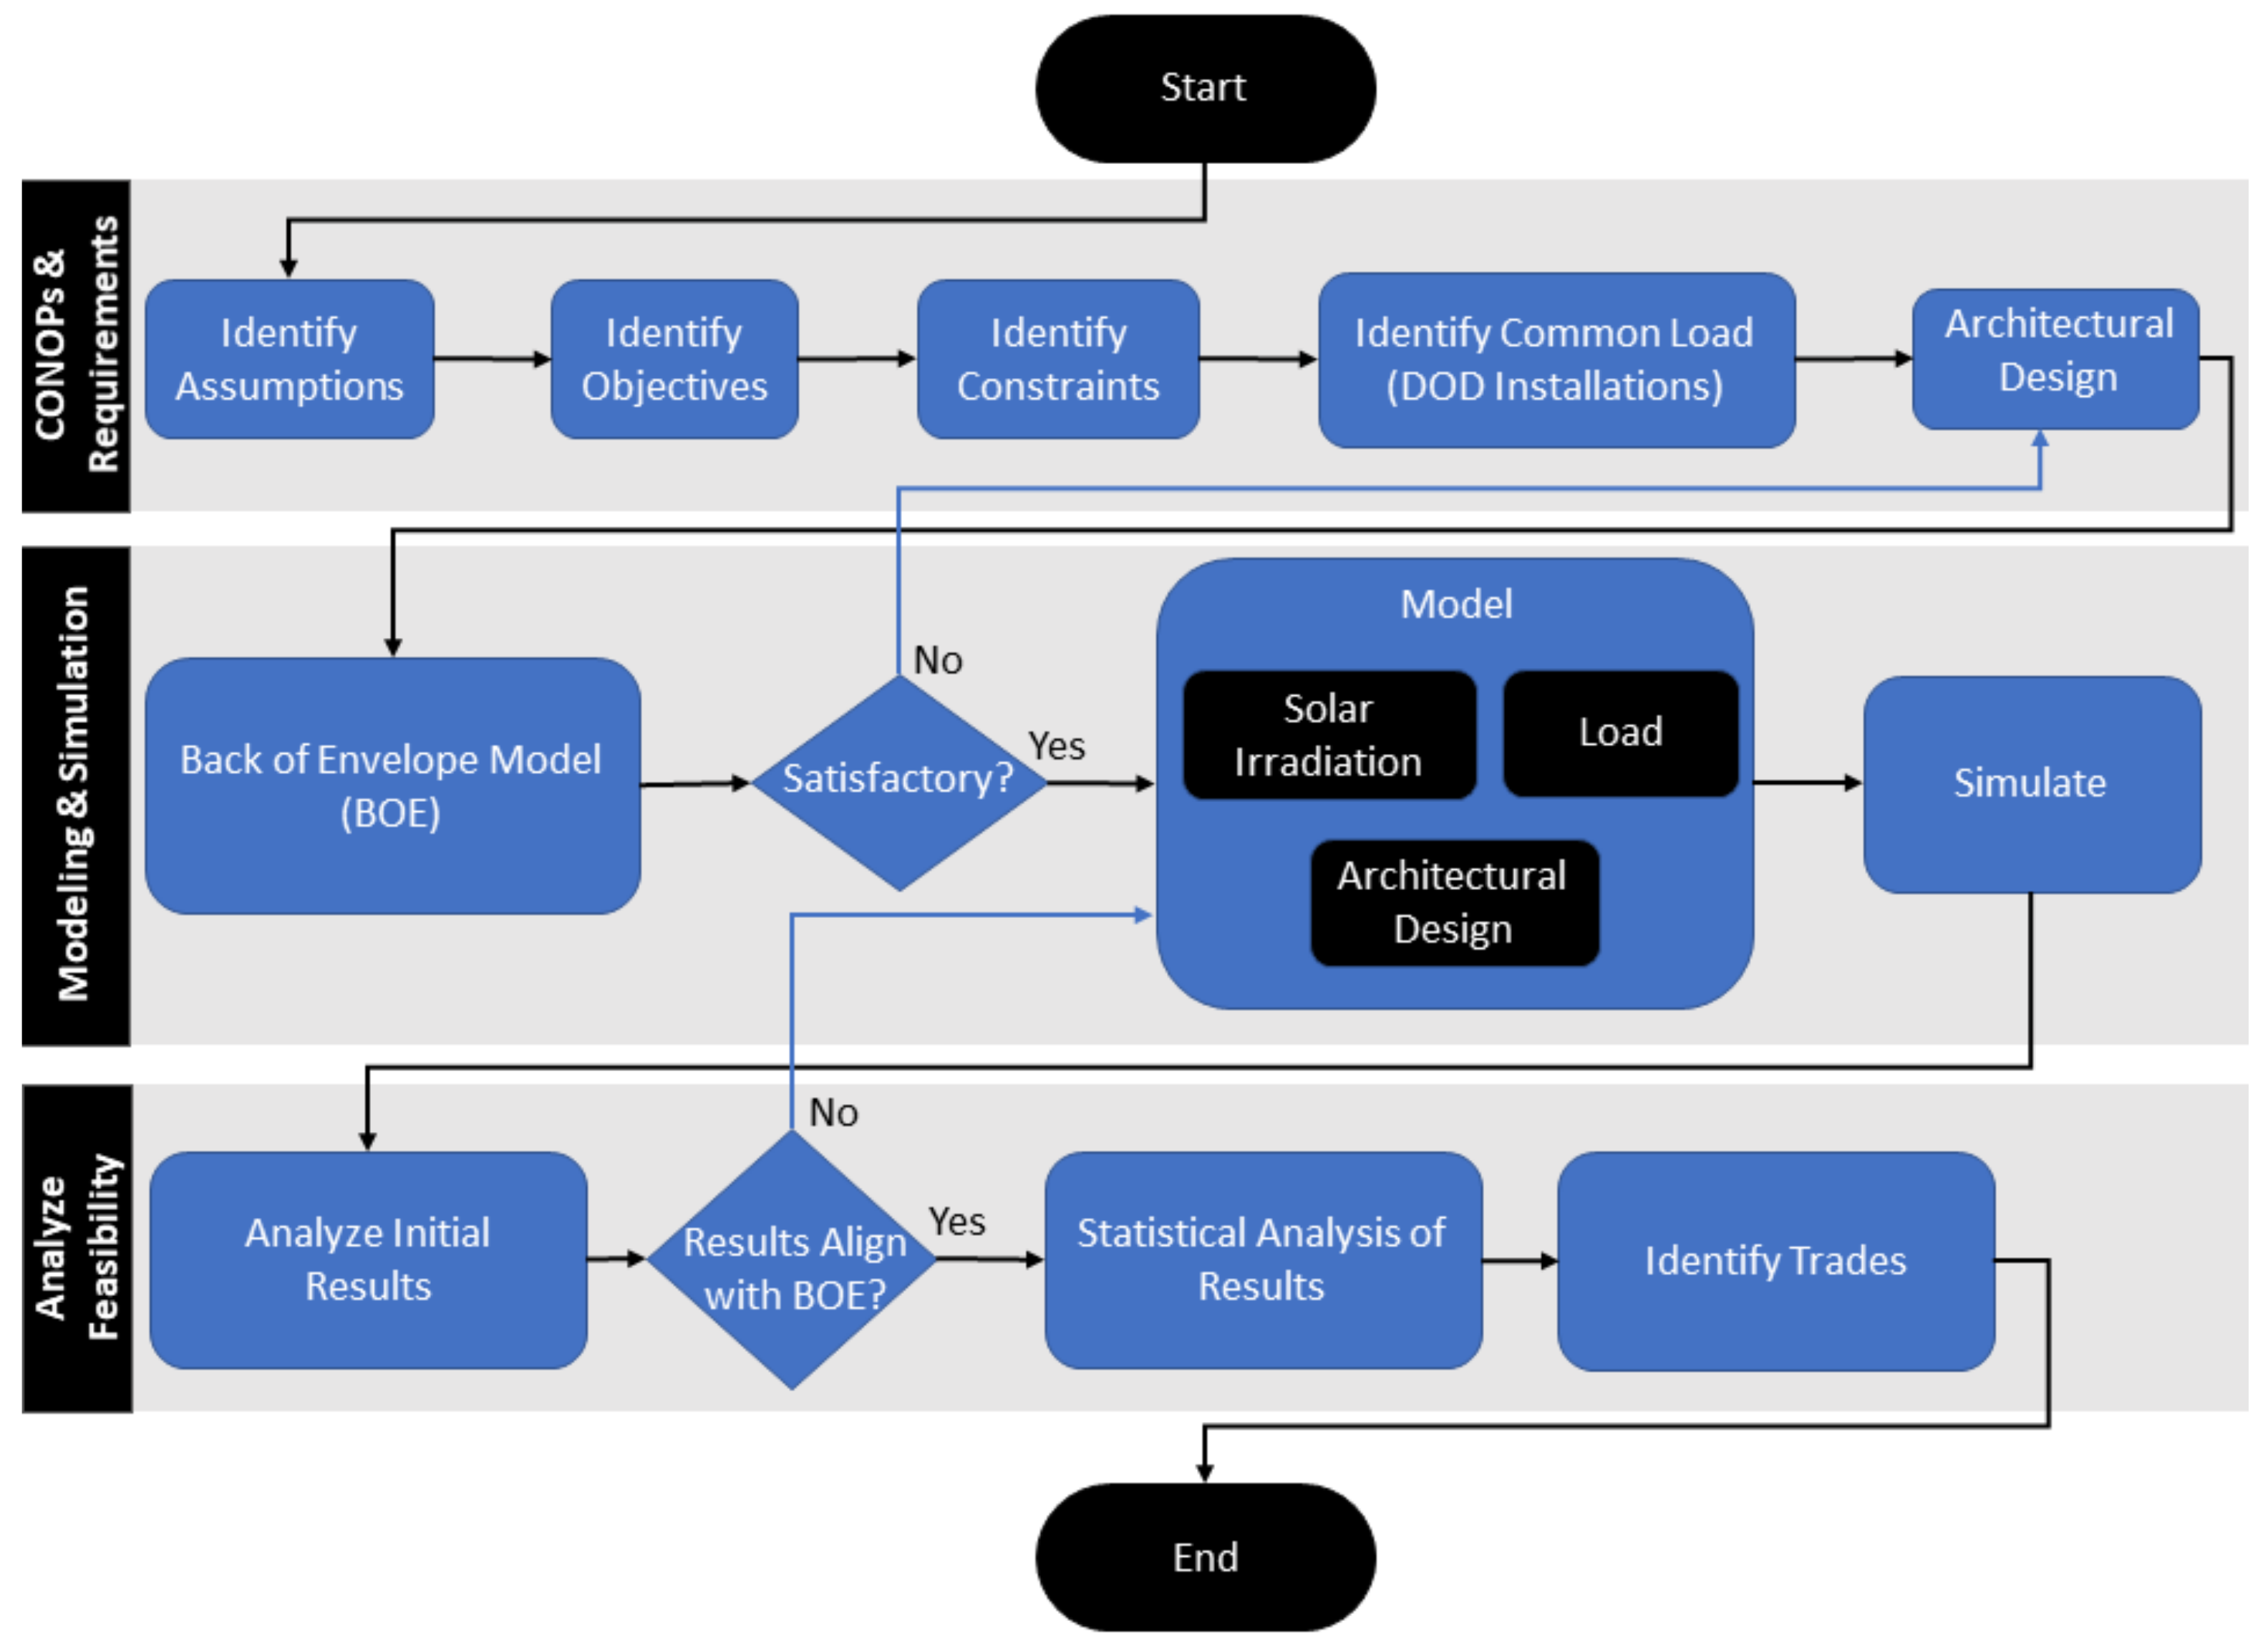
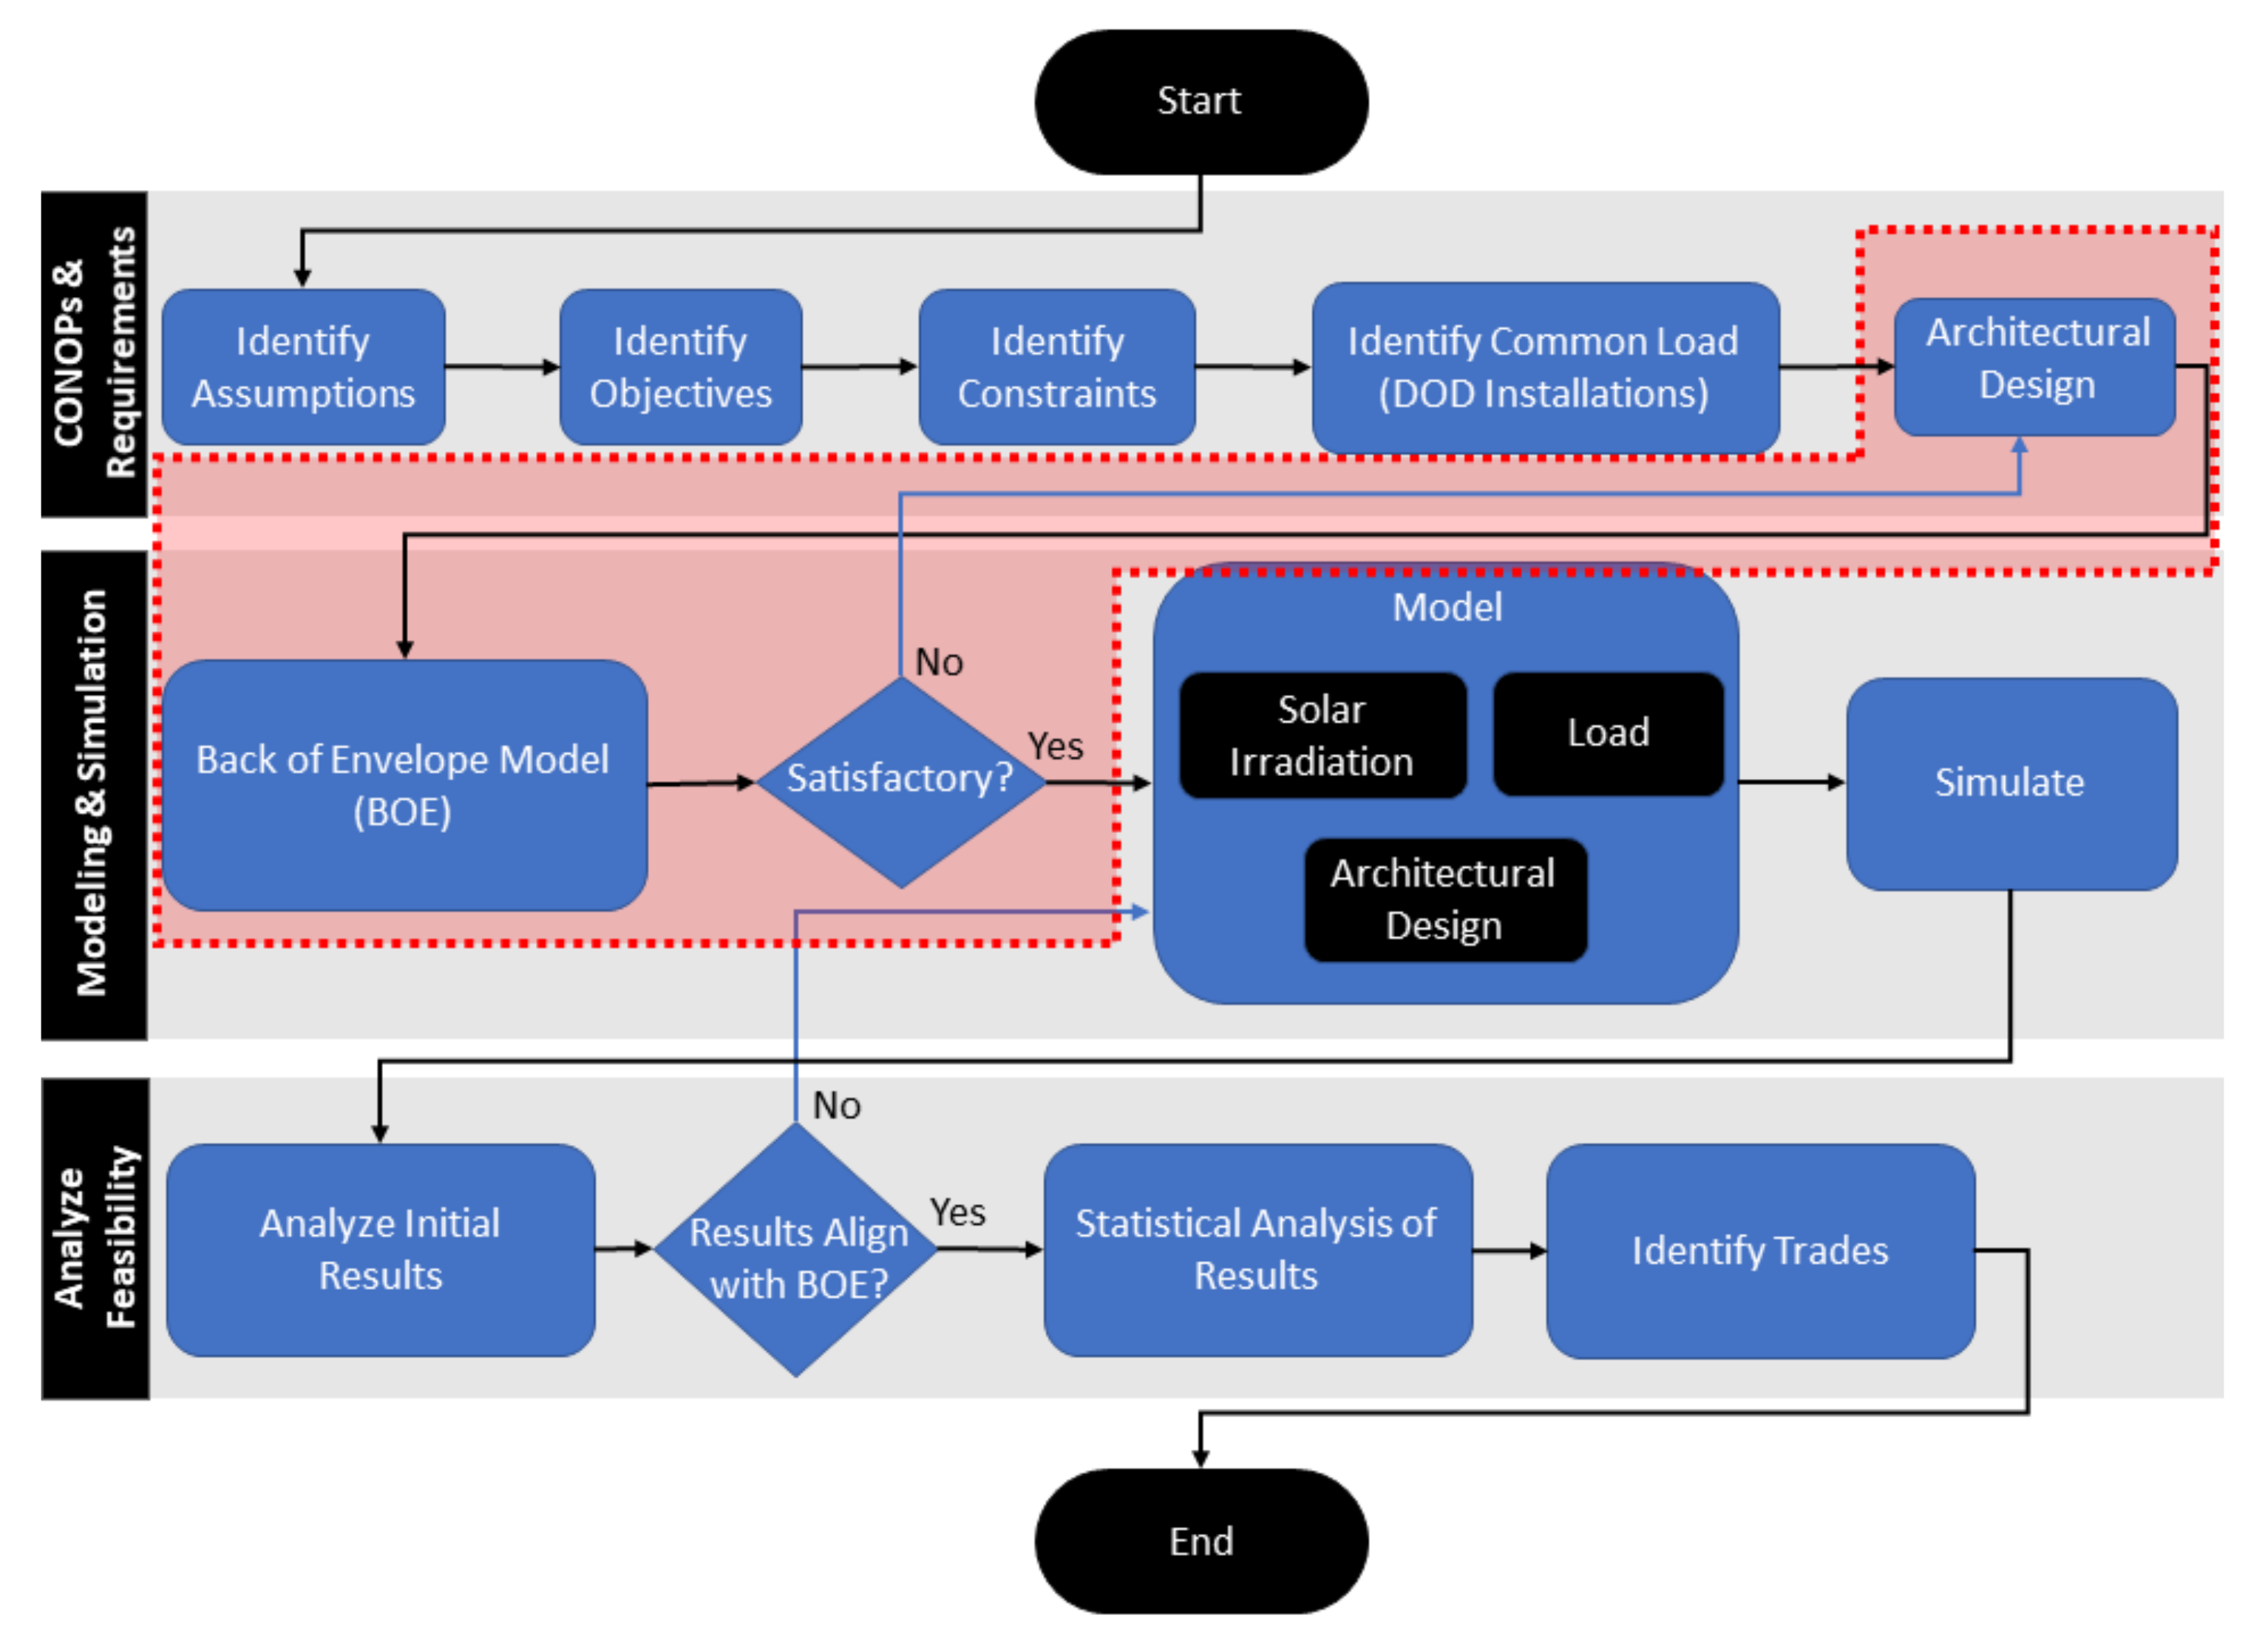
During LSCO, mobile microgrids can provide power to rear-echelon formations and more static consolidation areas while reducing the fuel consumption associated with diesel generators alone. This allows for LSCO logistics to reduce their footprint on the battlefield and push more resources toward the forward edge of the battle area (FEBA). In this mission for example, mobile microgrids are transported with organic military transportation assets. The mobile microgrid is collocated and connected with a division operations center in the division consolidation area. The mobile microgrid uses both the PV array and EDG to charge the BESS, resulting in reduced generator usage and lower logistics demand to provide power to part or all of the operations center loads. When the operations center needs to relocate, the mobile microgrid is disconnected from the load, the EDG is turned off, and the PV array is disconnected and placed back into the container. The mobile microgrid is then loaded on a movement asset, such as a flat bed truck, and staged for movement. This mission set assumes that rear-echelon formations are secure and can allow for an increased signature associated with the PV array. It also assumes that those rear-echelon formations will be static for several days at a time to allow for fuel savings associated with using the mobile microgrid’s EDG and PV array in conjunction. In this mission set, the mobile microgrid is used indefinitely to provide power. Figure 5 shows a CONOPS of the expected areas of the battlefield where mobile microgrids are employed.

4. Methodology

This research employs a systems engineering analysis approach to examine the feasibility of mobile microgrids for backup power on DoD installations. This section presents the methodology used to bound the problem, develop an architectural design, and model and simulate the design for analysis. The typical Systems Engineering “V” process model was adapted to align with available resources for this feasibility analysis. The adapted process flow is shown in Figure 6.

4.1. CONOPS and Requirements

The first level of the process model shows the adapted steps for concept of operations development, requirements development, and high-level design for the mobile microgrid.

4.1.1. Framing Assumptions

This analysis is defined by two framing assumptions:
  • Power outages will likely be accompanied by a fuel-constrained environment such as a natural disaster that restricts fuel transportation due to road damage, damage to nearby supply stores and pipelines, or enemy-targeted SCNs.
  • Risk/Reward Relationship: The risk of an outage of both the host domestic grid and installation microgrid does not warrant each individual critical load on the installation having a designated backup power redundancy such as a single load microgrid.
These framing assumptions help to bound the overall problem and lead to key attributes in the system design. As an example, the assumption that power outages will be accompanied by a fuel-constrained environment leads to examining only hybrid power systems that incorporate some form of renewable energy rather than the traditional method of relying solely on EDGs for installation critical load backup power. The risk and reward relationship leads to a design that is relocatable and therefore not optimized for a specific load but able to meet a generic threshold load.

4.1.2. Indentifying Objectives

Without a defined group of stakeholders and the extensive coordination needed to develop and approve requirements, this research identified system objectives to help guide the high-level system design for use in a feasibility study. The capability need identified in Section 1.1, Motivation and Need, was used to formulate the objectives.
  • Provide an “Off-the-Shelf” solution that allows installation energy managers to treat a mobile microgrid as an equipment purchase rather than going through the design and construction process associated with load-specific implementations for single load microgrids [1].
  • Provide a highly mobile design that supports movement with common DoD installation assets (e.g., 10K forklift, flatbed trucks, and trailers).
  • Support air transportation using common fixed wing military airlift assets (e.g., C-130 or C-17) and rotary wing airlift assets (e.g., CH-47 or CH-53) to support contingency operations, LSCO, and organic military asset long and short-range air transportation.
  • Align with DoD common shipping infrastructure such as flatbed truck, railroad, cargo plane, and cargo ship movement.
  • Provide a solution that offers the potential to support DoD installations, contingency operations, and secure rear-echelon power demands in LSCO.
  • Restore power to critical loads within 30 min of being collocated with the load.
  • Meet an average 10 kW load 12 h a day over 14 days of continuous operation.
  • Reduce the need for fossil fuels and resources external to the DoD installation.

4.1.3. Identify Constraints

Using these objectives the following system constraints were developed:
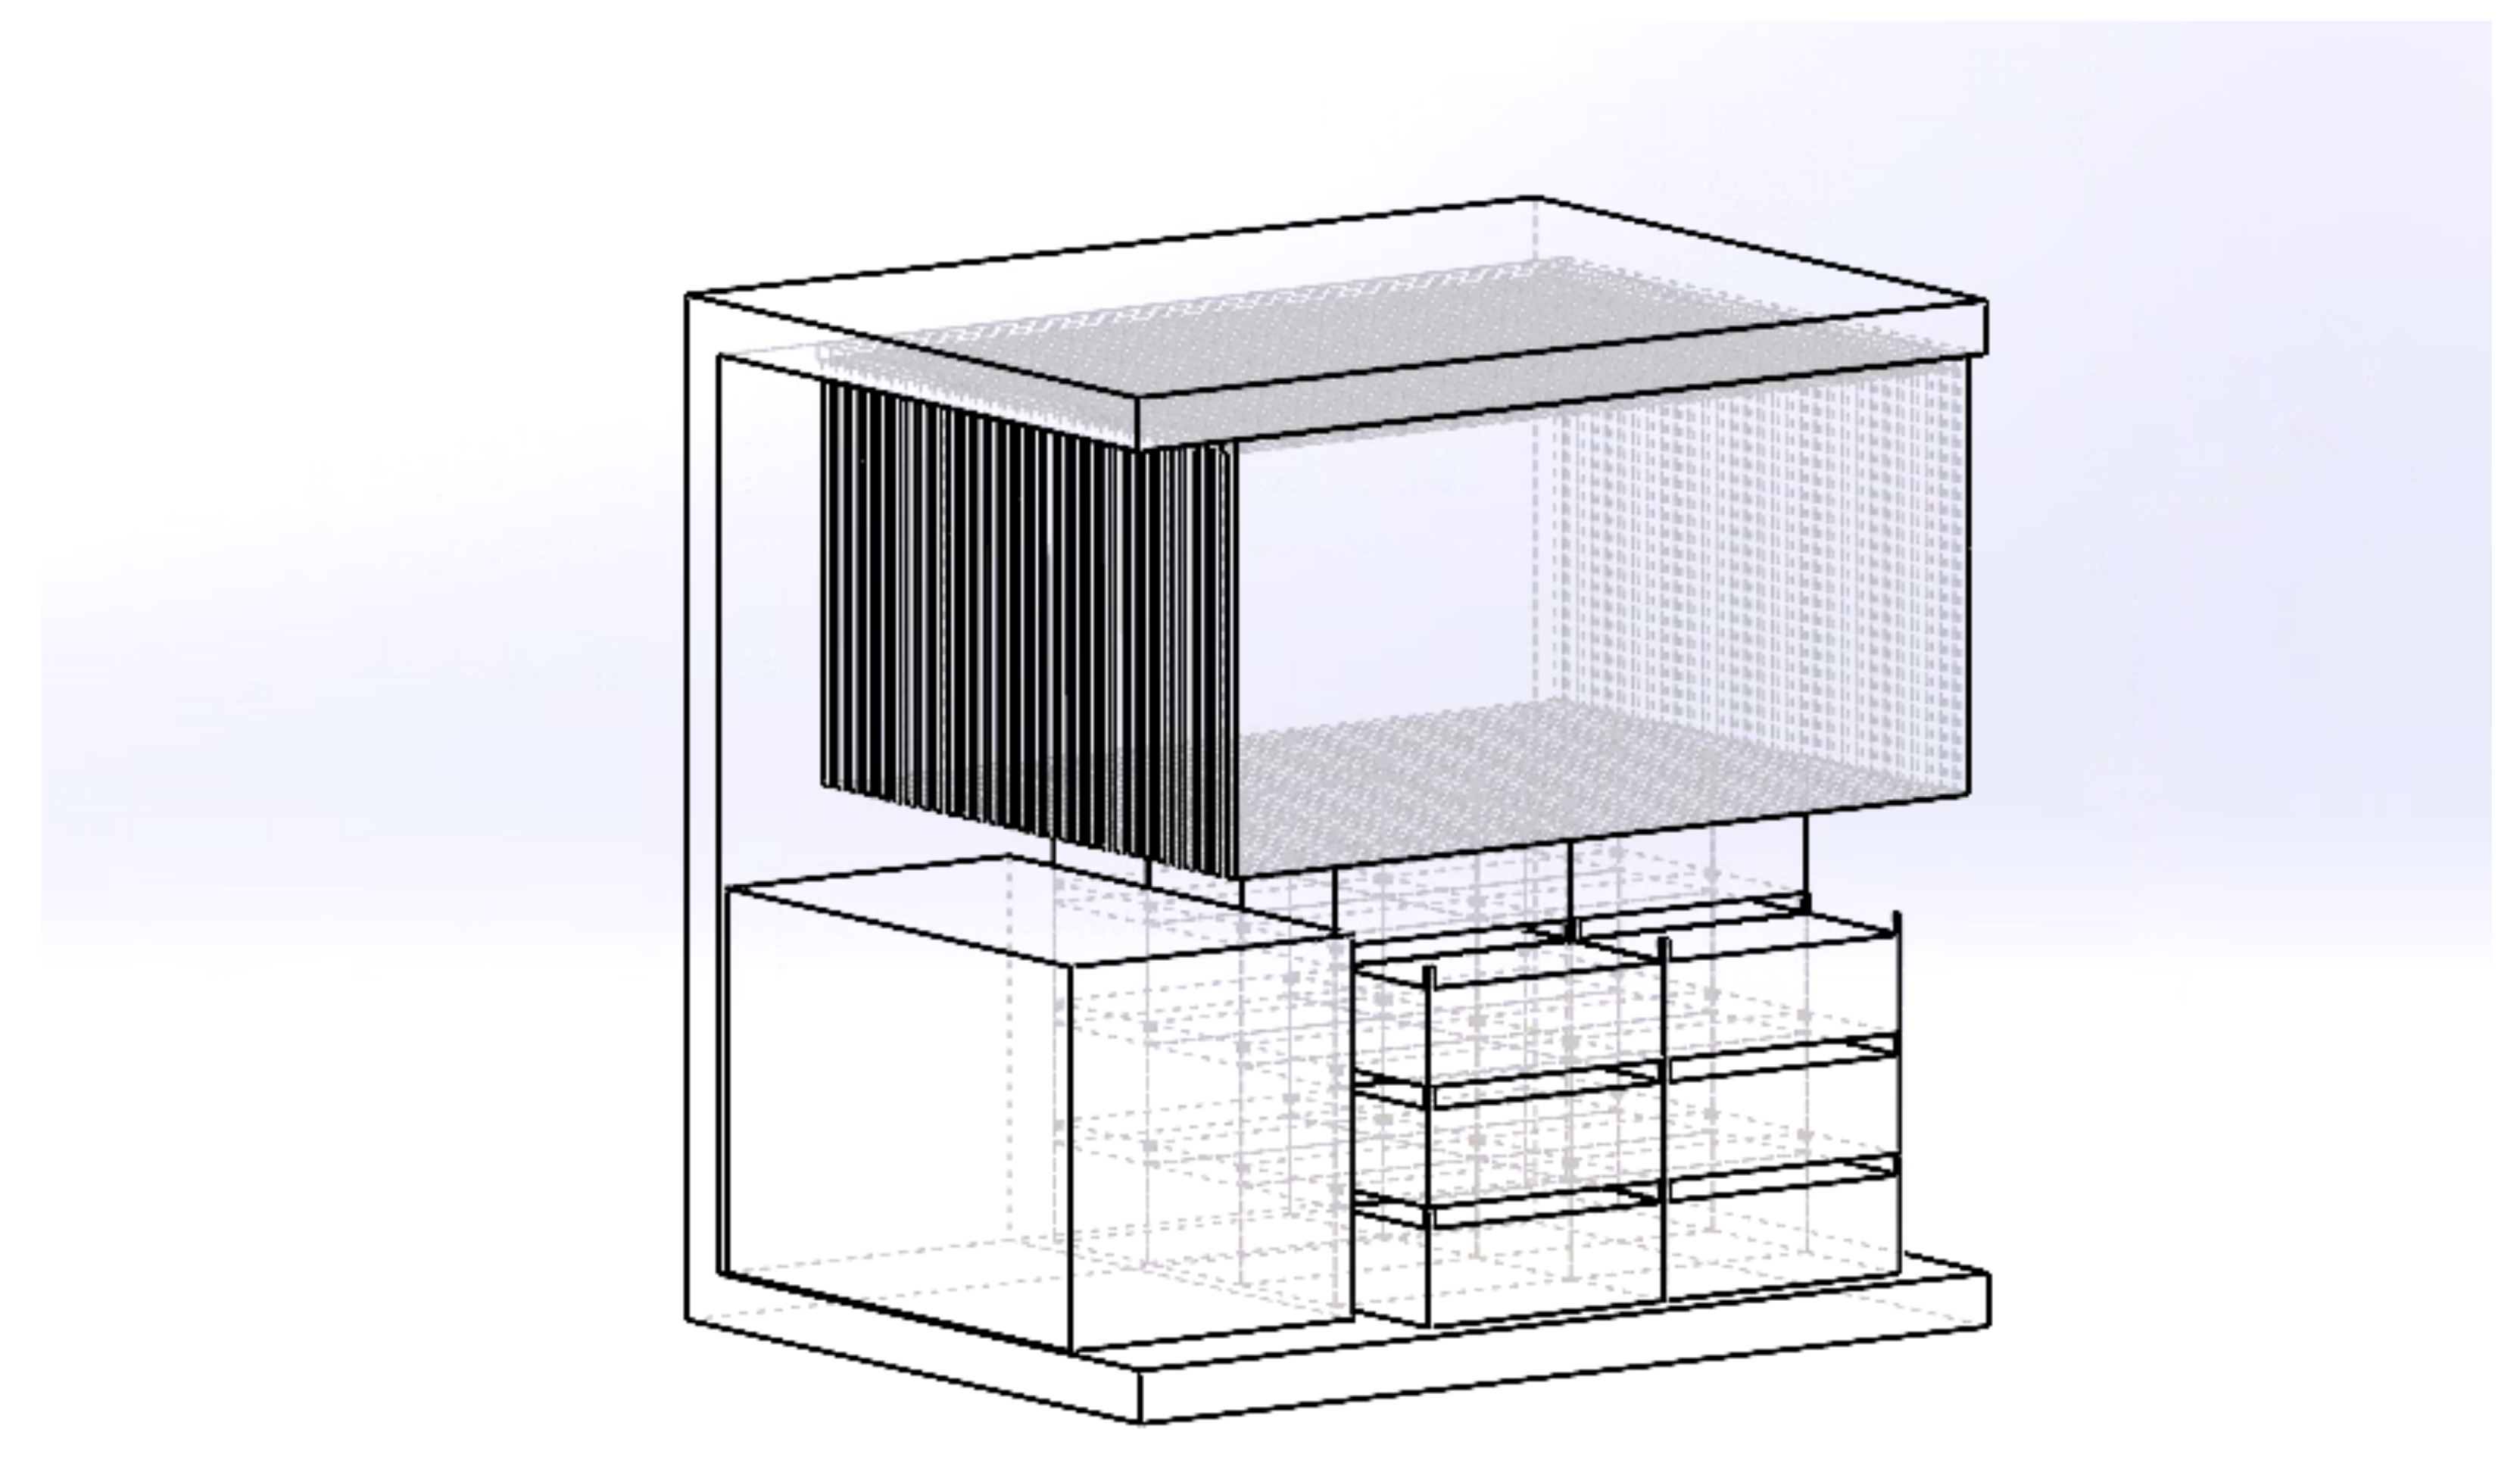
  • The housing for the mobile microgrid in this feasibility study is an International Organization for Standardization (ISO) Triple Container (TriCon).
    -
    The ISO TriCon is a shipping container used heavily by DoD, and is easily transported by both ground and air assets common to DoD and commercial shipping infrastructure. This container constraint was chosen because many DoD forklift assets can move TriCon containers without requiring extensive balancing of the internal load because of the container dimension’s minimal overlap on fork width. This reduces risk in all envisioned operations, requiring only standard training of transportation asset operators.
  • The mobile microgrid must be forklift transportable to allow for quicker reaction to emergent power requirements during an outage of the domestic host grid or microgrid.
    -
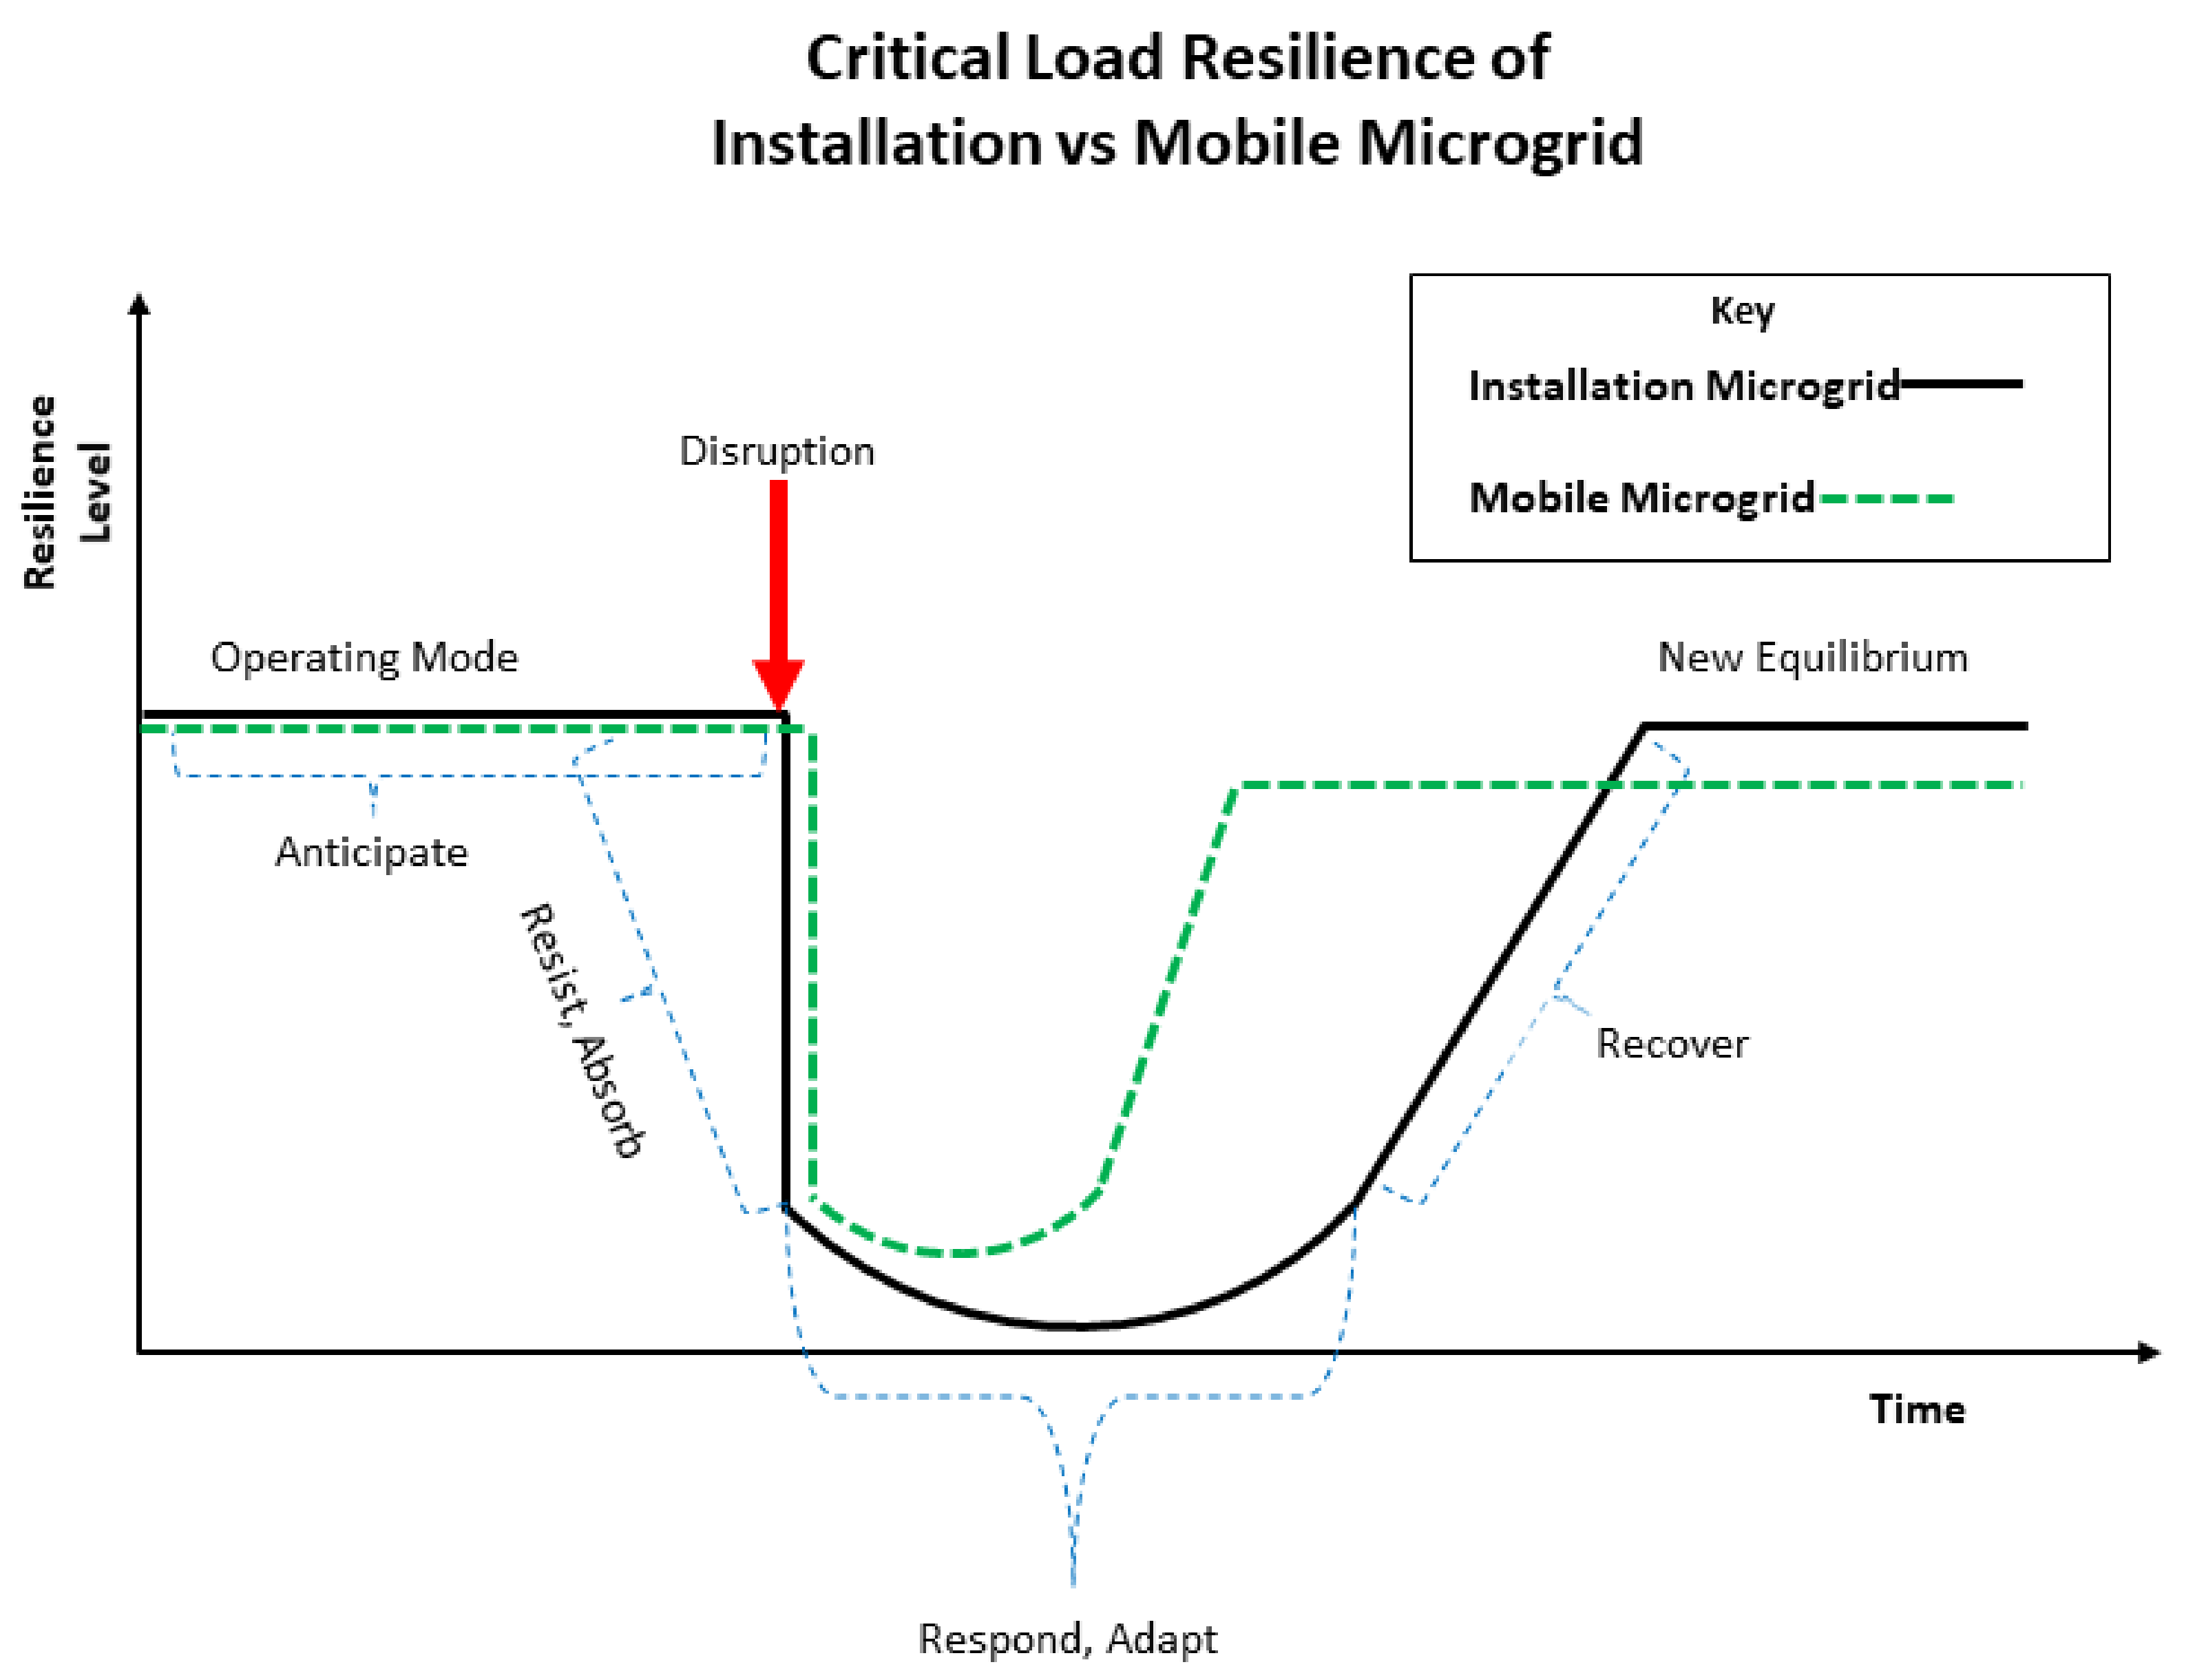
    The concept is to be able to use internal DoD installation assets to quickly relocate a mobile microgrid to the point of need without the use of special assets which may delay responding to the outage (focused on reducing the “Respond, Adapt” and “Recover” phases of the resilience curve in Figure 2). The forklift-compatible constraint primarily constrains the weight of the mobile microgrid, which for this research, is limited to less than 10,000 lbs (approximately 4535 kg) based on an assumption that DoD installations have Rough Terrain Military Forklifts or similar capabilities.
  • The mobile microgrid must be air-transportable.
    -
    For this constraint, both DoD fixed wing and helicopter assets were analyzed. The previous weight restriction of 10,000 lbs (approximately 4535 kg) is more restrictive than the limitations of larger heavy lift rotary wing assets. The other constraint is hazmat considerations associated with the BESS for fixed wing airlift. Helicopter airlift is assumed to be external load only.

4.1.4. Identify Common Load Level (DoD Installations)

Common load data were drawn from previous research utilizing Naval Support Activity (NSA) Monterey. For this research, a small office building of approximately 5500 sqft (approximately 510 m 2 ) with an average load of 2.8 kW and max load of 7 kW was used for initial analysis and design [6]. The threshold value for average load was increased based on common military diesel generator sizing as well as to account for variability in small DoD critical loads. A final threshold value of a 10 kW average load was chosen as the basis of comparison during the feasibility study.
In addition to identifying a threshold average critical load, this research also used average peak sun hours for the United States to identify the range of solar irradiance operating conditions for the system [49,50,51]. Global Horizontal Solar Irradiance (GHI) was used as the more conservative reference for solar energy and a conservative average of three peak sun hours was chosen as the initial baseline for analysis.

4.1.5. Architectural Design

The architectural design of the mobile microgrid provides a high-level system design focused on hybrid power generation and energy storage within the size constraint of an ISO TriCon container and weight constraints for transportation with common DoD forklift assets. The architectural design then becomes a study into energy density within the sizing and weight constraints to provide a solution that meets the identified threshold average load for 14 days of operation while reducing generator usage assuming the corollary with fuel consumption. The military mission set of the mobile microgrid dictates that some requisite level of power generation comes from non-renewable sources to ensure operations during periods of low renewable power generation. To simplify system design and better manage transient power issues, the design employs a low voltage architecture that runs the load directly from a BESS.
After identifying assumptions, objectives, constraints, and general design metrics such as average load and peak sun hours, a short analysis of renewable power generation was examined. Based on experience with DoD installations, DoD transportation, and research into the size, mobility, and energy reliability of various renewable power generation techniques, PV arrays were chosen as the method for renewable power generation.
The chosen architectural design consists of an EDG, PV array, and BESS.

4.2. Modeling and Simulation

A back of the envelope (BOE) model was developed using the design constraints and a single day of operation. The BOE model outputs were compared to previous hybrid power research modeling to verify results [52,53]. The model was then used to find a satisfactory combination of PV, BESS, and EDG power within the size and weight constraints to meet the required load. The model leverages commercial off the shelf (COTS) components for the architectural design. Because a variety of potential COTS components, within the ranges of the objectives, were compared, an optimization of component specifications was not run. Instead, the specifications from the components that provided the most satisfactory outputs were used. This study does not prescribe the components to use but intends, instead, to only show the feasibility of constructing a mobile microgrid from COTS components that meet the DoD need.

4.2.1. Model

The BOE was expanded and the mobile microgrid was modeled in Microsoft Excel to provide the following outputs for use as metrics in the feasibility analysis:
  • EDG Usage: Calculated as a percent of time compared to running the load only from an EDG.
  • Average Load per Day: The load is randomized using a normal distribution and standard deviation around a mean of the threshold average load.
  • Load Shed: Calculated as the ratio of the amount of unserved load by the mobile microgrid to the total load demanded.
  • Average Sun Hours: The average peak sun hours over the period of operation provides a more widely used and simplified metric to understand the level of conservatism of the model’s renewable power generation.
The model was constructed as a discrete stochastic model using time steps of 30 min. The solar input data comes from the National Renewable Energy Laboratory (NREL) GHI Database for each use case area. The GHI data provided values that represent both national low averages and national high averages to gain greater insight into the performance of the system based on varying solar irradiance [49]. The load was randomized using a normal distribution with the mean at the threshold average load value.

4.2.2. Simulate

The model was simulated using the more rigorous standard of 14 days-of-autonomy used by the Army and Marine Corps [30,31]. Oracle’s Crystal Ball software was used with the Excel model to run Monte Carlo simulations for each use case. Use cases are based on regions in the continental United States and were chosen to examine average highs and below average lows for solar irradiance.

4.3. Analyze Feasibility

4.3.1. Analyze Initial Results

After simulating the model, the output data were analyzed and checked against the BOE calculations to ensure the model was returning expected results. Any unexpected results were further analyzed to determine if the model required refinement or changes. Once a final model was constructed and validated, Monte Carlo simulations were run again, and a more in-depth analysis of the output data was conducted.

4.3.2. Statistical Analysis of Results

Once final Monte Carlo simulations were run, a statistical analysis of the output data was conducted. This statistical analysis provided the basis for the feasibility analysis of the mobile microgrid design.

4.3.3. Identify Trade-Offs

In addition to assessing the feasibility of the mobile microgrid design, this research also seeks to understand the trade-offs associated with choosing a mobile microgrid design over a static customized single load microgrid to support a critical load. Although the model does not statistically support all of the trade-offs identified, because that level of modeling is beyond the scope of this research, the trade-off discussion includes important factors when making decisions related to backup power solutions.

5. Preliminary Proposed Design

The preliminary proposed design for the mobile microgrid is done at a systems engineering analysis level and provided an architectural design but not a detailed design for this analysis. The preliminary design investigates power production and energy storage from three primary components: the PV array, the BESS, and the EDG. The following processes and high-level calculations provide an example for formulating a hybrid power BOE. These processes can be modified to create alternate hybrid power solutions or take the research further to develop a more detailed model.
The following preliminary proposed design steps provide greater detail into the portion of Mobile Microgrid SE Process Model that iterates the architectural design by modifying the BOE with different combinations of COTS component specifications, and then examining for the satisfactoriness of the design as seen in Figure 7 highlighted with the red box.

5.1. Sizing

The first task in the preliminary design was to examine COTS components that fit within the sizing constraints of an ISO TriCon. Three major categories of components in the architectural design are examined: PV panels, batteries for BESS, and EDGs. The initial concerns in sizing were identifying COTS PV panels that could fit in a stored configuration in an ISO TriCon. Table 1 represents the averages of COTS specifications for different sizes of components considered in this analayis. For PV, all values shown are for Standard Test Conditions (STC).

5.2. Load Analysis

The second step was a load analysis of an average 10 kW load. The total load was analyzed using the following initial assumptions:
  • Average threshold load = 10 kw
  • Operating hours per day = 8 h
  • Inverter/Charger efficiency = 0.85
  • Peak Sun Hours in Worst Month = 3 h/day@1-sun
  • System Voltage = 48 V, chosen because it is within DoD safety standards for untrained personnel to work on the system (e.g., place PV panels, connect and fuel EDG) while the system is running [76,77,78].
The total direct current load in kAh/day was calculated with these initial assumptions using Equation (1) and found to be 1.96 kAh/day (94.12 kWh/day) [79].
Total DC Load k A h / day = Average Threshold Load × Operating Hours ( Inverter Charger Efficiency × System Voltage )
After identifying a reasonable DC Load for a small DoD critical load, a design month fraction is identified which is the percent of total power in the lowest solar irradiance month that the solar will provide in a hybrid system [79]. The design month fraction was calculated for an arbitrary annual solar fraction to develop the framework for the initial construction of a BOE.
Equations (2) and (3) were used to determine the design month fraction based on an arbitrary annual solar fraction [79]. The annual solar fraction represents the desired percent of total power provided on average throughout the year from the PV array. Equation (2) is used when the annual solar fraction will be less than or equal to 80% and Equation (3) is used when the annual solar fraction is greater than 80% [79]. Initially assuming a 60% annual solar fraction for the preliminary design, the calculated design month fraction for the BOE was 0.375, meaning approximately 37.5% of total power provided in the worst solar irradiance month will come from the PV array.
Design - month Solar Fraction = 0.625 × Annual Solar Fraction
Design - month Solar Fraction = 0.50 + 28 ( Annual Solar Fraction 0.80 ) 2.5
Using the design month fraction and total DC load, the design month load for the PV array can be determined using Equation (4) [79].
Design - month Load k A h / day = Total DC Load × Design - month Fraction
The preliminary design month load was 0.735 kAh/day.

5.3. PV Sizing

After completing the load analysis, different COTS specifications for PV panels were used to determine the number of panels (with chosen specifications) required to meet the calculated design month fraction. The initial PV sizing was analyzed using the following initial assumptions:
  • Rated panel current = 10.92 A
  • Nominal panel voltage = 50.01 V
  • Coulomb Efficiency = 0.9
  • De-rating factor of the panel = 0.9
Remember that insolation was assumed to be 3h/day@ 1-sun for the worst month of solar based on average low values for the continental United States [49]. The following equations are used to calculate the power output per day from a single string of the PV panel being examined, the number of strings of panels needed to meet the design month load, and the number of panels in each string to meet the system voltage requirements. Using Equation (5), the Ah/day-string calculated was 26.54 Ah/day-string [79].
Ah / day - string = Insolation h / day @ 1 sun × I R ( A ) × Coulomb Efficiency × De - rating Factor
From the daily power output of a single string and the initial assumptions, using Equation (6), the total number of strings of PV panels required was determined to be 28 strings [79]. For this equation, the number of strings was rounded up to the nearest whole number.
Strings in parallel = Design - month load ( Ah / day ) Ah / day per string in design month
Remember that system voltage is 48 V and thus Equation (7) was used to find the number of PV panels needed in series for each string to meet the system voltage [79].
Panels in series = System voltage ( V ) Nominal Panel voltage ( V )
Again, the number of PV panels in series must be rounded up to the nearest whole number. Based on the assumptions for this particular initial calculation, it was found that only one panel per string was needed and did not require panels in series in each string. This outcome changed depending on the COTS PV panel specifications being used. Using the calculated values from Equations (6) and (7) in Equation (8), the total number of PV panels required by the system is 28 panels [79].
Number of PV Panels = Number of Strings in Parallel × Number of Panels in Series
The total number of PV panels can then be used to understand sizing and volume consumption in the total TriCon space available. The above calculations were run iteratively along with BESS sizing calculations and EDG sizing calculations to determine a satisfactory combination of major components that meet the size and weight constraints of the system.

5.4. BESS Sizing

The initial BESS sizing was analyzed using the following initial assumptions:
  • Usable days of storage = 1.5 days
  • Using Lithium Iron Phosphate (LiFePO4) Batteries with a maximum depth of discharge (MDOD) of 98%
  • A temperature correction factor (TCF) at 5 o Celcius for LiFePO4 Battery, TCF = 0.90
  • Nominal battery voltage = 48 V
  • Single battery capacity = 100 Ah
To size the BESS, the usable storage (Ah) needed from the system was determined using Equation (9) which assumes a perfect battery solution (e.g., no inefficiencies) [79]. The calculated usable storage based on initial assumptions was 2.94 kAh.
Usable Storage Capacity ( Ah ) = Total DC load ( Ah / day ) × Usable days of storage ( days )
Then using specifics for the COTS battery specifications being examined, stated in the initial assumptions, the total storage capacity of the BESS needed for the specific battery can be determined using Equation (10) [79]. The total storage capacity calculated for initial assumptions was 3.33 kAh.
Total Storage Capacity = Usable Storage Capacity ( Ah ) ( MDOD ) × ( TCF )
After determining total storage capacity needed from the BESS, the number of batteries in series per string was determined using Equation (11) and the number of strings of batteries in parallel needed was determined using Equation (12). Each of these calculated values are rounded up to the nearest whole number and can be used to determine the total number of batteries required by the BESS [79]. The calculated number of batteries in series per string was one battery. The calculated number of strings of batteries in parallel was 34 strings. The total number of batteries required for the BESS was 34 batteries, found using Equation (13).
Number of batteries in series = System voltage ( V ) Nominal battery voltage ( V )
Number of strings of batteries in parallel = Total storage capacity ( Ah ) Capacity of a sin gle battery ( Ah )
Number of Batteries = Number of Strings of Batteries × Number of Batteries in Series
Again, the battery sizing calculations are run iteratively with the PV sizing and generator sizing calculations across available COTS options to find a satisfactory combination of major components within the size and weight constraints of the system.

5.5. Generator Sizing

The initial generator sizing was analyzed using the following assumptions:
  • The system required a charge time of 20 h.
  • The charger efficiency is 80%.
Finally, the EDG is sized to replenish the batteries in a reasonable amount of time but not to exceed five hours to avoid damage to the BESS using Equation (14) [79]. The initial calculation for generator size was 10,004 W.
Generator ( W ) = Total storage capacity ( Ah ) × System voltage ( V ) Charge time ( h ) × Charger efficiency
The generator power output per year and run time per year can then be estimated using Equations (15) and (16) [79]. These calculations will offer points of comparison between the BOE calculations and the more detailed model to help verify the final model. The initial estimate for generator output per year was 17,176.5 kW/yr and annual generator run time was 1717 h/yr.
Generator ( kWh / yr ) = Total DC load ( Wh / day ) × 365 ( day / yr ) × ( 1 Annual solar fraction ) 1000 ( W / kW ) × Charger efficiency
Generator run time ( h / yr ) = Generator ( kWh / yr ) Generator rated power ( kW )
The above calculations were built into a BOE for a single day using a worst month average of 3 h/day@1-sun to find a satisfactory combination of PV, BESS, and generator sizing across potential COTS components to establish the preliminary design. This process was iterative, and Microsoft Excel was used to develop the BOE. The final component specifications and quantities chosen as the preliminary design and used for feasibility analysis are shown in Table 2. Figure 8 shows the physical sizing of the three major components in quantity as specified by Table 2 when placed inside an ISO TriCon.

6. Mission Engineering Analysis

In order to determine the feasibility of the proposed mobile microgrid, Monte Carlo simulations were run on the mobile microgrid model across several mission scenarios using the below assumptions for stochastic input distributions. The mission scenarios include operating during periods of low solar irradiance (January in the northern hemisphere), during times of high solar irradiance (July), and in scenarios where the average load stresses the mobile microgrid beyond design limits.
  • The average threshold load is set using a normal distribution with mean of 10 kW and standard deviation of 2 kW.
  • The number of PV panel strings in parallel is set using a uniform discreet distribution with minimum of 27 and maximum of 30 panels. This assumes that there may be up to three panels (10% of the proposed PV array) not working in our system at any one time from occurrences such as damage due to transportation, mishandling, or poor connections.
  • The Coulomb efficiency for PV panels uses a triangular distribution with a minimum of 0.80, a likeliest of 0.9 and maximum of 0.93. This provided more conservative results from the model’s solar power generation than using a fixed Coulomb efficiency of 0.90 which some simplified solar models recommend [79].
  • The panel De-rating Factor, essentially a parameter of panel efficiency, is a triangular distribution with a minimum of 0.85, likeliest of 0.9, and maximum of 0.93. This also provides more conservative results from the model’s solar power generation than using a fixed De-rating Factor of 0.90 which some basic solar models recommend [79].
  • The generator set uses a triangular distribution with max at 10 kW and likeliest at 9 kW and minimum at 8.5 kW for short duration run times to correlate to the model timestep of 30 min. This accounts for the generator running at outputs that align with its continuous output power specifications. This ensures the mobile microgrid can support more stressing scenarios where solar irradiance is lower or when work hours are extended outside of normal business hours during contingency and emergency operations.
  • Panel rated current uses a uniform distribution from 10 A to 10.88 A to account for variations in panel reliability from panel to panel and other factors such as dust.
BESS initial charge level was set to 2500 Ah. This assumes that the mobile microgrid is stored with the BESS charged to approximately 75% of its total capacity before being connected to the critical load. This is achieved by storing the mobile microgrids in a grid-connected mode. Many of the above assumptions are used in the same calculations within the model for power output. Applying these more conservative distributions to the model input variables essentially compounded the conservatism of the model and provided a higher level of confidence that the architectural design will perform at or beyond expectations in more stressing scenarios. The Monte Carlo simulation used 10,000 runs to generate a level of precision of approximately 1 h in all metrics being examined [80].

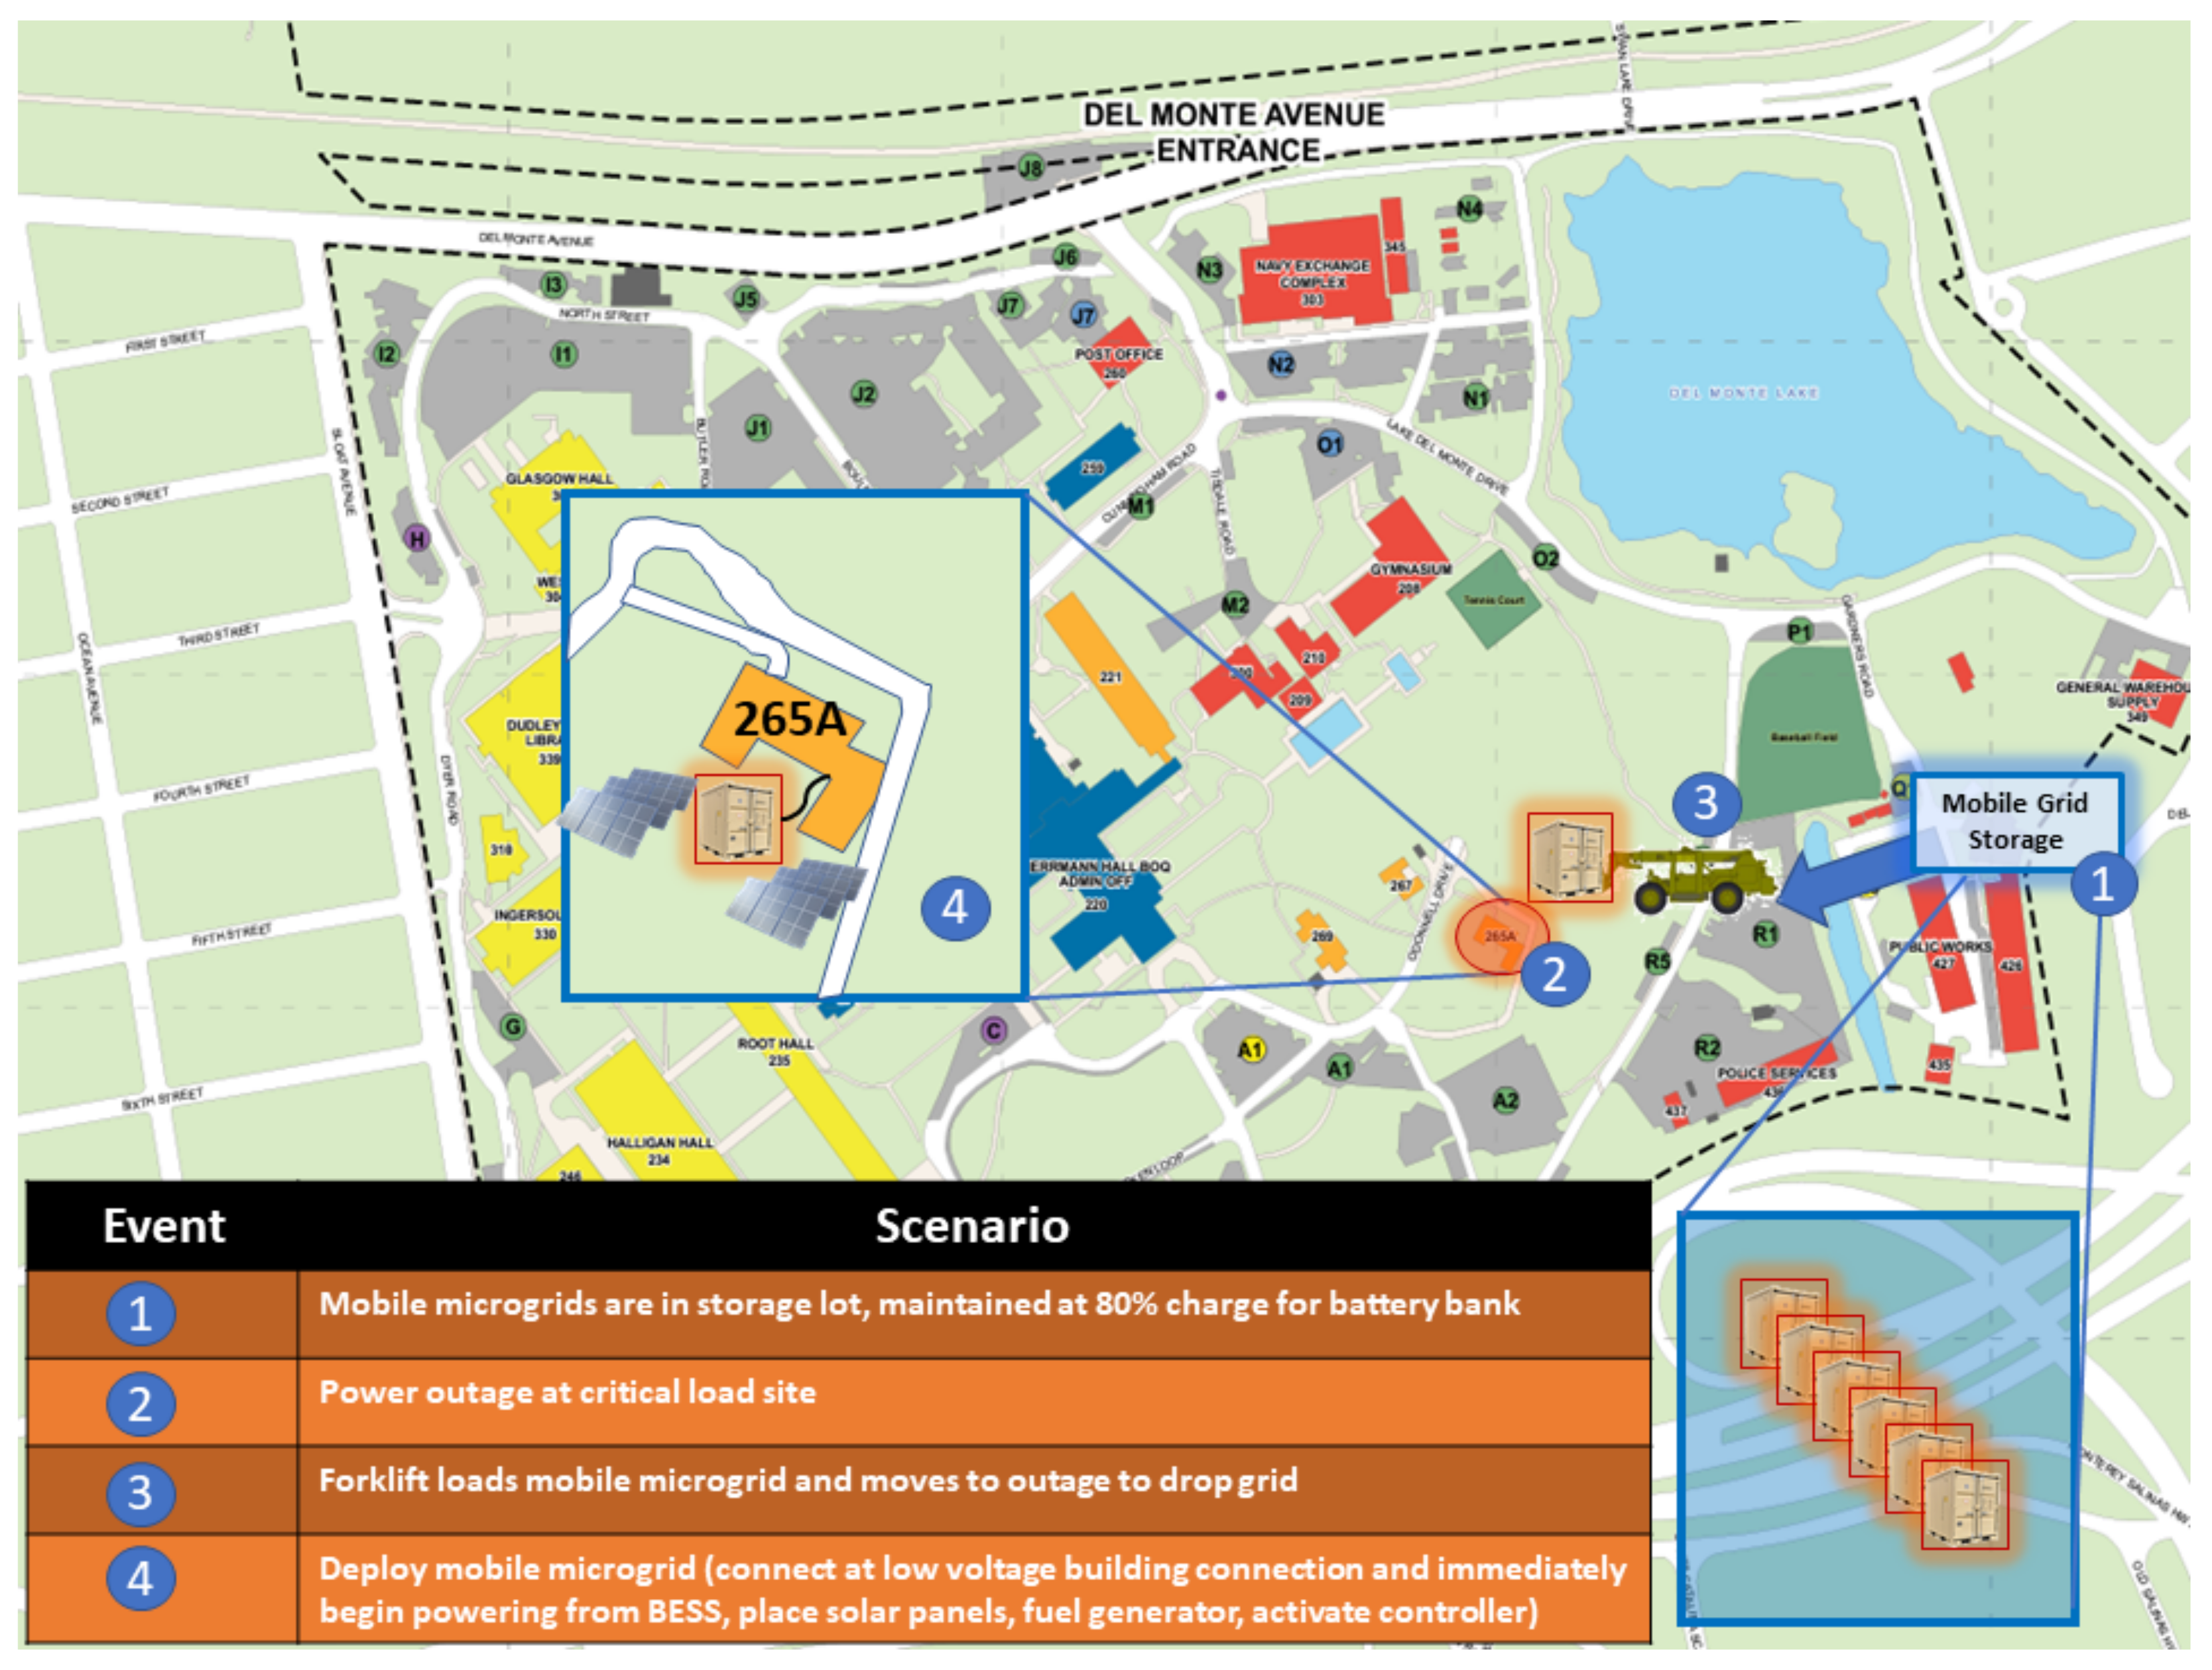
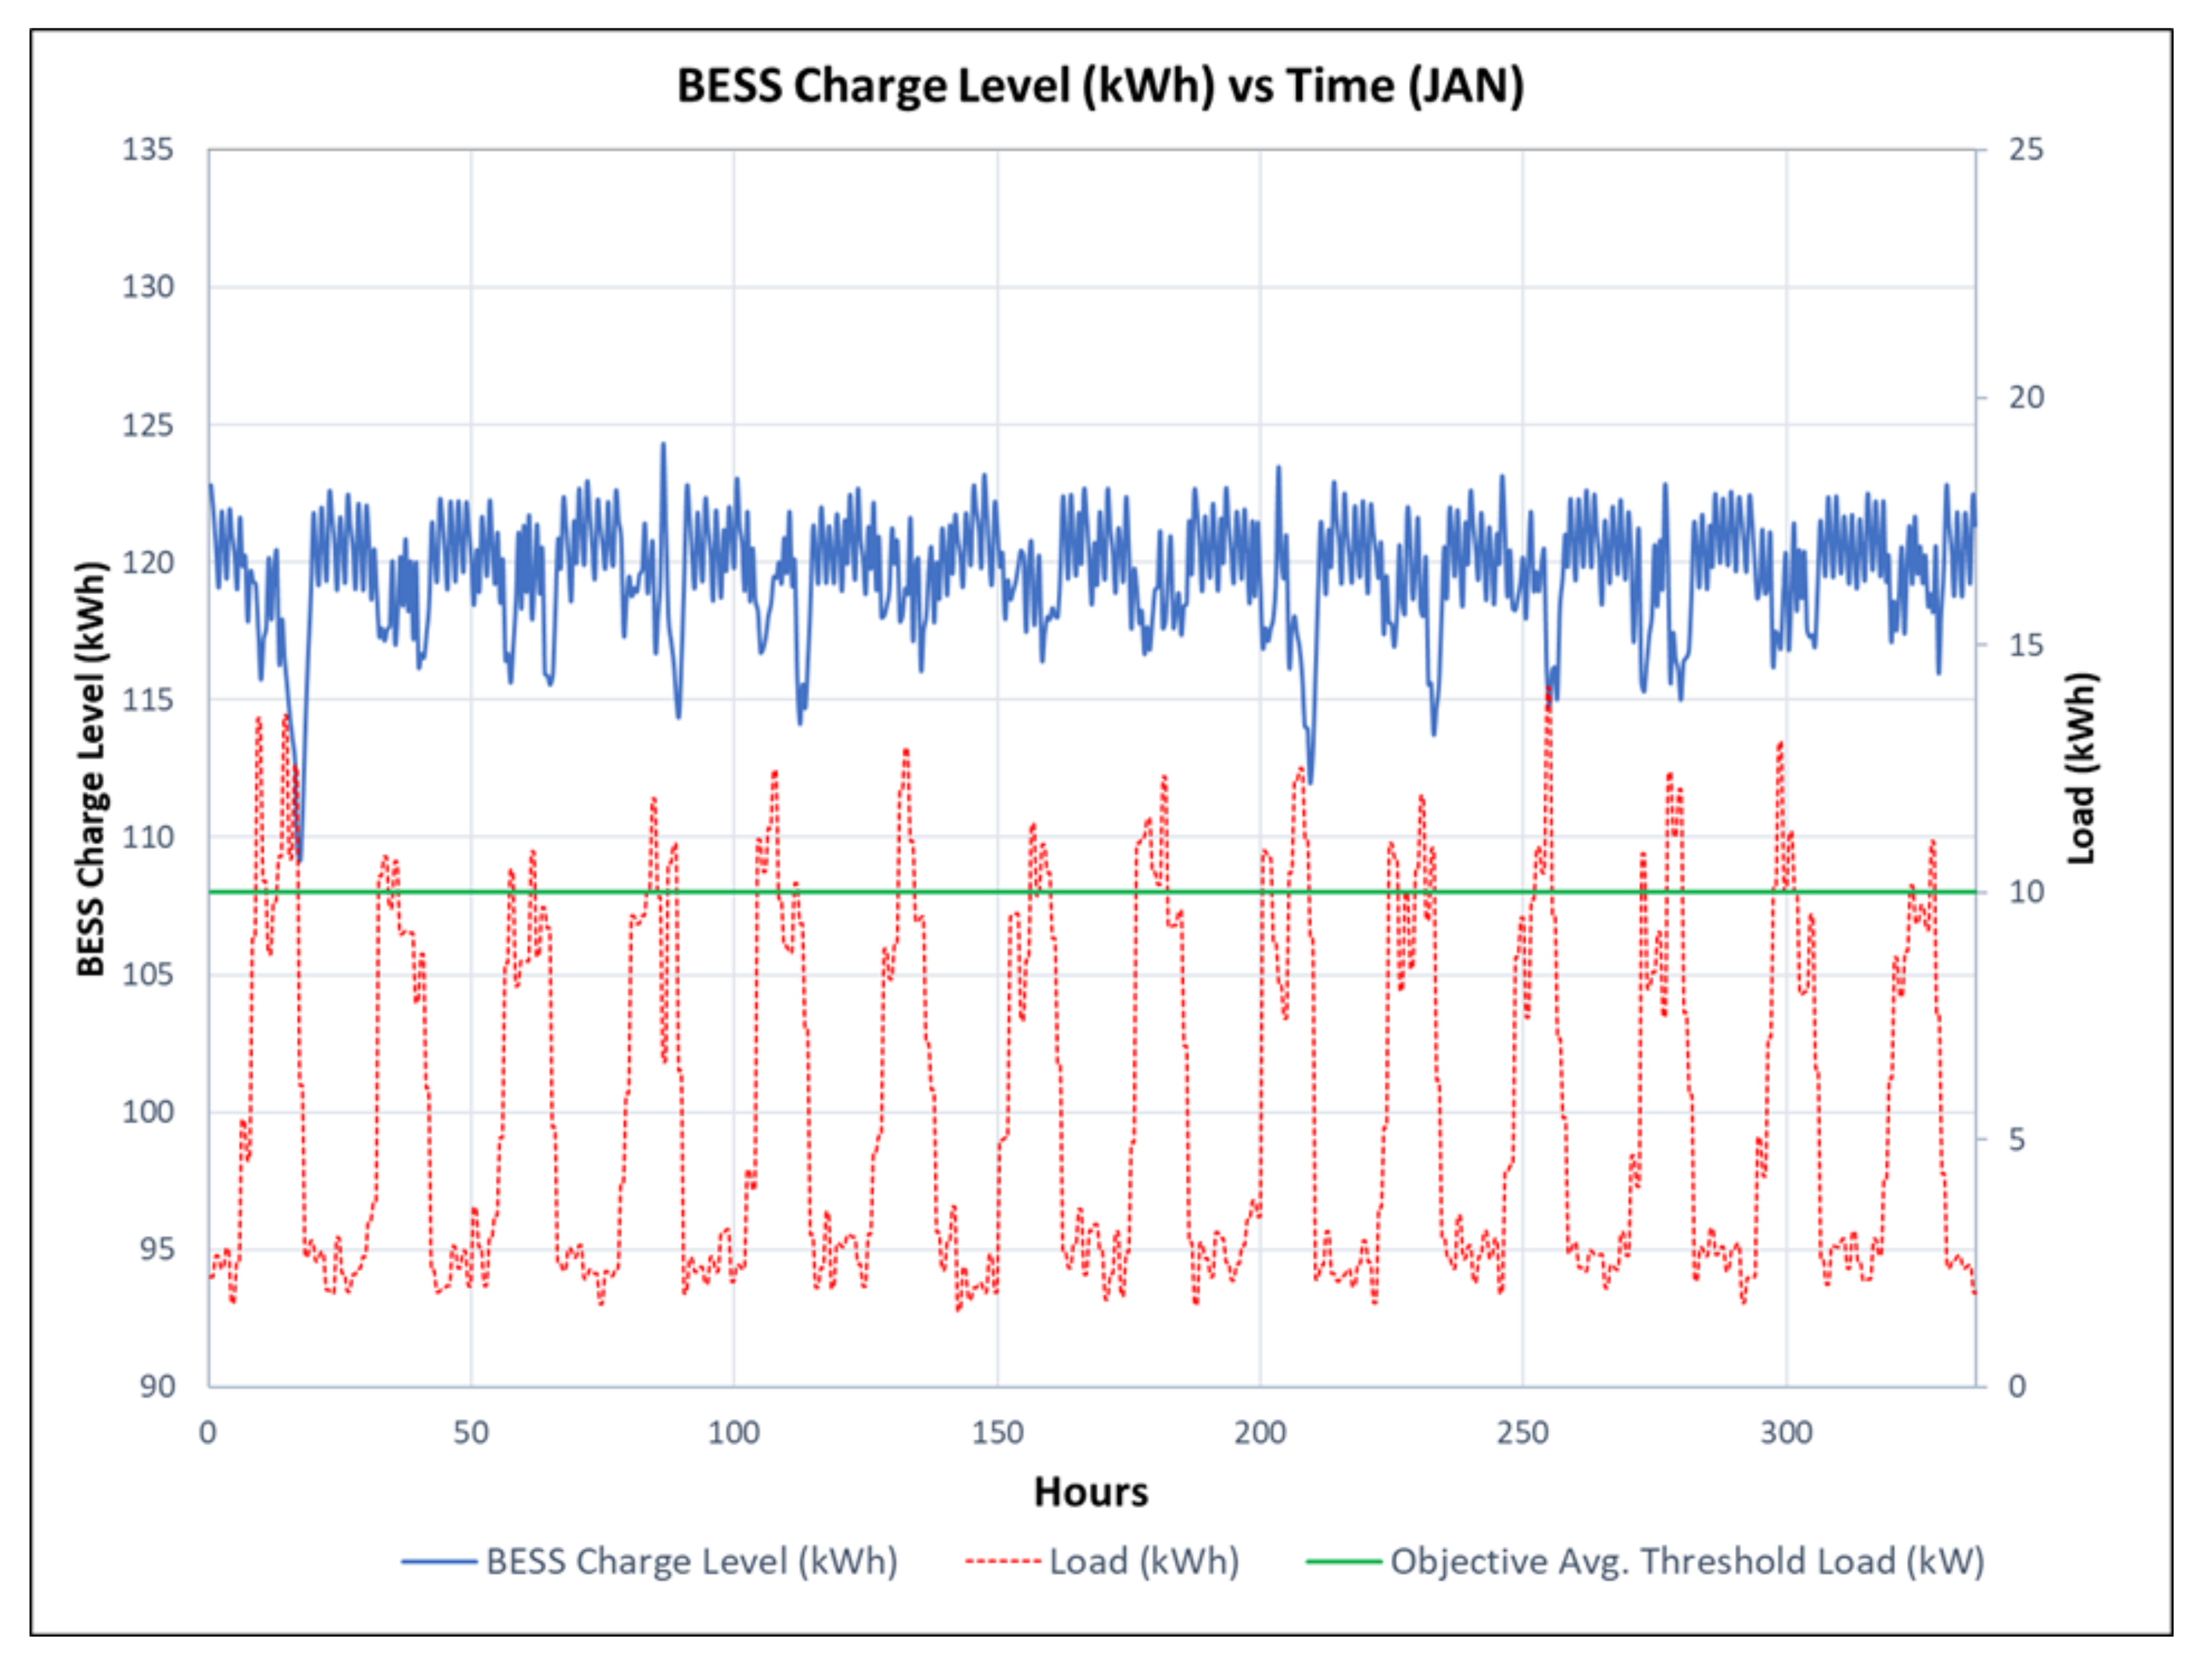
6.1. Feasibility Use Case NSA Monterey

In order to assess feasibility of the mobile microgrid design, Naval Support Activity (NSA) Monterey in California was used to conduct analysis. Two 14-day time periods, one in January and one in July, were examined using historic NREL GHI data from 2020 [81].

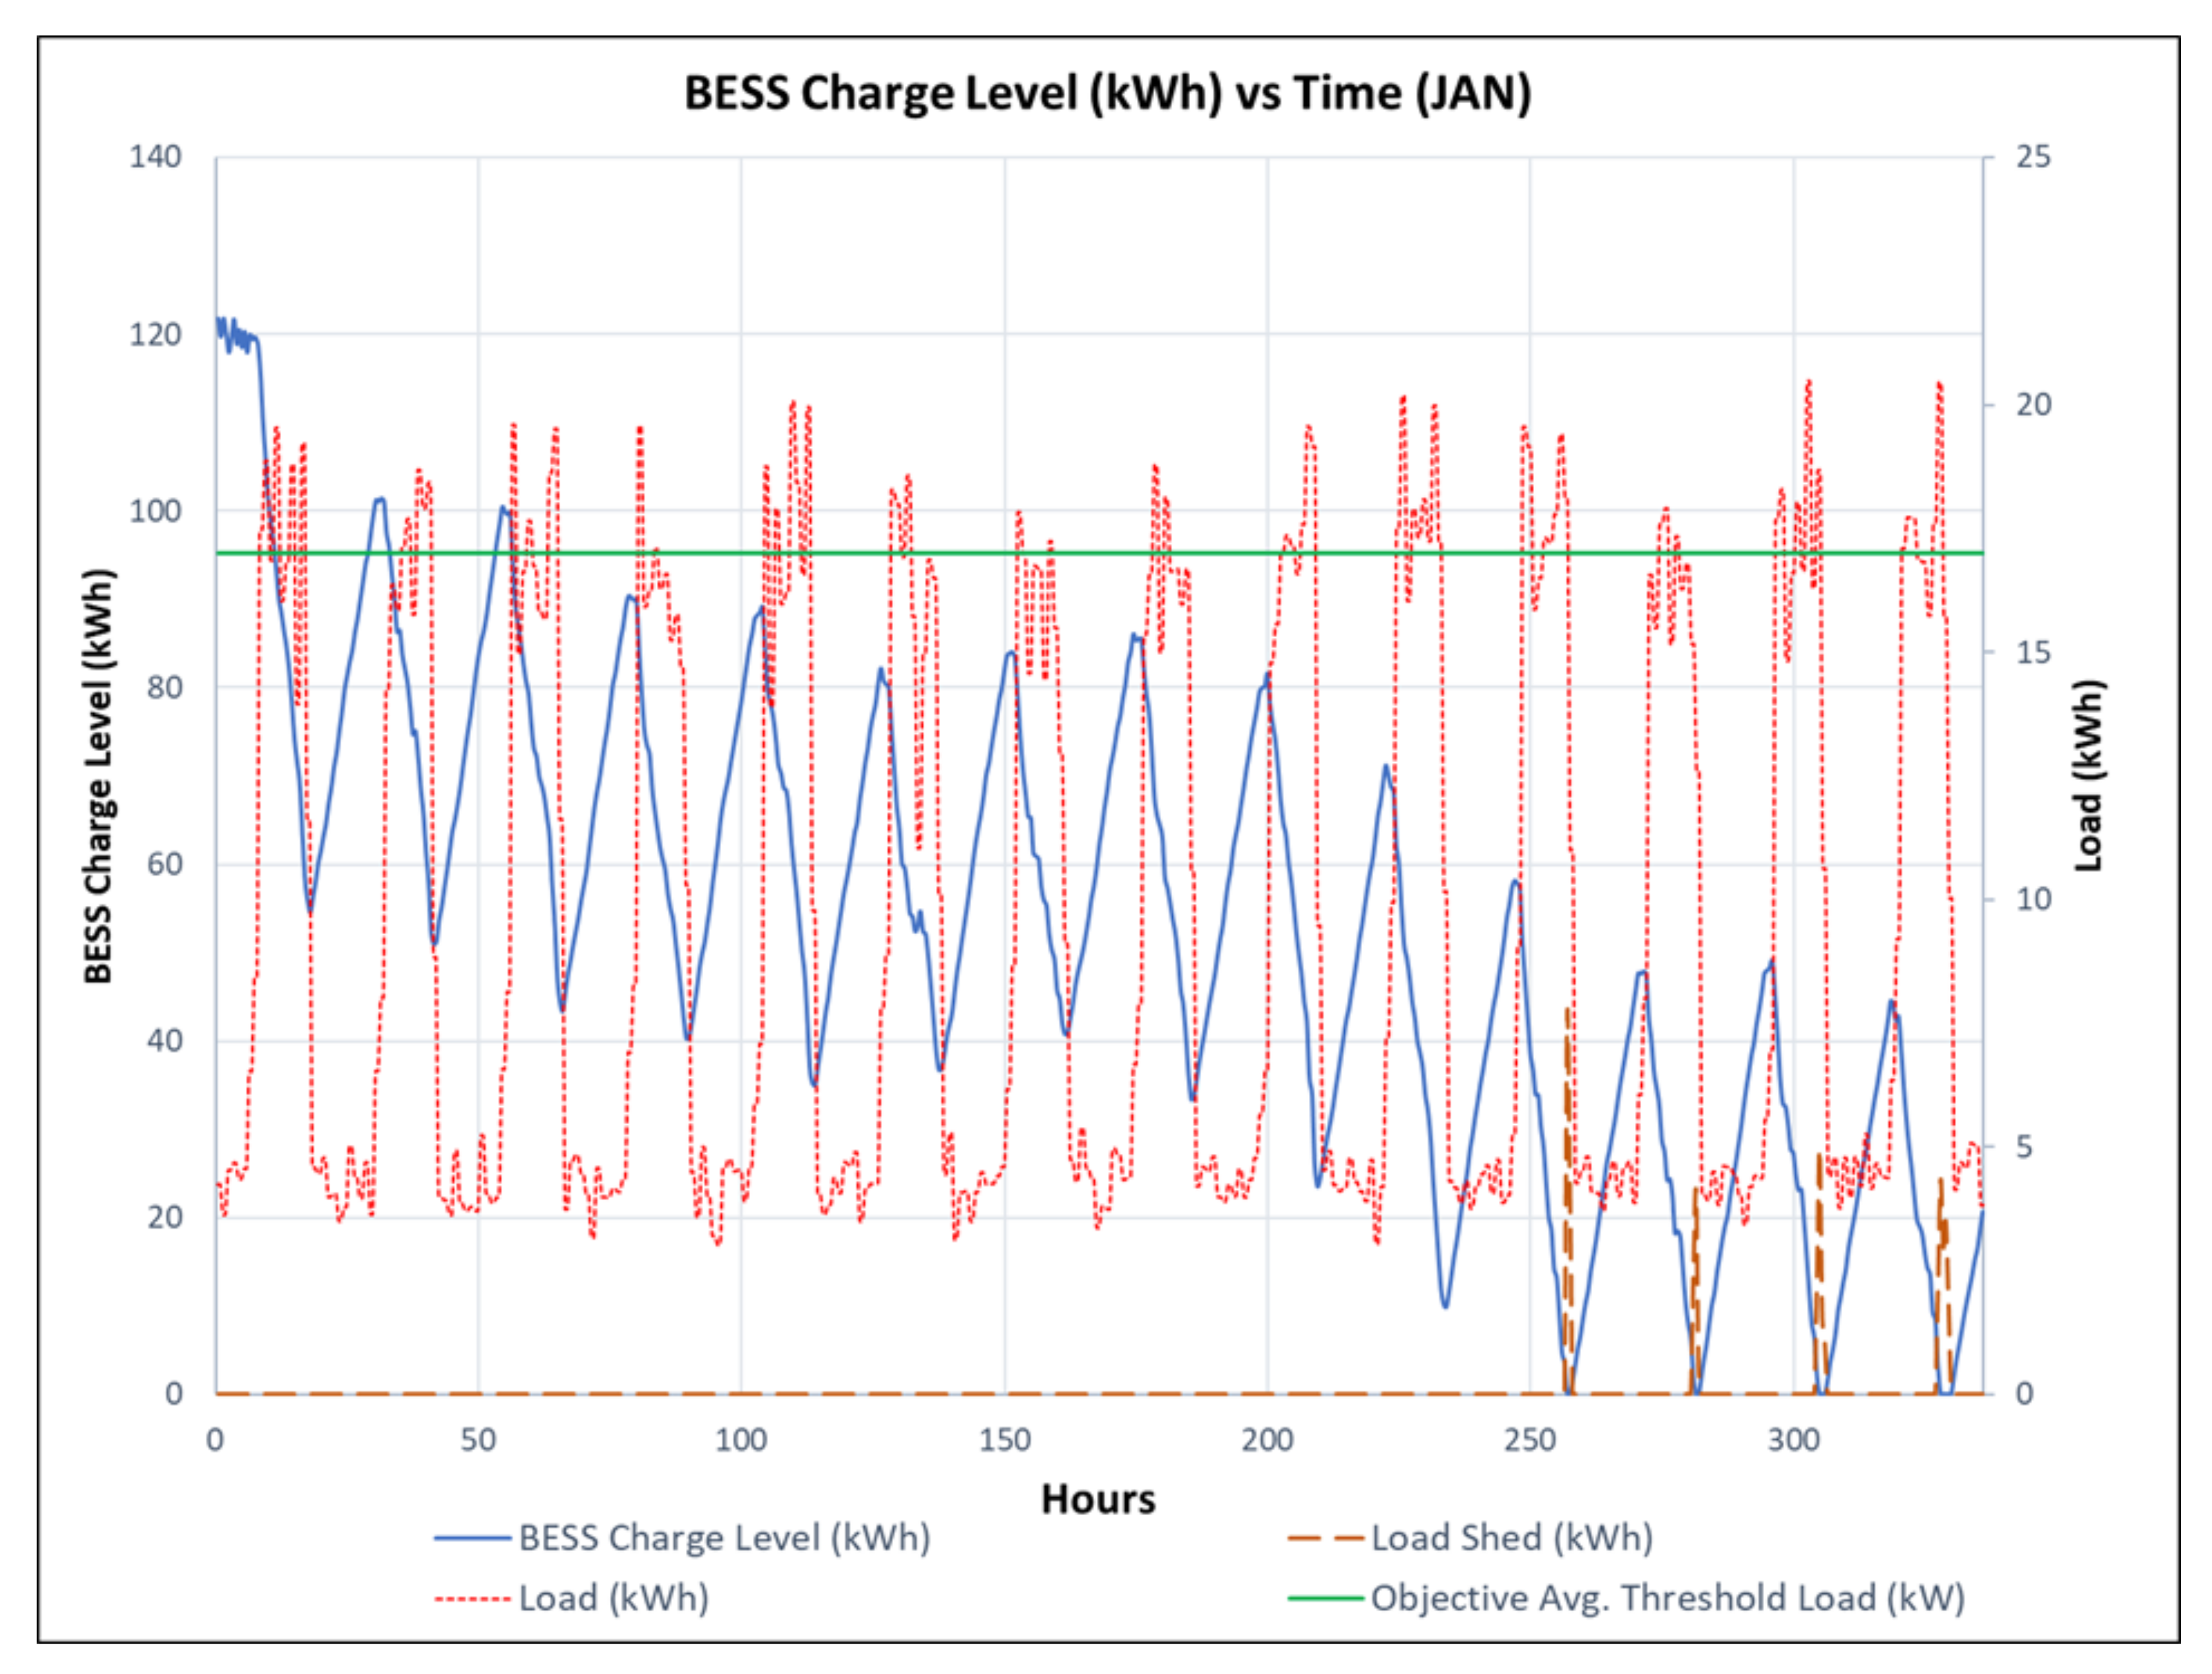
6.1.1. January Analysis

January data provided an average of 2.83 h@1-sun/day which is low for the continental United States [50]. The mean load per day placed on the mobile microgrid was 135.29 kWh/day with a standard deviation of 27.21 kWh/day. The 95% confidence interval for mean load per day was 135.29 kWh/day ± 0.53 kWh/day. This mimics a standard workday at a DoD installation small critical site and accounts for drawing a portion of the average threshold load during non-normal work hours (e.g., 00:01h to 06:30 h and 17:30 h to 24:00 h each day) to account for loads such as vampiric loads and critical site heating and cooling.
During the period of analysis, the generator was run for a mean of 207.03 h with a standard deviation of 52.00 h. The 95% confidence interval for mean generator usage in hours was 207.03 h ± 1.02 h over the entire 14-day period. When viewed as a percent of operating time, the generator was operating for a mean of 62% of the total operating time with a standard deviation of 15%. The 95% confidence interval for mean generator set usage as a percent of total operating time was 62% ± 0.29%. Note that the generator usage roughly aligned with the original design month fraction applied in the load analysis (Section 5.2, design month fraction of 37.5% ≈ 100% − 62% generator usage). This is another point of verification that the model implementation aligned with the proposed design.
Load shed as a percentage of the total load over the period of analysis had a mean of 0.0% with a standard deviation of 0.4%. Load shed cannot be negative and the Central Limit Theorem to assure an approximate normal distribution for the mean cannot be used from the Monte Carlo simulation to calculate a confidence interval.
These metrics show, with 95% confidence, that the mobile microgrid design is meeting its design objectives. The system is providing for an average threshold load of 10 kW during peak work hours as well as accounting for non-normal work hour loads over 14 days-of-autonomy without shedding any of the critical load during that time. The system shows the potential for handling short durations of load that are higher than the average threshold load. This is inserted into the model based on the randomness applied to the load and, in real world applications, may occur due to changing mission requirements during a situation that results in a power outage (e.g., natural disaster or deliberate attack). As compared to a strictly EDG system, the mobile microgrid reduced the reliance on generator power by approximately 38% or roughly 129 h over the 14-day period of analysis during a solar irradiance worst case for NSA Monterey. The system is meeting variations in load that exceed the 10 kW threshold average, primarily because a BESS was employed that allows for a larger power draw for short durations. Figure 9 represents a single run of the model, not the cumulative results of the Monte Carlo simulation, and shows the BESS response to the load. As seen in the figure, the load often exceeds the objective threshold load of 10 kW, because of the stochastic nature of the model, without forcing the BESS charge level to a point that requires load shed from the system.

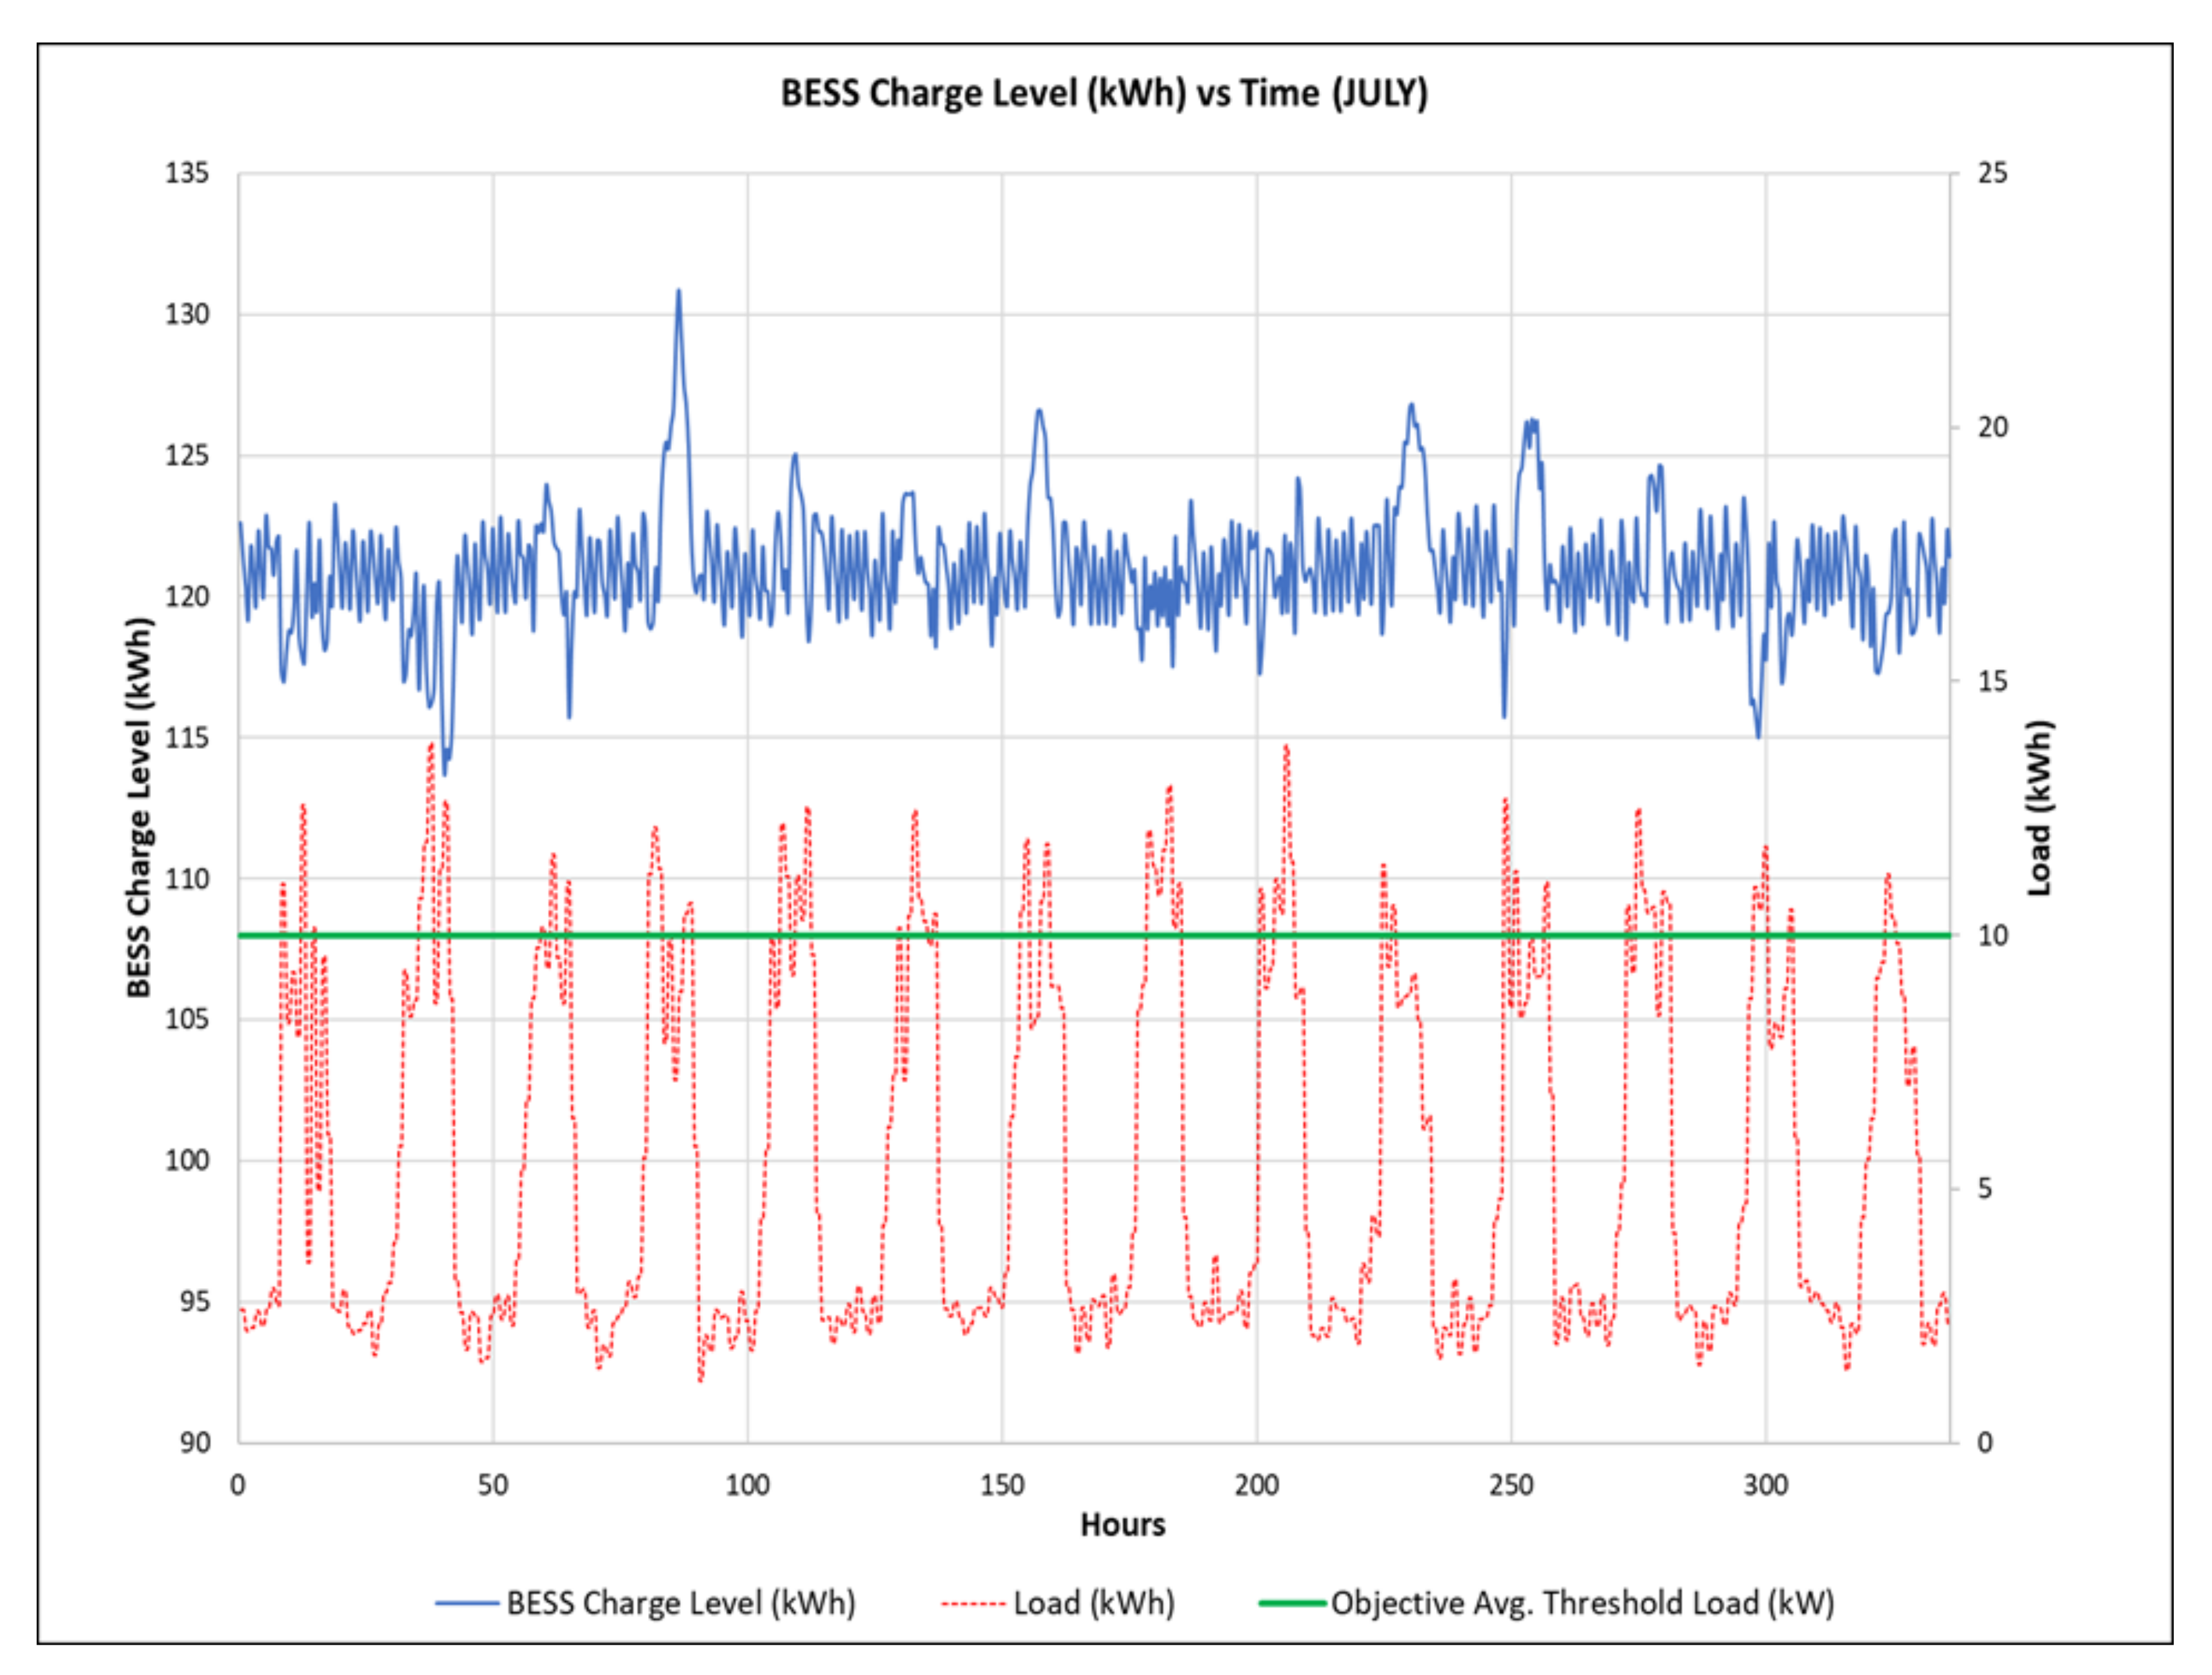
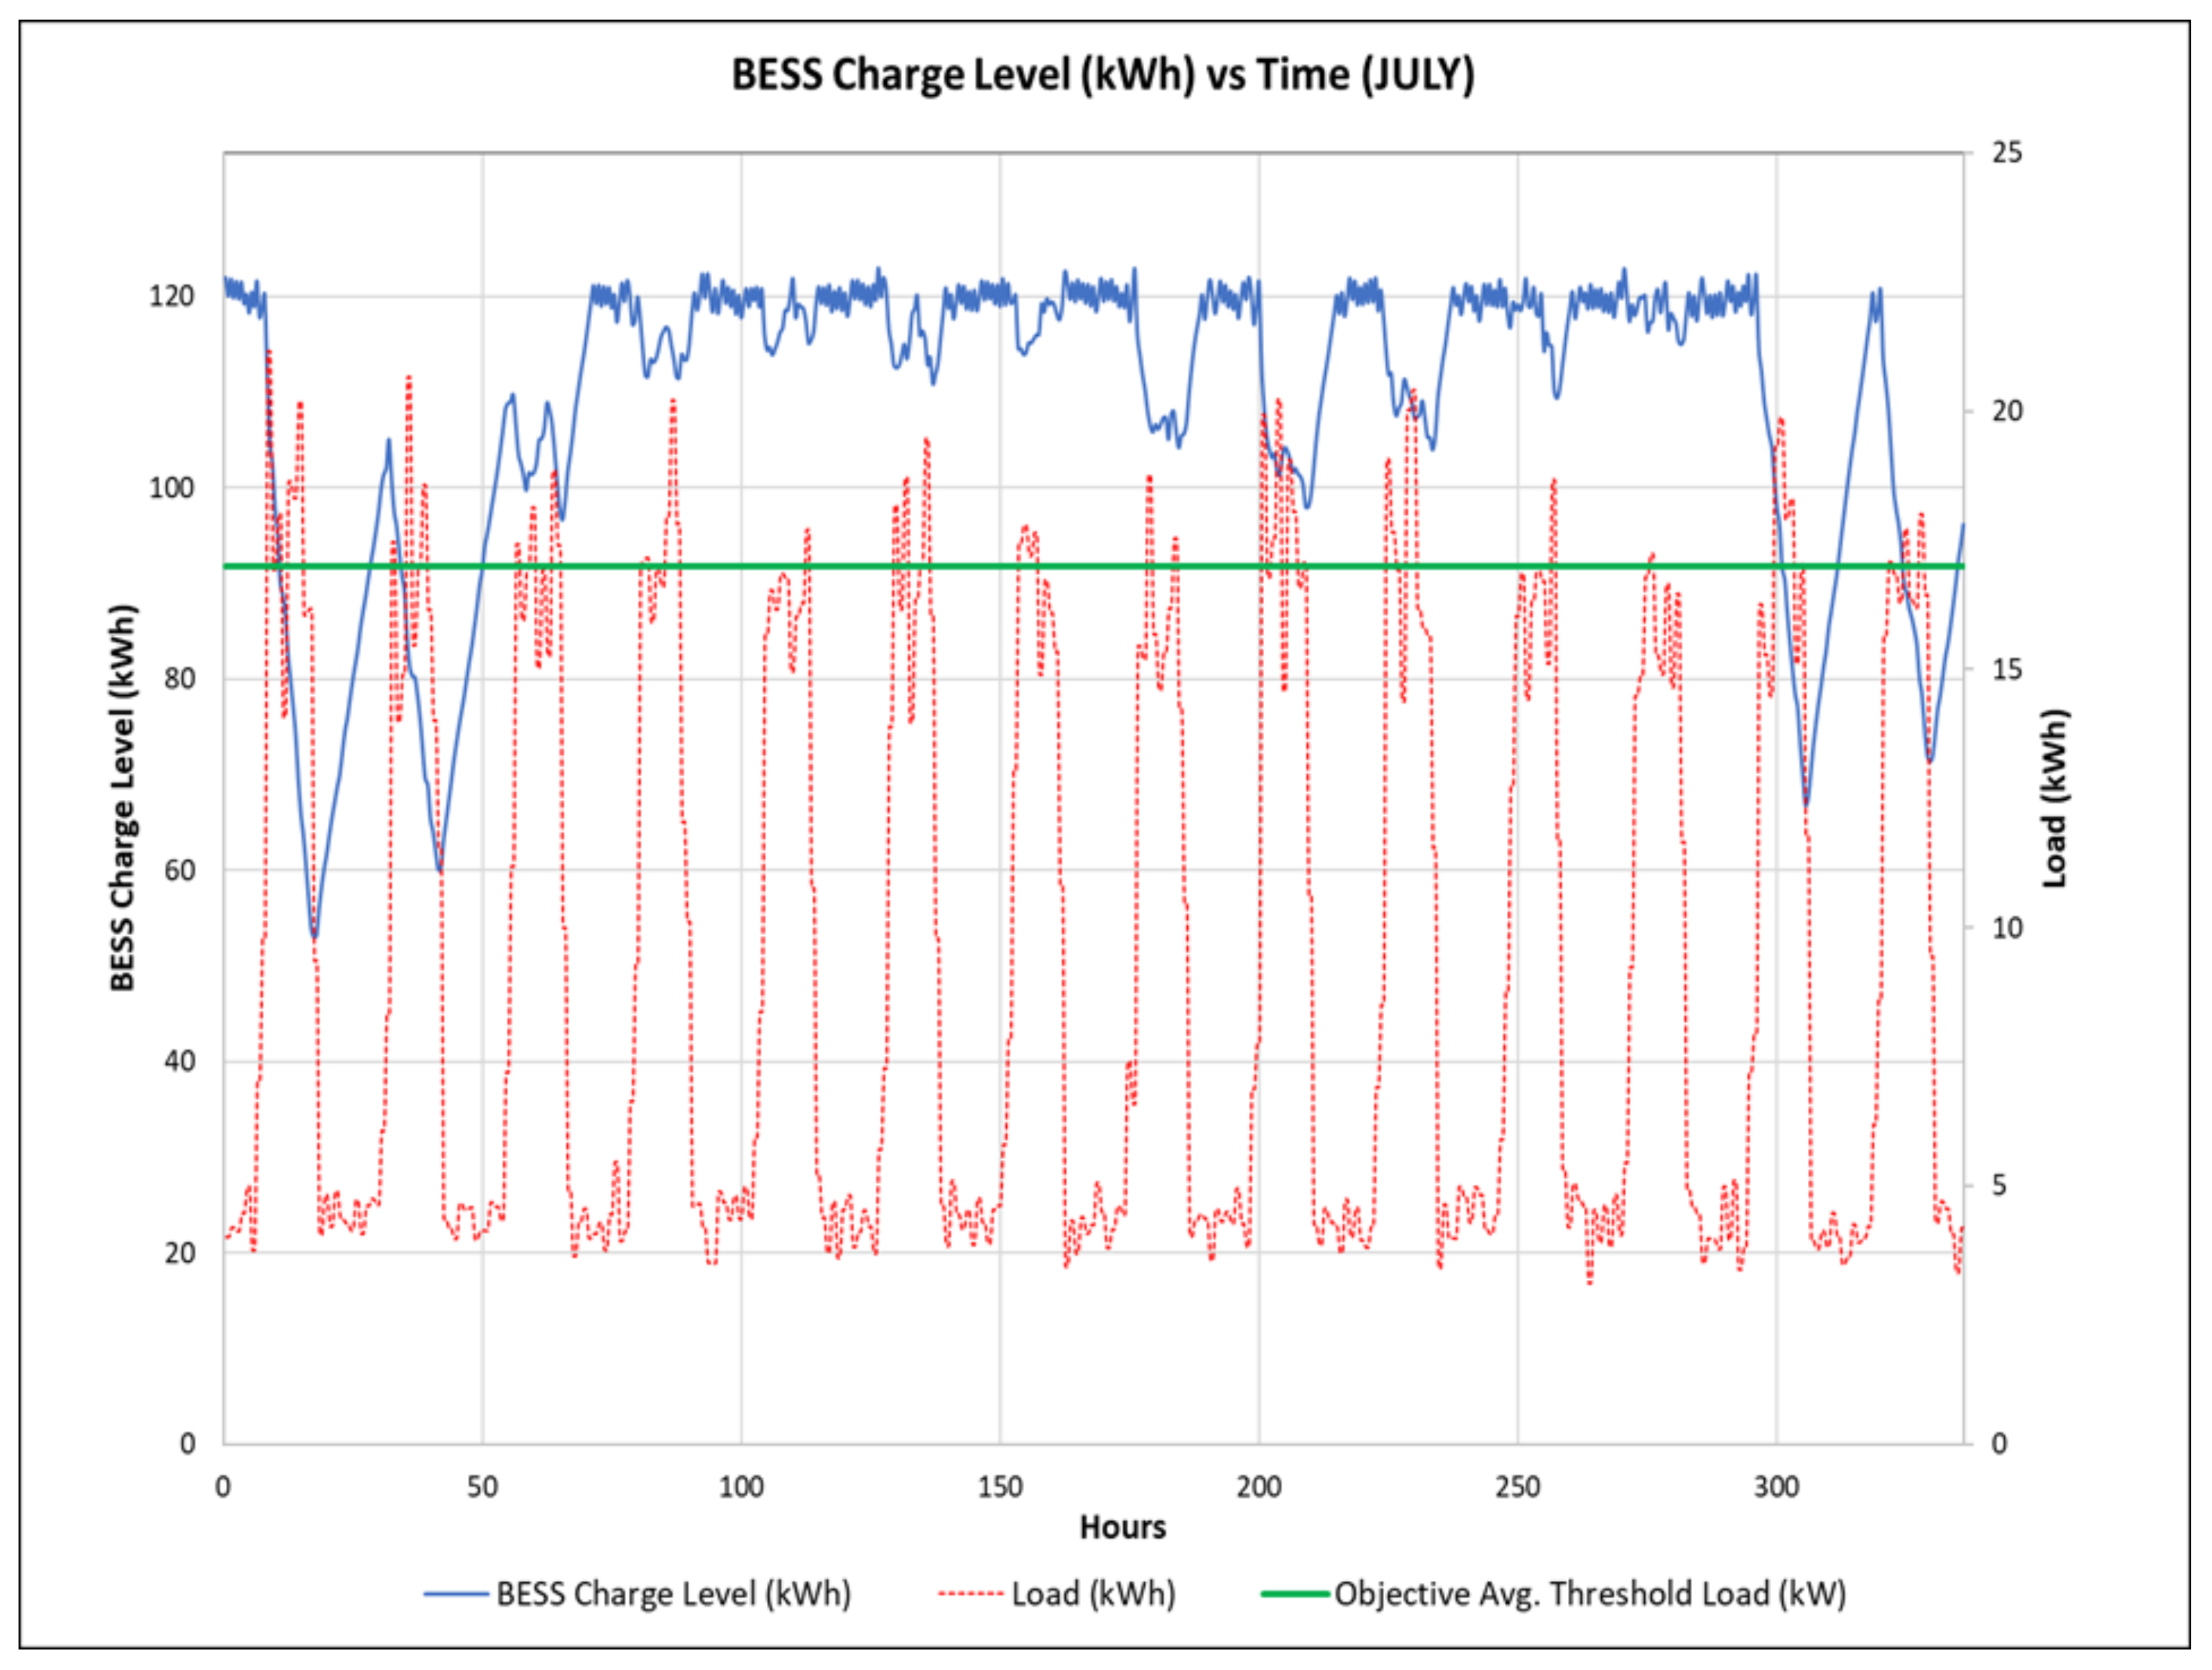
6.1.2. July Analysis

July data provided an average of 7.01 h@1-sun/day which is approximately average for the continental United States in July [51]. The mean load per day placed on the mobile microgrid was 135.23 kWh/day with a standard deviation of 27.34 kWh/day. The 95% confidence interval for mean load per day was 135.23 kWh/day ± 0.54 kWh/day. Again, the load accounts for non-normal work hours and mimics a standard workday for a small critical load site.
During the period of analysis, the generator was run for a mean of 136.65 h with a standard deviation of 52.18 h. The 95% confidence interval for mean generator usage in hours was 136.65 h ± 1.02 h over the entire 14-day period. When viewed as a percent of operating time, the generator was operating for a mean of 41% of the total operating time with a standard deviation of 16%. The 95% confidence interval for mean generator set usage as a percent of total operating time was 41% ± 0.31%.
Load shed as a percentage of the total load over the period of analysis had a mean of 0.0% with a standard deviation of 0.0%. Load shed cannot be negative and the Central Limit Theorem to assure an approximate normal distribution for the mean cannot be used from this Monte Carlo simulation to calculate a confidence interval, but we can see that we are nearly 100% confident that there is zero load shed during this July period.
These metrics show, with 95% confidence, that the mobile microgrid design is meeting its design objectives. For this July period, mean generator usage has a 21% reduction from January usage for the design, or approximately a mean 70-h reduction in generator operating hours from January, demonstrating the utility of the hybrid power design to reduce the reliance on outside resources for backup power. Figure 10 represents a single run of the model, not the cumulative results of the Monte Carlo, and shows the BESS response to the load. Again, the load often exceeds the objective threshold load of 10 kW because of the stochastic nature of the model with no need for the system to shed load.

6.2. Stressing Scenarios

Next, several stressing scenarios were examined where a load greater than the design objective was applied to the mobile microgrid. Such mission scenarios may occur when a mission changes and new loads are unexpectedly added.

6.2.1. Stressing Scenario Using January GHI Data

Using the same January solar irradiance data, with an average of 2.83 h@1-sun/day, a Monte Carlo simulation was run for an average load of 17 kW. The load was modeled using a normal distribution with a mean of 17 kW and standard deviation of 2 kW, all other input assumptions remained the same. The Monte Carlo simulation was run 10,000 times.
The mean load per day as a 95% confidence interval was 229.34 kWh/day ± 0.53 kWh/day. As a 95% confidence interval, the mean generator usage in hours for the entire period of analysis was 328.64 h ± 0.27 h. As a percentage of total operating time using a 95% confidence interval, the mean generator usage was 98% ± 0.08% over the 14 day period of analysis. The mean load shed for the period of analysis was 374.06 kWh with a standard deviation of 13.74 kWh or as a percent, 10.69% with a standard deviation of 8.74%. Again, the Central Limit Theorem to assure an approximate normal distribution for the mean load shed cannot be used from this Monte Carlo simulation to calculate a confidence interval. Figure 11 shows the system response to an average load greater than the design objective.
Although Figure 11 is a snapshot of a single run, and not the cumulative result of the entire Monte Carlo simulation, it highlighted some important considerations of the design and potential uses of the proposed mobile microgrid. For this stressing scenario, the initial BESS charge level was set at 75% of the total capacity. BESS charge level shows a downward trend over the period of analysis. Despite the increased load on the system, the system can handle the load for the majority of the period of analysis. There was a dramatic increase in generator usage to nearly 100%. Despite only having a 10 kW generator, the system met significantly larger than design objective loads because of the BESS storage capacity and the recharge capacity of both the PV and generator. The BESS was designed for 1.5 days of storage assuming a 10 kW average load, however the BESS can handle up to approximately a 30 kW load before causing damage to the BESS due to discharge rate [79]. The BESS capacity allows the system to avoid shedding load for the majority of the 14-day period. Although the generator is running full time, the goal of reduced fuel consumption is assumed to be met when the size of the load is considered against the useage of a smaller generator with a lower gallon per hour (GPH) fuel consumption rate. Results show that placing a much higher load, average of 17 kW, on the system is not sustainable for meeting DoD resilience requirements for longer than nine to 14 days of employment in this scenario. However, as a tool for installation energy managers, the mobile microgrid can be used as a shorter-term solution for backup power with larger loads (not to exceed 30 kW) and still provide for reduced fuel consumption.

6.2.2. Stressing Scenario Using July GHI Data

A similar Monte Carlo simulation was run using the July solar irradiation data with an average of 7.01 h@1-sun/day. The mean load per day as a 95% confidence interval was 230.00 kWh/day ± 0.53 kWh/day. The mean generator usage in hours as a 95% confidence interval was 297.82 h ± 0.72 h. As a percentage of total operating time, the 95% confidence interval for generator usage was 89% ± 0.22%. Finally, the mean load shed during the period of analysis was 72.94 kWh with a standard deviation of 160.46 kWh or as a percent of the total load, the mean load shed was 1.92% with a standard deviation of 4.09%.
In this scenario, generator usage was high but not needed all of the time and load shed was minimal and could potentially be avoided by implementing contingency power usage procedures during outages to avoid unexpected load shed. Figure 12 shows the system response to a larger than designed average threshold load during higher solar irradiance.
This final stressing scenario highlighted the utility of the proposed mobile microgrid design to meet larger loads in months of higher solar irradiance with minimal load shed and the potential to avoid load shed altogether. Like any tool, the basic capabilities of the mobile microgrid must be understood by installation energy managers in order to understand when and how they can be used and pushed beyond their original design.
Table 3 provides a summary of the results from Section 6. The table offers a simple side by side comparison of the effects of average load and solar irradiance on generator usage and load shed for the mobile microgrid.

7. Discussion and Future Work

Following the Engineering Mission Analysis conducted in Section 6, a qualitative assessment of the proposed mobile microgrid’s ability to meet design objectives and the capability need was conducted. The discussion includes insights gained from analysis relative to the design objectives from Section 4.1.2, as well as the relative load size of the design, and trade-offs between a mobile microgrid and static customized single load microgrid.

7.1. Design Objectives

The authors’ qualitative assessment is that the proposed mobile microgrid design meets the objectives laid out in Section 4.1.2. The design is a feasible solution to the need for increased energy resilience for DoD installations. If produced, the proposed design provides an “off-the-shelf” solution that can be procured as an equipment purchase rather than a construction project. The design utilizes a standard shipping container common to the DoD that can be transported using organic DoD installation assets as well as common DoD transportation infrastructure. The weight of the design’s major components, which include 30 PVs, 30 LiFePO4 batteries for the BESS, one 10 kW EDG, and one ISO TriCon is estimated to be 9260 lbs (4200 kg), leaving about 740 lbs (335 kg) of the objective weight for cabling, an inverter charger, and internal storage design to house and secure components. The design provides power from the BESS allowing it to connect quickly to support the load before the PV and EDG are set up. Setup of the PV and EDG can occur after the mobile microgrid has started powering the load. Finally, the design meets an average 10 kW load for 12 h a day over a 14-day period without shedding load and reduces EDG usage by nearly 40% in periods of low solar irradiation.

7.2. Load Size

Although 10 kW is a relatively small average load, the mobile microgrid provides a useful tool for installation energy managers. Like any tool, it can be used in innovative ways and can be used in situations exceeding the as-designed threshold load. The amount of load the design can handle is largely a result of the recharge capability from the EDG and PV, and the duration of time the mobile microgrid must support that load. As the stressing scenarios showed, the design is capable of supporting larger than 10 kW loads but EDG usage will increase and at some point, the load will be so large that the EDG and PV cannot recharge the BESS at a sufficient rate and BESS charge level will degrade over time potentially to the point of shedding load. The rate at which it degrades is determined by the size of the load and the recharge capability of the EDG and PV. Theoretically, the design can support an average 30 kW load without damaging the BESS but the design is only capable of supporting that load for approximately 7 h before the BESS is completely drained and begins shedding load. As a tool, installation energy managers would have to understand the duration of time they needed the load supported or potentially connect multiple mobile microgrids in parallel to support average loads larger than 15–17 kW.

7.3. Trade-Offs between a Mobile Microgrid and a Static Customized Single Load Microgrid

The mobile microgrid is designed to a standard average load of 10 kW. A static customized single load microgrid is designed specifically for the load it supports and that load is determined after a thorough analysis of the load over time. This makes for a much more efficient use of the resources of the static customized single load microgrid. In most instances, the mobile microgrid will not utilize its resources to their maximum potential. This could look like supporting a very small load at one site and under utilizing the PV because the BESS remains near its peak charge and cannot accept much of the charge from the PV. Assuming there is a grid outage, that excess power is wasted because it cannot be fed back into the installation microgrid. From a resilience standpoint, the mobile microgrid will never reduce the “Adapt, Respond” time seen Figure 2 of the resilience curve as much as a static customized single load microgrid that can be assumed to almost immediately support the load after a disruption. Finally, a static customized single load microgrid continuously produces power which can contribute to the greater installation microgrid or host domestic grid. The mobile microgrid can be grid connected and set up to provide the same capability of providing power to the installation microgrid or host domestic grid, but that is a choice dependent on how the installation energy manager decides to utilize the tool. An option to create greater payback from the mobile microgrid is to deploy it at an arbitrary load site in a grid connected mode to provide power from the renewable power generation to the load, the installation microgrid, or the host domestic grid [1]. However, maintaining the mobile microgrid in a deployed grid connected mode will most likely increase the response time to restore a critical load in the event of a disruption because the mobile microgrid will need to be packed into the TriCon before moving to the critical load.
The mobile microgrid does provide a backup power solution that does not require each critical load to have a custom built microgrid. This offers the potential for increased cost savings assuming static customized single load microgrids are being considered for installation critical loads. This also offers increased flexibility to use the mobile microgrid for backup power to support non-critical loads that the installation microgrid may not support during a disruption. As a tool for installation energy managers, the mobile microgrid provides greater flexibility than static customized single load microgrids and decreased generator usage when compared to using an EDG only system to power a load. The cost to this increased flexibility is a reduction in resilience as compared to the static customized single load microgrid.
As a tool for contingency operations, the mobile microgrid provides power while reducing generator usage. During contingency operations, it can be assumed that the environment will be fuel constrained either because of reduced or restricted fuel transportation or because of competition with the local market (e.g., homeowners and businesses using fuel to run EDGs to power personal loads).
As a tool for LSCO, the mobile microgrid again provides power while reducing generator usage as compared to the current method of using EDGs. This would allow for reduced logistics support to rear echelon formations. Ultimately this could reduce the logistics footprint on the battlefield or allow those logistics assets to be pushed forward to provide increased logistics support toward the forward edge of the battle area.

7.4. Future Work

Future work may investigate refining the mobile microgrid model to more accurately account for environmental factors and the correlation of generator usage with fuel consumption. The equations and modeling used in this research did not conduct a detailed accounting of temperature, wind, and other environmental considerations that may impact the BESS, PV, and EDG. Conservative values were used for many of the factors in model such as Coulomb efficiency, De-rating factor, inverter/charger efficiency, and generator charge efficiency to attempt to account for environmental factors but will not provide the same level of accuracy as applying further equations and specificity to the model. Refinement of the model can also provide greater fidelity of the generator usage metric to create generator load outputs that would allow for estimates of fuel consumption data. This would allow for more accurate modeling based on specific location environmental data and greater insight into fuel consumption.
Additional future work may include varying standard mobile microgrid sizes to account for larger critical loads on DoD installations. An average 10 kW load is relatively small when considering DoD installation critical load sizes. Further investigation into other sizing constructs should be completed. Mobile microgrids could be offered in various standard sizes such as small (10 kW), medium (50 kW), and large (100 kW) to provide greater flexibility and more tools to installation energy managers. A similar methodology could be applied using larger ISO containers such as a BiCon container and 20 ft container.
The design provided in this paper is a system architectural design that approaches the problem from an energy density perspective in the size and weight constraints provided in Section 4.1.3. Further pursuit of the concept of mobile microgrids should go into detailed design to ensure that the proposed design still falls within those constraints. Adding greater detail to account for low voltage connections, cabling, storage, and other support equipment such as an inverter/charger that are needed to make the mobile microgrid function may result in changes to the proposed energy density of the design. Varying combinations of energy storage, such as ultra-capacitors in addition to BESS should be considered to handle spike power demands from the critical load to increase energy resilience [82].
An analysis of existing infrastructure is needed before pursuing mobile microgrids as a solution for backup power. A thorough analysis of the integration requirements is needed to understand connections between the mobile microgrid and critical loads as well as requirements for operating in a grid connected mode or connecting mobile microgrids in parallel to support larger loads. The integration requirements should also consider providing power in contingency operations and LSCO.

8. Conclusions

This paper presented a systems engineering feasibility analysis of a proposed mobile microgrid design using commercial-off-the-shelf PV, EDG, and BESS constrained by size and weight to fit within an ISO TriCon container and not to exceed 10,000 lbs (4535 kg). The proposed mobile microgrid design was found to be feasible. Through modeling and simulation, the design supported an average 10 kW load over 14 days-of-autonomy without shedding load during a period with an average of less than 3 hrs@1-sun/day. The system showed a meaningful reduction in reliance on generator power because of the hybrid design that offers the potential for approximately 37% less generator usage during periods of low solar irradiance when compared to a strictly EDG system for backup power. This reduced reliance on generator power only increases as solar irradiance increases. The qualitative assessment of the mobile microgrid, based on analysis of the design, is that it meets the design objectives for transportability and supports expedient power restoration for small critical loads. Several directions for future work were identified to further support the pursuit of mobile microgrids as a tool for increasing energy resilience in DoD installations.

Author Contributions

Conceptualization, D.W.V., D.L.V.B. and A.P.; methodology, D.W.V., D.L.V.B. and A.P.; software, D.W.V.; validation, D.W.V.; formal analysis, D.W.V.; investigation, D.W.V., D.L.V.B. and A.P.; resources, D.L.V.B. and A.P.; data curation, D.W.V.; writing—original draft preparation, D.W.V.; writing—review and editing, D.W.V., D.L.V.B. and A.P.; visualization, D.W.V.; supervision, D.L.V.B. and A.P.; project administration, D.L.V.B. and A.P.; funding acquisition, D.L.V.B. All authors have read and agreed to the published version of the manuscript.

Funding

This research was funded by the NextSTEP Program through funding by the Office of Naval Research (ONR). The APC was funded by the Naval Postgraduate School.

Institutional Review Board Statement

Not applicable.

Informed Consent Statement

Not applicable.

Data Availability Statement

Please contact the authors for additional data and analysis files.

Acknowledgments

This research is partially supported by Naval Postgraduate School. Any opinions or findings of this work are the responsibility of the authors, and do not necessarily reflect the views of the Department of Defense or any other organizations. Approved for Public Release; distribution is unlimited.

Conflicts of Interest

The authors declare no conflict of interest.

References

  1. Piluso, A.; Defense Energy Manager, Sicily, Italy. Personal communication, March 2022.
  2. Gillis, W. Memorandum of Understanding Between U.S. Department of Defense, Office of the Assistant Secretary of Defense for Susainment and U.S. Department of Energy, Office of the Assistant Secretary for the Office of Electricity; Official Memorandum, Department of Defense: Washington, DC, USA, 2020; Available online: https://www.acq.osd.mil/eie/Downloads/IE/DoD%20DOE%20MOU%20for%20Energy%20Resilience.pdf (accessed on 5 January 2022).
  3. NAVFAC P-601 Microgrid Design Guide; Naval Facilities Engineering Command: Washington, DC, USA, 2016.
  4. Anderson, K.H.; Di Orio, N.A.; Cutler, D.S.; Butt, R.S. Increasing resiliency through renewable energy microgrids. Int. J. Energy Sect. Manag. 2017, 2, 1–17. [Google Scholar]
  5. Sagunsky, D.L. Risk on the Horizon, Rig for Dark: Solutions to Mitigate DoD’s Reliance on the Fragile Electric Grid. Master’s Thesis, Joint Forces Staff College National Defense University, Norfolk, VA, USA, 2013. Available online: https://apps.dtic.mil/sti/pdfs/ADA581121.pdf (accessed on 5 January 2022).
  6. Anuat, E.; Van Bossuyt, D.L.; Pollman, A. Energy Resilience Impact of Supply Chain Network Disruption to Military Microgrids. Infrastructures 2021, 7, 4. [Google Scholar] [CrossRef]
  7. Kain, A.; Van Bossuyt, D.L.; Pollman, A. Investigation of Nanogrids for Improved Navy Installation Energy Resilience. Appl. Sci. 2021, 11, 4298. [Google Scholar] [CrossRef]
  8. Mallery, J.; Van Bossuyt, D.L.; Pollman, A. Defense Installation Energy Resilience for Changing Operational Requirements. Designs 2022, 6, 28. [Google Scholar] [CrossRef]
  9. Neimeyer, L. Installation Energy Plans: Energy Resilience and Cybersecurity Update and Expansion of the Requirements to All DoD Installations; Official Memorandum, Department of Defense: Washington, DC, USA, 2018; Available online: https://www.acq.osd.mil/eie/Downloads/IE/IEP%20Policy_May302018.pdf (accessed on 5 January 2022).
  10. Yodo, N.; Wang, P. Engineering resilience quantification and system design implications: A literature survey. J. Mech. Des. 2016, 138, 111408. [Google Scholar] [CrossRef] [Green Version]
  11. Hosseini, S.; Barker, K.; Ramirez-Marquez, J.E. A review of definitions and measures of system resilience. Reliab. Eng. Syst. Saf. 2016, 145, 47–61. [Google Scholar] [CrossRef]
  12. Hamilton, M.C.; Lambert, J.H.; Connelly, E.B.; Barker, K. Resilience analytics with disruption of preferences and lifecycle cost analysis for energy microgrids. Reliab. Eng. Syst. Saf. 2016, 150, 11–21. [Google Scholar] [CrossRef]
  13. Roege, P.E.; Collier, Z.A.; Mancillas, J.; McDonagh, J.A.; Linkov, I. Metrics for energy resilience. Energy Policy 2014, 72, 249–256. [Google Scholar] [CrossRef]
  14. Armed Forces: 10 U.S.C. § 101(e)(6); Public Law U.S. Code; Government Printing Office: Washington, DC, USA, 3 January 2012.
  15. Armed Forces: 10 U.S.C. § 101(e)(7); Public Law U.S. Code; Government Printing Office: Washington, DC, USA, 3 January 2012.
  16. Armed Forces: 10 U.S.C. § 2911; Public Law U.S. Code; Government Printing Office: Washington, DC, USA, 3 January 2012.
  17. Reintjes, C.M. Energy Resiliency—How DoD Can Become Energy Resilient and Still Meet Its Renewable Energy Goals. Master’s Thesis, LLM Vermot Law School, South Royalton, VT, USA, 2019. Available online: https://apps.dtic.mil/sti/pdfs/AD1080509.pdf (accessed on 5 January 2022).
  18. Mishra, S.; Anderson, K.; Miller, B.; Boyer, K.; Warren, A. Microgrid resilience: A holistic approach for assessing threats, identifying vulnerabilities, and designing corresponding mitigation strategies. Appl. Energy 2020, 264, 114726. [Google Scholar] [CrossRef] [Green Version]
  19. Robyn, D.; Marqusee, J. Clean Power From the Pentagon. Issues Sci. Technol. 2019, 35, 63–68. [Google Scholar]
  20. Slattery, M. Energy Security in the United States Department of Defense: How and Why the U.S. Army and Navy Are Reducing Their Reliance on Fossil Fuels and the Electrical Grid, and What It Could Mean for the Rest of Us. Master’s Thesis, Vassar College, Poughkeepsie, NY, USA, 2015. [Google Scholar]
  21. Ton, D.T.; Smith, M.A. The US department of energy’s microgrid initiative. Electr. J. 2012, 25, 84–94. [Google Scholar] [CrossRef]
  22. Giachetti, R.E.; Peterson, C.J.; Van Bossuyt, D.L.; Parker, G.W. Systems engineering issues in microgrids for military installations. In Proceedings of the INCOSE International Symposium, Virtual Event, 20–22 July 2020; Volume 30, pp. 731–746. [Google Scholar]
  23. Hirsch, A.; Parag, Y.; Guerrero, J. Microgrids: A review of technologies, key drivers, and outstanding issues. Renew. Sustain. Energy Rev. 2018, 90, 402–411. [Google Scholar] [CrossRef]
  24. Hernandez-Aramburo, C.A.; Green, T.C.; Mugniot, N. Fuel consumption minimization of a microgrid. IEEE Trans. Ind. Appl. 2005, 41, 673–681. [Google Scholar] [CrossRef] [Green Version]
  25. Lasseter, R.H.; Paigi, P. Microgrid: A conceptual solution. In Proceedings of the 2004 IEEE 35th Annual Power Electronics Specialists Conference (IEEE Cat. No. 04CH37551), Aachen, Germany, 20–25 June 2004; Volume 6, pp. 4285–4290. [Google Scholar]
  26. Judson, N.; Pina, A.L.; Dydek, E.; Van Broekhoven, S.B.; Castillo, A. Application of a Resilience Framework to Military Installations: A Methodology for Energy Resilience Business Case Decisions; Technical Report; MIT Lincoln Laboratory: Lexington, MA, USA, 2016. [Google Scholar]
  27. Dileep, G. A survey on smart grid technologies and applications. Renew. Energy 2020, 146, 2589–2625. [Google Scholar] [CrossRef]
  28. Teymouri, F.; Amraee, T.; Saberi, H.; Capitanescu, F. Toward controlled islanding for enhancing power grid resilience considering frequency stability constraints. IEEE Trans. Smart Grid 2017, 10, 1735–1746. [Google Scholar] [CrossRef]
  29. Peterson, C.J.; Van Bossuyt, D.L.; Giachetti, R.E.; Oriti, G. Analyzing mission impact of military installations microgrid for resilience. Systems 2021, 9, 69. [Google Scholar] [CrossRef]
  30. McCarthy, R. Army Directive 2020-03 (Installation Energy and Water Resilience Policy); Official Memorandum, Department of Defense: Washington, DC, USA, 2020; Available online: https://www.asaie.army.mil/Public/ES/doc/ARN21644_AD2020-03_Web_Final.pdf (accessed on 6 January 2022).
  31. Coglianese, V. Installation neXt Hawaii Resilience Symposium Report; Technical Report; Marine Corps Installations Command, Marine Corps Base Hawaii: Oahu, HI, USA, 2019. [Google Scholar]
  32. Department of Defense, Washington, DC, USA. Unified Facilities Criteria: Engine-Driven Generator Systems for Prime and Standby Power Applications, Change 2, 5 November 2019. Available online: https://www.wbdg.org/ffc/dod/unified-facilities-criteria-ufc/ufc-3-540-01 (accessed on 10 February 2022).
  33. Nordman, B.; Christensen, K.; Meier, A. Think globally, distribute power locally: The promise of nanogrids. Computer 2012, 45, 89–91. [Google Scholar] [CrossRef] [Green Version]
  34. Khan, M.R.; Brown, E.D. DC nanogrids: A low cost PV based solution for livelihood enhancement for rural Bangladesh. In Proceedings of the 2014 3rd International Conference on the Developments in Renewable Energy Technology (ICDRET), Dhaka, Bangladesh, 29–31 May 2014; pp. 1–5. [Google Scholar]
  35. Ghasemi-Nejhad, M.N.; Menendez, M.; Minei, B.; Wong, K.; Gabrick, C.; Thornton, M.; Ghorbani, R. Smart nanogrid systems for disaster mitigation employing deployable renewable energy harvesting devices. In Proceedings of the Active and Passive Smart Structures and Integrated Systems 2016, Las Vegas, NV, USA, 21–24 March 2016; Volume 9799, pp. 756–765. [Google Scholar]
  36. Pollman, A.; Gannon, A. Multi–physics energy approach and demonstration facility. In Proceedings of the ASME 2015 9th International Conference on Energy Sustainability, San Diego, CA, USA, 28 June–2 July 2015. [Google Scholar] [CrossRef]
  37. Bouchekara, H.R.A.H.; Shahriar, M.S.; Javaid, M.S.; Sha’aban, Y.A.; Ramli, M.A.M. Multi-Objective Optimization of a Hybrid Nanogrid/Microgrid: Application to Desert Camps in Hafr Al-Batin. Energies 2021, 14, 1245. [Google Scholar] [CrossRef]
  38. Zhou, Q.; Shahidehpour, M.; Li, Z.; Che, L.; Alabdulwahab, A.; Abusorrah, A. Compartmentalization strategy for the optimal economic operation of a hybrid ac/dc microgrid. IEEE Trans. Power Syst. 2019, 35, 1294–1304. [Google Scholar] [CrossRef]
  39. Sandgani, M.R.; Sirouspour, S. Energy management in a network of grid-connected microgrids/nanogrids using compromise programming. IEEE Trans. Smart Grid 2016, 9, 2180–2191. [Google Scholar]
  40. Berardi, U.; Tomassoni, E.; Khaled, K. A Smart Hybrid Energy System Grid for Energy Efficiency in Remote Areas for the Army. Energies 2020, 13, 2279. [Google Scholar] [CrossRef]
  41. Firefly Hybrid Power. Firefly PowerPlus Hybrid Power Generator. Available online: https://www.fireflyhybridpower.com/products/powerplus (accessed on 23 May 2022).
  42. Hakaienergysolutions. Container Box Systems. Available online: https://hakaienergysolutions.com/commercial-solar/container-systems/ (accessed on 23 May 2022).
  43. Boxpower. BoxPower SolarContainer. Available online: https://boxpower.io/products/solar-container/ (accessed on 23 May 2022).
  44. Boxpower. BoxPower MiniBox. Available online: https://boxpower.io/products/mini-box-solar-power-system/ (accessed on 23 May 2022).
  45. Škanata, D. Improving Cyber Security with Resilience. Ann. Disaster Risk Sci. ADRS 2020, 3. [Google Scholar] [CrossRef]
  46. Francis, R.; Bekera, B. A metric and frameworks for resilience analysis of engineered and infrastructure systems. Reliab. Eng. Syst. Saf. 2014, 121, 90–103. [Google Scholar] [CrossRef]
  47. Abimbola, M.; Khan, F. Resilience modeling of engineering systems using dynamic object-oriented Bayesian network approach. Comput. Ind. Eng. 2019, 130, 108–118. [Google Scholar] [CrossRef]
  48. Headquarters, Department of the Army. FM 3-0 Operations; Department of the Army: Washington, DC, USA, 2017. Available online: https://armypubs.army.mil/epubs/DR_pubs/DR_a/pdf/web/ARN6687_FM%203-0%20C1%20Inc%20FINAL%20WEB.pdf (accessed on 10 April 2022).
  49. Global Horizontal Solar Irradiance Map National Solar Radiation Database Physical Solar Model. Available online: https://www.nrel.gov/gis/assets/images/solar-annual-ghi-2018-usa-scale-01.jpg (accessed on 25 March 2022).
  50. Global Horizontal Solar Irradiance in January National Solar Radiation Database Physical Solar Model. Available online: https://www.nrel.gov/gis/assets/images/solar-january-ghi-2018-usa-scale-01.jpg (accessed on 25 March 2022).
  51. Global Horizontal Solar Irradiance in July National Solar Radiation Database Physical Solar Model. Available online: https://www.nrel.gov/gis/assets/images/solar-july-ghi-2018-usa-scale-01.jpg (accessed on 25 March 2022).
  52. Fish, R. Design and Modeling of Hybrid Microgrids in Arctic Environments. Master’s Thesis, Department of Electrical Engineering, NPS, Monterey, CA, USA, 2020. [Google Scholar]
  53. Anglani, N.; Oriti, G.; Fish, R.; Van Bossuyt, D.L. Design and Optimization Strategy to Size Resilient Stand-Alone Hybrid Microgrids in Various Climatic Conditions. In Proceedings of the 2021 IEEE Energy Conversion Congress and Exposition (ECCE), Virtual, 10–14 October 2021; pp. 210–217. [Google Scholar]
  54. Canadiansolar. HiKu Super High Power PERC Module. Available online: https://www.canadiansolar.com/wp-content/uploads/2019/12/Canadian_Solar-Datasheet-HiKu_CS3W-MS_EN.pdf (accessed on 4 April 2022).
  55. JAsolar. JAM72S20 445-470/MR Series Modules. Available online: https://www.jasolar.com/uploadfile/2021/0602/20210602105327260.pdf (accessed on 4 April 2022).
  56. Renvu. LONGi Solar 450W 144 Half-Cell Mono PERC Tier 1 Solar Panel. Available online: https://www.renvu.com/LONGi-Solar-450W-144-Half-Cell-Mono-PERC-Tier-1-Solar-Panel (accessed on 4 April 2022).
  57. Sunwatts. 450 watt Phono Solar Mono XL M4 Solar Panel. Available online: https://sunwatts.com/450-watt-phono-solar-mono-xl-m4-solar-panel/ (accessed on 4 April 2022).
  58. Trinasolar. TALLMAX M DE17M(II) Half-cut, MBB, 430-450W Modules. Available online: https://www.trinasolar.com/en-glb/product/Tianjing72-de17mII (accessed on 4 April 2022).
  59. Ecodirect. Canadian Solar CS6X-320P, 320 Watt Solar Panel. Available online: https://www.ecodirect.com/Canadian-Solar-CS6X-320P-320W-36-8-V-PV-Panel-p/canadian-solar-cs6x-320ppallet.htm (accessed on 4 April 2022).
  60. JAsolar. 320 W PERC Smart Module. Available online: https://www.jasolar.com/uploadfile/2018/1215/20181215014401325.pdf (accessed on 4 April 2022).
  61. Renogy. 320 Watt Monocrystalline Solar Panel. Available online: https://www.renogy.com/320-watt-monocrystalline-solar-panel/ (accessed on 4 April 2022).
  62. Renvu. SOLARIA PowerXT 320 W High Power ALL BLACK 60 Cell Mono PERC. Available online: https://www.renvu.com/SOLARIA-PowerXT-320R-BX-320W (accessed on 4 April 2022).
  63. Battlebornbatteries. 100 Ah 12V LiFePO4 Deep Cycle Battery. Available online: https://battlebornbatteries.com/product/12v-lifepo4-deep-cycle-battery/ (accessed on 4 April 2022).
  64. Renogy. 12V 100Ah Smart Lithium Iron Phosphate Battery. Available online: https://www.renogy.com/12v-100ah-smart-lithium-iron-phosphate-battery/ (accessed on 4 April 2022).
  65. Dakotalithium. Dakota Lithium 12V 100AH Deep Cycle LIFEPO4 Battery. Available online: https://dakotalithium.com/product/dakota-lithium-12v-100ah-deep-cyle-lifepo4-marine-solar-battery/ (accessed on 4 April 2022).
  66. Richsolar. 12V 100Ah LiFePO4 Lithium Iron Phosphate Battery. Available online: https://richsolar.com/products/12v-100ah-lifepo4-lithium-iron-phosphate-battery (accessed on 4 April 2022).
  67. Renogy. Deep Cycle AGM Battery 12 Volt 100Ah. Available online: https://www.renogy.com/deep-cycle-agm-battery-12-volt-100ah/ (accessed on 4 April 2022).
  68. Eco-worthy. 100Ah 12V AGM Deep Cycle Battery. Available online: https://www.eco-worthy.com/products/100ah-12v-agm-deep-cycle-battery (accessed on 4 April 2022).
  69. Amazon. WindyNation 100 amp-Hour 100AH 12V 12 Volt AGM Deep Cycle Sealed Lead Acid Battery. Available online: https://www.amazon.com/WindyNation-amp-Hour-100AH-Sealed-Battery/dp/B07BS1ZB15?th=1 (accessed on 4 April 2022).
  70. Amazon. ExpertPower 12V 100Ah Deep Cycle Sealed Lead Acid Battery for Solar Wind Power (AGM). Available online: https://www.amazon.com/ExpertPower-100Ah-Solar-Sealed-Battery/dp/B01GSZMEU4?th=1 (accessed on 4 April 2022).
  71. Lithiumbatterypower. 48 V 100 Ah Lithium Battery. Available online: https://www.lithiumbatterypower.com/products/48v-100ah-lithium-ion-battery-steel-case (accessed on 4 April 2022).
  72. Relionlbattery. RB48V100 48 V 100 Ah LiFePO4 Battery. Available online: https://relionbattery.com/products/lithium/rb48v100 (accessed on 4 April 2022).
  73. Royalbattery. Constant Power Lithium 48 V-100 AH LiFePO4 Deep Cycle Solar RE. Available online: https://www.royalbattery.com/lbscpl48v-100 (accessed on 4 April 2022).
  74. Cummings. Rugged Mobile Power. Available online: https://www.cummins.com/generators/rugged-mobile-power (accessed on 4 April 2022).
  75. Marine Corps Systems Command. AMMPS 10 kW Generator Set. Available online: https://www.marcorsyscom.marines.mil/Portals/105/PfM/LCES/ES/Power%20Team/Mobile%20Power/Info%20Sheets/GENERATORSET10KW60HZAMMPSSKIDMOUNTED.pdf?ver=2018-11-13-150411-360 (accessed on 4 April 2022).
  76. Li, W.; Mou, X.; Zhou, Y.; Marnay, C. On voltage standards for DC home microgrids energized by distributed sources. In Proceedings of the 7th International Power Electronics and Motion Control Conference, Harbin, China, 2–5 June 2012; Volume 3, pp. 2282–2286. [Google Scholar]
  77. Rodriguez-Diaz, E.; Chen, F.; Vasquez, J.C.; Guerrero, J.M.; Burgos, R.; Boroyevich, D. Voltage-level selection of future two-level LVdc distribution grids: A compromise between grid compatibiliy, safety, and efficiency. IEEE Electrif. Mag. 2016, 4, 20–28. [Google Scholar] [CrossRef] [Green Version]
  78. Kumar, D.; Zare, F.; Ghosh, A. DC microgrid technology: System architectures, AC grid interfaces, grounding schemes, power quality, communication networks, applications, and standardizations aspects. IEEE Access 2017, 5, 12230–12256. [Google Scholar] [CrossRef]
  79. Masters, G.M. Renewable and Efficient Electric Power Systems; John Wiley & Sons: Hoboken, NJ, USA, 2013. [Google Scholar]
  80. Liu, M. Optimal Number of Trials for Monte Carlo Simulation; VRC–Valuation Research Report; VRC: Boston, MA, USA, 2017. [Google Scholar]
  81. National Solar Radition Data Base Data Viewer. Available online: https://maps.nrel.gov/nsrdb-viewer/?aL=IAvYSN%255Bv%255D%3Dt%26mcQtmw%255Bv%255D%3Dt%26mcQtmw%255Bd%255D%3D1&bL=clight&cE=0&lR=0&mC=4.740675384778373%2C22.8515625&zL=2 (accessed on 21 February 2022).
  82. Rahimi, T.; Ding, L.; Kheshti, M.; Faraji, R.; Guerrero, J.M.; Tinajero, G.D.A. Inertia response coordination strategy of wind generators and hybrid energy storage and operation cost-based multi-objective optimizing of frequency control parameters. IEEE Access 2021, 9, 74684–74702. [Google Scholar] [CrossRef]
Figure 1. The Resilience Venn Diagram shows the overlap and relationship between Installation Resilience and Energy Resilience that provides this research’s definition for Installation Energy Resilience. Installation Energy Resilience is focused only on the energy resources needed for the installation to conduct mission assurance and mission essential functions. Likewise, it is only focused on energy resilience as it relates to the installation.
Systems 10 00074 g001
Figure 2. This is a standard resilience curve that shows an un-scaled comparison between the installation microgrid recovery and mobile microgrid recovery for a single critical load. The anticipated result is that the mobile microgrid will provide a shortened “Respond, Adapt” and “Recover” time than an installation microgrid following a disruption. Adapted from [6,45,46,47]. This figure assumes that the installation microgrid has failed and a mobile microgrid is requested immediately following the disruption event. Unlike the installation microgrid, which will require troubleshooting and potentially repair, the mobile microgrid is stored in an operable state, with all components stored, functional, and awaiting deployment. For the mobile microgrid, the “Respond, Adapt” phase becomes the collocation and hookup of the system. The “Recover” phase has a steeper slope for the mobile microgrid because the system did not fail, but instead serves as a backup power system, whereas the installation microgrid is assumed to require restoration activities in the “Recover” phase following a major disruption.
Systems 10 00074 g002
Figure 3. This CONOPS for installation critical load backup power shows a simple step by step process for employing the mobile microgrid to restore power to a critical load. Power can be restored very quickly after the mobile microgrid is co-located with the critical load because the system provides power from the BESS. Workers can then position the PV array while the load is powered with the BESS, within safety requirements, because the mobile microgrid is a low voltage (48 V) system.
Systems 10 00074 g003
Figure 4. This CONOPS for contingency operations shows a mobile microgrid being airlifted to the contingency environment and collocated with an operations headquarters. The load can be powered from the BESS immediately after the mobile microgrid is dropped at the site. Workers can then position the PV array while the load is powered with the BESS, within safety requirements, because the mobile microgrid is a low voltage (48 V) system.
Systems 10 00074 g004
Figure 5. This CONOPS for LSCO shows a simple operational graphic, derived from Army FM 3.0 [48], for LSCO with the potential areas of the battlefield where mobile microgrids could best be used. The idea is to reduce generator usage in the rear-echelon formations to allow logistics assets to focus toward the forward edge of the battle area.
Systems 10 00074 g005
Figure 6. Mobile Microgrid Systems Engineering Process adapted from the typical Systems Engineering “V” Process Model.
Systems 10 00074 g006
Figure 7. Mobile Microgrid SE Process Model that highlights the iterative process to develop the architectural design. Shown in red is the design loop that was used to refine the architectural design using COTS products for use in modeling and simulation.
Systems 10 00074 g007
Figure 8. This figure shows a SolidWorks CAD drawing of the TriCon and three major components using component dimensions from Table 2. This CAD drawing shows the space occupied by the total quantities of the three major components of the design, PV, EDG, and BESS, and remaining space for detailed design components.
Systems 10 00074 g008
Figure 9. This figure shows a snapshot of a single run of the system for the 14 day period of analysis using January GHI input data. The green line represents the design objective threshold load. As seen, the load often exceeds this during peak work hours due to the stochastic nature of the model. The BESS is able to handle the load and the PV and EDG are able to recharge sufficiently to avoid load shed (BESS reaches zero).
Systems 10 00074 g009
Figure 10. This figure shows a snapshot of a single run of the system over the 14 day period of analysis using July GHI input data. The green line represents the design objective threshold load. As seen, the load often exceeds this during peak work hours. The BESS is able to handle the load and the PV and EDG are able to recharge sufficiently to avoid load shed (BESS reaches zero). The difference from Figure 9 is that the BESS is maintaining a higher charge level throughout the period of analysis due to the increased PV output from the increased solar irradiance in July.
Systems 10 00074 g010
Figure 11. This figure shows a snapshot of a single run of the system over the 14 day period of analysis using January GHI input data but a much larger load than was designed for. The green line represents the increased average load of 17 kW. As seen, the load often exceeds this during peak work hours. Because the BESS capacity was designed to provide 1.5 days of storage for an average 10 kW load, it is able to meet the load for the majority of the period of analysis. However, the PV and EDG are not able to recharge sufficiently to avoid load shed as seen by the dotted dark red line spikes representing load shed at the far right of the graph.
Systems 10 00074 g011
Figure 12. This figure shows a snapshot of a single run of the system over the 14 day period of analysis using July GHI input data but a much larger load than was designed for. The green line represents the increased average load of 17 kW. As seen, the load often exceeds this during peak work hours. The difference between this figure and Figure 11 is that the PV is now able to recharge at a sufficient rate to prevent a slow draw down of the BESS and prevent load shed.
Systems 10 00074 g012
Table 1. This table shows the average value from multiple COTS specifications that met the general range of output values desired (e.g., amperage, voltage, storage capacity). These averages were used in the design analysis to avoid using a specific product and instead show that in general, a variety of COTS products could be used to develop the proposed mobile microgrid.
PV Panel Specifications (STC)Sources
PV Panel Type by Advertised SizeOpen Circuit Voltage (Vmp) [V]Maximum Power Current (Imp) [A]Rated Maximum Power (Pmax) [W]Length (Inches)Width (Inches)Depth (Inches)Weight (lbs)
450 W49.3210.8945082.9041.111.4353.95[54,55,56,57,58]
320 W42.079.2032067.8239.681.4843.08 [59,60,61,62]
Battery Specifications
Battery TypeChemistryVoltageStorage Capacity
[Ah]
Length (Inches)Width (Inches)Height (Inches)Weight (lbs)
LiFePO4LiFePO41210012.496.768.3827.68 [63,64,65,66]
Lead AcidLead Acid AGM Deep Cycle1210012.756.748.5162.9 [67,68,69,70]
LiFePO4LiFePO44810026.6814.989.25135.57 [71,72,73]
Generator: DoD Advanced Medium Mobile Power Sources (AMMPS)
Power Rating (kW)Fuel Consumption:
100% Rated Load 60 Hz
(400 Hz) [GPH]
Length (Inches)Width (Inches)Height (Inches)Weight (Wet) [lbs]
100.755532361060 [74,75]
151.066536531560 [74]
Table 2. This table represents the final COTS components and quantities chosen for the preliminary design and feasibility analysis of the proposed mobile microgrid. The specification values are the average values for those chosen components taken from Table 1.
Final Design COTS Component Specifications
PV Panel Specifications (STC)Sources
PV Panel Type by Advertised SizeQuantityOpen Circuit Voltage (Vmp) [V]Maximum Power Current (Imp) [A]Rated Maximum Power (Pmax) [W]Length (Inches)Width (Inches)Depth (Inches)Weight (lbs)
450 W3049.3210.8945082.9041.111.4353.95 [54,55,56,57,58]
Battery Specifications
Battery TypeQuantityChemistryVoltageStorage Capacity (Ah)Length (Inches)Width (Inches)Height (Inches)Weight (lbs)
LiFePO430LiFePO44810026.6814.989.25135.57 [71,72,73]
Generator: DoD Advanced Medium Mobile Power Sources (AMMPS)
Power Rating (kW)QuantityFuel Consumption:
100% Rated Load 60 Hz
(400 Hz) [GPH]
Length (Inches)Width (Inches)Height (Inches)Weight (Wet) [lbs]
1010.755532361060 [74,75]
Table 3. This table presents a summary of final results from the Monte Carlo simulations across the four use cases investigated in this paper. The table provides a simple side by side comparison of the effects of average load and solar irradiance on generator usage and load shed for the mobile microgrid.
Summary of Results from Mission Engineering Analysis
Use CasePeriod of Analysis (Days)Average Peak Solar/Day (hrs@1-sun/Day)Average Load Input (kW) [Mean, Std]Mean Load/Day (kWh/Day as 95% CI)Mean Generator Usage (has 95% CI) [14 Days = 336 h]Mean Generator Usage (% of Period of Analysis as 95% CI)Load Shed (kWh) [Mean, Std]Load Shed (% of Total Load Demand) [mean, std]
January at NSA Monterey142.8310, 2135.29 ± 0.53207.03 ± 1.0262 ± 0.290.49, 11.960.0, 0.4
July at NSA Monterey147.0110, 2135.23 ± 0.54136.65 ± 1.0241 ± 0.310.00, 0.000.00, 0.00
January Stressing at NSA Monterey142.8317, 2229.34 ± 0.53328.64 ± 0.2798 ± 0.08374.06, 13.7410.69, 8.74
July Stressing at NSA Monterey147.0117, 2230.00 ± 0.53297.82 ± 0.7289 ± 0.2272.94, 160.461.92, 4.09
Publisher’s Note: MDPI stays neutral with regard to jurisdictional claims in published maps and institutional affiliations.

