
Evaluating the Impact of Institutional Improvement on Control of Corruption—A System Dynamics Approach


Abstract
:1. Introduction
- Happens anywhere: in government, in business, the courts, the media, civil society, and all sectors they touch, such as from health and education to infrastructure and athletics [13].
- Involves anyone: politicians, government officials, public servants, business people or members of the public. Moreover, it happens in the shadows, often with the help of professional enablers such as bankers, lawyers, accountants and real estate agents, opaque financial systems and anonymous shell companies that allow corruption schemes to flourish and the corrupt to hide their illicit wealth [13,14].
2. Literature Review
2.1. The Political Economy of Corruption
2.2. Econometric Studies of Corruption
2.3. System Dynamics Models of Corruption
3. Materials and Methods
3.1. Econometric Equations
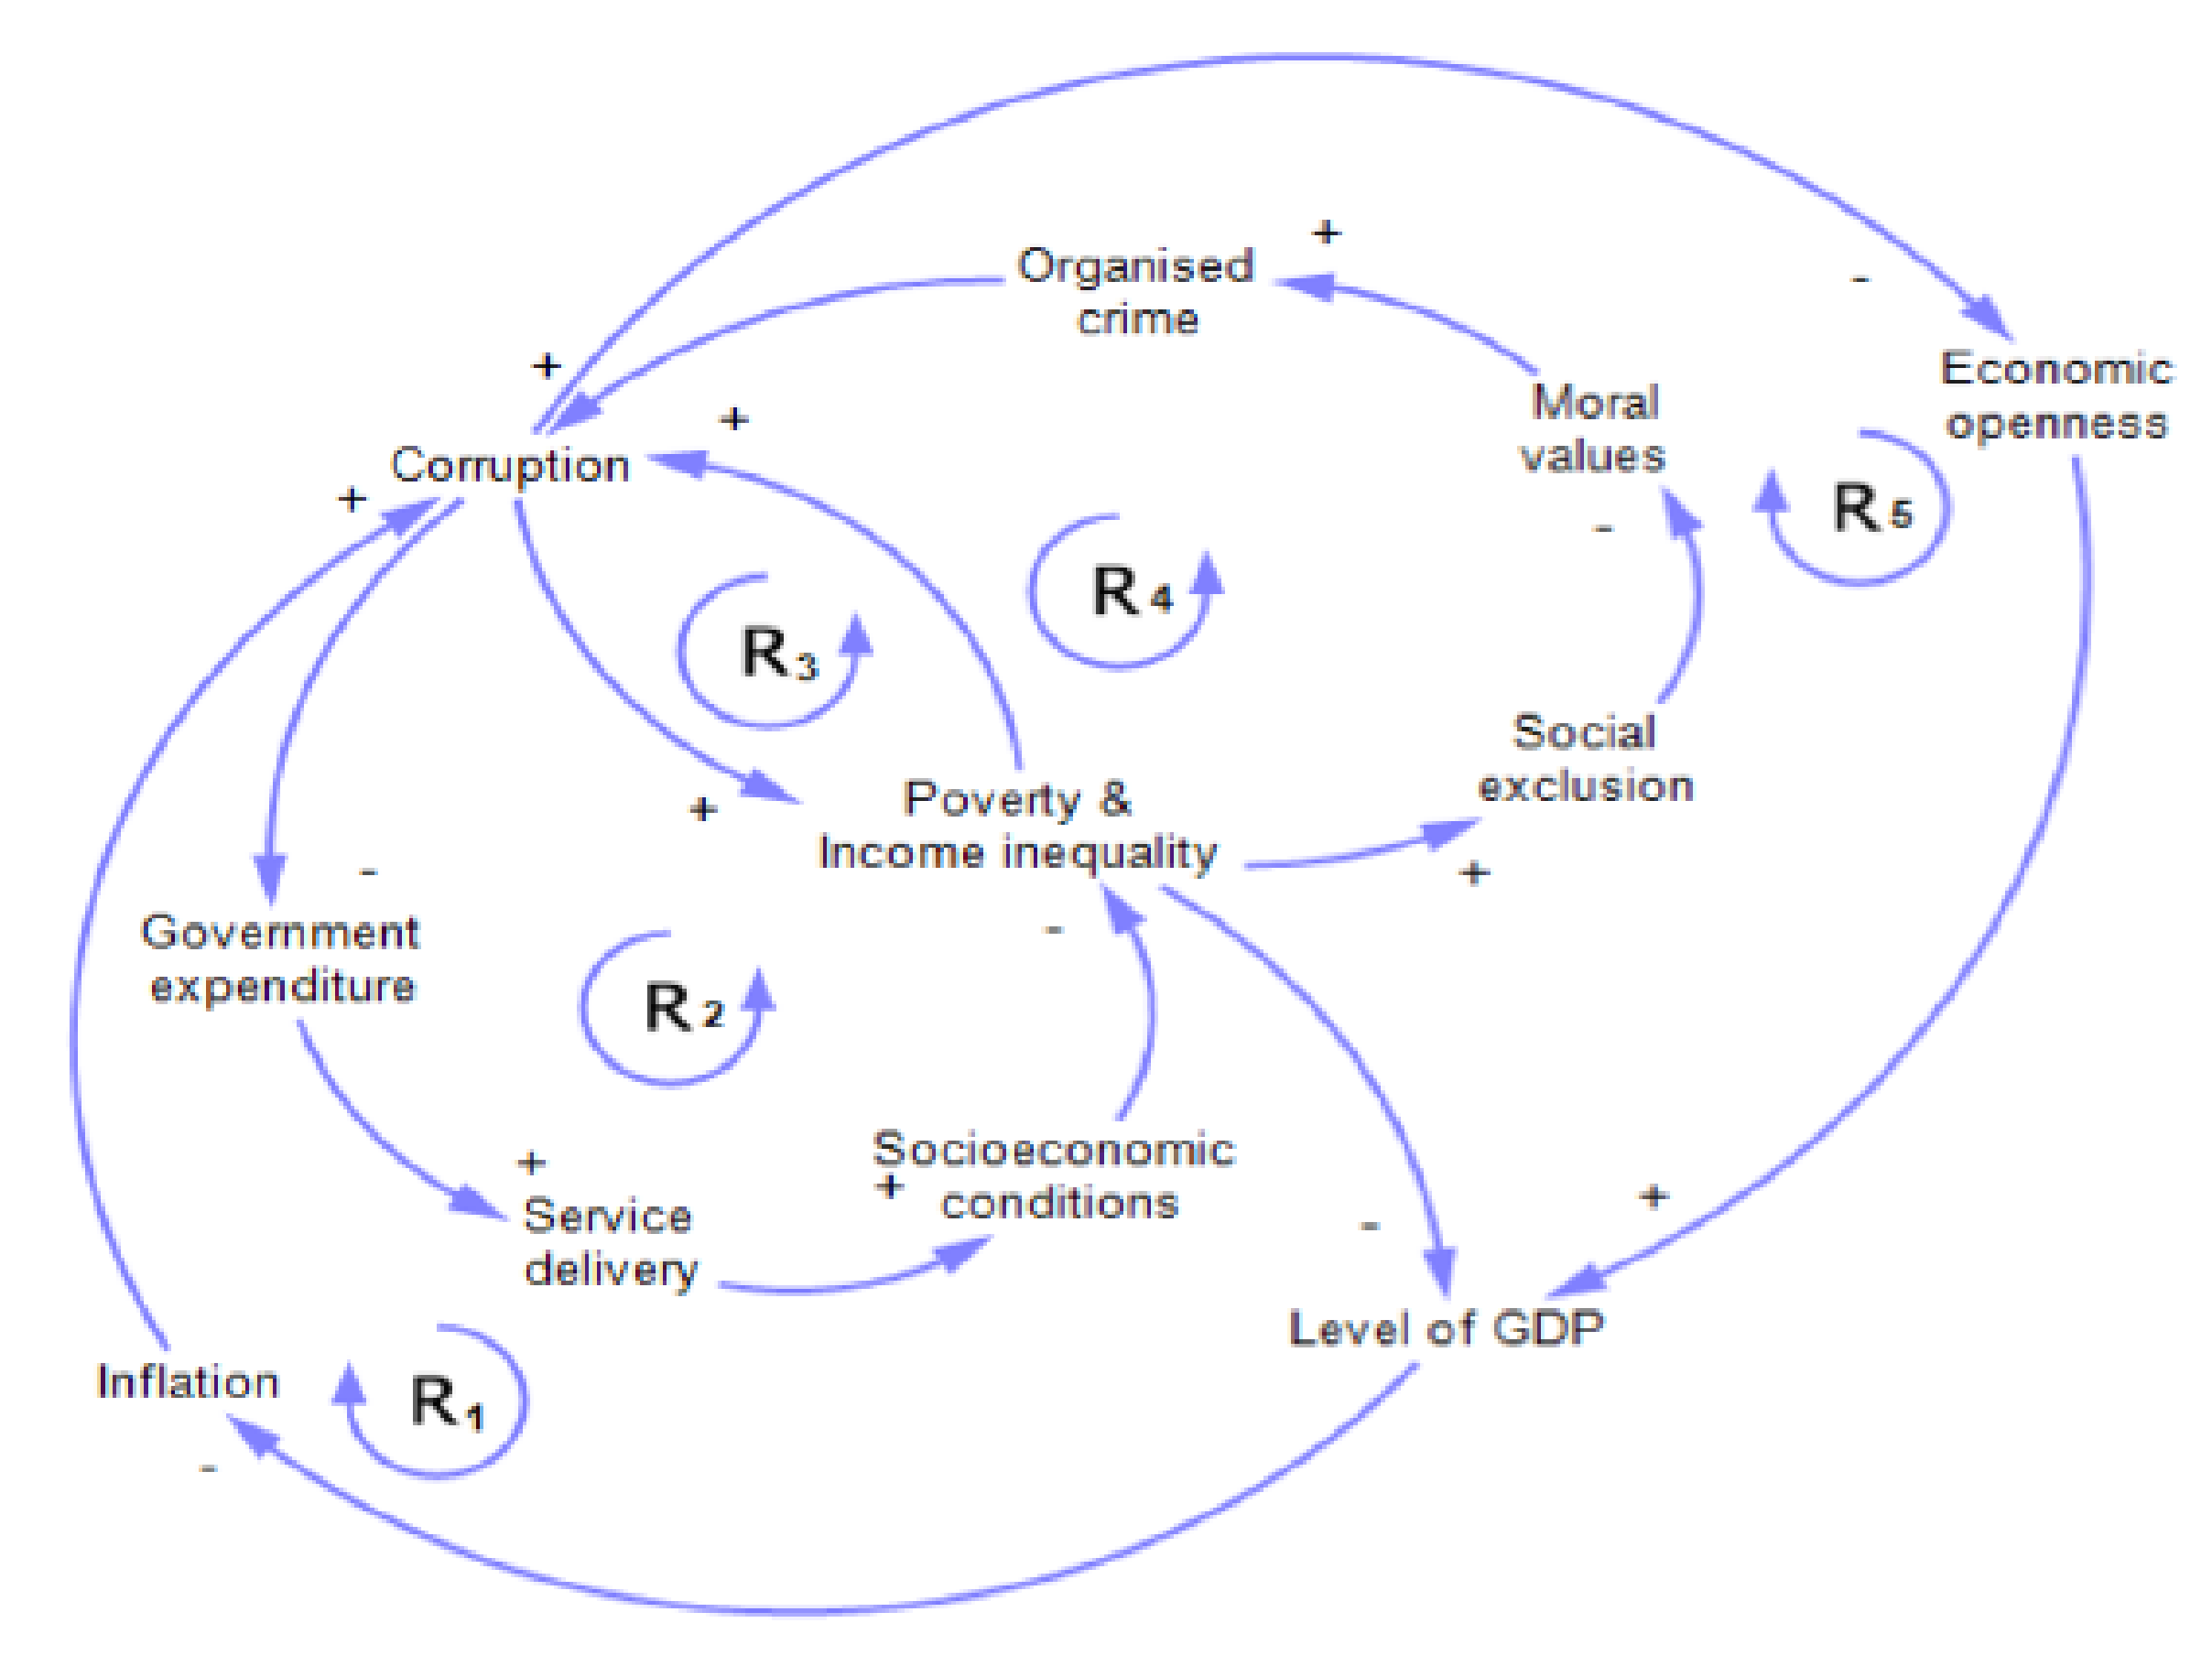
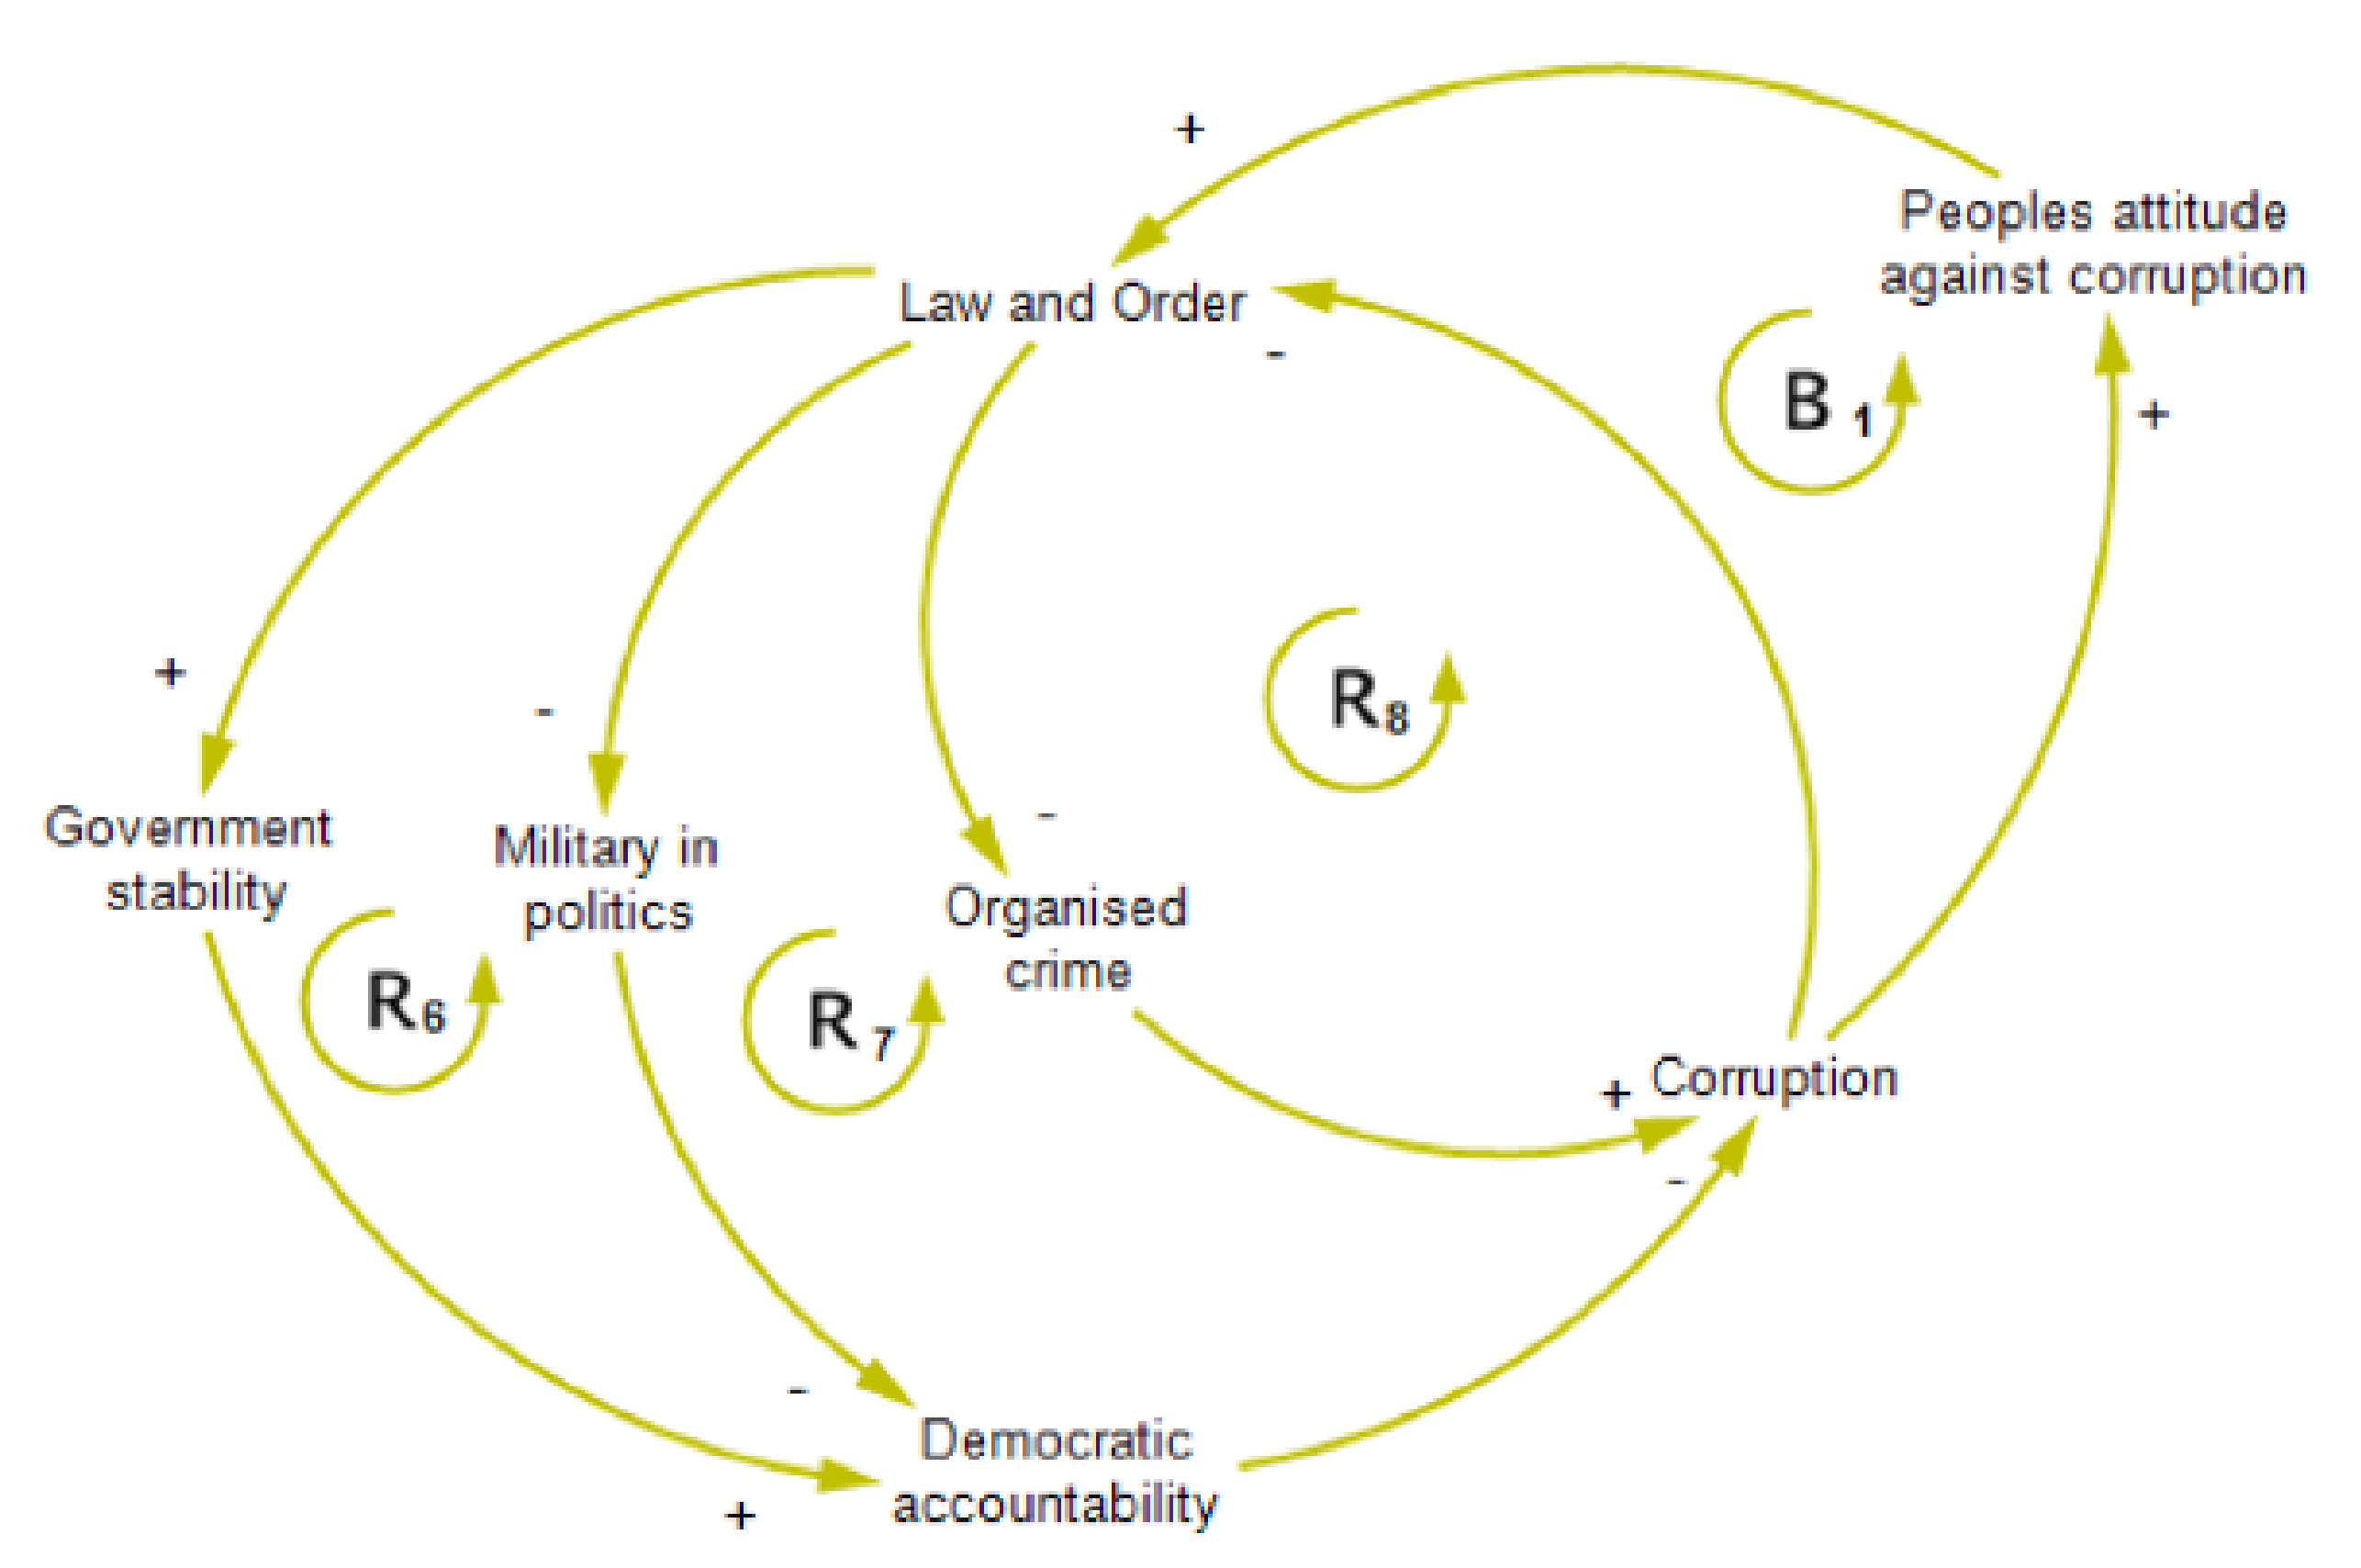
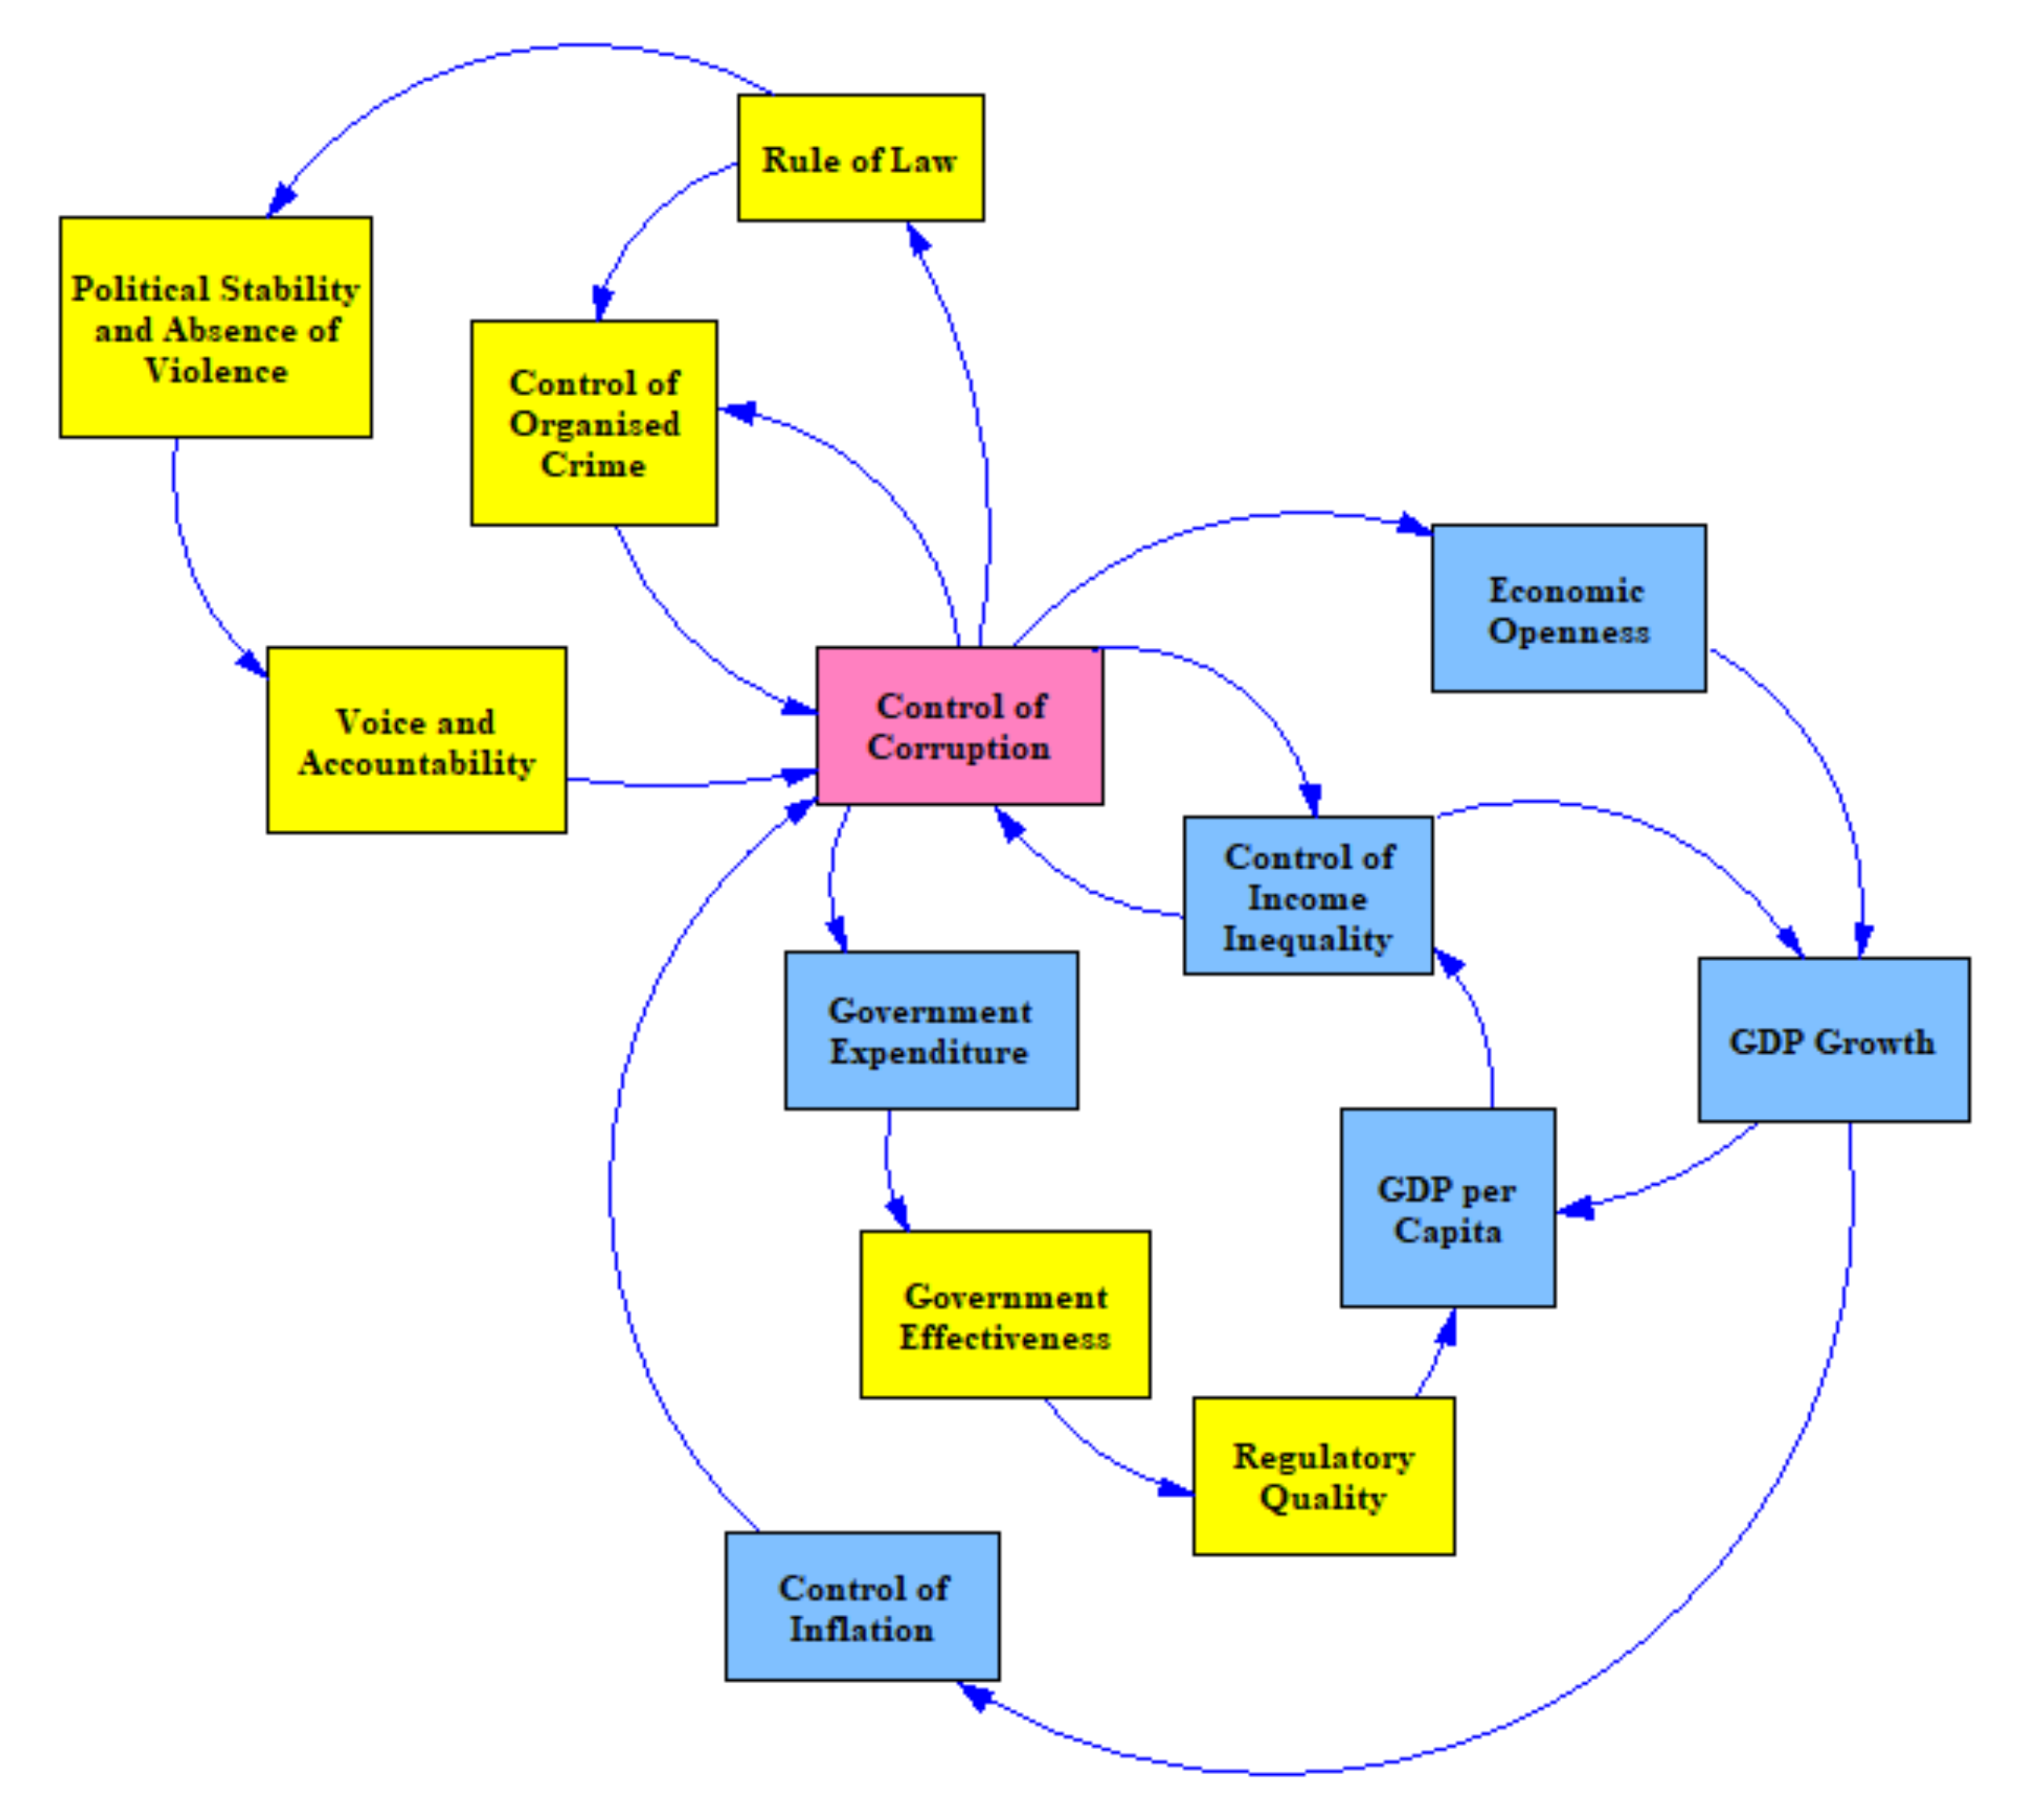
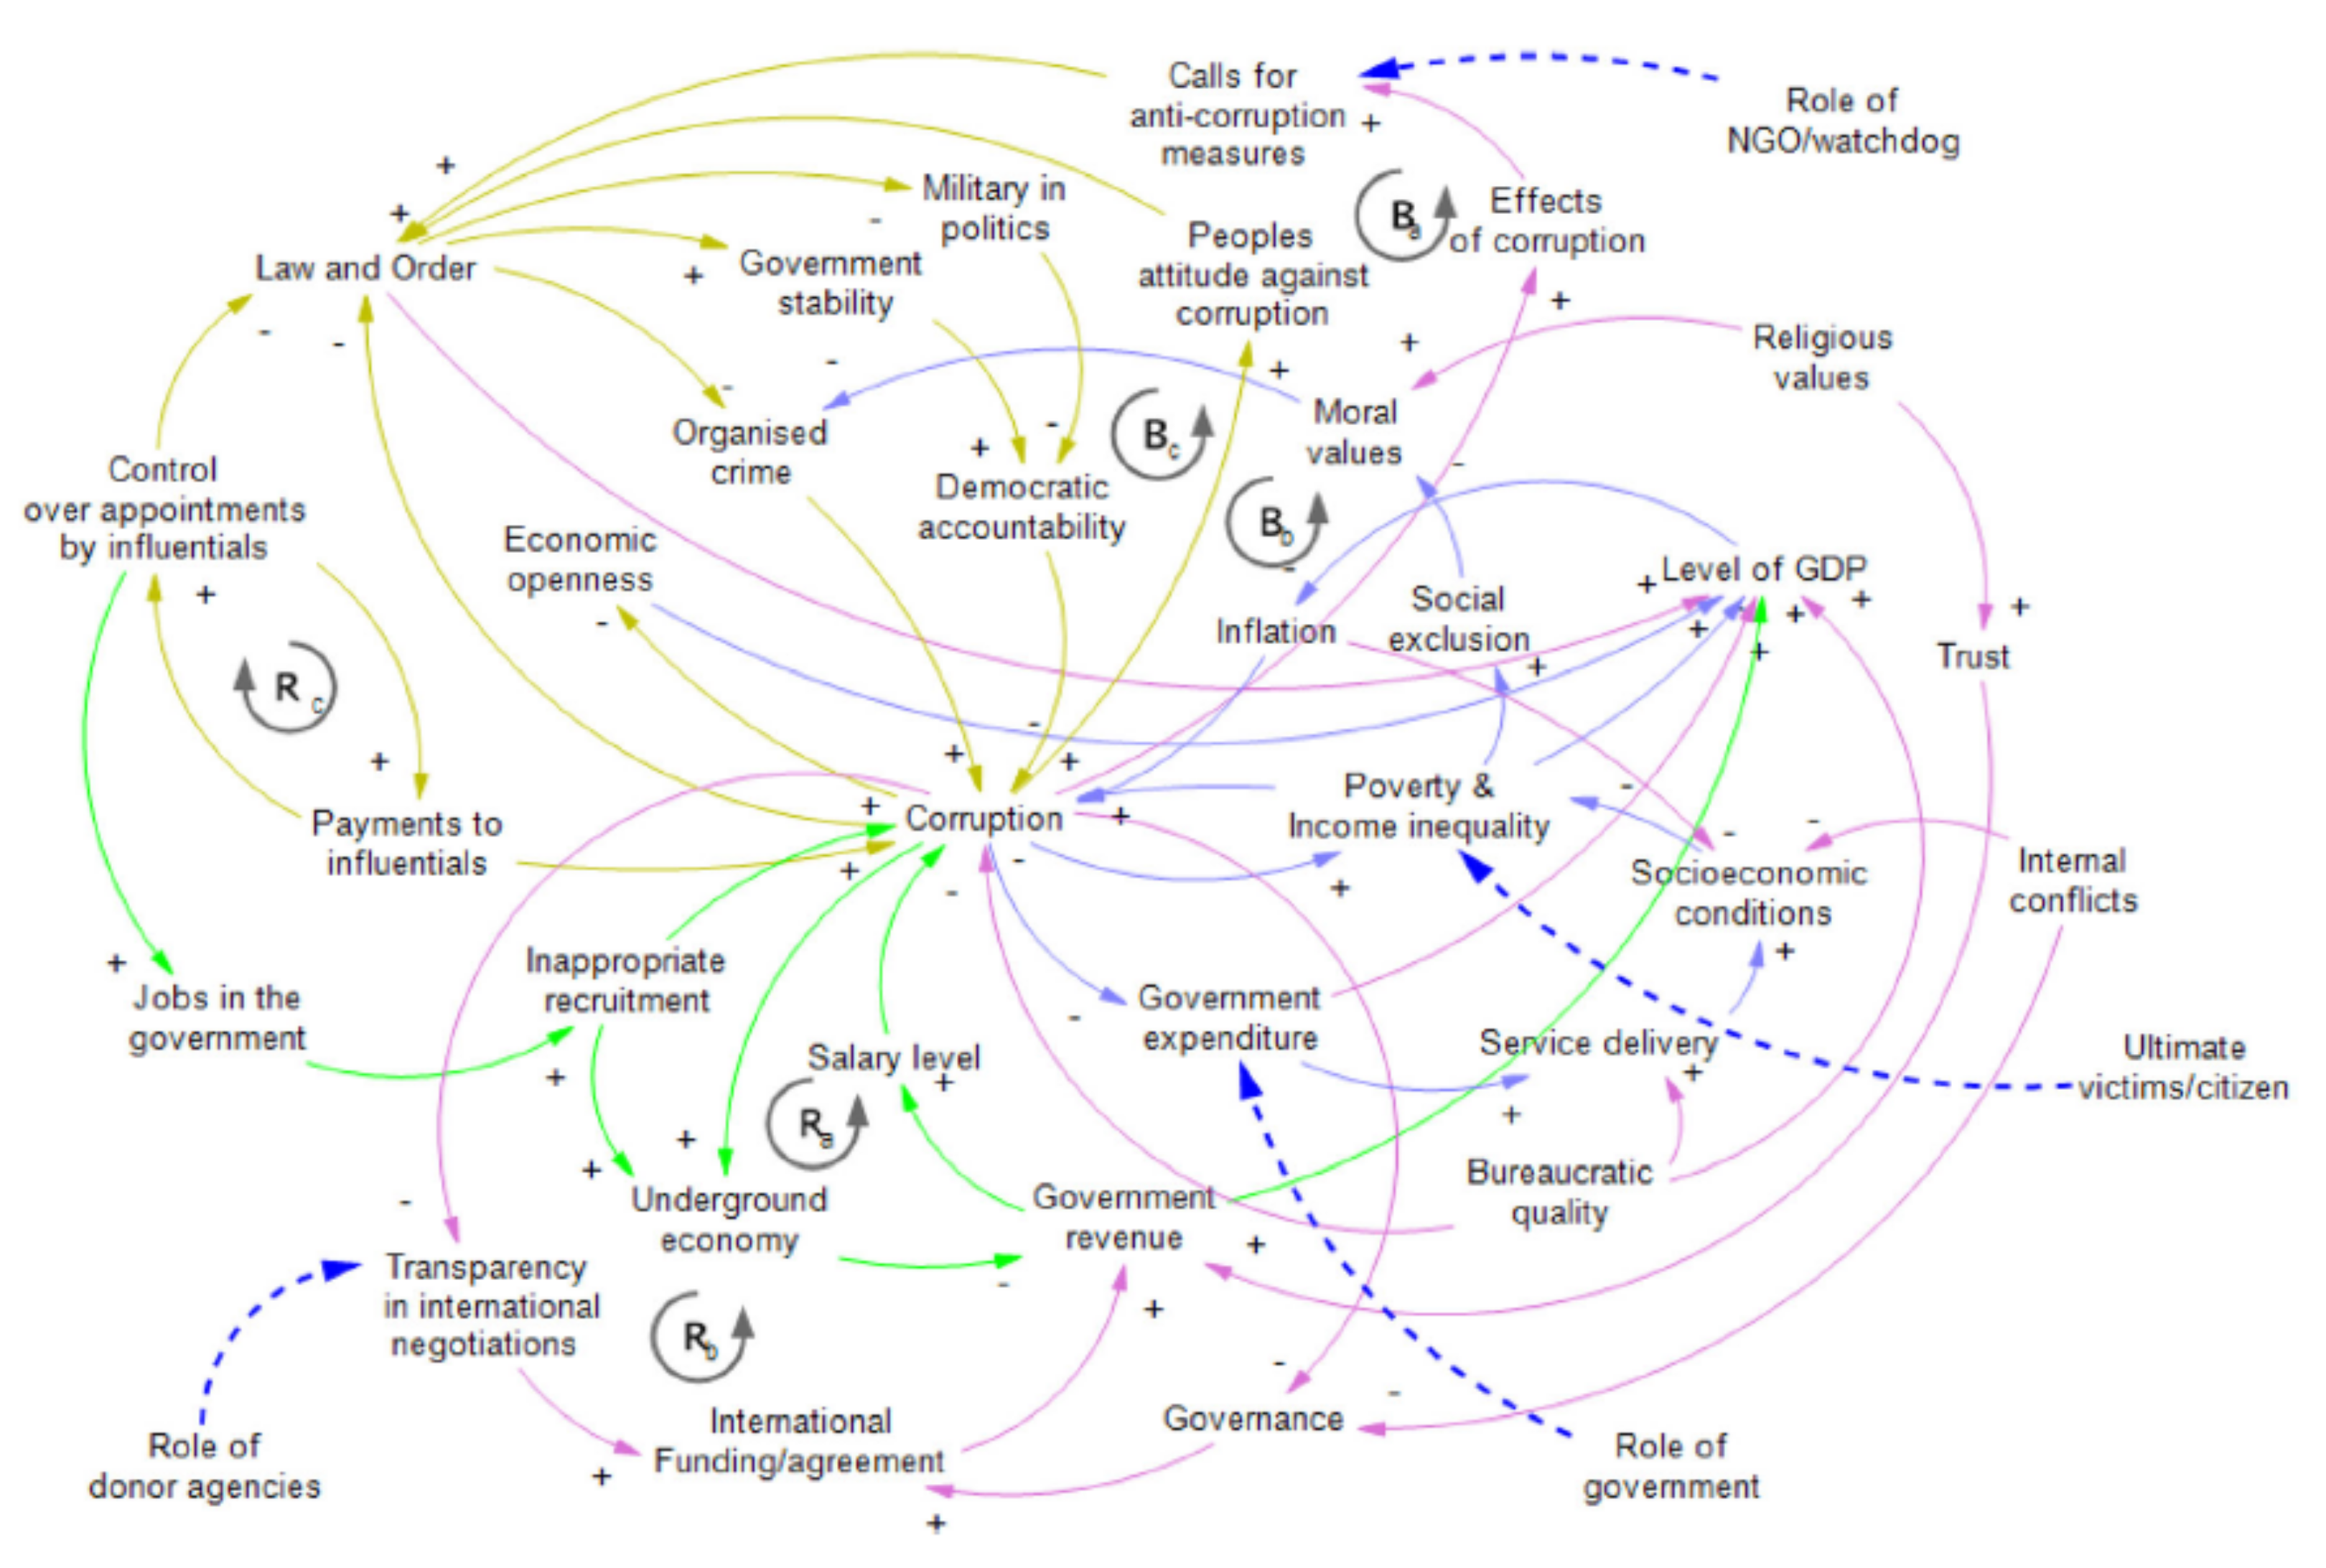
3.2. A Systems Thinking Model
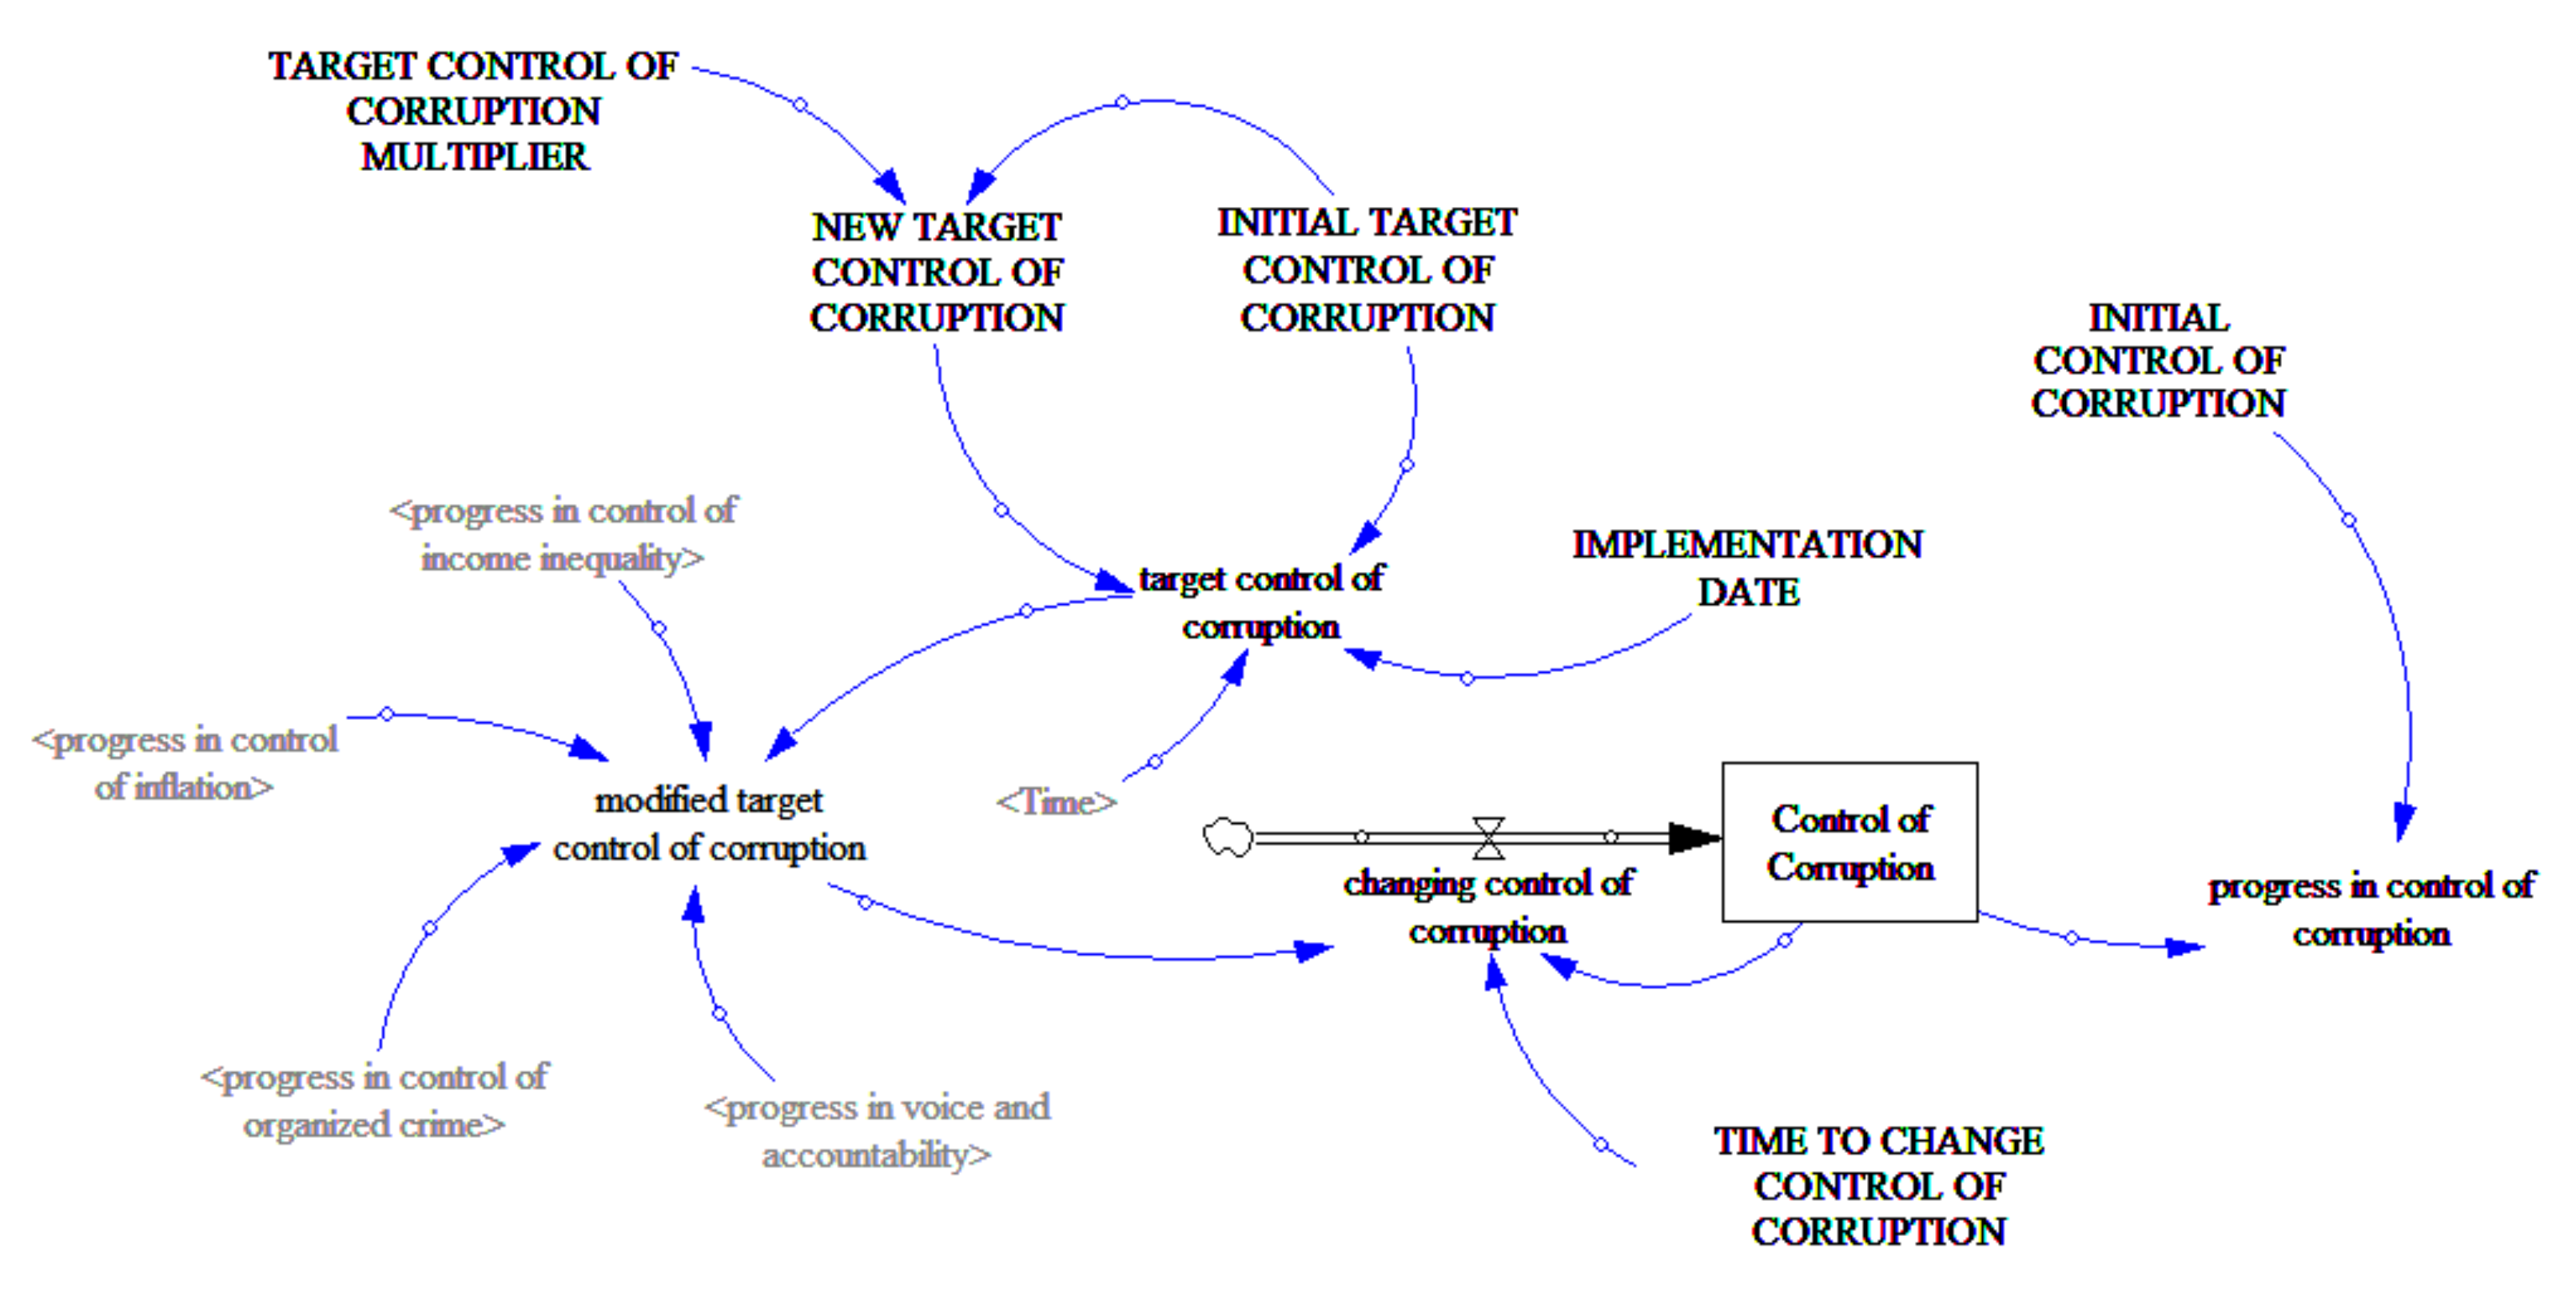
3.3. The System Dynamics Model
3.4. Data Conversion
4. Results
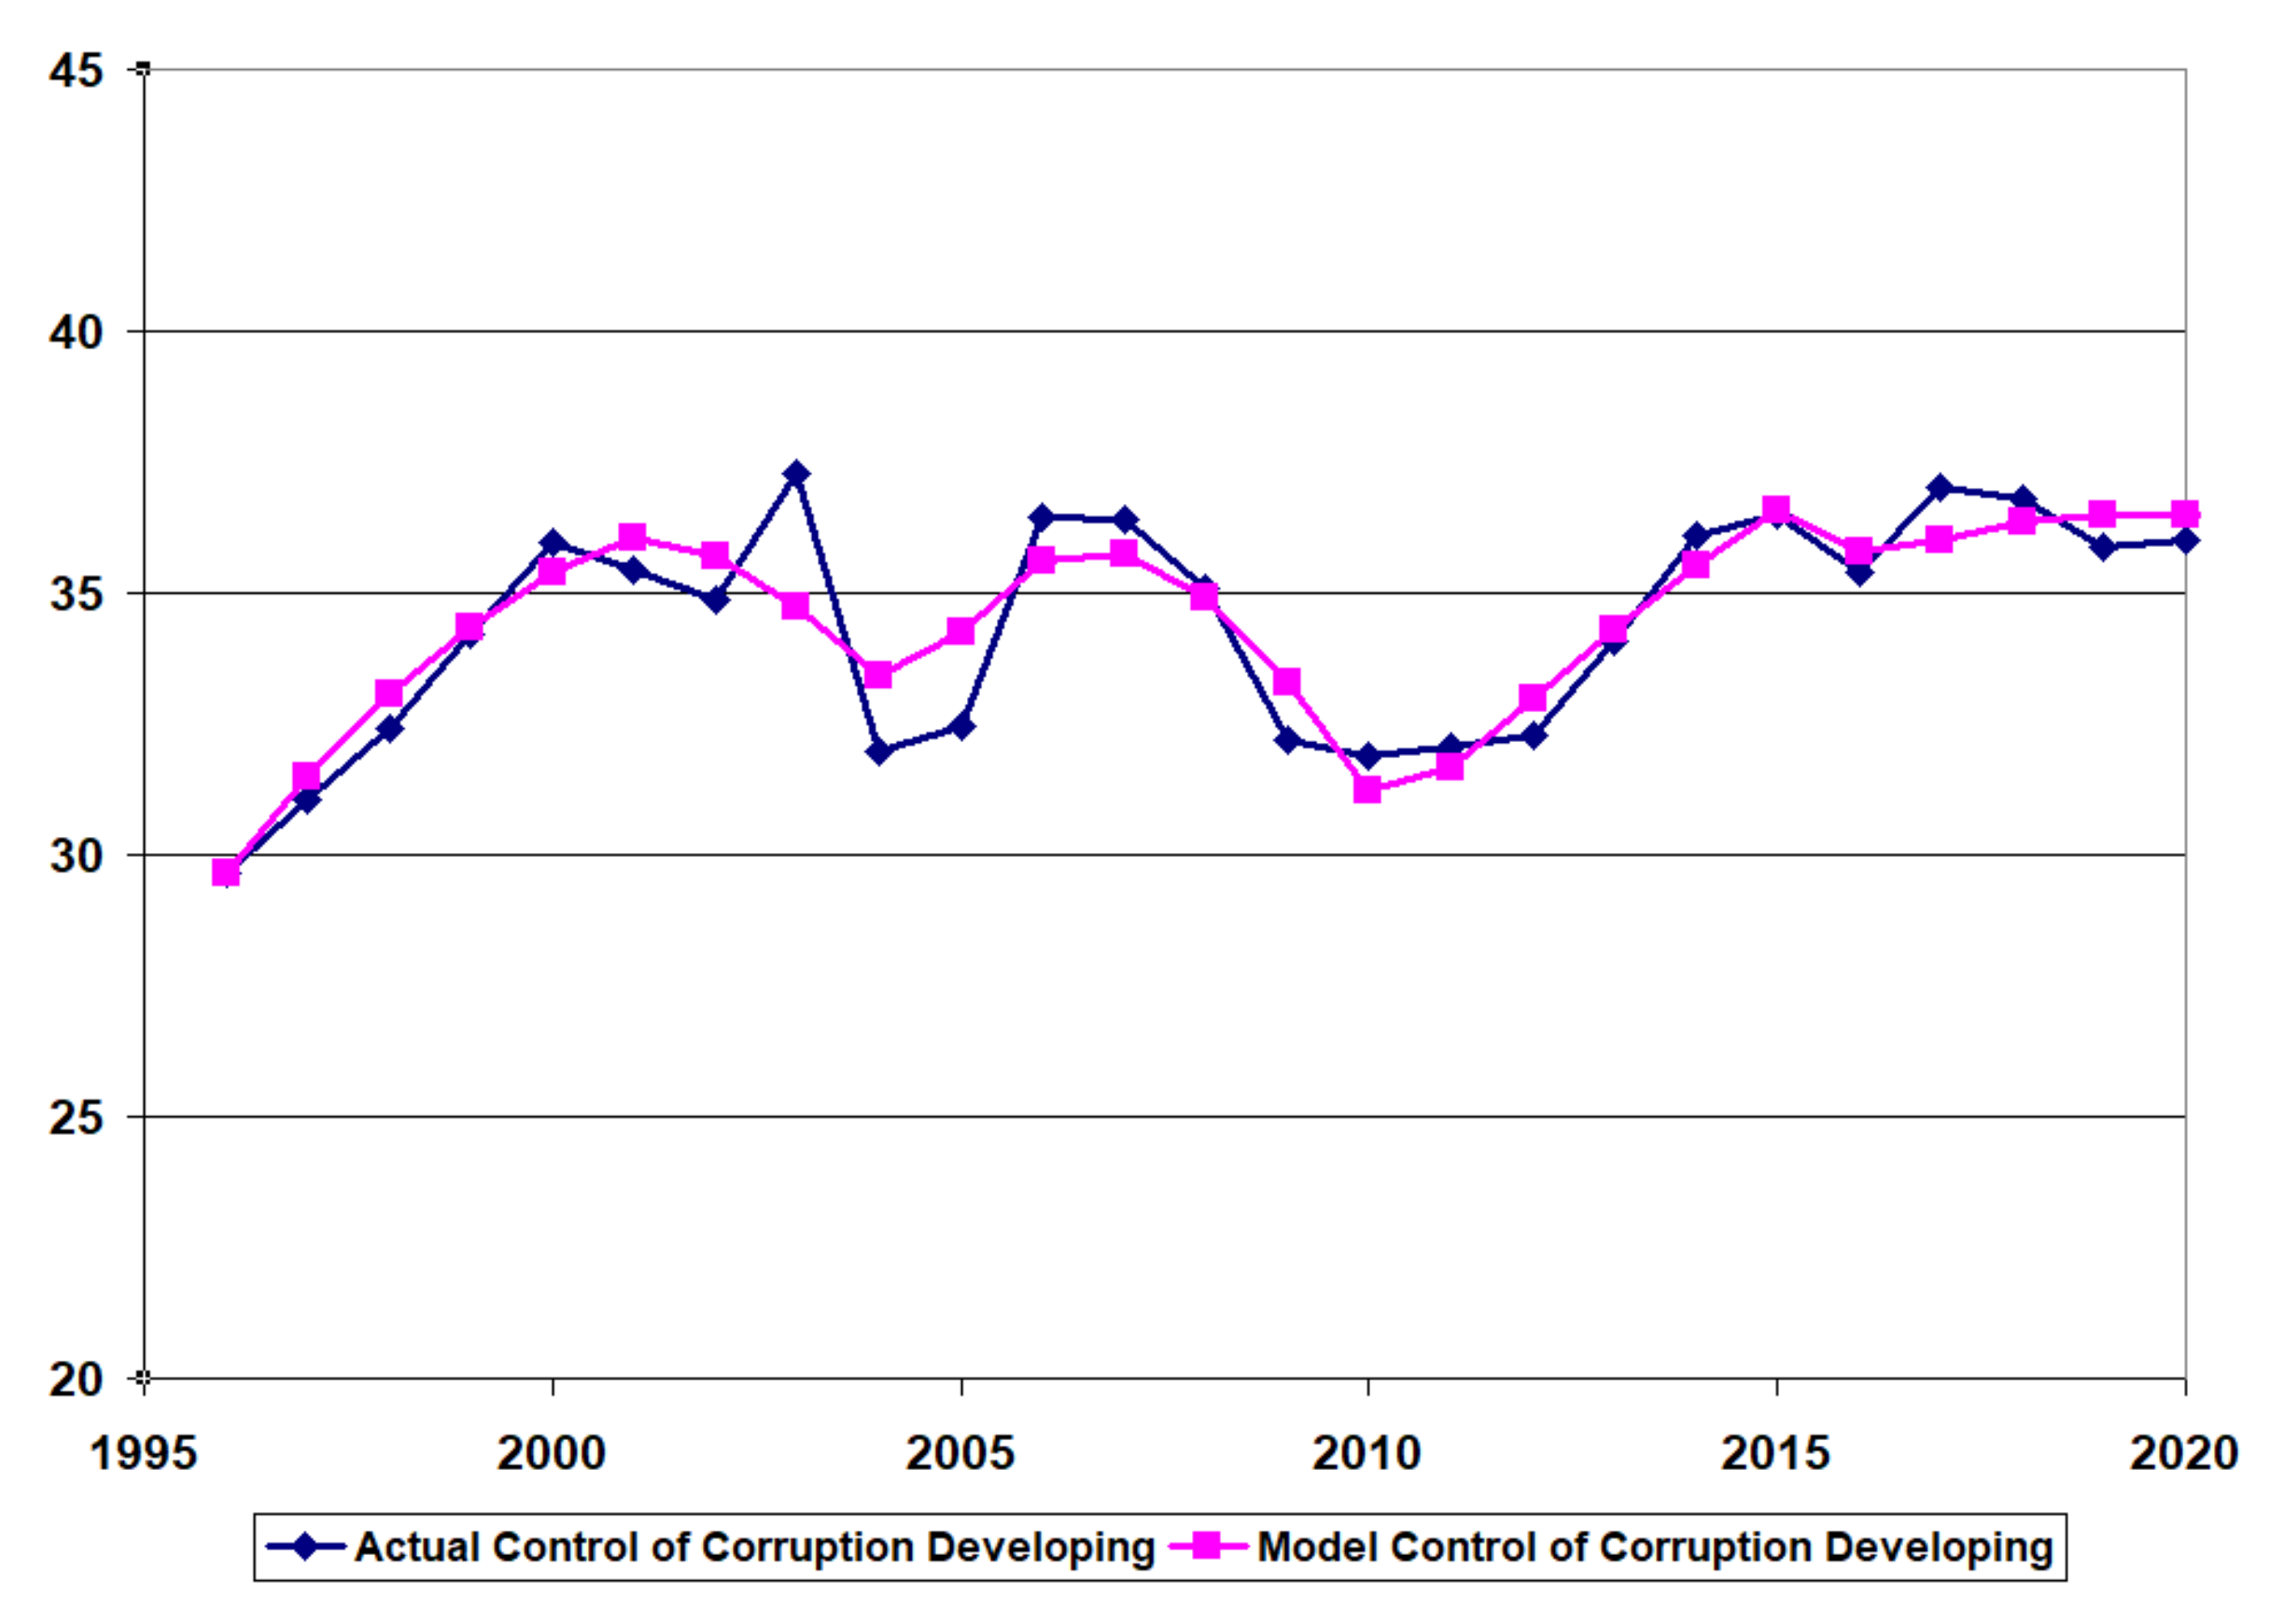
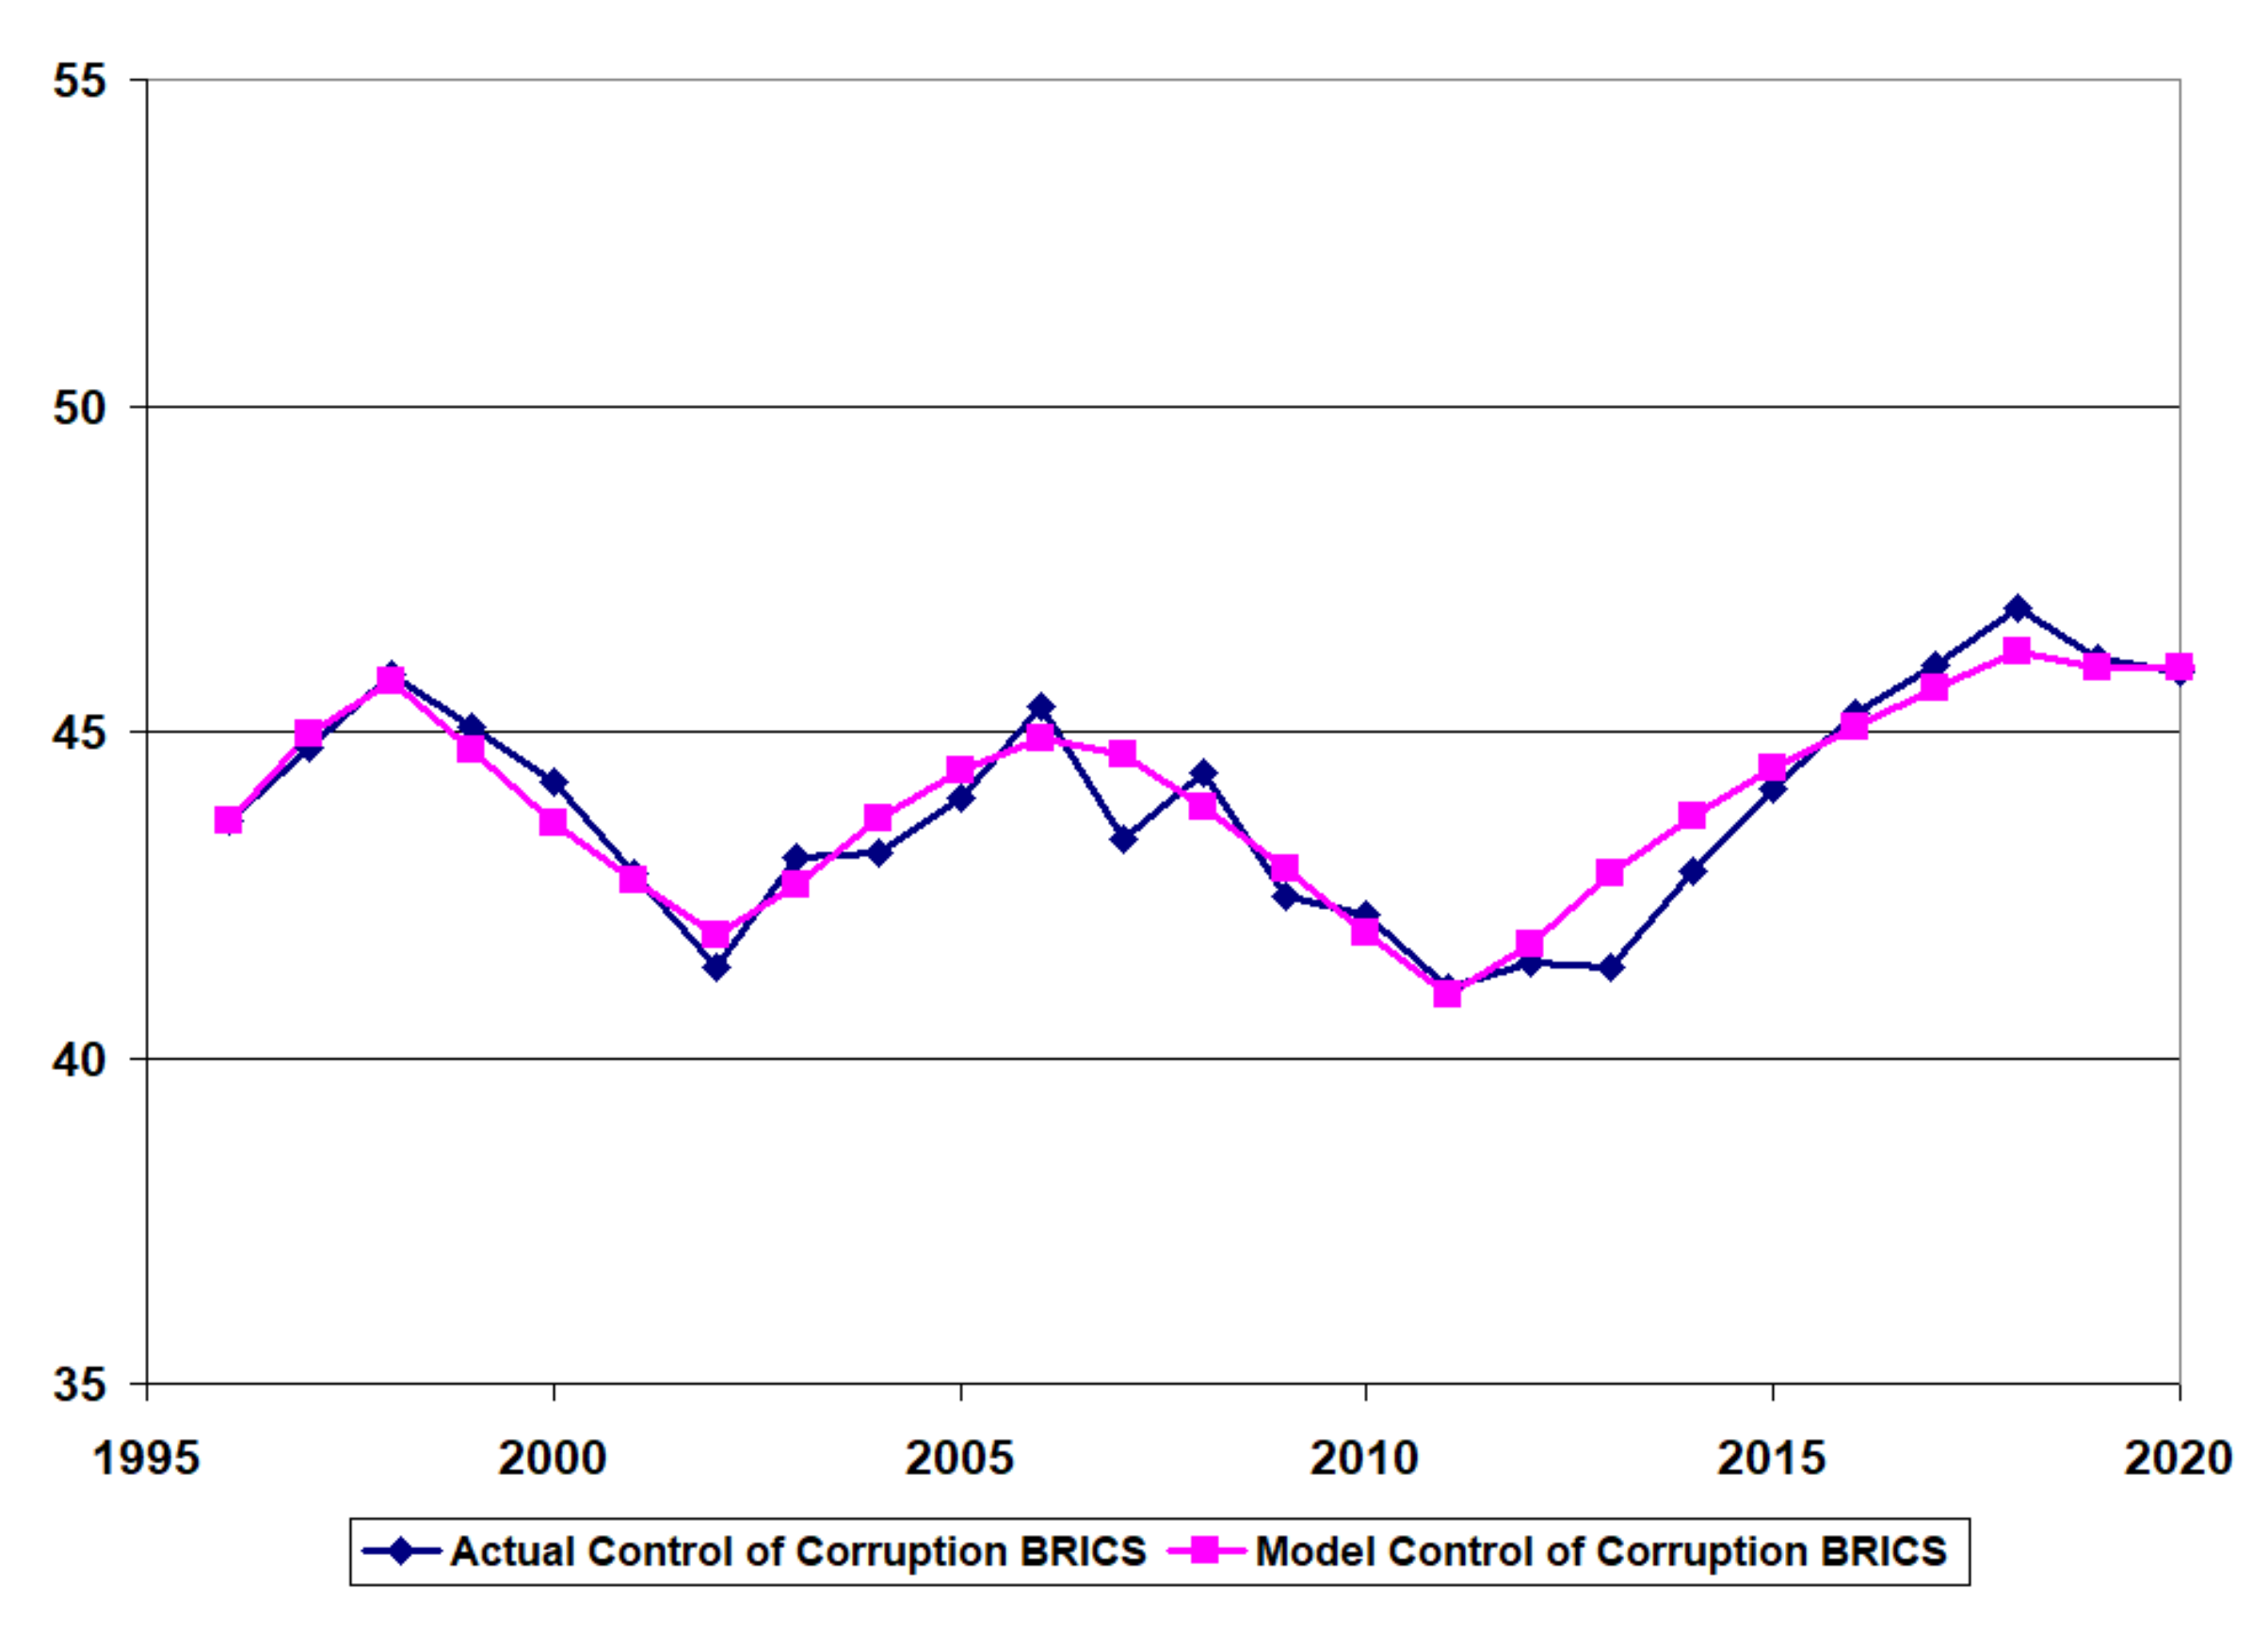
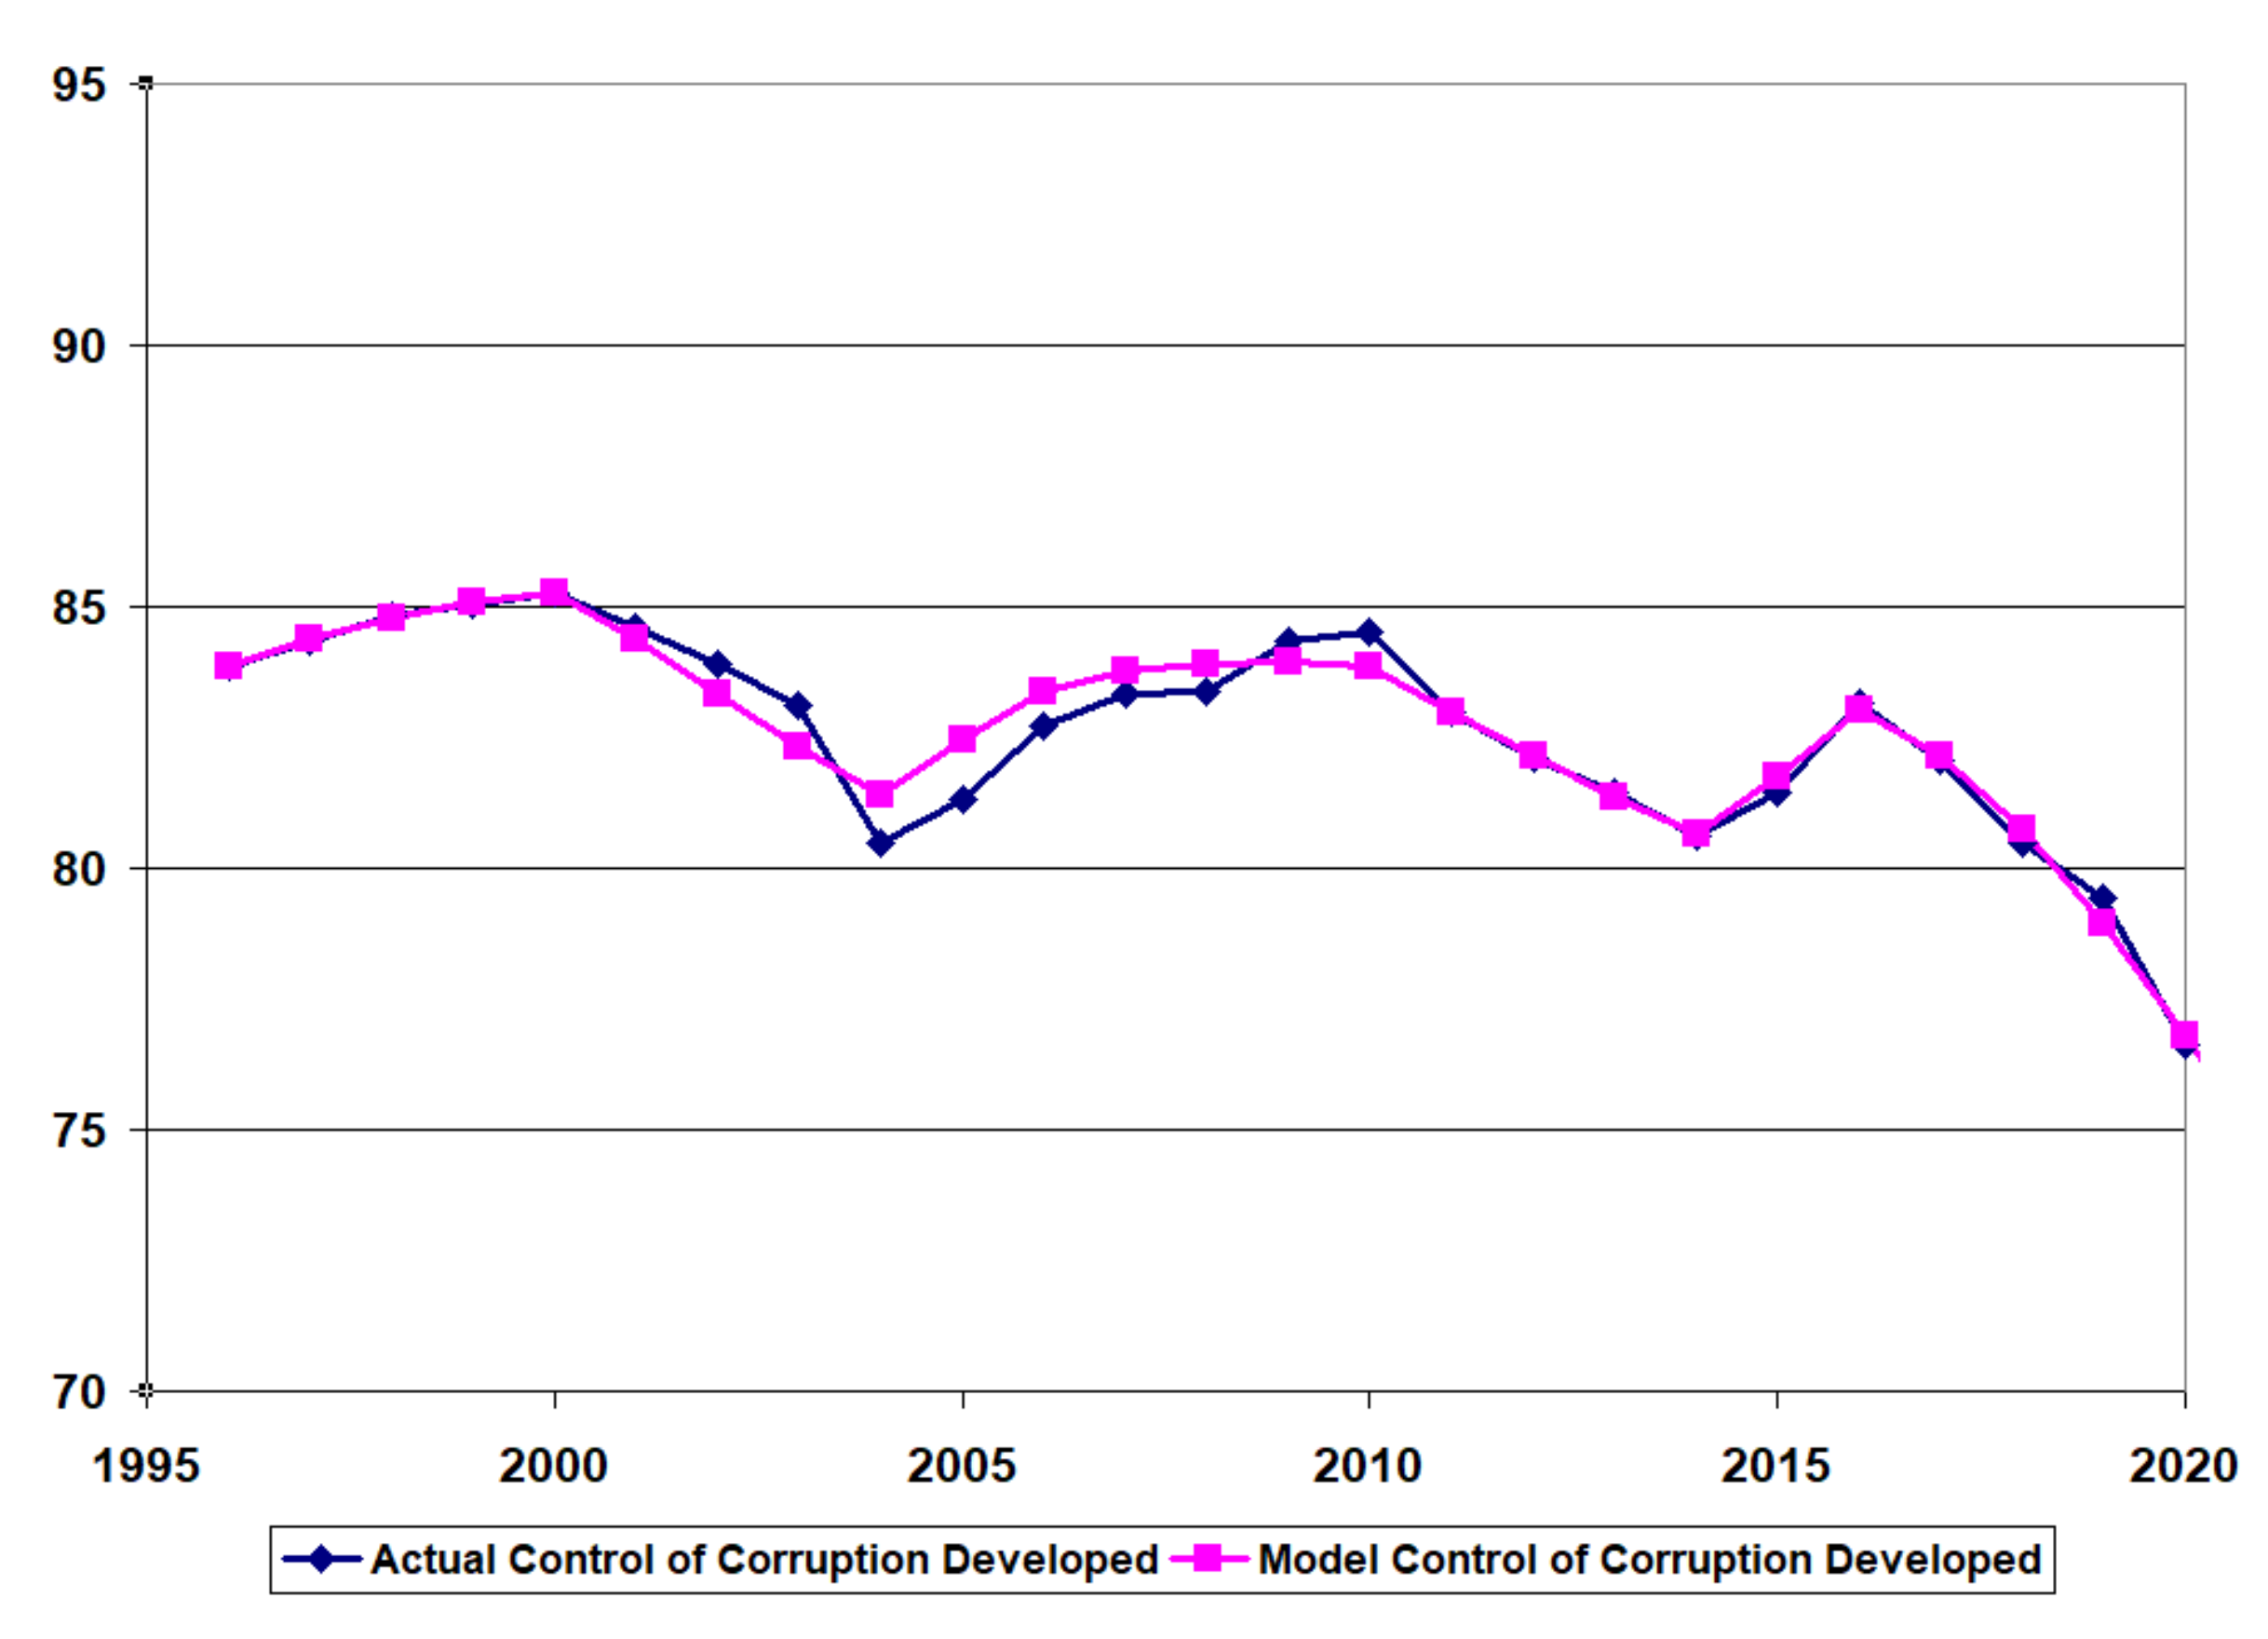
4.1. Model Calibration
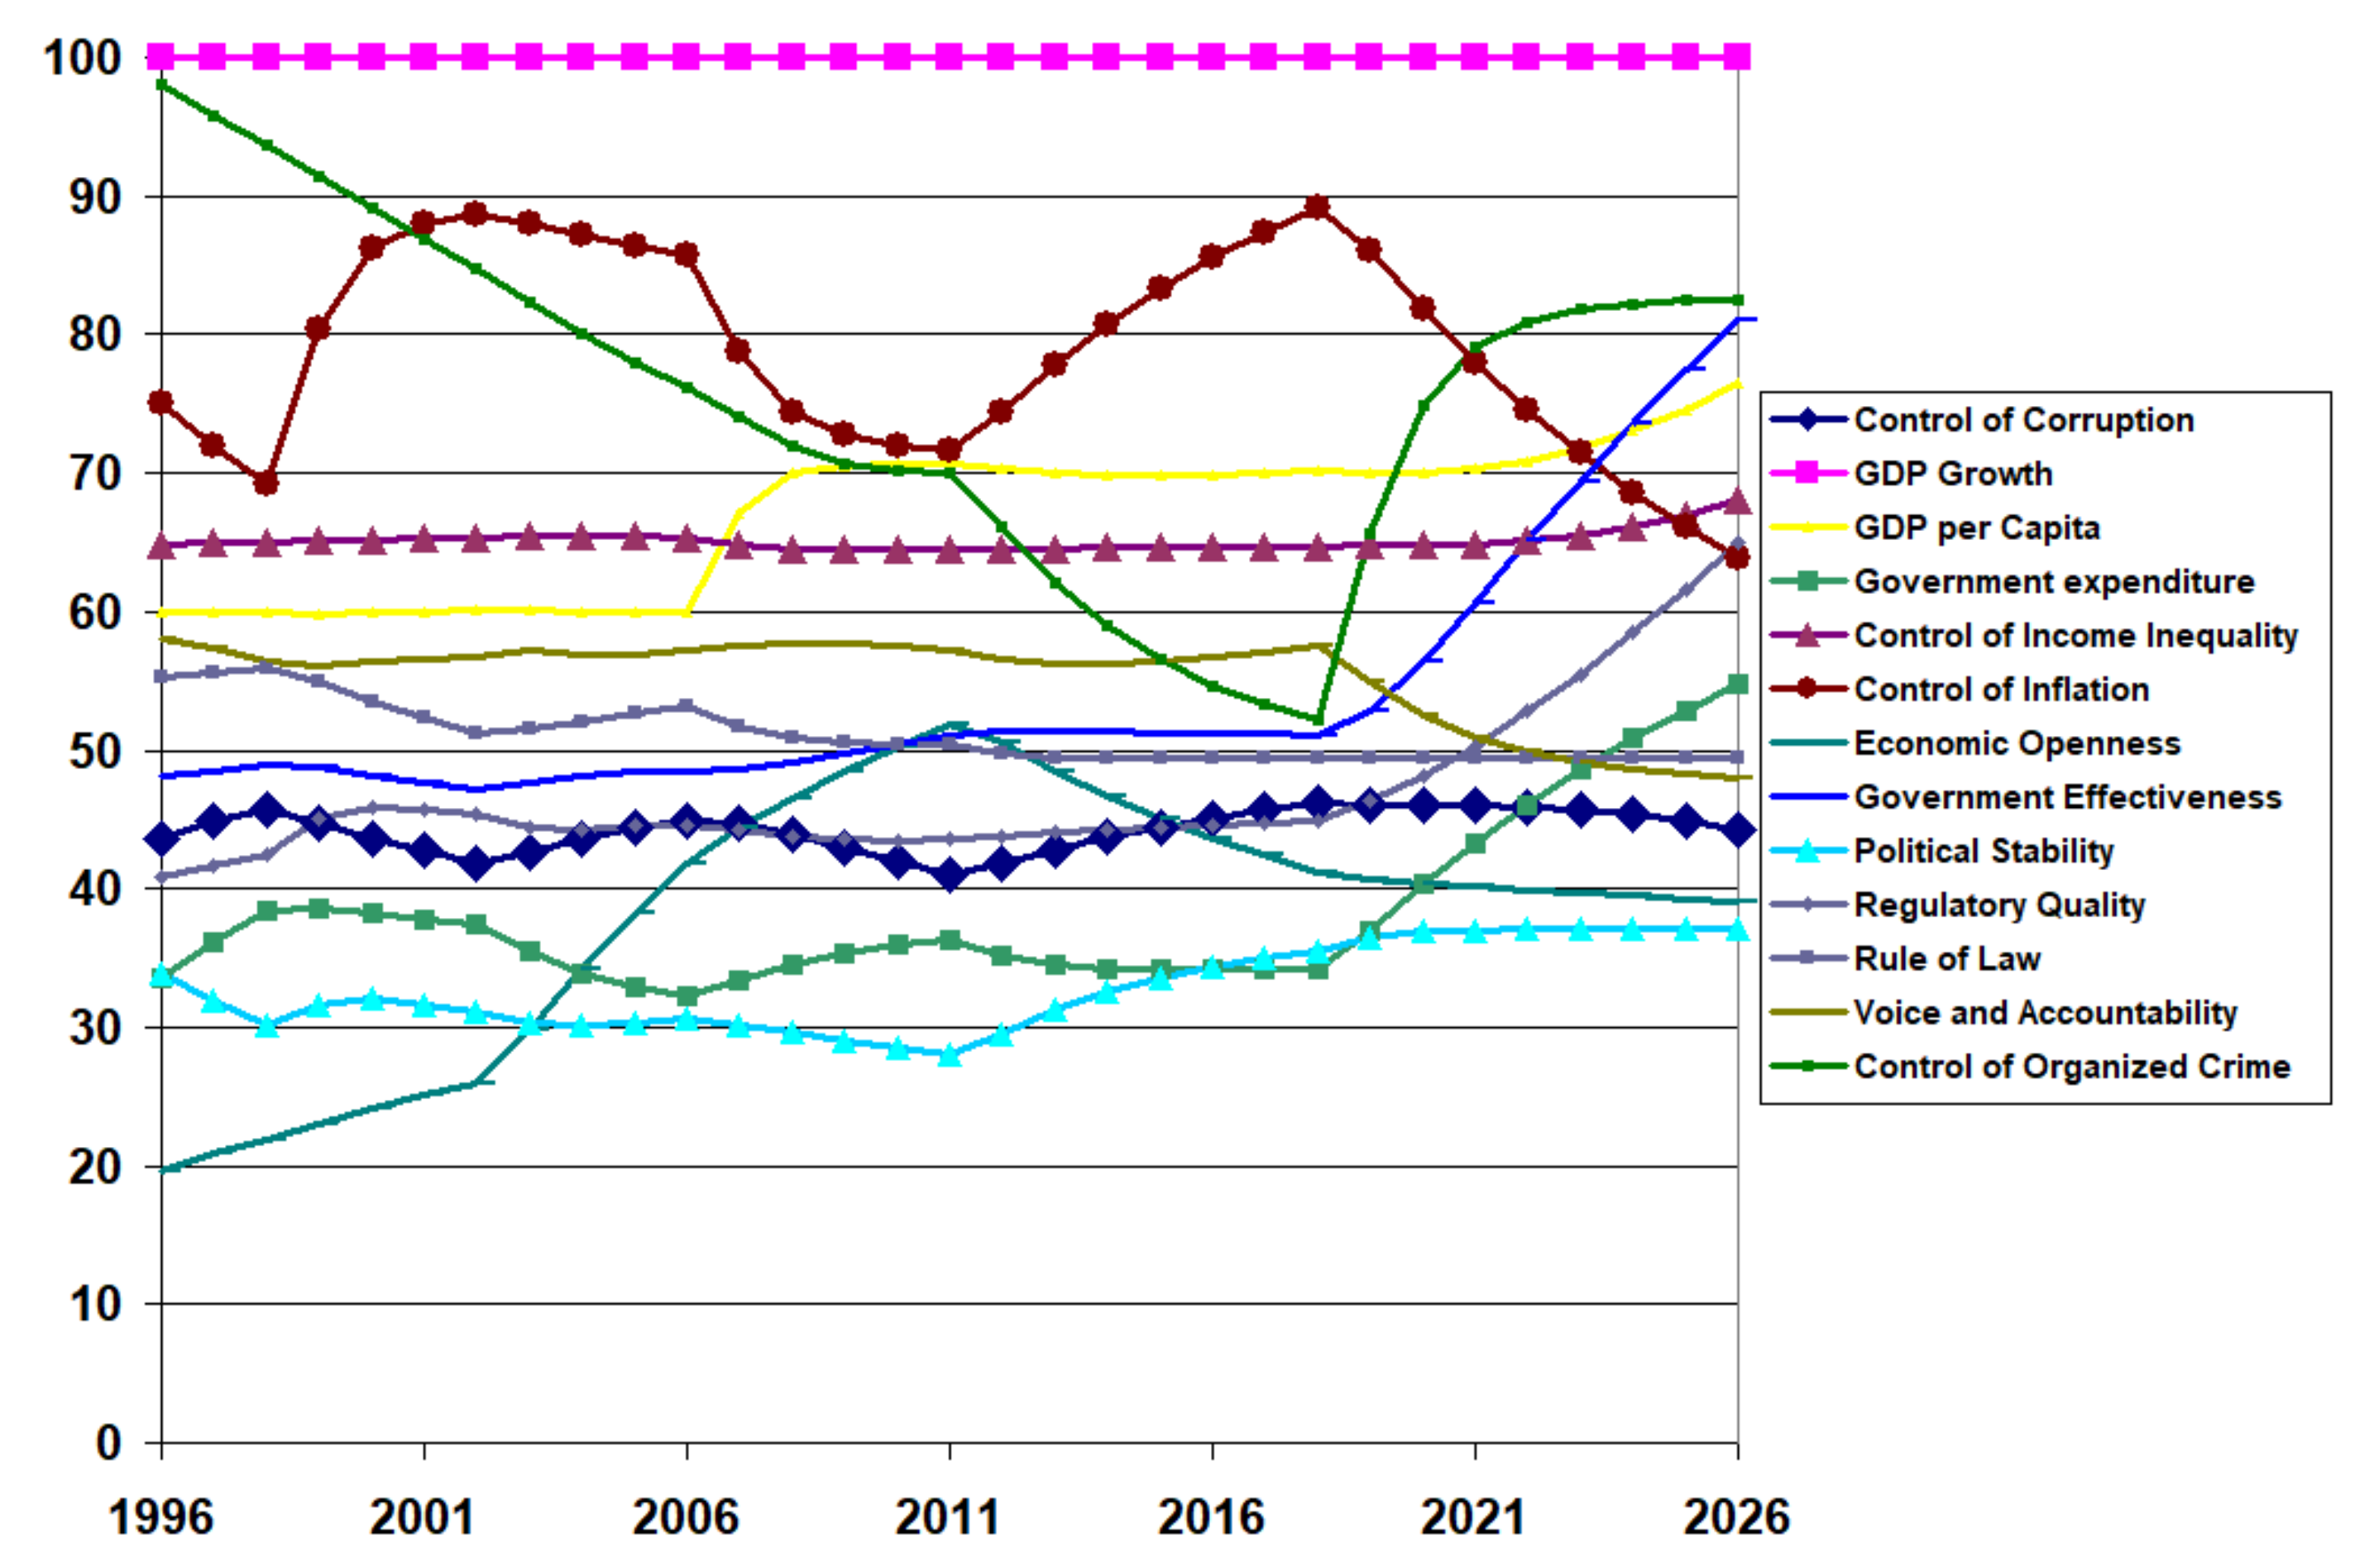
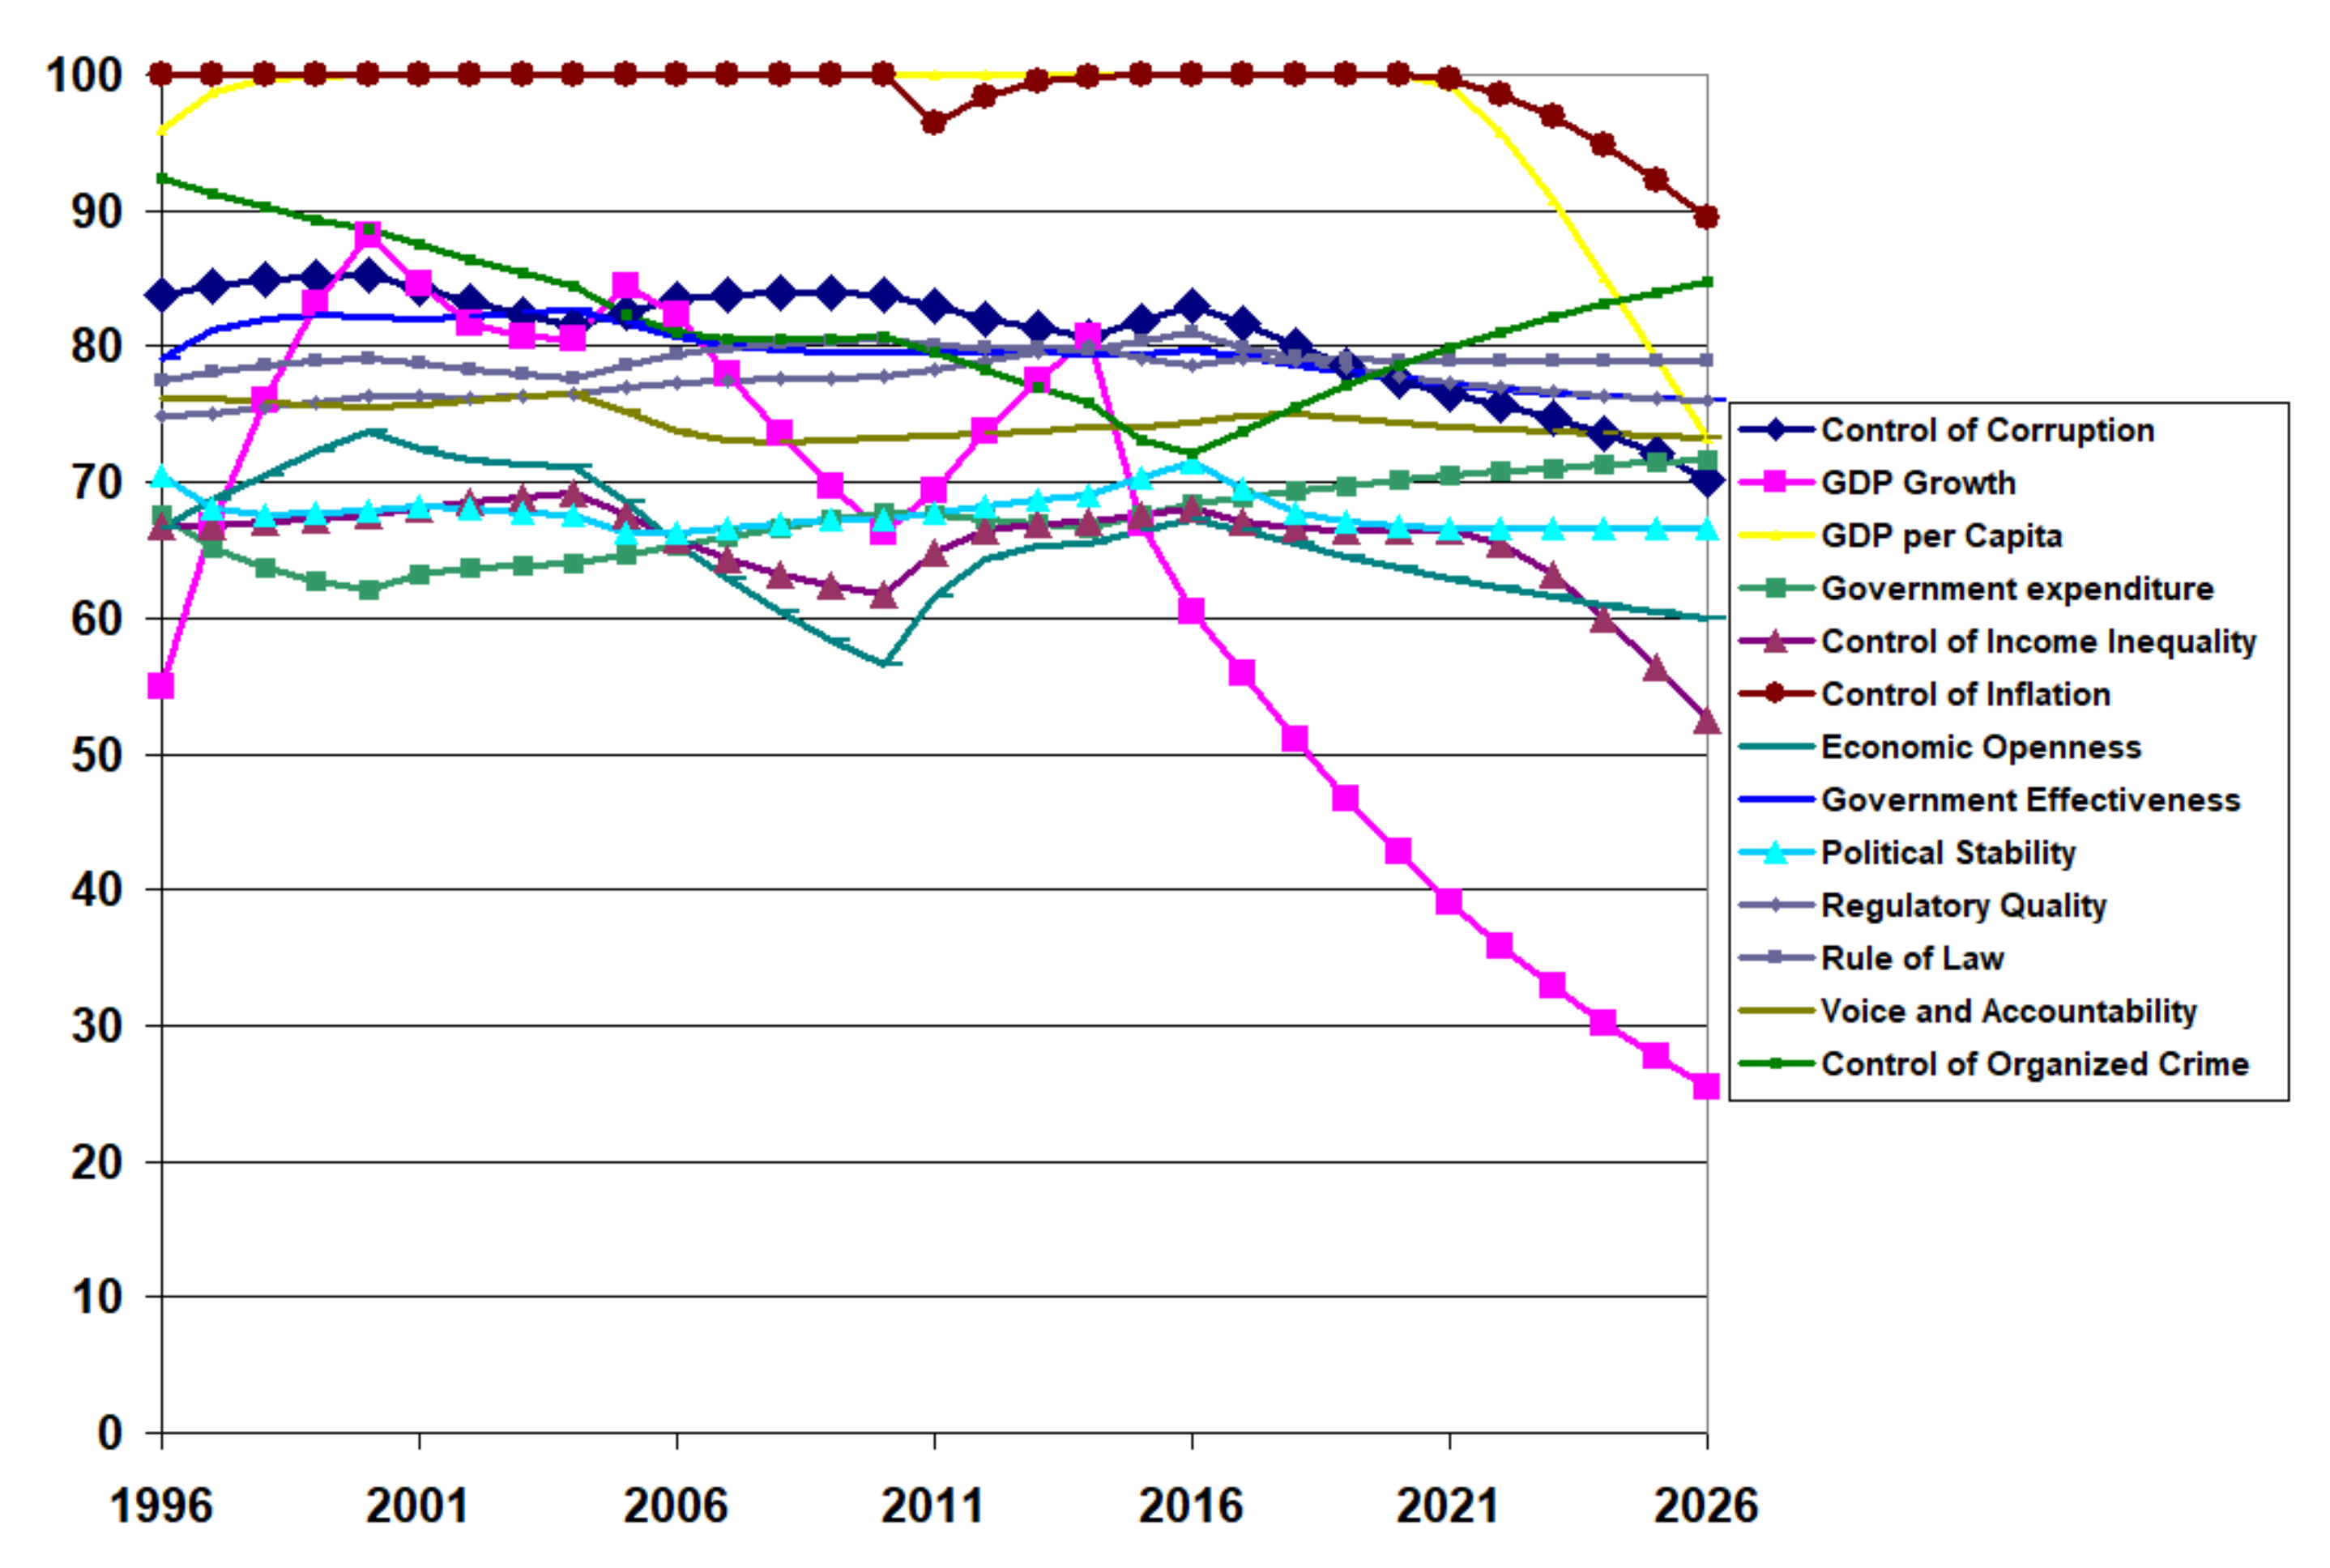
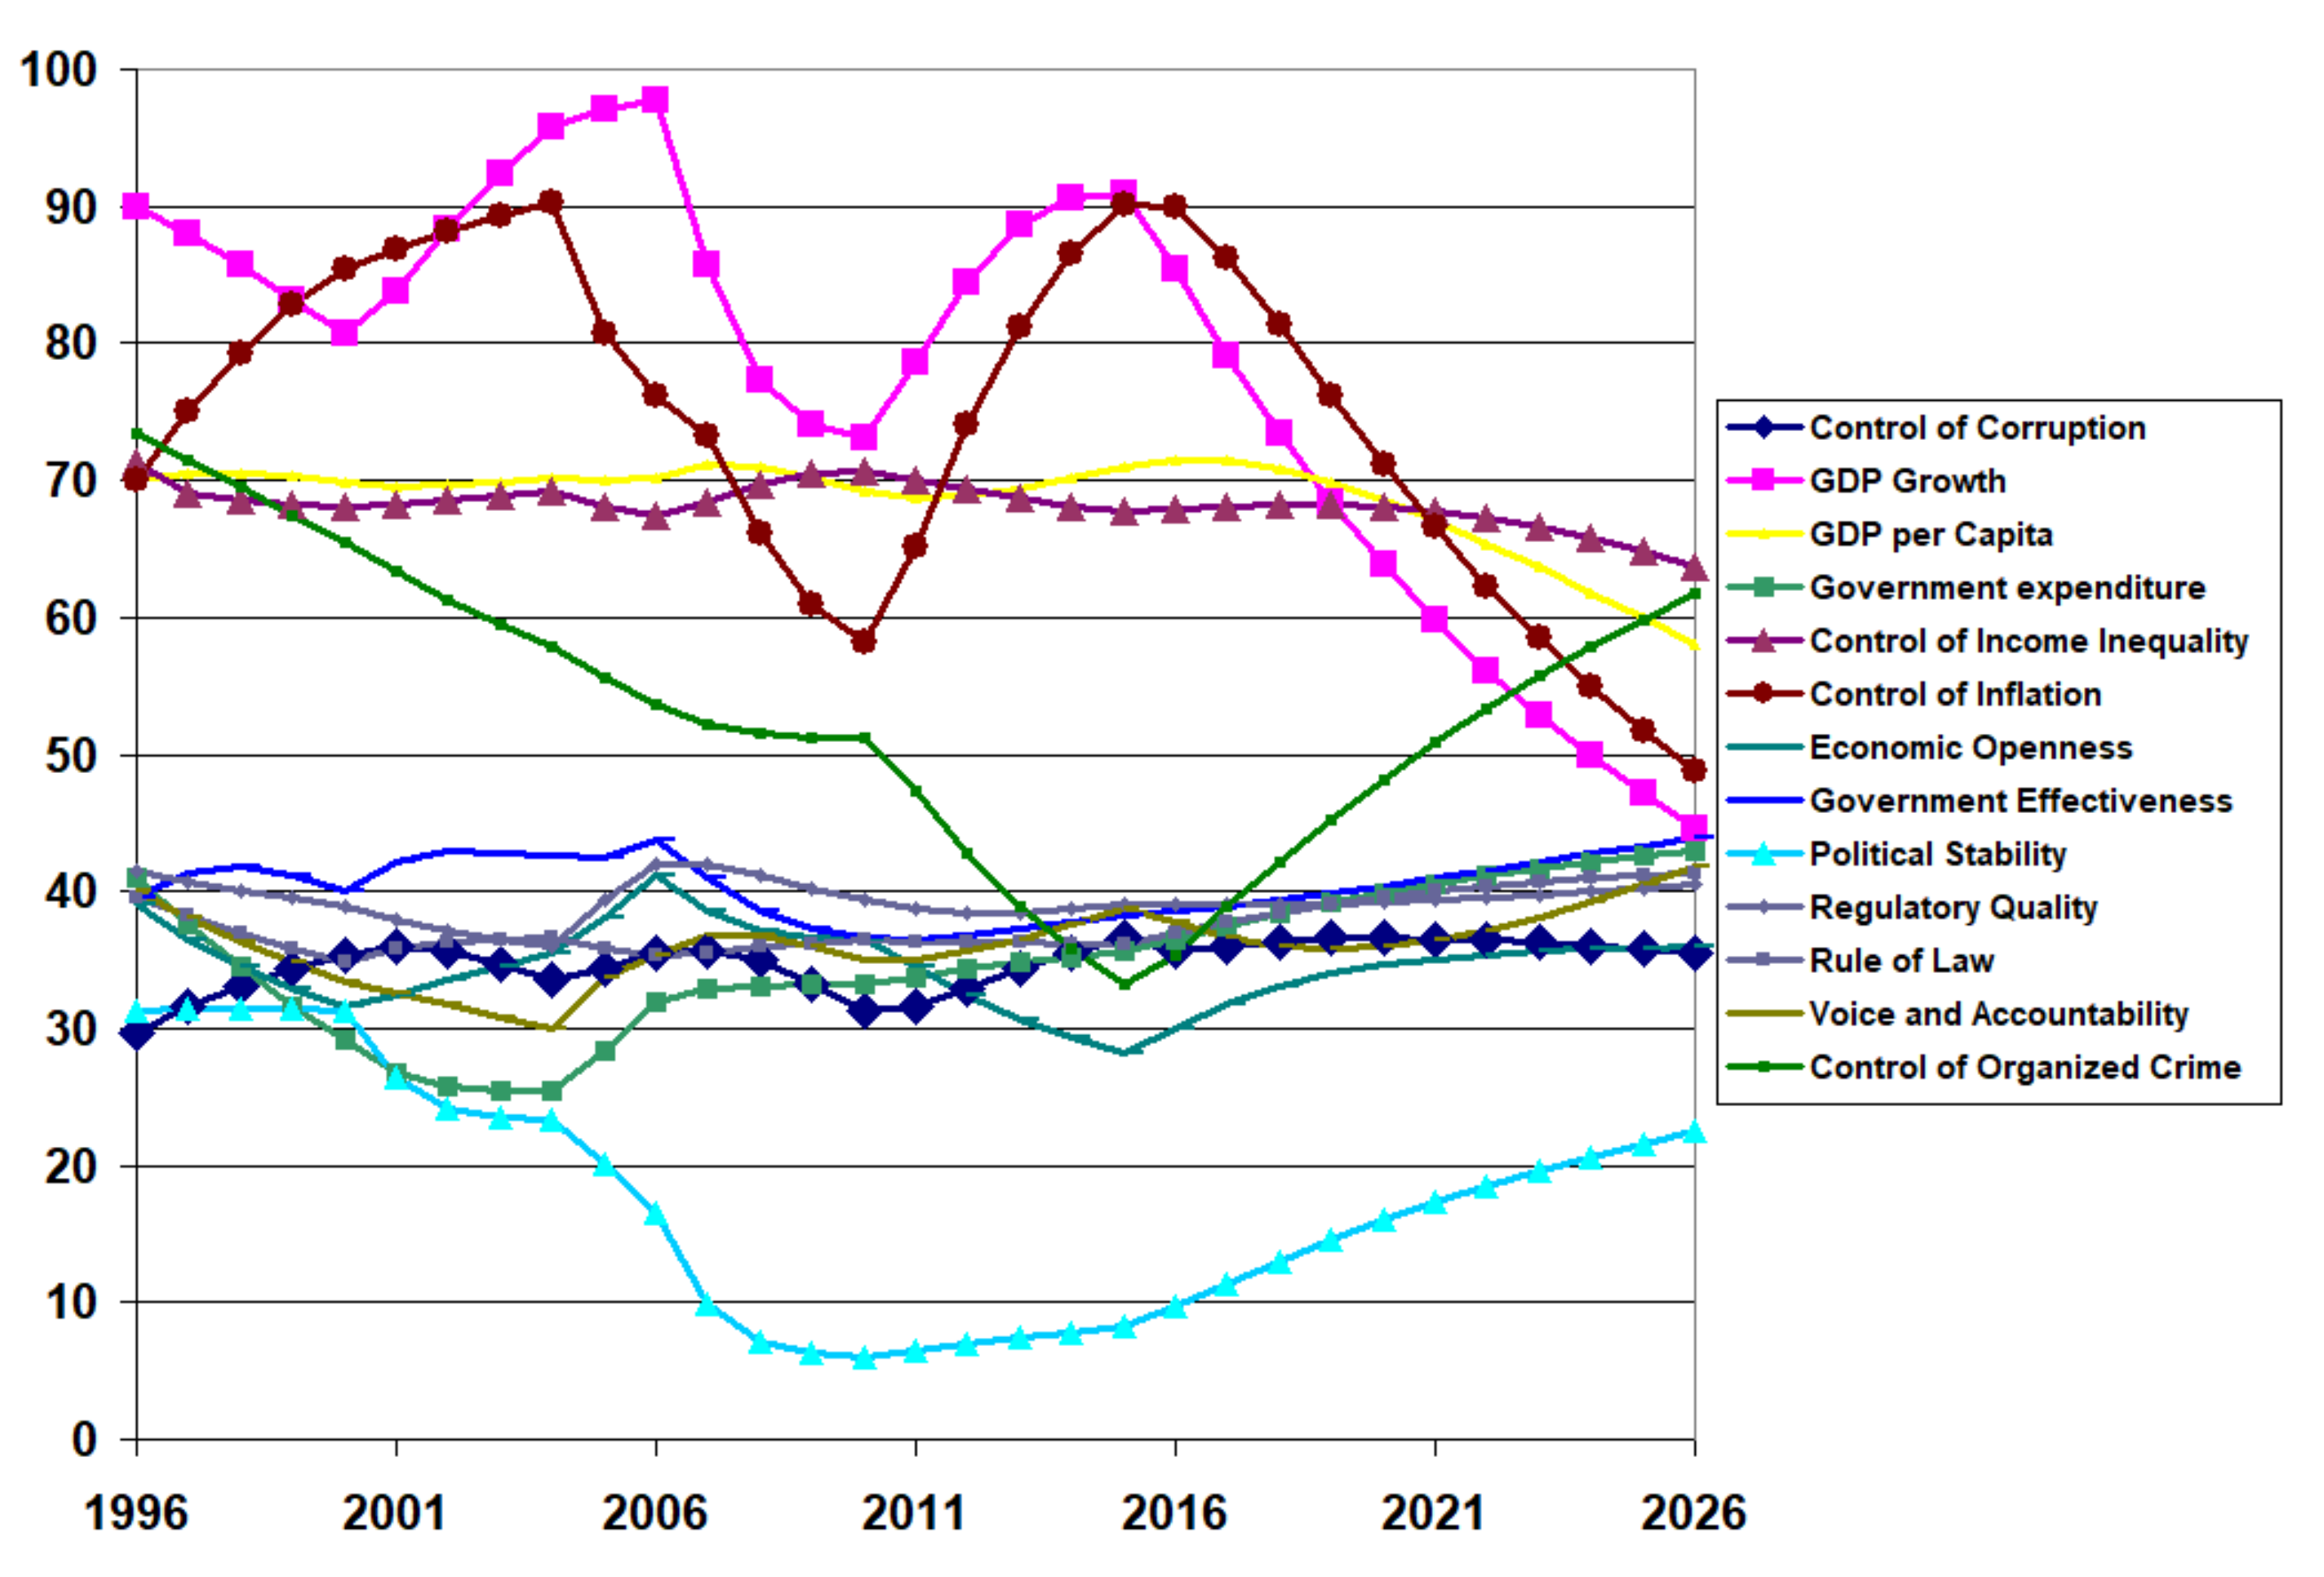
4.2. Projected Institutional Quality
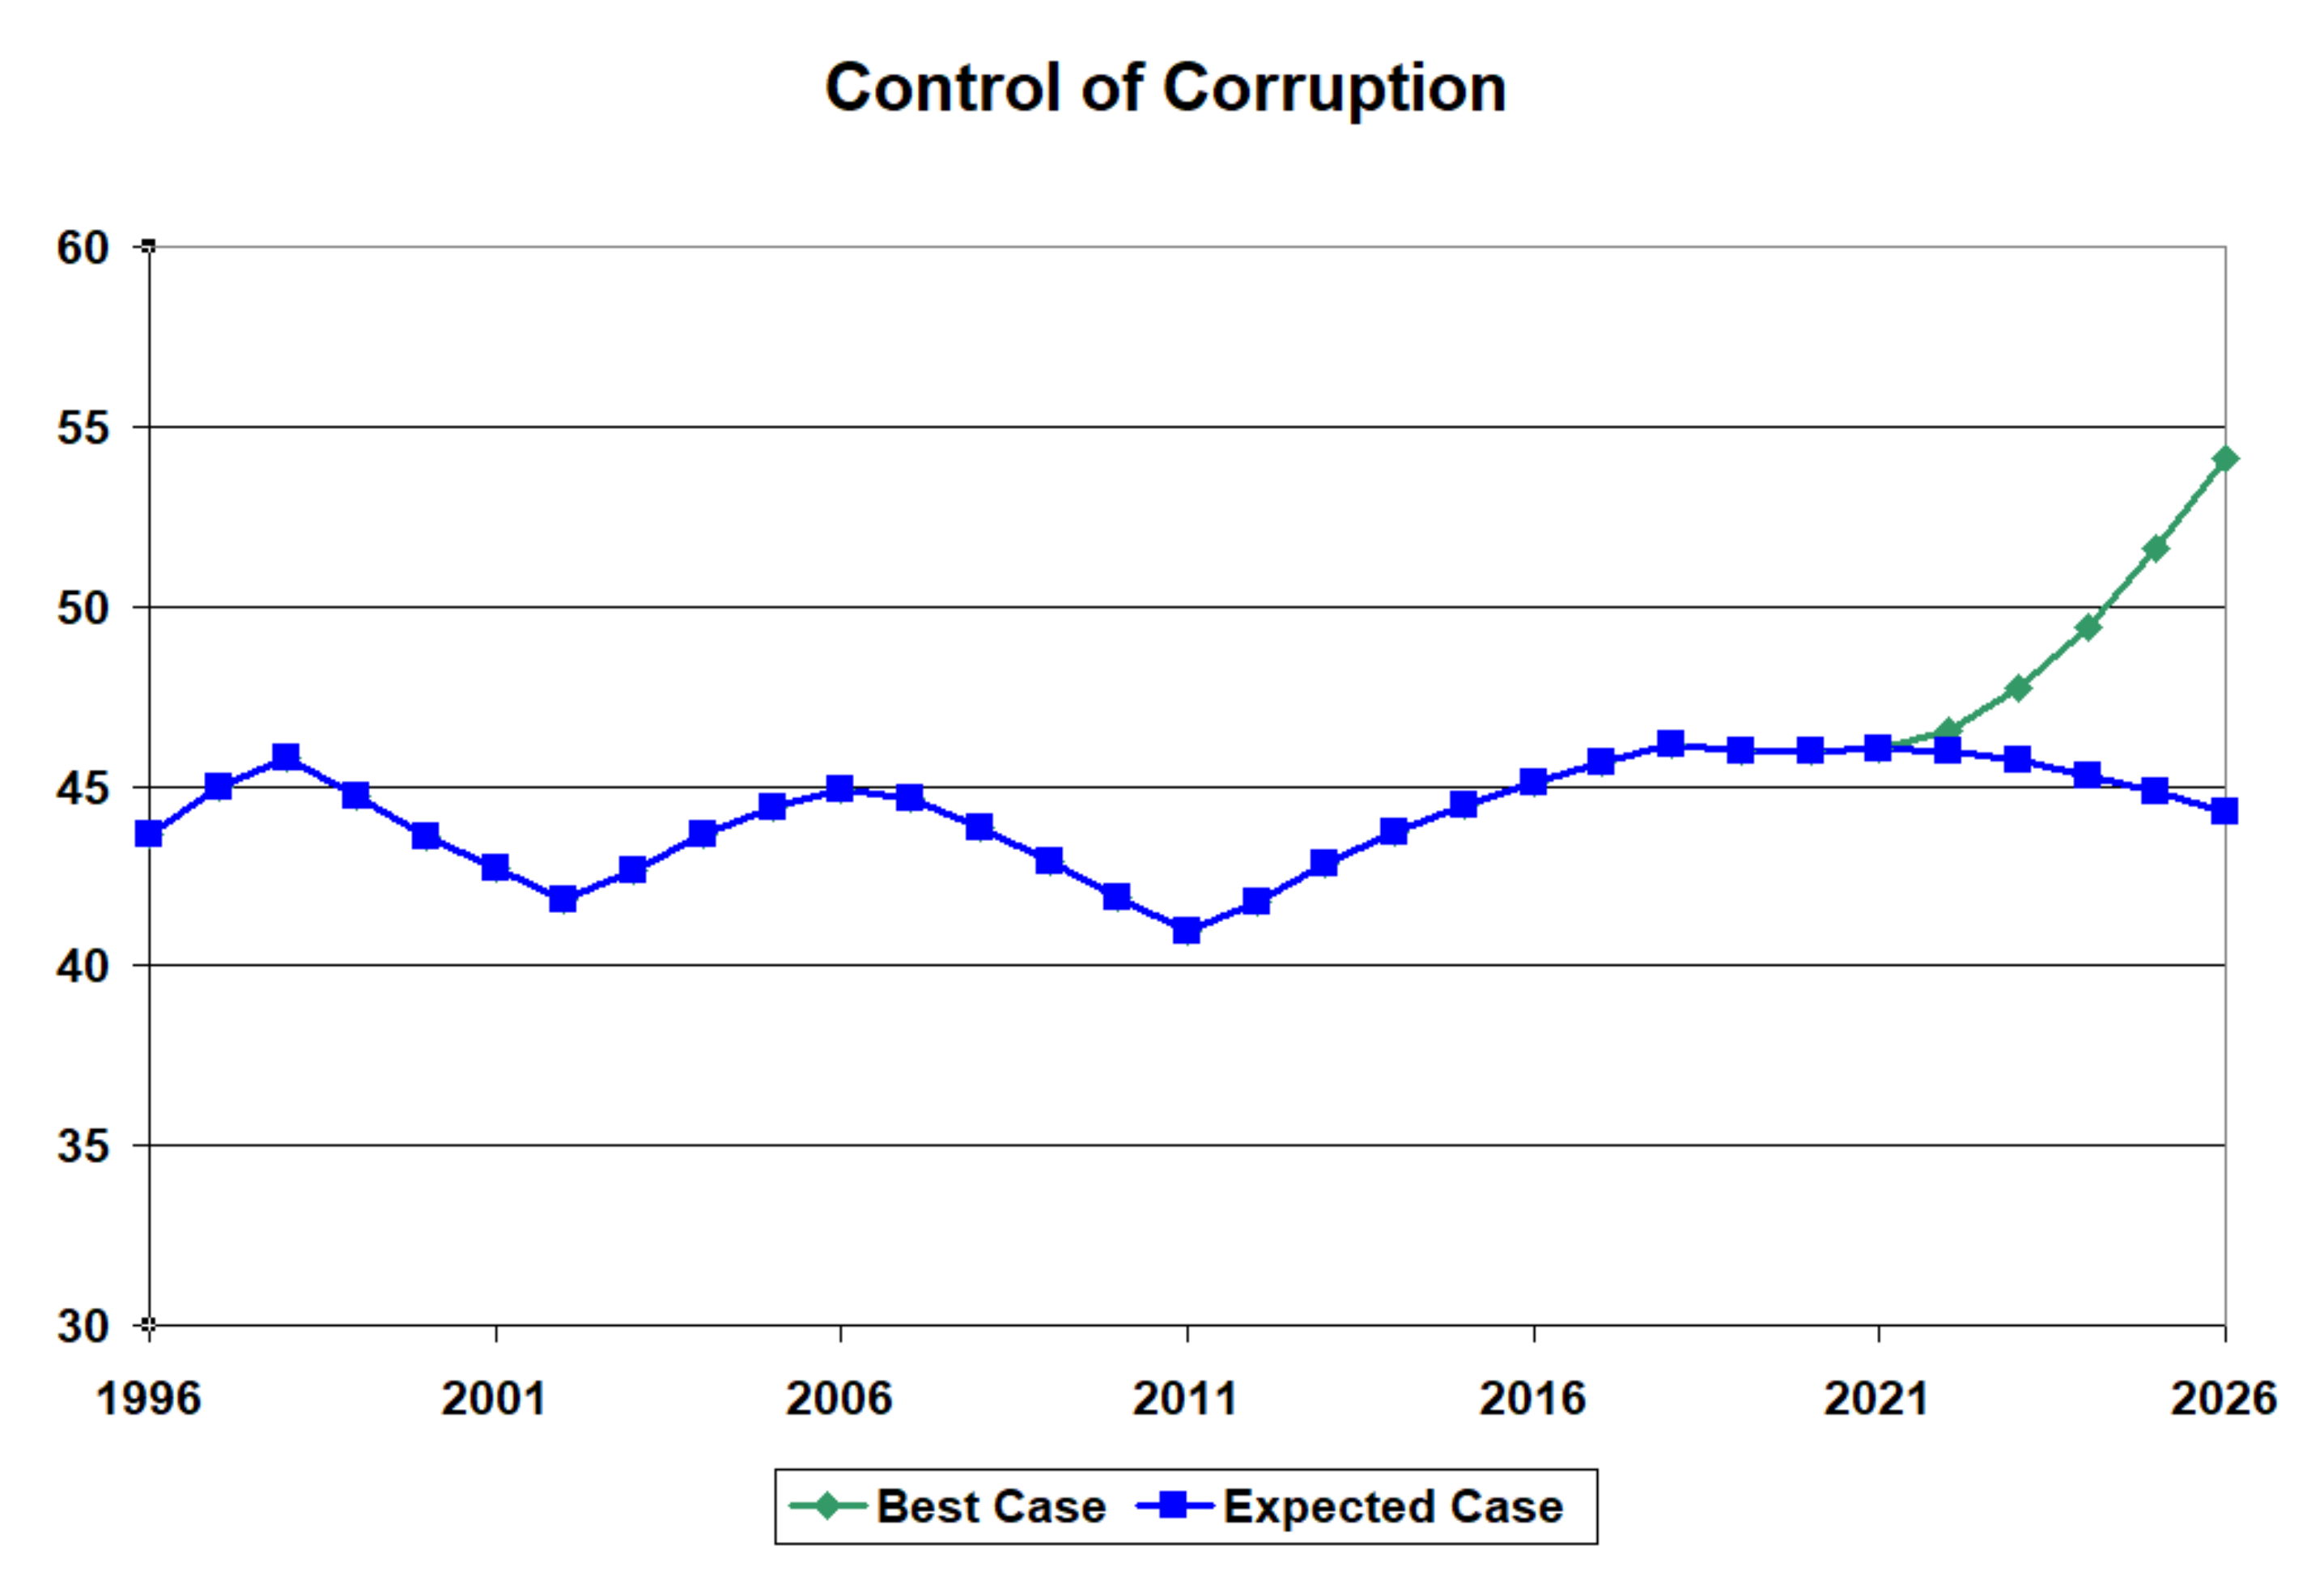
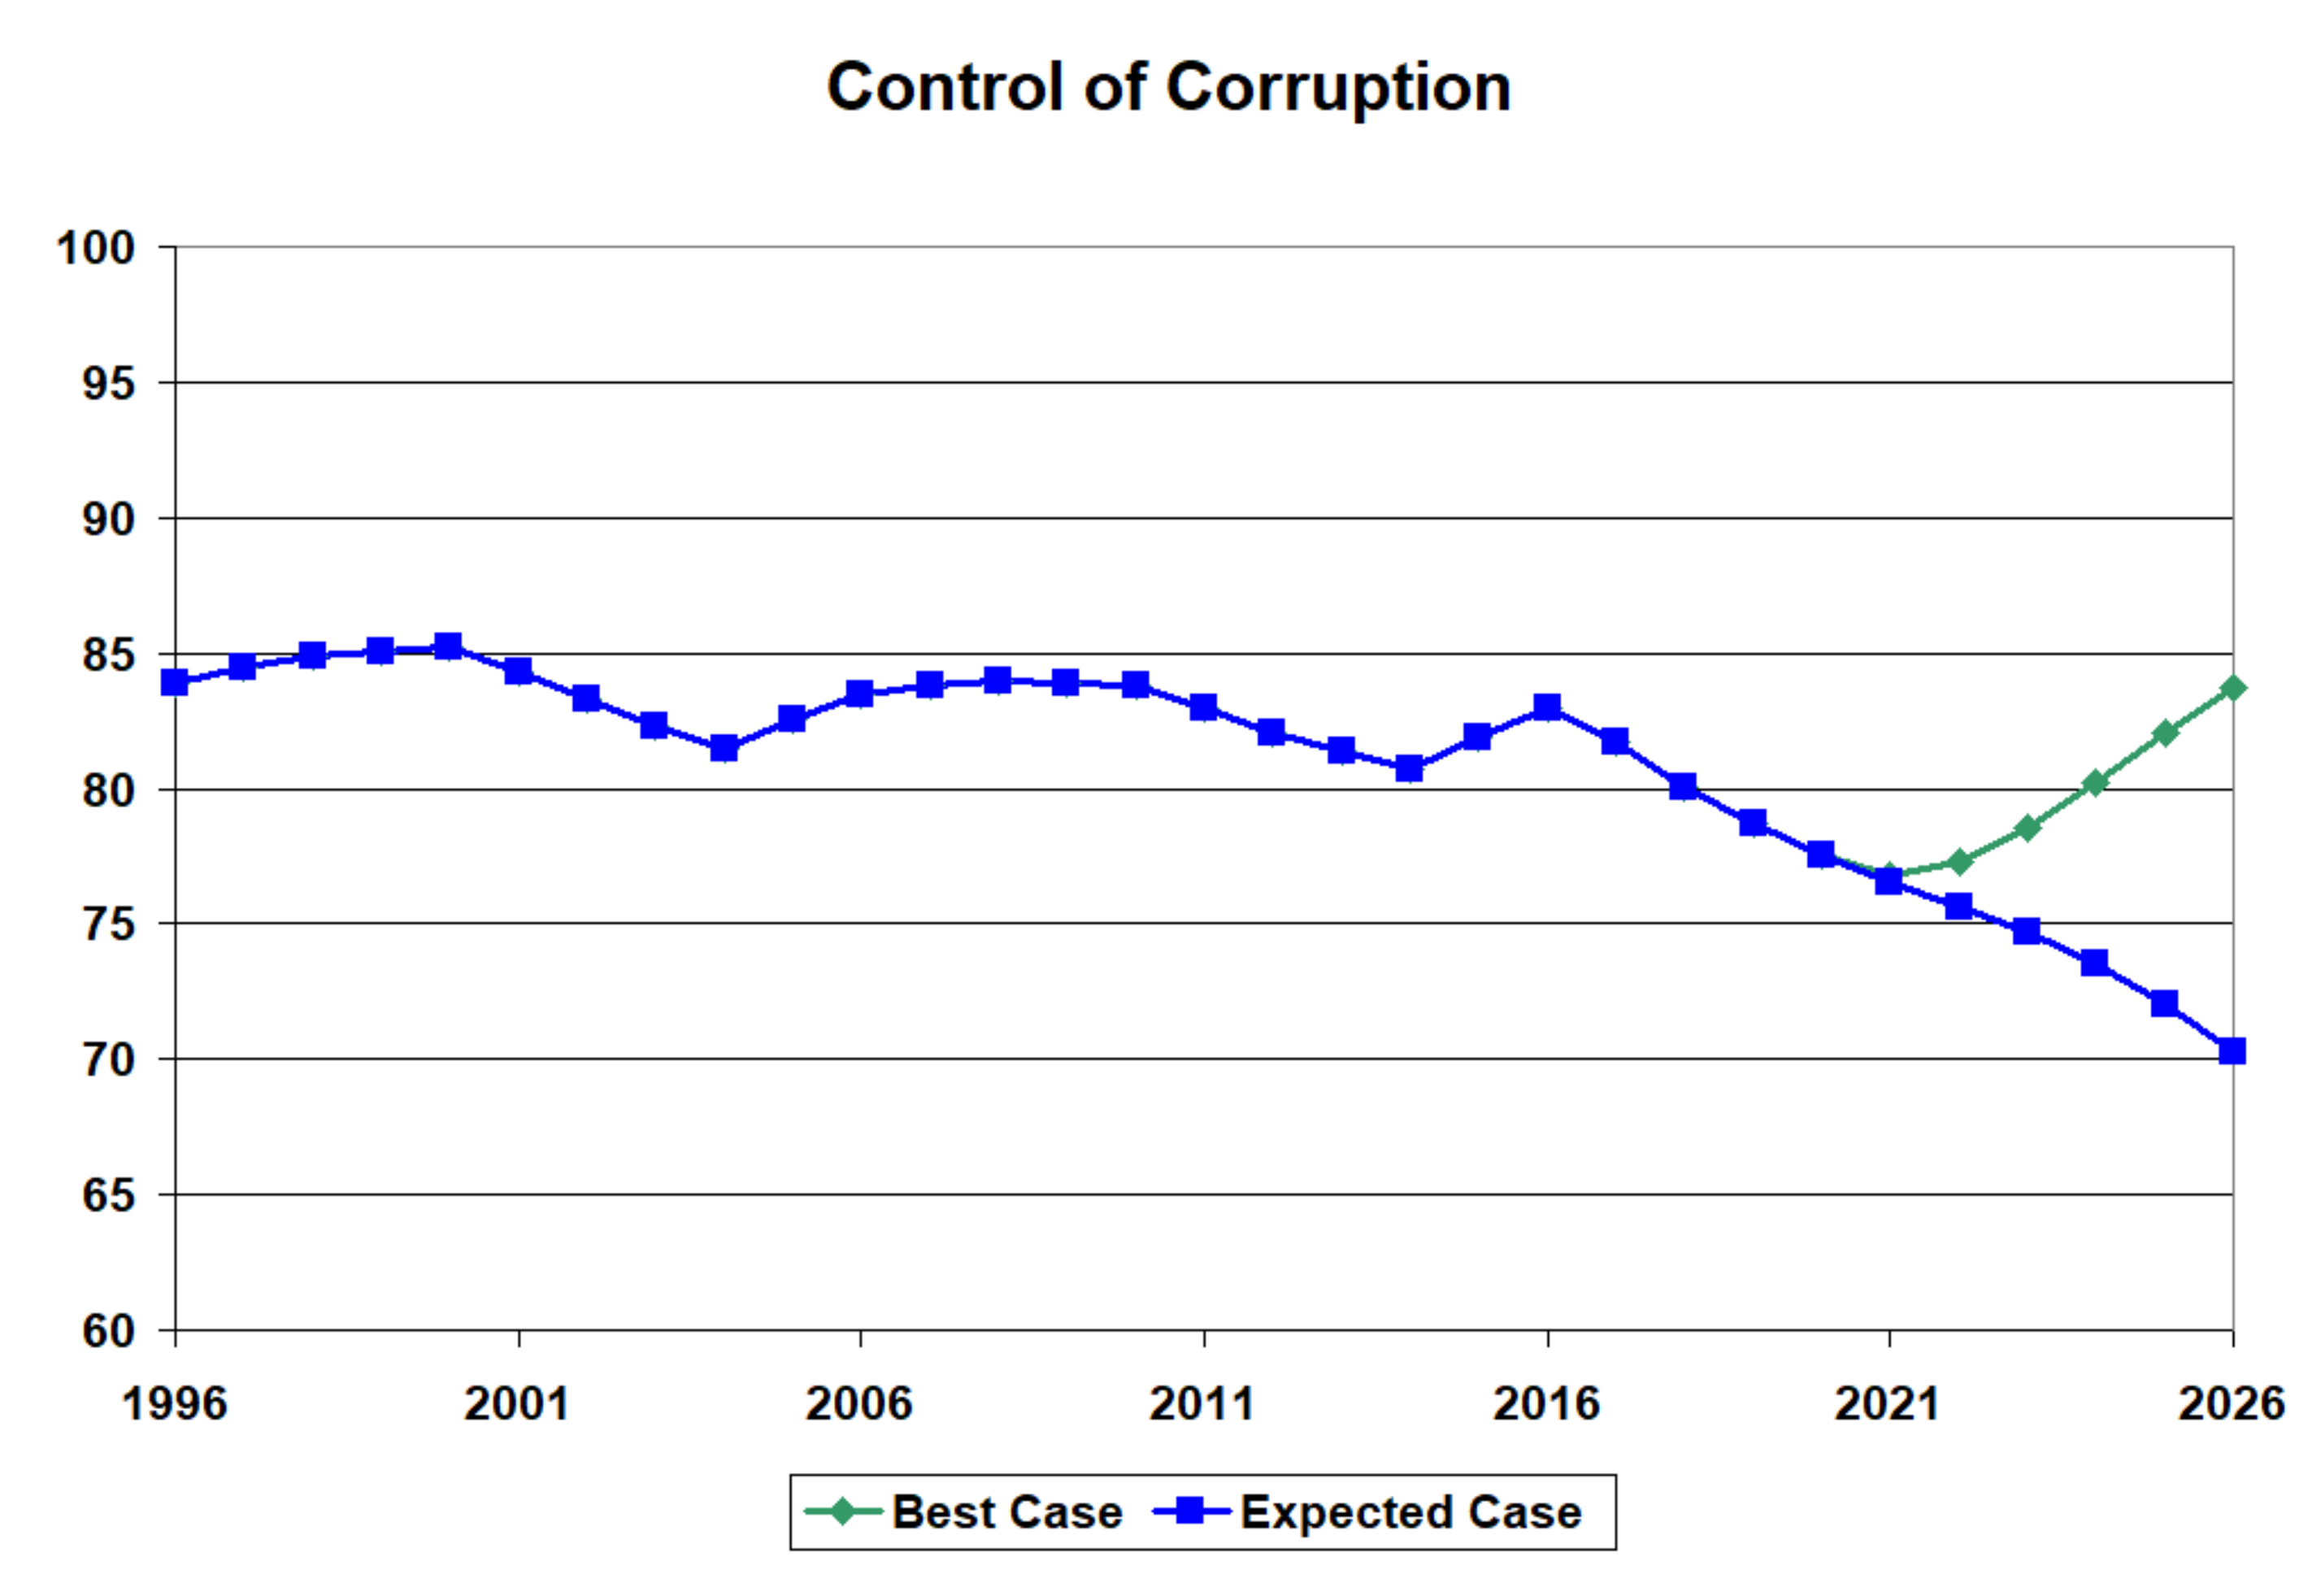
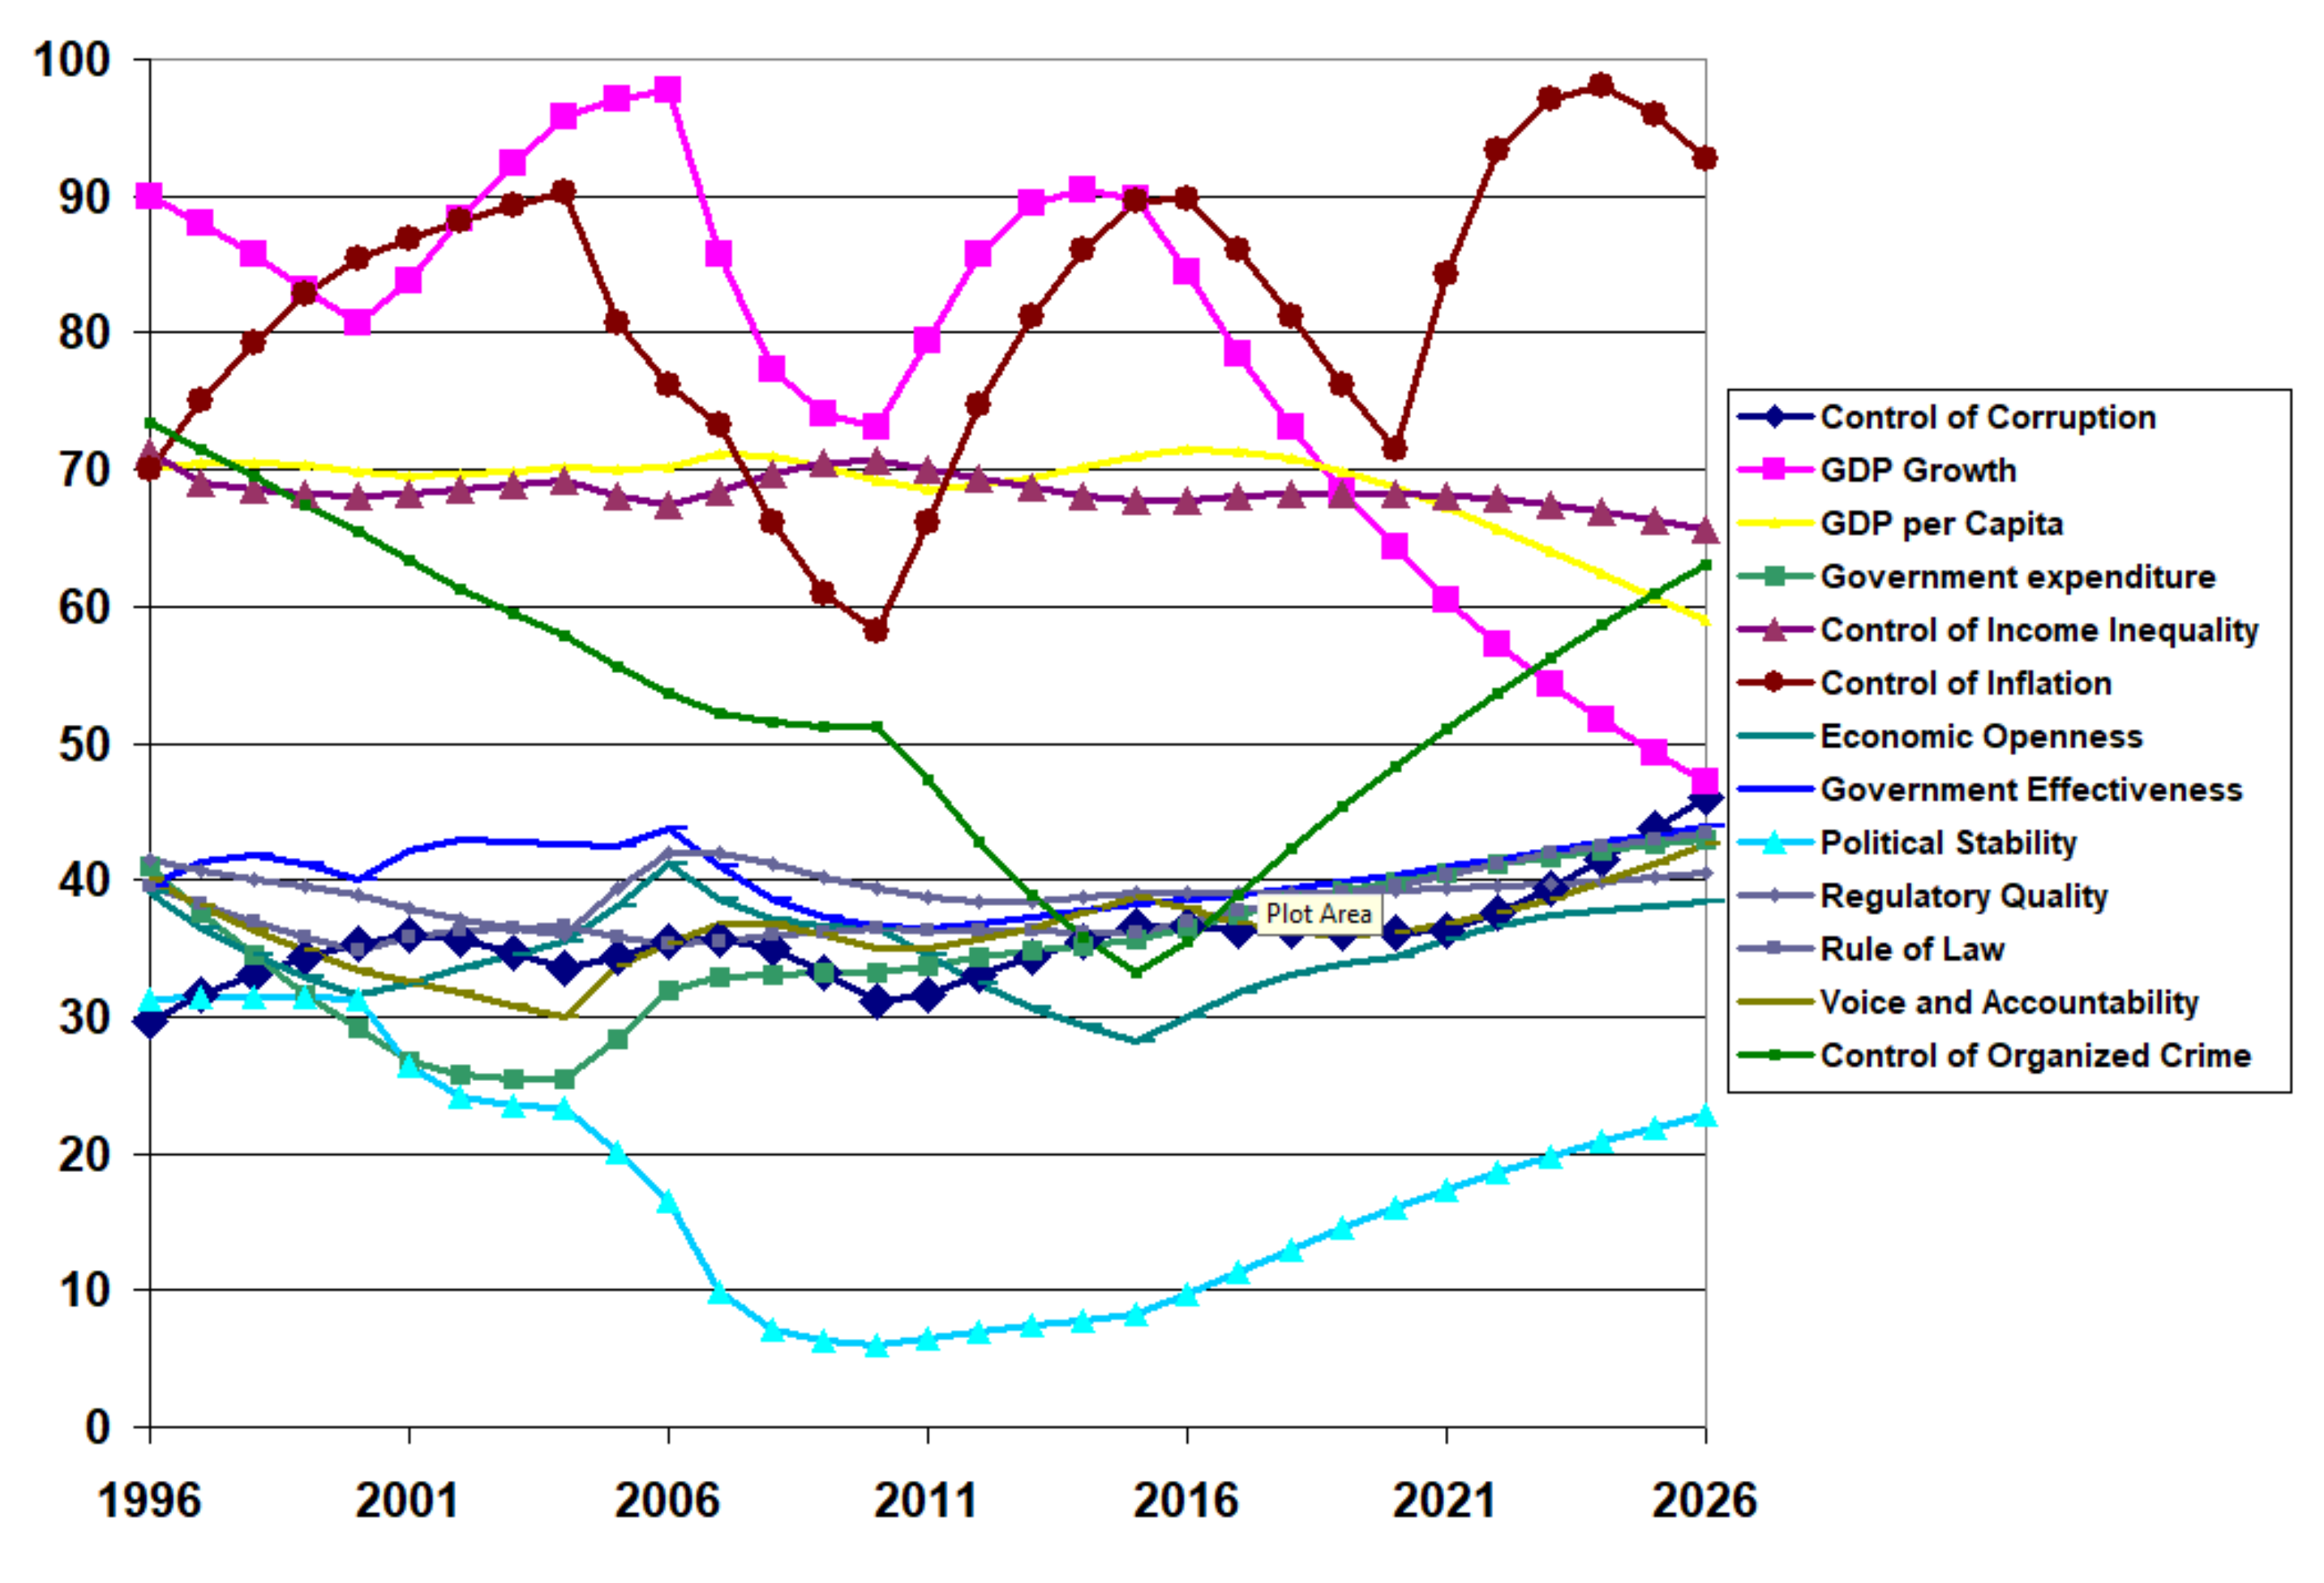
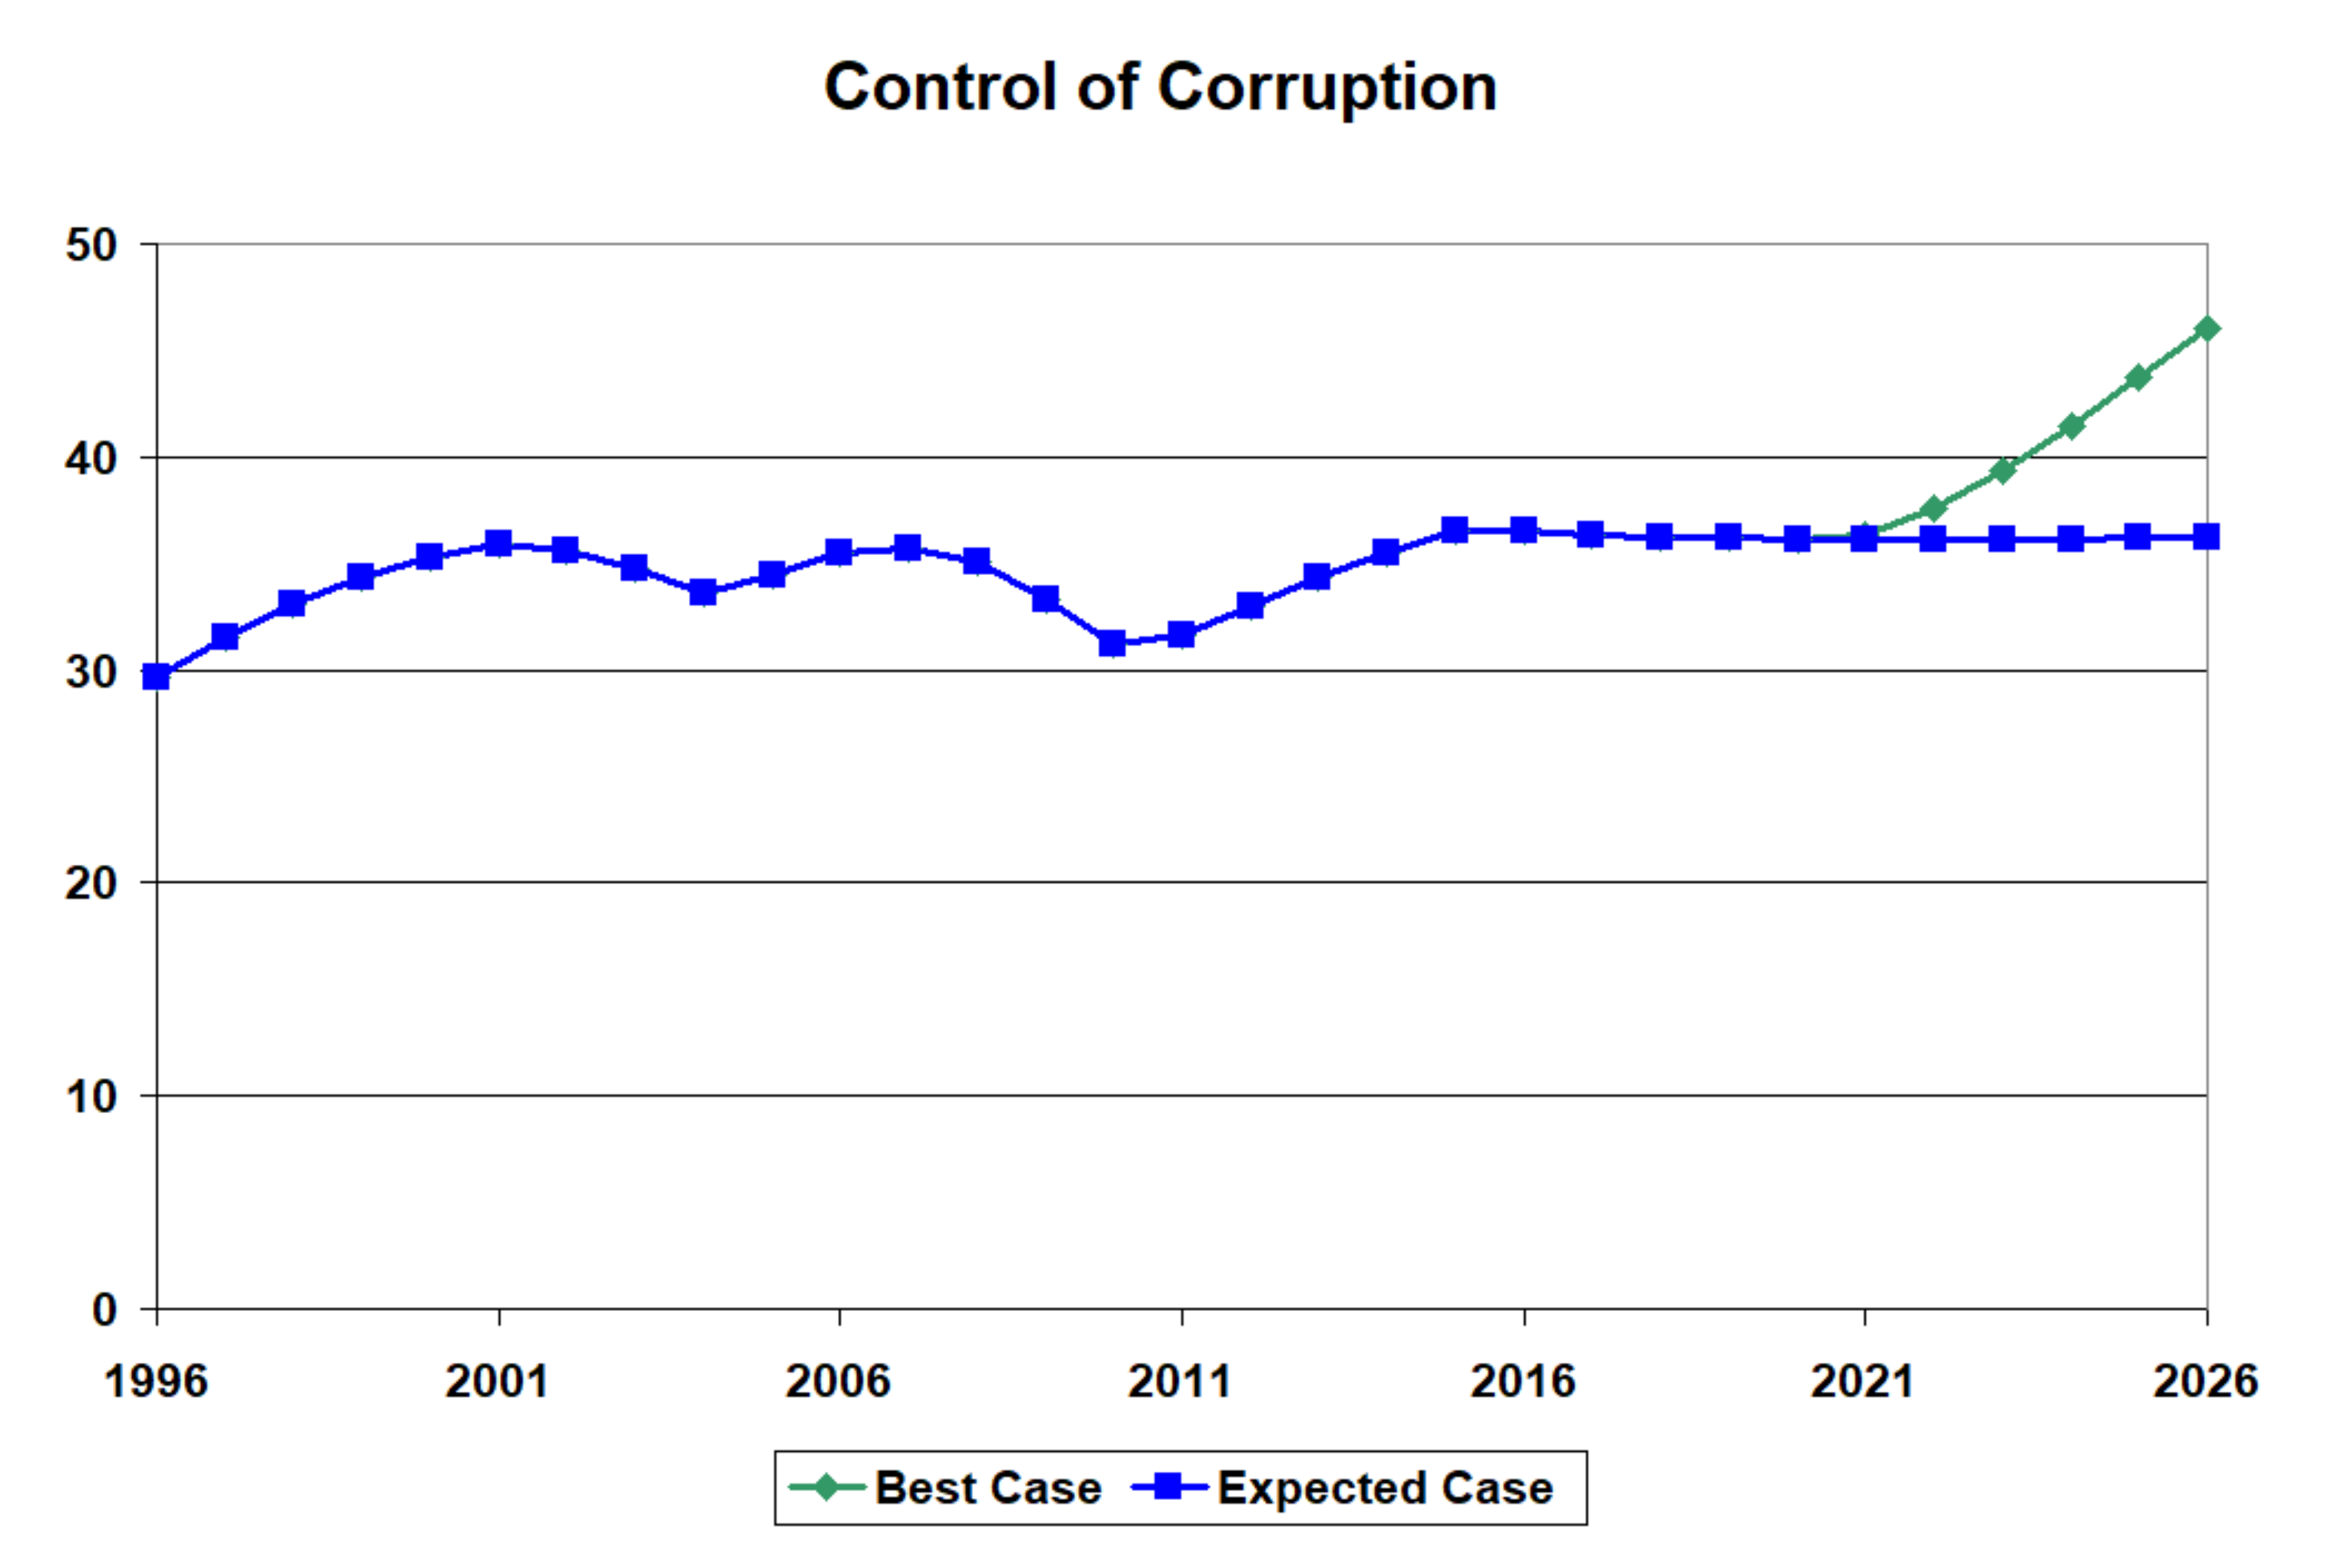
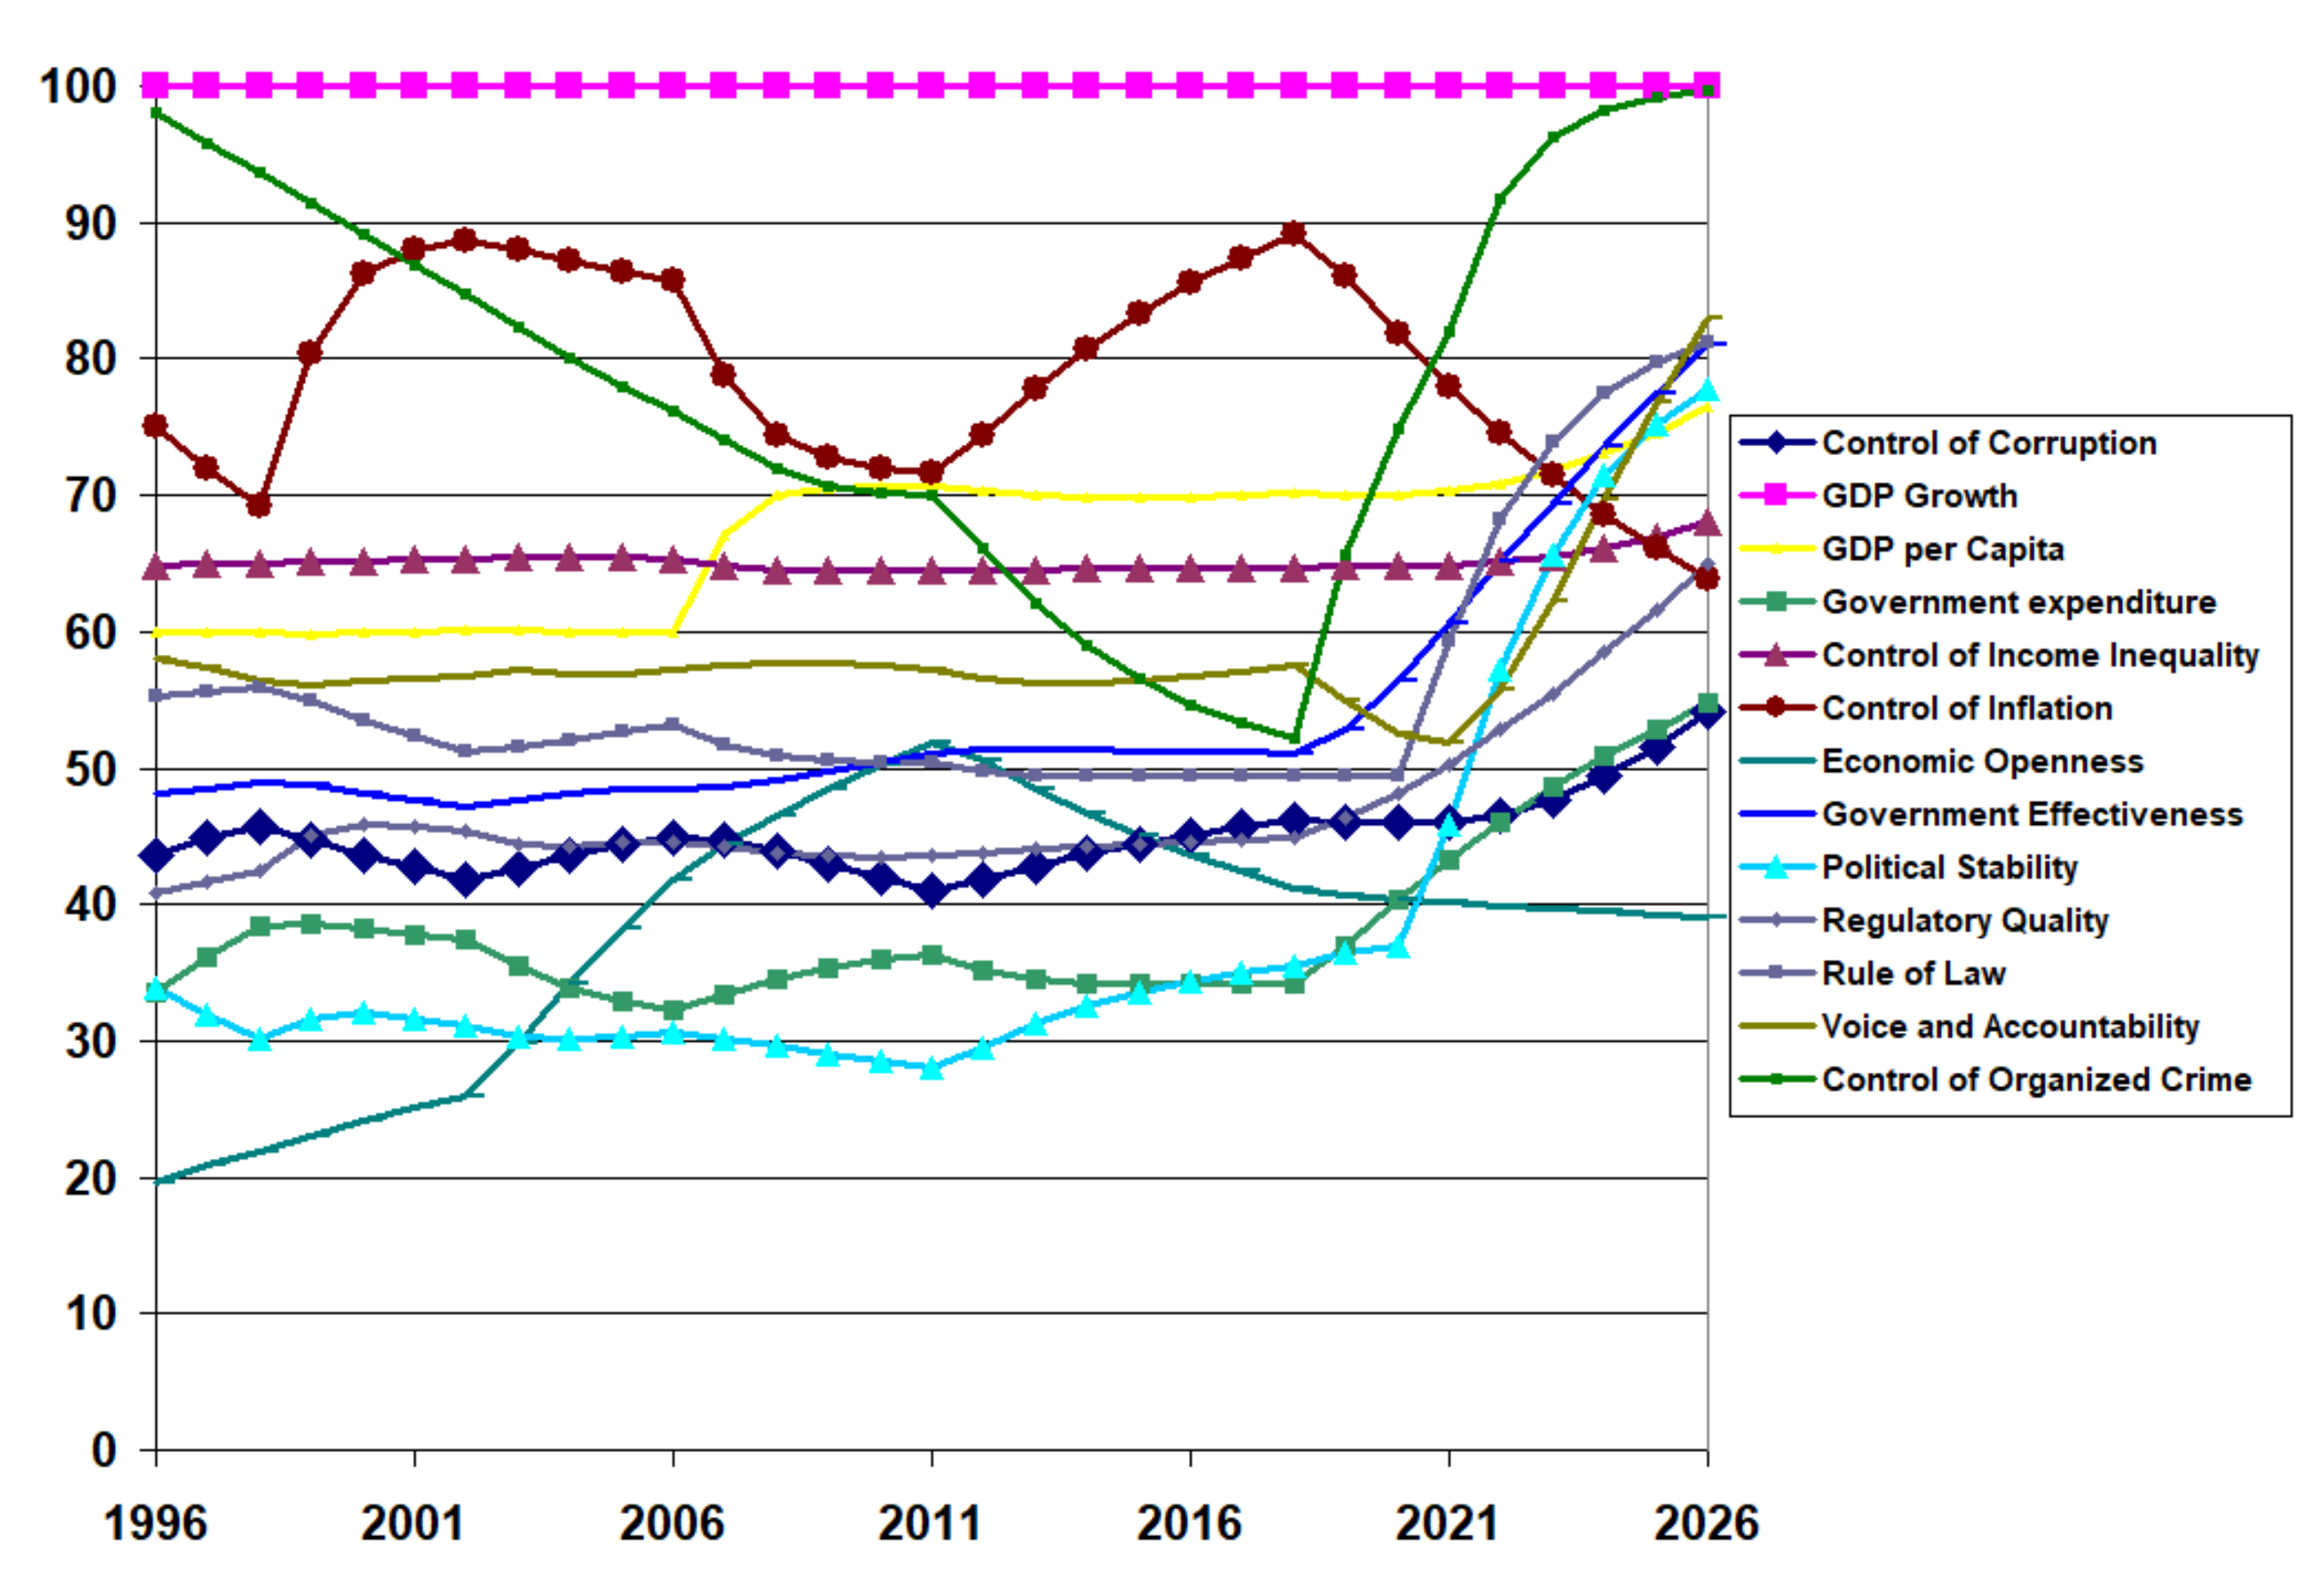
4.3. Projected Results if Effort Expended to Improve Institutional Quality
5. Discussion
6. Conclusions
Author Contributions
Funding
Institutional Review Board Statement
Informed Consent Statement
Data Availability Statement
Conflicts of Interest
References
- Cook, S.A.; Moretti, L.; Rudin, D. Corruption and the Arab Spring. Brown J. World Aff. 2012, 18, 21–28. [Google Scholar]
- Iwuoha, V.C.; Aniche, E.T. Protests and blood on the streets: Repressive state, police brutality and #EndSARS protest in Nigeria. Secur. J. 2021, 34, 1–23. [Google Scholar]
- Blackburn, K.; Neanidis, K.C.; Rana, M.P. A theory of organised crime, corruption and economic growth. Econ. Theory Bull. 2017, 5, 227–245. [Google Scholar] [CrossRef] [Green Version]
- United Nations High Commission for Refugees (UNHCR). Available online: https://www.unhcr.org/en-us/figures-at-a-glance.html (accessed on 2 March 2022).
- Lambsdorff, J.G. Framework Document to the 2004 Corruption Perceptions Index. Transparency International Background Paper. 2004. Available online: https://www.icgg.org/downloads/FD_CPI_2004.pdf/ (accessed on 2 March 2022).
- Kaufmann, D.; Kraay, A.; Zoido-Lobatón, P. Aggregating Governance Indicators. World Bank Policy Research Working Paper No. 2195. 1999. Available online: http://info.worldbank.org/governance/wgi/pdf/govind.pdf (accessed on 2 March 2022).
- World Migration Report. Available online: https://worldmigrationreport.iom.int/wmr-2020-interactive/ (accessed on 2 March 2022).
- Transparency International. Corruption Perception Index (CPI). Available online: https://images.transparencycdn.org/images/CPI2021_Report_EN-web.pdf (accessed on 2 March 2022).
- Barbier, E.B.; Burgess, J.C. Institutional quality, Governance and Progress towards the SDGs. Sustainability 2021, 13, 11798. [Google Scholar] [CrossRef]
- United Nations Sustainable Development (UN SDG). Available online: https://sdgs.un.org/goals (accessed on 2 March 2022).
- Noonan, J.T. Bribes; University of California Press: Berkeley, CA, USA, 1984. [Google Scholar]
- Nye, J.S. Corruption and Political Development: A Cost-Benefit Analysis. Am. Political Sci. Rev. 1967, 61, 417–427. [Google Scholar] [CrossRef]
- Transparency International. Definition of Corruption. Available online: https://www.transparency.org/en/what-is-corruption (accessed on 12 April 2022).
- Fidrmuc, J.; Gërxhani, K. Mind the gap! Social capital, East and West. J. Comp. Econ. 2008, 36, 264–286. [Google Scholar] [CrossRef] [Green Version]
- Forrester, J.W. Industrial Dynamics; The MIT Press: Cambridge, MA, USA, 1961. [Google Scholar]
- Sterman, J.D. Business Dynamics: Systems Thinking and Modeling for a Complex World; Irwin McGraw-Hill: Boston, MA, USA, 2000. [Google Scholar]
- Wolstenholme, E.F. System dynamics in perspective. J. Oper. Res. Soc. 1982, 33, 547–556. [Google Scholar] [CrossRef]
- Dangerfield, B. System Dynamics Models, Optimization of. In Complex Systems in Finance and Econometrics; Meyers, R., Ed.; Springer: New York, NY, USA, 2009. [Google Scholar]
- Kesar, A.; Jena, P.K. Corruption and Economic Growth: Empirical Evidence from BRICS Nations. In India Studies of Business and Economics; Kesar, A., Jena, P.K., Eds.; Springer: Cham, Switzerland, 2022; p. 183. [Google Scholar]
- Rose-Ackerman, S. Corruption: A Study in Political Economy; Academic Press: Cambridge, MA, USA, 2013. [Google Scholar]
- Rose-Ackerman, S. (Ed.) International Handbook on the Economics of Corruption; Edward Elgar Publishing: Northampton, MA, USA, 2007. [Google Scholar]
- Laeven, L.; Woodruff, C. The quality of the legal system, firm ownership, and firm size. Rev. Econ. Stat. 2007, 89, 601–614. [Google Scholar] [CrossRef] [Green Version]
- Kaufmann, D.; Kraay, A.; Zoido-Lobatón, P. Governance Matters. World Bank Policy Research Working Paper No. 2196. 1999. Available online: https://documents1.worldbank.org/curated/en/665731468739470954/pdf/multi-page.pdf (accessed on 2 March 2022).
- Mauro, P. Corruption: Causes, Consequences, and Agenda for Further Research. Financ. Dev. 1998, 35, A004. Available online: https://www.elibrary.imf.org/view/journals/022/0035/001/article-A004-en.xml (accessed on 2 March 2022).
- Khan, M.H. State failure in developing countries and strategies of institutional reform. In Toward Pro-Poor Policies: Aid Institutions and Globalization, Proceedings of Annual World Bank Conference on Development Economics; Tungodden, B., Stern, N., Kolstad, I., Eds.; Oxford University Press and World Bank: Oxford, UK, 2004. [Google Scholar]
- Meagher, P.; Azfar, O.; Rutherford, D. Governance in Bulgaria’s Pharmaceutical System: A Synthesis of Research Findings. A Report to USAID. 1999. Available online: https://pdf.usaid.gov/pdf_docs/PNADF523.pdf (accessed on 2 March 2022).
- Reinikka, R.; Svensson, J. Local capture: Evidence from a central government transfer program in Uganda. Q. J. Econ. 2004, 119, 679–705. [Google Scholar] [CrossRef] [Green Version]
- Kunicová, J.; Rose-Ackerman, S. Electoral rules and constitutional structures as constraints on corruption. Br. J. Political Sci. 2005, 35, 573–606. [Google Scholar] [CrossRef] [Green Version]
- Bardhan, P.; Mookherjee, D. Capture and governance at local and national levels. Am. Econ. Rev. 2000, 90, 135–139. [Google Scholar] [CrossRef] [Green Version]
- Bardhan, P.; Mookherjee, D. Eds. Decentralization and Local Governance in Developing Countries: A Comparative Perspective; MIT Press: Cambridge, MA, USA, 2006. [Google Scholar]
- Uslaner, E. Trust and corruption. In The New Institutional Economics of Corruption: Norms, Trust, and Reciprocity; Lambsdorff, J.G., Schramm, M., Taube, M., Eds.; Routledge: London, UK, 2004; pp. 76–92. [Google Scholar]
- Rousso, A.; Steves, F. The effectiveness of anti-corruption programs: Preliminary evidence from the post-communist transition countries. In International Handbook on the Economics of Corruption; Edward Elgar Publishing: Northampton, MA, USA, 2007; pp. 247–269. [Google Scholar]
- Hunt, J.; Laszlo, S. Is bribery really regressive? Bribery’s costs, benefits, and mechanisms. World Dev. 2012, 40, 355–372. [Google Scholar] [CrossRef]
- Rose-Ackerman, S. The Political Economy of Corruption: Causes and Consequences. World Bank. 1996. Available online: https://openknowledge.worldbank.org/handle/10986/11629 (accessed on 2 March 2022).
- Treisman, D. The causes of corruption: A cross-country study. J. Political Econ. 2000, 76, 399–457. [Google Scholar]
- Myint, U. Corruption: Causes, Consequences and Cures. Asia-Pac. Dev. J. 2000, 7, 33–58. [Google Scholar]
- Denyer, D.; Tranfield, D. Producing a systematic review. In The Sage Handbook of Organisational Research Methods; Buchanan, D.A., Bryman, A., Eds.; Sage Publications: Thousand Oaks, CA, USA, 2009; pp. 671–689. [Google Scholar]
- Thome, A.M.; Scavarda, L.F.; Scavarda, A.J. Conducting systematic literature review in operations management. Prod. Plan. Control 2016, 27, 408–420. [Google Scholar] [CrossRef]
- Xiao, Y.; Watson, M. Guidance on conducting a systematic literature review. J. Plan. Educ. Res. 2019, 39, 93–112. [Google Scholar] [CrossRef]
- Grande, M.V.; Teixeira, A.A. Corruption and MNCs’ entry mode. An empirical econometric study of Portuguese firms investing in PALOPs. Econ. Manag. Res. Proj. Int. J. 2011, 1, 36–52. [Google Scholar]
- Lacombe, D.J.; Coats, R.M.; Shughart, W.F., II; Karahan, G. Corruption and voter turnout: A spatial econometric approach. J. Reg. Anal. Policy 2016, 46, 168–185. [Google Scholar]
- Chakravorty, N.N. How Does Corruption Affect Economic Growth? An Econometric Analysis. J. Leadersh. Account. Ethics 2019, 16, 27–60. [Google Scholar]
- Khodapanah, M.; Dehghan Shabani, Z.; Akbarzadeh, M.H.; Shojaeian, M. Spatial spillover effects of corruption in Asian countries: Spatial econometric approach. Reg. Sci. Policy Pract. 2020, 1–19. [Google Scholar] [CrossRef]
- Ata, A.Y.; Arvas, M.A. Determinants of economic corruption: A cross-country data analysis. Int. J. Bus. Soc. Sci. 2011, 2, 161–169. [Google Scholar]
- Campos, N.F.; Dimova, R.; Saleh, A. Corruption and economic growth: An econometric survey of the evidence. J. Inst. Theor. Econ. Z. Gesamte Staatswiss. 2016, 2, 161–169. [Google Scholar] [CrossRef] [Green Version]
- Márquez, M.A.; Salinas-Jiménez, J.; Salinas-Jiménez, M.D. Exploring differences in corruption: The role of neighboring countries. J. Econ. Policy Reform 2011, 14, 11–19. [Google Scholar] [CrossRef]
- Rotimi, M.E.; IseOlorunkanmi, O.J.; Rotimi, G.G.; Doorasamy, M. Re-examining corruption and economic growth nexus in oil dependent economy: Nigeria’s case. J. Money Laund. Control 2021. [Google Scholar] [CrossRef]
- Moosa, I.A. Effect of corruption on FDI: Evidence from junk-science. Transnatl. Corp. Rev. 2017, 9, 88–96. [Google Scholar] [CrossRef]
- Hao, Y.; Gai, Z.; Wu, H. How do resource misallocation and government corruption affect green total factor energy efficiency? Evidence from China. Energy Policy 2020, 143, 111562. [Google Scholar] [CrossRef]
- Mariyono, J. Corruption and welfare: A simple econometric across countries analysis. Econ. J. Emerg. Mark. 2012, 4, 63–75. [Google Scholar] [CrossRef]
- Absalyamova, S.; Absalyamov, T.; Khusnullova, A.; Mukhametgalieva, C. The impact of corruption on the sustainable development of human capital. J. Phys. Conf. Ser. 2016, 738, 012009. [Google Scholar] [CrossRef] [Green Version]
- Nasreen, S.; Riaz, M.F. Relationship between corruption, income inequality and environmental degradation in Pakistan: An econometric analysis. Bull. Energy Econ. 2016, 4, 12–22. [Google Scholar]
- Oni, O.T.; Awe, O.O. Empirical nexus between corruption and economic growth (GDP): A cross country econometric analysis. Int. J. Sci. Res. 2012, 2, 426–430. [Google Scholar]
- Kolnes, V.L. Foreign Direct Investment and Corruption. An Econometric Analysis of the Multidimensional Effects of Corruption upon FDI Inflow. Master’s Thesis, University of Bergen, Bergen, Norway, 2016. [Google Scholar]
- Evan, T.; Bolotov, I. The weak relation between foreign direct investment and corruption: A theoretical and econometric study. Prague Econ. Pap. 2014, 23, 474–492. [Google Scholar] [CrossRef]
- Majeed, M.T. Corruption and trade. J. Econ. Integr. 2014, 29, 759–782. [Google Scholar] [CrossRef] [Green Version]
- Menegaki, A.N.; Ozturk, I. Growth and energy nexus in Europe revisited: Evidence from a fixed effects political economy model. Energ Policy 2013, 61, 881–887. [Google Scholar] [CrossRef]
- Cosenz, F.; Noto, G. A dynamic simulation approach to frame drivers and implications of corruption practices on firm performance. Eur. Manag. Rev. 2014, 11, 239–257. [Google Scholar] [CrossRef]
- Kim, S.J.; Lee, J. A percolation-like process of within-organisation collective corruption: A computational approach. Bus. Soc. 2021, 60, 161–195. [Google Scholar] [CrossRef]
- Gottschalk, P. Convenience dynamics in white-collar crime: Financial motive, organisational opportunity, and deviant behavior. Deviant Behav. 2021, 42, 532–543. [Google Scholar] [CrossRef]
- Zheng, Y.; Liao, X. The formation mechanism and precision control of corruption in poverty alleviation from the perspective of system dynamics. Math. Probl. Eng. 2018, 1–10. [Google Scholar] [CrossRef]
- Owusu, E.K.; Chan, A.P.; Wang, T. Tackling corruption in urban infrastructure procurement: Dynamic evaluation of the critical constructs and the anti-corruption measures. Cities 2021, 119, 103379. [Google Scholar] [CrossRef]
- Zuo, W.; Wang, Q.; Li, P. Rent-seeking decisions of the main participants in construction projects based on evolutionary-game and system dynamics. J. Civ. Eng. Manag. 2022, 28, 106–119. [Google Scholar] [CrossRef]
- Liu, L.; Chen, X. Evolutionary Dynamics of Cooperation in a Corrupt Society with Anti-Corruption Contro. Int. J. Bifurc. Chaos 2021, 31, 2150039. [Google Scholar] [CrossRef]
- Méndez-Giraldo, G.A.; López-Santana, E.R.; Franco, C. A hybrid system dynamics and fuzzy logic approach to social problem of corruption in Colombia. In Proceedings of the Applied Computer Sciences in Engineering: 4th Workshop on Engineering Applications, WEA 2017, Cartagena, Colombia, 27–29 September 2017; pp. 250–262. [Google Scholar]
- Liu, X.; Arthanari, T.; Shi, Y. Leverage risks for supply chain robustness against corruptione. Ind. Manag. Data Syst. 2021, 121, 1496–1521. [Google Scholar] [CrossRef]
- Hosseinzadeh, M.; Foroushani, M.S.; Tang, O.; Mehregan, M.R. Complexity management of corruption in Iran’s oil industry applying soft system dynamics methodology (SSDM). Kybernetes 2021, 50, 2397–2427. [Google Scholar] [CrossRef]
- Zhu, W.; Zheng, Y.; Ye, K.; Zhang, Q.; Zhang, M. Deterrence of Punitive Measures on Collusive Bidding in the Construction Sector. Complexity 2021, 1–12. [Google Scholar] [CrossRef]
- Gisladottir, J.; Sigurgeirsdottir, S.; Ragnarsdóttir, K.V.; Stjernquist, I. Economies of scale and perceived corruption in natural resource management: A comparative study between Ukraine, Romania, and Iceland. Sustainability 2021, 13, 7363. [Google Scholar] [CrossRef]
- Raouf, A.; Al-Ghamdi, S.G. Impact of Project Delivery Systems on Cost Overruns of Green Building Projects: System Dynamics Approach. In Proceedings of the International Conference on Sustainable Infrastructure 2019: Leading Resilient Communities through the 21st Century, Los Angeles, CA, USA, 6–9 November 2019. [Google Scholar]
- Alisic, R.; Molinari, M.; Paré, P.E.; Sandberg, H. Ensuring Privacy of Occupancy Changes in Smart Buildings. In Proceedings of the IEEE Conference on Control Technology and Applications (CCTA), Montreal, QC, Canada, 24–26 August 2020. [Google Scholar]
- Somogyvári, M. The costs of organisational injustice in the Hungarian health care systeme. J. Bus. Ethics 2013, 118, 543–560. [Google Scholar] [CrossRef]
- Martinez-Moyano, I.J.; McCaffrey, D.P.; Oliva, R. Drift and adjustment in organisational rule compliance: Explaining the “regulatory pendulum” in financial markets. Organ. Sci. 2014, 25, 321–338. [Google Scholar] [CrossRef]
- Omamo, A.; Rodrigues, A.J.; Muliaro, W. Kenya’s vision 2030: Modelling technology usage and the econom. Technol. Soc. 2019, 59, 101135. [Google Scholar] [CrossRef]
- Perko, I. Hybrid Reality development-can social responsibility concepts provide guidance? Kybernetes 2021, 50, 676–693. [Google Scholar] [CrossRef]
- Ullah, M.A.; Urquhart, C.; Arthanari, T.; Ahmed, E. Dimensions of corruption in Pakistan: A systems thinking approach and qualitative analysis. Syst. Res. Behav. Sci. 2021, 39, 324–338. [Google Scholar] [CrossRef]
- Ahmad, E.; Ullah, M.A.; Arfeen, M.I. Does Corruption Affect Economic Growth? Lat. Am. J. Econ. 2012, 49, 277–305. [Google Scholar] [CrossRef] [Green Version]
- Ullah, M.A.; Ahmad, E. Bureaucracy and Corruption: A Panel Data Analysis. SAARC J. Hum. Resour. Dev. 2014, 10. [Google Scholar]
- Ullah, M.A.; Ahmad, E. Inequality and Corruption: Evidence from Panel data. Forman J. Econ. Stud. 2016, 12, 1–19. [Google Scholar] [CrossRef]
- Meadows, D.H. Thinking in Systems: A Primer; Chelsea Green Publishing: Chelsea, VT, USA, 2008. [Google Scholar]
- World Governance Indicators (WGI). Available online: http://info.worldbank.org/governance/wgi/ (accessed on 2 March 2022).
- World Development Indicators (WDI). Available online: https://databank.worldbank.org/source/world-development-indicators (accessed on 2 March 2022).
- World Economic Forum (WEF). Available online: https://www.weforum.org/reports/ (accessed on 2 March 2022).
- International-Country-Risk-Guide (ICRG). Available online: https://www.prsgroup.com/explore-our-products/international-country-risk-guide/ (accessed on 2 March 2022).
- Ventana Systems Inc. Available online: https://vensim.com/ (accessed on 3 April 2022).
- Barlas, Y. Formal aspects of model validity and validation in system dynamics. Syst. Dyn. Rev. 1996, 12, 183–210. [Google Scholar] [CrossRef]
- Forrester, J.W.; Senge, P.M. Tests for building confidence in system dynamics models. TIMS Stud. Manag. Sci. 1980, 14, 209–228. [Google Scholar]
- Iserles, A. A First Course in the Numerical Analysis of Differential Equations, 2nd ed.; Cambridge University Press: Cambridge, MA, USA, 2009. [Google Scholar]
- Microsoft Corporation. Available online: https://www.microsoft.com/en-us/microsoft-365/excel (accessed on 3 April 2022).
- Teknomo, K. System Dynamics Tutorials. 2019. Available online: https://people.revoledu.com/kardi/tutorial/SystemDynamic/ (accessed on 3 April 2022).
- Albright, S.C. VBA for Modelers: Developing Decision Support Systems, 4th ed.; Cengage Learning: Independence, KY, USA, 2011. [Google Scholar]
- Frontline Solvers. Examples of Optimization Problems. Available online: https://www.solver.com/examples-optimization-problems (accessed on 3 April 2022).


| Source | Variables | Related Institutions |
|---|---|---|
| [40,41,42,43] | Independent Variables:
| Control of Corruption (1) Voice and Accountability (2) Government Effectiveness (3) |
| [42] [44,45] | Independent Variables:
| Control of Corruption (1) GDP Growth (4) Control of Income Inequality (5) Control of Inflation (6) |
| [41,42] [46,47,48,49] | Independent Variables:
| Control of Corruption (1) Voice and Accountability (2) GDP per Capita (7) Political Stability and Absence of Violence (8) Organised Crime (9) |
| [42] [50,51,52] | Independent Variables:
| Control of Corruption (1) Control of Income Inequality (5) Regulatory Quality (10) Economic Openness (11) |
| [42] [53,54,55] | Independent Variables:
| Control of Corruption (1) Control of Inflation (6) GDP per Capita (7) |
| [56,57] | Independent Variables:
| Control of Corruption (1) GDP per Capita (7) Political Stability and Absence of Violence (8) Economic Openness (11) The Rule of Law (12) Corruption Government Expenditure (13) |
| Institution | 1996 Value | 2020 Value | Projected 2026 Value |
|---|---|---|---|
| Control of Corruption | 30 | 36 | 36 |
| GDP Growth | 90 | 64 | 46 |
| GDP per capita | 70 | 69 | 59 |
| Government Expenditure | 41 | 40 | 43 |
| Control of Income Inequality | 71 | 68 | 66 |
| Control of Inflation | 70 | 71 | 51 |
| Economic Openness | 39 | 34 | 35 |
| Government Effectiveness | 40 | 40 | 44 |
| Political Stability and Absence of Violence | 31 | 16 | 23 |
| Regulatory Quality | 41 | 39 | 41 |
| The Rule of Law | 40 | 40 | 41 |
| Voice and Accountability | 40 | 36 | 42 |
| Control of Organised Crime | 73 | 48 | 62 |
| Average Institutional Quality | 52 | 46 | 45 |
| Institution | 1996 Value | 2020 Value | Projected 2026 Value |
|---|---|---|---|
| Control of Corruption | 44 | 46 | 44 |
| GDP Growth | 100 | 100 | 100 |
| GDP per capita | 60 | 70 | 76 |
| Government Expenditure | 34 | 40 | 55 |
| Control of Income Inequality | 65 | 65 | 68 |
| Control of Inflation | 75 | 82 | 64 |
| Economic Openness | 20 | 40 | 39 |
| Government Effectiveness | 48 | 56 | 81 |
| Political Stability and Absence of Violence | 34 | 37 | 37 |
| Regulatory Quality | 41 | 48 | 65 |
| The Rule of Law | 55 | 49 | 49 |
| Voice and Accountability | 58 | 52 | 48 |
| Control of Organised Crime | 98 | 75 | 83 |
| Average Institutional Quality | 56 | 59 | 62 |
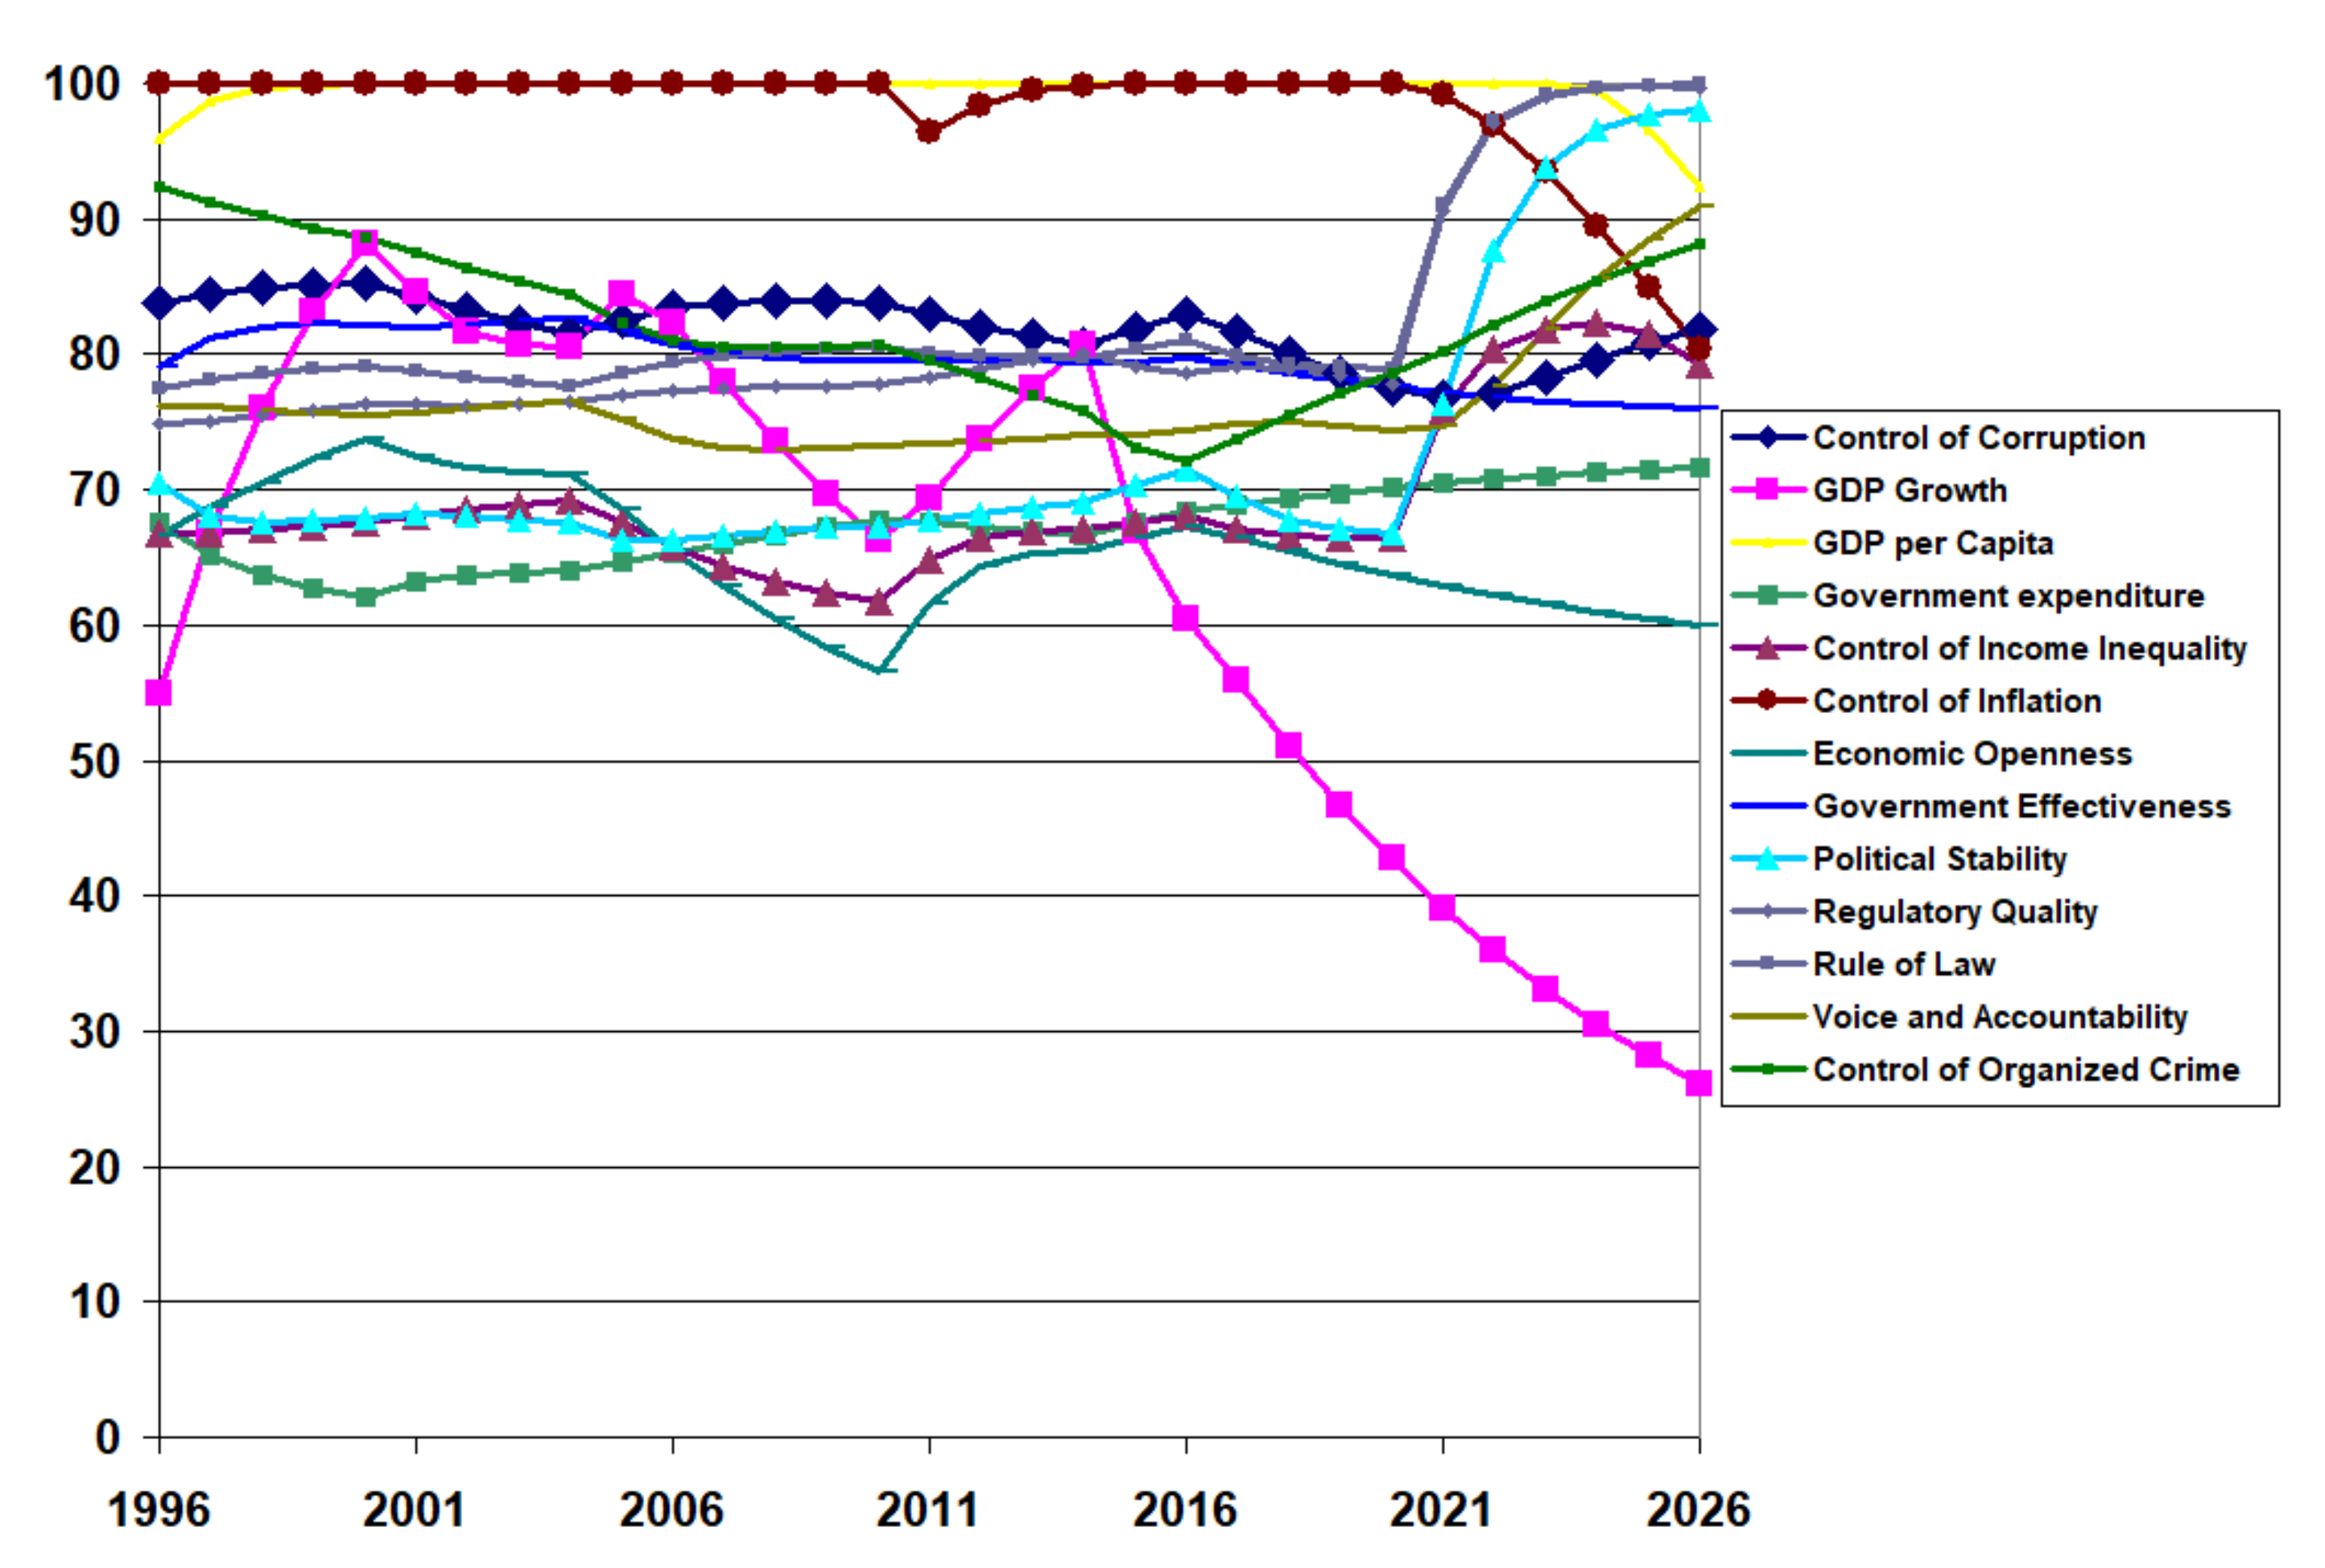
| Institution | 1996 Value | 2020 Value | Projected 2026 Value |
|---|---|---|---|
| Control of Corruption | 84 | 77 | 70 |
| GDP Growth | 55 | 43 | 25 |
| GDP per capita | 96 | 100 | 73 |
| Government Expenditure | 68 | 70 | 72 |
| Control of Income Inequality | 67 | 66 | 52 |
| Control of Inflation | 100 | 100 | 89 |
| Economic Openness | 67 | 64 | 60 |
| Government Effectiveness | 79 | 78 | 76 |
| Political Stability and Absence of Violence | 71 | 67 | 67 |
| Regulatory Quality | 75 | 78 | 76 |
| The Rule of Law | 77 | 79 | 79 |
| Voice and Accountability | 76 | 74 | 73 |
| Control of Organised Crime | 92 | 79 | 85 |
| Average Institutional Quality | 77 | 75 | 69 |
| Institution | Status Quo 2026 | Effort | Improved 2026 |
|---|---|---|---|
| Control of Corruption | 36 | 1 | 46 |
| GDP Growth | 46 | 1 | 47 |
| GDP per capita | 59 | 1 | 59 |
| Government Expenditure | 43 | 1 | 43 |
| Control of Income Inequality | 66 | 1 | 66 |
| Control of Inflation | 51 | 1.83 | 93 |
| Economic Openness | 35 | 1.09 | 38 |
| Government Effectiveness | 44 | 1 | 44 |
| Political Stability and Absence of Violence | 23 | 1 | 23 |
| Regulatory Quality | 41 | 1 | 41 |
| The Rule of Law | 41 | 1.08 | 43 |
| Voice and Accountability | 42 | 1 | 43 |
| Control of Organised Crime | 62 | 1 | 63 |
| Average Institutional Quality | 45 | 50 |
| Institution | Status Quo 2026 | Effort | Improved 2026 |
|---|---|---|---|
| Control of Corruption | 44 | 1 | 54 |
| GDP Growth | 100 | 1 | 100 |
| GDP per capita | 76 | 1 | 76 |
| Government Expenditure | 55 | 1 | 55 |
| Control of Income Inequality | 68 | 1 | 68 |
| Control of Inflation | 64 | 1 | 64 |
| Economic Openness | 39 | 1 | 39 |
| Government Effectiveness | 81 | 1 | 81 |
| Political Stability and Absence of Violence | 37 | 1.30 | 78 |
| Regulatory Quality | 65 | 1 | 65 |
| The Rule of Law | 49 | 1.70 | 81 |
| Voice and Accountability | 48 | 1 | 83 |
| Control of Organised Crime | 83 | 1 | 100 |
| Average Institutional Quality | 62 | 73 |
| Institution | Status Quo 2026 | Effort | Improved 2026 |
|---|---|---|---|
| Control of Corruption | 70 | 1 | 82 |
| GDP Growth | 25 | 1 | 26 |
| GDP per capita | 73 | 1.01 | 92 |
| Government Expenditure | 72 | 1 | 72 |
| Control of Income Inequality | 52 | 1.24 | 79 |
| Control of Inflation | 89 | 1 | 80 |
| Economic Openness | 60 | 1 | 60 |
| Government Effectiveness | 76 | 1 | 76 |
| Political Stability and Absence of Violence | 67 | 1.17 | 98 |
| Regulatory Quality | 76 | 1.31 | 100 |
| The Rule of Law | 79 | 1.27 | 100 |
| Voice and Accountability | 73 | 1 | 91 |
| Control of Organised Crime | 85 | 1 | 88 |
| Average Institutional Quality | 69 | 80 |
Publisher’s Note: MDPI stays neutral with regard to jurisdictional claims in published maps and institutional affiliations. |
© 2022 by the authors. Licensee MDPI, Basel, Switzerland. This article is an open access article distributed under the terms and conditions of the Creative Commons Attribution (CC BY) license (https://creativecommons.org/licenses/by/4.0/).
Share and Cite
Taylor, I.W.; Ullah, M.A.; Koul, S.; Ulloa, M.S. Evaluating the Impact of Institutional Improvement on Control of Corruption—A System Dynamics Approach. Systems 2022, 10, 64. https://doi.org/10.3390/systems10030064
Taylor IW, Ullah MA, Koul S, Ulloa MS. Evaluating the Impact of Institutional Improvement on Control of Corruption—A System Dynamics Approach. Systems. 2022; 10(3):64. https://doi.org/10.3390/systems10030064
Chicago/Turabian StyleTaylor, Ivan W., Muhammad Aman Ullah, Saroj Koul, and Mark Sandoval Ulloa. 2022. "Evaluating the Impact of Institutional Improvement on Control of Corruption—A System Dynamics Approach" Systems 10, no. 3: 64. https://doi.org/10.3390/systems10030064
APA StyleTaylor, I. W., Ullah, M. A., Koul, S., & Ulloa, M. S. (2022). Evaluating the Impact of Institutional Improvement on Control of Corruption—A System Dynamics Approach. Systems, 10(3), 64. https://doi.org/10.3390/systems10030064